Article

Alkali-Induced Phase Transition to β-Spodumene along the LiAlSi2O6-LiAlSi4O10 Join

by
Yves Thibault
* and
Joanne Gamage McEvoy
Natural Resources Canada, CanmetMINING, 555 Booth Street, Ottawa, ON K1A 0G1, Canada
*
Author to whom correspondence should be addressed.
Crystals 2023, 13(8), 1182; https://doi.org/10.3390/cryst13081182
Submission received: 27 June 2023 / Revised: 21 July 2023 / Accepted: 27 July 2023 / Published: 29 July 2023

Abstract

:
Due to the refractory nature of α-spodumene (LiAlSi2O6) and petalite (LiAlSi4O10), two major lithium minerals, conventional lithium recovery processes involve a high-temperature pre-treatment (>1000 °C) to induce a phase transition to tetragonal β-spodumene, an open structure allowing easier access to lithium through ion exchange. Considering that these high temperatures are not dictated by thermodynamics but rather sluggish kinetics, the study investigates the mechanisms enhancing the rate of transformation to β-spodumene at lower temperatures while minimizing the growth of metastable hexagonal β-quartz typically observed at the onset of the conversion. The heat treatment of natural α-spodumene revealed that rapid growth of β-spodumene veinlets is achieved at ≤600 °C by activation of alkali-rich fluid inclusions, through a dissolution–recrystallization process. For petalite, the mechanism of the phase transition, initiated at ≈750 °C is a solid-state transformation keeping crystallographic coincidence with the mineral host. Synthetic growth experiments along the LiAlSi2O6-LiAlSi4O10 join indicate a compositional dependence on the resulting β-phase structure, where minor sodium doping strongly favors β-spodumene, as the tetrahedral framework of β-quartz does not allow the extent of deformation to accommodate the larger alkali. These findings open opportunities for energy-efficient lithium recovery pathways where the phase transition and ion exchange can be achieved simultaneously without a high-temperature pre-treatment.

1. Introduction

Lithium-ion batteries exhibit very high energy density and are currently the dominant technology for powering electric vehicles. Consequently, there is significant interest in optimizing lithium recovery from α-spodumene (LiAlSi2O6) and petalite (LiAlSi4O10), the two major carrier phases hosted in lithium-caesium-tantalum (LCT) pegmatites. Due to the refractory nature of these lithium aluminosilicates, conventional recovery processes are very energy-intensive, involving an initial high-temperature treatment (>1000 °C) to induce a transition to a β-spodumene solid solution (β-spodumeness), a Li-stuffed derivative of the tetragonal silica polymorph keatite [1,2]. Due to the resulting higher lithium mobility, ion exchange can be achieved in a subsequent extraction stage through a concentrated sulfuric acid (H2SO4) leach at temperatures of approximately 250 to 300 °C [3,4,5], although exchange with Na+ has also been investigated; through pressure leaching to produce sodium aluminosilicates in the form of Na-keatite (NaAlSi2O6) using NaCl [6], or analcime (NaAlSi2O6·H2O) using Na2CO3 [7] or NaCl/NaOH [6].
The term “stuffed derivative” refers to the incorporation of a cation (e.g., Li1+) in interstitial channels within silica polymorphs, charge-balanced by Al3+ substituting for Si4+ in the tetrahedral framework [8]. Li-stuffed silica derivatives along the LiAlSiO4-SiO2 join have been extensively investigated due to their low thermal expansion properties for glass-ceramics applications [2,9,10,11], as well as in petrogenetic investigations of lithium aluminosilicates in LCT pegmatites [12,13,14,15]. At atmospheric conditions, in addition to compositions very close to the pure SiO2 endmember, the stability field for stuffed derivatives of hexagonal β-quartz (β-quartzss) is restricted to the low silica region of the join, represented by β-eucryptite, forming a solid solution ranging from LiAlSiO4 to ≈LiAlSi1.5O5, and extends from the liquidus temperature down to the inversion to α-eucryptite [2,9]. On the other hand, tetragonal β-spodumeness is thermodynamically favored within a wide compositional window encompassing α-spodumene (LiAlSi2O6) and petalite (LiAlSi4O10), although β-quartzss can be formed metastably, where it is sometimes referred to as γ-spodumene or virgilite [2]. The estimated low-temperature boundary of the β-spodumeness stability field at atmospheric conditions, mainly inferred from high-pressure studies [12,13,16], ranges from ≈680 to ≤500 °C for compositions of LiAlSi4O10 (petalite) to LiAlSi2O6 (α-spodumene), indicating that the high temperatures required to complete the phase transition in conventional lithium recovery processes (>1000 °C) are not dictated by thermodynamics but rather sluggish kinetics.
The rationale for transforming the natural phases (α-spodumene, petalite) into stuffed silica derivatives is to enhance the mobility of lithium that can then be leached out and typically replaced by hydrogen, in the form of concentrated sulfuric acid, following the simplified ion exchange reaction:
2 LiAlSi2O6 + H2SO4 → 2 HAlSi2O6 + Li2SO4
This is a process that is reversible without the collapse of the structure for both β-spodumeness and β-quartzss having LiAlSi2O6 stoichiometry [3]. One important factor for the sharp increase in lithium mobility is the extent of ionic porosity (Z), defined as the percentage of the unit cell not occupied by cations (Li+, Al3+, Si4+) and anions (O2−), which can be approximated by the relationship:
Z = 100 1 V i V c
where Vc is the volume of the unit cell, and Vi is the total volume of the ions (cations and anions) in the unit cell estimated using published effective ionic radii at the proper coordination [17] and assuming spherical geometry [18,19,20,21]. Following the protocol of Zhao and Zheng [20] for choices of ionic radii, the transition from α-spodumene (LiAlSi2O6), a monoclinic chain silicate, to stable β-spodumene or metastable β-quartz leads to an important increase in Z from ≈49 to 64%, mainly the results of Al shifting from sixfold (octahedral) coordination to the tetrahedral framework (fourfold coordination) where its distribution with Si is completely disordered [1,22,23]. Accommodation of interstitial Li within zeolite-like structural channels, running parallel to the a axes in tetragonal β-spodumeness and along the c axis in hexagonal β-quartzss, provides potential preferential paths for ion exchange with cations of appropriate size and charge, such as H1+ ↔ Li1+ [1,2,3,22]. Interestingly, the ionic porosity of natural monoclinic petalite (LiAlSi4O10), a tectosilicate with Al occupying the tetrahedral framework, is very close to that of the stuffed silica derivatives (Z ≈ 63%) and, although Li mobility is significantly higher than for α-spodumene, it does not reach the extent observed in β-spodumeness and β-quartzss [24]. Structural factors that may account for the more limited Li mobility in petalite are that all cation sites (Si4+, Al3+, Li+) are fully ordered and that the average Li-O bond distance within the LiO4 tetrahedra, at 0.194 nm [25], is significantly shorter than for the tetragonal (0.208 nm; [1]) and hexagonal (0.207 nm; [22]) β phases.
Recent investigations on the α → β phase transition in natural spodumene, designed specifically to optimize energy consumption during Li recovery, are focused on temperatures exceeding 800 °C [26,27,28,29,30,31,32]. Although the kinetics of the observed phase transformations are influenced by the heating mode (e.g., conventional vs. microwave) and the rate adopted for the reported experiments, these studies document that, on the onset of the conversion of α-spodumene, at temperatures between 800 and 900 °C, β-quartzss (γ-spodumene) is formed either as the major initial transition phase [26,27,28,30,31] or growing simultaneously with β-spodumeness [29]. With increasing temperatures, the proportion of β-spodumeness steadily increases at the expense of residual α-spodumene and metastable β-quartzss to eventually become the only significant phase at temperatures exceeding 1000 °C. From these observations, some of these authors [26,29,30,31] emphasized that, in order to optimize the heat treatment step to convert α-spodumene, the reactivity of β-quartzss relative to β-spodumeness during the subsequent Li extraction stage needs to be considered.
One of the objectives of the present study is to investigate potential factors that may enhance the kinetics of the transformation of natural α-spodumene and petalite at temperatures closer to the inferred minimum of the β-spodumeness stability field, which could provide opportunities for more energy-efficient pathways for lithium recovery. Additionally, experiments were performed to identify the impact of composition, in particular the increase in silica from LiAlSi2O6 to LiAlSi4O10, on the formation of β-quartzss within the stability field of β-spodumeness. Finally, in the context of an alkali route to access lithium, the relative efficiency of exchanging sodium, a larger alkali, in β-quartzss and β-spodumeness structures of similar composition was evaluated. We adopted the Li-stuffed silica derivatives nomenclature proposed by Beall [2] where the stable tetragonal and metastable hexagonal solid solutions along the LiAlSi2O6-LiAlSi4O10 join are referred to as β-spodumeness and β-quartzss, respectively. This should help to prevent confusion as, although the term γ-spodumene has been widely used recently to refer to the hexagonal phase, it has been applied specifically to LiAlSi2O6 stoichiometry.

2. Materials and Methods

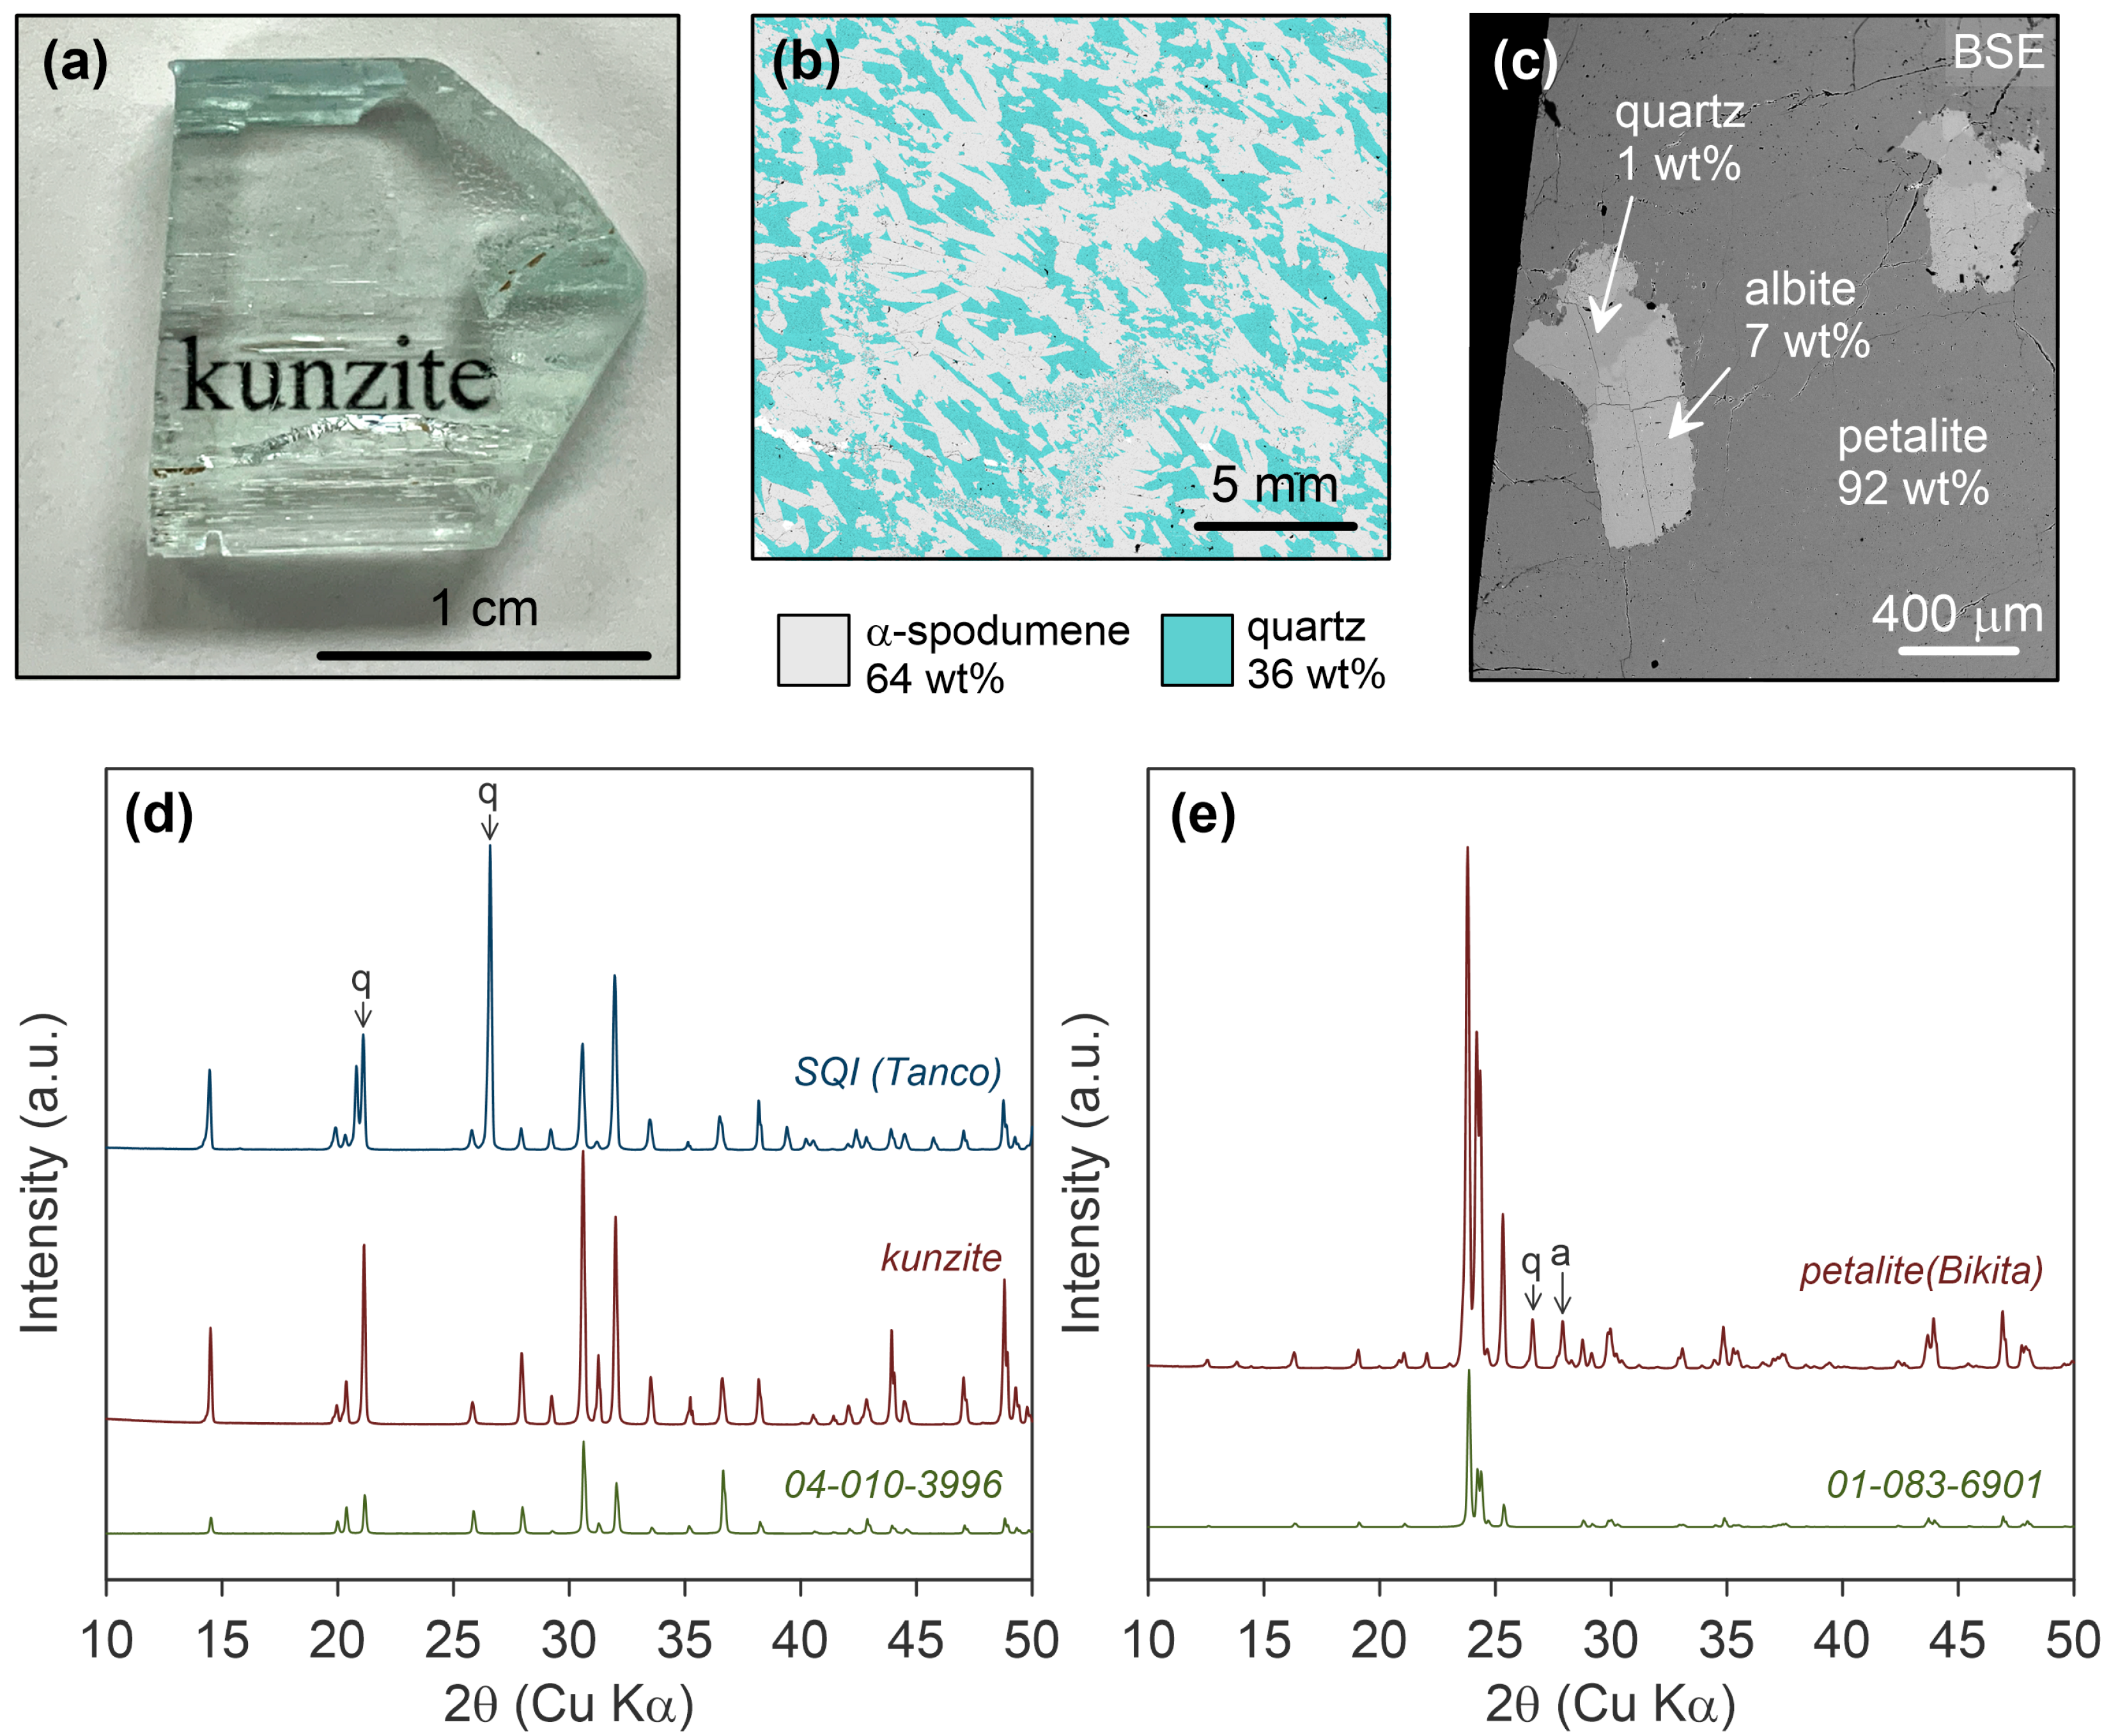
2.1. Materials: Natural Lithium Aluminosilicates

Two specimens of α-spodumene were acquired, which include a cm-sized clear single crystal of kunzite (Figure 1a,d) as well as a sample from the Tanco LCT pegmatite (Manitoba, Canada) consisting of intergrowths of α-spodumene and quartz (SQI; Figure 1b,d) pseudomorphing after petalite [33]. The petalite sample used in this study is a large single crystal (≈6 × 3 × 3 cm3) from the Bikita pegmatite (Masvingo, Zimbabwe) associated with minor albite and quartz in the form of equigranular inclusions (Figure 1c,e).
Both forms of α-spodumene and the petalite crystal show compositions close to their endmember formulae, LiAlSi2O6 and LiAlSi4O10, respectively (Table 1). Sodium is the dominant minor component in both kunzite and the Tanco α-spodumene, and, of the additional trace elements analyzed, only Mn and Fe have average concentrations in excess of 10 ppm (Table 1). The Bikita petalite shows an even higher purity, with abundances of all monitored trace elements below 10 ppm.

2.2. Analytical Techniques

2.2.1. X-ray Diffraction

Powder X-ray diffraction (XRD) analyses were performed on finely ground material (<45 μm) with a Rigaku D/MAX 2500 rotating anode system using monochromatic Cu Kα radiation (λ: 0.154059 nm) at 40 kV and 200 mA. The diffractograms were typically collected in the 2θ range of 5 to 70° using a step scan of 0.02° with a dwell time of 1 s per step. Phase identification was made using the current International Centre for Diffraction Data (ICDD) database. In some cases, to monitor the growth of β-spodumene, high-resolution XRD scans across the reflection of the (102) and (201) lattice planes were performed using a step scan of 0.002° at 5 s per step.

2.2.2. Electron Backscatter Diffraction

The distribution and crystallographic orientation of the phases produced after the heat treatment of petalite were obtained by electron backscatter diffraction (EBSD) using an Oxford Nordlys Nano detector attached to a Tescan MIRA3 field-emission scanning electron microscope. The EBSD analyses were performed at 20 kV with the polished sample surface tilted to 70° at a working distance of 18 mm. The Oxford AZtec software suite was used to process and index the electron backscatter Kikuchi patterns. Pole figures where the normal of the main crystal lattice planes are projected in relation to the sample surface were used to visualize the phase orientation.

2.2.3. Automated Mineralogy

Modal abundances and phase distributions within the SQI and petalite materials were obtained using a TESCAN Integrated Mineral Analyzer (TIMA) equipped with four silicon drift X-ray energy-dispersive spectrometers (EDS). Phase maps were collected on a 2.5 × 4.5 cm2 polished thin section using an accelerating voltage of 25 kV and a beam current of 5.5 nA with a step size of 1 µm. The backscattered electron (BSE) signal and the EDS spectra were collected simultaneously and were both used to identify phases and determine grain boundaries.

2.2.4. Electron Probe X-ray Microanalysis

To characterize the textural and compositional nature of the lithium aluminosilicate minerals as well as of the products from the synthesis, heat-treatment, and ion exchange experiments; BSE imaging and quantitative X-ray microanalyses by wavelength-dispersive spectrometry (WDS), in discrete and mapping modes, were performed using a JEOL JXA 8230 Electron Probe Microanalyzer (EPMA) operated with an accelerating voltage of 20 kV and a probe current of 10 to 75 nA. The characteristic X-ray lines and standards used for the analyses were Na Kα (cleavelandite), Al Kα (kunzite, petalite, cleavelandite), Si Kα (kunzite, petalite, cleavelandite). Considering that no lithium characteristic X-ray lines can be detected by WDS, the abundance of Li2O was estimated by difference of the calculated total relative to 100 wt%.

2.2.5. Laser-Ablation—Inductively Coupled Plasma—Mass Spectrometry (LA-ICP-MS)

To complement the EPMA characterization, in particular to quantify the abundance of lithium and to determine the concentration of relevant trace elements, LA-ICP-MS spot analyses and 2D elemental maps were acquired at the Geological Survey of Canada using an Applied Spectra RESOlution-SE 193 nm excimer laser ablation system with integrated Agilent 7700× or 8900 inductively coupled plasma–mass spectrometers (ICP-MS) following the procedure described in [34]. For the spot analyses, the ablation was achieved with an 80 µm focused laser spot, a fluence of 5 J/cm2, and a repetition rate of 6 Hz. Quantitative elemental maps were collected with a laser fluence of 7 J/cm2, a repetition rate of 25 Hz, a spot size and a line spacing of 8 µm, keeping a scan speed of 20 µm/s. The following elements were measured on the ICP-MS for quantification: 7Li, 9Be, 23Na, 25Mg, 27Al, 29Si, 39K, 42Ca, 55Mn, 57Fe, 60Ni, 85Rb, 88Sr, 89Y, 93Nb, 133Cs, 140Ce, 181Ta, and 208Pb. Data calibration included internal standardization relative to Al concentrations, as determined by EPMA, for the spot analyses, and normalizing the total element oxide concentrations to 100% for map quantification [35]. The mass response of the ICP-MS was calibrated with the United States Geological Survey glass standard GSE-1G [36] and the instrument performance was monitored using the glass standards NIST610 or NIST612 [37].

2.2.6. Raman Spectroscopy

Raman spectra were collected on an Edinburgh Instruments RM5 system fitted with a 785 nm laser source using a 100× objective, a grating of 1200 grooves mm−1, and a 50 μm slit, with periodic calibration of the spectrometer to the 520.5 cm−1 band of a Si single crystal. Each discrete analysis consisted of 12 acquisitions of 20 s in a spectral range from 80 to 1200 cm−1. Cosmic ray artefacts were removed using the Edinburgh Instruments Ramacle software.

2.3. Experimental Methods

2.3.1. Heat Treatment

Heat treatment experiments on the α-spodumene and petalite materials were performed in a muffle furnace at temperatures ranging from 575 to 900 °C. After reaching the peak temperature, a Pt crucible containing the sample was introduced in the furnace and left for 4 h, after which it was removed and partially immersed in water to rapidly cool the material.

2.3.2. Synthetic Growth of Li-Stuffed Silica Derivatives

Stuffed silica derivatives were synthesized by slowly cooling melts with LiAlSi4O10, LiAlSi2.9O7.8, and LiAlSi2O6 compositions. Appropriate stoichiometric proportions of finely-ground kunzite and high-purity fused silica, in some cases doped with Na2CO3, were pressed into pellets that were loaded in a covered hemispherical Pt dish and heated above the liquidus at 1430 °C in a muffle furnace for 30 min. To induce crystallization, the temperature was then decreased at rates of 5 °C/h down to 1375 °C, 50 °C/h to 1200 °C, and 400 °C/h to room temperature. The resulting product was in the form of a solid ellipsoid that could easily be removed from the Pt container.

2.3.3. Alkali Exchange Experiment

An ion exchange experiment in molten NaNO3 was performed to investigate lithium replacement by sodium in β-spodumeness and β-quartzss. Approximately 2 g of NaNO3 and mm-sized fragments of synthetic Li-stuffed silica derivatives (Section 2.3.2) were loaded in a covered Pt crucible and maintained at 320 °C for 24 h in a horizontal tube furnace kept under inert argon atmosphere. After cooling, the solidified nitrate salt was dissolved in DI water and the silicate fragments were recovered for characterization.

3. Results and Discussion

3.1. Phase Transitions during Heat-Treatment of Natural Lithium Aluminosilicates

3.1.1. α-Spodumene

In order to investigate if the α-β phase transition in spodumene can be achieved at temperatures below 1000 °C, isothermal heat treatment experiments were performed for a fixed duration of 4 h on the kunzite and SQI materials in the form of a powder ground to <45 μm and as cm-sized blocks.
Based on the high-resolution XRD scans monitoring the growth of β-spodumeness from the (102) lattice plane reflection (Figure 2a,b), the heat treatment of kunzite did not result in any observable diffraction peak within the investigated temperature range, except for the fine powder at 900 °C, confirming the inferred sluggish kinetics of the phase transition at lower temperatures. The presence of β-spodumeness in the powder at 900 °C as opposed to the block suggests a role of defects induced during grinding to promote the transformation.
The high-resolution XRD scans performed on the heat-treated SQI revealed that, although the material in powder form (Figure 2c) displays a behavior similar to kunzite (Figure 2a), the cm-sized block shows a much higher intensity of the β-spodumeness (102) diffraction peak at all investigated temperatures (Figure 2d). This suggests a significantly faster transformation rate, with β-spodumeness clearly identified at temperatures as low as 600 °C, and even as a trace component at 575 °C (inset of Figure 2d). BSE imaging revealed the appearance of filamentous veinlets initiated within the α-spodumene crystals and cross-cutting the {100} prismatic cleavage, suggesting no significant crystallographic or grain boundary control (Figure 3a). Chemically, the veinlets have compositions very close to their host, except for an enrichment in sodium, reaching concentrations of up to ≈0.5 wt% Na2O (Figure 4a,b). Characterization by Raman spectroscopy (Figure 5a) indicates that, structurally, they consist of β-spodumeness with a band at ~495 cm−1 (Figure 5a), which can be assigned to the A1 symmetric stretching mode (υs) of an oxygen bridging 2 tetrahedral (T) cations (υs [T-O-T] where T = Si4+, Al3+; [38,39,40]).
Optical observation of the pristine material reveals numerous small fluid inclusions (Figure 3c), and their distribution shows a strong similarity to the sinuous infiltration path of the β-spodumeness veinlets (Figure 3a), suggesting they may have played a role in inducing the phase transition at low temperatures. Fluid inclusions within α-spodumene crystals from the Tanco pegmatite are well characterized [15,41,42]. An alkali-bearing aqueous fluid often co-exists with a CO2-rich phase in the form of a liquid or as a vapor bubble, and, in some cases, with variable amounts of daughter crystals, such as zabuyelite (Li2CO3) and cookeite (LiAl4[Si3Al]O10[OH]8). In a microthermometry study published by Anderson [42], the evolution of these α-spodumene-hosted fluid inclusions, when heated in a hydrothermal diamond anvil cell to prevent decrepitation due to the increase in the inclusion internal pressure [42,43], indicated that after complete liquid–vapor homogenization into a supercritical alkali-rich aqueous carbonic fluid, total dissolution of the daughter solid phases occurs at temperatures ranging from 600 to 680 °C. Interestingly, the reported dissolution temperatures coincide with those at which β-spodumeness could be identified during the isothermal heat treatment of the SQI blocks (Figure 2d). From these observations, we suggest that, at temperatures exceeding 600 °C, the propagation of the β-phase follows trails of entrapped alkali-rich aqueous carbonic fluids that partially dissolve the α-spodumene host. As the fluid is finally released along defects (decrepitation), the internal pressure suddenly decreases leading to the precipitation of β-spodumeness, the inferred stable phase at atmospheric conditions and temperatures as low as 450 to 500 °C [12,13]. On the other hand, the lower rate of transformation observed for the fine powder (Figure 2c) would result from breaching the fluid inclusions during the initial grinding steps. This can also explain the contrasting behavior of the kunzite block (Figure 2a,b), considering that it is a single crystal free of fluid inclusions (Figure 1a). In addition, although the extent of the natural fluid-induced regime is dictated by the amount of inclusions available within the α-spodumene crystals (Figure 3a), as the temperature is increased, the resulting veinlets appear to act as nucleation sites to further promote the intrinsic phase transition (Figure 3b).
The expected influx of alkali during the release of an aqueous carbonic fluid is consistent with the sodium enrichment observed in the newly formed β-spodumene veinlets (Figure 4). In this context, the potential contribution of sodium in promoting the α- β transition at lower temperatures was evaluated by performing a heat-treatment experiment at 650 °C where a block of SQI was placed over a 13-mm diameter Na2CO3 pellet. Characterization of the filamentous veinlets formed within α-spodumene crystals located at the interface with the pellet show a strong enrichment in sodium up to 13.6 wt% of Na2O, while maintaining a silicon to aluminum ratio of two (Figure 6a,b). As the Raman signature is still consistent with β-spodumeness (Figure 5a), this indicates efficient exchange of sodium for lithium, reaching up to Na0.87Li0.13AlSi2O6 stoichiometry. As the sodium carbonate is well below its solidus at 650 °C, the effective diffusion of sodium within the veinlets hundreds of microns above the interface indicates, once again, an important role of released fluids in inducing the phase transition.

3.1.2. Petalite

Heat treatment experiments of 4-h duration were also performed on cm-sized blocks and finely ground powders of the petalite single crystal from the Bikita pegmatite, Zimbabwe. Based on the high-resolution XRD data shown in Figure 7, β-spodumeness can be identified from 750 °C, which is consistent with a minimum temperature for the petalite—β-spodumeness phase transition at ≈680 °C, inferred from high-pressure studies [12]. Comparable to what was observed for the spodumene α-β phase transition with the SQI material (Section 3.1.1), at a similar heat-treatment temperature, the transformation to β-spodumeness is significantly more advanced for the petalite block than the powder, as indicated by the higher intensity of the (201) lattice plane diffraction peak.
Characterization of the heat-treated blocks reveals the presence of regions of higher BSE intensity where micropores, that likely represent sectioned fluid inclusions, are preferentially concentrated (Figure 4a). The chemical composition of these distinct areas is very close to that of the petalite host except, once again, a significant Na2O enrichment of up to ≈0.3 wt% (Figure 4). The Raman spectra shown in Figure 5b confirmed that these regions have a different crystalline structure than the petalite host, more akin to tetragonal β-spodumene, with the frequency of the υs [T-O-T] band at 490 cm−1. This represents a slight shift from the position at 495 cm−1 observed in β-spodumeness produced from α-spodumene (Figure 5a), that can be related to the change in the tetrahedral Si:Al ratio from 2 (LiAlSi2O6) to 4 (LiAlSi4O10). Consequently, similar to what was observed in the case of α-spodumene, alkali-rich fluids can enhance the kinetics of the petalite → β-spodumeness transition. However, in this case, the asymmetry observed on the low-frequency flank of the υs [T-O-T] Raman band (Figure 5b) suggest the influence of a coexisting phase, likely metastable hexagonal β-quartzss. This can also account for the slight shoulder on the high 2θ side of the β-spodumeness (102) reflection observed in the high-resolution XRD patterns (Figure 7b), consistent with a minor contribution from the (101) lattice plane reflection in β-quartzss. The impact of an enrichment of sodium on the conversion of petalite was also investigated using the same strategy applied for α-spodumene (Section 3.1.1), where a petalite block placed over a 13-mm diameter Na2CO3 pellet was heat treated at 750 °C. In this case, both the υs [T-O-T] Raman band at 490 cm−1 (Figure 5b) and the (102) diffraction peak of β-spodumeness (Figure 7c) are now symmetrical, suggesting that alkali-enriched fluids not only promote the phase transition, but also minimize the growth of metastable β-quartzss.
The distinct habit of β-spodumeness in petalite in the form of discrete inclusions (Figure 8a,b), compared to the filamentous veinlets observed in α-spodumene (Figure 3a) suggests a different mechanism of transformation at play. In fact, as characterized by EBSD mapping (Figure 8b,c), the strong correlation between the crystallographic orientation of β-spodumene relative to its petalite host points to a phase transition achieved through a solid-state atomic rearrangement as opposed to a dissolution-reprecipitation process. This is consistent with petalite and β-spodumeness being both tectosilicates where Al resides in the tetrahedral site, and a comparison of model structures for both phases oriented as determined by EBSD provides a clearer view of the crystallographic coincidence (Figure 8c,d). The alignment of the lithium atoms parallel to the (100) plane of petalite is preserved along (001) for β-spodumeness. Additionally, within the tetrahedral framework (TO4), the attachment of one AlO4 to the double sheets of corner-sharing SiO4 in petalite can be related to the five-membered ring of corner-shared TO4 seen running along the [010] direction in β-spodumeness.

3.2. Synthetic β-Phases along the LiAlSi2O6-LiAlSi4O10 Join

3.2.1. Synthetic Growth

Although maintaining a stuffed keatite derivative structure, β-spodumeness produced from α-spodumene and petalite are significantly different in composition, becoming more silica-rich as the SiO2: LiAlO2 ratio increases from two to four. In order to investigate the impact of an increase in silica on the growth of β-spodumeness, in particular, the potential formation of metastable stuffed β-quartzss; synthetic LiAlSi2O6, LiAlSi2.9O7.8, and LiAlSi4O10 compositions, in the form of pellets with required proportions of ground kunzite and high-purity silica glass, were brought over their liquidus (1430 °C) and slowly cooled to induce crystallization at rates of 5 °C/h down to 1375 °C, 50 °C/h to 1200 °C, and 400 °C/h to room temperature (Section 2.3.2). Considering that kunzite contains ≈0.06 wt% Na2O, sodium is a trace impurity (Table 1). However, although its bulk concentration systematically decreases as SiO2 glass is progressively added to kunzite, stoichiometry across the LiAlSi2O6-LiAlSi4O10 join is maintained, as the Na/Li and (Na + Li)/Al remain constant.
The XRD patterns shown in Figure 9 suggest that, following a similar crystallization pathway, an increase in silica promotes the formation of β-quartzss, from a minor phase co-existing with β-spodumeness in LiAlSi2O6, up to being the only identified phase for LiAlSi4O10. BSE imaging of the synthetic LiAlSi2O6 (Figure 10a) and LiAlSi2.9O7.8 (Figure 10b) compositions reveal a subtle difference in contrast where, as confirmed by Raman spectroscopy (Figure 11), the brighter and darker phases are β-spodumeness and β-quartzss, respectively. On the other hand, as only β-quartzss is present in LiAlSi4O10 (Figure 9), no BSE contrast can be observed (Figure 10c). The υs (T-O-T) Raman band of β-spodumeness shifts from 495 cm−1 in LiAlSi2O6 to 492 cm−1 in LiAlSi2.9O7.8 (Figure 11a). In the case of β-quartzss (Figure 11b), a band at 483 cm−1, consistent with the υs (T-O-T) frequency observed for LiAlSi2O6 composition [38], also moves to lower frequency with increasing silica and the associated progressive growth of a shoulder at 455 cm−1, more akin to the frequency observed in pure SiO2 endmember β-quartz [44], may indicate a growing contribution of oxygen bridging two Si cations (Si-O-Si) relative to Si-O-Al linkages [40].
The compositions of the co-existing β-phases, as measured by EPMA (Figure 12a), are very close to one another, both having the Si/Al atomic ratios expected from the starting material stoichiometry (LiAlSi2O6, LiAlSi2.9O7.8, and LiAlSi4O10). The only striking difference is a strong preferential partitioning of the minor amount of sodium in the β-spodumeness structure (Figure 12a), in line with the observed BSE contrast (Figure 10). LA-ICP-MS analyses performed to improve the sodium detection limit and obtain the Si/Li atomic ratios (Figure 12c) are consistent with the EPMA characterization.
Considering that, during synthesis, all three compositions were brought over their liquidus temperatures and crystallized at the same rate, the systematic increase in the proportion of metastable β-quartzss may be partially related to a rise in the melt viscosity of approximately an order of magnitude, expected in simple alkali aluminosilicate systems with an increase in the Si:Al ratio from two to four, keeping an alkali:Al ratio of unity [45]. However, the progressive growth of the 455 cm−1 shoulder in the Raman spectra of β-quartzss from LiAlSi2O6 to LiAlSi4O10 (Figure 11b) suggests that an intrinsic change in the tetrahedral framework arrangement may be the dominant factor for the distinct crystallization sequence.
The observed strong preferential partitioning of sodium in β-spodumeness indicates that a slight increase in its concentration can minimize the extent of β-quartzss formation. In this context, similar synthesis experiments were performed with the addition of Na2CO3 at a concentration equivalent to 3 cmol Na per mole of Li, leading only to a very small deviation in the alkali to Al atomic ratio ([Li+Na]/Al) from 1 to 1.03. The XRD patterns collected on the product (Figure 9) clearly indicate that an increase in sodium promotes the formation of β-spodumeness over β-quartzss, being the only phase present in the doped LiAlSi2O6 and LiAlSi2.9O7.8, with average Na2O contents of ≈0.9 wt% and ≈0.7 wt%, respectively (Figure 12b). In the case of doped LiAlSi4O10, although only β-quartzss was observed in the pristine synthesis, β-spodumeness now represents an important co-existing phase (Figure 9), once again, where sodium is preferentially partitioned (Figure 12b). These results are consistent with the low-temperature fluid-induced phase transition for the natural lithium aluminosilicates discussed in Section 3.1, where the conversion of petalite, richer in silica than α-spodumene, produced a small amount of coexisting β-quartzss, although its formation can be minimized by a slight enrichment in sodium (Figure 5 and Figure 7c).

3.2.2. Alkali Exchange

In addition to Li+, having an ionic radius of 0.06 nm in fourfold coordination [17], cations that can be easily accommodated in the channels of the β-spodumeness and β-quartzss structures have radii smaller than 0.08 nm, such as H+, Mg2+, and Zn2+ [2,3]. For example, in a study by Berchot et al. [46] focusing on the ion exchange properties of β-eucryptite (LiAlSiO4), the stable lithium stuffed β-quartz derivative [2,9], Cu2+ (0.06 nm) and Mn2+ (0.07 nm) could easily be incorporated, but no substitution for lithium could be achieved for larger cations such as Na+ (0.10 nm) and K+ (0.14 nm). On the other hand, Baumgartner and Müller [47] reported that, although the incorporation of Na+ in β-spodumeness requires a significant deformation of the keatite tetrahedral framework, in particular, distortion of the T-O-T bond angles strongly deviating from equilibrium values, metastable NaAlSi2O6 isostructural with β-spodumeness can be produced from HAlSi2O6 by ion exchange in molten NaNO3 for 24 h at 320 °C. Considering that low-temperature alkali exchange can represent an interesting avenue to efficiently recover lithium [5,6,7], a similar ion exchange approach was used to investigate the relative efficiency of substituting sodium for lithium in coexisting stable tetragonal β-spodumeness and metastable hexagonal β-quartzss. To ensure a proper comparison, the experiment was performed with mm-sized fragments of the synthetic LiAlSi2.9O7.8 containing comparable amounts of both β-phases (Figure 9b) having the same stoichiometry.
Raman spectroscopy characterization of the exchanged product confirms that the β-spodumeness and β-quartzss structures were maintained within the LiAlSi2.9O7.8 fragments (Figure 13a). β-spodumeness, having significantly higher BSE intensity than β-quartzss, displays numerous cracks (Figure 13c) that were likely formed during the exchange process, as they were not observed in the starting material (Figure 10). The quantitative distribution of sodium and lithium, as determined by WDS-EPMA and LA-ICP-MS, respectively, reveals a sharp contrast in the extent of alkali substitution (Figure 13c). Whereas Na2O in β-quartzss plateaus at concentrations of less than 0.11 wt%, indicating no significant ion exchange, its abundance in β-spodumeness reaches values of up to 8.5 wt%. Considering that the Si:Al atomic ratio remains constant at 2.9, this means that an isostructural stoichiometric exchange of the form:
LiAlSi2.9O7.8stuffed keatite + NaNO3melt → NaAlSi2.9O7.8 stuffed keatite + LiNO3melt
was achieved at 65 to 70% efficiency across most of the mm-size β-spodumene grains (Figure 13b) with the resulting increase in the unit cell volume being responsible for the development of the fracture network (Figure 13c). As for the co-existing metastable β-quartzss structure, the negligible sodium exchange clearly indicates that it does not allow the extent of deformation required to accommodate the larger alkali. This indicates that, in the context of lithium recovery through alkali exchange [6,7] from β-spodumeness, minimization of the growth of metastable β-quartzss must be considered.

4. Conclusions

The kinetics of the transition to tetragonal β-spodumeness can be significantly enhanced by the activation of natural alkali-rich fluids, at temperatures as low as 575–600 °C for α-spodumene and 750 °C for petalite, and this, without significant formation of hexagonal β-quartzss, typically reported as an important initial low-temperature transition metastable phase. In the case of α-spodumene, the phase transition to β-spodumeness is achieved through a dissolution–recrystallization process, whereas, for petalite, the mechanism is a solid-state transformation keeping crystallographic coincidence with the mineral host. Considering that the newly-formed β-spodumeness consistently displays an enrichment in sodium, its dominance over β-quartzss can be explained by its greater ability to accommodate the larger alkali, as confirmed by the observed strong preferential sodium partitioning in the stable tetragonal form over the metastable hexagonal structure. Moreover, in the presence of Na2CO3, the low-temperature phase transition is accompanied by efficient ion exchange, where the β-spodumeness reaches compositions close to the NaAlSi2O6 endmember while maintaining the keatite structure.
Although the extent of phase transformation is dictated by the amount of available fluid inclusions, the inversion could be induced by synthetic alkali-rich fluids, the compositions of which may be optimized to access regions of the β-spodumene stability field even closer to the inferred minimum temperature (≈450–500 °C). This would provide a pathway for energy-efficient lithium recovery where the phase transition and ion exchange of sodium for lithium can be achieved simultaneously without the need for the conventional pre-treatment at temperatures exceeding 1000 °C.

Author Contributions

Conceptualization, Y.T. and J.G.M.; methodology, Y.T. and J.G.M.; validation, Y.T. and J.G.M.; investigation, Y.T. and J.G.M.; data curation, Y.T. and J.G.M.; writing—original draft preparation, Y.T. and J.G.M.; writing—review and editing, Y.T. and J.G.M. All authors have read and agreed to the published version of the manuscript.

Funding

Financial support for this project was provided by Natural Resources Canada through a special fund for the Critical Minerals R&D Program.

Data Availability Statement

The data are contained within the article.

Acknowledgments

Technical support for the EPMA characterization by Dominique Duguay, automated mineralogy by Nail Zagrtdenov, XRD analyses by Derek Smith, and sample preparation by Talia Beckwith, all from CanmetMINING (Ottawa, ON, Canada) are gratefully acknowledged. The authors also thank Duane Petts and Matthew Polivchuk from the Geological Survey of Canada (Ottawa, ON, Canada) for assistance with the LA-ICP-MS and EBSD work, respectively, as well Catriona Breasley from the Department of Earth, Ocean, and Atmospheric Sciences at the University of British Columbia for providing samples from the Tanco pegmatite.

Conflicts of Interest

The authors declare no conflict of interest.

References

  1. Li, C.-T.; Peacor, D.R. The crystal structure of LiAlSi2O6 II (“β-spodumene”). Z. Kristallogr. 1968, 126, 46–65. [Google Scholar] [CrossRef]
  2. Beall, G.H. Chapter 14: Industrial Applications of Silica. In Reviews in Mineralogy, Silica: Physical Behaviour, Geochemistry, and Materials Applications; Heaney, P.J., Prewitt, C.T., Gibbs, G.V., Eds.; Mineralogical Society of America; De Gruyter: Boston, MA, USA; Berlin, Germany, 1994; Volume 29, pp. 469–505. [Google Scholar] [CrossRef]
  3. Müller, G.; Hoffmann, M.; Neeff, R. Hydrogen substitution in lithium aluminosilicates. J. Mater. Sci. 1988, 23, 1779–1785. [Google Scholar] [CrossRef]
  4. Yelantontsev, D.; Mukhachev, A. Processing of lithium ores: Industrial technologies and case studies—A review. Hydrometallurgy 2021, 201, 105578. [Google Scholar] [CrossRef]
  5. Salakjani, N.K.; Singh, P.; Nikoloski, N. Production of lithium—A literature review part 2: Extraction from spodumene. Min. Proc. Ext. Met. Rev. 2021, 42, 268–283. [Google Scholar] [CrossRef]
  6. Alhadad, M.F.; Oskierski, H.S.; Ghischi, J.; Senanayake, G.; Dlugogorski, B.Z. Lithium extraction from β-spodumene: A comparison of keatite and analcime process. Hydrometallurgy 2023, 215, 105985. [Google Scholar] [CrossRef]
  7. Chen, Y.; Tian, Q.; Chen, B.; Shi, X.; Liao, T. Preparation of lithium carbonate from spodumene by a sodium carbonate autoclave process. Hydrometallurgy 2011, 109, 43–46. [Google Scholar] [CrossRef]
  8. Buerger, M.J. The stuffed derivatives of the silica structures. Am. Mineral. 1954, 39, 600–614. [Google Scholar]
  9. Strnad, Z. Glass-Ceramic Materials, Glass Science and Technology, Vol. 8; Elsevier: Amsterdam, The Netherlands, 1986; 268p, ISBN 9780444415776. [Google Scholar]
  10. Nordmann, A.; Cheng, Y.-B. Crystallization behaviour and microstructural evolution of a Li2O-Al2O3-SiO2 glass derived from spodumene mineral. J. Mater. Sci. 1997, 32, 83–89. [Google Scholar] [CrossRef]
  11. Xu, H.; Heaney, P.J.; Navrotsky, A. Thermal expansion and structural transformations of stuffed derivatives of quartz along the LiAlSiO4-SiO2 join: A variable-temperature powder synchrotron XRD study. Phys. Chem. Miner. 2001, 28, 302–312. [Google Scholar] [CrossRef]
  12. Roy, R.; Roy, D.M.; Osborn, E.F. Compositional and stability relationships among the lithium aluminosilicates: Eucryptite, spodumene, and petalite. J. Am. Ceram. Soc. 1950, 33, 152–159. [Google Scholar] [CrossRef]
  13. Munoz, J.L. Stability Relations of LiAlSi2O6 at High Pressure. In Mineralogical Society of America Special Paper 2, Pyroxenes and Amphiboles: Crystal Chemistry and Phase Petrology; Papike, J.J., Ed.; Mineralogical Society of America: Menasha, WI, USA, 1969; pp. 203–209. [Google Scholar]
  14. London, D.; Burt, D.M. Chemical models for lithium aluminosilicates stabilities in pegmatites and granites. Am. Mineral. 1982, 67, 494–509. [Google Scholar]
  15. London, D. Magmatic-hydrothermal transition in the Tanco rare-element pegmatite: Evidence from fluid inclusions and phase equilibrium experiments. Am. Mineral. 1986, 71, 376–395. [Google Scholar]
  16. Edgar, A.D. The α-β-LiAlSi2O6 (spodumene) transition from 5000 to 45000 lb/in2 PH2O. In Proceedings of the Papers and Proceedings of the International Mineralogical Association, 5th General Meeting, Cambridge, England, 30 August–3 September 1966; Mineralogical Society of London: London, UK, 1968; pp. 222–231. [Google Scholar]
  17. Shannon, R.D. Revised effective ionic radii and systematic studies of interatomic distances in halides and chalcogenides. Acta Crystallogr. 1976, A32, 751–767. [Google Scholar] [CrossRef]
  18. Dowty, E. Crystal-chemical factors affecting the mobility of ions in minerals. Am. Mineral. 1980, 65, 174–182. [Google Scholar]
  19. Fortier, S.M.; Giletti, B.J. An empirical model for predicting diffusion coefficients in silicate minerals. Science 1989, 245, 1481–1484. [Google Scholar] [CrossRef]
  20. Zhao, Z.-F.; Zheng, Y.-F. Diffusion compensation for argon, hydrogen, lead, and strontium in minerals: Empirical relationships to crystal chemistry. Am. Mineral. 2007, 92, 289–308. [Google Scholar] [CrossRef]
  21. Welsh, A.-M.; Murawski, D.; Prekajski, M.; Vulic, P.; Kremenovic, A. Ionic conductivity in single-crystal LiAlSi2O6: Influence of structure on lithium mobility. Phys. Chem. Miner. 2015, 42, 413–420. [Google Scholar] [CrossRef]
  22. Li, C.-T. The crystal structure of LiAlSi2O6 III (high quartz solid solution). Z. Kristallogr. 1968, 127, 327–348. [Google Scholar] [CrossRef]
  23. Xu, H.; Heaney, P.J.; Navrotsky, A.; Topor, L.; Liu, J. Thermochemistry of stuffed quartz-derivative phases along the join LiAlSiO4-SiO2. Am. Mineral. 1999, 84, 1360–1369. [Google Scholar] [CrossRef]
  24. Welsh, A.-M.; Behrens, H.; Ross, S.; Murawski, D. Structural control of ionic conductivity in LiAlSi2O6 and LiAlSi4O10 glasses and single crystals. Z. Phys. Chem. A. 2012, 226, 491–511. [Google Scholar] [CrossRef]
  25. Ross, N.L.; Zhao, J.; Slebodnick, C.; Spencer, E.C.; Chakoumakos, B.C. Petalite under pressure: Elastic behavior and phase stability. Am. Mineral. 2015, 100, 714–721. [Google Scholar] [CrossRef]
  26. Peltosaari, O.; Tanskanen, P.; Heikkinen, E.-P.; Fabritius, T. α → γ → β-phase transformation of spodumene with hybrid microwave and conventional furnaces. Miner. Eng. 2015, 82, 54–60. [Google Scholar] [CrossRef]
  27. Salakjani, N.K.; Singh, P.; Nikoloski, N. Mineralogical transformations of spodumene concentrate from Greenbushes, Western Australia. Part 1: Conventional heating. Miner. Eng. 2016, 98, 71–79. [Google Scholar] [CrossRef]
  28. Salakjani, N.K.; Nikoloski, N.; Singh, P. Mineralogical transformations of spodumene concentrate from Greenbushes, Western Australia. Part 2: Microwave heating. Miner. Eng. 2017, 100, 191–199. [Google Scholar] [CrossRef]
  29. Moore, R.H.; Mann, J.P.; Montoya, A.; Haynes, B.S. In situ synchrotron XRD analysis of the kinetics of spodumene transitions. Phys. Chem. Chem. Phys. 2018, 20, 10753–10761. [Google Scholar] [CrossRef] [PubMed]
  30. Abdullah, A.A.; Oskierski, H.C.; Altarawneh, M.; Senanayake, G.; Lumpkin, G.; Dlugogorski, B.Z. Phase transformation mechanism of spodumene during its calcination. Miner. Eng. 2019, 140, 105883. [Google Scholar] [CrossRef]
  31. Dessemond, C.; Soucy, G.; Harveu, J.-F.; Ouzilleau, P. Phase transitions in the α-γ-β spodumene thermodynamic system and impact of γ-spodumene on the efficiency of lithium extraction by acid leaching. Minerals 2020, 10, 519. [Google Scholar] [CrossRef]
  32. Salakjani, N.K.; Singh, P.; Nikoloski, N. Production of lithium—A literature review part 1: Pretreatment of spodumene. Min. Proc. Ext. Met. Rev. 2020, 41, 335–348. [Google Scholar] [CrossRef]
  33. Černý, P.; Ferguson, R.B. The Tanco pegmatite Bernic Lake, Manitoba. IV. Petalite and spodumene relations. Can. Mineral. 1972, 11, 660–678. [Google Scholar]
  34. Lawley, C.J.M.; Petts, D.C.; Jackson, S.E.; Zagorevski, A.; Pearson, D.G.; Kjarsgaard, B.A.; Savard, D.; Tschirhart, V. Precious metal mobility during serpentinization and breakdown of base metal sulphide. Lithos 2020, 354–355, 105278. [Google Scholar] [CrossRef]
  35. Jackson, S.E. Calibration Strategies for Elemental Analysis by LA-ICP-MS. In Short Course Series, Laser-Ablation-ICP-MS in the Earth Sciences: Current Practices and Outstanding Issues; Sylvester, P., Ed.; Mineralogical Association of Canada: Québec, QC, Canada, 2008; Volume 40, pp. 169–188. ISBN 9780921294498. [Google Scholar]
  36. Guillong, M.; Hametner, K.; Reusser, E.; Wilson, S.A.; Günther, D. Preliminary characterisation of new glass reference materials (GSA-1G, GSC-1G, GSD-1G and GSE-1G) by laser ablation-inductively coupled plasma-mass spectrometry using 193 nm, 213 nm and 266 nm wavelengths. Geostand. Geoanal. Res. 2005, 29, 315–331. [Google Scholar] [CrossRef]
  37. Kane, J.S. A history of the development and certification of NIST glass SRMs 610–617. Geostandard Newslett. 1998, 22, 7–13. [Google Scholar] [CrossRef]
  38. Sharma, S.K.; Simons, B. Raman study of crystalline polymorphs and glasses of spodumene composition quenched from various pressures. Am. Mineral. 1981, 66, 118–126. [Google Scholar]
  39. Matson, D.W.; Sharma, S.K.; Philpotts, J.A. Raman spectra of some tectosilicates and of glasses along the orthoclase-anorthite and nepheline-anorthite joins. Am. Mineral. 1986, 71, 694–704. [Google Scholar]
  40. Sprengard, R.; Binder, K.; Brändle, M.; Fotheringham, U.; Sauer, J.; Pannhorst, W. On the interpretation of the experimental Raman spectrum of β-eucryptite LiAlSiO4 from atomistic computer modelling. J. Non-Cryst. Solids 2000, 274, 264–270. [Google Scholar] [CrossRef]
  41. Anderson, A.J.; Clark, A.H.; Gray, S. The occurrence and origin of zabuleyite (Li2CO3) in spodumene-hosted fluid inclusions: Implications for the internal evolution of rare-element granitic pegmatites. Can. Mineral. 2001, 39, 1513–1527. [Google Scholar] [CrossRef]
  42. Anderson, A.J. Microthermic behavior of crystal-rich inclusions in spodumene under confining pressure. Can. Mineral. 2019, 57, 853–865. [Google Scholar] [CrossRef]
  43. Li, J.; Chou, I.-M. Homogenization experiments of crystal-rich inclusions in spodumene from Jiajika lithium deposit, China, under elevated external pressures in a hydrothermal diamond-anvil cell. Geofluids 2017, 2017, 9252913. [Google Scholar] [CrossRef]
  44. Li, S.; Chou, I.-M. Refinement of the α-β quartz phase boundary based on in situ Raman spectroscopy measurements in hydrothermal diamond-anvil cell and an evaluated equation of state of pure H2O. J. Raman Spectros. 2022, 53, 1471–1482. [Google Scholar] [CrossRef]
  45. Toplis, M.J.; Dingwell, D.B.; Hess, K.-U.; Lenci, T. Viscosity, fragility, and configurational entropy of melts along the join SiO2-NaAlSiO4. Am. Mineral. 1997, 82, 979–990. [Google Scholar] [CrossRef]
  46. Berchot, J.-L.; Vivien, D.; Gourier, D.; Thery, J.; Collongues, R. Ion exchange properties of β-eucryptite (LiAlSiO4): EPR investigation on copper-doped single crystals. J. Solid State Chem. 1980, 34, 199–205. [Google Scholar] [CrossRef]
  47. Baumgartner, B.; Müller, G. Framework distortion by large ions in MAlSi2O6 aluminosilicates with keatite structure. Eur. J. Mineral. 1990, 2, 155–162. [Google Scholar] [CrossRef] [Green Version]
Figure 1. General characteristics of the natural lithium aluminosilicate specimens used in this study. (a) Optical image of a fragment of the high-clarity single crystal of kunzite. (b,c) Modal distribution and textural relationship within (b) the Tanco spodumene/quartz intergrowth (SQI) material and (c) the Bikita petalite single crystal as determined by BSE- and EDS-based quantitative mineralogy. (d,e) Powder-XRD patterns for (d) the Tanco SQI, and the kunzite single crystal, and for (e) the Bikita petalite. Simulated ICDD reference spectra for α-spodumene (04-010-3996), and petalite (01-083-6901) are shown for comparison. Peaks labeled q and a refer to quartz and albite, respectively.
Crystals 13 01182 g001
Figure 2. High-resolution powder-XRD scans around the (102) β-spodumeness lattice plane for the α-spodumene materials heat-treated at temperatures from 650 °C to 900 °C: (a) kunzite powder ground to <45 μm, (b) cm-sized blocks of kunzite, (c) SQI powder ground to <45 μm, and (d) cm-sized blocks of SQI. The inset in (d) shows details of the high-resolution scans for the block and powder at 575 °C with an expanded intensity scale to better visualize the presence of the diffraction peak. See details in Section 3.1.1.
Crystals 13 01182 g002
Figure 3. (a,b) BSE images of α-spodumene crystals within heat-treated SQI blocks showing (a) fluid-induced infiltration of β-spodumeness veinlets, and (b) intrinsic growth of β-spodumeness islands. (c,d) Photomicrographs of α-spodumene crystals in a pristine SQI sample emphasizing (c) the distribution of trails of fluid inclusions, and (d) the details of inclusions with co-existing liquid and vapor phases.
Crystals 13 01182 g003
Figure 4. Textural and compositional characteristics of the phase transition to β-spodumeness in cm-sized blocks of SQI and petalite heat treated for 4 h at 650 °C and 750 °C, respectively. (a) BSE images and quantitative WDS-based Na2O maps. (b) Na2O content as a function of the atomic Si/Al ratio in the crystal host (petalite, α-spodumene) and the newly-formed β-spodumeness.
Crystals 13 01182 g004
Figure 5. Raman spectra collected on the crystal host and the newly-developed β-spodumeness within blocks of (a) the Tanco SQI and (b) the Bikita petalite single crystal after heat treatment for 4 h at 650 °C and 750 °C, respectively. For the SQI, due to their narrow width, the spectra collected in the veinlets show contribution from the α-spodumene host. The label “Na–doped” refers to heat-treatment experiments where the SQI and petalite blocks were in contact with a Na2CO3 pellet. The vertical lines indicate the observed frequency of the β-spodumeness υs [T-O-T] band.
Crystals 13 01182 g005
Figure 6. Textural and compositional characteristics of the phase transition to β-spodumeness at the interface of a cm-sized block of SQI heat treated for 4 h at 650 °C in contact with a pellet of Na2CO3. (a) BSE images and quantitative WDS-based Na2O maps. (b) Variation of the Si/Al and Na/Al atomic ratios within the β-spodumeness veinlets.
Crystals 13 01182 g006
Figure 7. High-resolution powder-XRD scans around the (-212) petalite and (201) β-spodumeness lattice planes for the Bikita petalite single crystal heat-treated for 4 h at temperatures from 650 °C to 900 °C in the form of: (a) a powder ground to <45 μm, and (b) cm-sized blocks. (c) Comparison of the high-resolution XRD scans obtained for blocks heat treated at 750 °C as-is (pristine) and in contact with a Na2CO3 pellet (Na-doped). The arrow indicates the position of the diffraction peak for the (101) lattice plane in β-quartzss.
Crystals 13 01182 g007
Figure 8. EBSD analysis of a partially transformed, cm-sized block of single-crystal petalite heat-treated for 4 h at 750 °C. (a) BSE image and (b) EBSD phase map of a representative area revealing the distribution of β-spodumeness within the petalite host. (c) Pole figures showing the orientation distribution of the {100} and {001} planes of petalite as well as the {001} and {110} planes of β-spodumeness projected in relation to the sample surface (x, y) as displayed in (a,b). (d) Oriented model structures (constructed with CrystalMaker X) of petalite and β-spodumeness with the trace of the lattice planes from the pole figures shown as dashed lines; the small drawn pentagons emphasize the coincidence in the tetrahedral framework arrangement of both phases as discussed in Section 3.1.2. The indexing of the EBSD Kikuchi patterns and the construction of the model structures were achieved using the crystal chemistry data from Ross et al. [25] for petalite and Li and Peacor [1] for β-spodumeness.
Crystals 13 01182 g008
Figure 9. Powder-XRD patterns showing the relative distributions of β-spodumeness (β-sss) and β-quartzss (β-qss) in synthetic lithium stuffed silica derivatives crystallized from melts of LiAlSi2O6, LiAlSi2.9O7.8, LiAlSi4O10 compositions. The small progressive shift towards higher 2θ (smaller d spacing) observed for both β phases going from LiAlSi2O6 to LiAlSi4O10 stoichiometries reflects a decrease of the unit cell volume with a reduction in the proportion of interstitial lithium. The diffractograms labeled ‘doped’ are for synthesis in the presence of 0.3 cmol Na per mole of Li.
Crystals 13 01182 g009
Figure 10. BSE images showing the distribution of β-spodumeness and β-quartzss in synthetic lithium stuffed silica derivatives crystallized from melts of (a) LiAlSi2O6, (b) LiAlSi2.9O7.8, and (c) LiAlSi4O10 compositions.
Crystals 13 01182 g010
Figure 11. Raman spectra collected on (a) β-spodumeness and (b) β-quartzss in synthetic lithium stuffed silica derivatives crystallized from melts of LiAlSi2O6, LiAlSi2.9O7.8, and LiAlSi4O10 compositions. To emphasize the progressive shift of the υs [T-O-T] band with composition in both β-spoduemeness and β-quartzss, vertical solid lines are positioned at the frequency observed for LiAlSi2O6. The vertical dashed line for β-quartzss represents the estimated frequency of the shoulder growing with increasing silica. See details in Section 3.2.1.
Crystals 13 01182 g011
Figure 12. Compositional characteristics of β-spodumeness and β-quartzss in synthetic lithium stuffed silica derivatives crystallized from melts of LiAlSi2O6, LiAlSi2.9O7.8, and LiAlSi4O10 compositions. (a,b) Na2O content (wt%) as a function of the atomic Si/Al ratio as determined by WDS-EPMA for the pristine compositions and those doped with 0.3 cmol Na per mole of Li. (c) Na2O content (ppm) as a function of the atomic Si/Li ratio as determined by LA-ICP-MS for the pristine compositions. In (a,b), uncertainties for representative Na2O concentrations are expressed as error bars, calculated as three times the standard deviation based on counting statistics, with the minimum detection limit (MDL) indicated as a dashed line. For clarity, the error bars are slightly offset to the right of the data points.
Crystals 13 01182 g012
Figure 13. Structural and compositional characteristics of co-existing β-spodumeness and β-quartzss in a LiAlSi2.9O7.8 fragment after ion exchange in a sodium nitrate molten bath at 320 °C for 24 h. (a) Raman spectra, (b) Na/Al and Si/Al atomic ratios as determined by WDS-EPMA, and (c) BSE image and quantitative Na2O and Li2O maps collected by WDS-EPMA and LA-ICP-MS, respectively.
Crystals 13 01182 g013
Table 1. Mean chemical compositions of the natural lithium aluminosilicates used in this study.
α-Spodumene Petalite
Kunzite Tanco Bikita
N = 401 σN = 401 σN = 401 σ
Major oxides (wt%)
SiO264.290.3364.870.4078.200.44
Al2O327.340.1427.320.2116.430.16
Li2O7.980.047.830.124.900.02
Minor oxides (ppmw)
Na2O575505376132
MnO18338214118<1
FeO5061793563
Total (wt%)99.69 100.12 99.53
Trace elements (ppmw) *
Be0.21 0.50 6.97
Rb<0.04 0.42 0.07
Sr<0.004 0.04 0.05
Nb<0.003 0.65 <0.003
Cs<0.004 3.09 0.32
Ta0.05 13.8 0.01
Calculated mineral formulae **
Si1.998 2.007 4.004
Al1.002 0.996 0.992
Li0.998 0.974 1.009
Na0.003 0.004 0.000
Mn0.000 0.001 0.000
Fe0.000 0.001 0.000
O6.000 6.000 10.000
Note: Si and Al determined by EPMA, all other elements by LA-ICP-MS; * in all minerals, Mg, K, Ca, Ni, Y, Ce, and Pb were analyzed but were below detection limits; ** mineral formulae (atoms per formula unit) calculated based on 6 and 10 oxygens for α-spodumene and petalite, respectively.
Disclaimer/Publisher’s Note: The statements, opinions and data contained in all publications are solely those of the individual author(s) and contributor(s) and not of MDPI and/or the editor(s). MDPI and/or the editor(s) disclaim responsibility for any injury to people or property resulting from any ideas, methods, instructions or products referred to in the content.

