Abstract
Generally, fossil carbon materials (coal, coke/char, and petroleum coke), biological carbon materials (charcoal, woodchips), and quartz from the earth’s crust are sources of carbon and silica to synthesise silicon carbide (SiC) at temperatures between 2000 and 2200 °C. The study investigated the isothermal and non-isothermal kinetics of synthesising SiC from automotive shredder residues (ASR) and windshield glass of end-of-life-vehicle (ELVs) at 1300 °C, 1400 °C, and 1500 °C for 30 min. The kinetics of ASR and waste glass degradation were studied by relating the thermogravimetric data via the Coats–Redfern model. The reaction mechanism includes the rapid formation of a gaseous SiO intermediate, and carbon reduction of the SiO to SiC is reaction-rate-controlling. The understanding of kinetics inferred that the optimisation of SiC formation is entirely associated with the conversion of SiO2 to SiO vapour and their reaction with CO and carbon particles. The kinetic parameters of the degradation of mixed ASR and waste glass were determined, and the activation energy of mixed ASR and glass for non-isothermal conditions are 22.48 kJ mol−1, 2.97 kJ mol−1, and 6.5 kJ mol−1, and for the isothermal study to produce SiC is 225.9 kJ mol−1, respectively. The results confirmed that this facile way of synthesising SiC would conserve about 50% of chemical energy compared to the traditional way of producing SiC. A beneficial route of transforming the heterogenous ASR and glass wastes into SiC with economic and environmental benefits is recognised.
1. Introduction
Silicon carbide (SiC) is commercially produced in submerged arc furnaces in which the main carbon sources are fossil carbon materials (coal, coke/char, and petroleum coke) and biological carbon materials (charcoal, woodchips) [1,2,3]. The primary source of silicon is in the form of quartz from the earth’s crust and consists of about 28% silicon [4] extracted by the Acheson process using carbothermic reduction. Owing to SiC’s corrosion and creep resistance, extreme hardness, excellent thermal conductivity, thermal shock resistance, and good electronic and chemical properties, the materials are of considerable interest. SiC is commonly used in numerous metallurgical applications, such as foundries, refractories, and abrasives [5]. Nano-SiC has excellent and unique properties of bulk and nanomaterials, such as small-size, surface, boundary, and quantum size effects [6,7]. Nano-SiC is utilised in nanoscale electro-devices, nanosensors, biological labels, and light-emitting devices [8,9,10,11,12,13]. Sol–gel [14,15,16], chemical vapour deposition [17,18], plasma [19,20], microwave heating [21], etc., are the methods that have been used to produce nanostructured SiC.
Most of the methods and commercial production of SiC use natural and expensive raw materials, which poses several environmental and economic issues. Managing the waste material and limited resources on our planet is one of the most critical challenges engineers and scientists face to solve. Several studies have investigated the use of different waste materials, including waste windshield and window glass, thermoset plastic [22], automotive waste tires [23], waste tire rubber, e-waste glass powder [24,25], waste coffee grounds, and automotive glass waste [26], for the synthesis of silicon carbide (SiC) nanoparticles/nanofibers. The studies demonstrate successful methods of transforming these waste materials into SiC through high-temperature treatments. The resulting SiC materials exhibit desirable properties and have potential applications in various fields.
Automotive manufacturing is one of the most resource-consuming waste producers among different industries and sectors that need appropriate management [27]. There are three stages in waste management of end-of-life-vehicle (ELVs): depollution, dismantling, and shredding. After shredding, 70–75% of the total shredded output that contains ferrous fractions and nonferrous metals will be separated, and the rest, the 20 to 25% remaining from shredded production, called the automotive shredder residue (ASR), is sent to landfill [28,29]. Automotive shredder residue (ASR) is a highly heterogeneous, complex solid mixture of materials containing plastics, foams, rubber, glass (silica), moisture, metals, and metal oxides [30]. ASR has about 26% carbon, which could serve as an excellent alternative to conventional carbon sources for producing SiC [31]. Waste automotive glasses are a significant burden on the environment consisting of approximately 71% silica, which could be used as a silicon source in synthesising SiC [32]. Various mechanisms for the production of SiC have been identified using the reaction of silica [32] and carbon (C) at high temperatures, mostly between 1227 and 1727 °C [33]. However, due to the complexity of this reaction, based on the thermodynamics and kinetics of this reaction, there is no comprehensive investigation to establish a definite mechanism.
Kinetic studies of the thermal degradation of ASR and waste glass are a matter of significant interest for investigating their potential to be scaled up for the production of SiC [24,25,34]. Several studies have investigated the activation energy of ASR degradation using thermogravimetric analysis (TGA), which measures the weight loss of a material as it is heated. These studies have reported activation energies in the range of 120–250 kJ/mol for the degradation of ASR under different heating conditions. The relatively high activation energy of ASR degradation suggests that thermal treatment of ASR requires a significant input of energy to initiate the degradation reaction. However, the actual activation energy may vary depending on the specific composition of the ASR and the heating conditions used for its treatment. Thermogravimetric analysis has been traditionally used for comprehending the kinetics of the reaction studies, wherein experiments are usually performed under a controlled heating program. The mass loss curve (mass loss versus temperature) and the reaction conversion curve (the extent of the reaction versus temperature) are recorded during the heating. This study adopts one of the integral methods proposed by Coats and Redfern to determine the activation energy. Several other models were developed in addition to Coats and Redfern method (CRM) to determine the kinetic parameters, such as the Freeman and Carroll model (FCM) [35], distributed activation energy model (DAEM) [36], and Flynn–Wall–Ozawa model (FWO) [37]. Although the accuracy of determining the activation energy through CRM is still in doubt, these methods have been extensively used, neglecting the low-temperature end of the temperature integral [38]. The interactions between the compounds in the waste glass and ASR and their kinetic parameters were primarily investigated using TGA, and the formation kinetics of SiC were extracted for isothermal conditions between 1300 and 1500 °C.
2. Experimental Method
2.1. Materials
Automotive shredder residues (ASR) were used in this study and collected from local steel manufacturers in Australia due to the accessibility and availability of the local manufacturers.
Figure 1a represents oxides in the windshield glass powder. Silica is the dominant oxide of automotive glass with a mass fraction of 71.25%, and other major oxides in automotive glass are Na2O, CaO, and MgO, with mass fractions of 15.50%, 8.30%, and 3.73%, respectively. The XRF results represent that the windshield glass is a suitable source of silica. ASR (Automotive Shredder Residue) demonstrates promising characteristics as a carbon source due to the presence of various carbon-rich materials, including plastics, rubber, and textiles, as shown in Figure 1b, which represents that ASR is a suitable source of carbon as it contains nearly 26 wt.% carbon.
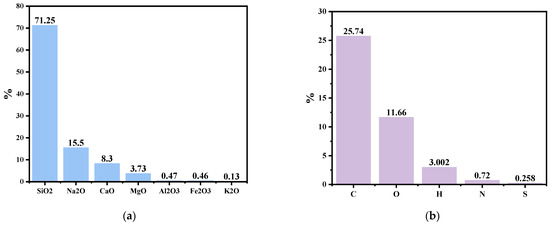
Figure 1.
(a). Main oxides in the windshield glass via XRF, and (b) CHNSO analysis of ASR [31].
2.2. Sample Preparation
ASR was shredded in a knife mill with attached metal screens in a size range of 0.75–1 mm for 10 min. The pulveriser ring mills crushed the waste windshield glass for 2–3 min to obtain a fine powder of the glass waste. The ASR samples were chosen for heat treatment using the cone and quartering method to avoid creating a systematic bias. The method involves first pouring the bulk material onto a clean flat surface and forming it into a cone shape. The cone is then flattened by spreading the material evenly around its base, forming a flattened circular area known as a “cake”. The cake is then divided into quarters using a straightedge, with two opposite quarters removed and discarded. The remaining two quarters are then combined to form a new cone and flattened into a new cake, and the process is repeated until the desired sample size is obtained. The ASR and waste glass with a weight ratio of 70–30% were blended. The ASR and waste glass blends were placed in a horizontal tube furnace under Ar gas (purity > 99%) supply at 0.8 L min−1 using a mass flow controller (Model HTF 7060, Ceramic Engineering, Sydney, Australia). The samples were carefully placed in the cold zone at 200 °C for 10 min to prevent thermal shock. Subsequently, they were transferred to the hot zone and subjected to temperatures of 1300 °C, 1400 °C, and 1500 °C for 30 min each. To prevent oxidation, the samples were then promptly returned to the cold zone for an additional 10 min. The entire process detailed above was carried out in a furnace under an inert Ar gas atmosphere to mitigate the potential for oxidation and maintain the integrity of the samples. Furthermore, the Ar gas played a pivotal role as a carrier gas, facilitating the transport of CO from one location to another throughout the process. This dual functionality of the Ar gas ensured both the protection of the samples and the efficient movement of CO, contributing to the successful execution of the experimental procedure.
2.3. Characterisation
Then, as-synthesised materials were collected and grounded by mortar and pestle for further analysis via X-ray diffraction (XRD, Empyrean II, PANalytical, Eindhoven, The Netherlands, Co Anode, K-alpha 1.78901 Å at 40 mA and 45 kV, XRD ranged 10° 2θ to 110° 2θ).
Highscore Plus software was used to analyse XRD results (version 5.1, 2021, Malvern PANalytical, Eindhoven, The Netherlands). EPMA-JEOL JXA-8500F Field-Emission SEM-EPMA Hyperprobe (WDS & SDD-EDS) (15 kV, 5 nA) was used to provide area-specific quantitative elemental results and measure the concentration of elements.
The EPMA samples were prepared by cold mounting the powder on the bottom of the mounting cup, and then the resins were poured into and left for 24 h to cure. The sample was removed from the mounting cup and polished until the synthesised material was exposed and ready for carbon coating. Carbon was spray-coated using Safematic CCU-010 for a thickness of 25 nm.
2.4. Kinetic Study
The thermal transformation behaviour of ASR and waste glass mixture (70–30%) under non-isothermal conditions of heating was investigated by thermogravimetric analysis (TGA) between ambient room temperature until 850 °C at 20 °C min−1 in a nitrogen atmosphere with a flow rate of 20 mL min−1 (TGA, STA-8000, PerkinElmer, Groningen, The Netherlands).
In the current study, non-isothermal degradation was conducted by correlating the TGA experimental data of ASR via Coats–Redfern’s method. For the non-isothermal degradation study in this work, the Coats–Redfern method was applied, which could be summarised by the following equation [39]:
when n = 1, where x = as the degree of transformation of the sample (, W0 is the initial mass of the sample, Wt is the actual mass of the sample at any time t, and Wf is the final mass of the sample after degradation), A = frequency factor, T = absolute temperature (K), Ea = activation energy (kJ mol−1), R = universal gas constant (8.314 J mol−1 K−1), and β = heating rate.
The isothermal kinetics of the mixture was investigated was demonstrated at 1300 °C, 1400 °C, and 1500 °C to understand the reaction mechanism of the formation of SiC from waste resources at different solid-state temperatures via collecting weight loss data and off-gas analysis data at 1300 °C, 1400 °C, and 1500 °C. An infrared gas analyser (IR, AO2020, Advanced optima, ABB) was attached to the horizontal tube furnace to measure the non-condensable released gases (CO, CO2, CH4, H2) during the heat treatment of waste materials. The off-gas analysis data were analysed, and the required mass balance was carried out to determine the extent of conversion (with time) of silica in waste glass to silicon carbide. The extent of conversion data was fitted into different solid–gas reaction kinetic models (Table 1), and the most suitable model was determined using the linear regression model, where a linear equation is fitted, and the model with an R2 value closer to one is considered to fit the best.

Table 1.
The conventional models for solid-state reactions to determine the reduction mechanism of silica with carbon [40].
The Arrhenius equation (Equation (2)) was used in this study to predict the temperature dependence of chemical reaction rates [41].
where K = the reaction rate constant, A = pre-exponential factor (frequency factor), Ea = activation energy, R = the universal gas constant, and T = the absolute temperature.
2.5. Formation Mechanism of SiC
Based on the literature, the formation mechanism of SiC production has been described in detail. Various mechanisms have been proposed to explain the formation of SiC from SiO2 and C reactions at high temperatures [40]. The reaction kinetics is studied to understand the detailed mechanism of SiC synthesis. The reaction mechanism of carbothermic reduction is represented in Figure 2. SiC production is a multi-step reaction that starts with the reduction of SiO2 by C in direct physical contact [42], as shown in reaction (3), Viscomi, F. and Himmel, L. adopted the general reaction of the SiC formation [43]. As shown in Figure 2a, during heat treatment of mixed ASR and waste glass at 1300 °C, 1400 °C, and 1500 °C for 30 min, the reaction of SiO2 with C happened and resulted in gaseous SiO and CO (4) as schettamicaly presented in Figure 2b. According to reaction (5), SiO vapour reacted with CO gas and formed the SiC [3,43], as indicated in Figure 2c. Reaction (6) demonstrates the reaction between CO2 with the surrounding C to generate CO, which boosts reaction (7) to produce SiC constantly [25,44].
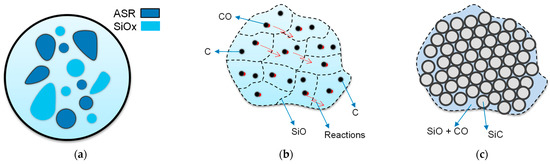
Figure 2.
Schematic porous SiC formation mechanism during heat treatment: (a) mixed ASR plastics and glass are heated at different temperatures; (b) Chemical reactions; (c) SiO and CO reacted together and produced SiC.
3. Results and Discussion
3.1. Characterisation of Heat-Treated Products
XRD Spectrums of Heat-Treated ASR and Waste Glass Mixture
The glass from the windshield of cars was used as a Si source and ASR as a source of C to synthesise SiC at three different temperatures 1300 °C, 1400 °C, and 1500 °C. As shown in Figure 3, X-ray diffraction spectra indicate that the SiC peaks start forming from 1300 °C, and near the complete transformation into SiC happened at 1500 °C, and there are some minor peaks of SiO2. SiC peaks at 1500 °C are stronger than 1400 °C and 1300 °C, indicating that the increase in temperature to 1500 °C favours more formation of SiC. Results from other studies also confirmed that the reaction is more prominent between Si and C at a higher temperature [25]. The highest peak for SiC is around 41.60°, 71.50°, and 85.88°, corresponding to rings (111), (220), and (311) planes of cubic SiC (Reference code: 01-087-3651). Notably, the decreasing intensity of some SiO peaks with increasing temperatures also indicates the conversion of the SiO to SiC.
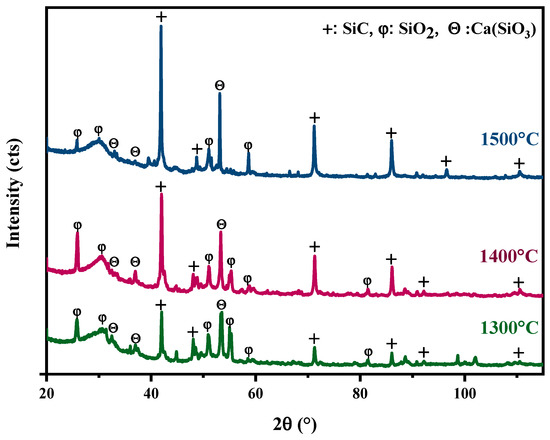
Figure 3.
XRD spectrums of heat-treated mixed ASR and waste glass at 1300 °C, 1400 °C, and 1500 °C for 30 min.
Figure 4 plots the mapped areas verified as only C and Si by quantitative and mapping targeted for qualitative scans to show the presence of Si. The ability of EPMA to resolve the peaks of Si Ka (1.739 keV) and W Ma (1.774 keV), which are not resolvable via EDS, makes it a robust technique to confirm the presence of SiC. The distribution of Si and C is depicted in Figure 4b. Moreover, Figure 4c corresponds to the intensity of C and Si peaks from point analyses (yellow arrow), affirming the presence of distinct SiC particles formed at 1500 °C. The mass concentration of Si and C derived from the point analyses are listed in Table 2. It is to be noted that a high-purity silicon sample coated with the same thickness of carbon was used as the standard. Even though the sample was coated with carbon, there was an increase in the peak intensity of the carbon as compared to that obtained with the standard, strongly confirming the presence of carbide. The results of EPMA were in very good agreement with the XRD results, revealing the formation of SiC from ASRs.
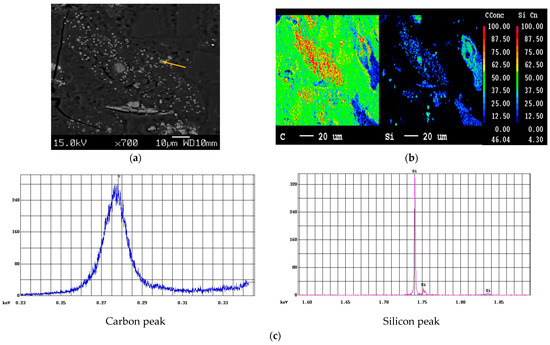
Figure 4.
EPMA of SiC samples at 1500 °C: (a) location of points and qualitative scans, (b) elemental mapping and point analysis (c) obtained carbon and silicon peaks.
Table 2.
Point quantification normalised mass percent of elements.
3.2. Kinetics of Degradation
3.2.1. Non-Isothermal Condition
In the current study, the non-isothermal degradation was conducted by correlating the experimental data acquired from TGA of mixed ASR and waste glass (70–30%) via the Coats–Redfern method, as illustrated in Figure 5. Non-isothermal studies using TGA equipment involve heating the ASR and glass waste mixture and observing their weight changes continually over time for a constant heating rate. Non-isothermal kinetics are generally relevant for pyrolysis and decomposition reactions. The notable weight losses of mixed ASR and waste glass due to thermal decomposition took place at 170 °C (Tonset) and were completed at 800 °C (Tendset). From the TGA curve, the degradation of ASR is inferred to be a single-stage process. However, the derivative thermogravimetry (DTG) curve, plotted based on the rate of weight changes of the ASR and glass waste upon heating against temperature, shows a multi-staged degradation. The first two degradation steps at 359 °C and 520 °C in the curve result from the plastics in the ASR, and the last degradation step at 717 °C is because of the wood and glass transition. By comparing the weight loss of the sample at any time, the extent of degradation can be determined, i.e., W0–Wt/W0–Wf, where W0 is the initial mass of the sample, Wt is the actual mass of the sample at any time t, and Wf is the final mass of the sample after degradation [29]. Based on the degradation analysis of mixed ASR and glass, the activation energy and frequency factor of individually distinguished stages were estimated. Figure 6 shows the plots of Coats–Redfern’s when n = 1. Figure 6a depicts the first step degradation activation energy; the frequency factor is 22.48 kJ mol−1 and 261 min−1, respectively. Figure 6b demonstrates the second step degradation activation energy is 2.97 kJ mol−1, and the frequency factor is 34.58 min−1. In the last step, degradation activation energy is 6.5 kJ mol−1, and the frequency factor is 75.77 min−1, as shown in Figure 6c. Table 3 represents the non-isothermal parameters of ASR from various studies including the current work.
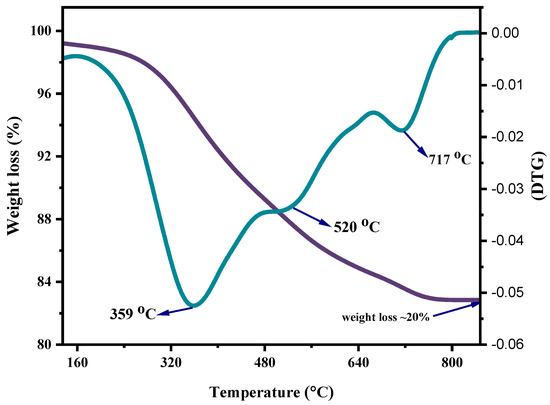
Figure 5.
TGA and DTGA curves of mixed ASR and waste glass ratio of 70–−30%.
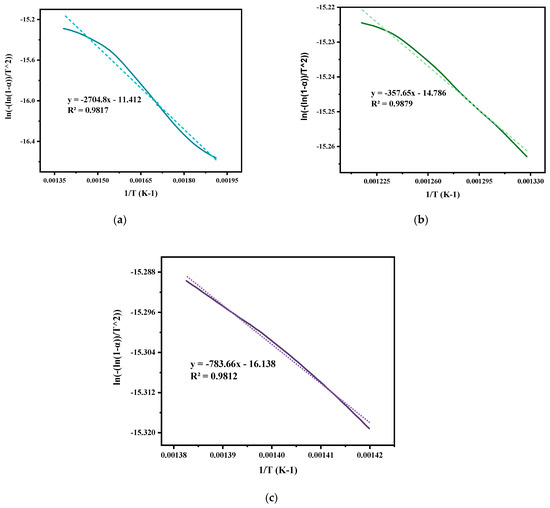
Figure 6.
Coats−Redfern plots of ASR: (a) in the temperature range of 250 to 450 °C, (b) in the range of 480 to 550 °C, and (c) in the range of 650 to 750 °C when n = 1; calculated from TGA-DTG data at a heating rate of 20 °C min−1 under nitrogen purge of 20 mL min−1.
Table 3.
Non-isothermal kinetic parameters of ASR decomposition from different studies.
3.2.2. Isothermal Degradation
The mixed ASR and waste glass were heat treated at three different temperatures, 1300 °C, 1400 °C, and 1500 °C, for 30 min to understand the reaction mechanism of the formation of SiC. The weight loss and off-gas data (Figure S1 in supplementary file) were recorded, and the extent of the conversion of silica in waste glass to silicon carbide, and its duration, was determined, and then fitted into different solid–gas reaction kinetic models, as listed in Table 1. Figure 7, Figure 8 and Figure 9 and Table 4 present the model’s fit in Table 1 with the experimental reduction data at different temperatures. The k values and their relevant R2 were investigated via these models and were plotted in these figures. The fitted curves that are closer to one value (attending to the calculated R2 values) in these figures are summarised in Table 4. According to Figure 7, Figure 8 and Figure 9, and Table 4, R2 values of the 3D diffusion mechanism in all three temperatures were closest to one. Therefore, it is likely that the reaction rate was fast enough at these temperatures, and the diffusion of SiO gas inside the carbon particles controlled the total rate of the reactions [40]. As demonstrated by Krishnarao, R.V. and Godkhindi, M.M. (1992), the favourable conditions to optimise the formation of SiC are the SiO vapour emissions at a reasonable rate and the presence of CO and carbon particles [46]. Furthermore, Abolpour B. et al. (2020) reported that the primary route for SiC production in the investigated reaction is attributed to the reaction of silicon components at the surface of carbon particles or by the diffusion of SiO species inside the carbon particles and at temperatures exceeding 1477 °C, where the reduction process exhibited a fast reaction rate, with the rate of SiO diffusion inside the carbon particles governing the overall reaction rate [40]. As observed by the results of this study and other researchers’ studies, the enhanced production of SiC is related to the conversion of SiO2 to SiO vapour and the reaction with the carbon-carrying particles to the fullest extent [32,47].
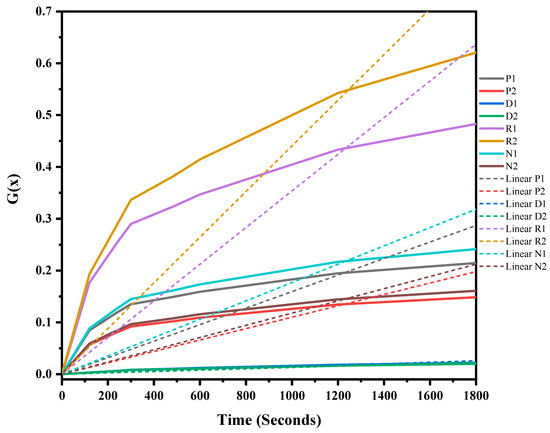
Figure 7.
G(x) versus time for the conversion of sample heat-treated at 1300 °C for 30 min.
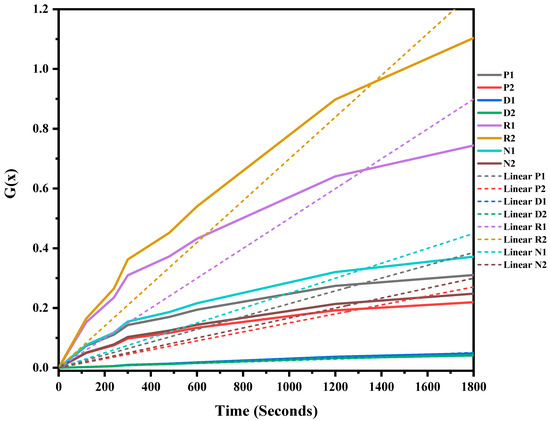
Figure 8.
G(x) versus time for the conversion of sample heat treated at 1400 °C for 30 min.
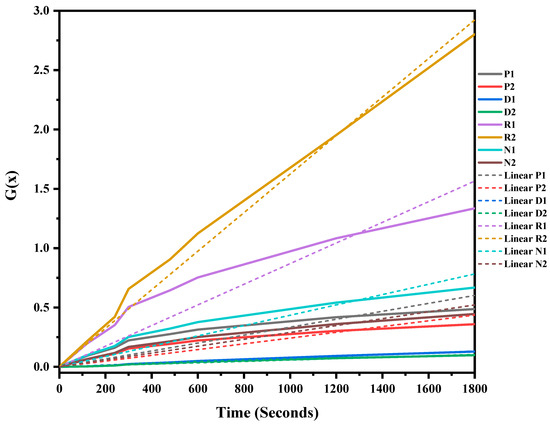
Figure 9.
G(x) versus time for the conversion of sample heat treated at 1500 °C for 30 min.
Table 4.
Mathematical Model 70%ASR + 30%waste glass for 30 min.
3.2.3. Temperature Dependence of Initial Linear Rate Constant
The reaction rate described in this part is for the synthesis of SiC from mixed ASR and waste glass in the higher temperature range of 1300 °C, 1400 °C, and 1500 °C. The influence of temperature on the rates of chemical reactions is known as the Arrhenius equation [48]. The temperature dependence of the reaction rate constant is displayed in Figure 10, and the activation energy was calculated as presented in Equation (8). Activation energies of producing SiC from natural resources are listed in Table 5. On comparing the activation energies of producing SiC from natural resources, the ASR-based production route was determined to be 225.9 kJ mol−1, which was much less, indicating a higher reaction rate. One of the reasons for the lower activation energy is the high volatility and lower decomposition temperature of ASR, which favours a faster reaction compared to that of the natural carbon sources used in the production of SiC.
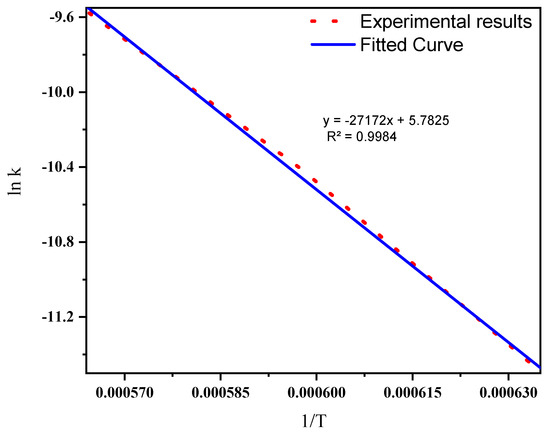
Figure 10.
The temperature dependence of the initial linear rate constant.
Table 5.
Activation energy determined for the formation of SiC from various studies.
The linearity of the relationship between the reaction rate and the temperature drawn from Figure 10 can be expressed by Equation (8).
y = −27,172x + 5.7825 (R2 = 0.9984)
Slope of the line, m = −Ea/R = −27,172, Ea = 27,172 × 8.314 = 225,908 J mol−1 = 225.9 KJ mol−1.
4. Conclusions
In conclusion, this research comprehensively evaluated and compared the activation energy required for synthesising SiC from automotive shredder residue (ASR) and waste glass, as opposed to the traditional method that relies on natural resources. The non-isothermal degradation analysis using Coats–Redfern’s approach revealed a three-step degradation process with distinct activation energies for each step. The activation energies were measured to be 22.48 kJ mol−1, 2.97 kJ mol−1, and 6.5 kJ mol−1, with corresponding frequency factors of 261 min−1, 34.58 min−1, and 75.77 min−1. Furthermore, the study investigated the reaction mechanism involved in the formation of SiC from ASR and waste glass at various temperatures. The results indicated that the 3D diffusion mechanism, with R2 values closest to one, was the dominant mechanism at temperatures of 1300 °C, 1400 °C, and 1500 °C. This finding suggests that the reaction rate at these temperatures was sufficiently fast and controlled by the diffusion of SiO gas inside the carbon particles. Importantly, the activation energy determined through isothermal studies was found to be approximately 225.9 kJ mol−1 for the ASR-based production route, which is significantly lower than the activation energy associated with the traditional method utilising natural resources. This lower activation energy indicates a higher reaction rate in the ASR-based production route. The volatile nature and lower decomposition temperature of ASR contribute to its favourable reactivity, allowing for a faster reaction compared to natural carbon sources typically used in SiC production. Utilising waste resources, such as ASR and waste glass, for SiC synthesis presents a promising and sustainable solution for managing automotive waste that would otherwise end up in landfills. Additionally, it helps mitigate the growing scarcity of natural resources. By understanding the underlying mechanisms and optimising the production process, this research paves the way for efficient and environmentally friendly SiC production, contributing to a more sustainable future.
Supplementary Materials
The following supporting information can be downloaded at: https://www.mdpi.com/article/10.3390/cryst13081183/s1, Figure S1: Concentration levels of non-condensable gases released during heat treatment of mixed 70% ASR-30% waste glass at different temperatures for 30 min.
Author Contributions
S.H.: Conceptualization, Methodology, Investigation, Formal analysis, Visualisation, Writing—original draft, and Writing—review and editing. S.B.: Conceptualization, Methodology, formal analysis, Validation, and Writing—review and editing. F.P.: Conceptualization, Methodology, Validation, Supervision, and Writing—review and editing S.U.: Writing—review and editing, V.S.: Resources, Supervision, Funding acquisition, Project administration, and Writing—review and editing. All authors have read and agreed to the published version of the manuscript.
Funding
This research was funded by the Australian Research Council’s Discovery Project funding scheme (project: DP180101436).
Data Availability Statement
Data can be made available upon request to the authors.
Acknowledgments
This research was supported by the Australian Research Council’s Discovery Project funding scheme (project: DP180101436). We gratefully acknowledge the analytical support given by the Mark Wainwright Analytical Centre (MWAC), UNSW, Sydney, Australia.
Conflicts of Interest
The authors declare no conflict of interest.
References
- Aarnæs, T.S.; Tangstad, M.; Ringdalen, E. SiC formation and SiO reactivity of methane at high temperatures. Mater. Chem. Phys. 2022, 276, 125355. [Google Scholar] [CrossRef]
- Li, F.; Tangstad, M. Carbothermal reduction of quartz with carbon from natural gas. Met. Mater. Trans. B 2017, 48, 853–869. [Google Scholar] [CrossRef]
- Li, F.; Tangstad, M.; Ringdalen, E. Carbothermal reduction of quartz and carbon pellets at elevated temperatures. Met. Mater. Trans. B 2018, 49, 1078–1088. [Google Scholar] [CrossRef]
- Schei, A.; Tuset, J.K.; Tveit, H. Production of High Silicon Alloys; Tapir: Trondheim, Norway, 1998. [Google Scholar]
- Kumar, P.V.; Gupta, G.S. Study of formation of silicon carbide in the Acheson process. Steel Res. 2002, 73, 31–38. [Google Scholar] [CrossRef]
- Ramrakhiani, M. Nanostructures and their applications. Recent Res. Sci. Technol. 2012, 4, 14–19. [Google Scholar]
- Castelletto, S.; Johnson, B.C.; Boretti, A. Quantum effects in silicon carbide hold promise for novel integrated devices and sensors. Adv. Opt. Mater. 2013, 1, 609–625. [Google Scholar] [CrossRef]
- Chan, W.C.; Nie, S. Quantum dot bioconjugates for ultrasensitive nonisotopic detection. Science 1998, 281, 2016–2018. [Google Scholar] [CrossRef]
- Bruchez, M.; Moronne, M.; Gin, P.; Weiss, S.; Alivisatos, A.P. Semiconductor nanocrystals as fluorescent biological labels. Science 1998, 281, 2013–2016. [Google Scholar] [CrossRef]
- Phan, H.-P.; Dao, D.V.; Nakamura, K.; Dimitrijev, S.; Nguyen, N.-T. The piezoresistive effect of SiC for MEMS sensors at high temperatures: A review. J. Microelectromechanical Syst. 2015, 24, 1663–1677. [Google Scholar] [CrossRef]
- Ziegler, G.; Lanig, P.; Theis, D.; Weyrich, C. Single crystal growth of SiC substrate material for blue light emitting diodes. IEEE Trans. Electron Devices 1983, 30, 277–281. [Google Scholar] [CrossRef]
- Wright, N.G.; Horsfall, A.B.; Vassilevski, K. Prospects for SiC electronics and sensors. Mater. Today 2008, 11, 16–21. [Google Scholar] [CrossRef]
- Oliveros, A.; Guiseppi-Elie, A.; Saddow, S.E. Silicon carbide: A versatile material for biosensor applications. Biomed. Microdevices 2013, 15, 353–368. [Google Scholar] [CrossRef] [PubMed]
- Hatakeyama, F.; Kanzaki, S. Synthesis of Monodispersed Spherical β-Silicon Carbide Powder by a Sol-Gel Process. J. Am. Ceram. Soc. 1990, 73, 2107–2110. [Google Scholar] [CrossRef]
- Seog, I.-S.; Kim, C.H. Preparation of monodispersed spherical silicon carbide by the sol-gel method. J. Mater. Sci. 1993, 28, 3277–3282. [Google Scholar] [CrossRef]
- Qian, J.-M.; Wang, J.-P.; Qiao, G.-J.; Jin, Z.-H. Preparation of porous SiC ceramic with a woodlike microstructure by sol-gel and carbothermal reduction processing. J. Eur. Ceram. Soc. 2004, 24, 3251–3259. [Google Scholar] [CrossRef]
- Guo, J.; Zuo, Y.; Li, Z.; Gao, W.; Zhang, J. Nanostructures. Preparation of SiC nanowires with fins by chemical vapor deposition. Phys. E Low-Dimens. Syst. Nanostructures 2007, 39, 262–266. [Google Scholar] [CrossRef]
- Henderson, E.J.; Veinot, J.G. From phenylsiloxane polymer composition to size-controlled silicon carbide nanocrystals. J. Am. Chem. Soc. 2009, 131, 809–815. [Google Scholar] [CrossRef]
- Zhu, C.; Zhao, G.; Revankar, V.; Hlavacek, V. Synthesis of ultra-fine SiC powders in a dc plasma reactor. J. Mater. Sci. 1993, 28, 659–668. [Google Scholar] [CrossRef]
- Guo, J.; Gitzhofer, F.; Boulos, M.I. Induction plasma synthesis of ultrafine SiC powders from silicon and CH4. J. Mater. Sci. 1995, 30, 5589–5599. [Google Scholar] [CrossRef]
- Ramesh, P.; Vaidhyanathan, B.; Ganguli, M.; Rao, K.J. Synthesis of β-SiC powder by use of microwave radiation. J. Mater. Res. 1994, 9, 3025–3027. [Google Scholar] [CrossRef]
- Farzana, R.; Sahajwalla, V. Novel recycling to transform automotive waste glass and plastics into SiC-bearing resource by silica reduction. J. Sustain. Metall. 2015, 1, 65–74. [Google Scholar] [CrossRef]
- Rajarao, R.; Farzana, R.; Khanna, R.; Sahajwalla, V. Synthesis of SiC/Si3N4 nanocomposite by using automotive waste tyres as resource. J. Ind. Eng. Chem. 2015, 29, 35–38. [Google Scholar] [CrossRef]
- Mayyas, M.; Pahlevani, F.; Handoko, W.; Sahajwalla, V. Preliminary investigation on the thermal conversion of automotive shredder residue into value-added products: Graphitic carbon and nano-ceramics. Waste Manag. 2016, 50, 173–183. [Google Scholar] [CrossRef] [PubMed]
- Maroufi, S.; Mayyas, M.; Sahajwalla, V. Waste materials conversion into mesoporous silicon carbide nanocermics: Nanofibre/particle mixture. J. Clean. Prod. 2017, 157, 213–221. [Google Scholar] [CrossRef]
- Hossain, R.; Sahajwalla, V. Molecular recycling: A key approach to tailor the waste recycling for high-value nano silicon carbide. J. Clean. Prod. 2021, 316, 128344. [Google Scholar] [CrossRef]
- Jody, B.; Daniels, E.; Duranceau, C.; Pomykala, J.; Spangenberger, J. End-of-Life Vehicle Recycling: State of the Art of Resource Recovery from Shredder Residue; Argonne National Lab (ANL): Argonne, IL, USA, 2011. [Google Scholar]
- GHK; Bio Intelligence Service. A Study to Examine the Benefits of the End of Life Vehicles Directive and the Costs and Benefits of a Revision of the 2015 Targets for Recycling, Re-Use and Recovery under the ELV Directive; DG Environment: Birmingham, AL, USA, 2006. [Google Scholar]
- Cossu, R.; Lai, T. Automotive shredder residue (ASR) management: An overview. Waste Manag. 2015, 45, 143–151. [Google Scholar] [CrossRef]
- Patierno, O.; Cipriani, P.; Pochetti, F.; Giona, M. Pyrolysis of automotive shredder residues: A lumped kinetic characterization. Chem. Eng. J. 1998, 70, 157–163. [Google Scholar] [CrossRef]
- Hemati, S.; Hossain, R.; Sahajwalla, V. Selective thermal transformation of automotive shredder residues into high-value nano silicon carbide. Nanomaterials 2021, 11, 2781. [Google Scholar] [CrossRef] [PubMed]
- Lee, J.-S.; Byeun, Y.-K.; Lee, S.-H.; Choi, S.-C. In situ growth of SiC nanowires by carbothermal reduction using a mixture of low-purity SiO2 and carbon. J. Alloys Compd. 2008, 456, 257–263. [Google Scholar] [CrossRef]
- Omoriyekomwan, J.E.; Tahmasebi, A.; Dou, J.; Tian, L.; Yu, J. Mechanistic study on the formation of silicon carbide nanowhiskers from biomass cellulose char under microwave. Mater. Chem. Phys. 2021, 262, 124288. [Google Scholar] [CrossRef]
- Mayyas, M.; Pahlevani, F.; Maroufi, S.; Liu, Z.; Sahajwalla, V. Waste conversion into high-value ceramics: Carbothermal nitridation synthesis of titanium nitride nanoparticles using automotive shredder waste. J. Environ. Manag. 2017, 188, 32–42. [Google Scholar] [CrossRef] [PubMed]
- Long, Q.; Wang, C. Thermal Degradation Behavior and Kinetics Analysis of PMMA with Different Carbon Black Contents. Chin. J. Mater. Res. 2022, 36, 837–844. [Google Scholar]
- Xu, J.; Zuo, H.; Wang, G.; Zhang, J.; Guo, K.; Liang, W. Gasification mechanism and kinetics analysis of coke using distributed activation energy model (DAEM). Appl. Therm. Eng. 2019, 152, 605–614. [Google Scholar] [CrossRef]
- Yao, Z.; Yu, S.; Su, W.; Wu, W.; Tang, J.; Qi, W. Kinetic studies on the pyrolysis of plastic waste using a combination of model-fitting and model-free methods. Waste Manag. Res. 2020, 38, 77–85. [Google Scholar] [CrossRef] [PubMed]
- Cai, J.; Bi, L. Precision of the Coats and Redfern method for the determination of the activation energy without neglecting the low-temperature end of the temperature integral. Energy Fuels 2008, 22, 2172–2174. [Google Scholar] [CrossRef]
- Mayyas, M.; Mayyas, M.; Pahlevani, F.; Liu, Z.; Rajarao, R.; Sahajwalla, V. From automotive shredder residue to nano-ceramics and graphitic carbon—Thermal degradation kinetics. J. Anal. Appl. Pyrolysis 2016, 120, 60–74. [Google Scholar] [CrossRef]
- Abolpour, B.; Shamsoddini, R. Mechanism of reaction of silica and carbon for producing silicon carbide. Prog. React. Kinet. Mech. 2020, 45, 1468678319891416. [Google Scholar] [CrossRef]
- Crapse, J.; Pappireddi, N.; Gupta, M.; Shvartsman, S.Y.; Wieschaus, E.; Wühr, M. Evaluating the Arrhenius equation for developmental processes. Mol. Syst. Biol. 2021, 17, e9895. [Google Scholar] [CrossRef]
- Carroll, D.F.; Weimer, A.W.; Dunmead, S.D.; Eisman, G.A.; Hwang, J.H.; Cochran, G.A.; Susnitzky, D.W.; Beaman, D.R.; Conner, C.L. Carbothermally prepared nanophase SiC/Si3N4 composite powders and densified parts. AIChE J. 1997, 43, 2624–2635. [Google Scholar] [CrossRef]
- Viscomi, F.; Himmel, L. Kinetic and mechanistic study on the formation of silicon carbide from silica flour and coke breeze. JOM 1978, 30, 21–24. [Google Scholar] [CrossRef]
- Zhang, Y.; Shi, E.-W.; Chen, Z.-Z.; Li, X.-B.; Xiao, B. Large-scale fabrication of silicon carbide hollow spheres. J. Mater. Chem. 2006, 16, 4141–4145. [Google Scholar] [CrossRef]
- Han, S.; Jang, Y.-C.; Choi, Y.-S.; Choi, S.-K. Thermogravimetric kinetic study of automobile shredder residue (ASR) pyrolysis. Energies 2020, 13, 1451. [Google Scholar] [CrossRef]
- Krishnarao, R.V.; Godkhindi, M.M. Studies on the formation of SiC whiskers from pulverized rice husk ashes. Ceram. Int. 1992, 18, 35–42. [Google Scholar] [CrossRef]
- Choi, H.-J.; Lee, J.-G. Continuous synthesis of silicon carbide whiskers. J. Mater. Sci. 1995, 30, 1982–1986. [Google Scholar] [CrossRef]
- Laidler, K.J. The development of the Arrhenius equation. J. Chem. Educ. 1984, 61, 494. [Google Scholar] [CrossRef]
- Lee, J.G. Formation of silicon carbide from rice hulls. Am. Ceram. Soc. Bull. 1975, 54, 195–198. [Google Scholar]
- Weimer, A.W.; Nilsen, K.J.; Cochran, G.A.; Roach, R.P. Kinetics of carbothermal reduction synthesis of beta silicon carbide. AIChE J. 1993, 39, 493–503. [Google Scholar] [CrossRef]
- Blumenthal, J.L.; Santy, M.J.; Burns, E.A. Kinetic studies of high-temperature carbon-silica reactions in charred silica-reinforced phenolic resins. AIAA J. 1966, 4, 1053–1057. [Google Scholar] [CrossRef]
- Kuznetsova, V.; Dmitrenko, V.; Kokurin, A. Kinetics of formation of silicon carbide. Proc. Mendeleev Chem. Soc. 1980, 25, 118–119. [Google Scholar]


Disclaimer/Publisher’s Note: The statements, opinions and data contained in all publications are solely those of the individual author(s) and contributor(s) and not of MDPI and/or the editor(s). MDPI and/or the editor(s) disclaim responsibility for any injury to people or property resulting from any ideas, methods, instructions or products referred to in the content. |
© 2023 by the authors. Licensee MDPI, Basel, Switzerland. This article is an open access article distributed under the terms and conditions of the Creative Commons Attribution (CC BY) license (https://creativecommons.org/licenses/by/4.0/).