Abstract
Tetrafluorocyclohexa-1,3-diene ring-containing tricyclic π-conjugated molecules are promising negative-dielectric-anisotropy guest species for vertical-alignment-type liquid-crystalline (LC) displays. Building on our previous work reporting the excellent photoluminescence (PL) properties of tricyclic π-conjugated molecules with central tetrafluorocyclohexa-1,3-diene rings, we herein synthesized four analogous molecules with terminal tetrafluorocyclohexa-1,3-diene rings from commercially available precursors and investigated the effects of substituent type and diene ring position on PL and LC properties using microscopic and spectroscopic methods. One of the prepared molecules exhibited a relatively planar molecular structure and formed herringbone-type aggregates via π/F and CH/π interactions instead of forming stacked aggregates via π/π stacking interactions, thus exhibiting relatively strong PL in solution and crystalline states. Moreover, the PL color of this compound depended on the electronic character of its terminal substituents along the long molecular axis. Of the four prepared species, two featured terminal ethyl groups and formed one or more LC phases. The PL properties of these phases indicated that the related phase transition induced changes in the aggregate structure, PL wavelength, and PL color. Our results expand the applicability of CF2CF2 moiety-containing tricyclic compounds as functional molecules for the fabrication of next-generation PL, LC, and PL-LC materials.
1. Introduction
Fluorinated organic molecules have drawn much attention as the structural components of pharmaceuticals [1,2] and agrichemicals [3,4], as well as major constituents of liquid crystals [5,6,7] and optoelectronic materials [8,9]. This popularity is due to the unique properties of fluorine [10], namely, its highest electronegativity among all elements (4.0 on the Pauling scale), second smallest atomic radius (147 pm according to Bondi [11]), and the high dissociation energy of C–F bonds (105.4 kcal·mol−1). In view of these properties, the introduction of fluorine into molecular structures enhances latent functions or promotes the emergence of new ones and is, therefore, a powerful approach for the development of novel organic functional materials.
Our group has developed efficient and selective synthetic routes to various fluorinated organic molecules [12,13] including those exhibiting photoluminescence (PL) and liquid-crystalline (LC) properties [14]. The results obtained so far indicate that the introduction of fluorine atoms substantially increases PL intensity in the solid state and induces the emergence of mesophases between crystalline (Cry) and isotropic (Iso) phases.
Previously, we prepared a tricyclic molecule with a central tetrafluorocyclohexa-1,3-diene ring (1a) as a guest molecule with negative dielectric anisotropy to develop vertical alignment-type LC materials [15,16,17,18] and showed that 1a exhibits blue PL in the crystalline and solution states. On this basis, we synthesized analogous tricyclic molecules with controlled electron density along the long molecular axis (1b and 1c) and revealed that their PL behavior is greatly affected by the electron density distribution, which, in turn, is influenced by the electronic properties of terminal substituents (Figure 1) [19].
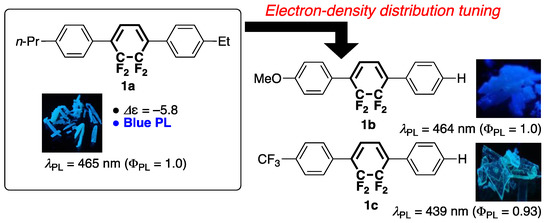
Figure 1.
Previously synthesized tricyclic molecules 1a–c with central tetrafluorocyclohexa-1,3-diene rings.
Building on the abovementioned results, we herein synthesized and characterized molecules 2a–d to examine how PL and LC properties are affected by the position of the tetrafluorocyclohexa-1,3-diene ring in the tricyclic structure and the electronic properties of terminal substituents (Figure 2) [15,18].
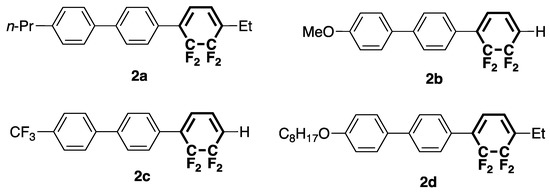
Figure 2.
Structures of tricyclic molecules 2a–d with terminal tetrafluorocyclohexa-1,3-diene rings.
2. Materials and Methods
2.1. General Characterization
Melting points (Tm) were measured on a Shimadzu DSC-60 Plus instrument using at least three heating/cooling cycles at a scan rate of 5.0 °C·min−1. 1H and 13C nuclear magnetic resonance (NMR) spectra were recorded on a Bruker AVANCE III 400 spectrometer (1H: 400.13 MHz, 13C: 100.61 MHz) in chloroform-d (CDCl3). Chemical shifts were reported on the basis of the residual proton or carbon signal of CHCl3 (δH = 7.26 ppm, δC = 77 ppm) in parts per million (ppm). 19F-NMR (376.46 MHz) spectra were recorded on the Bruker AVANCE III 400 spectrometer in CDCl3 using trichlorofluoromethane (CFCl3, δF = 0.00 ppm) as an internal standard. Infrared (IR) spectra were acquired using the KBr method on a JASCO FT/IR-4100 type A spectrometer. High-resolution mass spectra (HRMS) were recorded on a JEOL JMS-700MS spectrometer using fast atom bombardment (FAB+) methods. Column chromatography was performed using Wakogel® 60N (38–100 μm), and thin-layer chromatography was performed using the corresponding silica gel plates (silica gel 60F254, Merck, Darmstadt, Germany).
2.2. Materials
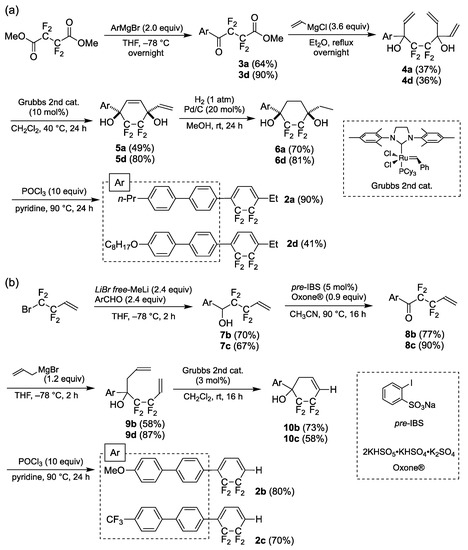
The target molecules were synthesized according to a previously reported method from readily available precursors, namely, dimethyl 2,2,3,3-tetrafluorosuccinate (2a and 2d; Scheme 1a) [18] and 4-bromo-3,3,4,4-tetrafluorobut-1-ene (2b and 2c, Scheme 1b) [15].
Scheme 1.
Syntheses of (a) 2a and 2d, and (b) 2b and 2c.
Detailed synthetic procedures are provided in Schemes S1 and S2, and Figures S1–S42 shown in the Supplementary Materials. Characterization data are presented below (for 2a–d) and in the Supplementary Materials (for other molecules).
2.2.1. 4-Ethyl-5,5,6,6-tetrafluoro-1-[4-(4-n-propylphenyl)phenyl]cyclohexa-1,3-diene (2a)
Yield: 90% (0.25 g, 0.67 mmol); yellow solid; Tm: 92 °C; 1H-NMR (CDCl3): δ 0.98 (t, J = 7.2 Hz, 3H), 1.20 (t, J = 7.6 Hz, 3H), 1.69 (sext, J = 7.6 Hz, 2H), 2.40 (q, J = 7.2 Hz, 2H), 2.64 (t, J = 7.2 Hz, 2H), 6.09 (d, J = 6.0 Hz, 1H), 6.39 (d, J = 6.0 Hz, 1H), 7.27 (d, J = 7.8 Hz, 2H), 7.53 (d, J = 8.4 Hz, 4H), 7.62 (d, J = 7.6 Hz, 2H); 13C-NMR (CDCl3): δ 11.4, 13.8, 21.6, 24.5, 37.7, 114.0 (tt, J = 251.87, 26.82 Hz), 114.1 (tt, J = 251.9, 26.8 Hz), 123.1 (t, J = 9.2 Hz), 125.8 (t, J = 8.79 Hz), 126.8, 126.9, 127.4, 129.0, 131.7, 133.6 (t, J = 22.0 Hz), 137.6, 137.8 (t, J = 21.9 Hz), 141.5, 142.3; 19F-NMR (CDCl3): δ −126.57 (d, J = 4.76 Hz, 2F), −122.23 (d, J = 4.86 Hz, 2F). The above characterization data were consistent with those reported previously [15,18].
2.2.2. 5,5,6,6-Tetrafluoro-1-(4-methoxyphenyl)phenylcyclohexa-1,3-diene (2b)
Yield: 80% (0.53 g, 1.6 mmol); white solid; Tm: 130 °C; 1H-NMR (CDCl3): δ 3.86 (s, 3H), 6.03–6.12 (m, 1H), 6.37–6.46 (m, 2H), 7.00 (d, J = 8.8 Hz, 2H), 7.51–7.63 (m, 6H); 13C-NMR (CDCl3): δ 55.3, 110.0–116.0 (m, 2C of CF2CF2), 114.3, 122.9 (t, J = 25.8 Hz), 124.7 (t, J = 8.0 Hz), 126.7, 127.7, 128.1, 129.9 (t, J = 11.8 Hz), 130.9, 132.6, 136.4 (t, J = 22.0 Hz), 141.6, 159.5; 19F-NMR (CDCl3): δ −121.29 (s, 2F), −121.67 (s, 2F); IR (KBr): ν 3026, 2968, 2844, 1649, 1604, 1576, 1530, 1445, 1399, 1312, 1289, 1202, 1183, 1021, 1011, 879, 787 cm−1; HRMS (FAB) calculated for C19H14F4O [M]+: 334.0980, found: 334.0980. Crystal data for C19H14F4O (M = 334.30 g/mol): orthorhombic, space group P 21 21 21, a = 5.5586(7) Å, b = 9.2038(15) Å, c = 29.282(4) Å, α = 90°, β = 90°, γ = 90°, V = 1498.1(4) Å3, Z = 4, T = 173 K, μ(MoKα) = 0.710 mm−1, Dcalc = 1.482 g/cm3, 98,894 reflections measured (3.042° ≤ 2θ ≤ 27.480°), 7212 unique (Rint = 0.0476, Rsigma = 0.0950), which were used in all calculations. The final R1 was 0.0631 (I > 2σ(I)) and wR2 was 0.1269 (all data).
2.2.3. 5,5,6,6-Tetrafluoro-1-{4-(trifluoromethyl)phenyl}phenylcyclohexa-1,3-diene (2c)
Yield: 70% (0.15 g, 1.4 mmol); white solid; Tm: 138 °C; 1H-NMR (CDCl3): δ 6.06–6.18 (m, 1H), 6.40–6.54 (m, 2H), 7.60 (d, J = 8.8 Hz, 2H), 7.64 (d, J = 8.8 Hz, 2H), 7.72 (s, 4H); 13C-NMR (CDCl3): δ 112.7 (tt, J = 249.4, 27.2 Hz), 113.4 (tt, J = 253.0, 26.5 Hz), 124.2 (q, J = 272.1 Hz), 123.4 (t, J = 25.6 Hz), 125.5 (t, J = 8.0 Hz), 125.8 (q, J = 3.6 Hz), 127.3, 127.4, 127.9, 129.7 (q, J = 32.3 Hz), 129.8 (t, J = 11.8 Hz), 132.6, 136.1 (t, J = 22.7 Hz), 140.4, 143.6; 19F-NMR (CDCl3): δ −62.43 (s, 3F), −121.31 (s, 2F), −121.72 (s, 2F); IR (KBr): ν 3088, 2362, 1919, 1690, 1616, 1502, 1425, 1274, 1210, 968, 875, 794, 739, 729 cm−1; HRMS (FAB) calculated for C19H11F7 [M]+: 372.0749, found: 372.0759.
2.2.4. 4-Ethyl-5,5,6,6-tetrafluoro-1-[4-{4-(n-octyloxy)phenyl}phenyl]cyclohexa-1,3-diene (2d)
Yield: 83% (0.32 g, 0.69 mmol); pale-yellow solid; Tm: 71 °C; 1H-NMR (CDCl3): δ 0.90 (t, J = 6.8 Hz, 3H), 1.19 (t, J = 7.2 Hz, 3H), 1.26–1.42 (m, 8H), 1.48 (quin, J = 8.0 Hz, 2H), 1.81 (quin, J = 7.2 Hz, 2H), 2.40 (q, J = 7.2 Hz, 2H), 4.00 (t, J = 6.8 Hz, 2H), 6.09 (d, J = 6.0 Hz, 1H), 6.38 (d, J = 6.0 Hz, 1H), 6.98 (d, J = 8.8 Hz, 2H), 7.48–7.62 (m, 6H); 13C-NMR (CDCl3):δ 11.5, 14.1, 21.7, 22.7, 26.1, 29.26, 29.31, 29.4, 31.8, 68.1, 110–125 (m, 2C of CF2CF2), 114.9, 123.1 (t, J = 8.8 Hz), 125.6 (t, J = 8.8 Hz), 126.7, 127.5, 128.0, 131.3, 132.6, 133.7 (t, J = 23.1 Hz), 137.8 (t, J = 21.2 Hz), 141.3, 159.1; 19F-NMR (CDCl3): δ –123.55 (s, 2F), –127.90 (s, 2F); IR (KBr): ν 3038, 2926, 2852, 1885, 1654, 1606, 1579, 1529, 1500, 1253, 1132, 907, 864 cm−1; HRMS (FAB) calculated for C28H32F4O [M]+: 460.2389, found: 460.2382.
2.3. Single-Crystal X-ray Diffraction (XRD)
Single-crystal XRD patterns were recorded on an XtaLAB AFC11 diffractometer (Rigaku, Tokyo, Japan). The reflection data were integrated, scaled, and averaged using CrysAlisPro software (v. 1.171.39.43a; Rigaku Corporation, Akishima, Japan), and empirical absorption corrections were applied using the SCALE 3 ABSPACK scaling algorithm (CrysAlisPro). Structures were identified using a direct method (SHELXT-2018/2 [20]), refined using a full-matrix least-squares method (SHELXL-2018/3 [21]), and visualized using OLEX2 [22]. The crystallographic data were deposited in the Cambridge Crystallographic Data Center (CCDC) database (CCDC 2269760 for 2b) and can be obtained free of charge from the CCDC, 12 Union Road, Cambridge CB2 1EZ, UK; Fax: +44-1223-336033; e-mail: deposit@ccdc.cam.ac.uk.
2.4. Photophysical Properties
JASCO V-750 absorption (JASCO, Tokyo, Japan) and FP-6600 fluorescence (JASCO, Tokyo, Japan) spectrometers were used to acquire solution-phase ultraviolet/visible (UV/vis) absorption and PL spectra. A Quantaurus-QY C11347-01 instrument (Hamamatsu Photonics, Hamamatsu, Japan) was used for PL quantum yield measurements, and a Quantaurus-Tau fluorescence lifetime spectrometer (C11367-34; Hamamatsu Photonics, Japan) was employed for PL lifetime determination.
2.5. LC Properties
Polarizing optical microscopy (POM) measurements were carried out using an Olympus BX53 microscope (Tokyo, Japan) equipped with cooling and heating stages (10,002 L, Linkam Scientific Instruments, Surrey, UK) to assess LC properties. Thermodynamic properties were assessed using differential scanning calorimetry (DSC; DSC-60 Plus, Shimadzu, Kyoto, Japan) at heating and cooling rates of 5.0 °C·min−1 under N2. Variable-temperature powder X-ray diffraction (VT-PXRD) analyses were carried out using an X-ray diffractometer (Rigaku, MiniFlex600, Tokyo, Japan) equipped with an X-ray tube (Cu Kα, λ = 1.54 Å) and semiconductor detector (D/teX Ultra2). The sample powder was mounted on a nonreflecting silicon plate set on a benchtop stage (Anton Paar, BTS-500). The temperature, heating/cooling rate, and X-ray exposure time were controlled.
2.6. Theoretical Calculations
All computations were performed using the Gaussian 16 program set [23] with density functional theory (DFT) at the level of the M06-2X hybrid functional [24] and the 6-31+G(d) (for all atoms) basis set with a conductor-like polarizable continuum model (CPCM) [25] for CHCl3. Theoretical vertical transitions were calculated using the time-dependent DFT (TD-DFT) method at the same theoretical level using the same solvation model.
3. Results and Discussion
3.1. Synthesis
Compounds 2a and 2d, featuring an ethyl group attached to the longitudinal molecular terminal, were synthesized from the readily available dimethyl 2,2,3,3-tetrafluorosuccinate according to a reported procedure (Scheme 1a) [18]. The reaction of dimethyl tetrafluorosuccinate with 4-(4-n-propylphenyl)phenylmagnesium bromide in THF at −78 °C overnight followed by hydrolysis under acidic conditions afforded ketoester 3a in 64% yield. Compound 3a was treated with 3.6 equivalents of vinylmagnesium chloride in Et2O, and the reaction mixture was stirred overnight at reflux to afford 4,4,5,5-tetrafluoroocta-1,7-diene (4a) in 37% yield. In the presence of a second-generation Grubbs catalyst, the ring-closing metathesis of 4a in CH2Cl2 (40 °C, 24 h) furnished 1-aryl-4-ethyl-5,5,6,6-tetrafluorocyclohex-2-ene-1,4-diol (5a) in 49% yield. The 24 h exposure of 5a in methanol to H2 at room temperature resulted in catalytic hydrogenation and furnished 1-aryl-4-ethyl 2,2,3,3-tetrafluorocyclohexan-1,4-diol (6a) in 70% yield. Subsequent dehydration with phosphoryl chloride in pyridine at 90 °C for 24 h produced 2a in 90% yield. The octyloxy chain-bearing structural analog 2d was prepared by a similar procedure starting with the addition of 4-(4-octyloxyphenyl)phenylmagnesium bromide.
Compound 2b, featuring an electron-donating methoxy group, and 2c, featuring an electron-withdrawing trifluoromethyl (CF3) group at the longitudinal molecular end, were synthesized according to a previously reported procedure (Scheme 1b) [15]. The Barbier-type nucleophilic addition of 1,1,2,2-tetrafluorobut-3-enyllithium (prepared in situ from 4-bromo-3,3,4-4-tetrafluorobut-1-ene and LiBr-free MeLi) to p-anisaldehyde in tetrahydrofuran (THF) at −78 °C for 2 h gave tetrafluorohomoallyl alcohol 7b in 70% yield. The oxidation of 7b with Oxone® in the presence of sodium 2-iodobenzenesulfonate (pre-IBS; 5 mol%) in acetonitrile at 90 °C for 16 h afforded 1-aryl-2,2,3,3-tetrafluoropent-4-en-1-one (8b) in 77% yield. Compound 8b was treated with allylmagnesium bromide in THF at −78 °C for 2 h to produce 4-aryl-5,5,6,6-tetrafluoroocta-1,7-diene-4-ol (9b) in 58% yield. Compound 9b underwent ring-closing metathesis upon treatment with a second-generation Grubbs catalyst (3 mol.%) to furnish 4-aryl-5,5,6,6-cyclohex-1-en-4-ol (10b) in 73% yield. The dehydration of 10b with phosphoryl chloride in pyridine at 90 °C for 24 h produced the target methoxy-substituted species (2b) in 80% yield. The CF3-substituted 2c was synthesized using the same reaction sequence.
Compounds 2a–d were purified by column chromatography (eluent: hexane/EtOAc = 3/1 for 2a or 10/1 for 2b–d) and recrystallization from a 1:1 (v/v) mixture of CH2Cl2 and hexane. The molecular structures of the target molecules were confirmed by NMR spectroscopy, IR spectroscopy, and HRMS, and the related purities were sufficient for photophysical and LC property analyses.
Among 2a–d, only the methoxy-substituted 2b furnished single crystals appropriate for X-ray crystallographic analysis upon recrystallization, whereas 2a, 2c, and 2d did not furnish single crystals even after multiple recrystallizations. Figure 3 shows the crystal structure of 2b obtained by X-ray structure analysis.
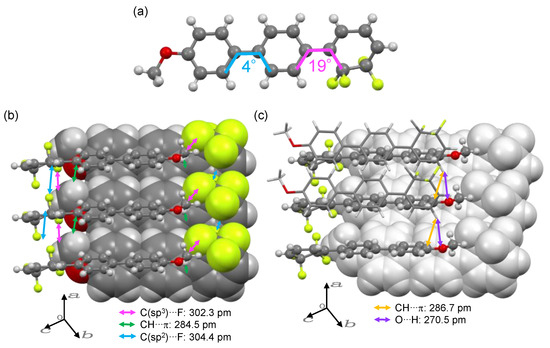
Figure 3.
(a) Molecular structure and (b,c) packing of 2b in the crystalline lattice. Display notation: space-filling model for rearmost molecules, ball-and-stick model for middle molecules, and wire-frame model for frontmost molecules.
Compound 2b crystallized in an orthorhombic system (P 21 21 21 space group) and featured a unit cell with four molecules. The dihedral angle between the two aromatic rings of the biphenyl moiety was approximately 4°, and that between the tetrafluorocyclohexa-1,3-diene ring and the biphenyl moiety was approximately 19° (Figure 3a). In 1b, which has a central tetrafluorocyclohexa-1,3-diene ring, the dihedral angle between the cyclohexa-1,3-diene ring and the adjacent aromatic ring was at least 31° [19]. On the basis of the molecular structures of 1b and 2b, we concluded that the change in the position of the tetrafluorocyclohexa-1,3-diene ring from central to terminal favored a more planar structure. The space-filling model representation in Figure 3b suggests that the π/F interactions [26,27] between the π-electrons and F atoms of tetrafluorocyclohexa-1,3-diene resulted in the formation of a stacked structure along the a-axis. The C(sp2)···F interatomic distance corresponding to the π/F interaction (304.4 pm) was shorter than the sum of van der Waals radii (317 pm) of carbon (170 pm) and fluorine (147 pm) atoms [10]. The molecule represented by the space-filling model formed molecular packings featuring two pairs of CH/π interactions [28] with the molecule represented by the ball-and-stick model along the b-axis direction. The C(sp2)···H interatomic distance corresponding to the CH/π interaction worked (284.5 pm) was also shorter than the sum of the van der Waals radii (290 pm) of carbon (170 pm) and hydrogen (120 pm). In addition to the short distance between the C(sp2) and H atoms, the carbon atom of the methoxy group was in close contact with the fluorine atom at a distance (302.3 pm) shorter than the sum of carbon (170 pm) and fluorine (147 pm) van der Waals radii. The molecule represented by the ball-and-stick model also formed a stacked structure with the molecule represented by the wire-frame model along the a-axis via CH/π interactions (short contact: 286.7 pm) and O/H hydrogen bonds (short contact: 270.5 pm) (Figure 3c). Accordingly, herringbone-type packing structures were formed through multiple intermolecular interactions. However, unlike the packing structure of 1b [19], which features a central cyclohexa-1,3-diene ring, the packing structure of 2b did not feature intermolecular π/π stacking.
3.2. Photophysical Properties
Figure 4 shows the UV/vis absorption spectra, PL spectra, and PL color chromaticity diagrams (as defined by the Commission Internationale de l’Eclailage (CIE)) of 2a–d, and Table 1 lists the related photophysical data.
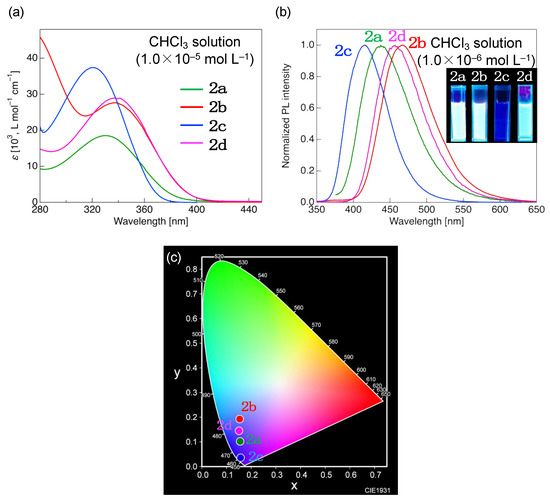
Figure 4.
(a) Ultraviolet/visible absorption spectra (concentration: 1.0 × 10⁻⁵ mol·L−1) and (b) photoluminescence (PL) spectra (concentration: 1.0 × 10⁻⁶ mol·L−1) of 2a–d measured in chloroform (CHCl3). Inset: photographs of PL in CHCl3 solution under UV irradiation (λex = 365 nm). (c) Commission Internationale de l’Eclailage (CIE) chromaticity diagram for PL colors of 2a–d.

Table 1.
Photophysical data of 2a–d in CHCl3 solution.
Compound 2a, possessing ethyl and n-propyl substituents at longitudinal molecular terminals, exhibited a single absorption band with a maximum absorption wavelength (λabs) of ~330 nm in CHCl3. Compound 2b, featuring a strongly electron-donating methoxy group, exhibited a red-shifted λabs of 337 nm, whereas 2c, featuring a strongly electron-withdrawing CF3 group, exhibited a blue-shifted λabs of 320 nm. In CHCl3, the λabs of 2d with ethyl and n-octyloxy groups as longitudinal terminal substituents was 337 nm, i.e., equal to that of 2b.
The theoretical vertical transition was modeled using Gaussian software [23] with time-dependent density functional theory (TD-DFT). Figure 5 shows the distributions of the highest occupied molecular orbitals (HOMOs) and lowest unoccupied molecular orbitals (LUMOs) for 2a–d, with the related theoretical data summarized in Table 2. The detailed orbital distributions are shown in Figures S44–47 in Supplementary Materials.
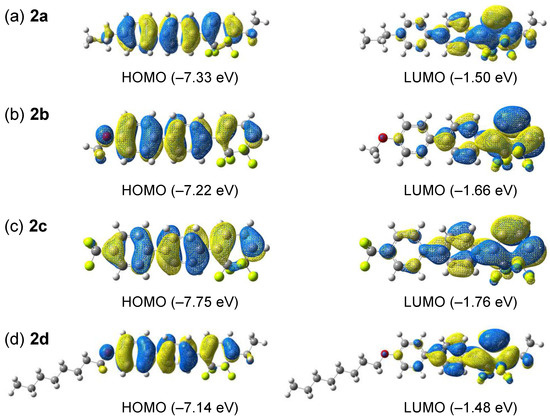
Figure 5.
Highest occupied molecular orbital (HOMO, left) and lowest unoccupied molecular orbital (LUMO, right) distributions of (a) 2a, (b) 2b, (c) 2c, and (d) 2d.
Table 2.
Theoretical data of 2a–d obtained using Gaussian software with time-dependent density functional theory 1.
According to Figure 5, the HOMOs of 2a–d were spread throughout the π-conjugated structure, whereas the LUMOs were localized on the tetrafluorocyclohexa-1,3-diene ring of the tricyclic π-conjugated framework. Substituents at longitudinal molecular ends affected the HOMO and LUMO energies, e.g., electron-donating substituents such as alkoxy groups increased the HOMO energy, whereas electron-withdrawing substituents had the opposite effect. The alkoxy group at the opposite end did not affect the energy of the LUMO, as this orbital was localized on the tetrafluorocyclohexa-1,3-diene ring, whereas the electron-donating ethyl group introduced into the tetrafluorocyclohexa-1,3-diene skeleton increased the LUMO energies of 2a and 2d. The absorption wavelengths (λcalcd) of 2a–d determined by TD-DFT calculations (331 nm for 2a, 338 nm for 2b, 325 nm for 2c, and 335 nm for 2d) were close to the measured λabs values listed in Table 1. The transitions from the ground to the first excited states were calculated to be of π–π* HOMO→LUMO and HOMO–1/HOMO–2→LUMO types.
When a solution of 2a in CHCl3 was excited by irradiation with UV light at λabs (330 nm), a single PL band with a maximum PL wavelength (λPL) of approximately 437 nm was observed (Figure 4b). Compared to that of 2a, the PL band of 2b with an electron-donating methoxy group (λPL = 463 nm in CHCl3) was red-shifted by 26 nm, whereas the PL band of 2c with an electron-withdrawing CF3 group (λPL = 416 nm) was substantially blue-shifted. Similar to the methoxy-substituted 2b, the n-octyloxy-substituted 2d exhibited PL (λPL = 463 nm). In the case of 2c with a large HOMO–LUMO overlap, radiative deactivation probably occurred from the locally excited state, whereas 2b or 2d with a locally existing LUMO luminesced through the radiative deactivation of the intramolecular charge transfer (ICT) excited state, which can be reasonably explained by the Lippert–Mataga plot [29,30] shown in Figure S49.
The high-energy PL of 2c corresponded to dark-blue color represented by CIE chromaticity coordinates of (x, y) = (0.157, 0.036) (Figure 4c). In contrast, the low-energy PL of 2b and 2d emitted from ICT states corresponded to light-blue color with CIE coordinates of (x, y) = (0.153, 0.189). The quantum yields (ΦPL) and PL lifetimes (τ) of 2a–d were determined as 0.24–0.94 and ~2.11 ns, respectively. This value of τ indicates that the light emitted by 2a–d was fluorescent. Among the four compounds, 2c exhibited the lowest ΦPL (0.24) and a very short τ (<1.0 ns). The radiative (kr) and nonradiative (knr) deactivation rate constants of 2c were calculated from ΦPL and τ as 3.30 × 10⁸ s−1 and 10.44 × 10⁸ s−1, respectively. Notably, kr was not significantly different between 2a and d, whereas the knr of 2c was 5–37 times higher than those of other derivatives. These results suggested the occurrence of fluorescence reabsorption (self-absorption) in 2c, which resulted in decreased ΦPL and increased knr.
Most molecules exhibiting luminescence in solution generally experience luminescence quenching through intermolecular energy transfer at high concentrations or in the solid state. However, 2a–d exhibited strong luminescence even in the crystalline state. Figure 6 shows the PL spectra of crystalline 2a–d, the related CIE chromaticity diagram, and photographs of crystals under 365 nm UV light. The corresponding photophysical data are summarized in Table 3.
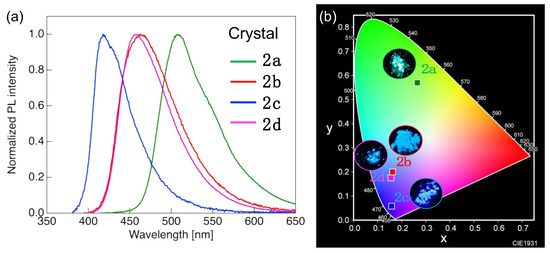
Figure 6.
(a) PL spectra of crystalline 2a–d. (b) CIE chromaticity diagram and photographs of 2a–d crystals under 365 nm ultraviolet light.
Table 3.
Photophysical data of crystalline 2a–d.
Crystalline 2a with two alkyl groups at longitudinal molecular ends exhibited green PL with a single PL band at λPL around 509 nm, which was red-shifted relative to the value in CHCl3 solution by 72 nm. However, the PL behavior of 2b–d did not substantially change upon the transition from the CHCl3 solution to the crystalline state. In the crystalline state, 2b crystallized mainly via CH/π, π/F, and hydrogen bonds; π/π stacking between the intermolecular aromatic rings was not observed. The similarity between the λPL and ΦPL values observed in the crystalline state and CHCl3 solution was ascribed to the absence of π/π stacking interactions in crystalline 2b, which suppressed the nonradiative deactivation induced by the formation of molecular aggregates. Given that crystalline 2c and 2d also exhibited PL behavior similar to that in the CHCl3 solution state, we concluded that their conjugated structures were also not involved in intermolecular interactions, although their crystal structures have not yet been elucidated. On the other hand, we inferred that crystalline 2a, which featured a PL wavelength and PL color different from those observed in the solution state, interacted with the π-conjugated site through the formation of molecular aggregates, unlike in the dilute solution, although the crystal structure of 2a also remained veiled. PL lifetime measurements showed that the τ of crystalline 2a–d was 1.84–3.19 ns and, therefore, also indicative of fluorescence. The PL decays of 2a, 2c, and 2d were well modeled by a mono-exponential function, and the related PL originated from a single excited state. In contrast, the PL decay of 2b was fitted by a biexponential function assuming a radiative deactivation pathway from any two excited states, although the related excited-state details remain unknown.
Compared with the previously reported 1b and 1c with a central tetrafluorocyclohexa-1,3-diene ring [19], 2b and 2c featured a shorter (by 20–25 nm) λabs in CHCl3, which was ascribed to the significantly increased LUMO level of the latter molecules. However, λPL was found to be almost the same, except for 2c, which had a CF3 group at the molecular terminal. In the crystalline state, the λPL of 2c was blue-shifted relative to that of 1c, although almost identical λPL values were observed for 2b and 1b. The CHCl3 solution-phase ΦPL values of 2b and 2c exceeded those of 1b and 1c. In contrast, the opposite trend was observed in the crystalline state, i.e., the ΦPL values of 2b and 2c were lower than those of 1b and 1c. In 2b and 2c, which greatly differ from 1b and 1c [19], the biphenyl moiety was planar and formed a herringbone structure because of CH/π interactions. We concluded that weak intermolecular interactions did not lead to molecular motion suppression, resulting in decreased ΦPL. Accordingly, the positional change of the tetrafluorocyclohexa-1,3-diene ring in the tricyclic scaffold had a relatively large effect on the crystalline-state behavior, and the position of this ring affected intermolecular interactions and, hence, the extent of molecular motion inhibition and ΦPL.
3.3. LC Properties
The previously reported 1a–c exhibited transitions only between their Cry and Iso phases upon heating and cooling, i.e., no LC phases were observed [15]. To understand how the position of the tetrafluorocyclohexa-1,3-diene ring in tricyclic molecules affects their LC properties, we used POM and DSC to examine the LC behavior of 2a–d, which showed PL in both dilute solution and crystalline states (Figures S53–S56 in Supplementary Materials). Compounds 2b and 2c exhibited only a Cry→Iso phase transition but did not form any mesophase upon heating and cooling. In contrast, for 2a and 2d, a fluid bright-field POM image was observed between the Cry and Iso phases, indicating the formation of an LC phase upon cooling (2a) or heating/cooling (2d). Figure 7 shows the DSC curves of 2a and 2d and the POM images of the corresponding mesophases. Table 4 lists the phase transition behaviors of 2a–d, namely, their phase sequences, as well as phase transition temperatures and enthalpies in the second heating and cooling processes.
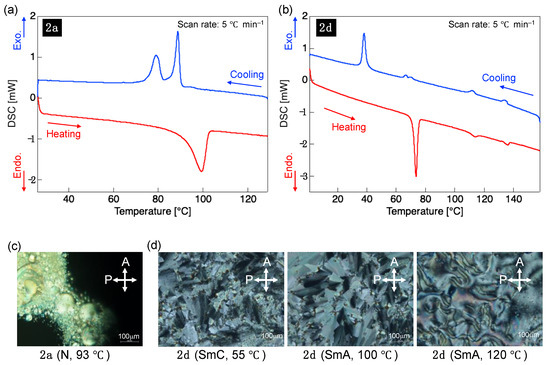
Figure 7.
Differential scanning calorimetry (DSC) curves of (a) 2a and (b) 2d recorded during the second heating and cooling processes at a scan rate of 5 °C·min−1 under N2. Polarizing optical microscopy textures in the mesophases of (c) 2a and (d) 2d.
Table 4.
Phase transition data of 2a–d during the second heating and cooling processes.
In the case of the 2a mesophase, POM revealed that a fluid four-brush Schlieren texture formed at 90 °C after the slow cooling from the dark-field-image Iso phase. Given that POM indicated the formation of a nematic (N) phase with only orientational order, the mesophase appearing during the cooling of 2a was classified as the N phase. Further cooling from the N-phase state of 2a resulted in fluidity loss at 81 °C and a phase transition to the hard Cry phase. In the case of the 2d mesophase, the nonfluidic bright-field POM image corresponding to the Cry phase changed to a fluidic fan-shaped POM image at 71 °C upon heating. Further heating induced an optical texture change to a Schlieren-patterned N phase at 110 °C followed by a phase transition to the Iso phase in the dark-field POM image at 133 °C. Upon cooling, the N-phase Schlieren texture appeared at 136 °C, and a transition to a phase with a fan-shaped texture occurred at 114 °C. Upon further cooling, a broken fan-shaped texture was observed at 68 °C, followed by a phase transition to the nonfluidic Cry phase at 40 °C. The fan-shaped optical texture observed in the mesophase of 2d is characteristic of the smectic (Sm) phase, which has an orientational and positional order. Notably, in the case of 2d, the Sm phase appeared at a lower temperature than the N phase.
Further insights into the LC phases exhibited by 2a and 2d were provided by VT-PXRD measurements. The pattern of 2a recorded after cooling from the Iso phase and holding at 70 °C featured no Cry phase peaks but contained a halo peak centered around 2θ = 18° (Figure S57). This result strongly suggests that the mesophase appearing in 2a is the N phase without positional order. PXRD measurements were also performed for 2d at 124, 89, and 49 °C after cooling from the Iso phase. A halo peak centered around 18° was also observed in the pattern recorded at 124 °C, and the mesophase appearing at this temperature was determined to be the N phase (Figure S57). The PXRD pattern recorded at 89 °C featured a sharp peak at 3.75° and a weak peak at 7.45° (Figure 8a).
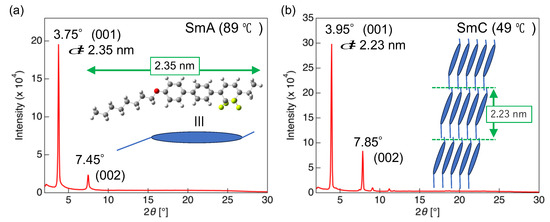
Figure 8.
Powder X-ray diffraction patterns of 2d recorded at (a) 89 and (b) 49 °C.
These diffraction peaks corresponded to the plane indices of (hkl) = (001) and (002). The peak at 3.75° in the low-angle region corresponded to a d-spacing of 2.35 nm, according to Bragg’s equation, which was consistent with the longitudinal molecular length of 2d (Figure 8a) This consistency of the interlayer distance with the molecular length agreed with the formation of a smectic A (SmA) phase with a layered periodic structure wherein the long molecular axis was oriented in the direction of the layer normal. In the pattern recorded at 49 °C, the peak of the (001) plane appeared at 3.95° and corresponded to a d-spacing of 2.23 nm, which was shorter than the molecular length along the long molecular axis (2.35 nm) (Figure 8b). This result indicated the presence of a smectic C (SmC) phase featuring a tilt angle with respect to the layer normal (Figure 8b).
3.4. PL Properties of 2d in Various Molecular Aggregation States
Compound 2d, which forms various mesophases, was selected to investigate PL behavior changes associated with the phase transition-induced alterations in molecular aggregate structure. PL behavior was examined using a fluorescence spectrometer equipped with a self-made temperature control unit. The samples were cooled from the Iso phase and held for 5 min at each temperature during cooling. Figure 9 shows the thus obtained PL spectra and CIE chromaticity diagrams, and Table 5 summarizes the related photophysical data.
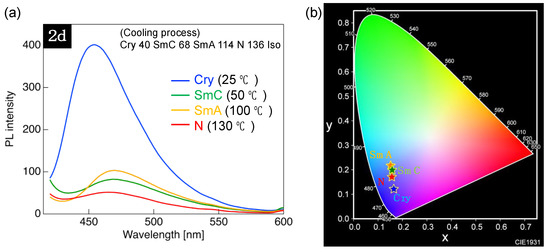
Figure 9.
(a) PL spectra of 2d recorded at different temperatures upon cooling. (b) CIE chromaticity diagram for PL color of 2d at different temperatures.
Table 5.
Photophysical data of 2d in various phases.
In the case of 2d, a PL band with λPL ≈ 466 nm appeared in the N phase; however, the related PL intensity (IN) decreased because of the accelerated nonradiative deactivation by micro-Brownian motion upon heating. The N→SmA phase transition observed upon cooling induced a 2.0-fold PL intensity increase (I/IN = 2.0) along with a slight red shift in λPL. No significant change was observed in λPL or PL intensity upon the transition to the SmC phase, whereas the transition to the Cry phase induced a blue shift of λPL by 12 nm and a 7.8-fold increase in PL intensity relative to the N phase (I/IN = 7.8). The CIE chromaticity diagram shown in Figure 9b demonstrates that the PL color of 2d changed from dark blue to light blue owing to the phase transition-induced alteration of the molecular aggregate structure.
4. Conclusions
Tricyclic π-conjugated molecules with terminal tetrafluorocyclohexa-1,3-diene rings and different substituents introduced at the longitudinal molecular ends (2a–d) were synthesized in five steps from dimethyl 2,2,3,3-tetrafluorosuccinate or 4-bromo-3,3,4,4-tetrafluorobut-1-ene and evaluated in terms of their photophysical and LC behaviors. All four molecules exhibited PL in both dilute solutions and crystalline states. In dilute solutions, the PL wavelength varied in the range of 416–463 nm, which reflected the effect of substituent electron-donating/withdrawing nature on molecular orbital energy. ΦPL was maximal (0.94) for 2a and minimal (0.24) for 2c, which had the shortest λPL. The low ΦPL observed in the latter case was ascribed to self-absorption caused by the overlap of absorption and PL spectra. In the crystalline state, the PL behaviors of 2b–d were similar to those in dilute solution, whereas 2a, which had two alkyl groups at both ends, exhibited green PL with substantially red-shifted λPL. Regarding phase transition behavior, a mesophase was observed for 2a and 2d with an ethyl group at one molecular end. Only the N phase with an orientational order appeared in the case of 2a, whereas the Sm phase with both orientational and positional orders, as well as the N phase, appeared in the case of 2d. The N phase observed for 2d exhibited weak blue PL during cooling. The PL intensity increased upon the N→SmA phase transition during cooling, did not substantially change upon the SmA→SmC phase transition, and strongly increased upon the SmC→Cry phase transition on further cooling. Concomitantly, the PL color changed from dark blue to light blue, i.e., temperature-responsive PL behavior was observed. The results described herein expand the applicability of CF2CF2-containing tricyclic molecules as next-generation PL, LC, and PL-LC materials.
Supplementary Materials
The following supporting information can be downloaded from https://www.mdpi.com/article/10.3390/cryst13081208/s1: Scheme S1. Synthetic procedure of 2a and 2d starting from commercially available dimethyl 2,2,3,3-tetrafluorosuccinate. Scheme S2. Synthetic procedure of 2b and 2c starting from commercially available 4-bromo-3,3,4,4-tetrafluorobut-1-ene. Figures S1–S42. 1H-, 13C-, and 19F-NMR spectra; Figure S43. ORTEP-type crystal structure of 2b; Figures S44–S47. HOMO-1/HOMO-2, HOMO, and LUMO distributions and differential density between HOMO and LUMO; Figure S48. UV/vis absorption and PL spectra of 2a–d in CHCl3 solution; Figure S49. PL spectra of 2a–c in different solvents and related Lippert–Mataga plots; Figure S50. PL decay profiles of 2a–d in CHCl3 solution; Figure S51. Excitation and PL spectra of 2a–d in crystalline states; Figure S52. PL decay profiles of 2a–d in crystalline states; Figures S53–S56. DSC thermograms and POM images for 2a–d; Figure S57. VT-PXRD patterns of 2a and 2d recorded at different temperatures; Table S1. Crystallographic data for 2b; Tables S2–S5. Cartesian coordinates for 2a–d; Tables S6–S9. Phase transition behaviors of 2a–d observed by DSC.
Author Contributions
Conceptualization, H.O., S.Y., and T.K.; methodology, H.O., S.Y., and T.K.; validation, H.O., S.Y., and T.K.; formal analysis, H.O., S.Y., and T.K.; investigation, H.O., S.Y., and T.K.; resources, S.Y. and T.K.; data curation, H.O., S.Y., and T.K.; writing—original draft preparation, H.O., S.Y., and T.K.; writing—review and editing, H.O., S.Y., M.Y., and T.K.; Visualization, H.O., S.Y., and T.K.; supervision, T.K.; project administration, T.K.; funding acquisition, S.Y. and T.K. All authors have read and agreed to the published version of the manuscript.
Funding
This research received no external funding.
Data Availability Statement
Data supporting the presented findings are contained within the article and Supplementary Materials.
Acknowledgments
The authors express their sincere gratitude to Tosoh Finechem Corporation for providing 4-bromo-3,3,4,4-tetrafluorobut-1-ene and to Profs. Sakurai and Shimizu (Kyoto Institute of Technology) for help with VT-PXRD measurements. The authors acknowledge the use of equipment shared in the MEXT project to promote public utilization of advanced research infrastructure (program for supporting the introduction of the new sharing system), grant number JPMXS0421800222.
Conflicts of Interest
The authors declare no conflict of interest.
References
- Inoue, M.; Sumii, Y.; Shibata, N. Contribution of organofluorine compounds to pharmaceuticals. ACS Omega 2020, 5, 10633–10640. [Google Scholar] [CrossRef] [PubMed]
- Purser, S.; Moore, P.R.; Swallow, S.; Gouverneur, V. Fluorine in medicinal chemistry. Chem. Soc. Rev. 2008, 37, 320–330. [Google Scholar] [CrossRef] [PubMed]
- Ogawa, Y.; Tokunaga, E.; Kobayashi, O.; Hirai, K.; Shibata, N. Current contributions of organofluorine compounds to the agrochemical industry. iScience 2020, 23, 101467. [Google Scholar] [CrossRef]
- Jeschke, P. The unique role of fluorine in the design of active ingredients for modern crop protection. ChemBioChem 2004, 5, 570–589. [Google Scholar] [CrossRef]
- Zhou, X.; Kang, S.W.; Kumar, S.; Li, Q. Self-assembly of discotic liquid crystal porphyrin into more controllable ordered nanostructure mediated by fluorophobic effect. Liq. Cryst. 2009, 36, 269–274. [Google Scholar] [CrossRef]
- Wang, H.; Bisoyi, H.K.; Urbas, A.M.; Bunning, T.J.; Li, Q. Reversible circularly polarized reflection in a self-organized helical superstructure enabled by a visible-light-driven axially chiral molecular switch. J. Am. Chem. Soc. 2019, 141, 8078–8082. [Google Scholar] [CrossRef]
- Wang, H.; Bisoyi, H.K.; Li, B.X.; McConney, M.E.; Bunning, T.J.; Li, Q. Visible-light-driven halogen bond donor based molecular switches: From reversible unwinding to handedness inversion in self-organized soft helical superstructures. Angew. Chem. Int. Ed. 2020, 59, 2684–2687. [Google Scholar] [CrossRef]
- Kirsch, P. Modern Fluoroorganic Chemistry: Synthesis, Reactivity, Applications, 2nd ed.; Kirsh, P., Ed.; WILEY-VCH: Weinheim, Germany, 2013; pp. 247–298. [Google Scholar]
- Hird, M. Fluorinated liquid crystals–properties and applications. Chem. Soc. Rev. 2007, 36, 2070–2095. [Google Scholar] [CrossRef]
- O’Hagan, D. Understanding organofluorine chemistry. An introduction to the C–F bond. Chem. Soc. Rev. 2008, 37, 308–319. [Google Scholar] [CrossRef] [PubMed]
- Bondi, A. van der Waals volumes and radii. J. Phys. Chem. 1964, 68, 441–451. [Google Scholar] [CrossRef]
- Konno, T. Trifluoromethylated internal alkynes: Versatile building blocks for the preparation of various fluorine-containing molecules. Synlett 2014, 25, 1350–1370, and references cited therein. [Google Scholar] [CrossRef]
- Ohsato, H.; Kawauchi, K.; Yamada, S.; Konno, T. Diverse synthetic transformations using 4-bromo-3,3,4,4-tetrafluorobut-1-ene and its applications in the preparation of CF2CF2-containing sugars, liquid crystals, and light-emitting materials. Chem. Rec. 2023, 23, e202300080, and references cited therein. [Google Scholar] [CrossRef]
- Yamada, S.; Konno, T. Development of donor-π-acceptor-type fluorinated tolanes as compact condensed phase luminophores and applications in photoluminescent liquid-crystalline molecules. Chem. Rec. 2023, 23, e202300094, and references cited therein. [Google Scholar] [CrossRef] [PubMed]
- Yamada, S.; Hashishita, S.; Asai, T.; Ishihara, T.; Konno, T. Design, synthesis and evaluation of new fluorinated liquid crystals bearing a CF2CF2 fragment with negative dielectric anisotropy. Org. Biomol. Chem. 2017, 15, 1495–1509. [Google Scholar] [CrossRef] [PubMed]
- Yamada, S.; Hashishita, S.; Konishi, H.; Nishi, Y.; Kubota, T.; Asai, T.; Ishihara, T.; Konno, T. New entry for fluorinated carbocycles: Unprecedented 3,6-disubstituted 1,1,2,2-tetrafluorocyclohexane derivatives. J. Fluorine Chem. 2017, 200, 47–58. [Google Scholar] [CrossRef]
- Yamada, S.; Tamamoto, K.; Kida, T.; Asai, T.; Ishihara, T.; Konno, T. Rational design and synthesis of a novel laterally-tetrafluorinated tricyclic mesogen with large negative dielectric anisotropy. Org. Biomol. Chem. 2017, 15, 9442–9454. [Google Scholar] [CrossRef] [PubMed]
- Kumon, T.; Hashishita, S.; Kida, T.; Yamada, S.; Ishihara, T.; Konno, T. Gram-scale preparation of negative-type liquid crystals with a CF2CF2-carbocycle unit via an improved short-step synthetic protocol. Beilstein J. Org. Chem. 2018, 14, 148–154. [Google Scholar] [CrossRef]
- Ohsato, H.; Morita, M.; Yamada, S.; Agou, T.; Fukumoto, H.; Konno, T. Aggregation-induced enhanced fluorescence by hydrogen bonding in π-conjugated tricarbocycles with a CF2CF2-containing cyclohexa-1,3-diene skeleton. Mol. Syst. Des. Eng. 2022, 7, 1129–1137. [Google Scholar] [CrossRef]
- Sheldrick, G.M. SHELXT-integrated space-group and crystal-structure determination. Acta Crystallogr. Sect. A Found. Adv. 2015, 71, 3–8. [Google Scholar] [CrossRef]
- Sheldrick, G.M. Crystal structure refinement with SHELXL. Acta Crystallogr. Sect. C Struct. Chem. 2015, 71, 3–8. [Google Scholar] [CrossRef] [PubMed]
- Dolomanov, O.V.; Bourhis, L.J.; Gildea, R.J.; Howard, J.A.K.; Puschmann, H. OLEX2: A complete structure solution, refinement, and analysis program. J. Appl. Crystallogr. 2009, 42, 339–341. [Google Scholar] [CrossRef]
- Frisch, M.J.; Trucks, G.W.; Schlegel, H.B.; Scuseria, G.E.; Robb, M.A.; Cheeseman, J.R.; Scalmani, G.; Barone, V.; Petersson, G.A.; Nakatsuji, H.; et al. Gaussian 16, Revision B.01; Gaussian, Inc.: Wallingford, CT, USA, 2016. [Google Scholar]
- Hohenstein, E.G.; Chill, S.T.; Sherrill, C.D. Assessment of the performance of the M05-2X and M06-2X exchange-correlation functionals for noncovalent interactions in biomolecules. J. Chem. Theory Comput. 2008, 4, 1996–2000. [Google Scholar] [CrossRef] [PubMed]
- Li, H.; Jensen, J.H. Improving the efficiency and convergence of geometry optimization with the polarizable continuum model: New energy gradients and molecular surface tesselation. J. Comput. Chem. 2004, 25, 1449–1462. [Google Scholar] [CrossRef] [PubMed]
- Rybalova, T.V.; Bagryanskaya, I.Y. C–F···π, F···H, and F···F intermolecular interactions and F-aggregations: Role in crystal engineering of fluoroorganic compounds. J. Struct. Chem. 2009, 50, 741–753. [Google Scholar] [CrossRef]
- Kawahara, S.; Tsuzuki, S.; Uchimaru, T. Theoretical study of the C–F/π interaction: Attractive interaction between fluorinated alkane and an electron-deficient π-system. J. Phys. Chem. A 2004, 108, 6744–6749. [Google Scholar] [CrossRef]
- Tsuzuki, S.; Fujii, A. Nature and physical origin of CH/π interaction: Significant difference from conventional hydrogen bonds. Phys. Chem. Chem. Phys. 2008, 10, 2584–2594. [Google Scholar] [CrossRef] [PubMed]
- Mataga, N.; Kaifu, Y.; Koizumi, M. The solvent effect on the fluorescence spectrum changes of solute-solvent interactions during the lifetime of the excited solute molecule. Bull. Chem. Soc. Jpn. 1955, 28, 690–691. [Google Scholar] [CrossRef]
- Mataga, N.; Kaifu, Y.; Koizumi, M. Solvent effects on fluorescence spectra and dipole moments of excited molecules. Bull. Chem. Soc. Jpn. 1956, 29, 465–470. [Google Scholar] [CrossRef]


Disclaimer/Publisher’s Note: The statements, opinions and data contained in all publications are solely those of the individual author(s) and contributor(s) and not of MDPI and/or the editor(s). MDPI and/or the editor(s) disclaim responsibility for any injury to people or property resulting from any ideas, methods, instructions or products referred to in the content. |
© 2023 by the authors. Licensee MDPI, Basel, Switzerland. This article is an open access article distributed under the terms and conditions of the Creative Commons Attribution (CC BY) license (https://creativecommons.org/licenses/by/4.0/).