Abstract
During operation, cables of overhead power lines (OPLs) are exposed to the impact that differs in separate parts of the OPL span due to the different responses of cables near the clamps and far from them. This paper presents the results of a study of aluminum and steel wires cut from such separate parts of ACSR cables before and after exploitation. Structural, microstructural, and elastic–microplastic properties of wires and their changes during operation were studied through optical microscopy, energy-dispersive X-ray microanalysis, electron backscattering diffraction, X-ray diffraction, densitometry, and acoustic measurements. The characteristics of the properties of the wires along the span were found to change in a coordinated manner. Numerical estimates of the influence of the steel core on aging the ACSR cable were obtained. Changes in the properties of the wires, as well as oxidization and corrosion of their near-surface layers, were studied in detail. Quantitative values of the characteristics of properties, the most distant from those observed in the new wires, were revealed for samples of aluminum and steel wires cut from the cable at 1/4 span and near clamps. It is assumed that these cable parts should be the most crucial for cable durability.
1. Introduction
The electric power industry is the backbone of the infrastructure of manufacturing, transport, and life support of the population. Its most important task is to deliver electricity to the consumers, which, in most cases, is carried out using alternating current transmission overhead power lines (OPLs) [1], and this is due to economic reasons.
Ensuring the stability of the power system requires the renewal of OPL cables as their resource is depleted, leading to breaks in the cables. With the aim of carrying out this renewal in due course, it is necessary to understand the process of aging (degradation) of cables and wires in them in order to identify their characteristic properties, the control of which will make it possible to quickly predict cable breaks during operation in OPLs.
During the operation of OPLs, the parameters of the wires in the cables change and degrade, which leads to the destruction of wires with subsequent rupture. OPLs in ambient air conditions use stranded cables of twisted concentric layers of wires (also referred to as wraps). Cables in OPLs are attached on brackets with insulators to high-rise supports located at a considerable distance of up to several hundred meters from each other. In this regard, in addition to high voltage, cables are affected by atmospheric phenomena, such as wind, precipitation, significant temperature fluctuations, etc. As a result, these cables and wires in them are subjected to cyclically changing tensile strain, mechanical longitudinal and transverse oscillations and vibrations, heating due to the action of electric current, cyclic heating and cooling due to changes in atmospheric temperature, etc.
As an optimal compromise between a sufficiently high electrical conductivity and a satisfactorily low cost of the metal [2,3], OPLs cables use either high-purity or technical-purity aluminum as the material of the conductive wires, including aluminum alloys with small additions less than ~3 wt.% of other elements (the main ones are Mg and Si [4], Fe and Si [3,5,6,7], Mg and Fe [7], Mg, Si, and Fe [8,9] Mg, Si, Fe, Cu, and Zn [6], etc.). In a stranded all-aluminum cable, one or more layers (wraps) of aluminum or aluminum-alloy wires are concentrically wound around a central wire of the same metal (for short, if accentuation is not needed, we will use the term “Al wires” in both cases of either pure aluminum or its alloy).
Steel-aluminum stranded cables are similar to all-aluminum stranded cables but with a steel core instead of a central Al wire. The steel core may consist of a single steel wire or several steel wires wound concentrically around a central wire, also a steel one. Al wires in all types of cables are initially coated with a thin film of amorphous aluminum oxide, which protects them from atmospheric and galvanic corrosion. To prevent rapid galvanic corrosion, the steel wires of the core of steel-aluminum cables are protected with a thin electroplated Zn (or Zn/Zn-Fe) coating (from ~25 µm to ~70 µm thick [10,11,12]). In addition, a special grease [11] is used to prevent corrosion. When the number of layers is more than one, the internal Al and all steel wires of the core (if any) are covered with this lubricant. In the case of only one layer of outer wires, only the central Al wire or steel core is lubricated. Cables in overhead OPLs are often used without additional insulation (bare), see e.g., [5,11,13,14,15,16]. Sometimes, for better protection against atmospheric corrosion, OPLs use jacketed cables made of plastic material [17,18] or Al-1.6%Mn alloy [19].
The outer Al layer is in contact with the atmosphere on one side and with the Al wires from the inner Al layers (if any) or with the outer wires of the steel core on the other. The wires from the inner Al layers (if any) are in contact with Al wires from their own and other Al layers or with the wires of the outer layer of the steel core (or the central steel wire in the absence of layers of steel wires in the core). In turn, the outer wires of the steel core are in contact with the Al wires of the inner layer on one side and with the steel wires of the lower layer (the middle layer or the last layer, which are usually called the middle and inner layers, respectively). Subsequent layers of steel wires have contacts only with steel wires of their own and neighboring layers.
In the literature, stranded all-aluminum cables are referred to as all-aluminum alloy conductors (AAACs) [4,7,8,20,21,22,23,24,25,26,27] or, separately, all-aluminum conductors (AACs) if all of the wires in the cable are made of high-purity aluminum or aluminum conductor alloy-reinforced (ACAR) if the wires are made of technical-grade aluminum [28]. Stranded steel-aluminum cables are called aluminum conductors (or cable or clad) steel-reinforced (ACSR) [4,5,6,7,11,12,14,15,26,29,30,31,32,33,34].
Earlier, to investigate the processes occurring during the operation of cables, cables were studied not only immediately after operation in OPLs [5,11,12,14,15,24,25,26,30,34] but also after fatigue tests [6,16,20,21,22,23,27,28,29,31,32,33,35,36], which simulated “aging” of wires (changes in microstructural, structural, and other properties) under real operating conditions or after heat treatment [8,9,10]. Both AAAC [6,8,16,20,21,22,23,24,25,26,27,28,36] and ACSR [5,6,11,12,14,15,26,29,30,31,32,33,34,35] cables (or wires from these cables) were studied.
A wide range of experimental methods were used for research, such as optical microscopy (OM) [5,11,12,14,15,20,21,22,23,25,27,29,30], scanning electron microscopy (SEM) [5,11,12,14,15,20,21,22,23,27,30,32], energy-dispersive X-ray microanalysis (EDX, also energy-dispersive X-ray spectroscopy in some articles, abbreviated as EDS) [5,11,14,20,24,25,27,30], X-ray diffraction (XRD) [14,15,24,25,26,27], electron backscatter diffraction (EBSD) [24,25,26,27,34], densitometry [24,25,26,27,34], the acoustic-resonance method [24,25,26,27,34], differential scanning calorimetry (DSC) [5], the electrochemical method for measuring corrosion resistance in NaCl solution [15], Raman spectroscopy, and Fourier-transform infrared spectroscopy (FTIR) [11] and measurements of Vickers hardness and mechanical tensile-and-bending properties [11,35], as well as measurements of the electrical resistance of conductors (wires) [8,9,36].
For instance, the effect of both tensile mechanical stress [20,21,28,29] and the amplitude of displacements at bending [6,21,22,23,28,29,31,35] were investigated, as well as that of annealing temperature [8,9] and mechanical defects of Al wires during their production [7], effect of clamp material [23,31], elemental composition of Al wires [6,22], presence of a steel core [6,26], corrosion due to exposure to ambient air during operation in power lines [5,14,15,30], forest fires [10], and the environment during fatigue tests (either room atmosphere or NaCl solution) [32]. Changes in the microstructure, structure, chemical composition, and physical properties of wires from cables were also studied after their operation in OPLs for various service lives ranging from 8 to 62 years [5,11,12,14,15,24,25,26,30,34] and after fatigue testing [27,36].
In the papers [5,24,25,26], where cable wires were studied after operation in OPLs, and in most of the papers devoted to the results of fatigue tests [6,16,20,22,28,32,33,36] and to the studies of various physical properties of the wires after fatigue tests [27,35,36], the positions of the wires in the cable cross-section or along the cable length were not fixed.
Nevertheless, there are several works where the characteristics of wires in cables were determined depending on their position in the cross-section of AAAC cables [21,23] or ACSR ones [11,12,14,15,29,30,31,34] with more than one layer of Al wires. The main research methods in these works, as in most articles where the position of the wire in the wraps was not fixed [5,6,16,20,22,28,29,31,32,33], were methods of OM [11,12,14,15,21,23,29,30], SEM [11,12,14,15,23,30], XRD [14,15], and EDX [11,14,30], on the basis of which qualitative fractographic [20,21,23,29,30,31] (for broken wires), metallographic [11,12,15,31], and X-ray phase analyses of wires [14,15] were carried out and their chemical composition [11,14,30] was determined.
Based on these qualitative analyses, the fracture surfaces of broken wires were classified by type (V type, 45° cleavage, and quasi-planar type), and statistics were determined on the number of broken wires, the type of fracture surface in different layers of the cable, and the types of cracks and other surface defects that appeared; it was also determined which crystalline phases and chemical elements are present in the near-surface layers (NSLs) of the wires. It was found that the outer and inner layers of cables differ in all of these parameters. Moreover, it was shown by [11] that not only the appearance of the surface and its elemental composition but also the tensile strength and Vickers hardness of wires from different layers of the ACSR cable (two Al wraps of 13 and 19 wires of different diameters around the core of two steel wraps of 12 and 6 wires around a central steel wire, all steel wires having been galvanized with Zn-coating) that has served 61 years in a 225 kV OPL in northern France changed compared to the new cable. At the same time, the deterioration of the mechanical properties (reduction in the tensile strength) of the wires of the outer layer (wrap) of Al wires, which was in contact with the surrounding atmosphere, and the outer wrap of the steel wires of the core, which was in contact with the inner Al layer of wires, was found to be noticeably stronger, in contrast to the hardness, which decreases approximately equally in all wire wraps. Likewise, a greater decrease in the tensile strength of the wires of the outer Al wrap than that in the inner one, compared with the new cable, was noted when studying the ACSR cable (two Al wraps, 16 wires in the outer wrap and 10 wires in the inner one around a core of 6 steel wires wound around central steel wire (all steel wires with thin Zn plating)) that served in 110 kV OPL in Tongling (Anhui province of China) for 26 years [12]. At the same time, unlike the results reported by [11], the tensile strength of the steel wires of the core remained practically unchanged compared to the new cable, and only degradation of the electroplated Zn coating of the steel wires was observed.
In one of our previous works [34], using densitometry and acoustic measurements, quantitative results were obtained for the ACSR cable of AC120/19 modification (two layers of aluminum wires and a steel core of six steel wires twisted around a central steel wire; the area of the aluminum part is 117.62 mm2 and that of the steel part is 18.81 mm2) after 33 years of operation in OPL at high voltage of 110 kV in the Volgograd region of Russia. A decrease in the integral density, accompanied by a decrease in Young’s modulus for aluminum wires from the outer aluminum layer of the cable and for steel wires of the core layer in contact with the adjacent inner aluminum layer of the cable, has been proven.
In our other previous works using XRD, EBSD, densitometry, acoustic measurements [24,25,26], and surface-resistance measurements [25], we investigated individual Al wires from the outer layer of AAAC cables of the A50 type with a service life of up to 62 years [24,25,26] and ACSR type AC50/8 with a service life of up to 20 years [26] after operation in OPLs in the Volgograd region of Russia at 0.4 kV and 10 kV, respectively (service life is counted from 2021). According to the International Technical Standard GOST 839 [37], grade A50 AAAC cable consists of one wrap of six Al wires around a central Al wire, and the cable cross-sectional area is 49.5 mm2 ≈ 50 mm2. The ACSR AC50/8 cable also contains one strand of six Al wires around a central Zn-plated steel wire with cross-sectional areas of aluminum and steel parts of, respectively, 48.4 mm2 ≈ 50 mm2 and 8.04 mm2 ≈ 8 mm2 (hereinafter, for short, this brand of ACSR cable is designated as AC50). Cables of both brands, A50 and AC50, are non-insulated.
It was shown [24] for Al wires from AAAC cables that their elastic–microplastic characteristics, as well as structural and microstructural parameters of the wire bulk and the NSL (averaged over the thickness of ≈36 μm equal to the penetration depth of the X-rays used), show the maximum values of changes in absolute values, respectively, after 10 and 18 years of service in OPLs. A noticeable decrease in Young’s modulus E is detected, accompanied by a significant increase in amplitude-independent decrement δi, a decrease in microplastic flow stress σs, and a noticeable decrease in the integral mass density ρ obtained in densitometric measurements. Besides the change in characteristics of the entire wire, XRD gives evidence of the NSL Al-lattice expansion resulting in a decrease in the mass density ρX calculated from XRD data. The ρX value is systematically ~0.1% higher than the integral density ρ, i.e., the NSL is denser than the bulk of the wires. During the increase in the service life duration from 10–18 to 62 years, a relaxation of the elastic, microplastic, structural, and microstructural characteristics of wires to the values close to the service life of 0–10 years is observed. According to XRD, the relaxation is associated with an increase in the crystallographic preferential orientation of the crystallites in NSL, accompanied by a noticeable increase in their sizes, appearance of microstrain in the crystallites, and the formation of δ- and/or δ*-alumina. According to EBSD, a tendency to grain boundary alignment in the bulk of the wires is developed with an increase in the service life duration.
In [25], using XRD data, the profiles of distributions of the structural and microstructural parameters of the Al material in NSL of Al wires from the same AAAC cables of up to a service life of 62 years as in [24] were built. The distributions of the parameters follow a law close to the exponential decay law, depending on the depth from the surface, stabilizing at the parameter value observed in the bulk. The thickness of the defect NSL with reduced mass density, determined from the XRD mass density ρX distribution profile, is ~56 μm in the new wire and increases to ~140 μm in a wire after 62 years of service. During the service life from 0 to 18 years, the thickness of the defect NSL increases practically linearly, at a rate of ~4 μm/year. The XRD mass density ρX is lower and the parameter of the Al cubic unit cell of the NSL is larger closer to the wire surface. Also, according to distribution profile estimations for all wires, the crystallite sizes D increase from ~90 nm at a depth of ~40 μm to ~110–200 nm (depending on the wire service life) near the surface, accompanied by a decrease in microstrains εs from 0.01–0.03% at the depth of ~40 μm and deeper to 0 near the surface.
In [26], Al wires cut from AAAC A50 cables with a service life of up to 20 years were compared with Al wires obtained from ACSR AC50 cables with a comparable service life of up to 18 years from [24,25]. It is shown that the Al wires of ACSR AC50 cables exhibit the same trends in the characteristics of the studied elastic–microplastic, structural, and microstructural properties as the aluminum wires of AAAC A50 cables studied in [24,25] and briefly described above. However, the distribution profiles of the structural and microstructural parameters of the Al material of the AC50 cable are more gently sloping than those of the A50 cables. Moreover, the change in the parameters of the entire wire (elasto-microplastic characteristics E, δi, and σs and integral density ρ) and the parameters averaged over NSL (unit cell parameter a, XRD density ρX of Al material of NSL, mean crystallite size D, and absolute value of mean microstrain εs) is slower than in the A50 cable. For example, it was found that the degradation rate of the average parameter a of an Al cubic unit cell of the NSL of the wire with a service life of 0–20 years and, accordingly, its XRD mass density ρx, was ~15% slower in the Al wires of AC50 cables compared to the A50 wires. This difference was explained by the stabilizing effect of the steel core in the ACSR AC50 cable.
The same XRD, EBSD, densitometry, and acoustic methods were used to study wires from a new (0 years of service) AAAC cable of the A50 grade [27], which were subjected to tensile fatigue tests [36]. It has been shown that, both after operation under natural conditions [24,25,26] in OPLs and after fatigue testing [27], the structural and elastic–plastic properties change in a similar way, whereas the change in microstructural properties occurs in different ways. Moreover, the study of pieces of wires cut from different parts of the wires (next to the clamps and in the center of the wires between the clamps) after fatigue tests shows that the properties change similarly in different parts of the wires, though differently in magnitude. As a result, different parts of the wires show different effective lifetimes, the longest near the wire breaks that occurred near one of the clamps.
One can expect that, after operation in OPLs, the change in the physical properties of the cable (of wires in it) not only occurs along its cross-section but also depends on the location of the cable segments along cable length, similarly to what was observed in [27] for wires after fatigue tests.
However, the positions on the span, from where samples of cables (wires from them) were taken, were not recorded in most studies (including our previous works [24,25,26], where the studied wires were taken from an unfixed location of the outer wrap away from the clamps). At best, it was noted that the wire was taken from the area of the AAAC cable [20,21,23] or the ACSR one [12,29,30] near or far from the clamp. Most of these papers [20,21,23,29] refer to the study of cables after fatigue testing. Only two articles [12,30] are devoted to the characterization of ACSR cables (with two Al strands consisting of sixteen wires in the outer wrap and ten wires in the inner one, and a core consisting of one strand of six steel wires around the central steel wire) that have served to break for 29 years in an aerial 460 kV OPL along the Paraná-river crossing in Brazil [30] and for 26 years without an accident in Tongling, Anhui province of China [12]. At the same time, the authors of [12,20,21,23,29,30] did not study the quantitative characteristics of physical properties, and, as in the case of studying wires by position in the cross-section, a qualitative fractological analysis based on the examination of OM and SEM images [20,21,23,29,30] and metallographic [12] analysis were carried out, which classified the type of surface of broken wires and summed up the statistics on the number of breaks and types of break surfaces. Like [27], in [20,21,23,29,30], breaks in Al wires of outer and/or inner Al wraps were observed under the clamps or at distances up to ~30 mm from the clamps. In [12], also the mechanical properties of wires from the outer and inner wraps of wires of the ACSR cable segments under either the clamp or the vibration damper or in the free state between the clamp and the damper were measured. The worst mechanical properties (minimum tensile strength) of the wires were found for cable segments under the strain clamp, whereas wires from free cable segments between the clamp and the vibration damper show the highest values.
In this paper, we want to close gaps left by previous works of various authors, mentioned above regarding the possible change in the characteristics of wires from the cable in different parts of the OPL span. The aim of this work is to study the quantitative and qualitative characteristics of the structural, microstructural, and elastic–plastic properties of wires from different positions of the ACSR cable of the AC50 brand along the span between the supports after service in an OPL. To achieve this goal, in the Volgograd region of Russia, ACSR cables of the AC50 brand with a service life of 52 years in OPLs were selected from the available ones. This region is the same place where AAAC A50 and ACSR AC50 cables originated with service lives up to 62 [24,25,26] and 20 years [26], respectively, i.e., the cables were operated in the same climatic conditions, which is important for comparison purposes.
Here, as in [24,25,26,27], studies are carried out using XRD, EBSD, densitometry, and acoustic measurements. In contrast to those papers, where only Al wires were characterized and cut from a place remote from clamps, in this work, both Al and steel wires are also systematically studied along with fixing the position of the cable segment on the span from which the wires were taken. Moreover, unlike our previous works, where EDX measurements were carried out only from sections of cross-sections, and XRD patterns were taken only from the side of the wire that was in contact with the surrounding atmosphere, in this work, EDX spectra were taken from the outer sides of the wires too, as well as XRD patterns from the places of contact with the atmosphere and with the neighboring steel wire. Lastly, [25] investigated AC50 wires from cables in OPLs with shorter service lives, only up to 20 years, and, here, we are extending this period up to 52 years. This choice of the maximum service life among the available cables is due to the expectation that, firstly, the difference between the different parts of the cable will be maximum for a cable with a long service life. Secondly, it was expected that, due to the presence of a steel core in the ACSR AC50 cable, changes in the structural, microstructural, and elastoplastic properties of the cable after such a long service life may be significantly stronger than those observed after the 62-year service life of the AAAC A50 cable, which was studied earlier [24,25]. Compared to [11,12], where the mechanical properties of ACSR cables were studied after operation for 61 years [11] and 26 years [12], the samples studied in this work differ in the place of operation in OPL, brand, and research methods (all of these options are described in the text above).
2. Materials and Methods
2.1. Samples
The samples studied in this work were cut from an ACSR cable of the AC50 brand, which served in a 10 kV OPL in the Volgograd region of Russia for 52 years. Samples of aluminum and steel wires were cut from the part at the beginning of the OPL span, immediately adjacent to the clamp (but not under the clamp) and with an accuracy of several centimeters, from the free cable either at a quarter or at half of the span between supports (standard total span length is 50–80 m). The length of wires of both types was ≈70 mm with a diameter of ≈3.2 mm. Also, for comparison, similar samples were cut from an unused new (0 years of service) AC50 cable. Since this new cable has not been used and has not been clamped, all sections of this cable are similar in their properties. Therefore, only wires at a distance of ~1 m from the end of the cable in the coil were cut.
Further in the text, samples at distances of 0/1, 1/4, and 1/2 of a span are designated, respectively, as N1_W, N2_W, and N3_W in the case of Al wire (W for “Wire”) and N1_C, N2_C, and N3_C for the steel core wire (C for “Core”). New aluminum and steel wires (service life of 0 years) are designated as N0_W and N0_C, respectively. The quantitative characteristics of the new wires are shown in graphs of the further text at the span part designed as ‘−1’.
After cutting, the wires were washed in an acetone ultrasonic bath to remove grease and contaminants from the surface (which had been not ingrained into the surface of the wires). After washing, wires ≈ 70 mm long were used to determine the integral density by the densitometric method.
After densitometric measurements, smaller samples were cut off from these wires with a length l of ≈25 mm in the case of Al wires and ≈27 mm in the case of steel samples. These smaller segments were used for OM imaging as well as for EDX, XRD, and acoustic measurements (see Section S1.1 of Supplementary Materials for choice of sample length). The exact lengths l and diameters Ø of these specimens are given in Table S1 of Supplementary Materials.
EBSD maps were built from faceted cross-sections of these samples, and the EDX spectra were also taken. To prepare cross-sections, samples ~ 5 mm long were cut off from the ends of the wires and fixed at one end in a holder. For the mechanical grinding of the opposite side of these samples, a MultiPrep8 grinder (Allied, San Francisco, CA, USA) was used with a successive reduction in the size of the abrasive grain. The final polishing of the surface of the cross-sections was carried out with an argon-ion beam on a Camilla 1061 ion etching and polishing machine (Fischione, Export, PA, USA), which was utilized for the final polishing of the surface of the sections with an argon-ion beam.
EBSD, EDX, and XRD were registered from different sides of the wires, which had been in contact with the surrounding atmosphere or the steel core in the case of Al wires or the adjacent Al wire in the case of steel wires. These different contacts are indicated in the text, tables, and figures either directly by words or by the corresponding letters (A (air/atmosphere), W (Al Wire), and C (steel Core)), which are attached to the designation of the sample. For example, N1_W-A stands for “sample taken at 0/1 span position, Al Wire, side in contact with Air”, or N2_W-C stands for “sample taken at 1/4 span position, Al W, side in contact with steel Core”, etc. For ease of use, the nomenclature of samples is summarized in Table S2 of Supplementary Materials.
2.2. Experimental Methods
In this work, to study the samples, we used the methods of OM, EDX, EBSD, XRD, densitometry, and acoustic measurements. SEM was used to control the surface quality of the cross-sectional facet used to build EBSD maps. Our previous papers [24,25,26,27] have described in detail all the experimental equipment used and the aspects of the experiment and analysis. Therefore, we will not dwell on this in detail, giving only a summary of these parameters in Table 1 and Table 2 and a brief characterization of the main features of the methods. In contrast to other research methods carried out at room temperature, due to the features of the desktop diffractometer used, the temperature that was established in the sample chamber of the X-ray diffractometer during XRD measurements was Tmeas = 314 ± 1 K.

Table 1.
Methods, equipment used, and experimental details.
Table 2.
Software and calculations used for analysis of experimental data.
Important points such as the size of the areas and the thickness of the near-surface layers of wires, which have been the objects of study through various methods listed above, are considered in Section S1.2 of Supplementary Materials using the necessary data and formulas for estimation of penetration depths for EDX, EBSD, and XRD from [46,47,48,49,50,51,52,53].
Taking into account this consideration, one can conclude that OM characterizes the state of the wire surface. The EDX spectrum taken from the long (outer) side of the wire gives the elemental composition of the near-surface layer up to ~3 μm thick for Al wires and ~1 μm for steel wires.
As in the case of applying the EBSD and EDX methods to the long (outer) side of the wires, in the case of sections of wire cross-sections, the signal is recorded from a depth of ~1 μm or ~3 μm for steel and aluminum wires, respectively. However, since these measurements are taken from cross-sections of cut wires, in this case, EBSD and EDX characterize the bulk of the wires. In the case of EBSD, when the ~100 × 100 μm2 EBSD map was taken from the edge of the cross-section at a distance of ~150 μm from the outer surface of the wire, the NSL of the wires was characterized with a thickness of ~150–200 μm.
For Al wires, the characteristics obtained with XRD are averaged over NSL with thickness Tpen ≈ 36 μm. In the case of steel wires, if they are new, the depth from which the X-ray signal comes is determined by the galvanic Zn layer with Tpen ≈11 μm and up to ≈19 μm if it is oxidized. If the reflections of Fe and FeO and Fe2O3 oxides are visible, then this means that the galvanic layer is disturbed (or destroyed) and the depths from which XRD reflections occur are much smaller: Tpen ≈1.9 μm in the case of only Fe material and up to Tpen ≈ 3.2–4.5 µm for iron oxides.
As for densitometry and measurements of elasto-microplastic parameters using the acoustic compound-resonator method, these methods give purely integral characteristics averaged over the entire sample, including the bulk and NSL.
3. Results
Let us consider first the results of OM, which characterize the surface of the wires, then, subsequently, the results of EDX, EBSD, and XRD, which provide information on the NSL of different thicknesses from about one to tens of micrometers from the surface of the wires (and even more if the facets of the cross-sections of the wires are examined), and, finally, the results of densitometry and acoustic measurements providing integral characteristics of the wires.
To explicitly show the periodicity of changes in the characteristics of the material of the wires along the span length between the OPL supports when presenting the results of EBSD, XRD, densitometric and acoustic measurements on graphs, the points for the span parts ‘3/4’ and ‘1/1’ are set by mirroring the experimental points at the span parts ‘1/4’ and ‘0/1’, respectively. Lines connecting the experimental points on the graphs, which were shown with different symbols for different samples according to the legends depicted in the figures, are guides to the eye only. The data for samples from the new cable are indicated at the position on the span formally equal to ‘–1’.
3.1. OM Results
Typical surface images of aluminum and steel wire samples obtained by OM are shown in Figure 1 and in Figure S1 of Supplementary Materials.
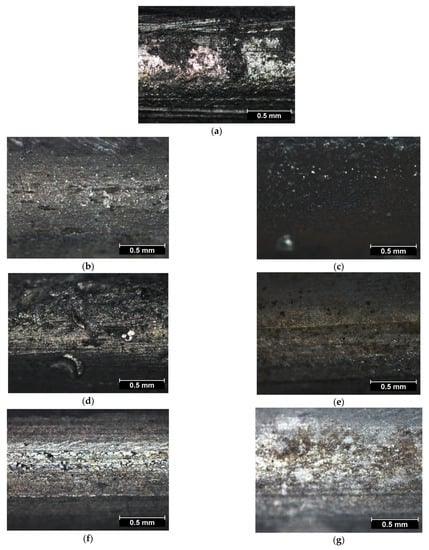
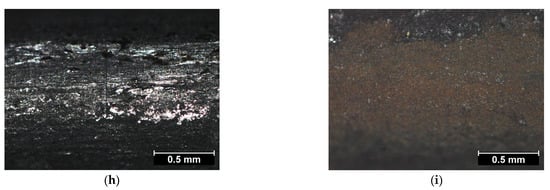
Figure 1.
OM images of the AC50 samples (a) N0_W-C, (b) N2_W-A, (c) N2_W-C, (d) N6_W-A, (e) N6_W-C; A50 samples (f) N6-2_W-Al core and (g) N6-2_W-A; and AC50 samples (h) N0_C-W and (i) N2_C-W. Wires N0 (a,h) are new (0 years of service), and samples N2 (1/4 span) (b,c), N6 (d,e), and N6-2 (f,g) are after 52, 20, and 62 years of exploitation in OPLs, respectively. Samples N6 (d,e) and N6-2 (f,g) are the same as those investigated in Ref. [26] and in Refs. [24,25]. C-W, W-C, and W-A are contacts of a steel core with an Al wire, an Al wire with a steel core, and an Al wire with the atmosphere, respectively. For A50 cable in (f), the external Al wire makes contact with Al core wire.
As an example, OM images of samples N0 of aluminum and steel wires from the AC50 cable not served in OPLs (Figure 1a,h) are shown, as well as those of samples of N2 taken from an AC50 cable operated for 52 years in OPL, from the 1/4 span position between supports (Figure 1b,c,i). The OM images of the Al surface of wires N1 (0/1 span, from a cable cut at supports) and N3 (1/2 span) are similar to the OM images of specimens N2 (see Figure S1a–d of Supplementary Materials). For the new Al sample N0 (Figure 1a), only the steel wire contact surface (N0_W-C) is shown as an example, since the air-contact surface (W-A) is completely analogous. For steel wires of the core, the surface is shown only near one contact with an Al wire (C-W), and the remaining contacts are similar for all steel wires cut from the cable in different places of the OPL span between the supports (Figure 1h,i and Figure S1g,h of Supplementary Materials). For comparison, OM images are given of Al wires from AC50- and A50-type cables that have served 20 (Figure 1d,e) and 62 years (Figure 1f,g), respectively, which were previously studied in [24,25,26] (they were cut out from cables at locations far from supports).
As one can see (Figure 1a,h), the new steel and aluminum wires from the AC50 cable show a shiny metallic surface. Samples of AC50 cable wires after 52 years of operation (Figure 1b,c,i and Figure S1a–d,g,h of Supplementary Materials) are visually very different from new samples. The surfaces of Al wires in contact with the atmosphere (the W-A contacts) have a dark dull appearance, no longer show a metallic sheen, and are covered with clearly visible pits (Figure 1b and Figure S1a,c of Supplementary Materials). The entire surface of the steel wire of the core and the side of the Al wires in contact with the steel core are covered with a bulk corrosion layer, which is clearly visual and has a dark rusty appearance on the steel wires (Figure 1i and Figure S1g,h of Supplementary Materials) and almost black on the Al wires (Figure 1c and Figure S1b,d of Supplementary Materials). We made an estimation of the thickness of the corrosion layer of the steel wires and Al wires on the W-C side in contact with the steel wires. To do this, the corrosion layer on the surface of the wires was scratched, and the thickness of the corrosion layer Tcorros in this scratch was measured using SEM. For steel wires N1_C-W (0/1 span) and N2_C-W (1/4 span), this estimate gave Tcorros = 16–20 μm depending on the location of the layer-thickness estimation; for N3_C-W (1/2 span), the corrosion layer is slightly less than Tcorros = 12–16 µm. In the case of Al wires, sample N2_W (1/4 span) has the same corrosion layer thickness Tcorros = 16–20 μm as steel wires, and for samples N1_W (0/1 span) and N3_W (1/2 span), the value of the corrosion layer is noticeably smaller at Tcorros = 1–2 μm and 1–3 μm, respectively.
It should be noted that Al wires N6 from an AC50-type cable (which was studied in [26]) that served in the same Volgograd region of Russia as Al samples N1_W, N2_W, and N3_W, though less (20 years versus 52), do not show strong corrosion damage (Figure 1d,e). The surface in the vicinity of the W-A contact with air shows the presence of pits but is still metallic in color (Figure 1d), although duller than that of new wire, and, in the area of W-C contact with a steel core, the color of the sample is not as dark as after 52 years of service, and there are spots of rust colors that can be attributed to the initial sign of corrosion (Figure 1e). Furthermore, after 8 years of operation (sample N2-2 studied in [26]), the surfaces of both contacts (W-A and W-C) have a metallic sheen, although the surface in the W-C contact area is somewhat darker and there are pits in the W-A contact area (Figure S1e,f of Supplementary Materials). As a result of the lack of a steel core in A50-type cables, even after 62 years of service in OPL (also in the Volgograd region of Russia), the outer Al wires (N6-2 sample studied in [24,25]) show a metallic sheen (Figure 1f,g) and the presence of only initial signs of corrosion in the form of light brown spots at the point of contact with the Al core (Figure 1i) and pits in the area of contact with air (Figure 1f).
3.2. EDX Results
EDX spectra were taken either from the surface of the long sides of the wires (outer) or from thin sections of their cross-sections (inner). Examples of recorded EDX spectra are given in Figure S2 of Supplementary Materials. Elemental composition results (in wt.%) are summarized in Table 3.
Table 3.
Elemental composition (wt. %) of the samples according to EDX analysis.
3.2.1. EDX Results: Facets of Cross-Sections of Aluminum and Steel Wires
As one can see from the results of microanalysis of the elemental composition of facets of wire cross-sections, in the bulk, all aluminum and steel wires of AC50 cable after 52 years of operation are very close or even practically do not differ from each other and from the wires from the new unused AC50 cable. Al wires in the bulk consist of ≈98 wt.% Al and ≈2 wt.% O (after averaging over all three samples N1_W, N2_W, and N3_W from different parts of the span, 97.92(10) wt.% Al and 2.08(10) wt.% O in Al wires after 52 years of service in an OPL are found compared to 97.91 wt.% Al and 2.09 wt.% O in new wires). Steel wires after 52 years of service in an AC50 OPL cable show a slight increase in O and Si in the bulk and a corresponding slight decrease in Fe (when averaged over all three samples N1_C, N2_C, and N3_C from different parts of the span; 0.75(3) wt.% O, 0.23(2) wt.% Si, and 99.02(5) wt.% Fe versus 0.70 wt.% O, 0.16 wt.% Si, and 99.14 wt.% Fe in the new N0_C steel wire. Note that carbon (C), which is present in steel, cannot be determined by the system used for EDX microanalysis in this work because of insufficient sensitivity to such a light element).
In contrast to the cross-sections of the wires, analysis of EDX spectra recorded from the long sides of samples after 52 years of service in the OPL showed significant differences both from the new unused state and from the location on the span from where the cable pieces were taken, from which wires were cut.
3.2.2. EDX Results: Outer Surface of Al Wires
As in the bulk of the samples (i.e., as for the cross-sections), the main element on the outer surface of the new Al wire (sample N0_W) is aluminum. However, there is less Al here, not ≈98 wt.% but only 90.13 wt.%, and the content of O has increased almost four times up to 7.80 wt.%. There are also small contaminants, ≈1 wt.% of S and Cl. In contrast to the bulk of the steel wire, where the dominant element (≈99 wt.%) was Fe, Zn was found as the main element (75.44 wt.%) on the outer surface of the steel wires, which is explained by the fact that steel wires were covered with a galvanic Zn layer in the manufacture. Moreover, 19.29 wt.% O, 4.28 wt.% Fe, and 0.99 wt.% Al are recorded at the outer side of the steel wire.
After 52 years of service in an OPL, Al-wire surfaces exposed to air showed a dramatic increase in O content from 7.80 wt.% in new N0_W-A Al wire to ≈37 wt.% in N1_W-A (0/1 span) samples and N2_W-A (1/4 span) and 26.58 wt.% in N3_W-A (1/2 span) with a simultaneous decrease in the weight content of Al, respectively, to ≈58–60 wt.% and 68.02 wt.%. Moreover, ≈0.50 wt.% of K appeared, probably from the environment. Additionally, for wires N1_W-A (0/1 span) and N2_W-A (1/4 span), the content of S increased from 1.01 wt.% in the new wire to 1.09 wt.% and 1.24 wt.% for the samples N1_W-A (0/1 span) and N2_W-A (1/4 span), while for Al wire N3_W-A from the middle of the span, the amount of S practically did not change (0.99 wt.%). The presence of Fe was also recorded (1.33 wt.% for N1_W-A (0/1 span) and ≈3 wt.% for N2_W-A and N3_W-A from cables on a quarter and half a span, respectively). Although Fe was found on the outer side of Al wires in contact with air, it is more likely to originate from the other side of the wires in contact with steel wires.
On the reverse surfaces of Al wires that served 52 years in OPL and were in contact with the steel core wire, where the formation of a corrosion layer was observed by means of OM, the O content increased even more, up to ≈50–55 wt.% with a decrease in the weight content of Al down to ≈13–15 wt.% in N1_W-C (0/1 span) and N2_W-C (1/4 span) and 31.49 wt.% in N3_W-C (1/2 span). The Fe content also increased significantly, most strongly for N2_W-C (1/4 span) and N1_W-C (0/1 span) to 17.32 wt.% and 13.12 wt.%, respectively, and, to a lesser extent, to 6.18 wt.% for N3_W-C (1/2 span). The content of K increased for all samples, approximately 1.5–2 times to 0.76–1.38 wt.%, and that of S rose to 1.87 wt.% and 2.86 wt.% in samples N3_W-C (1/2 span) and N1_W-C (0/1 span), respectively. In addition to Fe, for the N2_W-C (1/4 span) sample, 2.09 wt.% Zn is observed, obviously, like Fe, from the steel wire, more precisely from its galvanic layer. The appearance of new elements, apparently originating from the air environment, such as ≈10 wt.% of Si in all wires and 2.16–2.34 wt.% of P for N1_W-C (0/1 span) and N2_W-C (1/4 span), should also be noted.
3.2.3. EDX Results: Outer Surface of Al Wires
Steel wire of the core after 52 years of service in an OPL cable in contact with Al wires shows a two-fold increase in O weight content in samples N1_C-W (0/1 span) and N3_C-W (1/2 span) to, respectively, 35.79 wt.% and 42.43 wt.% from 19.29 wt.% in new unused wire N0_C-W. In N2_C-W (1/4 span) wire, oxidation is even higher (48.18 wt.% of O). After 52 years of service in OPL, the Zn content on the surface of the steel wires drops sharply and the Fe content increases, probably as a result of the destruction of the electroplated Zn layer. The Zn content dropped the most for the N2_C-W (1/4 span) wire (down to 9.54 wt.% from 75.44 wt.% in the original new state N0_C-W). The smallest drop in the Zn content, though also significant (down to 24.50 wt.%), is observed in the N3_C-W steel core wire cut from the cable at half the span. Correspondingly, the Fe content increases in comparison with N0_C-W by a factor of 9–10 on the surfaces of the N1_C-W (0/1 span) and N2_C-W (1/4 span) samples, to 40.39 wt.% and 34.82 wt.%. For the steel wire N3_C-W (1/2 span), the increase is not as large, only up to 13.92 wt.% from 4.28 wt.% in N0_C-W. Moreover, on the surface of samples N1_C-W (0/1 span) and N3_C-W (1/2 span), 4.77 wt.% and 11.35 wt.% Al, respectively, appear, apparently as a result of the transfer from neighboring Al wires because of fretting. As in the case of Al wires in contact with steel ones (N1_W-C, N2_W-C, and N3_W-C), a small amount of Si appears on the surface of steel wires in contact with aluminum (from 1.65 wt.% in N1_C-W (0/1 span) up to 4.37 wt.% in N3_C-W (1/2 span) and 5.73 wt.% in N2_C-W (1/4 span)), S (from 0.75 wt.% to 1.95 wt.% in different samples), K (≈0.70 wt.% in N2_C-W (1/4 span) and N3_C-W (1/2 span)), and 0.80 wt.% Cl in N3_C-W (1/2 span), as well as 0.10–0.27 wt.% of Cu in N1_C-W (0/1 span) and N2_C-W (1/4 span), which was not previously detected in other samples. Moreover, as can be seen from Table 3, the number of all these elements is, as a rule, noticeably less on the surfaces of steel wires than on the contact surfaces of Al wires surrounding the steel core wire.
3.3. EBSD Results
Examples of EBSD maps obtained for aluminum and steel wires of an ACSR-type AC50 cable after 52 years of operation in OPL are presented in Figure 2a,b,c,d,e,f and 2g,h,i,j,k,l, respectively. These EBSD maps were taken from aluminum and steel samples N0 (new, 0 years of service) and N2 (1/4 span) in the center of the cross-section and from the edges at the points of contact with neighboring steel (W-C, for Al wires) or aluminum (C-W, for steel core) wire and air/atmosphere (W-A, for Al wires) or a second contact C-W(2) with Al wire (on the opposite border of cross-section of the steel core). Similar EBSD maps for aluminum (N1_W (0/1 span) and N3_W (1/2 span)) and steel (N1_C (0/1 span) and N3_C (1/2 span)) samples are given in Figure S3 of Supplementary Materials.
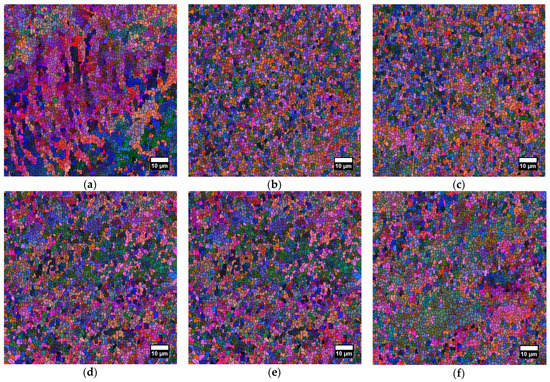
Figure 2.
EBSD distribution maps of the Euler angles φ1, Φ, and φ2 of the cross-sections of (a–f) aluminum and steel-core (g–l) wires from the new AC50 cable with service life of 0 years ((a–c) N0_W aluminum and (g–i) N0_C steel wire) and an AC50 cable after 52 years of operation in an OPL ((d–f) N2_W aluminum and (j–l) N2_C steel wire from 1/4 of the span length of the cable). EBSD maps shown in (a,d,g,j) were taken from the area in the center of the aluminum (a,d) and steel-core (g,j) wire cross-section. For aluminum wires, the EBSD maps shown in (b,c,e,f) were taken from the edges of the wire cross-section at contact W-C of the aluminum wire with steel-core (b,e) and at a contact W-A with the atmosphere (c,f). Respectively, for steel-core wires, the EBSD maps shown in (h,i,k,l) were taken from the edges of the steel-core wire cross-section at contact C-W of the steel-core with adjacent aluminum wire (h,k) and at a contact C-W(2) with adjacent aluminum wire at the opposite side of the steel-core cross-section (i,l). Scales and legends of the Euler angles (in degrees) are shown in (m). The angle ranges of Φ and φ2 are the same.
On EBSD maps (Figure 2 and Figure S3 of Supplementary Materials), the grain boundaries are shown as solid black lines. As grains, the regions were considered in which the crystal lattice is misoriented by an angle less than 2°, the orientation of each grain being described by three Euler angles φ1 (angle of intrinsic rotation), Φ (angle of nutation), and φ2 (angle of precession) [54]. The orientation of each grain (i.e., the orientation of the grain crystal lattice) is displayed with its own color of a certain contrast by means of marking each of the angles with its own color and assigning each possible value of the angles to its own degree of contrast (see legend in Figure 2m). Accordingly, grains of close orientation have colors of the same gamut of close shades. Thus, if there is a tendency for preferential orientation of grains, clusters of grains of close shades of the same color are observed on EBSD maps. If there is no preferential orientation, then EBSD maps will have a colorful appearance.
Visual inspection of the obtained EBSD maps reveals clusters of grains of similar color shades, especially noticeable in the center of the cross-sections of Al wires (Figure 2a,d and Figure S3d of Supplementary Materials) with the exception of the N1_W sample (0/1 span, Figure S3a of Supplementary Materials), taken from the area near the cable clamps on the supports. Clusters of grains of the same color, though less pronounced, are also observed in Al wires at the edge of the cross-sections of samples N1_W-C (0/1 span, Al wire—steel core (W-C) contact area, Figure S3b of Supplementary Materials) and N2_W-A (1/4 span, Al wire—atmosphere (W-A) contact area, Figure 2f). Unlike Al wires, clusters of grains of similar shades of color are observed more noticeably only in steel core wires after operation in OPL cables and only in wires cut out of the cable at a quarter and at half the span, both in the center of their cross-section and on edges at C-W and C-W(2) in contact with adjoining Al wires (samples N2_C (1/4 span) and N3_C (1/2 span); see Figure 2j,k,l and Figure S3j,k,l of Supplementary Materials, respectively). As mentioned above, the observed clusters of grains of the same shade of color indicate a tendency to align the grains along a common direction.
Furthermore, visual inspection of the EBSD maps (Figure 2 and Figure S3 of Supplementary Materials) leads to the conclusion that the size and shape of the grains of aluminum and steel wires in the new state and after 52 years of operation in OPL do not show noticeable changes. Though the visual inspection does not reveal subtle differences, the most widespread grain size appears to be ~1–2 μm for both types of wires over the entire OPL span between supports.
In order to obtain detailed data from this simple visual inspection of EBSD maps and to obtain more accurate quantitative characteristics of wire grains, histograms of grain size Dgrain distribution were constructed. As an example, Figure 3 shows Dgrain histograms for Al wires N0_W (new) and N2_W (1/4 span) and steel core wires N0_C (new) and N2_C (1/4 span). For other aluminum and steel samples N1 (0/1 span) and N3 (1/2 span), Dgrain histograms are given in Figure S4 of Supplementary Materials. Moreover, one can see dependencies of relative area Srel occupied by grains on their size Dgrain (see Figure 4 and Figure S6 of Supplementary Materials) and grain distribution histograms according to their aspect ratio (AR), as well as the ratio of the maximum grain size to its minimum size. As an example, Figure 5 shows AR histograms for Al wires N0_W (new) and N2_W (1/4 span) and steel core wires N0_C (new) and N2_C (1/4 span). For other aluminum and steel samples, N1 (0/1 span) and N3 (1/2 span) histograms are given in Figure S5 of Supplementary Materials. Figure 6 presents histograms of grain distribution by misorientation angle φmis between neighboring grains (i.e., by the misorientation angle φmis of grain boundaries (GBs)). It should be noted that, when either the distribution of grains by size (Figure 3 and Figure S4 of Supplementary Materials) or the dependence of Srel on the grain size (Figure 4 and Figure S5 of Supplementary Materials) is discussed, the size of each particular grain Dgrain refers to the effective diameter of a round grain with the same area as the actually observed grain occupies (calculated using the applied EBSD map analysis program).
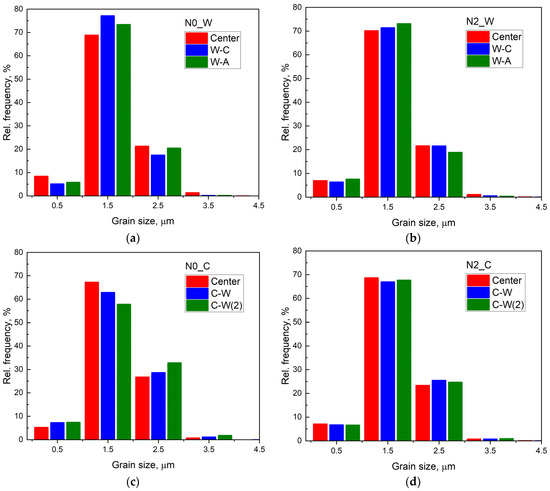
Figure 3.
Grain size (Dgrain) distribution histograms in the central and edge areas of the cross-sections of (a) aluminum wires N0_W (from AC50 cable of service life of 0 years (new)) and (b) N2_W (from AC50 cable operated 52 years in an OPL, 1/4 span) and (c) steel wire cores N0_C (new) and (d) N2_C (service life of 52 years, 1/4 span). The aluminum sample is designed as ‘_W’, whereas the steel wires are shown with ‘_C’ designation. Histograms designated as ‘Center’ were obtained from the centers of the wire cross-sections. Histograms designated as W-C and W-A were obtained from areas of aluminum wires near contacts of aluminum wire—steel wire core and aluminum wire—air/atmosphere, respectively. Histograms designated as C-W and C-W(2) were calculated from areas of steel wire cores near contacts of steel wire—adjacent aluminum wire and steel wire—adjacent aluminum wire at opposite side of the steel wire. For better visualization, the Center and W-A (or W-C(2)) histogram columns are shifted along the abscissa axis by the width of the base of the histogram columns, respectively, to the left and right relative to the true position.
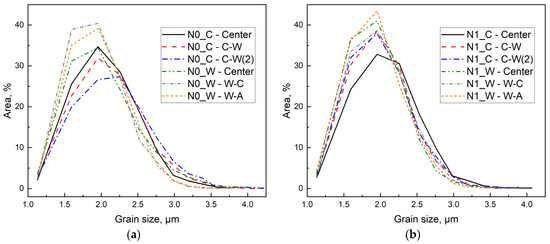
Figure 4.
Relative areas Srel occupied by grains with dependence on the grain sizes Dgrain in (a) new sample N0 and sample (b) N1 (0/1 span) after 52 years of operation in an OPL. For designations, see caption of Figure 3.
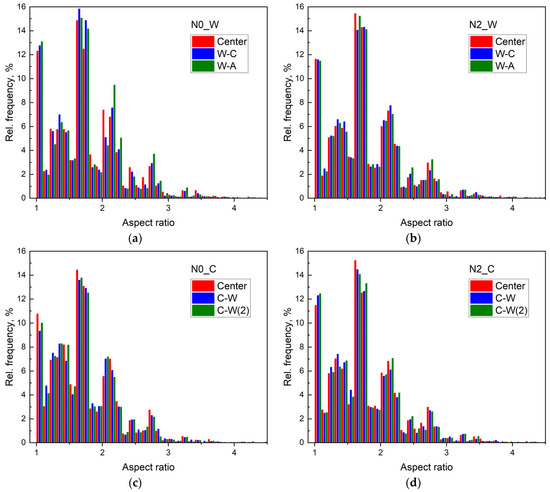
Figure 5.
AR distribution histograms in the central and edge areas of the cross-sections of (a) aluminum wires N0_W (from AC50 cable of service life of 0 years (new)) and (b) N2_W (from AC50 cable operated 52 years in an OPL, 1/4 span) and (c) steel wire cores N0_C (new) and (d) N2_C (service life of 52 years, 1/4 span). For designations, see the caption of Figure 3. For better visualization, the Center and W-A (or W-C(2)) histogram columns are shifted along the abscissa axis by the width of the base of the histogram columns, respectively, to the left and to the right relative to the true position.
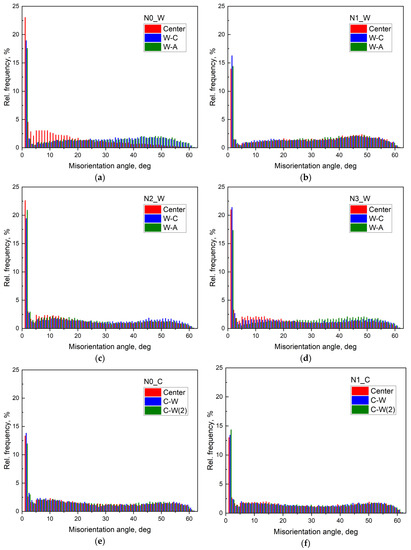
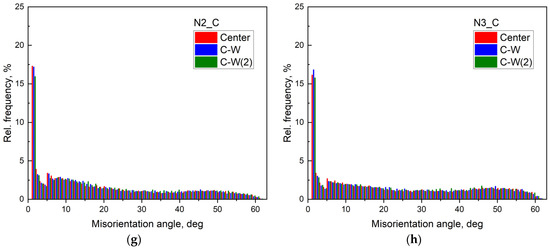
Figure 6.
Distribution histograms of the GB misorientation angles φmis in the central and edge areas of the cross-sections of (a) aluminum wire N0_W and (e) steel wire core N0_C from the new AC50 cable of service life of 0 years and (b) N1_W and (f) N1_C (both from 0/1 span), (c) N2_W and (g) N2_C (both from 1/4 span), and (d) N3_W and (h) N3_C (both from 1/2 span) aluminum wires (_W) and steel wire cores (_C) from the AC50 cable after 52 years of operation in an OPL. For designations, see caption of Figure 3. For better visualization, the Center and W-A (or W-C(2)) histogram columns are shifted along the abscissa axis by the width of the base of the histogram columns, respectively, to the left and to the right relative to the true position.
The average quantitative characteristics of the microstructure of aluminum and steel wires, which were obtained from the analysis of EBSD maps, are summarized in Table S4 of Supplementary Materials. In that Table S4, for all investigated cross-sections of samples of Al wires (W) and steel core wires (C) in their middle and at the point of contact with other wires (W-C, C-W, and C-W(2)) or air atmosphere (W-A), we give average grain sizes <Dgrain>; relative areas Srelmax occupied by grains of size Dgrain = 1.95 μm (the grain size at which the dependence Srel(Dgrain) shows a maximum); fractions fAR<3.2 of grains with aspect ratios AR < 3.2; average values <AR> of aspect ratios of grains; fraction f=2, fLAGB, and fHAGB of GBs with misorientation angles φmis = 2°, 2° < φmis < 15° (low-angle GBs (LAGBs)), and φmis ≥ 15° (high-angle GBs (HAGBs)), respectively; and average misorientation angles <φmisLAGB>, <φmisHAGB>, and <φmis> for LAGBs, HAGBs, and all GBs (φmis ≥ 2°), respectively.
Below, a brief description of the results of the qualitative inspection of the grain size distribution histograms (Figure S4a–d of Supplementary Materials and Figure 3a–d), dependences of relative area Srel occupied by grains on their size Dgrain (Figure 4 and Figure S5 of Supplementary Materials), grain distribution histograms according to their AR (Figure 5 and Figure S6 of Supplementary Materials), and histograms of grain distribution by misorientation angle φmis by the misorientation angle φmis of GBs (Figure 6) are given. An additional detailed description of the histograms and dependences obtained from the analysis of the EBSD maps is presented in Section S2.3 of Supplementary Materials.
As one can see from grain size distribution histograms (Figure 3a–d and Figure S4a–d of Supplementary Materials) consistent with visual inspection expectations, for all aluminum and steel samples, the most widespread grain sizes are Dgrain ≈ 1.5 μm (from ≈64% to ≈78% in different samples and areas along the span), the second and third most widespread sizes are Dgrain ≈ 2.5 μm (from ≈17% to ≈32%) and Dgrain ≈ 0.5 μm (from ≈4% to ≈9%). Grains with sizes Dgrain ≈ 3.5 μm and more do not exceed ~1%, i.e., the sum of fractions of all grains with Dgrain ≤ ≈2.5 μm is ≈100%.
Visual inspection of the grain size distribution histograms of the aluminum wires after 52 years of operation in OPL shows an increase in the fraction of the large grains (Dgrain ≈ 2.5 μm) at the W-C edge, in the center, and at the W-A edge of the cross-section of Al wires to ≈21%, ≈18%, and ≈17%, respectively, in N1_W (0/1 span); ≈21%, ≈21%, and ≈18% in N2_W (1/4 span); and, most strongly, up to ≈26%, ≈25%, and ≈32% in N3_W (1/2 span) compared to ≈17%, ≈22%, and ≈21% for the new N0_W Al wire. This increase in the large grains with Dgrain ≈ 2.5 μm is accompanied by an increase in the small grains with Dgrain ≈ 0.5 μm to ≈6%, ≈ 8%, and ≈10% in N1_W (0/1 span); ≈6%, ≈7%, and ≈8% in N2_W (1/4 span); and, most strongly, up to ≈5%, ≈6%, and ≈4% in N3_W (1/2 span) compared to ≈5%, ≈6%, and ≈4% for the new N0_W Al wire. The increase in the fraction of large and small grains is followed by a corresponding change in the fraction of the medium-sized grains with Dgrain ≈ 1.5 μm (see Section S2.3 of Supplementary Materials).
It should be noted that these grain size distribution results are qualitatively similar to the results for Al wires from cables of A50 and AC50 types with lifetimes of 0–62 years and 0–20 years, respectively, previously studied in [24,25,26], and for Al wires (from cables A50 type) after fatigue tests [27].
In steel wires, the grain size trends are different compared to Al wires. In contrast to the new Al wire, in the new steel wire, on average (over the entire cross-section), the fraction of grains with sizes Dgrain ≈ 1.5 μm is less, whereas that with sizes Dgrain ≈ 2.5 μm is more than in the steel core wire from the cable after 52 years of operation in OPL, while the fraction of grains with sizes Dgrain ≈ 0.5 μm on average slightly differs up or down (Figure 3c,d and Figure S4c,d of Supplementary Materials) (see also Section S2.3 of Supplementary Materials).
As one can see from the grain size distribution histograms (Figure 3 and Figure S4 of Supplementary Materials), the root mean square (r.m.s.) estimated standard deviations (e.s.d.s) of the average grain sizes <Dgrain> averaged over all available individual Dgrain values, for all samples, are rather large, ~0.4–0.5 μm. Nevertheless, the average <Dgrain> grain size seems to systematically change along the length of the OPL span (Figure 7a,b and Table S4 of Supplementary Materials).
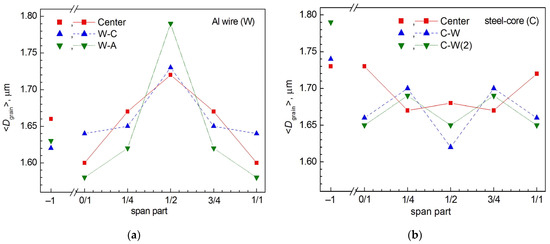
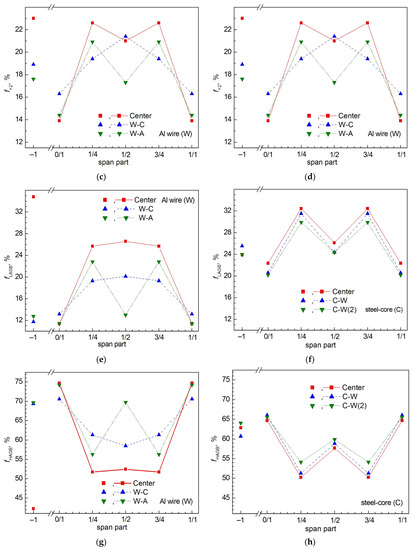
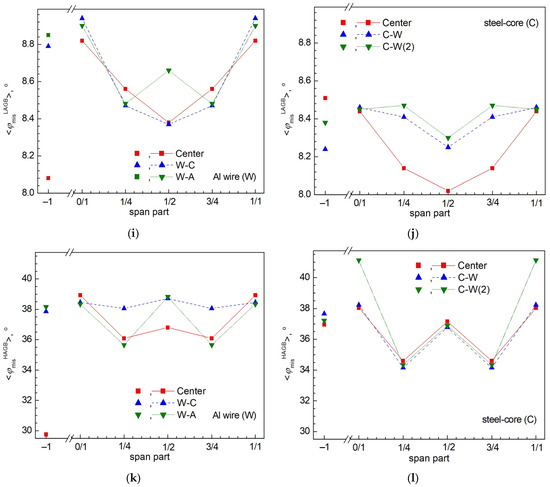
Figure 7.
(a,b) Average crystallite size <Dgrain>, (c,d) fraction f=2 of GBs with misorientation angle φmis = 2°, (e,f) fraction fHAGBs of HAGBs (with misorientation angles 2° < φmis < 15°), (g,h) fraction fHAGBs of HAGBs (with misorientation angles φmis ≥ 15°), (i,j) mean misorientation angle <φmisLAGB> averaged over LAGB range with 2° < φmis < 15°, and (k,l) mean misorientation angle <φmisHAGB> averaged over HAGB range for (a,c,e,g,i,k) aluminum wire (W) and (b,d,f,h,j,l) steel wire core (C) of AC50 cable at different span parts after 52 years of operation in OPL. For comparison, data for new (0 years of service life) are shown at the span position designated as ‘–1’. For explanations of other designations, see caption of Figure 3.
In the new Al wire N0_W, the average grain sizes at the center of the cross-section (‘Center’ in Figure 7a) and at its edges at the point of contact with the steel wire (W-C) and with the atmosphere (W-A) are close, although somewhat larger in the center (cf., <Dgrain> = 1.66 µm, 1.62 µm, and 1.63 µm for Center, W-C, and W-A). After 52 years of service in the OPL, due to different changes in different span parts, the change in <Dgrain> along the span from one clamp to the next one is close to a Λ-shape (inverted V-shape) with a maximum at the middle of the span (<Dgrain> = 1.72 μm, 1.73 μm, and 1.79 μm for Center, W-C, and W-A, respectively); see Section S2.3 of Supplementary Materials for description of <Dgrain> change along the span parts and Section 4.4.1 for the discussion.
In steel wires, the average grain size <Dgrain> changes along the span from the clamp to the middle in a different way than in Al wires, showing a sawtooth change, antiphase at the center of the cross-section (‘Center’ in Figure 7b) and at its edges (C-W and C-W(2)). The change <Dgrain> along the span is described by a W-shaped function for the center and M-shaped functions for edges (distorted M-shaped function with a drop in the middle of the span for C-W edge). After exploitation in OPL, the average grain <Dgrain> size in all parts of the steel wire is smaller than in new steel wire for all span parts (<Dgrain> = 1.65–1.73 μm, 1.67–1.70 μm, and 1.62–1.68 μm at the edges and center of the cross-section for wires N1_C-W (0/1 span), N2_C-W (1/4 span), and N3_C (1/2 span), respectively, in comparison to <Dgrain> = 1.73–1.79 μm for the new wire N0_C). Near the clamp (0/1 span), in the center of the cross-section, the <Dgrain> value is the same as in the new wire, although noticeably decreasing at the edges (cf., <Dgrain> = 1.73 μm, 1.66 μm, and 1.65 μm for Center, C-W, and C-W(2)). For a detailed description and discussion of <Dgrain> in steel wire, refer to Section S2.3 of Supplementary Materials and Section 4.4.1.
It is worth noting that if similar dependences on the span part are constructed for other quantitative microstructure parameters obtained from the EBSD analysis and summarized in Table S4 of Supplementary Materials, then these dependences have a character similar to the dependences of the average grain size <Dgrain> on the span part. The only difference is that the change in some parameters is in antiphase with <Dgrain> when moving along the span, i.e., their values decrease when <Dgrain> increases, whereas the change in other parameters is in phase with the change in <Dgrain> (cf. Figure 7a–l and Figure S7a–h of Supplementary Materials. For ease of comparison, the dependences of the microstructure parameters of the same type for aluminum and steel wires are shown in the figures on the same scale).
Like for the average grain size <Dgrain>, other microstructural characteristics of AC50 aluminum cable cores after 52 years of operation in OPL are also dependent on the span part. These are relative area Srel occupied by grains of different sizes and histograms of AR and misorientation angles φmis, which, in general, are qualitatively similar to those observed for aluminum wires from A50-type and AC50 cables with service lives of 0–62 years and 0–20 years, respectively, as well as for aluminum wires after fatigue tests [27]. Moreover, the same can be said about steel wires, although, of course, there are some peculiarities.
In particular, the dependences of relative areas Srel(Dgrain) occupied by grains of different sizes (Figure S5a,b of the Supplementary Materials and Figure 4a,b) before and after operation in OPLs are nearly bell-shaped (more precisely, like a lognormal distribution) with maxima Srelmax at Dgrain ≈ 1.95 μm for aluminum and steel wires, which are practically independent of the service life and position on the span from where the wires originated. The functions of changing the Srelmax magnitude depending on the span part are characterized by a shape that is almost antiphase with respect to the functions obtained for <Dgrain>. Namely, these functions are V-shaped for Srelmax of aluminum wires (or a bowl-shaped function for the center of the cross-section of the wire, which, in the first approximation, can also be described as V-shaped) and M- and W-shaped functions for the center and edges of the steel wire in contrast to corresponding Λ-, W-, and M-shaped functions for <Dgrain> (cf. Figure S7a,b of Supplementary Materials and Figure 7a,b). The peculiarities of Srel histograms and functions of changing the Srelmax magnitude depending on the span part are discussed in Section S2.3 of Supplementary Materials.
As in aluminum wires from A50 cables of the AAAC type that have served from 0 to 62 years in OPL [24,25] or after fatigue testing [27], as well as from AC50 cables of the ACSR type [26], AR histograms of grains in the center and on the cross-sectional edges of the new wire and the wire after 52 years of operation are very similar and change insignificantly along the span between the OPL supports (Figure 5a–d and Figure S6a–d of Supplementary Materials). Moreover, this qualitative statement is true for both aluminum wire and steel one cut from the AC50 cable, which indicates that the shape of the grains remains even after changing their average size after operation in OPL.
A quantitative study, which is more sensitive to detecting changes, has shown that the average <AR> value of the AR value of aluminum wires changes systematically nonetheless and is close to the antiphase change with a variation in the average grain size <Dgrain>, i.e., the <AR> value shows a decrease at the span part where <Dgrain> is increasing (cf. Figure S7a,b of Supplementary Materials and Figure 7a,b). For the center of the cross-section and one of the edges (CW(2)) of steel wire, the functions of changing in <AR> by parts of the span in the first approximation are similar to the functions of changing the grain sizes. For the other edge (CW), AR changes slightly, remaining almost constant. Apparently, it is a peculiarity of the investigated sample. In spite of the variation in AR along the span, for all aluminum and steel wires, both new and after use in OPL, the overwhelming fraction of grains (>98.4%) is characterized by an aspect ratio AR < 3.2 (Figure S7e,f of Supplementary Materials).
A detailed description and discussion of the AR of grains are given in Section S2.3 of the Supplementary Materials and in Section 4.3.3 and Section 4.4.1.
An analysis of histograms of misorientation angles of GBs shows that in aluminum wire after exploitation, the fraction of GBs with the smallest misorientation angle φmis = 2° (Figure 6a–d) at the center of the cross-section drops from f=2 = 23.0% in the new wire to f=2 = 13.9% at the clamp (0/1 span), then increases to f=2 = 22.6% (1/4 span) and decreases again to f=2 = 21.0% at the middle of the span of OPL (1/2 span), i.e., this dependence on the span part is characterized by an M-shape (Figure S7). The same M-shape is observed for the change in fraction f=2 along the span at the W-A edge where the Al wire is exposed to the air, although with a smaller scatter of maximum and minimum values and a larger dip in the middle of the span (f=2 = 14.4%, 20.9%, and 17.3% for span parts = 0/1, 1/4, and 1/2, respectively). For the W-C contact, where an Al wire is in contact with the steel one, the M-shaped dependence degenerates into a Λ-shape (inverted V-shaped), where, along the span, an almost linear increase in f=2 is observed from the clamp to the middle of the span (f=2 = 16.3%, 19.4%, and 21.4% for span parts = 0/1, 1/4, and 1/2, respectively) followed by a mirrored linear decline to the next clamp (1/1 span).
A decrease in the fraction f=2 in the center of the cross-sections (i.e., in the bulk) and at the edges of aluminum wires from the AC50 cable after 52 years of service is opposite to the trend toward an increase in the proportion of f=2 observed in [24,26] for the bulk of aluminum wires from AAAC cables of the A50 brand without a steel core after 8–62 years of service [24], as well as for cross-section centers (i.e., the bulk) of aluminum wires from the AC50 cable with a service life of 8 years, for the edges of aluminum wires from the AC50 cable with a service life of 20 years and for the bulk of aluminum wires from the A50 cable after fatigue tests on tension [27]. At the same time, a decrease in the proportion of f=2 to the initial value in the new aluminum wire was observed for AC50 cable with a service life of 20 years, and a noticeable decrease in the proportion of f=2 grains with the smallest misorientation angle φmis = 2° was observed on the edges of aluminum wires from A50 cable after fatigue tests [27].
In the new Al wire of the AC50 cable, LAGBs with misorientation angles of 2° < φmis < 15° dominate (~3% at maximum) in the center of the cross-section, whereas HAGBs do it at the W-A and WC edges, especially for angles φmis = 40–60° (~2%, Figure 6a). According to [24,26], it means that in the center of the cross-section of the new Al wire, the grains tend to line up along one common direction, while the number of grains with arbitrary orientation increases at the edges. After 52 years of service, the number of LAGBs drops sharply at the center of the cross-sections in Al wire near the clamps (span 0/1) to ~1%, and the distributions of GBs at the center and at the edges almost coincide, showing a wide maximum of ~2% in the range φmis = 40–60° (Figure 6b). The Al wires after operation from quarter the span (1/4 span, Figure 6d) and half the span (1/2 span, Figure 6c) show broad peaks ~1.5–2% in the LAGBs and HAGBs regions in the center of the cross-section and at its edges. Thus, in the bulk of the Al wire along the entire span, the arbitrariness of grain orientation increases, although a sufficiently large number of grains remain far from the clamps, tending to align their crystal structures in one direction similar to at the edges.
For steel wire after 52 years of use as a core, the f=2 fraction of GBs with the smallest misorientation angle φmis = 2° (Figure 6e–h) at the center of the cross-section and at its C-W and C-W(2) edges near the clamps is close to that observed for new steel wire. Further, with an increase in the fraction of the span length, the dependence of f=2 on the part of the span in the center of the cross-section and in the contact areas C-W and C-W(2) qualitatively repeats the M-like variations of f=2 in the Al wire with minima near the clamps (0/1 and 1/1 span), maxima about a quarter spans (1/4 and 3/4 spans), and a half-span dip (1/2 span). However, for steel wire, the spread of minimum and maximum values of f=2 at the edges is ~2 times less than for aluminum wire, and the difference between the minimum of f=2 in the middle of the span is only ~0.3%–0.9% less at compared to the maximum at a quarter of the span length, that is, 3–10 times less than that of aluminum wire (Figure 7d).
The histograms of misorientation angles of GBs for steel wire before and after operation show the presence of two wide maxima ~2.5% in regions of the LAGBs and HAGBs, and there is practically no difference between the center of the cross-section and its edges (Figure 6–h). Only a slight decrease in the fraction of LAGBs to ~2% (at the maximum) is observed for the steel wire near the clamp and a slight increase in the fraction of LAGBs to ~3% at a quarter of the span. Thus, due to very small changes in the steel wire, a qualitative visual inspection of the histogram of the distribution of the misorientation angles does not reveal a noticeable effect of the alignment of GBs along one direction.
According to the variations in the histograms for aluminum and steel wires, which were described above, the quantitative dependences of the microstructure parameters associated with GBs (fraction f=2 of GBs with misorientation angle φmis = 2°, fraction fHAGB of GBs with misorientation angle φmis ≥ 15° (i.e., fraction of HAGBs), the average misorientation angle <φmisLAGB> of LAGBs, the average misorientation angle <φmisHAGB> of HAGBs, and the total average misorientation angle <φmis> of all GBs), qualitatively repeat W- or V-shaped curves (or their inverted M- and Λ-analogues) of alongside-span changes in mean grain sizes <Dgrain>, relative area Srelmax covered by 1.95 μm grains, average grain aspect ratio <AR>, and grain fraction fAR<3.2 with AR < 3.2 (cf. Figure 7a–l and Figure S7a–h of Supplementary Materials). Moreover, the scatter of the maximum values of the microstructure parameters in the steel wire, which is the core, is usually less than in the Al wire, although there is an exception, namely, the value of the average misorientation angle of HAGBs <φmisHAGB> showing a greater scatter along the span in steel wire compared to aluminum one, <φmisHAGB> = 34.34–41.12° vs. 38.34–38.83°, respectively.
3.4. XRD Results
Figure 8a–d present measured XRD patterns from Al wires of a new AC50 ACSR cable (the N0 wire) and of a similar cable after 52 years of operation in OPL, with the patterns taken at points of contact of wires either with the air (W-A) or with steel core wire (W-C) for different parts of the span (the wires N1, N2, and N3 for span parts ‘0/1’, ‘1/4’, and ‘1/2’, respectively). Figure 9a–d show similar XRD patterns of the steel wire that is the core of the AC50 ACSR cable and is in contact with the adjacent aluminum wire (C-W contact). The crystallographic data of all possible crystalline phases found in XRD analysis are summarized for convenience in Table S5 of Supplementary Materials. Table S6 contains estimates of the depth Tpen of X-ray penetration (Section 2.2) from which reflections of these phases occur with an intensity sufficient to register them with the Cu-Kα radiation used and the maximum Bragg angles of 2θBmax of the observed reflections. The evaluation assumed diffraction on a material consisting of these crystalline phases.
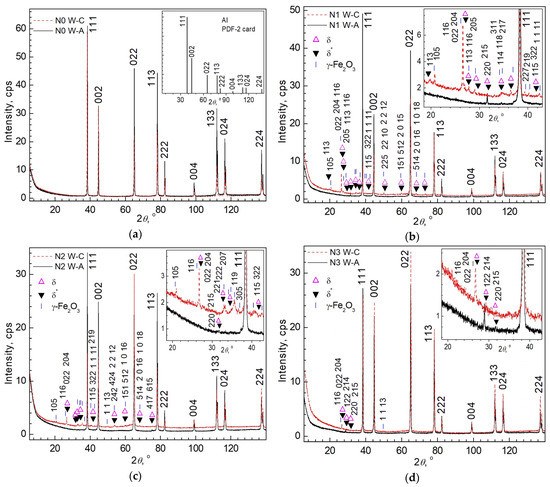
Figure 8.
XRD patterns of aluminum wires from AC50 ACSR-type cables: (a) new (non-used, N0) and (b–d) after service life of 52 years in OPL, cut from the span parts (b) 0/1 (N1), (c) 1/4 (N2), and (d) 1/2 (N3). W-A and W-C are contacts of the aluminum wire with atmosphere and steel core wire, respectively. Miller indices hkl of the Al reflections and of the selected reflections of crystalline phases attributed to the corrosion layer of the aluminum wires (labeled with different symbols) are indicated. Inset in (a) presents the theoretical XRD pattern of powder Al according to PDF-2 card 01-071-4008 with the unit cell parameters obtained at temperature Tmeas = 312.3 K comparable with the temperature of measurements Tmeas = 314 ± 1 K of the presented XRD patterns. Insets in (b–d) show the parts of XRD patterns in the range of 2θ = 18.5–43° on a larger scale.
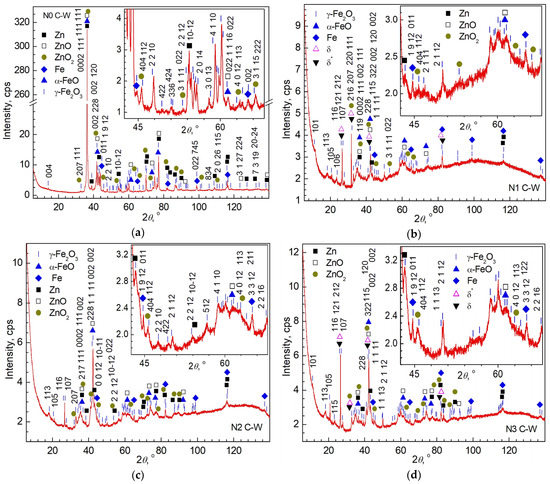
Figure 9.
XRD patterns of steel core wires from AC50 ACSR-type cables: (a) new (non-used, N0) and (b–d) after service life of 52 years in OPL, cut from the span parts (b) 0/1 (N1), (c) 1/4 (N2), and (d) 1/2 (N3). C-W is contact of the steel core wire with neighboring aluminum wire. Miller indices hkl of the selected reflections of the observed crystalline phases (labeled with different symbols) are indicated. Insets in (a–d) show the parts of XRD patterns in the range of 2θ = 42.5–68° on a larger scale.
3.4.1. XRD Results: Aluminum Wires
As expected and in agreement with [24,25,26,27], the new Al wire from the AC50 cable (Figure 8a) is characterized by an XRD pattern of polycrystalline aluminum containing only Al reflections (cubic space group (225), PDF- 2 cards 01-071-4008 and 01-073-9843, Refs. [55,56]) with different Miller indices hkl, regardless of whether this wire is in contact with the air (W-A contact) or with the steel core (W-C contact).
After 52 years of operation in the OPL cable, there appear a few weak reflections in addition to strong Al reflections in the XRD patterns of Al wires at the W-A contacts, which are attributable to aluminum oxides δ-Al2O3 (tetragonal space group P41212 (92), PDF-2 card 00- 056-1186, Ref. [51]) and/or δ*-Al2O3 (orthorhombic space group P222 (16), PDF-2 card 00-046-1215, Ref. [52]); see Figure 8b–d. Previously, the formation of reflections of the δ- and/or δ*-Al2O3 phases on the side of the Al wires exposed to the atmosphere (i.e., on the surface of the W-A contacts) was noted for the outer Al wires of the A50 cable with a service life of 8 to 62 years [24,25,26] and from the AC50 cable with a service life of 10 to 20 years [26]. Note that, in [24,25,26] as in the current study, Al wires were studied after operation in OPL cables in the Volgograd region of Russia.
XRD patterns from that side of the Al wires that were in contact with the steel core wire (the W-C contact) during 52 years of operation in the OPL cable also contain a number of weak reflections (greater if compared to the patterns taken at the side of the W-A contact) in addition to strong Al reflections (Figure 8b–d). Most of these reflections can be assigned to the δ- and/or δ*-Al2O3 phases or to γ-Fe2O3 (maghemite, tetragonal space group P43212 (96), PDF-2 card 01-089-5894, Ref. [57]). Since the reflections that can be indexed as reflections of the δ- and/or δ*-Al2O3 phases can also be attributed to the reflections of γ-Fe2O3 and, in addition, reflections are observed that are indexed only as γ-Fe2O3 (for example, reflections γ-Fe2O3 with Miller indices hkl = 105 and 1 1 13 in Figure 8b–d), it is most likely that most of these reflections (if not all) are γ-Fe2O3 reflections. This iron-oxide phase of γ-Fe2O3 is evident in the XRD patterns due to the quite noticeable corrosion layer on the W-C contact surface of the Al wires observed visually (OM images shown in Figure 1c and Figure S1b,d of Supplementary Materials). Moreover, the smallest number of reflections attributed to γ-Fe2O3 is seen in XRD patterns taken from the W-C contact of Al wires at the middle of the span (N3, 1/2 span, Figure 8d), where, according to EDX, the smallest number of Fe atoms is detected (6.18 wt.% in comparison to 13.12 wt.% for sample N1 (0/1 span) and 17.32 wt.% for sample N2 (1/4 span), see Table 3).
It should be recalled that, as estimates show (Section 2.2), in the case of aluminum and its oxides, the depth of penetration of X-rays into the material of Al wires, from which the recorded XRD reflections come, reaches Tpen = 36–37 μm. In the case of iron oxide γ-Fe2O3, if a homogeneous continuous material is formed, the maximum value is Tpen ≈ 4.4 μm. However, it is more likely that iron oxides are contained in the corrosion layer of the Al wires, where they enter from adjacent steel wires of the AC50 cable during the service in the OPL. Thus, γ-Fe2O3 reflections in XRD patterns from the sides of Al wires corresponding to W-C contacts can arise from iron oxide particles located at a greater depth up to ~37 μm as well.
Since Al reflections are strongest and well resolved in XRD patterns obtained from either a new wire or a wire after 52 years of operation (Figure 8a–d), this allows quantitative estimations of the structural and microstructural parameters of the Al material of wires, similar to that performed in [24,25,26,27]. The obtained values of the structural and microstructural parameters of the studied Al wires are summarized in Table S7 of Supplementary Materials and are presented graphically in Figure 10, Figure 11 and Figure 12 and Figures S8–S10 of Supplementary Materials.
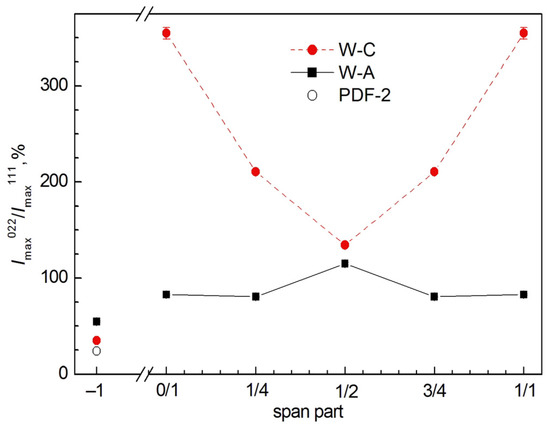
Figure 10.
The ratio of the maximum intensities of 022 and 111 Al reflections (Imax022/Imax111) for different span parts of AC50 cable after 52 years of operation in OPL. For comparison, data for new sample N0 (0 years of service life) are shown at the position designated as ‘–1’. At the same position ‘–1’, the Imax022/Imax111 value for the Al powder (PDF-2 card 01-073-9843) is also shown.
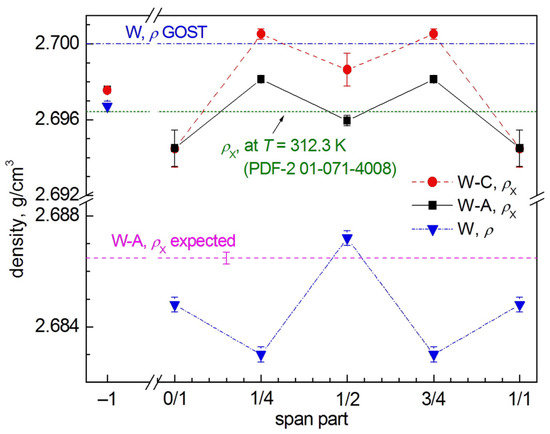
Figure 11.
XRD (ρX) and integral (ρ) mass densities of the aluminum wires W of AC50 cable taken at different span parts after 52 years of operation in OPL. XRD density ρX is shown calculated for NSL of surfaces contacted either with steel wire core (W-C) or the atmosphere (W-A). For comparison, data for new (0 years of service life) sample N0 are shown at the “–1” position. Horizontal lines show integral density ρ according to the GOST 839 [37] and XRD density ρX expected according to degradation law of Al wire density in AC50 cables from Ref. [26]. The measurements were carried out at Tmeas = 314 ± 1 K in the case of ρX and at room temperature in the case of densitometric measurements of ρ.
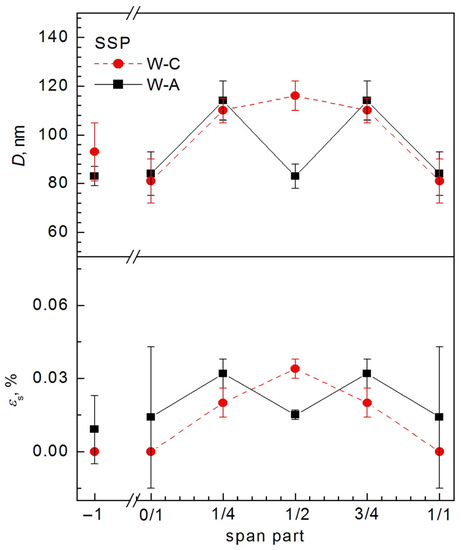
Figure 12.
Mean crystallite size D and absolute value of mean microstrain εs according to results of SSP analysis for the aluminum wires W of AC50 cable at different span parts after 52 years of operation in OPL. The values of D and εs are shown calculated for NSL of surfaces contacted with steel core (W-C) and atmosphere (W-A). For comparison, data for new sample N0 (0 years of service life) are shown at the position designated as ‘−1′. XRD measurements were carried out at Tmeas = 314 ± 1 K.
Previously, when studying Al wires from AC50 cables with a service life of up to 20 years [26] (the investigated wires were taken from unfixed places of the cable far from the clamps and removed from the outer layer, i.e., W-A contacts were studied), XRD patterns showed an increased intensity of Al reflections with Miller indices hkl = 022. Moreover, the effect of preferential orientation along the [011] Al direction was noticeably increased after 20 years of wire service. As can be seen from a comparison of the measured XRD patterns of Al wires with the theoretical XRD pattern of tabular Al powder from PDF-2 (cf. Figure 8a–d and inset in Figure 8a), the 022 reflection also has increased intensity in both the new wire and on all sections (0/1, 1/4, and 1/2 spans) and sides (W-A and W-C) of the tested wire.
As an example, Figure 10 shows the ratio of the maximum intensities of Al reflections 022 and 111, Imax022/Imax111, for the investigated new Al wire and wire after 52 years of operation, which can be considered a measure of the preferential orientation of Al crystallites in these wires. The change in the characteristic of the preferential orientation along the cable span for another Al reflection (ratio Imax002/Imax022) is shown in Figure S8 of Supplementary Materials.
The value of the Imax022/Imax111 ratio is increased compared to the tabular data for the Al powder already for the new N0 state of the Al wire (Figure 10, Imax022/Imax111= 35% and 55% for W-C and W-A sides, respectively, in comparison to 24% for PDF- 2 data from 01-073-9843 card and Ref. [56]). Moreover, for the W-A side in contact with the atmosphere, the deviation from the table value is noticeable, which is consistent with the previously obtained results [26] for the new Al wire from the AC50 cable.
After 52 years of operation in the OPL, the preferential orientation of the crystallites of the Al wire increases, which leads to a further increase in the value of Imax022/Imax111 in accordance with the results of [26] for wires after up to 20 years of service. At the same time, the increase in Imax022/Imax111 is most noticeable for the W-C side in contact with the steel core (≈134%–355% for the W-C side compared to 80%–115% for the W-A one, see Figure 10). However, the behaviors of the function of changing the value of Imax022/Imax111 along the OPL span for the W-A and W-C sides of the Al wire are opposite. The change function for the W-C side is characterized by a pronounced V-shape with a minimum at the middle of the span (1/2 span) and maxima at the edges (near the supports, span parts ‘0/1’ and ‘1/1’), whereas the W-A-side function shows a shape that in the first approximation can be described as Λ-shaped, i.e., with a maximum at the middle of the span and minima at the edges (Figure 10).
Figure S9 of Supplementary Materials and Figure 11 graphically represent, respectively, the obtained values of the parameter a of the cubic unit cell of the Al material of the investigated wires and their XRD mass density ρX calculated from a with Formula S3 of Supplementary Materials. As noted in Section 2.2, in the case of the XRD method, these characteristics of the Al material correspond to the NSL of an Al wire with a thickness equal to the penetration depth of the used Cu-Kα radiation, Tpen ≈ 36 μm.
In the new state, the values of the parameter a of the cubic unit cell of the Al material and, correspondingly, the values of its XRD mass density practically coincide for the sides in contact with air (W-A) or with the steel core (W-C), ρX0 ≈ 2.6975 g/cm3 at Tmeas = 314 ± 1 K (see Table S7 and Figure S9 of Supplementary Materials and Figure 11). This value ρX0 is noticeably smaller than the mass density of Al wires according to GOST 839 [37] ρX GOST ≈ 2.700 g/cm3 (at 298 K) and tabular mass density ρX table ≈ 2.7043 g/cm3 of Al powder at 312.3 K, which can be calculated from the value atable = 4.05069 Å according to the PDF-2 card 01-071-4008 [55].
For an Al cubic unit cell, ρX ∝ 1/a3 (see Formulas S3 and S4 in Supplementary Materials), it suffices to consider the course of change along the span for only one characteristic, for example, ρX. The second characteristic (parameter a) will behave in the opposite way, i.e., a increases where ρX decreases and vice versa (cf. Figure S9 of Supplementary Materials and Figure 11). The change in the parameter a of the Al material of wires along the span between OPL supports is described in Section S2.4 of Supplementary Materials.
Next, let us consider the dependence of the function of change ρX depending on the position of the span. As in [26] for Al wires (side W-A in contact with air) from the AC50 cable after 20 years of operation, density ρX of the W-A side of aluminum AC50 wire after 52 years of service at span parts ‘0/1’, ‘1/1’, and ‘1/2’ (respectively, the edges and the middle of the span) decreased, was stronger at the edges of the span, and increased by 1/4 and 3/4 of the span (ρX ≈ 2.6945 g/cm3 at the edges of the span, ≈2.6960 g/cm3 at the middle, and ≈2.6981 g/cm3 for 1/4 and 3/4 spans). Thus, the dependence of ρX on the position of the span has an M-shape, alternately increasing and decreasing from the edge through each quarter of the span between the OPL supports. For the W-C side in contact with the steel core, the change in ρX along the span also follows an M-shaped law but with a larger difference between the maximum and minimum values (ρX ≈ 2.6945 g/cm3 at the span edges, ≈2.6986 g/cm3 at the middle, and ≈2.7005 g/cm3 for 1/4 and 3/4 spans; see Figure 11). Accordingly, the parameter a of the cubic cell of the Al material of wires on the sides W-A and W-C, i.e., the crystal lattice of the Al material of NSL of aluminum wires, shows W-shaped variation along the span with differing ranges of the variation, alternately shrinking and expanding every quarter span between OPL supports.
Note that after t = 52 years of XRD operation, the mass density ρX of Al wires in all span parts and on both sides, W-A and W-C, is greater than the expected XRD density ρXexp = 2.6865(2) g/cm3 estimated under the assumption that the linear degradation law ρXexp = ρX0 + vρX·t is valid, where vρ = 2.13(7)·10−4 g/(cm3·year) and t is the service life obtained in [26] for aluminum W-A wires with service life from 0 to 20 years.
When describing the results of the analysis of the measured XRD patterns of Al wires, the last, but not least, issues we dwell on are the parameters of their microstructure on the scales of ~0.003–0.3 μm (average size D of crystallites, i.e., regions of coherent X-ray scattering, and the absolute average value of microstrains εs in them).
The dependence functions of the average size D0 of crystallites, estimated in the model of the absence of microstrains (εs = 0), on the position on the span, show an M-shaped appearance for both sides (W-A and W-C) of Al wires; however, the e.s.d.s values of D0 are too large (Figure S10 of Supplementary Materials), which could be associated not only with the experimental e.s.d.s of the determined values of FWHMcorr but also with the presence of the contribution of microstrains to the broadening of reflections.
Indeed, the calculated SSP plots [43] (Figure S11b,d,f,h,j,l, Table S7, and Section S2.4 of Supplementary Materials. During the SSP calculations coefficients KScherrer = 0.94 and Kstrain = 4 of, respectively, Scherrer and Wilson–Stokes equations were used) confidently showed the presence of non-zero microstrains εs for most of the samples while the WHP method [42] in most cases led to εs = 0. However, the WHP method is much less sensitive to the presence of εs (see [43]) and is characterized by higher e.s.d.s values of the determined quantities D and εs. This is a consequence of a noticeably larger scatter of the WHP experimental points around the approximating straight line (Figure S11a,c,e,g,i,k of Supplementary Materials) in comparison with SSP and is expressed by a low value of the determination coefficients [41,43] (Rcod = 1.59–52.04% in case of WHP vs. 92.97–99.50% for SSP). Therefore, further in the text, we will take into consideration the results of SSP.
Figure 12 graphically shows the D and εs values for the W-A and W-C sides of Al wires, obtained from SSP analysis for unused samples and for span parts of the OPL cable between towers after 52 years of operation.
On the W-A and W-C sides of a new unused N0 wire, the average crystallite size D is ~83–93 nm, and the microstrain is zero or close to zero (εs = 0–0.009(14)%; see Figure 12 and Table S7 of Supplementary Materials). These near-zero εs results are in good agreement with the previously obtained values εs = 0–0.007(11)% in [26] for the W-A side of the Al wire from the new AC50-type cable. The values of D in the N0 sample are about 1.6 times smaller, which is probably due to the difference in the batches of wires made by the manufacturer. Previously [26], for an Al wire (W-A side) after 8 years of operation in the AC50 cable, an increase in the crystallite size from D ≈ 138 nm to D ≈ 219 nm in the new state was observed, which was replaced by a drop to D ≈ 167 nm after 20 years of use (SSP data). As one can see from Figure 12, the values of D and εs change along the span after 52 years of operation of Al wires. The D dependence on the position on the span has an M-shaped form for the W-A side, as the values of D = 84(5) nm and 83(5) nm, respectively, at the edges and in the middle of the span (span parts ‘0/1’, ‘1/1’, and ‘1/2’) are almost equal to the value of D = 83(4) nm for the W-A side of a new wire, increasing to D = 114(8) nm at positions of 1/4 and 3/4 of the span. The change in microstrain along the span for the W-A side is also characterized by an M-shaped function with minima εs = 0.014(29)% and 0.015(2)% at the edges and in the middle of the span and maxima 0.032(6)% at the 1/4 and 3/4 span. For the W-C side, both parameters, D and εs, change along the span, following a Λ-shaped law or close to it, increasing from D = 81(9) nm and εs = 0 at the span edges to D = 116(6) nm and εs = 0.034(4)% in the middle.
3.4.2. XRD Results: Steel Wires
Unlike the new Al wire, whose XRD pattern contains only Al reflections, the XRD pattern from the new N0 steel wire (contacting adjacent Al wires in the AC50 cable, contact C-W) includes a large set of reflections of varying intensity and varying overlap degrees (Figure 9a). The strongest-intensity reflections can be attributed to the reflections of Zn phase (hexagonal space group P63/mmc (194), PDF-2 card 01-080-4436, Ref. [58]) and ZnO one (cubic space group (225), PDF-2 card 01-073-8589, Ref. [59]). The same strong reflections and a large number of weak ones can be reflections of ZnO2 (cubic space group (205), PDF-2 card 01-076-1364, Ref. [60]) and α-FeO (cubic space group (225), PDF-2 card 01-080-3819, Ref. [61]). Moreover, there is a large set of weak but noticeable reflections attributed to γ-Fe2O3 (tetragonal space group P43212 (96), PDF-2 card 01-089-5894, Ref. [57]) and Fe (cubic space group (229), PDF-2 card 00-006-0696, Ref. [62]). The presence of reflections of Zn and zinc oxides is expectable, since steel, whose main material is Fe, was plated with a zinc layer with a nominal thickness of several tens of nanometers, whereas the depth Tpen at which XRD reflections related to Zn, ZnO, and ZnO2 is ≈8.6 μm to ≈19.0 μm depending on the observed maximum Bragg angle 2θBmax of the reflections of these phases (Table S6 of Supplementary Materials). The XRD pattern of the new steel wire (Figure 9a) also contains reflections that can be attributed to Fe and Fe oxides, namely, α-FeO and γ-Fe2O3 (estimated values of Tpen are varied from ≈1.7 μm to ≈4.5 μm depending on the observed values of 2θBmax of the corresponding reflections, see Table S6 of Supplementary Materials). The presence of reflections of Fe and its oxides correlates well with the EDX results, confirming the presence of Fe atoms in the near-surface layers of the new steel wire (Table 3), indicating that already in the new state, the protective galvanic zinc layer of the steel wire is broken.
After 52 years of service as the core in an AC50 cable of OPL, the steel-wire XRD patterns over the entire span change dramatically (Figure 9b–d). The strong reflections that were attributed to Zn, ZnO, ZnO2, and α-FeO practically vanish, all of the observed reflections becoming either weak or medium in intensity. Only a small portion of the reflections can be attributed to Zn, ZnO, ZnO2, and α-FeO, although the number of reflections of the γ-Fe2O3 phase increasing. Apparently, in the corrosion layer of the steel core wire at the locations near the clamps (sample N1_C-W, 0/1 span) and in the middle of the span (sample N3_C-W, 1/2 span), aluminum oxide phases δ*- and δ-Al2O3 appear, perhaps from the corrosion layer of Al wires in contact with the steel core. It is worth noting that, taking into account the possible change in the unit cell parameters, reflections with the Bragg angles 2θ = 26.86° and 42.42° in the XRD pattern of the N2_C-W sample (1/4 span) can be interpreted as reflections of the δ*-/δ-Al2O3 phases (121/212 and 115/322, respectively). However, since, unlike samples N1_C-W and N3_C-W, the EDX spectra of samples N2_C-W did not show the presence of Al (Table 3), the presence of some aluminum-oxide phases in the corrosion layer of sample N2_C-W was not assumed.
It should also be noted that if, in the case of the γ-Fe2O3 phase, XRD patterns contain reflections that can be ascribed only to this phase (for example, γ-Fe2O3 reflections with Miller indices hkl = 004, 2 2 10, 422, 4 1 10 and others), then, for other phases (Zn, ZnO, ZnO2, Fe, α-FeO, δ*- and δ-Al2O3), the reflections are superimposed and can also be described as related only to γ-Fe2O3. However, based on the elemental composition (cf., the EDX results), the presence of all these phases cannot be ruled out.
As can be seen from the qualitative X-ray-phase analysis, the XRD patterns of steel core wire samples are very difficult for quantitative analysis due to the large number of overlapping reflections of different crystalline phases. In addition, the new sample N0_C-W and the samples N1_C-W, N2_C-W, and N3_C-W after 52 years of operation differ greatly in the number of reflections and their identification with respect to belonging to different phases. Due to the above reasons, the quantitative analysis of XRD patterns of steel wires seems to be laborious and has not been carried out.
3.5. Results of Densitometry Measurements
The numerical values of the integral mass density ρ of all investigated aluminum and steel wires, obtained through densitometric hydrostatic weighing, are summarized in Table S1 of Supplementary Materials. The same results are illustrated graphically as a function of relative span length for aluminum (Figure 11) and steel (Figure 13) wires.
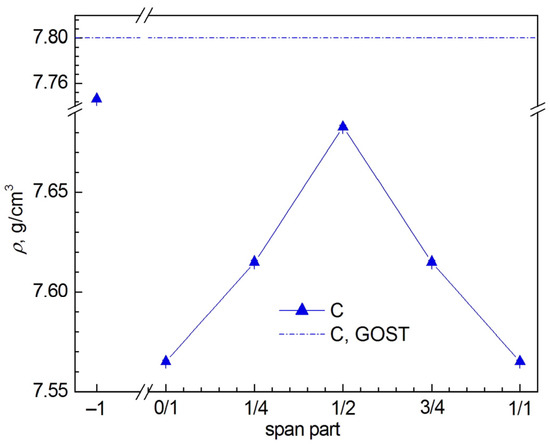
Figure 13.
Integral mass density ρ of the steel cores C of AC50 cable taken at different span parts after 52 years of operation in OPL. For comparison, data for new (0 years of service life) sample are shown at the “–1” position. Moreover, integral density ρ is shown by a horizontal line according to the International Technical Standard GOST 839 [37]. The measurements were carried out at room temperature.
As can be seen from the qualitative X-ray-phase analysis, the XRD patterns of steel core wire samples are very difficult for quantitative analysis due to the large number of overlapping reflections of different crystalline phases. In addition, the new sample N0_C-W and the samples N1_C-W, N2_C-W, and N3_C-W after 52 years of operation differ greatly in the number of reflections and their identification with respect to belonging to different phases. Due to the above reasons, the quantitative analysis of XRD patterns of steel wires seems to be laborious and has not been carried out.
The integral density ρ of wires of both types drops significantly after 52 years of service in an OPL cable, apparently due to the influence of various processes, namely, the formation of void defects due to fretting effects, wire stretching under the action of oscillations and vibrations due to wind, atmospheric and galvanic corrosion, and the formation of oxides of zinc and iron, which are characterized by a lower mass density than the corresponding metals, and aluminum oxides, whose effect is reversed (the mass density of alumina is greater than that of pure Al). A greater decrease in the integral density of steel wire compared to aluminum may be explained by the action of all factors listed above in the case of steel wires, whereas for Al wires, the formation of the Al2O3 oxide is an “opposite” factor, slightly increasing the density.
3.5.1. Results of Densitometry Measurements: Aluminum Wires
For Al wires (Figure 11) there is a moderate decrease in the integral mass density ρ compared to the nominal passport value from GOST 839. Most strongly (by 0.63(1)%) ρ decreases at a quarter of the span (N2_W, 1/4 span), slightly less (by 0.56(1)%) at the beginning of the span near the clamp (N1_W, 0/1 span) and, as and in the case of steel wires, it decreases minimally (by 0.47(1)%) at half the span (N3_W, 1/2 span). It is also worth noting a trend that the integral mass density ρ of Al wires is systematically less than the XRD mass density ρX (by 0.36(4)–0.56(1)% for the W-A contacts and by 0.36(4)–0.65(1)% for the W-C contacts); that is to say, the mass density averaged over the volume and NSL (integral density ρ) is less than the mass density of the NSL alone (XRD density ρX). Moreover, the course of change in ρ along the cable span in OPL is the reverse of the course of change in ρX, namely, where the XRD density ρX increases, there, the integral density ρ decreases, and vice versa (Figure 11). The Al wire at the middle of the span shows the value, which is closest to the value of the integral mass density in the new Al wire, namely, ρ = 2.6872(3) g/cm3 (sample N3_W, 1/2 span) versus ρ = 2.6967(3) g/cm3 in the N0_W sample. Near the supports, the density is less, ρ = 2.6848(3) g/cm3 (sample N1_W, 0/1 span), and at a quarter of the span, it is even less (ρ = 2.6830(3) g/cm3, sample N2_W, 1/4 span). Thus, for Al wire, the integral density ρ is characterized by a W-shaped course along the span with an increased maximum at the middle of the span (1/2 span) in contrast to the XRD density ρX, which corresponds to the mass density of NSL with a thickness of ~36 μm and shows an M-shaped change in the value of ρX along the span between the OPL clamps. As a result, the change in ρ along the span appears to be similar both to a change in the average grain size <Dgrain> along the span in the middle of the cross-section of the Al wire and at its edges and to a Λ-shaped change in the integral mass density ρ of the steel wire along the span (cf. Figure 7a, Figure 11 and Figure 13).
3.5.2. Results of Densitometry Measurements: Steel Wires
The reduction in the integral mass density ρ (see Figure 13) is the strongest for the steel wire near the clamps (near the supports OPL, N1_C, 0/1 span), namely, by 3.01(1)% compared to the nominal mass density in the new steel wire according to GOST 839, and gradually decreases to 1.50(1)% for steel wire at half span of the OPL (N3_C, 1/2 span). Accordingly, as in the case of Al wire, the integral mass density ρ = 7.6828(8) g/cm3 of steel wire at half the span (sample N3_C, 1/2 span) becomes as close as possible to the value ρ = 7.7462(8) g/cm3 of the new sample N0_C and turns out to be minimum near the supports (ρ = 7.5650(8) g/cm3 for N1_C, 0/1 span). Furthermore, when moving away from the middle of the span, the value of ρ decreases again when approaching the next OPL support, mirroring the change in the first half of the span length. As a result, the integral density of the steel core wire changes along the OPL span from one clamp to the next one according to a Λ-shaped law with a maximum at the middle of the span (1/2 span).
3.6. Results of Acoustics Measurements
Using the acoustic method of a composite vibrator at frequencies of about 100 kHz, which correspond to the resonant frequency of the samples with l ≈ 25 mm for aluminum wires and l ≈ 27 mm for steel ones, the properties of the aluminum and steel wires of the AC50 cable were studied, including elastic (Young’s modulus E, also called the modulus of elasticity), inelastic (internal friction, also called the logarithmic decrement δ), and microplastic (microplastic deformation, also called the vibrational-stress amplitude σ) ones.
Young’s modulus E and elastic vibration (attenuation) decrement δ were measured in the range of vibrational deformation amplitudes ε from ~10−6 to 3 × 10⁻⁴ and (0.25–2) × 10−4 for aluminum and steel wires, respectively. This range includes both amplitude-independent and -dependent (at large ε) regions. In the amplitude-independent region, the recorded values of E and δ are practically independent of the value of ε and are denoted by the index ‘i’ as, respectively, Ei and δi. According to the obtained dependence E(ε), diagrams of microplastic strain σ(εd) were constructed. Here, the vibrational stress σ was obtained by multiplying E by ε according to Hooke’s law, and εd is the nonlinear inelastic deformation calculated by multiplying the vibrational deformation ε by Young’s modulus defect (ΔE/E)h (relative Young’s modulus corrected by Ei, see Section S1 of Supplementary Materials).
Figure 14a,b show the dependences of Young’s modulus E(ε) and decrement δ(ε) on the amplitudes of applied vibrational deformation ε, which were measured for the studied aluminum and steel samples. Figure 15a,b present the respective microplastic deformation diagrams σ(εd).
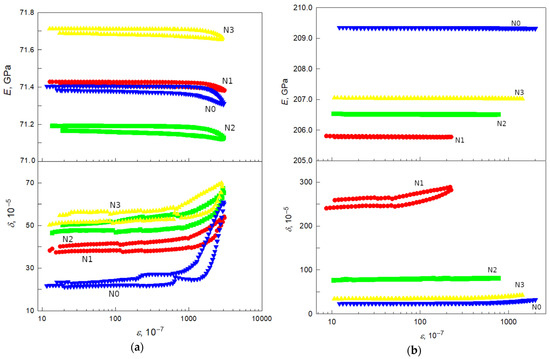
Figure 14.
Amplitude dependences of Young’s modulus E and decrement δ of (a) aluminum and (b) steel wires for samples N1 (0/1 span), N2 (1/4 span), N3 (1/2 span) after 52 years of service life in OPL AC50 cable, and N0 (from new AC50 cable). The measurements were carried out at room temperature.
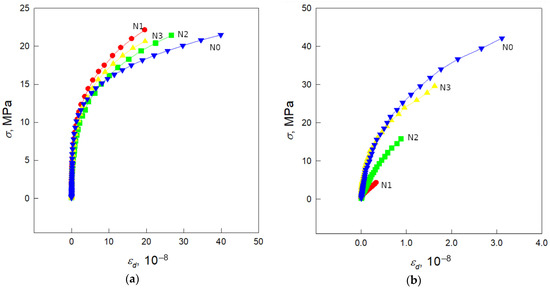
Figure 15.
Microplastic deformation diagrams σ(εd) of (a) aluminum and (b) steel wires for samples N1 (0/1 span), N2 (1/4 span), N3 (1/2 span) after 52 years of service life in OPL AC50 cable, and N0 (from new AC50 cable). The measurements were carried out at room temperature.
It should be noted that E is practically independent of the vibrational deformation amplitude ε in a wide range (from ε ~10−6 to ε ≈ 2·10−4 in Figure 14a,b), and, therefore, when considering Young’s modulus not as dependent on ε, E(ε) but as a parameter of elastic properties of the bulk, the amplitude-independent quantity Ei is given in the literature (and in this paper) without any index but just as E.
Figure 16a,b show the values of the amplitude-independent Young’s modulus E = Ei and the decrement δi as well as the microplastic flow stress σs (the value of σ at a fixed nonlinear inelastic strain εd = 1·10−8 and εd = 3·10−9 for aluminum and steel wires, respectively) for samples, depending on the relative location on the cable span. The numerical values of E, δi, and σs, which are shown graphically in Figure 16a,b, are summarized in Table S8 of Supplementary Materials.
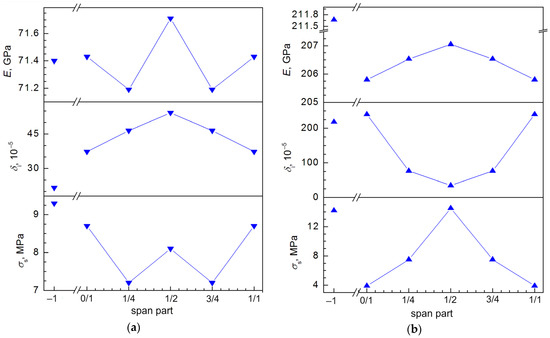
Figure 16.
Dependences of (amplitude-independent) Young’s modulus E, amplitude-independent decrement δi, and microplastic flow stress σs for (a) aluminum and (b) steel wires on span part of a cable operated 52 years in an OPL. For comparison, data for new samples (N0_W and N0_C, 0 years of service life) are shown at the position of span part designated as ‘–1’. The data were obtained from the acoustics measurements at room temperature.
3.6.1. Results of Acoustics Measurements: Aluminum Wires
For Al wire after 52 years of service in the OPL, the elastic (E), inelastic (δi), and microplastic (σs) deformation behaviors are complicated (Figure 16a), probably reflecting the influence of several opposing processes. Compared to the new N0_W aluminum wire, the microplastic strain values σs are higher and the decrement δi is lower for Al wire after 52 years of operation in OPL cable over the entire span (σs = 9.3 MPA and δi = 21.6 in N0_W compared to σs = 7.2–8.7 MPa and δi = 37.3–54.2 in different parts of the span of Al wire after operation). The amplitude-independent decrement δi of the Al wire shows a smooth increase as one moves from an OPL support to the middle of the span. In contrast, the values of Young’s modulus E and microplastic stress σs show not a gradual increase but a dip to a minimum value at a quarter of a span, followed by a rise when moving toward half a span. Moreover, at half the span, the value of Young’s modulus of the N3_W-C aluminum sample after 52 years of operation is even slightly higher than that of the new N0_W aluminum wire (cf. E = 71.71 GPa and 71.40 GPa, respectively). Thus, for aluminum wire in contrast to the steel one, the independent decrement δi changes along the span between the OPL supports according to the Λ-shaped law, whereas E and σs change according to the W-shaped law. However, as in the case of the integral mass density ρ of the Al wire, the change in E is close to Λ-shaped due to the increased value of E at the middle of the span, that is to say, similar to the change in the average grain size <Dgrain> in the middle and at the edges of the cross-section of Al wire (cf. Figure 7a, Figure 13 and Figure 16a).
3.6.2. Results of Acoustics Measurements: Steel Wires
As can be seen from Figure 16b, for steel wire, the change in elastic (E), inelastic (δi), and microplastic (σs) deformation parameters occurs smoothly, with E and σs increasing while δi decreases from the first support (sample N1_C, 0/1 span) to the middle of the span (N3_C, 1/2 span) and the tendency changing to a decrease (E and σs) or an increase (δi) when moving toward the next support (1/1 span). Though there is a tendency to increase in E as one moves from the supports to the middle of the span for steel wire after operation, the value of Young’s modulus in the new steel wire (N0_C) is noticeably higher compared to the values at all parts of the span (cf. E = 211.67 GPa for N0_C in comparison to E = 205.80 GPa and 207.05 GPa for N1_C (0/1 span) and N3_C (1/2 span), respectively). The microplastic flow stress σs = 14.2 MPa for the new N0_C steel wire is also significantly higher than that in the vicinity of the OPL supports (σs = 3.9 MPa for N1_C, 0/1 span) in the cable after operation, but toward the middle of the span, the value of σs gradually increases to the value close to σs in the new sample (for N3_C, 1/2 span, σs = 14.5 MPa). In contrast, the value of the decrement δi = 34.3 for N3_C at the middle of the span is drastically less than δi = 218 for the steel wire N0_C in the new state but gradually increases when approaching the supports to a close, though somewhat larger, value δi = 240 for N1_C (0/1 span). As a result, for a steel core wire, the change in Young’s modulus E and microplastic stress σs along the span between OPL supports is described by a Λ-shaped function with a maximum at the middle of the span (1/2 span), which is similar to that observed for the integral density of steel wire (cf. Figure 13 and Figure 16b). At the same time, the change in the independent decrement δi along the span follows a parabolic law with a minimum at the middle of the span (1/2 span), which can also be considered as a V-shaped one.
4. Discussion
4.1. Corrosion Layer in the OM Images
So, aluminum and steel wires of ACSR AC50 cable after 52 years of use in OPL show corrosion signs clearly visible in OM images. In the case of the outer side of W-A aluminum wires, corrosion appears in the form of numerous pits and a duller color compared to new wires. The contacting surfaces W-C of aluminum wires and C-W of steel wires are covered with a thick corrosive layer of black color for Al wires and dark rusty for steel ones. As noted in Section 3.1, this pattern sharply differs from what has previously been observed for the W-A sides of Al wires (in contact with the atmosphere) from AAAC A50-type cables (with an Al-wire core) with a service life of up to 62 years [24,25] and from ACSR AC50-type cables (with a steel core) with a service life of up to 20 years [26], operated in the same climatic conditions of the Volgograd region of Russia. In these Al wires, no noticeable corrosion signs were found, although initial stages of corrosion were observed in the form of several pits on the surface up to ~10–20 μm deep (for A50 and AC50 cables) [25] and sporadic rusty spots (in wires from AC50 cables).
Pits on the air-contact surface (W-A) appear to be apparently the result of atmospheric corrosion [5,11,14,15]. The depths of the pits in the upper aluminum layer are somewhat greater and come up to ~200 μm, reach ~150 μm in the layer second from the surface, and are ~50 μm in the last third aluminum layer and in the adjacent steel layer of the core of the thicker ACSR cable investigated by [14] after 40 years of service at OPL in the Czech Republic (three layers of aluminum wires and steel core made of one layer of steel wires and three central steel wires). In [11], the depths of pits on the surface of the outer aluminum wires of an ACSR cable (two outer aluminum layers and a steel core made of one inner layer of steel wires and a central steel wire) reached ~100 μm after 61 years of operation in northern France, while corrosion pits were not noted in the inner aluminum layer due to the protective effect of grease. For an identical ACSR cable after operation in Lechan, Sichuan Province of China (service life not specified), the depths of corrosion pits on the outer aluminum layer reached ~50 μm and ~20 μm on the inner layer [15].
In the samples described in this study, as well as in [11,14,15], in addition to pits on the W-A surface of the outer aluminum wires due to atmospheric corrosion, a sufficiently thick corrosion layer was observed on the contact surfaces of aluminum and steel wires (contacts W-C and C-W, respectively) of the studied samples. The formation of a layer consisting of corrosion outcomes is obviously the result of galvanic corrosion [11,15]. Galvanic corrosion of cable wires occurs due to the formation of an electrolyte solution between the Al wires and the steel core of the cable under high voltage, when water either penetrates the cable from the surrounding atmosphere or is formed as a result of oxidation and chemical decomposition of the grease, which covered the steel core and the surfaces of the Al wires in contact with it [11].
As discussed in Section 3.1, measurements have shown that Al wire N2_W-C taken from a cable cut at 1/4 span length has a thicker corrosion layer with a thickness Tcorros = 16–20 µm (same thickness as in steel wires N2_C-W (1/4 span) and N1_C-W (0/1 span) of the core) compared to Al wires N1_W-C (0/1 span) and N3_W-C (1/2 span) with thicknesses Tcorros = 1–2 μm and Tcorros = 1–3 μm, respectively. Also, steel wires N2_C-W (1/4 span) and N1_C-W (0/1 span) of the core are characterized by an identically thick corrosion layer (Tcorros = 16–20 μm) with a slightly lower value of Tcorros = 12–16 μm in the middle of the span (N3_C-W, 1/2 span). These thicknesses of oxide-corrosion layers in the studied samples show values similar or smaller compared to data in [11,14,15] (Tcorros ~ 5 μm for aluminum wires of the outer layer and Tcorros ~ 20 μm for steel core wires in contact with aluminum wires [11], Tcorros ~50 μm in the outer aluminum layer versus Tcorros ~20 μm in the inner one [15], and Tcorros ~10 μm–15 μm on the surface of aluminum wires of the outer layer [14]). The difference in the depths of the pits caused by atmospheric corrosion and the thicknesses of the corrosion layer because of galvanic corrosion in the studied samples and in [11,14,15] are obviously related to the different diameters and compositions of the investigated ACSR cables, as well as to different durations of use and climate and compositions of the atmosphere of the area of their operation.
It was noted in [7] that various wire defects arising in the manufacture of OPL cables might lead to a reduction in their service life. Such a reduction in lifetime can also occur due to corrosion of the cable wires due to defects that contribute to corrosion and are initially present in these wires after manufacture. Such defects, for example, may include scratches that violate the integrity of the protective amorphous alumina layer of the Al wire and/or some breaches of the integrity of the galvanic Zn layer of the steel wire, as a result of which the Al and Fe materials of the corresponding wires can directly come into contact with each other and undergo enhanced corrosion.
Possibly, the thicker corrosion layers observed on Al wire N2_W-C (1/4 span) and on steel wires N2_C-W (1/4 span) and N1_C-W (0/1 span) are due to defects in these wires and/or in the wires in contact with them, originally existent after manufacture. Another possible cause of thicker corrosion layers of contacting aluminum and steel wires at 1/4 span and near the clamps (0/1 span) is the faster aging of the wires in these areas when used in OPL due to a combination of mechanical effects of wind at varying temperature and humidity.
4.2. Correlation between the Results of EDX and X-ray Phase Analyses for Aluminum and Steel Wires
4.2.1. New Aluminum and Steel Wires
As one can see from Table 3, the main element in the new Al wire either on the outer surface or in the bulk is Al (90.13 wt.% and 97.91 wt.%, respectively). At the same time, the oxygen content on the outer surface of the new Al wire is almost four times greater (7.80 wt.%) than that in the bulk, although the XRD patterns show only Al reflections in the cases of the W-A and W-C sides in contact with either the atmosphere or the steel core wire, respectively (Figure 8a). Obviously, the increased content of oxygen on the surfaces of the wires is due to the presence of a protective amorphous alumina layer. Slight contamination with S and Cl (≈1 wt.%) apparently appeared during the cable-manufacturing process, although, according to the International Technical Standard GOST 11069 [63], these elements should be absent in the A7E aluminum material from which the wires were made. In XRD patterns, S or Cl or their oxides do not appear; that is, they are X-ray amorphous.
On the outer side of the new steel wire, in addition to 75.44 wt.% Zn from the galvanic layer covering the wire, there is also a noticeable additive of Fe (4.28 wt.%), which probably indicates an initial violation of the integrity of the protective galvanic layer. A small amount of Al (0.99 wt.%) apparently appeared from adjacent Al wires during cable manufacture when the wires were twisted around the steel core wire. And, finally, there is a rather high content of O (19.29 wt.%), which indicates at least partial oxidization of the electroplated Zn layer and, possibly, the oxidization of Fe and Al polluting this Zn layer. As noted in Section 3.4.2, apart from reflections attributable to crystalline Zn (from the galvanic layer) and Fe (from the material of the wire itself, probably because of disruption of the galvanic layer), the XRD patterns of the steel wire already in the new state (N0_C-W, Figure 9a) show reflections of oxides ZnO, ZnO2, α-FeO, and γ-Fe2O3 crystallizing within the galvanic layer, which is probable taking into account the X-ray penetration depth Tpen from ≈1.7 μm to ≈16.5 μm for the observed crystalline phases and the maximum Bragg angles of their reflections (Table S6 of Supplementary Materials). In other words, the galvanic layer already in the new steel wire probably has violations and is contaminated with iron and iron and zinc oxides.
4.2.2. Aluminum and Steel Wires after 52 Years of Operation in OPL
First of all, we note that, taking into account the thicknesses of the corrosion layers (Tcorros = 1–16 μm for Al wires and Tcorros = 12–20 μm for steel wires; see Section 3.1) and the NSL thickness with which the EDX signal is recorded (from ~1 μm for steel wires and ~3 μm for Al ones; see Section 2.2), the EDX analysis actually reflects the elemental composition of the corrosive wire layer in the case of the surface near the contact of aluminum wire with steel one (W-C contact) and steel wire with aluminum one (C-W contact). In the case of the W-A surface of Al wires exposed directly to the atmosphere, EDX analysis gives the elemental composition of Al-wire NSL with a thickness of ~3 μm. Similarly, in the case of XRD at a penetration depth of up to Tpen ≈ 36 μm for Al material, the observed reflections of Al and δ- and/or δ*-Al2O3 oxides from the W-A sides of the Al wires refer to the Al-wire NSL with a thickness of ~36 μm. In turn, iron and zinc oxides, which are characterized by low Tpen (Table S6 of Supplementary Materials), apparently belong to the corrosion layer of steel wires.
As one can see from Table 3, according to the results of EDX analysis of faceted wire sections, the content of Al in the bulk of Al wires practically does not change with the duration of operation and across parts of the span (97.91 wt.% in the new wire N0_W and 97.94 wt.%, 97.81 wt.%, and 98.01 wt.% in samples N1_W, N2_W, and N3_W, respectively). In the bulk of the steel wires, the Fe content changes slightly, decreasing from 99.14 wt.% in the new N0_C wire to 99.02 wt.%, 99.07 wt.%, and 98.98 wt.% in the N1_C, N2_C, and N3_C samples, respectively.
The main changes in the elemental composition occur on the wire surfaces. For the outer sides of W-A aluminum wires after service in the AC50 OPL cable for 52 years, EDX analysis (Table 3) shows an increase in O content from 7.80 wt.% in the new wire to 26.58–37.01 wt.% after operation and a corresponding decrease in the Al content. This increase in the weight content of oxygen is explained by the formation of crystalline oxides, δ- and/or δ*-Al2O3 (see XRD patterns in Figure 8b–d), as was previously observed [24,25] for the W-A sides of Al wires from A50 and AC50 cables after operation in the OPLs in the Volgograd region of Russia. Perhaps because of violations of the protective amorphous alumina layer of Al wires as a result of fretting during operation, Al from the wire material is exposed to the air and climatic fluctuations in temperature and humidity, resulting in the appearance of δ- and/or δ*-Al2O3 oxides.
According to the results of the EDX analysis (Table 3), the W-C contact surfaces, and in fact, the corrosion layers of all studied Al wires used in the AC50 OPL cable, contain a noticeable amount of Fe and O atoms. The highest content of Fe, 17.32 wt.%, was noted for sample N2_W-C (1/4 span), somewhat less at the beginning of the span (13.12 wt.% in the sample N1_W-C from 0/1 span), and the lowest Fe content, 6.18 wt.%, was in sample N3_W-C (1/2 span). Obviously, Fe atoms appeared in the corrosion layer of aluminum wires from the material of the steel wire core during operation because of the destruction of the protective amorphous aluminum-oxide layer of Al wires and the galvanic zinc layer of steel wire as a result of the fretting phenomenon (rubbing of wires against each other) caused by vibrations and cable oscillations under the influence of wind. Due to the influence of environmental humidity, water molecules penetrated inside the cable and led to the appearance of iron oxide γ-Fe2O3 in the corrosion layer of aluminum wires at the point of contact with the steel wire of the core (contact W-C). Analogously, EDX analysis detects the appearance of 4.77 wt.% and 11.35 wt.% of Al in the corrosion layer of serviced steel wire at the beginning of the span (sample N1_C-W) and at midspan (N3_C-W), respectively, while at the quarter-span (N2_C-W), aluminum was not detected. In this case, the XRD patterns show the formation of reflections with a noticeable intensity, which were not observed in the XRD patterns of new steel wires and which can be attributed to the reflections of δ- and/or δ*-Al2O3 with crystallite sizes of ~100 nm (simultaneously, these reflections can be indexed as reflections of other phases, in particular, γ-Fe2O3).
The results of EDX analysis for steel wires after operation (Table 3) show a significant decrease in the content of Zn (from 75.44 wt.% in new wire to 16.06 wt.%, 9.54 wt.%, and 24.50 wt.% at the beginning, at the quarter, and at the middle of the span, respectively), which correlates with an increase in the content of Fe (respectively, from 4.28 wt.% to 40.39 wt.%, 34.82 wt.%, and 13.92 wt.%) and O (respectively, from 19.29 wt.% to 35.79 wt.%, 48.18 wt.%, and 42.43 wt.%). These changes in the elemental composition of the C-W surface of steel wires are obviously related to the destruction of their galvanic layer, as was observed in [12,14], as a result of which Fe atoms from the bulk appear in the corrosion layer of steel wires, and are connected with the subsequent formation of Zn and Fe oxides in this layer due to interaction with the air and moisture.
For steel wires after operation in OPLs, XRD patterns change significantly (cf. Figure 9a–d), reflecting the change in elemental composition. Reflection intensities decrease tenfold, especially ones corresponding to Zn, ZnO, and ZnO2, which means a decrease in the scattering volume of Zn and its oxides and correlates with the results of EDX on the decrease in the weight content of Zn after operation. Although the intensities of the reflections attributable to Fe and α-FeO also decrease, the number of γ-Fe2O3 reflections (albeit weak in intensity) increases in the XRD patterns of steel wires after operation, which also correlates with an increase in the weight content of Fe according to EDX. As one can see from Figure 9a–d, the reflections observed in the XRD patterns of steel wires after service are noticeably wider than those for new wires. Indeed, the crystallite size (in the model without microstrains, εs = 0) averaged over the reflections of all observed crystalline phases, except for the reflections of δ- and/or δ*-Al2O3, is D0 = 51(21) nm for the new wire N0_C-W and D0 = 34(28) nm, 36(35) nm, and 44(35) nm for N1_C-W, N2_C-W, and N3_C-W (here, r.m.s. e.s.d.s in parentheses characterizes the deviation from the mean value for all crystalline phases, since most reflections are difficult to separate). Thus, the intensities of XRD reflections from Zn, Fe, and their oxides in steel wires after 52 years of operation decrease as well as the sizes of crystallites corresponding to them, which probably indicates a tendency toward amorphization of the corrosion layer of steel wires. Moreover, since the average sizes of crystallites are smaller in samples N1_C-W and N2_C-W, the tendency toward amorphization of the corrosion layer of steel wires is stronger at the beginning and at a quarter of the span.
As already noted above, data on the elemental (EDX) and phase (XRD) composition of the W-A surfaces (i.e., external surfaces exposed to the atmosphere) of Al wires from A50 AAAC and AC50 ACSR cables of different service lives from 8 to 62 years [24,25,26] are in good agreement with the data obtained in this work for Al wire from the AC50 ACSR cable after 52 years of operation. However, comparison with known EDX and XRD data from other studies [5,11,14,15,30] (see Section S3.1 of Supplementary Materials) shows a difference in both the elemental and phase composition of the Al-wire W-A surfaces.
Unlike samples N1_W-A, N2_W-A, and N3_W-A (from the ACSR AC50 cable, 52 years of service in the Volgograd region of Russia), in which small amounts of S, Cl, K, and Fe were detected in addition to Al and O through the EDX method (Table 3), Cl, K, Fe, and Cu were detected on the W-A surfaces of outer Brazil, near Parana River; P, C, and S were detected in [11] (from the ACSR cable, 61 years of service in northern France); C, Mg, P, S, K, and Fe were detected in [5] (from the ACSR cable, 42 years of service in Romania); and Si, P, S, Fe, and Zn were detected in [14] (from the ACSR cable, 40 years of service in the Czech Republic).
In contrast to the XRD patterns of the N1_W-A, N2_W-A, and N3_W-A aluminum wire samples, which show strong Al reflections and very weak reflections attributed to δ- and/or δ*-Al2O3 (Figure 8b–d), XRD patterns in [14] from the W-A surface of the outer Al wires of the ACSR cable (40 years of service, exposed to the atmosphere) contain strong reflections of Al and reflections of α-SiO2 with fairly strong intensities and low FWHM values (thus corresponding to rather large crystallite sizes, ~50–100 nm), as well as very weak reflections of α-Al2O3. In [15], XRD patterns from the W-A surface of the outer Al wires of the ACSR cable (Sichuan Province of China, service life was not specified) contained reflections of α-Al2O3 and AlOOH with intensities comparable to the intensities of the Al phase. Unlike the samples of steel wires N1_C-W, N2_C-W, and N3_C-W, the XRD patterns of which contain reflections of Zn, ZnO, ZnO2, Fe, γ-Fe2O3, α-FeO, and δ- and/or δ*-Al2O3 (Figure 9b–d), XRD patterns from the surface of the steel wire of the ACSR cable core in [15] showed the presence of Zn, ZnO, and Zn(OH)2.
The difference in the elemental and phase composition of W-A surfaces of external aluminum wires and C-W surfaces of steel wires (surfaces of steel wires in contact with aluminum wires in the ACSR cable) may be due to the initially different composition of impurities in wires from different manufacturers. For example, in the new Al wire N0, EDX found the presence of small impurities of S and Cl (Table 3), while in the new Al wire in [15], EDX detected Si, Fe, Cu, Zn, Ti, and Cr impurities. Moreover, for inner wires, in particular steel core wires, the different construction of ACSR cables plays a role, with one layer of Al wires in the AC50 cable and several layers in [5,11,14,15,30]. The difference in the content of light atoms, in particular C atoms, is obviously related to the better sensitivity of the instruments used in [5,11] for recording EDX spectra. Obviously, the difference also arises due to different pollution levels of the air, different climatic conditions in terms of temperature and humidity at the place where the cables are used, and the different durations of their operation.
4.3. Changes in the Aluminum Wire Characteristics Depending on the Duration of Exploitation and Comparison with the Results of the Recent Investigations of the Wires from A50 and AC50 Cables
Previously, in [24,25,26], studies were carried out on Al wires from cables similar to those used in this study and employing the same quantitative methods. Al wires of the outer wrap from A50- and AC50-type cables were studied after exploitation in the Volgograd region of Russia for 0–62 years (A50 cables) [24,25] and 0–20 years (AC50 ones) [26]. In contrast to the present work, the place on the span from which the specimens were cut was not fixed precisely, and each cable sample was removed from a location between the OPL supports, that is, between the clamps (position ‘0/1’ in this study) and the middle of the span (1/2 span). The XRD patterns given in [24,25,26] were measured from the outer side of the wires exposed to air (‘W-A side’ in the present study). EBSD maps in [24,25,26] were taken at the center of the cross-sections of Al wires, and, in [25,26], at a distance of ~150 μm from the W-A sides as well.
4.3.1. The Proportion of δ- and/or δ*-Al2O3 Phases in Aluminum Wires after Operation According to Estimates from XRD Data
For cables of both types, it was previously established through XRD methods [24,25,26] that in Al wires already after 8 years of operation, crystalline alumina in the δ- and/or δ*-Al2O3 modifications appear in NSL up to 36 μm thick, with the amount of alumina increasing with time of exploitation. Furthermore, its volume proportion is greater in the wires from the AC50 cable, apparently due to the presence of a steel core wire. As one can see from Figure 8b–d, reflections of δ- and/or δ*-Al2O3 phases have also been observed in the present study in the XRD patterns from the W-A and W-C sides of the wires from all parts of the AC50 cable span. For the W-A side, these reflections are of low intensity, which leads to an estimate of the volume proportion q = 1.38(5)%, 1.35(4)%, and 1.85(7)% for samples N1_W-A (0/1 span), N2_W-A (1/4 span), and N3_W-A (1/2 span) (here q = IintAl2O3/IintAl·x 100%, where IintAl2O3 and IintAl are, respectively, the integral intensities of the observed Al2O3 and Al reflections with the highest value of maximum intensities Imax). The obtained values of the volume proportion of the Al2O3 phase on the W-A side of the Al wires after service in the OPL cable for 52 years are in good agreement with the value of q = 0.9(1)% obtained in [26] for the external Al wires of the AC50 cable with a service life of 20 years. According to the Bragg angles 2θB of the observed reflections, δ- and/or δ*-Al2O3 phases are formed in the NSL of the W-A sides at depths of ~11 μm for samples N1_W-A (0/1 span) and N3_W-A (1/2 span) and ~24 μm for N2_W-A (1/4 span) (Table S6 of Supplementary Materials). In the case of the W-C side in contact with the steel core wire, the intensities of the reflections attributed to the δ- and/or δ*-Al2O3 phases are maximum near the clamps and decrease when approaching the middle of the span, which leads to the values q = 15.2(5)%, 3.4(9)%, and 2.7(1)% for samples N1_W-C (0/1 span), N2_W-C (1/4 span), and N3_W-C (1/2 span), respectively.
Since in the XRD patterns, the reflections from the W-C sides of the Al wires, which are attributed to the δ- and/or δ*-Al2O3 phases, can also be attributed to γ-Fe2O3, the large values of q for the W-C sides of the Al wires probably reflect the contribution of the γ-Fe2O3 phase in the corrosion layer covering the W-C side of the Al wires. This γ-Fe2O3 phase appears to have come from the corrosion layer of the adjacent steel core, as noted in Section 4.2.2 when comparing the results of XRD and EDX analyses.
4.3.2. Size of Grains in Aluminum and Steel Wires and the Alignment of These Grains along One Direction (from EBSD Data) and Size of Crystallites, Microstrain Level, and Preferential Orientation of Crystallites for Al Phase of Wire Material (from XRD Data)
The qualitative analysis of grain size distribution histograms, which were built from the analysis of EBSD maps, shows for Al wires from A50 cables (0 to 62 years of exploitation) [24,25,26] and from AC50 ones (0 to 20 years of operation) [26] a slight increase (~1–3%) in the number of large grains, Dgrain ~ 3.5–5 μm, in the center of the cross-sections (i.e., in the bulk of the wire) and up to Dgrain ~ 6 μm at the edge of the wire when the duration of operation increases. It has been suggested [25] that the increase in grain size is related to an increase in the size of Al crystallites, which they are composed of. According to the SSP analysis of the XRD reflection profiles, the average sizes of crystallites D and the absolute values of the average microstrains εs in them increase during the operation of the wires, although to a lesser extent for the wires from the AC50 cable due to the stabilizing effect of the steel core. The alignment of Al wire grains along one direction is also observed after use in OPLs, which correlates with an increase in the preferential orientation of crystallites along the [011] direction.
In the case of Al wires of the AC50 cable after 52 years of service, investigated in this work, the grain size results (Figure 3a,b and Figure S4a,b of Supplementary Materials) are consistent with the results obtained in [24,25,26] and summarized above. A detailed description of the change in the frequency of occurrence of grains of various sizes, Dgrain ~ 0.5–3 μm, in aluminum and steel wires is given in Section 3.3, where opposite trends have been noted for aluminum and steel wires, namely, an increase both in the number of large grains, as observed in [24,25,26], and in the average grain size in aluminum wires while there is their decrease in steel wires. It can only be added here that the number of grains with large sizes, Dgrain ~ 3.5–4.5 μm, also increases in the used Al wires for all parts of the span. Moreover, as in [25,26], the largest increase in the number of grains up to ~2.5% (from ~0.5% in new wire N0_W) is observed at the W-A side of the Al wire from the middle of the span (sample N3_W, 1/2 span). In steel wires, in contrast, the number of large grains with Dgrain > 3.5 μm decreases from ~2–3% in the new sample N0_C down to ~0.5–1% in N1_C (0/1 span), N2_C (1/4 span), and N3_C (1/2 span) samples (Figure 3c,d and Figure S4c,d of Supplementary Materials).
In contrast to [24,25,26], we have also obtained quantitative values of the average grain sizes <Dgrain> in aluminum and steel wires along the span both in the center of their cross-section (i.e., in the bulk) and at the surface (Figure 7a,b). So, quantitative estimates show that for the W-A side as well as for the bulk of the investigated aluminum wire, an average grain size larger than in the new wire is observed only in the middle area between 1/4 and 3/4 of the span. Only at the W-C side, the <Dgrain> value increased in all sections of the span. As noted in Section 3.3, the shape of the <Dgrain> distribution functions along the span from one clamp to the next one is close to a Λ-shape for the center of the cross-section, as well as for the W-A and W-C sides of the Al wire, i.e., with minima of <Dgrain> values near the clamps (spans ‘0/1’ and ‘1/1’) and a maximum in the middle of the span (1/2 span). Moreover, the maximum spread between the minimum and maximum <Dgrain> values and the maximum deviations of <Dgrain> from the value in the new Al wire is observed for the W-A side of the Al wire after exploitation in the OPL cable (respectively, a spread of 0.21 μm and a deviation of 0.16 μm for W-A in comparison with 0.09 µm and 0.11 µm for the W-C side and 0.12 µm and 0.06 µm in the bulk of the Al wire; see Figure 7a). Probably, the values of the scatter of the average grain size along the span and its deviation from the values in the new wire for both the W-C side and the bulk of the Al wire are lower due to the stabilizing effect of the core steel wire, which is adjacent to the Al wire.
The change in grain size in Al wires can be associated with several different processes. One of them is, as proposed in [25], the growth of the average size D of crystallites (revealed by XRD) caused by the recrystallization process starting in aluminum wires at OPL operating temperatures of ~90–130 °C (see Section 4.3.5). Indeed, since the grains are composed of crystallites, as D increases due to tensile stresses, cable vibrations and swings, high electrical voltages, and temperature changes during operation in the OPL cable, the value of <Dgrain> will also increase. Since the distribution of the average size D of crystallites (Figure 12a) corresponds in the first approximation to the Λ- and M-shaped laws for the W-C and W-A sides with maxima at half and a quarter (and three-quarters) of the span, respectively, apparently, this mechanism of <Dgrain> growth mainly works far from the places where the cables are fixed by clamps. Noteworthily, microstrain εs under the influence of the same factors mentioned above develops in crystallites according to similar Λ- and M-shaped laws for the W-C and W-A sides (Figure 12b), respectively, along with the growth of D. Whereas near the clamps (spans ‘0/1’ and ‘1/1’), the microstrain is zero (εs = 0) or close to zero, the values of microstrain at the quarter and in the middle of the span (1/4 and 1/2 span), where the impact of vibrations and swings of the cable under the action of the wind is increased compared to the clamp places, are, respectively, εs = 0.032(6)% and 0.015(2)% on the W-A side of the wire and εs = 0.020(6)% and 0.034(4)% on the W-C side. These values of microstrains in Al wires after 52 years of service in the AC50 OPL cable are in good agreement with the values of εs = 0.026(3)% and 0.025(3)% found in [26] for W-A aluminum-wire samples from AC50 cables with lifetimes of 8 and 20 years, respectively. Probably, the zero or almost zero microstrain value obtained for the W-A and W-C sides of the aluminum wires at the clamps is explained by the healing of the defects due to the process of return occurring in aluminum wires starting after operation, when the OPL temperature rises to ~90–130 °C due to the applied high voltage (Section 4.3.5).
The second process leading to grain growth, due to the same reasons as described above, is the alignment of grains along one direction (seen from the analysis of EBSD maps), which is also, apparently, interconnected with the observed increase in the preferential orientation of crystallites along the crystallographic direction [011] of Al (from XRD analysis). For the wires after a long 52-year exploitation in OPL, the alignment of grains along one direction in wires after operation leads to a decrease in the fraction f=2 of grains in them with a minimum misorientation angle φmis = 2° (Figure S7c of Supplementary Materials) due to the merging of neighboring grains with a decrease in the misorientation angle between them being less than 2° (a grain is understood as a region in which the misorientation of the crystal lattice is less than 2°).
It should be remarked that, as already noted in Section 3.3, in AAAC cables of the A50 brand without a steel core and in AC50 cables of a short service life (8 years), there is an increase in the fraction f=2 in aluminum wire [24,26], which means an increased tendency to align GBs along one direction but without the merging of grains into one. In AC50 cables, the fraction f=2 in the bulk of aluminum wire begins to decrease after 20 years of service in comparison to 8 years of service [26], i.e., the grain alignment is already so strong that they begin to merge. During a long 52-year operation of the AC50 cable, this process intensifies, resulting in a noticeable decrease in f=2 (cf. Figure 6a–d). At the same time, the f=2 value in steel wire practically does not change or even slightly increases by a quarter and in the middle of the span compared to new wire (cf. Figure 6e–h). Taking into account all of these facts (an increase in the fraction f=2 for aluminum wires of the A50 cable of a long service life and AC50 cable of a short service life and a drop of f=2 with an almost unchanged or slightly growing proportion of f=2 for steel wires), it can be assumed that an increase in the tendency toward alignment of the grains with the smallest angle of misorientation φmis = 2°, which leads to grain merging, occurs due to the stabilizing effect of the steel core.
For example, this stabilizing effect is manifested in the fact that the sagging and stretching of the AC50 cable are not as strong as those of the A50 cable due to the stronger steel core of the AC50 cable. As a result, not only does the fraction fLAGB of LAGBs increase and the fraction fHAGB of HAGBs decrease (i.e., the number of grains with a misorientation angle 2° < φmis ≤ 15° increases and that with φmis > 15° decreases) but also a larger number of grains with the smallest misorientation angle φmis = 2° merge, i.e., their fraction f=2 decreases. This assumption is also confirmed by a noticeable decrease in the fraction f=2 (i.e., merging the grains with the smallest angle of misorientation) at the edges, accompanied by an increase in f=2 in the bulk of the wire (i.e., an increase in the number of grains with the smallest angle of misorientation due to the increased tendency to align GBs along one direction) of the A50 cable aluminum wire after tensile fatigue tests [27].
This process of grain merging is accompanied by an increase in the preferential orientation of the crystallites, which is observed in the experiment (cf. Figure 10 and Figure S8 of Supplementary Materials). Since the difference in f=2 between the new and used wire is noticeably greater for the central regions of the wire, the increase in grain size due to the process of aligning their crystal lattices seems to be more pronounced for the bulk of the Al wire near the clamps than for the W-A and W-C sides. However, given the decrease in f=2 at the ends of the span, 0/1 and 1/1, this process of <Dgrain> increase is more pronounced near the clamps and at the W-A and W-C sides. At the same time, not all grains merge into larger grains. Along with the grains tending to line up along the same direction, a large fraction fHAGB of grains with an arbitrary orientation of the crystal lattice remains, characterized by a misorientation angle φmis ≥ 15° (Figure S7g of Supplementary Materials). At the same time, at the W-A and W-C sides of Al wires away from the clamps (1/4 and 3/4 spans for W-A and 1/4, 1/2, and 3/4 for W-C), the fHAGB value is reduced compared to the new Al wire, reflecting the trend toward grain alignment. A decrease in the average misorientation angles of low- and high-angle grain boundaries <φmisLAGB> and <φmisHAGB> and in the average misorientation angle <φmis> of grains with φmis > 2° at the same positions along the cable span (Figure 7i,k and Figure S7g of Supplementary Materials) within used Al wires at the W-A and W-C sides away from the clamps compared to new wires also matches the grain alignment trend in these parts of the span.
Along with the above factors that promote the growth of crystallites and grains, there is also one counter-factor, namely, the gravitational sagging of the cable between the supports. Internal stress counteracts the merging of crystallites into grains and grains between themselves, literally pulling them apart by force. Even in the approximation of an ideally flexible thread, the stress in the wire at the attachment points is greater (although not radically) than at its lowest point (sag) [64], so this counter-factor slows down the discussed merging near the supports more, i.e., grain growth over time should be greater in the middle of the span yet again. In other words, the counter-factor paradoxically leads to the same dependencies (~Λ-shaped) for the growth of crystallites and grains along the span.
For aluminum wires, full correlation is observed neither between the Λ-shaped change in the average grain size <Dgrain> (Figure 7a) and that in the average crystallite size D (Figure 12a), nor with variation in the fraction f=2 of grains with a minimum misorientation angle φmis = 2° (Figure S7c of Supplementary Materials), nor with changes in other microstructural parameters describing the ordering of Al wire grains (fLAGB, fHAGB, <φmisLAGB>, <φmisHAGB>, and <φmis> (Figure S7g of Supplementary Materials and Figure 7e,g,i,k)). Apparently, this is due to the influence of the neighboring steel wire of the core, which is an additional factor influencing grain growth. For the steel core wire, grains are formed not from the Al material but from steel wire material (mainly Zn of galvanized layer on the edges and Fe and Fe3C in the bulk). The average grain size <Dgrain> of a steel wire, although showing variation along the span, is opposite in phase and smoothed compared to an Al wire (cf. Figure 7a,b). The shape of the distributions of microstructural parameters f=2, fHAGB, <φmisLAGB>, <φmisHAGB>, and <φmis> at the edges and in the bulk of the wire, which characterize the alignment of steel wire grains along one direction, is practically similar to the corresponding distributions for Al wire, although showing much smaller variation between minimum and maximum values and less deviation from values in the new steel wire (cf. Figure 7b,d,f,h,j,l and Figure 7a,c,e,g,i,k). It seems that the steel wire of the core modifies the shape of these distributions in the adjacent AC50 aluminum wire of the ACSR-type cable.
4.3.3. Aspect Ratio of Grains (from EBSD Data)
The distribution histograms of the ratio of the maximum grain size to the minimum size (aspect ratio, AR) constructed in [24,25,26,27] for the centers and edges of the cross-sections of Al wires from the A50 and AC50 cables with lifetimes from 0 to 20 years (AC50) and from 0 to 62 years (A50) as well as such histograms for A50 aluminum wires subjected to fatigue tests with a load of up to 155.9 MPa [27] are qualitatively very similar in appearance. The largest fraction, ~13%–15% of grains, possesses a value of AR ≈ 1.7, and a somewhat smaller fraction, ~10%–12%, falls on grains with AR ≈ 1.2. Although there are grains with AR up to ~5.5 in the cross-section of aluminum wires, the vast majority of grains (~98%–99%) are characterized by AR < 3.2. At the same time, for the centers and edges of the longitudinal sections of the Al wires, the overwhelming fraction of grains (~98%–99%) is characterized by a larger value of AR < 6.2, whereas AR < 3.2 is typical only for ~86% of grains [25]. The form of histograms for the longitudinal and cross-sections of Al wires studied in [24,25,26,27] is practically independent of the service life or the applied loads during fatigue tests. Since the AR histograms of grains in the longitudinal and cross-sections of Al wires practically do not change, it was concluded that the grain shape was retained during operation in A50 and AC50 OPL cables at the above service lives and during fatigue tests at the specified loads.
Visual analysis of the AR distribution histograms of grains in wires from AC50-type cables after 52 years of service in OPL (Figure 5a–d and Figure S6a–d of Supplementary Materials) leads to the same conclusions as above not only for aluminum wires but also for steel ones. AR distribution histograms for grains of aluminum and steel wires from used cables for all parts of the span and from a new cable are absolutely similar to the histograms constructed in [24,25,26,27] and briefly described above.
The quantitative analysis of grain AR distribution histograms shows that, for the investigated wires with a service life of 52 years, the average AR values are similar at the center and edges of aluminum and steel wires (1.65–1.74 for aluminum wire and 1.65–1.71 for steel one; see Figure S7c,d and Table S4 of Supplementary Materials). Compared to the new wire, there is a slight shift to higher AR values for the W-C side of the aluminum wire, probably because of the adjacent steel wire. The span distribution functions for the W-C and W-A edges and for the center of the cross-section of Al wire are described by an M-shaped function with maxima at a quarter of the span (1/4 span and 3/4 span) and a huge minimum at the middle of the span (1/2 span). As a result of this dip, the distribution functions become closer to V-shaped, that is, the inverse of Λ-shaped for grain size distribution functions, especially in the case of the W-A side. Note that a decrease in AR means a less anisotropic grain shape, and, conversely, an increase in AR corresponds to a larger difference between the minimum and maximum grain sizes. Thus, in the middle of the span, where grains of the maximum average size grow, they grow unequally in different directions, which leads to a decrease in their AR, i.e., to a more isotropic grain shape than in other parts of the span.
As for the total fraction of grains with AR < 3.2, for the new wire as well as for different parts of the cable used in OPL, it is fAR<3.2 = 98.39%–99.93% for the aluminum wire and 98.54%–99.23% for the steel wire core (Figure S7e,f and Table S4 of Supplementary Materials). The distribution functions of fAR<3.2 over the span for both types of wires are described by a W-shape (V-shape for the W-A side of an aluminum wire), i.e., in the used wires, the fractions of grains with AR < 3.2 increase near the clamps. Compared to new wires, this fraction near clamps in used wires is higher for aluminum wires and lower for steel ones.
Thus, the analysis carried out in the present study and in previous papers [24,25,26,27] allows us to conclude that the vast majority of grains of the cross-section of aluminum and steel wires from AC50-type cables as well as of aluminum wires from A50 in new condition, after use in OPL cables, and after fatigue tests are characterized by a value of AR < 3.2. The proportion of grains with larger AR values is negligible in cross-sections, not exceeding 2%, although is noticeable (~14%) for the longitudinal section, as was obtained, for example, for aluminum wires of the A50 cable [25].
The obtained “magic” ratio AR < 3.2 finds its natural explanation if one takes into account the phenomenon of the Plateau–Rayleigh instability. As shown experimentally and then theoretically [65,66], due to this instability, a long jet of fluid under the action of gravity and surface tensions spontaneously breaks into separate drops (grains) with a ratio of the length of the drops to their diameter, that is, AR less than π ≈ 3.14 (AR < π).
Previously, the Plateau–Rayleigh instability concept was applied to explain the fragmentation of copper [67] and gold [68] nanowires. Probably, at the stage of hot manufacturing the aluminum and steel wires by drawing, the same Plateau–Rayleigh instability leads to the breaking (fragmentation) of the wires into grains. When drawing a wire, the main pressure is applied not along the drawing axis but across, in a die. When leaving the die, the squeezed heated wire probably slightly expands in the sectional plane in all directions. Due to the Plateau–Rayleigh instability, under the action of negative pressure, large sections of the crystalline wire are broken into drops (grains) with an orientation in all directions so that AR < π in the cross-section of the wire but not along the drawing axis. As for the drawing axis (longitudinal section of the wire), the grains just slightly elongate because of the drawing, with some of them showing AR > π as a result.
4.3.4. Density of the Aluminum and Steel Wires According to XRD and Densitometry
The main facts worth paying attention to when discussing XRD (ρX) and integral (ρ) mass densities are as follows (see Section 3.4.1 and Section 3.4.2, Figure 11).
The Al wire XRD density is ρX ∝ 1/a3, where a is the cubic unit cell parameter of the aluminum wire material (see Formulas S3 and S4 of Supplementary Materials), which was calculated from the Bragg angles of the observed XRD reflections of the Al phase. According to the estimate, the observed XRD reflections of the Al phase correspond to an NSL with a thickness equal to the penetration depth of the used Cu-Kα radiation, Tpen ~ 36 μm (Formula S2 and Table S3 of Supplementary Materials). In other words, ρX is the estimated (calculated) average density of aluminum wire NSL ~36 μm thick. The value of ρX is regulated by how much the crystal lattice of the Al phase in this layer has expanded or contracted, which results in a decrease or increase in XRD density ρX, respectively (cf. ρX in Figure 11 and the corresponding a value in Figure S9 of Supplementary Materials).
In its turn, the integral mass density ρ determined by densitometric measurements is the density averaged over the entire volume of the wire, including the bulk, NSL, and the corrosion layer covering the surface of the wire.
If there was only a linear decrease in the XRD density ρX of Al wire NSL over the entire service life of 52 years, then according to the corrosion rate from [26] found for the W-A sides of aluminum wires from AC50 cables with lifetimes up to 20 years, the expected XRD density would decrease from ρX0 ≈ 2.6975 g/cm3 in a new wire to ρX = 2.6865(2) g/cm3 (see Section 3.4.1). However, as can be seen from Figure 11 and Table S7 of Supplementary Materials, the XRD density ρX of aluminum wire after 52 years of operation is characterized by significantly higher values, from ρX = 2.6945(1) g/cm3 (span ‘0/1’) to 2.6981(1) g/cm3 (1/4 span) and 2.6960(3) g/cm3 (1/2 span), in the case of the W-A side directly exposed to the air. For the W-C side, which is also characterized by an M-shaped distribution function of the XRD mass density ρX of NSL, the increase in ρX is even greater, from ρX = 2.6945(1) g/cm3 (span ‘0/1’) to 2.7005(3) g/cm3 (1/4 span) and 2.6986(9) g/cm3 (1/2 span).
At the same time, the integral density ρ of aluminum wire is systematically lower by ~0.3–0.5% than the XRD density ρX of the wire’s NSL (Figure 11 and Table S7 of Supplementary Materials) and varies following the W-shaped law along the span, i.e., in antiphase with ρX (note that the higher value of the integral density ρ of the aluminum wire near the clamps compared to the quarter span is probably due to the healing of micropores caused by the return process at the operating temperature of OPL ~90–130 °C; see Section 4.3.5).
Thus, it can be said that the Al wire from the AC50 cable of ACSR type after 52 years of operation in OPL is characterized by a less dense core (bulk) covered with a denser NSL.
A similar pattern of a less dense core and a denser NSL was previously observed for Al wires from an A50 AAAC-type OPL cable after service with lifetimes from 0 to 62 years in the same Volgograd region of Russia [24] as in the current study. Just as in the case of the Al wire of the AC50 cable after 52 years of service in this study, the Al wire of the A50 cable after 62 years of service in the OPL had an XRD mass density ρX greater than would be expected from the linear decrease in ρX observed at short service times less than 20 years [26].
Density reduction (degradation) according to a linear law was associated [24,25] with the formation of defects of a void nature in NSL and in the bulk of the Al wire during operation in OPL cables because of stretching and oscillations due to wind. Owing to the phenomenon of fretting in neighboring cable wires being under high voltage and exposed to fluctuations in temperature and humidity within climatic norms, the protective amorphous alumina layer is destroyed, and crystallites of oxides, δ- and/or δ*-Al2O3, are formed in the NSL of aluminum wires. The formation of these crystallites leads to an opposite effect on the measured mass density of aluminum wires [26]. On the one hand, these oxides are characterized by a higher mass density (~3.7 g/cm3 compared to ~2.7 g/cm3 for Al), which should lead to an increase in the integral density ρ. On the other hand, these oxides are much harder than Al and act as an abrasive for the soft aluminum material [30], which leads to the increased formation of fretting-induced void defects and to a decrease in the integral density ρ. In addition, the formed oxide crystallites adjacent to Al crystallites compress the crystal lattice in them, a result of which, when the fraction of oxides increases sufficiently, the linear law of the decrease in the density ρX due to the formation of void defects is violated, and the XRD density ρX increases [26].
It is possible that in the case of the W-C side in contact with the steel core wire, in addition to the formation of δ- and/or δ*-Al2O3 oxides, the increase in ρX compared to the XRD density of the W-A side occurs since atoms with Slater radii smaller than that of Al atoms are introduced into the structure of the Al phase of NSL, which leads to the additional lattice compression. Such atoms can be, e.g., Si atoms (their Slater radius is 1.10 Å compared to 1.25 Å for Al [69]). According to [63], up to 0.08 wt.% Si is present in aluminum material of the A7E grade, which Al wires are made from. As can be seen from the EDX results (Table 3), the amount of Si increases significantly up to ~10 wt.% in all parts of the span on the W-C sides of the aluminum wire in contact with the adjacent steel wire after 52 years of operation. Probably, Si migrated to the NSL on the W-C side during operation from either the environment or the grease that covered the contact surfaces of the steel and aluminum wires, a small part of the Si atoms incorporated into the structure of the Al phase in NSL.
As for the steel core wire, its XRD density could not be calculated because of a significant change in the phase composition after 52 years of operation and a strong overlap of reflections, as indicated in Section 3.5. The integral density in the wire after operation noticeably decreased compared to ρ = 7.6828(8) g/cm3 for a new wire by 2.3–0.8% depending on the span part. The value of ρ varies along the span according to the Λ-shaped law with minimum values of ρ = 7.5650(8) g/cm3 near the clamps and a maximum of ρ = 7.6828(8) g/cm3 in the middle of the span (Figure 13 and Table S1 of Supplementary Materials).
One of the reasons for the decrease in the integral density ρ of steel wire is, just as for aluminum wire, the formation of void defects in it during operation under the action of tension and oscillations due to wind and fretting induced by neighboring aluminum wires. Previously [34], for an ACSR-type cable with a larger diameter and a core of six steel wires twisted around a central steel wire (cable modification AC120/19) after operating for 33 years in OPL, it has been found that the central steel wire is characterized by a noticeably greater integral density than steel wires in contact with aluminum ones. Since up to 20 wt.% of Al can be incorporated into the Fe [70] structure at room temperature under equilibrium conditions, the authors have assumed that, in addition to the formation of defects of a void nature during operation in the OPL cable, the value of ρ can also decrease due to the incorporation of Al into the Fe structure due to direct contact of the steel wires of the upper core layer with adjacent aluminum wires as a result of the destruction of both the protective galvanic zinc layer of the steel wire and the amorphous aluminum oxide layer. It is possible that the same effect contributes to the observed decrease in the integral density of the steel wire of both the core and the investigated AC50 cable after 52 years of operation in the OPL.
4.3.5. Variation of Elastoplastic Characteristics along the Cable Span in Comparison to the Literature Data
Previously, elastoplastic characteristics were obtained in acoustic measurements of aluminum wires from AAAC cables of the A50 modification with different service lives of 0 to 18 [24,25,26] and 62 years of service [24,25] and after fatigue tests [27], as well as for wires from cables of ACSR type of the AC50/8 modification (denoted as AC50) with different service lives from 0 to 20 years [26] and the AC120/19 one after 0 (new cable) and 33 years of service [34]. The same measurements were made in [34] for steel wires from the AC120/19 cable. An analysis of all of these data shows that the parameter that is most sensitive to degradation during operation in OPL cable or during fatigue testing is Young’s modulus E.
Young’s modulus of aluminum wires from the A50 cable decreases from E = 72.8 GPa in a new wire down to E = 69.4–71.3 GPa after 8 years and 71.6–71.2 GPa after 20 years of wire operation in OPL [24,25,26], returning almost to the initial value after 62 years of service, E = 72.6 GPa. After fatigue tests of aluminum wires from the A50 cable with different loads (149.4 MPa and 150.7 MPa), Young’s modulus E also showed a decrease in its value, correlating with a decrease in the measured integral density ρ and most noticeably for specimens cut near the wire breaks (E = 72.2 GPa and 72.4 GPa), characterized by effective lifetimes teff = 21 and 16 years, respectively (teff was estimated from the calculated XRD density ρX) [26]. A decrease in E from 72.4–73.0 GPa in the new state down to E = 71.4–71.6 GPa after 33 years of operation was found for aluminum wires from the outer layer of the AC120/19 cable, while the E value in individual wires of the inner aluminum layer coincided within the experimental scatter with the E value in this layer of the new cable [34]. For aluminum wires from the AC50 cable studied in [24,26], Young’s modulus was E = 71.8–72.2 GPa in a new cable, which firstly increased up to E = 72.9 GPa after 8 years of service and then decreased down to E = 71.6 GPa after 20 years of operation. For aluminum wires from the AC50 cable after 52 years of operation, the study of which is presented in this paper (Figure 16a and Table S8 of Supplementary Materials), Young’s modulus in the wire from the new cable is E = 71.4 GPa and after 52 years of operation fluctuates within the range of 71.2–71.7 GPa in various parts, remaining almost unchanged near the clamps (span ‘0/1’), while decreasing to a minimum value at a quarter of a span (1/4 span) and then rising at the middle of a span (1/2 span).
The steel core wires also demonstrate a decrease in E after service as a general trend. In the steel wires of the new AC120/19 cable, Young’s modulus is E = 209.9–211.2 GPa in different individual wires of the core, decreasing to E = 207.0–209.4 GPa in most wires after 33 years of service in an OPL cable (only for one of the steel wire cores, Young’s modulus increases after operation to E = 211.4 GPa) [34]. The modulus of elasticity of the steel core wire of the AC50 cable after 52 years of operation, examined in this paper (Table S8 of Supplementary Materials and Figure 16b), shows a close high value of E = 211.7 GPa in the new cable, decreasing to E = 205.8–207.1 GPa in different parts of the span.
Thus, the E values in aluminum and steel wires from the new cable and cable after 52 years of service and the trend of their change after operation are in good agreement with the previously obtained values in [24,25,26,27,34]. The scatter in the E values for samples from cables of the same type and service life is probably due to the fact that different samples cut from a cable were used for measurements. In addition, variation is possible for cables from different batches produced in different years.
The integral density ρ of a material is one of the main factors affecting the value of the elastic modulus E [71]. A good illustration of this fact is the shape of the distribution functions of Young’s modulus E along the OPL span for aluminum and steel wire after exploitation (cf. Figure 11 and Figure 16a and Figure 13 and Figure 16b, respectively). Dependencies of E on position on the span practically repeat the distribution functions of the integral density ρ along the OPL span, namely, a W-shaped function close to Λ-shaped for the aluminum wire (with a maximum at the middle of the span (1/2 span), significantly exceeding the values of the functions near the clamps (span ‘0/1’)) and a Λ-shaped function for the steel one.
The decrease in E of aluminum and steel wires after operation is associated [24,27,34] with a decrease in the integral density ρ of wires due to stretching and the formation of defects of a hollow nature because of the fretting of adjacent wires during vibrations and oscillations of the cable under the action of wind or after fatigue vibrations. The increase in E for aluminum wires with a long service life is explained by the competing contribution of the formed aluminum oxides to the measured value of E [24] since Young’s modulus of Al2O3 modifications is more than five times higher than that of Al [72]. As the volume fraction of aluminum oxides in the aluminum wires of an AC50 cable after 52 years of service in OPL is at least 1.5–2 times higher than that of an A50 cable after 62 years of service (see Section 4.3.1), the value of E for the aluminum wire of the AC50 cable increases more. As a result, in contrast to the A50 cable after 62 years of operation [24], the E values of the aluminum wire near the clamps (span ‘0/1’) and, especially, in the middle of the span (1/2 span) of the AC50 cable after 52 years of service become higher than in a new cable (Figure 16a).
As for the decrement δi and microplastic flow stress σs of aluminum and steel wires, their change in the samples studied in this work does not show such a clear correlation with all of the results from [24,25,26,27,34] as in the case of Young’s modulus E.
For aluminum wires from the AC50 cable after operation in OPL for 52 years, it was found that the decrement δi noticeably increased from the value δi = 21.6·10−5 in new condition to δi = 37.3·10−5–54.2·10−5 after 52 years of operation in different parts of the span, going together with a Λ-shaped distribution function of the values δi over the parts of the span, i.e., with a minimum at the ends of the span (span ‘0/1’) and a rise to a maximum in the middle of the span (1/2 span). An increase in the decrement δi compared to the new wire is accompanied by a decrease in the microplastic flow stress σs after 52 years of service to values equal to 93.5%, 77.4%, and 87.1% of the σs value in the aluminum wire of the new AC50 cable at the span parts 0/1, 1/4, and 1/2, respectively, i.e., the distribution function σs has the form of a W-shaped function but without an enlarged maximum in the middle of the span, as in the case of Young’s modulus E.
Unlike the AC50 cable with a service life of 52 years, for aluminum wires from the AC50 cable with a not-so-long service life, the decrement δi of the aluminum wire decreases to δi = 17·10−5 after 8 years of operation and only after 20 years of service increases to δi = 31·10−5 [26]. As for the aluminum wire with a service life of 52 years compared to a new wire, the change in microplastic flow stress σs is opposite in sign to the change in decrement δi, i.e., when δi decreases, σs increases, and vice versa. Accordingly, in aluminum wires from the AC50 cable, the value of σs increases (up to ≈107% of σs in new wire) after 8 years of operation and then decreases (down to 87%) after 20 years of service.
For aluminum wires from the A50 AAAC-type cable [24,25], the changes in δi and σs are also opposite in sign. Obviously, due to the absence of the stabilizing effect of the steel core, the values of δi and σs are characterized by larger values at comparable durations of exploitation, and the direction of their changes is opposite to the changes observed for the wires of the AC50 cable. To be exact, the decrement δi increases from δi = 23·10−5 in a new sample to δi = 133·10−5–457·10−5 after 10 years of service, then decreases to δi = 85·10−5 after 20 years of operation and returns to the value δi = 23·10−5 after 62 years of service. At the same time, the microplastic flow stress σs decreases after 10 years of service and increases after 18 and 62 years of service, reaching, respectively, the values σs ≈ 43–16%, 64%, and 93.5% of the σs value in new aluminum wire. As in the case of Young’s modulus E, the scatter of the above values of δi and σs for samples of the same service life is due to the fact that the measurements were carried out on different samples cut from adjacent but different sections of a cable.
For aluminum wires from an A50 cable brought to break in fatigue tests [27], no noticeable change in the decrement δi and microplastic flow stress σs near the break points is observed. Yet, for samples cut far from the break, as described above, the decrement for aluminum wires from the A50 cable after operation increases up to δi = 48·10−5 and 32·10−5 for samples tested under loads of 149.4 MPa and 150.7 MPa, respectively. In this case, as after operation in the OPL, the σs value for the first sample decreases to 56% of the value in the new wire, although increasing to 106% for the second sample.
At the same time, for the wires from the outer and inner aluminum layers of the ACSR type cable, no clear trend in the change in δi and σs was revealed after 33 years of operation, and only a scatter of the obtained values around the values in new wires was observed [34].
For the steel core wire of the AC50 cable after 52 years of use in OPL, some increase in decrement is observed only near the clamps from δi = 218·10−5 in new condition up to δi = 240·10−5 (Figure 16b and Table S8 of Supplementary Materials). On the remaining parts of the span, the decrement decreases to a minimum δi = 34.3·10−5 at the middle of the span (1/2 span) according to a law close to parabolic, which, in the first approximation, can be described by a V-shaped function in contrast to the Λ-shaped distribution function δi for aluminum wire. As in the case of aluminum wire, the microplastic flow stress σs varies in span parts in antiphase with the decrement δi. As a result, the distribution of the σs value for the steel core wire is described according to the Λ-shaped law. Near the clamps (span ‘0/1’) the σs value is minimum and reaches only ≈27.5% of the σs value in new steel wire, rising to ≈102% of this value in the middle of the span (1/2 span).
Unlike the AC50 cable, in the AC120/19 cable [34], all steel core wires show values δi ≈ 52·10−5–100·10−5 after 33 years of operation, higher than in the new AC120/19 cable (δi ≈ 35·10−5–50·10−5). The σs values of the steel wires after operation show a scatter around the σs values in the steel wires of the new cable.
The scatter in the values of δi and σs for wires of the same material from the same type of cable and the same service life is probably affected by the deformation history of the wires during their manufacture and operation in OPL cables.
As regards the increase in decrement δi and decrease in microplastic flow stress σs, which are observed in aluminum and steel wires of AC50, A50, and AC120/19 cables after their use as described above, they can apparently be related to an increase in the concentration of defects, including dislocations. Estimates according to the ratio Ldis ∝ εs/D (cf. Formula S5 of Supplementary Materials) [73], which are carried out based on data on the average sizes D of the regions of coherent X-ray scattering (i.e., crystallites), and to the absolute value of the average microstrain εs in these crystallites show that the increase in εs is followed by an increase in the dislocation density Ldis. Taking aluminum wires from A50 and AC50 cables studied earlier in [24,25,26,27] as an example, one can conclude that this increase in Ldis is caused by the fact that, in ~36 μm thick NSL, an increase in the size D of crystallites after the operation of wires in cables occurs to a lesser degree compared to the increase in εs. Moreover, according to the constructed profiles of changes in D and εs with depth from the surface for aluminum wires from A50 and AC50 cables after operation in OPL [25,26], the value of D is maximum near the surface (at depths < ~30 μm) and asymptotically tends to a smaller constant value in the bulk. At the same time, εs has a zero or close to zero value near the surface and reaches its maximum almost constant value at depths of 15 μm and more. Thus, a decrease in D and an increase in εs to constant values with distance from the surface will also lead to an increase in the dislocation density Ldis, which stops, stabilizing at the maximum value, starting from a depth of ~30 μm from the surface.
Evaluations made based on the D and εs data for aluminum wires from the AC50 cable after 52 years of service in OPL (see Section S3.2 of Supplementary Materials) have shown that the distribution of Ldis along the span very well reproduces the distribution of microstrain εs (cf. Figure S12 of Supplementary Materials and Figure 12); note that in Figure S12 of Supplementary Materials, the normalized quantity Ldisnorm is shown, which indicates how many times the dislocation density Ldis is greater or less in comparison with the dislocation density Ldis0 on the W-A side of the aluminum wire from the new cable (Formula S6 of the Supplementary Materials). Like the εs value, the dislocation density Ldis for the W-A side follows an M-shaped distribution function with minima near the clamps (span parts ‘0/1’ and ‘1/1’) and in the middle of the span (1/2 span), having a maximum at a quarter of the span (1/4 span). On the W-A side directly exposed to the atmosphere, near the clamps and in the middle of the span, Ldis is only ≈1.3–1.4 times greater than the dislocation density Ldis0 on the W-A side of the new wire. At a quarter of the span, Ldis ≈ 2.1·Ldis0. On the W-C side in contact with the steel core, the distribution function of Ldis along the span follows a Λ-shaped law just as the microstrain εs does. The dislocation density Ldis is zero on the W-C side of the new aluminum wire near the clamps (span ‘0/1’) and almost linearly increases after exploitation in the AC50 OPL cable for 52 years from Ldis = 0 (within the accuracy of determination) to 1.4·Ldis0 and beyond up to 2.2·Ldis0 on a quarter (1/4 span) and midspan (1/2 span), respectively. The almost zero dislocation density Ldis at clamps is managed to the almost zero microstrains εs (see Formula S5 in Supplementary Materials) due to return processes occurring at an operating temperature ~90–130 °C of OPL, discussed further in this section.
Taking into account the stabilization of Ldis at depths greater than ~30 μm from the surface, as discussed above for aluminum wires from A50 and AC50 cables after operation in OPL, one can consider the dislocation density Ldismean averaged over the Ldis values for the W-A and W-C sides. In doing this, the average value of the dislocation density in the wire after operation is minimum near the clamps (Ldismean = 0.62·Ldis0) and is 1.74–1.78 times greater at a quarter and in the middle of the span in comparison with the dislocation density Ldis0 on the W-A-side NSL of a new aluminum wire.
Thus (cf. Figure S12 of Supplementary Materials and Figure 16a), for aluminum wire from the AC50 cable after 52 years of operation, just in those parts of the span where the dislocation density Ldismean averaged over the W-A and W-C sides of the wire is maximum, the magnitude of the stress microplastic flow stress σs is either minimum (at a quarter, 1/4 span) or the decrement δi is maximum (in the middle of the span, 1/2 span).
In addition, a qualitative explanation of the Λ-like shape of the change function on the span parts of the aluminum wire and V-like function (in first approximation) in steel wire of the AC50 cable after 52 years of operation in OPL gives the theory of internal friction in metals.
The most intense deformation of the aluminum wire occurs near the places of its attachment or suspension at the ends of the span. With intense plastic deformation, intragrain shifts along one or more sliding systems are activated. These shifts can pass through the GB, forming localized or stretched steps or inclined segments on it [74]. This kind of fragmentation of boundaries can be carried out not only with initially inhomogeneous deformation. Homogeneous plastic deformation of a single grain, as well as a single crystal, becomes unstable under certain conditions. This leads to the formation of defect-free channels [75], inside which there is no plastic deformation. The passage of such inhomogeneous shifts across the border forms rotated sections on it. In addition, this type of deformation leads to the appearance of a large number of dislocations in the grains.
During the operation of OPL wires, their temperature rises up to values of ~90–130 °C due to the applied high voltage. This is enough for the processes of return or recrystallization to occur in the aluminum wire. The first of them does not affect the change in the configuration of GBs. At the same time, the grains themselves get rid of various structural defects, such as dislocations and micropores. This healing probably explains the reduction to almost zero of local deformations (microstrains) εs in crystallites and dislocation densities Ldis detected using XRD in NSL aluminum wires after a long 52-year operation in OPL (Figure 12 and Figure S12 of Supplementary Materials) and the higher value of the integral density ρ of aluminum wire near the clamps by compared with a quarter of the span (Figure 11).
Thus, the shape of the GBs along the span changes. From being highly tortuous or faceted at the beginning, it takes a smoother shape in the middle of the span. GB slippage along winding boundaries has a non-conservative character with the participation of vacancy diffusion flows between neighboring sites, differently oriented with respect to the average shear stress along the boundary [76]. The rate of slippage under these conditions is significantly lower than along the GBs in the middle of the span, where they are less rugged, and the process is largely conservative. Therefore, the internal friction or attenuation decrement (and independent decrement δi analyzed in Section 3.6), having a grain boundary nature, takes a smaller value at the ends of the span. This explains the Λ-shaped nature of its change along the span.
A comparison of Figure 11 and Figure 13 shows that the integral density ρ of steel wire varies along the span significantly more than aluminum. In particular, this is, apparently, due to the presence of an excessive number of micropores in the steel wire near the ends of the span. The temperature at the beginning of the return and recrystallization processes in steel is much higher than in aluminum. Therefore, the defective structure in the steel wire does not change at operating temperatures. The internal friction in a porous material is higher than in a nonporous one [77]. Therefore, for steel wire, the dependence of the attenuation decrement along the span has a V-shaped character, the opposite of the dependence in the aluminum wire.
4.4. Shape of Distribution Functions of Wire Characteristics along the Span between the OPL Supports and Troublemaking Areas of the AC50 Cable on Span
4.4.1. Formal Analysis of the Shape of Distribution Functions of Wire Characteristics along the Span
Thus, the constructed dependencies of the quantitative characteristics of the structural, microstructural, and elastic–microplastic properties of aluminum and steel wires after operation in OPL (Figure 11, Figure 12, Figure 13 and Figure 14, and Figures S8–S10 and S12 of Supplementary Materials) reveal that all of these characteristics change in parts of the span in a coordinated manner. Moreover, as can be seen from the comparison of the same characteristics of aluminum and steel wires, in the case of microstructural characteristics obtained from EBSD (Figure S7 of Supplementary Materials and Figure 7), the gap between the minimum and maximum values along the span for steel wires is noticeably smaller. This is probably due to the greater rigidity of the steel core, which is why it is less affected by vibrations during exploitation in the OPL cable. The only exception is the averaged angle <φmisHAGB> of misorientation of HAGB (cf. Figure S7k,l of Supplementary Materials), which is larger than for aluminum wires.
As for the physical parameters of these properties, one can identify four main forms of the distribution functions over the parts of the span. These are the W- and antiphase M-shaped functions, as well as V- and antiphase Λ-shaped ones, which can be sometimes considered the degenerated form of the first two. A parameter characterized by a V-shaped distribution function has maximum values near the clamps (0/1 and 1/1 spans) and a minimum value in the middle of the span (1/2 span). The antiphase Λ-shaped function, in contrast, shows maxima at the clamps and a minimum in the middle of the span. The M-shaped function shows minima at the clamps and in the middle of the span but maxima at a quarter span (1/4 and 3/4 spans). The W-shaped function, in contrast, is characterized by maxima near the clamps and in the middle of the span but minima at a quarter span. As an example of a pronounced V-shaped function, the distribution functions of the misorientation angle LAGB <φmisLAGB> for the center of the cross-section of an aluminum wire match (Figure 7i). As an example of an M-shaped function, one can point out the XRD density ρX of the W-A and W-C sides of an aluminum wire (Figure 11), calculated from the unit cell volume of Al material at these sides. Accordingly, the cubic unit cell parameter a for these sides of the aluminum wire follows an antiphase W-shaped law of change along the span (Figure S9 of Supplementary Materials). The integral density ρ of steel wire is a good example of a Λ-shaped dependence along the span (Figure 13).
Table 4 summarizes the observed forms of the distribution functions over the parts of the span for all analyzed quantitative characteristics.
Table 4.
The shape of the distribution functions of the parameters of aluminum and steel wires along the span after 52 years of operation in the OPL (for description, see paper text below).
Some dependencies have a distorted form, which can be described as V- M-, Λ-, or W-shaped merely in a first approximation.
If a dependence is better described as bowl-shaped (or bell-shaped), though it could be described as V- or Λ-shaped in the first approximation as well, then in the table, such a dependence is indicated as VB or ΛB. For example, the VB shape characterizes the distribution of the steel wire decrement δi over the parts of the span (Figure 14), and the ΛB-shaped distribution function shows the average crystallite size D of the W-C side of the aluminum wire (Figure 12). In turn, if, for a formally M-shaped function, the minimum corresponding to the middle of the span (1/2 span) drooped noticeably below the minima corresponding to the clamps (spans ‘0/1’ and ‘1/1’), then such a function can be described in the first approximation as a V-shaped too. And vice versa, formally, the W-shaped function with the value of the maximum corresponding to the middle of the span, which is noticeably increased in comparison with the maxima near the clamps, can also be described as a Λ-shaped function in the first approximation. In Table 4, such functions are designated as VM and ΛW, respectively. As examples of such distribution functions of parameter values over span parts, one can offer the average value of the aspect ratio <AR> of grains in an aluminum wire (VM-like shape, Figure S7c,d of Supplementary Materials) and the integral density ρ of aluminum wires (ΛW-like shape, Figure 11).
In addition, Table 4 indicates the parts of the span where the maximum deviation from the new wire value is observed, with the minus sign corresponding to a smaller deviation and the plus sign to a larger deviation. If the deviation values on different parts of the span are close, then two parts of the span are indicated: first, the one where the deviation is greater in absolute value, then the one where it is less.
It would be reasonable to assume that those parts of the span, where the deviations are greater compared to the characteristic values of the new wires, are the first candidates for a possible break during further operation.
However, if we formally sum up the number of span parts found in Table 4, where a maximum deviation is observed (maximum in absolute value or close to it), then none of the span parts is noticeably distinguished for aluminum wires (21 times, the deviations are the maximum in the middle of the span (1/2 span), 22 times near the clamps (0/1 span), and 25 times at a quarter span). In the case of steel wire, this formal approach highlights the position at a quarter span (1/4 span), and the corresponding numbers are 13, 22, and 11 for the 0/1, 1/4, and 1/2 span parts, respectively.
The difference increases if the factors are excluded from consideration, the development of which, within reasonable limits, probably does not directly lead to the rupture of the wires, despite being their important characteristics. These are the relative area Srelmax occupied by grains with a size Dgrain = 1.95 μm corresponding to the maximum of the dependence Srel(Dgrain), the average grain aspect ratio <AR>, and the proportion of grains fAR<3.2 with an aspect ratio AR < 3.2. In doing this, the number of cases when the deviations are maximum in absolute value or close to the maximum is 17, 22, and 15 on span parts 0/1, 1/4, and 1/2, respectively, for aluminum wire and 9, 15, and 8 for steel wire.
Thus, such a formal approach to the magnitude of the deviation of the parameters of the structural, microstructural, and elastoplastic properties of aluminum and steel wires after operation in OPL leads to the conclusion that the position of a quarter span (1/4 span) is the most critical in both cases.
4.4.2. Troublemaking Areas of the AC50 Cable on Span
Indeed, if we turn to the numerical characteristics of the physical properties of wires from different parts of the cable along the span, then, from the analysis carried out, it follows that their changes, which are critical for a possible break, occur mostly at a quarter span (1/4 span).
For aluminum wires, the following important physical harbingers of a possible wire breakage at quarter span can be pointed out.
First of all, this is a noticeable decrease in the integral density ρ (determined from densitometry) on a quarter span compared to the other parts of the span (decrease of ≈0.07–0.16%; see Figure 12 and Table S1 of Supplementary Materials), which is associated with the formation of void defects because of the stretching, swinging, vibrations, and oscillations of cables under the action of wind and due to fretting (mechanical wear due to friction of the wires against each other) under the influence of the same reasons.
At the same time, as was mentioned in the discussion in Section 4.3.4, the density ρX of the “top crust” of aluminum wires (NSL with a thickness of ~36 μm, which is determined in the XRD experiment) increases at a quarter span compared to the other parts after long-term operation in the OPL cable (by 0.08–0.14% and 0.07–0.22% for the W-A and W-C sides of the wire, respectively), even exceeding the XRD density ρX of the new aluminum wire by 0.02% (W-A) and 0.11% (W-C). In Section 4.3.4, this densification of the NSL was associated with the possible compression of the lattice of the Al phase of NSL when Si atoms penetrate it and with the compression of Al crystallites because of the neighborhood with denser and harder crystallites of aluminum oxides, which are formed in already noticeable amounts in NSL of aluminum wires after 52 years of continuous use in the OPL (see Section 4.3.1 as well). In turn, the increased content of harder particles of crystalline alumina, which act as abrasives against softer aluminum, leads to increased fretting, to the accelerated formation of defects of a void nature, and, as a result, to a stronger decrease in the integral density ρ of the wire at a quarter span.
On the other hand, the density ρX determined by XRD is the mean value averaged over NSL and calculated from the cubic parameter a of the Al unit cell, i.e., there are also crystallites characterized by smaller and larger parameters a and by the corresponding inverse variation in the density. The presence of Al phase crystallites with somewhat different cubic parameters a, as well as the neighborhood with alumina crystallites, lead to the appearance of microstrains in the crystallites. At a quarter span, the maximum microstrain εs is observed on the W-A side of the aluminum wire compared to other parts of the span and to a new wire (εs = 0.032% compared to εs ≈ 0.011–0.015%, respectively, according to more accurate SSP calculations). An increase in εs is also accompanied by an almost ≈1.5 times increase in the size D of crystallites on the W-A side at a quarter of the span and approximately the same decrease in the middle of the span (Figure 12 and Table S6 of Supplementary Materials). On the W-C side, the quarter-span microstrain is also characterized by a noticeable, albeit smaller, value of εs ≈ 0.20% compared to εs = 0 near the clamps and in the new wire. However, on the W-C side in contrast to the W-A side, the microstrain εs increases in the middle of the span to almost the same value as for the quarter span on the W-A side. This increase in εs is also accompanied by an increase in the size D of the crystallites. Apparently, the increase in εs for the W-C side of the aluminum wire in the middle of the span is due to the influence of the neighboring steel wire of the core.
As a result of the increase in εs to a maximum on the W-A side of the aluminum wire, which is relatively greater than the increase in D, the dislocation density Ldis on the W-A side of the aluminum wire is also maximum at a quarter of the span compared to the W-A side of the wires from other parts of the span and with the new wire (Section 4.3.5). For the W-C side, Ldis also increases, though not reaching the level of Ldis on the W-A side (Figure S12 of Supplementary Materials).
There may appear a rather high level of microstrain on both sides of the quarter-span aluminum wire (εs = 0.020–0.032% at a quarter span compared to εs = 0.015%–0.034% and εs = 0–0.011% near the clamps), as well as greater dislocation density Ldis in this span part, which can lead to a higher probability of wire breakage at a quarter span.
Since the discussed values (ρX, εs, D, and Ldis) are determined from the XRD results and thus refer to NSL with a thickness of ~36 μm, it is possible that their quarter-span changes described above will only lead to the peeling of the NSL as the first stage of degradation. However, this peeling will lead to an increase in fretting and to the destruction of the protective amorphous alumina layer of aluminum wires on a quarter of the span, which, again, increases the likelihood of wire breaks at this position compared to the others.
There is yet another important indicator of the degradation of aluminum wires, namely, the change in the relative fractions of HAGBs and LAGBs (respectively, fHAGB and fLAGB; see Section 3.3) determined from the EBSD.
Since for the aluminum and steel wires, the fractions of HAGBs and LAGBs are, in most cases, the functions either changing along the span in a similar manner or close in shape, though in antiphase (i.e., if fHAGB decreases, then fLAGB increases; see Table S4 and Figure 7e–h), it suffices to further discuss only the fraction of HAGBs.
For the W-A side of the aluminum wire, there is a pronounced minimum of the fraction of HAGBs at a quarter span (see Table S4 of Supplementary Materials and Figure 7g). In the center of the wire cross-section, i.e., in the bulk, this minimum is not so pronounced compared to the middle of the span (the difference is merely ~1%). For the W-C sides, the fraction of HAGBs is minimum in the middle of the span, but its value at a quarter of the span differs by only ≈5%.
Thus, at a quarter of the span (1/4 span) in comparison with other parts of the span, the values of fHAGB fall to a minimum and, accordingly, fLAGB increases to a maximum in the bulk of the aluminum wire and on its W-A edge, while on the W-C edge, they are characterized by values close to the minimum and maximum values, respectively.
A decrease in the fraction of HAGBs and a corresponding increase in the fraction of LAGBs in aluminum wires were observed earlier after their operation in OPL cables [24,25,26] and after fatigue tests [27] and are associated with the tendency of GBs of grains in the wire to line up in one direction. At the same time, in wires from the AC50 cable of the same service life, due to the stabilizing influence of the steel core, this effect was observed to a lesser extent than in wires from the A50-type cable without a steel core [26]. In [78], the formation of large grains with the disordering of HAGBs in nanocrystalline aluminum under tensile loads is associated with strain relaxation preventing the development of cracks. Thus, in wires after long-term operation and fatigue tests, the reverse effect of ordering the HAGBs is observed, which is associated with the aging of the wires. As a result, conditions appear for the development of cracks and other void defects and, finally, for the rupture of the wires.
As can be seen from the above-discussed decrease in fHAGB and, accordingly, the increase in fLAGB at quarter span, the tendency for HAGBs to order, resulting in conditions for the appearance of void defects and the possible breakage of the aluminum wire, is most pronounced at the quarter span of Al wires after 52 years of operation in the OPL.
At the same time, a comparison of the fractions of HAGBs and LAGBs in the new aluminum wire and in the wire after operation for 52 years (Table S4 of Supplementary Materials and Figure 7e,g) leads to the conclusion that, during exploitation, a misorientation of GBs of grains takes place over the entire span in the center of the cross-section (i.e., in the bulk throughout the span, fHAGB decreases after operation and fLAGB increases). However, the misorientation of GBs is maximum near the clamps, while in the middle and, especially, at a quarter of the span, it is less, and there is a tendency for GBs to align along one direction. For the W-A and W-C edges of aluminum wire after 52 years of service in the OPL cable, the grain disordering practically does not change in comparison with the new wire near the clamp (span ‘0/1’), not changing even in the middle of the span for the W-A edges. As discussed above, the alignment of GBs occurs only at a quarter span for W-A and at a quarter and midspan for W-C sides. This behavior of GBs of the aluminum wire from the ASCR AC50 cable after 52 years of operation in OPL differs from the behavior of aluminum wires from the ACSR AC50 cable with a shorter service life of 20 years [26] and those from the AAAC A50 cable with a service life up to 62 years [24]. In [24,26], for aluminum wires after operation, a tendency to align GBs along one direction and an increase in the misorientation of GBs at the W-A edge was found, which is less pronounced for wires from the AC50 cable due to the stabilizing effect of the steel core. Probably, the difference between the behavior of GBs of grains of the aluminum wire studied in this work and in [24,26] is caused by the influence of the steel core wire with a long service life of 52 years.
The steel wire also shows a similar decrease in the fraction of HAGBs and, accordingly, an increase in fLAGB in the bulk of the wire and at both sides at the quarter span compared to other parts of the span and to the new steel wire, although smaller (Table S4 and Figure 7h,f). Probably, for steel wire at the quarter span, there is also a tendency toward the alignment of GBs along a direction after 52 years of operation as the core of an AC50 cable of OPL. Just as for the aluminum wire, one can assume an increased formation of void defects in the steel core wire at a quarter span during operation.
In aluminum wires, the spread between the maximum and minimum values of the average misorientation angle over the entire span was <φmisLAGB> = 8.37–8.66° and <φmisHAGB> = 35.65–38.93° for LAGBs and HAGBs, respectively (Table S4 of Supplementary Materials and Figure S7i,k). For steel wires, this spread was <φmisLAGB> = 8.02–8.47° and <φmisHAGB> = 34.34–41.12° for LAGBs and HAGBs, respectively (Table S4 of Supplementary Materials and Figure 7j,l). One can see that for steel wires, the spread of <φmisLAGB> for LAGBs and <φmisHAGB> for HAGBs (0.45° and 6.78°, respectively) is noticeably larger than for aluminum wires (0.29° and 3.28°, respectively); that is to say, the heterogeneity of different sections in the steel wire is higher. Furthermore, the <φmisLAGB> values of LAGBs in steel wire are, on average, smaller than in aluminum wire, which indicates a lesser misorientation of LAGBs in steel wire. At a quarter span, where the maximum alignment of GBs is observed, the misorientation of HAGBs and LAGBs in steel wire is smaller (<φmisHAGB> = 34.34–34.60° in the bulk and at the edges of the wire for HAGBs and <φmisLAGB> = 8.14–8.47° for LAGBs) than in aluminum wire (<φmisHAGB> = 35.65–38.06° and <φmisLAGB> = 8.47–8.56°, respectively). It can be supposed that the alignment of HAGBs and LAGBs in steel wire at a quarter span after 52 years of operation is more pronounced; that is, the steel wire from the AC50 cable at the quarter span is perhaps even more prone to degradation and the risk of breakage during operation in OPL.
In [27], based on fatigue tests, the conclusion was made that the positions near the clamps were critical for the possible breakage of the aluminum wire. However, that conclusion may not contradict the result obtained here, since in [27], only specimens cut near the clamps and in the middle of the wire between the clamps were studied, not near 1/4 span. In addition, it is obvious that fatigue tests do not fully reproduce the influences on wires during their operation in OPL cables under natural conditions.
However, not only 1/4 span samples demonstrate characteristics that indicate the possibility of a break. An important characteristic such as the integral density ρ of aluminum and steel wires, determined from densitometric measurements, which rules the durability of the wires from the AC50 cable, shows for the wires after operation the minimum value near the clamps (0/1 span), as can be clearly seen from Figure 11 and Figure 13. The XRD study also provided evidence that the crystal lattice of the Al material of the NSL on both sides (W-A and W-C) of the aluminum wire near the clamps expanded during operation (cf., the maximum unit cell parameter a of the Al phase for a sample cut from the aluminum wire of the cable near the clamp in Figure S9 of Supplementary Materials). As a result, the calculated XRD density ρX of NSL of both sides (W-A and W-C) of the aluminum wire near the clamps also shows minimum values. These contemplations allow one to suggest that positions near the clamps (0/1 span) are also likely locations of breakage of the steel and aluminum wires of the AC50 cable in service.
In favor of greater degradation of the wires on a quarter of the span and near the clamps, the fact also says that the thickness of the corrosion layer was maximum for the W-C side of the aluminum and steel wires from the quarter span and near the clamps (for aluminum wires, 16–20 μm for sample N2_W-C (1/4 span) versus 1–3 μm for N1_W-C and N3_W-C (respectively, 0/1 and 1/2 spans), and for steel wires, 16–20 µm for N2_C-W (1/4 and и 0/1 spans) versus 12–16 µm for N3_C-W; see Section 3.1). Moreover, a greater degradation of the wires at a quarter of the span and near the clamps is evidenced by a significantly higher number of γ-Fe2O3 reflections in the XRD patterns of the W-C side of the aluminum wires taken from the cable at a quarter of the span and near the clamps (cf. Figure 9a–c), which correlates with the increased Fe content on the W-C side on these span parts (respectively, 17.32 wt.% and 13.12 wt.% compared to 6.18 wt.% in the middle of the span and 3.01 wt.% in the new aluminum wire; see Table 3). This indicates a greater content of γ-Fe2O3 in the corrosion layer of the W-C side (or greater contamination of the W-C side) of the aluminum wire, i.e., greater galvanic corrosion of aluminum and steel wires on these parts of the span. The greater degradation of the galvanic layer of steel wires from the beginning (0/1 span) and quarter the span (1/4 span) is also evidenced by the significantly higher Fe content on the wire surfaces in these span parts according to EDX data (40.39 wt.% and 34.82 wt.% for span parts ‘0/1’ and ‘1/4’ in comparison with 13.92 wt.% at midspan and 4.28 wt.% in new steel wire; see Table 3). In addition, for steel wire, as discussed in Section 4.2.2, the tendency toward amorphization of the corrosion layer is observed, which is stronger near the clamps and at a quarter span than in the midspan.
The observed decrease in Young’s modulus E at a quarter span to the minimum value along the span for aluminum wires and near the clamps for steel wires, as well as the accompanying correlated changes in the independent decrement δi, is obviously not the reason for the breakage of the wires, although it is an indicator of the location in the span where such a break is more likely.
5. Conclusions
Studies of aluminum and steel wires from the ACSR-type AC50/8-brand cables (six aluminum wires twisted around a central core of one steel wire) with a service life of 0 and 52 years were carried out using EDX, EBSD, XRD methods, densitometry, and acoustic measurements.
Analysis of the data obtained has led us to the following conclusions.
5.1. New Aluminum and Steel Wires
Unlike the protective alumina layer of aluminum wires, the galvanic layer in the new steel wire already has defects and is contaminated with crystalline iron and iron oxides (mainly FeO and γ-Fe2O3) and zinc oxides (ZnO and ZnO2).
5.2. Aluminum and Steel Wire of the AC50 Cable after 52 Years in OPL
5.2.1. Corrosion Layers of Contacting Steel and Aluminum Wires and NSL of the Aluminum Wire Side in Contact with the Atmosphere
According to the OM studies, the outer surface of Al wires in direct contact with air (W-A side of the wire) after 52 years of service in OPL shows mainly atmospheric corrosion in the form of numerous pits on the surface. The side of the Al wire in contact with the steel wire of the core (W-C side) is more amenable to galvanic corrosion, just as the steel wire surfaces (C-W surfaces) are. As a result of galvanic corrosion during operation in the OPL cable for 52 years, thick corrosion layers are formed on the W-C surface of the aluminum wire and on the C-W surface of the steel wire.
According to the X-ray phase analysis results, corrosion layers of steel wires consist mainly of crystalline iron oxides with γ-Fe2O3 as the main component and zinc oxides. Zinc and iron oxides appear as a result of the oxidization of Zn in the galvanic layer and oxidization of iron, which, for the cable at the beginning and at a quarter of the span, increases its content in the near-surface layer of steel wire by an order of magnitude (according to EDX) due to the destruction of the protective galvanic layer.
On the W-C side of the aluminum wire, a corrosion layer is formed with a noticeable content of γ-Fe2O3 moved from the corrosion layer of the adjacent steel wire. After 52 years of service in OPL, the galvanic corrosion of the steel wire and the W-C side of the aluminum wire cut from the cable near the clamps and from the quarter span develops more than at the middle of the span. In the steel wire on the same parts of the span, a stronger amorphization of the corrosion layer occurs.
On the W-A side of aluminum wires in NSL up to ~24 μm thick, after 52 years of service in OPL, δ- and/or δ*-Al2O3 phases crystallize in amounts of ~1.5 vol.%.
5.2.2. Change in the Quantitative Characteristics of Properties along the Span
Analysis of the obtained results of EBSD, XRD, densitometry, and acoustic measurements has shown that the quantitative characteristics of the structure, microstructure, and elastoplastic properties of aluminum and steel wires after operation in OPL cables change along the span between the supports not randomly but correlated with each other. Most of the laws of change in quantitative characteristics in span parts between clamps on OPL supports can be described as V- and W-shaped and antiphase Λ- and M-shaped functions. However, for some of the characteristics, this is true only in the first approximation; more precisely, these laws might be described as distorted bowl-shaped VB or bell-shaped ΛB functions with extrema near the clamps or, also, as distorted M-shaped (VM) or distorted W-shaped (ΛW) functions with global extrema at the midspan. For most characteristics except for the fraction of HAGBs of grains, steel wire is characterized by a smaller difference between the maximum and minimum values of the characteristics. This confirms its stabilizing role for aluminum wire, and it is probably due to the lesser effect of vibrations and tension on it due to the greater rigidity of the steel wire material.
5.2.3. Microstructure Parameters from XRD Analysis and Dislocation Density
In aluminum wires after operation, in some parts of the span, an increase in the size D of crystallites of the Al phase is observed (due to the recrystallization process caused by heating the OPL cables during operation), accompanied by a larger relative increase in microstrain εs from zero or a close to zero value in the new wire. Along the OPL span between the clamps, D and εs follow a law described as an M-shaped function in the case of the W-A side of the wire with maximum values of D and εs at a quarter of the span. For the W-C side, the change function along the span is ΛB-shaped, and for εs, it is Λ-shaped. Near the clamps for both wire sides, the microstrain is zero or close to zero. As a result of a larger relative growth of the microstrain in aluminum wires, the dislocation density Ldis appears, differing noticeably from zero in some span parts far from the clamps. The law of Ldis change is the same as for εs, with a maximum at a quarter span for the W-A side and at half a span for the W-C side. The reduction in εs and Ldis to zero values or close to zero near the clamps is due to the healing of the defects, which is caused by the return process in aluminum wires when the OPL operating temperature rises to ~90–130 °C due to the applied high voltage.
5.2.4. Preferential Orientation of Aluminum Wire Crystallites and Merging of Grains
After operation in the OPL cable, on the long (longitudinal) W-A or W-C sides of the wire, the amount of Al crystallites with a preferential orientation along the crystallographic direction [011] increases. It is possible that this enhancement of the preferential orientation is associated with a decrease in the f=2 fraction of grains with the smallest misorientation angle φmis = 2° due to the merging of grains into a grain.
5.2.5. XRD Density of Aluminum Wire NSL and Integral Density of Aluminum and Steel Wires
The integral density ρ of aluminum and steel wires after 52 years of operation in the AC50 OPL cable in all span parts is less than ρ of new wires. After the operation in OPL, the change in ρ of aluminum and steel wires along the span between clamps follows the ΛW- (W-shaped with enhanced value of maximum in the middle of the span) and Λ-shaped laws with a minimum integral density at a quarter and at the beginning of the span for aluminum and steel wire, respectively.
XRD density ρX of the W-A and W-C sides of aluminum wire, corresponding to NSL with a thickness of ~36 μm, is systematically more than integral density ρ. The XRD density of both sides of the aluminum wire after the operation in OPL follows an M-shaped law along the span, antiphase with respect to the change in the cubic unit cell parameter a of Al wire material. Near clamps, the XRD density ρX is minimum over the span and less than that of the new wire, and at the quarter span, where it is at a maximum, ρX is greater than that of the new wire.
Operation in OPL results in an appearance of a noticeable difference between the higher XRD (ρX) density of NSL and the smaller integral (ρ) density of the aluminum wire, reaching ~0.36–0.65% in different span parts for the W-C side and ~0.32–0.38% for the W-A side.
A decrease in the integral (ρ) and XRD (ρX) densities is associated with the formation of void defects in the wires and their stretching during operation in the OPL cable due to the sagging and fretting of neighboring wires caused by their swing, vibration, oscillation, and so on as a result of the effects of winds of varying strength with changing air humidity and daily and annual temperature fluctuations. In the case of steel wire, the decrease in ρ is also (probably and partially) associated with the incorporation of Al atoms into the Fe wire material during direct contact between aluminum and steel wires due to the destruction of the protective layers of aluminum and steel wires as a result of fretting.
The increase in ρX of the aluminum wire above the value in the new wire is probably caused by the entry into the structure of atoms with a larger Slater radius, for example, Si, from the surrounding atmosphere or from the protective grease of the wires. Also, an increase in ρX can be caused by the formation of a sufficiently large amount of alumina crystallites, which compress the crystal lattice of neighboring Al crystallites.
5.2.6. Grain AR and the Plateau–Rayleigh Instability, Alignment, and Size of Grains
The fragmentation of aluminum and steel wires into grains occurs as a result of the Plateau–Rayleigh instability phenomenon during the wire production process. As a result, the vast majority (more than ~98.4%) of grains in the wire cross-section are characterized by an aspect ratio value AR < 3.2 (from EBSD results), which is close to the theoretical limit AR < π. This ratio, as well as the grain shape of aluminum and steel wires, practically do not change after 52 years of operation.
Among important characteristics of the “health” of the wires, the fractions of HAGBs and LAGBs, fHAGB and fLAGB, are worth noting, which are the fractions of GBs with misorientation angles φmis ≥ 15° and 2° < φmis < 15°, respectively. The analysis has shown that fLAGB changes along the span almost in antiphase with respect to fHAGB, so it is sufficient to analyze fHAGB alone. A decrease in fHAGB matches the tendency toward the alignment of GBs along a direction, and an increase in fHAGB corresponds to misorientation.
So, considering an increase in fHAGB in comparison with a new cable, in aluminum wires of the AC50 cable after 52 years of service in the OPL, the misorientation of GBs of grains is stronger over the entire span in the center of the wire cross-section, i.e., in the bulk.
At the same time, the fraction of HAGBs in the bulk, fHAGB, varies along the span according to a W-shaped law with maxima near the clamps, i.e., the misorientation of GBs is maximum near the clamps, whereas they tend to align at the quarter span. For the W-A and WC edges, the fHAGB change function is, respectively, W- and distorted V-shaped. Thus, the greatest alignment of GBs occurs at a quarter span for W-A and midspan for W-C sides. Probably, the alignment of GBs of grains of the same direction promotes both the formation of extended GBs and, as a result, the development of crack nuclei.
In steel wires after 52 years of operation, the fraction of HAGBs, fHAGB, in the center of the cross-section and at both edges along the entire span is less than in new steel wire, following a W-shaped function of change over span parts. Thus, for steel wires after service in OPL, a tendency of alignment of GBs along one direction appears at a quarter span in the bulk and on both sides of the steel wire in contact with adjacent aluminum wires. Smaller average quarter-span misorientation angles for HAGBs and LAGBs of the steel wire compared to the aluminum one (values averaged over the bulk and edges are <φmisHAGB> = 34.50° and <φmisLAGB> = 8.34° for steel wires, respectively, and <φmisHAGB> = 36.60° and <φmisLAGB> = 8.50° for aluminum wires) lead to the assumption that after 52 years of service, in steel wire at a quarter of the span, the alignment of GBs is more pronounced, and, therefore, the development of cracks and degradation of steel wire may be more pronounced than for aluminum wire.
The exploitation of wires for 52 years in AC50 OPL leads to a change in the average grain size <Dgrain>. At the center of the cross-section (i.e., in the bulk) and at the W-A and W-C sides of the aluminum wires, <Dgrain> varies in span parts, following a Λ-shaped law with minima near the clamps and a maximum in the middle of the span. For steel wires, the function of changing <Dgrain> in the bulk corresponds to the W-shaped law, and at the wire sides, it is described by M- and VM-shaped functions. In comparison with new wires, near the clamps and at a quarter of the span, <Dgrain> decreases by ~3.0–3.5% for the bulk and W-A side of the aluminum wire, and in the middle of the span, their <Dgrain> increases, respectively, by ~4.4% and ~ 7.5%. For the W-C sides, <Dgrain> increases in all parts of the span by ~1.2%, ~1.9%, and maximally by ~6.8% near the clamps at a quarter and at half the span.
The increase and decrease in the average grain size <Dgrain> of long-life wires is likely owing to a combination of various factors.
Taking into account Λ- (for W-C side) and M-shaped (W-A) functions of change in average size D of the crystallites along the span, the growth factor for D works for all parts of aluminum wire and, in general, away from clamps. For steel wire, due to the impossibility of determining the parameters of the microstructure from the XRD experiment because of the disappearance of the reference reflections of Zn and Fe after long-term operation in OPL and heavy overlapping of reflections of different crystalline phases, the influence of this factor could not be clarified.
The merging of grains with the smallest misorientation angle, φmis = 2°, is expressed through a decrease in the fraction of such grains, f=2, compared to a new wire or compared to other parts of a span. Since the f=2 fraction for the center of the cross-section of the aluminum wire and its W-A and W-C edges is characterized by M- (center and W-A edge) and Λ-shaped (W-C) functions with f=2 decreasing near the clamps, the merging of grains leads to an increase in <Dgrain> in aluminum wire near the clamps both in comparison with the new wire and in comparison with other parts of the span far from the clamps. For aluminum wires of the AC50 cable with a long service life, the stabilizing effect of the steel core enhances the tendency of GB alignment for GBs with the smallest misorientation angle, which leads to the enhancement of grain merging.
For steel wires characterized by M-shaped distribution functions of f=2 along the span, a decrease in the f=2 fraction occurs, though with a very small dip in the middle of the span, only at the points in the span with minimum functions but not relative to new wires. It can be concluded that the merging of grains, which leads to an increase in <Dgrain> relative to its values in other parts of the span, although being less than in the new wire, takes place at the ends of the span, mainly in the bulk of the steel wire.
The gravitational sagging of the cable between the supports, on the one hand, contributes to the merging of grains. On the other hand, by pulling the grains apart, it slows down the merging of grains to a greater extent just near the supports (i.e., near the clamps). In sum, the merging of grains is maximum at the point of maximum sag in the middle of the span, resulting in a Λ-shaped function of change in <Dgrain> along the span for aluminum wires.
The absence of a complete correlation between the f=2 fraction of grains with the smallest misorientation angle φmis = 2° and the average grain size <Dgrain> is explained by the multidirectional action of various factors affecting the grain size in aluminum and steel wires and their mutual influence on each other.
5.2.7. Parts of the Span with an Increased Probability of Wire Breakage and Characteristics Sensitive to Possible Breakage
The analysis has been carried out of the change in the characteristics of the physical properties of aluminum and steel wires in parts of the OPL span between the clamp and the middle of the OPL span before and after 52 years of operation in OPL, allowing one to identify parts of the span with an increased probability of breaking the wires of the AC50 cable during its operation in OPL and to reveal characteristics that foreshadow this break.
For pieces of aluminum and steel wires from different parts of the span, the integral density ρ measured by densitometry is one of such characteristics. A noticeable decrease in ρ due to the appearance of void defects is a serious sign of a possible wire break.
For cross-sections of aluminum and steel wires from different parts of the span, such characteristics are the microstructural ones determined from the analysis of EBSD maps in the center of the cross-section and at its edges. Among the parameters, fractions of GBs with misorientation angles φmis = 2°, 2° < φmis < 15°, and φmis ≥ 15° (respectively, f=2, fLAGBs. and fHAGBs) are the most sensitive to possible wire breakage. A decrease in f=2 or fHAGBs followed by an increase in fLAGBs indicates a tendency for GBs grains to align in one direction, which can lead to the development of cracks and the formation of void defects.
For NSL with a thickness of ~36 μm at the W-A and W-C sides of aluminum wires, the important characteristics are the cubic unit cell parameter, a, of the Al phase and its XRD density, ρX; the average size D of Al phase crystallites; the absolute average value εs of microstrain in them; and the average dislocation density Ldis, as well as the parameter, characterizing the predominant orientation of crystallites (all these characteristics are determined from the XRD measurements). A noticeable increase in the parameter a and a corresponding decrease in ρX and/or a faster increase in εs compared to D, which results in an increase in the dislocation density Ldis, are indications of a possible failure of at least NSL. As the parameter of preferential orientation, the ratios of the maximum intensities of the Al reflections Imax022/Imax111 and Imax002/Imax022 are usable since, for the investigated wires, the preferential orientation direction is [011] (the 022 reflection shows an intensity increased compared to the tabulated value). A significant change in these ratios in comparison to the tabulated ratios indicates a strong preferential orientation, which can lead to the alignment of GBs of grains along one direction.
The performed analysis of changes in the characteristics of the structural and microstructural properties of aluminum and steel wires from different parts of the ACSR cable AC50 brand along the span shows that the changes in the above characteristics in the course, which is critical for a possible break, occur mostly at a quarter span (1/4 span) and near clamps (0/1 span).
5.2.8. Elasto-Microplastic Characteristics and Integral Density
Elasto-microplastic characteristics such as Young’s modulus E, independent decrement δi, and microplastic flow stress σs show correlated changes across span parts too. In particular, the changes in E, δi, and σs of an aluminum wire are described along the span, respectively, by the ΛW- (W-like function described as V-shaped in the first approximation), Λ-, and W-shaped function, while, for the steel wire, they are Λ-, VB- (bowl-like function described as V-shaped in the first approximation), and Λ-shaped functions. The Λ-shaped function of the change in δi along the span in aluminum wires is explained by return and recrystallization processes starting at an operating temperature of OPL ~90–130 °C, which leads to an enhanced healing of the defects near the clamps. In the steel wires, an opposite V-shaped (more precisely, VB) function of the change in δi is observed, since the operating temperature is not enough to start these processes, and a large number of defects remains near clamps.
For both aluminum and steel wires, the changes in E repeat the changes in integral density ρ. These characteristics can be used as indicators of possible wire breakage since they correspond to structural and microstructural processes leading to such a breakage. In particular, E and ρ decrease for both types of wires after operation in OPL.
5.3. Summing Up
Thus, in brief, the main results are as follows.
Aluminum and steel wires of the ACSR cable of AC50/8 brand after 0 and 52 years of operation in OPL are investigated by means of OM, EDX, EBSD, XRD, densitometry, and acoustic measurements.
In the new steel wire, the galvanic layer already has defects and is contaminated with iron and iron oxides and zinc oxides.
After operation in OPL, a thick corrosion layer develops on the surface of the steel wire and the W-C side of the aluminum wire in contact with the steel wire. The development of the thicker corrosion layer and a tendency toward its amorphization in steel wires are stronger at the beginning and at a quarter of the span. In the NSL on the W-A side of aluminum wires, which is directly affected by air, particles of crystalline aluminum oxides (δ- and/or δ*-Al2O3) are formed.
The Plateau–Rayleigh instability phenomenon controls the fragmentation of aluminum and steel wires into grains during the wire production process, resulting in an aspect ratio value AR < 3.2 for the vast majority (more than ~98.4%) of grains. After 52 years of operation, this ratio and histograms of AR distribution practically do not change, evidencing the invariability of the grain shape.
Operation in OPL results in the growth of the average crystallite size D (due to the recrystallization process), magnitude of the absolute average value of microstrain εs, and estimated dislocation density Ldis of the aluminum wires far from clamps.
Among factors causing the growth of the grain size <Dgrain> of the wires after operation in OPL, there are an increase in the average size D of the crystallites making up the grains, the merging of grains with the smallest misorientation angle φmis = 2°, and the gravitational sagging of the cable between the supports. The first factor is the main factor of growth of the grain size away from clamps in aluminum wires. The merging of grains is essential in aluminum and steel wires mainly near clamps and in gravitational sagging of the cable in the middle of the span. Grain merging in aluminum wires is enhanced due to the stabilizing effect of the steel core, which leads to an increase in the tendency to align grains with the smallest misorientation angle in aluminum wire from the AC50 cable with a long service life of more than 20 years (according to comparison with previous and this work). The Λ-shaped function of change of <Dgrain> along the span for aluminum wires of the AC cable of a long service life of 52 years is caused by gravitational sagging of the cable during exploitation in OPL.
For the wires from different span parts of the cable, operation in OPL results in different levels of enhancement of preferential orientation of crystallites and a tendency toward the alignment of grain GBs in one direction, which, probably, leads to the formation of crack nuclei.
For aluminum wires from the AC50 cable after 52 years of service in the OPL, the misorientation of GBs of grains is stronger over the entire span in the bulk of the wires. At the same time, in the bulk of the wires, the misorientation of GBs is maximum near the clamps, whereas at the quarter span, there are a lot of grains that tend to align. In comparison to the new wire and with other span parts of the cable, the W-A side (affected directly by air) from quarter span and W-C side (in direct contact with the steel wire) from midspan exhibit the greatest alignment of GBs. Due to smaller misorientation angles of GBs, the alignment of GBs and the degradation of steel wire at a quarter of the cable span may be more pronounced than for the aluminum wire.
Operation in OPL results in the development of a noticeable difference in the integral (ρ) and XRD (ρX) densities. The smaller value of the integral density ρ and higher XRD density ρX lead to the model of aluminum wire after the operation in OPL with a less dense bulk covered with a “crust” of a denser NSL.
A denser NSL is formed, probably, due to the inclusion of Si atoms in the structure of the Al phase of the aluminum wire and the compression of Al crystallites due to the aluminum oxide crystallites formed in NSL and adjacent to Al crystallites. A decrease in the integral density ρ is associated with the development of defects of a hollow nature in the aluminum wire. The largest decrease in ρ is observed at the clamps for the steel wire and a quarter of the cable span for the aluminum one. The decrease in the XRD density ρX of NSL is associated with the tension of the wire during operation. For the aluminum wire, the largest decrease in ρX along the span parts is observed at the clamps.
The changes in all characteristics of the structural, microstructural, and elastic–microplastic properties of the aluminum and steel wires along the span parts are described, at least in the first approximation, by means of a V- and M-shaped or antiphase Λ- and W-shaped functions. The stabilizing role of the steel wire is evidenced by a mostly smaller difference between the maximum and minimum values of the functions due to greater rigidity of the steel wire material.
The difference between the Λ-shaped function of the change in independent decrement δi along the span in aluminum wires and the V-shaped (in the first approximation) function for the steel wire is associated with the phenomenon of healing of defects near the clamps in the aluminum wire. Healing occurs due to the processes of return and recrystallization, which start in aluminum wires at an OPL operating temperature ~90–130 °C, sufficient for them to begin in aluminum.
A noticeable drop in Young’s modulus E and integral density ρ, observed at a quarter of the span for the aluminum wire and near the clamps for the steel wire, can be used as an indicator of a possible wire break.
During operation in OPL, aluminum and steel wires from the AC50 cable are most likely to break at a quarter (and three-quarters) of the span and near the clamps.
Supplementary Materials
The following supporting information can be downloaded at: https://www.mdpi.com/article/10.3390/cryst13081253/s1, Section S1. Samples: Subsection S.1.1. Samples: Table S1. Sizes (diameter Ø and length l) of cylindrical aluminum and steel wire samples; Table S2. Wire samples investigated; Subsection S1.1.2. Estimates of penetration depth of X-rays for maximum diffraction angle: Table S3. Estimates of the penetration depths Tpen for different possible crystalline phases for maximum diffraction angle; Section S2. Results: Section S.2.1. Results of OM: Figure S1. OM images of Al wires (a) N1_W-A, (b) N1_W-C, (c) N3_W-A, (d) N3_W-C, (e) N2-2_W-A, and (f) N2-2_W-C and steel wires (g) N1_C-W and (h) N3_C-W; Section S2.2. Results of EDX: Figure S2. EDX spectra obtained from the long (external) side of the samples (a) N0_C, (b) N0_W, (c) N1_C-W, (d) N1_W-A, (e) N1_W-C, (f) N2_C-W, (g) N2_W-A, (h) N2_W-C, (i), N3_C-W, (k) N3_W-A, and (l) N3_W-C and EDX spectra registered from the centers of the cross-sections of the wires (m) N2_C and (n) N2_W; Section S2.3. Results of EBSD: Figure S3. EBSD distribution maps of the Euler angles φ1, Φ, and φ2 of the cross-sections of aluminum (a–c) N1_W (0/1 span) and (d–f) N3_W (1/2 span) wires and steel core (g–i) N1_C (0/1 span) and (j–l) N3_C (1/2 span) wires; Figure S4. Grain size distribution histograms in the central and edge areas of the cross-sections of aluminum wires (a) N1_W (0/1 span) and (b) N3_W (1/2 span) and steel wire cores (c) N1_C (0/1 span) (d) N3_C (1/2 span) from the AC50 cable after 52 years of operation in an OPL; Figure S5. Relative areas Srel occupied by grains in dependence on the grain sizes Dgrain in (a) N2 (1/4 span) and (b) N3 (1/2 span) after 52 years of operation in an OPL; Figure S6. AR distribution histograms in the central and edge areas of the cross-sections of aluminum wires (a) N1_W (0/1 span) and (b) N3_W (1/2 span) and those of steel wire cores (c) N1_C (0/1 span) (d) N3_C (1/2 span) from the AC50 cable after 52 years of operation in an OPL; Table S4. Microstructure characteristics of the aluminum wires (W) and steel wire core (C) at different locations of the cross-section of the wires from the AC50 cable after 52 years of operation in OPL, obtained through analysis of the distribution histograms of the grain sizes; Figure S7. (a,b) Relative area Srelmax occupied by grains with size Dgrain = 1.95 μm (where maximum of the Srel(Dgrain) dependence is observed), (c,d) average AR value <AR>, (e,f) grain fraction with AR < 3.2, and (g,h) mean misorientation angle <φmis> averaged over all observed individual GBs with misorientation angles φmis ≥ 2° for (a,c,e,g) aluminum wire (W) and (b,d,f,h) steel wire core (C) of AC50 cable at different span parts after 52 years of operation in OPL; Section S2.4. Results of XRD: Table S5. Crystallographic data of the crystalline phases observed for aluminum and steel wires (at room temperature) according to PDF-2 database; Table S6. Estimated penetration depths Tpen for Cu-Kα radiation and maximum Bragg angle 2θBmax, where the reflections attributed to the crystalline phase are observed for different samples; Table S7. Results of XRD analysis of Al wires from the AC50 ACSR-type cable at different span parts between OPL supports (temperature of XRD measurements is Tmeas = 314 ± 1 K); Figure S8. Change in the Imax002/Imax022 ratio along the span for the aluminum wire (for W-A and W-C sides of the wire) from the AC50 cable after 52 years operation in OPL; Figure S9. Change in the cubic unit cell parameter a along the span for the aluminum wire (for W-A and W-C sides of the wire) from the AC50 cable after 52 years operation in OPL; Figure S10. Change in the Al-crystallite size D0 calculated in the model of the microstrain absence (εs = 0) along the span for the aluminum wire (for W-A and W-C sides of the wire) from the AC50 cable after 52 years of operation in OPL; Figure S11. (a,c,e,g,i,k,m,o) WHP plots and (b,d,f,h,j,l,n,p) SSP ones constructed for the aluminum wire sides W-A (a,b,e,f,i,j,m,n) and W-C (c,d,g,h,k,l,o,p) in contact, respectively, with air and steel core wire; Section S2.5. Results of acoustics measurements: Table S8. Young’s modulus E, amplitude-independent decrement of elastic vibrations δi, and microplastic flow stress σs of aluminum and steel wire samples prepared from AC50 OPL cables depending on the span position; Section S.3. Discussion: Subsection S3.1 Comparison of elemental and phase content according to EDX and XRD in current research and in literature data; Section S.3.2. Estimation of density of dislocations in aluminum wires from AC50 cable after 52 years of operation in OPL: Figure S12. Change in the normalized dislocation density Ldisnorm along the span for the aluminum wire (for W-A and W-C sides of the wire and averaged over W-A and W-C sides) from the AC50 cable after 52 years of operation in OPL; References [5,11,14,24,25,26,27,30,37,39,41,42,43,44,45,46,47,48,49,50,51,52,53,55,56,57,58,59,60,61,62,73] are cited in Supplementary Materials.
Author Contributions
Conceptualization: A.A.L., P.N.B., M.M.S., V.G.K. and I.A.B. Data curation: A.A.L., A.I.L., M.V.N., B.K.K. and A.G.K.; Formal analysis: A.A.L., A.I.L., M.V.N., B.K.K. and A.G.K.; Funding acquisition: P.N.B. and M.M.S.; Investigation: A.A.L., A.I.L., M.V.N., B.K.K. and A.G.K.; Methodology: A.A.L., A.G.P., M.V.N., N.D.P., R.V.S., P.N.B., M.M.S., V.G.K., I.A.B. and D.S.N.; Project administration: A.A.L., N.D.P., R.V.S. and P.N.B.; Resources: M.M.S., V.G.K., I.A.B. and D.S.N.; Software: A.A.L., A.I.L., M.V.N. and B.K.K.; Supervision: A.A.L.; Validation: A.A.L., A.G.P., N.D.P., R.V.S., P.N.B., M.M.S., V.G.K., I.A.B. and D.S.N.; Visualization: A.A.L., A.G.P., A.I.L., M.V.N. and B.K.K.; Writing—original draft: A.A.L., A.G.P. and M.V.N.; Writing—review and editing: A.A.L. and A.G.P. All authors have read and agreed to the published version of the manuscript.
Funding
This research was funded by the state assignment of the Russian Federation FSWF-2020-0025 “Development of methods and analysis of ways to achieve a high level of safety and competitiveness of objects of energy systems based on digital technologies”.
Institutional Review Board Statement
Not applicable.
Informed Consent Statement
Not applicable.
Data Availability Statement
The data presented in this study are available on request from the corresponding author.
Acknowledgments
The work was carried out using the equipment and software of the Center of Joint Use “Materials Science and Diagnostics in Advanced Technologies” (Ioffe Institute, St. Petersburg, Russia).
Conflicts of Interest
The authors declare no conflict of interest.
References
- Papailiou, K.O. Overhead Lines. In Springer Handbook of Power Systems; Papailiou, K.O., Ed.; Springer: Singapore, 2021; pp. 611–758. [Google Scholar] [CrossRef]
- De Araújo, M.M.; Manheimmer, W.A.; Serra, E. Corrosion aspects in aluminum electrical conductors. Mater. Sci. 1988, 8, 175–197. [Google Scholar] [CrossRef]
- Xu, X.; Yu, Z.; Li, Y.; Wang, W.; Xu, L. Microstructural Study of Arc Beads in Aluminum Alloy Wires with an Overcurrent Fault. Materials 2021, 14, 4133. [Google Scholar] [CrossRef] [PubMed]
- Karabay, S.; Önder, F.K. An approach for analysis in refurbishment of existing conventional HV–ACSR transmission lines with AAAC. Electr. Power Syst. Res. 2004, 72, 179–185. [Google Scholar] [CrossRef]
- Achiriloaiei, D.; Medeleanu, M. Studies on the Effects of Environmental Pollution on ACSR Conductors. Rev. De Chim. 2019, 70, 3984–3986. [Google Scholar] [CrossRef]
- Kalombo, R.B.; Araujo, J.A.; Ferreira, J.L.A.; da Silva, C.R.M.; Alencar, R.; Capra, A.R. Assessment of the fatigue failure of an All Aluminium Alloy Cable (AAAC) for a 230 kV transmission line in the Center-West of Brazil. Eng. Fail. Anal. 2015, 61, 77–87. [Google Scholar] [CrossRef]
- Karabay, S.; Ertürk, A.T.; Zeren, M.; Yamanoğlu, R.; Karakulak, E. Failure analysis of wire-breaks in aluminum conductor production and investigation of early failure reasons for transmission lines. Eng. Fail. Anal. 2018, 83, 47–56. [Google Scholar] [CrossRef]
- Alshwawreh, N.; Alhamarneh, B.; Altwarah, Q.; Quandour, S.; Barghout, S.; Ayasrah, O. Electrical Resistivity and Tensile Strength Relationship in Heat-Treated All Aluminum Alloy Wire Conductors. Materials 2021, 14, 5738. [Google Scholar] [CrossRef]
- Smyrak, B.; Jurkiewicz, B.; Zasadzińska, M.; Gniełczyk, M.; Jałowy, P. The Effect of Al-Mg-Si Wire Rod Heat Treatment on Its Electrical Conductivity and Strength. Metals 2020, 10, 1027. [Google Scholar] [CrossRef]
- Kim, S.D.; Morcos, M.M. Mechanical deterioration of ACSR conductors due to forest fires. IEEE Trans. Power Deliv. 2003, 18, 271–276. [Google Scholar] [CrossRef]
- Lequien, F.; Auzoux, Q.; Moine, G.; Rousseau, M.; Pasquier-Tilliette, S.; Holande, A.; Ammi, S.; Heurtault, S.; Prieur, P. Characterization of an aluminum conductor steel reinforced (ACSR) after 60 years of operation. Eng. Fail. Anal. 2021, 120, 105039. [Google Scholar] [CrossRef]
- Chen, G.H.; Wang, X.; Wang, J.Q.; Liu, J.J.; Zhang, T.; Tang, W.M. Damage investigation of the aged aluminium cable steel reinforced (ACSR) conductors in a high-voltage transmission line. Eng. Fail. Anal. 2012, 19, 13–21. [Google Scholar] [CrossRef]
- Shahid, M.A.; Khan, T.M.; Zafar, Z.; Hashmi, M.F.; Imran, M. Health diagnosis scheme for in-service low voltage Aerial Bundled Cables using super-heterodyned airborne Ultrasonic testing. Electr. Power Syst. Res. 2020, 180, 106162. [Google Scholar] [CrossRef]
- Kreislova, K.; Jaglova, M.; Turek, L.; Koukalova, A. Evaluation of corrosion of long-term exposed aluminium conductor. Koroze Ochr. Mater. 2013, 57, 25–34. [Google Scholar] [CrossRef][Green Version]
- Deng, Y.J.; Yu, J.C.; Xia, K.Q.; Yang, L. Corrosion Conditions Analysis of In-service ACSR Overhead Lines. Appl. Mech. Mater. 2013, 446–447, 753–758. [Google Scholar] [CrossRef]
- Kalombo, R.B.; Pestana, M.S.; Freire, R.C.S.; Ferreira, J.L.A.; da Silva, C.R.M.; Veloso, L.A.C.M.; Camara, E.C.B.; Araujo, J.A. Fatigue life estimation of an all aluminium alloy 1055 MCM conductor for different mean stresses using an artificial neural network. Int. J. Fatigue 2020, 140, 105814. [Google Scholar] [CrossRef]
- Lu, J.; Hu, J.; Fang, Z.; Qiao, X.; Zhang, Z. Electric Field Distribution and AC Breakdown Characteristics of Polluted Novel Lightning Protection Insulator under Icing Conditions. Energies 2021, 14, 7493. [Google Scholar] [CrossRef]
- Brettschneider, S.; Fofana, I. Evolution of Countermeasures against Atmospheric Icing of Power Lines over the Past Four Decades and Their Applications into Field Operations. Energies 2021, 14, 6291. [Google Scholar] [CrossRef]
- Isozaki, M.; Adachi, K.; Hita, T.; Asano, Y. Study of corrosion resistance improvement by metallic coating for overhead transmission line conductor. Electr. Eng. Jpn 2008, 163, 41–47. [Google Scholar] [CrossRef]
- Matos, I.M.; Rocha, P.H.C.; Kalombo, R.B.; Veloso, L.A.C.M.; Araujo, J.A.; Castro, F.C. Fretting fatigue of 6201 aluminum alloy wires of overhead conductors. Int. J. Fatigue 2020, 141, 105884. [Google Scholar] [CrossRef]
- Rocha, P.H.C.; Langlois, S.; Lalonde, S.; Araújo, J.A.; Castro, F.C. A general life estimation method for overhead conductors based on fretting fatigue behavior of wires. Theor. Appl. Fract. Mech. 2022, 121, 103443. [Google Scholar] [CrossRef]
- Kalombo, R.B.; Reinke, G.; Miranda, T.B.; Ferreira, J.L.A.; da Silva, C.R.M.; Araújo, J.A. Experimental Study of the Fatigue Performance of Overhead Pure Aluminium Cables. Procedia Struct. Integr. 2019, 19, 688–697. [Google Scholar] [CrossRef]
- Miranda, T.; Badibanga, R.; Araújo, J.A.; Silva, C.; Ferreira, J. Fatigue Evaluation of All Aluminium Alloy Conductors Fitted with Elastomeric and Metallic Suspension Clamps. IEEE Trans. Pow. Deliv. 2022, 37, 539–546. [Google Scholar] [CrossRef]
- Levin, A.A.; Narykova, M.V.; Lihachev, A.I.; Kardashev, B.K.; Kadomtsev, A.G.; Brunkov, P.N.; Panfilov, A.G.; Prasolov, N.D.; Sultanov, M.M.; Kuryanov, V.N.; et al. Modification of the structural, microstructural, and elastoplastic properties of aluminum wires after operation. Metals 2021, 11, 1955. [Google Scholar] [CrossRef]
- Narykova, M.V.; Levin, A.A.; Prasolov, N.D.; Lihachev, A.I.; Kardashev, B.K.; Kadomtsev, A.G.; Panfilov, A.G.; Sokolov, R.V.; Brunkov, P.N.; Sultanov, M.M.; et al. The structure of the near-surface layer of the AAAC overhead power line wires after operation and its effect on their elastic, microplastic, and electroresistance properties. Crystals 2022, 12, 166. [Google Scholar] [CrossRef]
- Levin, A.A.; Narykova, M.V.; Lihachev, A.I.; Kardashev, B.K.; Kadomtsev, A.G.; Prasolov, N.D.; Panfilov, A.G.; Sokolov, R.V.; Brunkov, P.N.; Sultanov, M.M.; et al. Comparison of structural, microstructural, elastic, and microplastic properties of the AAAC (A50) and ACSR (AC50/8) cables after various operation periods in power transmission line. Crystals 2022, 12, 1267. [Google Scholar] [CrossRef]
- Levin, A.A.; Narykova, M.V.; Lihachev, A.I.; Kardashev, B.K.; Kadomtsev, A.G.; Panfilov, A.G.; Prasolov, N.D.; Sokolov, R.V.; Brunkov, P.N.; Sultanov, M.M.; et al. Structural, Microstructural, Elastic, and Microplastic Properties of Aluminum Wires (from AAAC (A50) Cables) after Fatigue Tests. Metals 2023, 13, 298. [Google Scholar] [CrossRef]
- Badibanga, R.; Miranda, T.; Rocha, P.; Ferreira, J.; da Silva, C.; Araújo, J. The effect of mean stress on the fatigue behaviour of overhead conductor function of the H/w parameter. MATEC Web Conf. 2018, 165, 11001. [Google Scholar] [CrossRef]
- Fadel, A.A.; Rosa, D.; Murça, L.B.; Fereira, J.L.A.; Araújo, J.A. Effect of high mean tensile stress on the fretting fatigue life of an Ibis steel reinforced aluminium conductor. Int. J. Fatigue 2012, 42, 24–34. [Google Scholar] [CrossRef]
- Azevedo, C.R.F.; Cescon, T. Failure analysis of aluminum cable steel reinforced (ACSR) conductor of the transmission line crossing the Paranaґ River. Eng. Fail. Anal. 2002, 9, 645–664. [Google Scholar] [CrossRef]
- Azevedo, C.R.D.F.; Henriques, A.M.D.; Pulino Filho, A.R.; Ferreira, J.L.A.; Araújo, J.A. Fretting fatigue in overhead conductors: Rig design and failure analysis of a Grosbeak aluminium cable steel reinforced conductor. Eng. Fail. Anal. 2009, 16, 136–151. [Google Scholar] [CrossRef]
- Ma, X.C.; Gao, L.; Zhang, J.X.; Zhang, L.C. Fretting Wear Behaviors of Aluminum Cable Steel Reinforced (ACSR) Conductors in High-Voltage Transmission Line. Metals 2017, 7, 373. [Google Scholar] [CrossRef]
- Said, J.; Garcin, S.; Fouvry, S.; Cailletaud, G.; Yang, C.; Hafid, F. A multi-scale strategy to predict fretting-fatigue endurance of overhead conductors. Tribol. Int. 2020, 143, 106053. [Google Scholar] [CrossRef]
- Lihachev, A.I.; Narykova, M.V.; Levin, A.A.; Prasolov, N.D.; Sokolov, R.V.; Kardashev, B.K.; Kadomtsev, A.G.; Brunkov, P.N.; Sultanov, M.M.; Strizhichenko, A.V.; et al. Influence of service life on the microstructure and elastic-plastic properties of steel-aluminum wire AC120/19 overhead power lines. Glob. Energy 2023, 29, 139–156. (In Russian) [Google Scholar] [CrossRef]
- Rolim, A.L.; da Moreira, J.L.R.; Veloso, L.A.C.M.; de Souza, R.M.; Araújo, J.A. Differential displacement and strain analysis of transmission line cables. J. Braz. Soc. Mech. Sci. Eng. 2013, 35, 327–336. [Google Scholar] [CrossRef]
- Kul’kov, V.G.; Tyshkevich, V.N.; Kuryanov, V.N.; Sultanov, M.M.; Norov, D.S.; Narykova, M.V.; Kadomtsev, A.G.; Prasolov, N.D.; Brunkov, P.N.; Likhachev, A.I.; et al. Experimental studies of fatigue strength and surface electrical resistance of aluminum wire of overhead power transmission lines. Saf. Reliab. Power Ind. 2021, 14, 189–195. (In Russian) [Google Scholar] [CrossRef]
- Nakhimova, L.I. (Ed.) GOST 839-2019; Non-Insulated Conductors for Overhead Power Lines. Specifications. Strojizdat: Moscow, Russia, 2019; 39p. (In Russian)
- Bruker, A.X.S. Karlsruhe, Diffrac. Suite Eva Version 5.1.0.5; DIFFRAC.SUITE User Manual; Bruker AXS GmbH: Karlsruhe, Germany, 2019. [Google Scholar]
- International Centre for Diffraction Data (ICDD). Powder Diffraction File-2 Release 2014; ICDD: Newton Square, PA, USA, 2014. [Google Scholar]
- Maunders, C.; Etheridge, J.; Wright, N.; Whitfield, H.J. Structure and microstructure of hexagonal Ba3Ti2RuO9 by electron diffraction and microscopy. Acta Crystallogr. B 2005, 61, 154–159. [Google Scholar] [CrossRef]
- Levin, A.A. Program SizeCr for Calculation of the Microstructure Parameters from X-ray Diffraction Data. 2022. preprint. [Google Scholar] [CrossRef]
- Terlan, B.; Levin, A.A.; Börrnert, F.; Simon, F.; Oschatz, M.; Schmidt, M.; Cardoso-Gil, R.; Lorenz, T.; Baburin, I.A.; Joswig, J.-O.; et al. Effect of Surface Properties on the Microstructure, Thermal, and Colloidal Stability of VB2 Nanoparticles. Chem. Mater. 2015, 27, 5106–5115. [Google Scholar] [CrossRef]
- Terlan, B.; Levin, A.A.; Börrnert, F.; Zeisner, J.; Kataev, V.; Schmidt, M.; Eychmüller, A. A Size-Dependent Analysis of the Structural, Surface, Colloidal, and Thermal Properties of Ti1–xB2 (x = 0.03–0.08) Nanoparticles. Eur. J. Inorg. Chem. 2016, 2016, 3460–3468. [Google Scholar] [CrossRef]
- Langford, J.I.; Cernik, R.J.; Louer, D. The Breadth and Shape of Instrumental Line Profiles in High-Resolution Powder Diffraction. J. Appl. Phys. 1991, 24, 913–919. [Google Scholar] [CrossRef]
- Nikanorov, S.P.; Kardashev, B.K. Elasticity and Dislocation Inelasticity of Crystals; Nauka: Moscow, Russia, 1985; 256p. (In Russian) [Google Scholar]
- Lukiyanov, F.A.; Rau, E.I.; Sennov, R.A. Depth Range of Primary Electrons, Electron Beam Broadening, and Spatial Resolution in Electron-Beam Studies. Bull. Russ. Acad. Sci. Phys. 2009, 73, 463–472. [Google Scholar] [CrossRef]
- Kanaya, K.; Okayama, S. Penetration and energy-loss theory of electrons in solid targets. J. Phys. D Appl. Phys. 1972, 5, 43–58. [Google Scholar] [CrossRef]
- Fundamental Physical Constants. Available online: https://physics.nist.gov/cgi-bin/cuu/Value?na|search_for=Avogadro (accessed on 2 February 2023).
- Kraus, W.; Nolze, G. POWDER CELL—A program for the representation and manipulation of crystal structures and calculation of the resulting X-ray powder patterns. J. Appl. Crystallogr. 1996, 29, 301–303. [Google Scholar] [CrossRef]
- Merkys, A.; Vaitkus, A.; Grybauskas, A.; Konovalovas, A.; Quirós, M.; Gražulis, S. Validation of the Crystallography Open Database using the Crystallographic Information Framework. J. Appl. Crystallpogr. 2021, 54, 661–672. [Google Scholar] [CrossRef]
- Tsybulya, S.; Kryukova, G. New X-ray powder diffraction data on δ-Al2O3. Powder Diffr. 2003, 18, 309–311. [Google Scholar] [CrossRef]
- Fargeot, D.; Mercurio, D.; Dauger, A. Structural characterization of alumina metastable phases in plasma sprayed deposits. Mater. Chem. Phys. 1990, 24, 299. [Google Scholar] [CrossRef]
- Repelin, Y.; Husson, E. Etudes structurales d’alumines de transition. I—Alumines gamma et delat. Mater. Res. Bull. 1990, 25, 611–625. (In French) [Google Scholar] [CrossRef]
- Mason, J.K.; Schuh, C.A. Representation of Texture. In Electron Backscatter Diffraction in Material Science, 2nd ed.; Schwartz, A.I., Kumar, M., Adams, B.L., Field, D.P., Eds.; Springer: Boston, MA, USA, 2009; pp. 45–46. [Google Scholar] [CrossRef]
- Otte, H.M.; Montague, W.G.; Welch, D.O. X-ray diffractometer determination of the thermal expansion coefficient of aluminum near room temperature. J. Appl. Phys. 1963, 34, 3149–3150. [Google Scholar] [CrossRef]
- Miller Jr, P.H.; DuMond, J.W.M. Tests for the Validity of the X-Ray Crystal Method for Determining N and e with Aluminum, Silver and Quartz. Phys. Rev. 1940, 57, 198–206. [Google Scholar] [CrossRef]
- Shin, H.-S. A study on the structure of maghemite (gamma-(Fe2O3)). I. Rietveld analysis pf powder XRD patterns. J. Korean Ceram. Soc. 1998, 35, 1113–1119. [Google Scholar]
- Martinez, O.; Hortelano, V.; Jimenez, J.; Plaza, J.L.; de Dios, S.; Olvera, J.; Dieguez, E.; Fath, R.; Lozano, J.G.; Ben, T.; et al. Growth of Zn O nanowires through thermal oxidation of metallic zinc films on Cd Te substrates. J. Alloys Compds. 2011, 509, 5400–5407. [Google Scholar] [CrossRef]
- Karzel, H.; Potzel, U.; Potzel, W.; Moser, J.; Schaefer, C.; Steiner, M.; Peter, M.; Kratzer, A.; Kalvius, G.M. X-ray diffractometer for high pressure and low temperatures. Mater. Sci. Forum. 1991, 79, 419–426. [Google Scholar] [CrossRef]
- Vannenberg, N.G. Formation and structure of zinc peroxide. Ark. Kemi 1959, 14, 119. [Google Scholar]
- Crisan, O.; Crisan, A. Phase transformation and exchange bias effects in mechanically alloyed Fe/magnetite powders. J. Alloys Compds. 2011, 509, 6522–6527. [Google Scholar] [CrossRef]
- Swanson, H.E.; Tatge, E. Standard X-Ray Diffraction Powder Patterns. Natl. Bur. Stand. 1955, Circ. 539 IV, 3. [Google Scholar]
- Nakhimova, L.I. (Ed.) GOST 11069-2001; Primary Aluminium. Grades. IPK Izdatel. Standartov: Moscow, Russia, 2004; 84p. (In Russian)
- Idelchik, V.I. Electrical Systems and Networks: Textbook for Universities; Energoatomizdat: Moscow, Russia, 2022; 600p. (In Russian) [Google Scholar]
- Plateau, J. Statique Expérimentale et Théorique des Liquides Soumis aux Seules Forces Moléculaires; Gauthier-Villars: Paris, France, 1873; Volume 2, 495p. (In French) [Google Scholar]
- Rayleigh, L. On the Instability of Jets. Proc. Lond. Math. Soc. 1878, 10, 4–12. [Google Scholar] [CrossRef]
- Toimil-Molares, M.E.; Balogh, A.G.; Cornelius, T.W.; Neumann, R.; Trautmann, C. Fragmentation of nanowires driven by Rayleigh instability. Appl. Phys. Lett. 2004, 85, 5337–5339. [Google Scholar] [CrossRef]
- Karim, S.; Toimil-Molares, M.E.; Balogh, A.G.; Ensinger, W.; Cornelius, T.W.; Ukhan, E.; Neumann, R. Morphological evolution of Au nanowires controlled by Rayleigh instability. Nanotechnology 2006, 17, 5954–5959. [Google Scholar] [CrossRef]
- Slater, J.C. Atomic Radii in Crystals. J. Chem. Phys. 1964, 41, 3199–3204. [Google Scholar] [CrossRef]
- Massalski, T.B.; Okamoto, H.; Subramanian, P.R.; Kacprzak, L. (Eds.) Binary Alloy Phase Diagrams, 2nd ed.; ASM International: Materials Park, OH, USA, 1990; Volume 1, 3542p. [Google Scholar]
- Zhu, K.; Li, C.; Zhu, Z.; Liu, C.S. Measurement of the dynamic Young’s modulus of porous titanium and Ti6Al4V. J. Mater. Sci. 2007, 42, 7348–7353. [Google Scholar] [CrossRef]
- Martienssen, W.; Warlimont, H. (Eds.) Springer Handbook of Condensed Matter and Materials Data; Springer: Berlin/Heidelberg, Germany, 2005; pp. 431–476. [Google Scholar] [CrossRef]
- Williamson, G.K.; Smallman, R.E., III. Dislocation densities in some annealed and cold-worked metals from measurements on the X-ray Debye-Scherrer spectrum. Philos. Mag. 1956, 1, 34–46. [Google Scholar] [CrossRef]
- Gleiter, H.; Chalmers, B. High-Angle Grain Boundaries; Pergamon Press: New York, NY, USA, 1972; 274p. [Google Scholar]
- Malygin, G.A. Relay mechanism of formation of dislocation-free and defect-free channels during plastic deformation of crystals. Fiz. Tverd. Tela 1991, 33, 1855–1859. (In Russian) [Google Scholar]
- Kul’kov, V.G. Diffusion Model of Internal Friction in Nanocrystalline Materials. Tech. Phys. 2007, 52, 333–338. [Google Scholar] [CrossRef]
- Kul’kov, V.G. Contribution of Grain Boundary Pores to the High-Temperature Background of Internal Friction in Metals with Ultrafine Grain. Bull. Russ.Acad.Sci. Phys. 2020, 84, 1043–1047. [Google Scholar] [CrossRef]
- Ye, W.; Hohl, J.; Misra, M.; Liao, Y.; Mushongera, L.T. Grain boundary relaxation in doped nano-grained aluminum. Mater. Sci. Commun. 2021, 29, 102808. [Google Scholar] [CrossRef]


Disclaimer/Publisher’s Note: The statements, opinions and data contained in all publications are solely those of the individual author(s) and contributor(s) and not of MDPI and/or the editor(s). MDPI and/or the editor(s) disclaim responsibility for any injury to people or property resulting from any ideas, methods, instructions or products referred to in the content. |
© 2023 by the authors. Licensee MDPI, Basel, Switzerland. This article is an open access article distributed under the terms and conditions of the Creative Commons Attribution (CC BY) license (https://creativecommons.org/licenses/by/4.0/).