Abstract
The process of biomineralization of apatite in nature has been studied by scientists from various fields of science for more than a century. Unlike the volcanogenic, hydrothermal, and other types of igneous apatites, the genesis of which is entirely clear, the formation of phosphate ores of marine sedimentary origin is still debatable. Since phosphate concentrations in water bodies are too low for the spontaneous precipitation of solid phosphates, the study of different ways for their concentration is of particular interest. In this work, phase equilibria in the system CaO–P2O5–HF–H2O at 298 K, involving fluorapatite formation, have been studied. Fluorapatite is known to be the most common phosphate mineral and the main source of phosphorus on Earth, playing an important role in the mineralization process of dental tissues in vertebrates. The equilibrium in the system defined above was studied at a low mass fraction of the liquid phase components, i.e., in conditions close to natural. It has been shown that the compounds of variable composition with the fluorapatite structure containing HPO42− ions were formed in the acid region of this system. These compounds are formed at pH ≤ 7.0 and have invariant points with monetite, CaHPO4, and fluorite, CaF2. Stoichiometric fluorapatite was formed at the lowest concentrations of the liquid phase components in a neutral and weakly alkaline medium and had an invariant point with Ca(OH)2. The composition of the resulting equilibrium solid phases was found to be dependent on the Ca/P ratio of the initial components and pH of the equilibrium liquid phase. Fluorite CaF2 was present in each sample obtained in this study.
1. Introduction
Phosphate ores are the main source used as raw material for manufacturing elemental phosphorus and its compounds [1,2,3,4,5,6]. Fluorapatite (FAp) with the chemical formula Ca10(PO4)6F2 is the main phosphate mineral of igneous origin [1,6,7]. Fluorapatite has a very low solubility in water [7]. This type of apatite has Ca/P and P/F atomic ratios of 1.67 and 3, respectively. Phosphate ores of sedimentary origin and the products of weathering, as a rule, are FAp with the partial replacement of phosphate by carbonate and calcium by other cations, which changes the Ca/P and P/F ratios [1,4]. Fluorapatite is white in color, but sometimes it can be of green, blue, cyan, yellow, purple, and pink hues, which indicate the presence of substituent ions in the FAp structure (Figure 1).
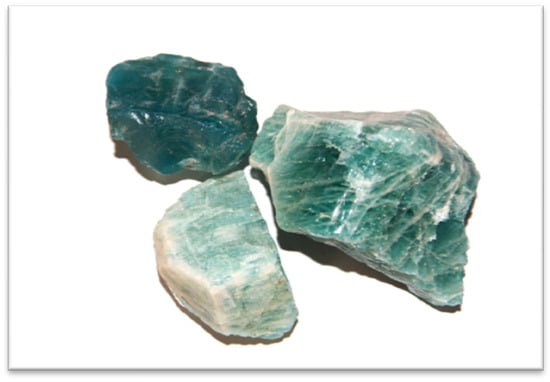
Figure 1.
Image of natural fluorapatite from the Slyudyanka deposit (Irkutsk region, Lake Baikal). Element composition of the crystals is presented in Table S1. The collection of M.V. Chaikina.
An interesting question is the origin of sedimentary phosphate ores. Phosphorus accumulation in sea and river water occurs from dust, glacial runoff, underground hydrothermal volcanic activity, and deposition of organic material [4]. The primary inflow of dissolved phosphorus is from continental weathering, brought out by rivers to the ocean. The remains of fish and other inhabitants of the underwater world, as well as marsh grass and algae, are also a source of dissolved phosphorus formed during the process of their decomposition with the participation of bacteria and enzymes. When the concentration of phosphorus in water bodies is close to saturation, environmental changes (temperature, pressure, pH) can lead to a sharp precipitation of the phosphates from a supersaturated solution in the form of phosphate minerals, including FAp.
Nevertheless, most of the phosphorus is generated in the Earth’s upper mantle. Magmatic rocks of the mantle and granite shell opened by erosion contain a large number of phosphate minerals, including FAp [4]. Phosphate rock is the major resource mined to produce phosphate fertilizers for the agricultural industry. In this regard, the technology of processing phosphate ores into fertilizers and for the production of double superphosphate and other phosphorus compounds is of great interest.
The aim of the study carried out by Farr et al. [8] was to make phosphate fertilizer by direct interaction of phosphate ore with phosphoric acid and to determine the thermodynamic properties of the resultant equilibrium phases in the system. For this aim, Farr et al. studied the phase equilibria in the CaO–P2O5–HF–H2O system in a region of high mass fraction (w) of the liquid phase components at temperatures of 25 °C and 50 °C [8]. The mass fractions w(P2O5) and w(CaO) varied from 3.81 to 33.85 wt% and 0.922 to 3.729 wt%, respectively, at pH from 1.90 to 0.26. Farr et al. found that under given experimental conditions, fluorapatite and calcium fluoride CaF2 were the equilibrium solid phases [8]. In the liquid phase containing w(P2O5) = 25.78 wt%, w(CaO) = 5.466 wt%, at pH = 0.81, together with fluorapatite and calcium fluoride, the third solid phase Ca(H2PO4)2·H2O appeared.
At low concentrations of the liquid phase components, the CaO–P2O5–HF–H2O system was studied at 25 °C by Kazakov [9] in order to reconstruct the formation process of FAp in sedimentary rocks with the formation of phosphate ores. Under these conditions, the following equilibrium solid phases were obtained in the system: FAp, fluorhydroxyapatite Ca10(PO4)6(F,OH)2, CaF2, and Ca(OH)2. The regions of the stability of these solid phases were defined. It was found that the composition and ratio of phases are dependent on the amount of the introduced fluoride ion and the pH value of the equilibrium liquid phase.
A large number of studies are devoted to fluoride-containing hydroxyapatite and fluorapatite since these materials are essential for dental hard tissues and play an important role in the prevention of dental caries [10,11,12,13,14,15,16,17,18,19,20]. In a number of studies, the positive effect of low levels of fluoride in acid solutions on the demineralization of dental enamel has been shown both in vitro and in vivo [10,11,12]. In order to identify the reason for dental caries, Duff [16,17,18,19] studied the transformation of various phosphates in fluoride-containing solutions. The thermodynamic properties of the solid phase of the CaO–P2O5–CaF2–H2O system have also been calculated. According to these data, the equilibrium solid phases of the system are FAp, CaF2 and Ca(OH)2, and all the phosphates are metastable, except for FAp.
Thus, the reported information about the regions where the phosphates exist as the equilibrium solid phases in CaO–P2O5–HF/CaF2–H2O system is incomplete. One of the methods to determine the conditions for the formation of solid phases is to study phase equilibria in this system [7].
The purpose of this work is to study the compositions of the equilibrium solid phases in the CaO–P2O5–HF–H2O system at low mass fractions of the liquid phase components at 298 K and the regions where they exist. In order to prevent the formation of carbonate-containing apatites, experiments were carried out in a nitrogen atmosphere [7].
Two sections of the CaO–P2O5–HF–H2O system were studied at 298 K. For Section I, the initial ratio of phosphorus to fluorine remained unchanged and was similar to that of the stoichiometric fluorapatite, i.e., P/F = 3, whereas the ratio of calcium to phosphorus (Ca/P) varied from 1 to 2. Section II represents the system in the acid region at a constant ratio of the initial components Ca/(P + F) = 0.5 and at a P/F value varying from 1 to 20. The results of this study can be used to reveal the mechanism of dental caries in an acid environment or fluorosis, with a lack or excess of fluorine, respectively [10,11]. The obtained isotherms can be used to determine the conditions for FAp formation in solutions with low ion concentrations.
2. Materials and Methods
2.1. Sample Preparation
Freshly calcined CaO, CaF2, HF, an aqueous solution of H3PO4 (w = 87 wt%), and distilled and deionized water were the initial components in the synthesis. All reagents were of chemically pure grade supplied by Khimreaktiv LTD (Ekaterinburg, Russia). The initial solutions containing different mass fractions of calcium, phosphate, and fluoride were prepared by mixing the aqueous solutions of the individual ions in the appropriate ratios. A solution containing phosphate with a mass fraction of 0.1126 wt% was obtained by diluting the concentrated H3PO4 acid with distilled and deionized water. Distilled deionized water was obtained with a Direct-Q3 (Millipore, Burlington, MA, USA) system with a produced water resistivity of 18.2 MΩ·cm. The hydrofluoric acid solution was obtained by diluting the concentrated HF acid with distilled and deionized water to a mass fraction of 0.4446 wt%. A calcium solution was prepared by stirring freshly calcined CaO in distilled and deionized water up to a mass fraction of 0.056 wt%.
The concentration of calcium ions in the initially investigated solutions of Section I was varied, while the concentration of fluoride and phosphorus ions remained constant with the ratio P/F = 3, similar to that for stoichiometric FAp. Therefore, conditions for the formation of calcium-deficient FAp and FAp with excess calcium cations were created in the solutions of Section I. In the solutions of Section II, the calcium concentration remained constant, but the P/F ratio was varied, maintaining the Ca/P + F ratio at a value of 0.5, which is the case in the oral cavity environment.
The resulting initial solutions were poured into polyethylene containers with mixers and placed in a thermostat chamber at a constant temperature of 298 (±0.1) K and a pressure of 0.1 MPa to achieve an equilibrium state. To create an inert atmosphere, nitrogen gas purified from CO2 and H2O using an absorber with CaCl2 was bubbled into the containers with solutions.
Equilibrium was considered to have been achieved when the pH value and the concentration of calcium and phosphate ions did not change after being sampled and analyzed at least three times with an interval of at least a month. Phase equilibrium in the system has been achieved in 9 to 20 months. After equilibration, the solid phases of the samples were filtered on a Buchner funnel using a vacuum pump, placed in a desiccator, and analyzed by chemical and physical methods.
2.2. Characterization
Due to very low concentration, the analysis of liquid phase components was performed using the most sensitive methods of the State Standards of the Russian Federation [21] applied for the analysis of water purity, similar to International Standards [22].
The phosphate content in the liquid phases was determined by the colorimetric method using the molybdenum blue reaction [21,22]. This method is based on the interaction of phosphate ions with the molybdenum blue complex MoO2·4MoO3 with the formation of a stable blue color. This method can be used in the phosphorus concentration range from 0.005 mg/L to 0.8 mg/L [22]. Phosphate ion contents in the solid phases were determined according to the published method [23] by the precipitation of magnesium ammonium phosphate followed by its ignition to magnesium pyrophosphate Mg2P2O7 [8]. Calcium content in the liquid and solid phases was determined by titration using Ethylenediaminetetraacetic acid tetrasodium (EDTA) with an Eriochrome Black T indicator according to the published method [24,25].
Fluoride ions were separated from the solid phases by distillation according to the State Standard [26]. The apparatus used consists of a reaction flask made of heat-resistant glass, with a pocket for a thermometer, placed in a heating mantle connected to a relay for controlling the distillation temperature. A sample of the solid phase was placed in the reaction flask containing 50 mL of sulfuric acid. The flask was closed with a rubber stopper with two glass tubes, one of which was connected to a steam generator and the other to a ball cooler and a condensate receiver for the evaporated fluorine. The temperature of the reaction mixture was maintained at 130–135 °C. Fluorine in the condensate obtained from the solid phase and fluorine in the liquid phases of the incubated sample were determined by the potentiometric method [27] on a pH-121 pH-meter using a fluoride-selective electrode of the EF-VI type and an auxiliary silver chloride electrode EVL-1M3 (ZIP, Gomel, Russia). The chemical compositions of the equilibrium liquid and solid phases are shown in Table 1 and Table 2.

Table 1.
Composition of equilibrium liquid and solid phases at P/F = 3 (Section I).
Table 2.
Composition of equilibrium liquid and solid phases at Ca/(P + F) = 0.5 (Section II).
Powder X-ray diffraction (XRD) was used to identify the phase composition of the solid phases obtained. The diffraction patterns were recorded on a D8 Advance diffractometer (Bruker, Mannheim, Germany) with Bragg–Brentano geometry using CuKα radiation, a nickel Kβ filter, and a position-sensitive one-dimensional Lynx-Eye detector. The crystallite size was refined by the Rietveld method using Topas 4.2 software (Bruker, Germany). The fundamental parameter approach was used to account for the instrumental contribution [28].
The functional groups in the solid phases were identified by IR spectroscopy. The spectra were recorded on an Infralum-801 instrument using the KBr pellet method.
A high-resolution JEM-2010 electron microscope (JEOL, Tokyo, Japan) at an accelerating voltage of 200 kV and a resolution of 1.4 Å was used to study the microstructure of the solid phases. A suspension of the particles in alcohol was deposited onto a copper substrate using an ultrasonic disperser. Local analysis of the elemental composition of the sample was carried out using a QUANTAX 200-TEM energy-dispersive EDS spectrometer (Bruker, Germany) with an XFLASH detector and an energy resolution of about 130 eV.
3. Results
A part of the isotherm of the CaO–P2O5–HF–H2O system has been studied at 298 K in a nitrogen atmosphere for the equilibrium liquid phase containing w(CaO) = 0.0019–1.0750 wt%, w(P2O5) = 0.01 × 10⁻³–4.1877 wt%, w(F) = 0.41 × 10⁻³–2.15 × 10⁻³ wt%, and at pH changing from 1.84 to 11.54 (Table 1 and Table 2). It was found that the compounds of variable composition with the fluorapatite and fluorite structures mostly exist in this region. In this system, the region of fluorapatite is much wider than the region of the existence of hydroxyapatite and carbonate apatite observed in the ternary [29] and quaternary [30] systems, respectively. Thus, calcium-deficient hydroxyapatites of variable composition, which form an invariant point with octacalcium phosphate Ca8H2(PO4)6·5H2O, were found in the ternary system CaO–P2O5–H2O whose liquid phase at equilibrium contained w(CaO) = 0.0026 wt%, w(P2O5) = 0.0058 wt% and had pH = 6.64 [29]. In the quaternary CaO–H3PO4–H2CO3–H2O system, carbonate apatites of variable composition are formed, having an invariant point with brushite CaHPO4·2H2O at equilibrium values w(CaO) = 0.0101 wt%, w(P2O5) = 0.0202 wt%, and pH = 5.40 [30].
3.1. Section I
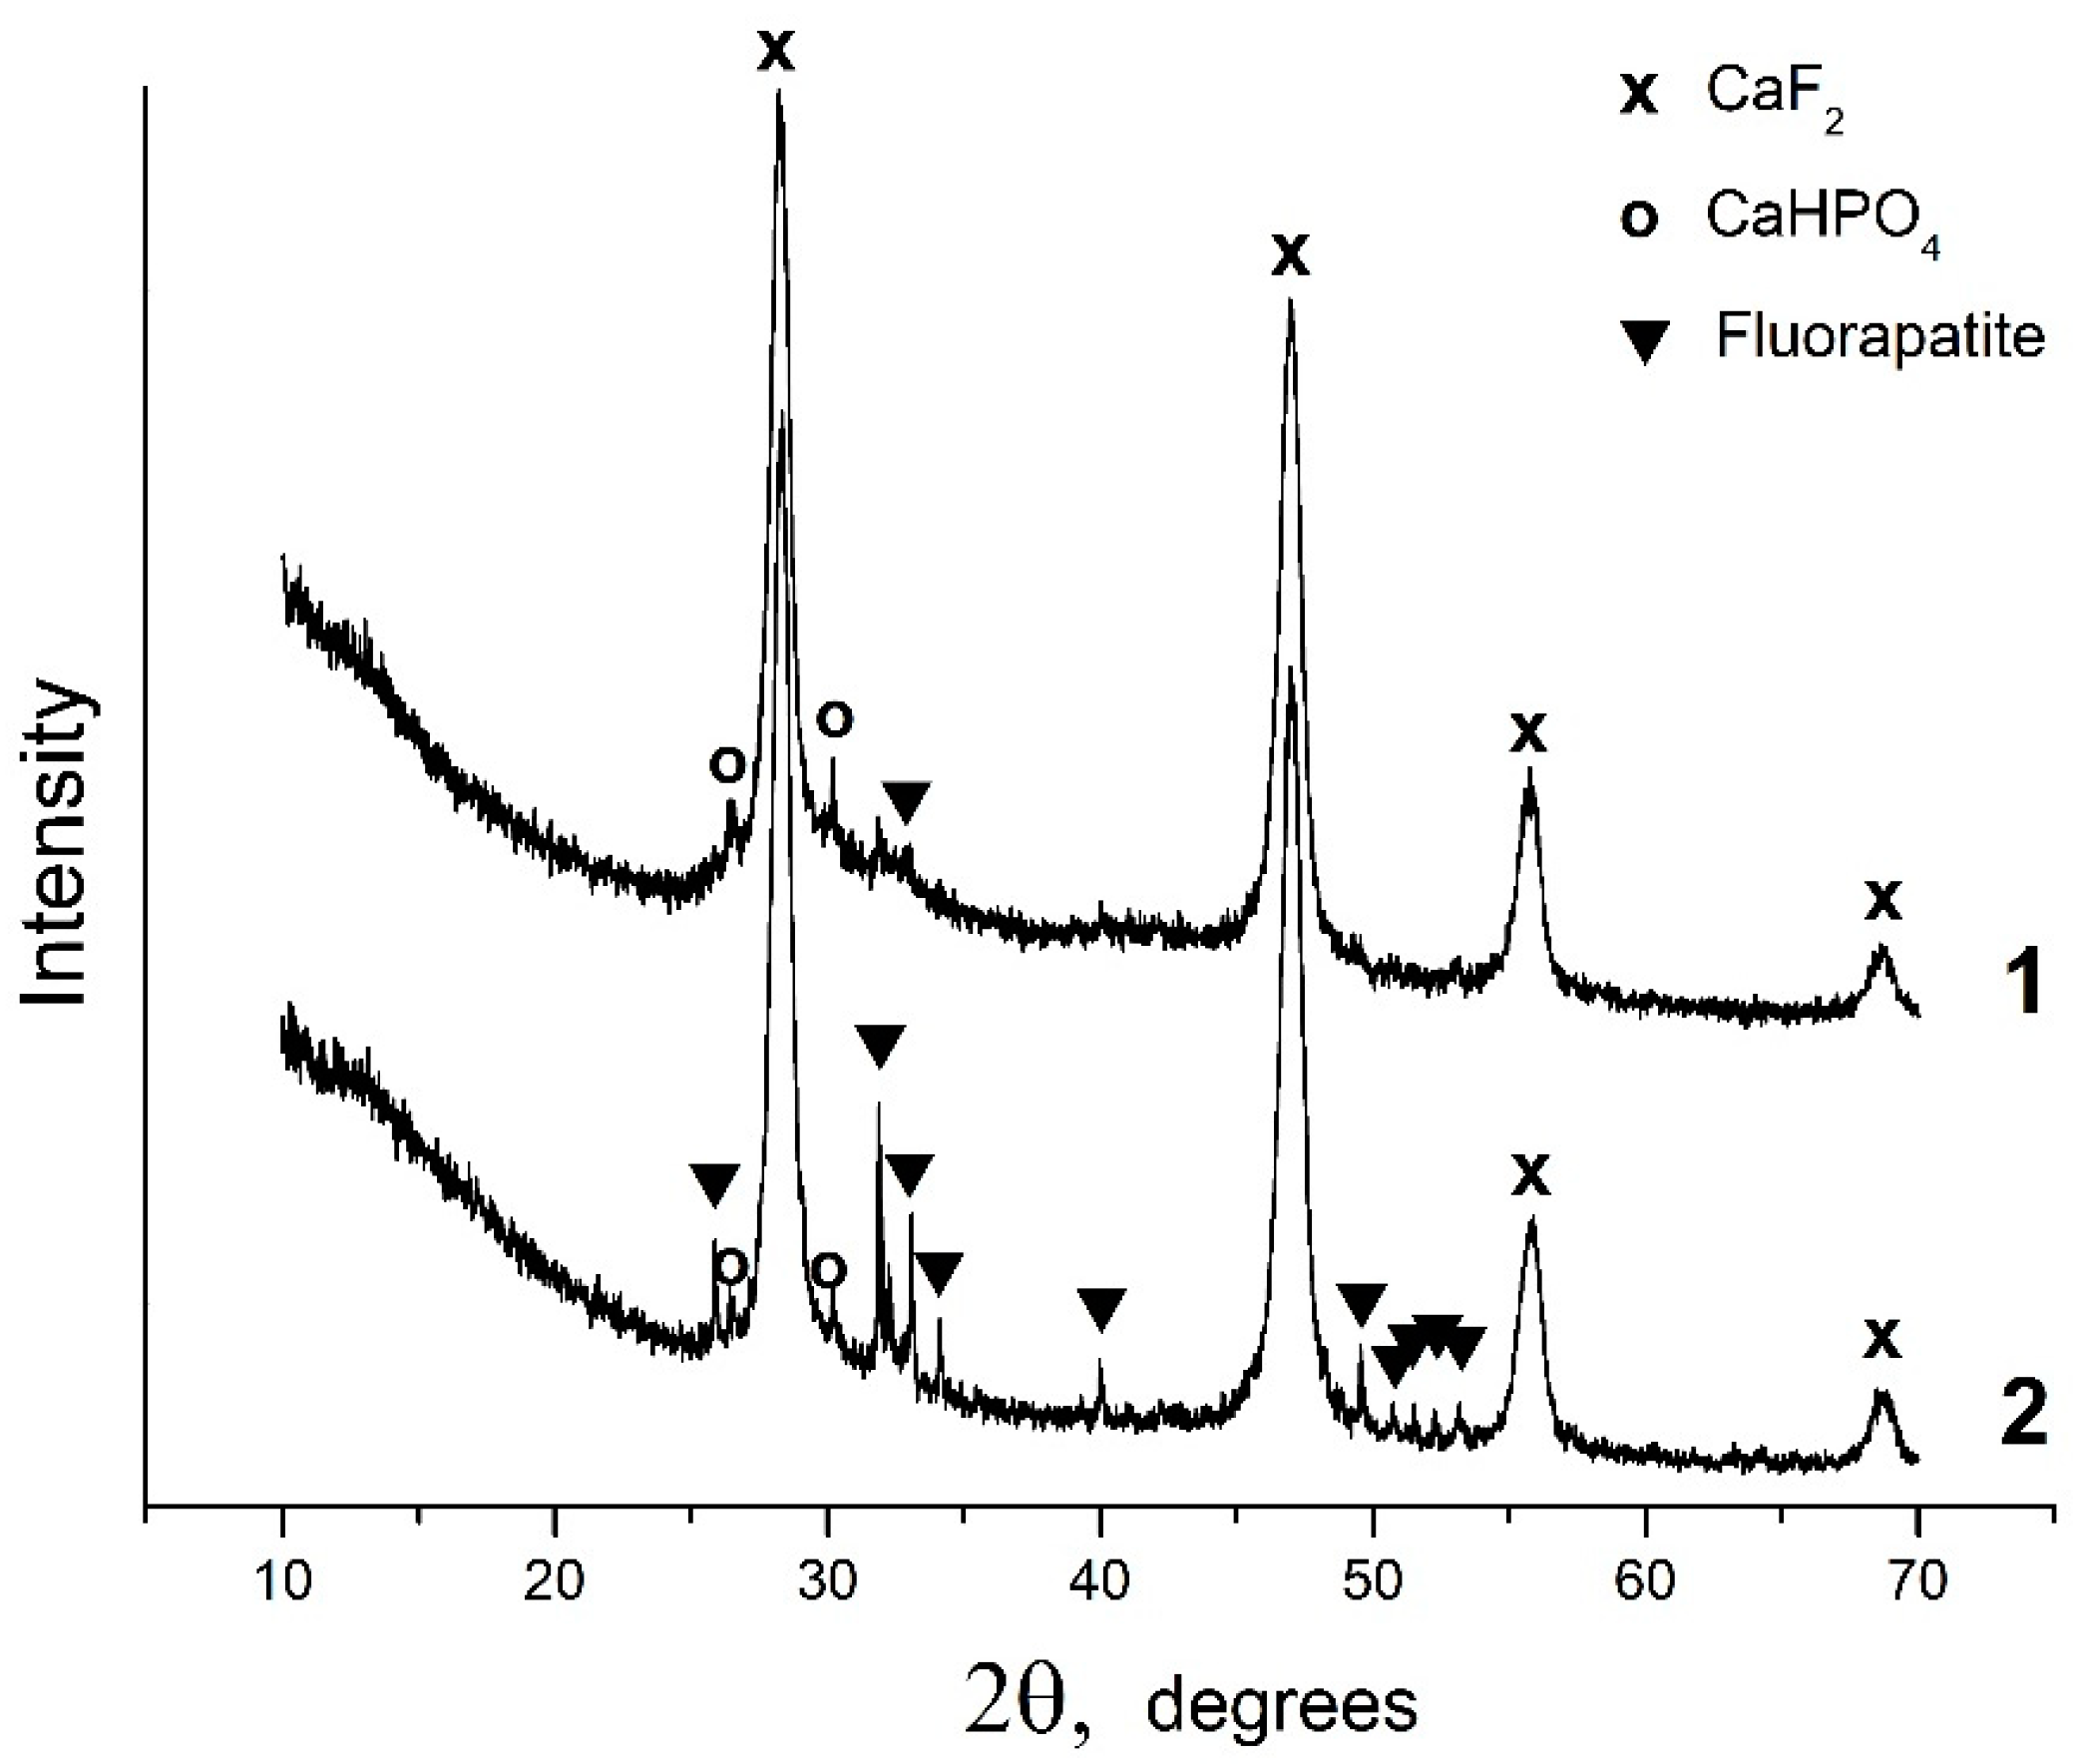
Under acid conditions, in the CaO–P2O5–HF–H2O system, fluorapatite is bordered by monetite CaHPO4, where, at equilibrium w(CaO) = 1.075 wt%, w(P2O5) = 4.1877 wt%, and w(F) = 2.15 × 10⁻³ wt%, and pH = 2.00, fluorite, monetite, and nanosized amorphous phosphate are formed (Figure 2, Table 1 sample #1). According to the XRD data, the invariant point (sample #2) involves fluorite, monetite, and fluorapatite (Figure 2, Table 1, sample #2). CaF2, with an average crystallite size of 12 nm, is the predominant solid phase (90 wt%) in the sample. The concentration of fluorapatite in this sample is only 8 wt%, and the average crystallite size is ~170 nm. TEM image of the equilibrium solid phase of sample #2 reveals the presence of a finely dispersed CaF2 phase and large fluorapatite particles (Figure 3).

Figure 2.
X-ray diffraction patterns of the solid phases of samples #1 and #2.
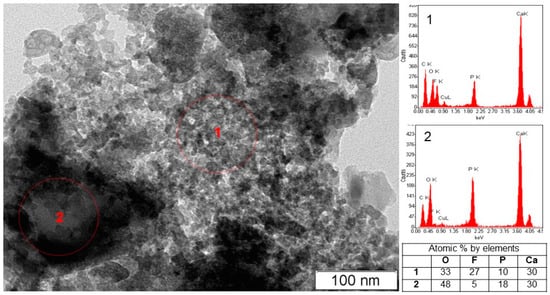
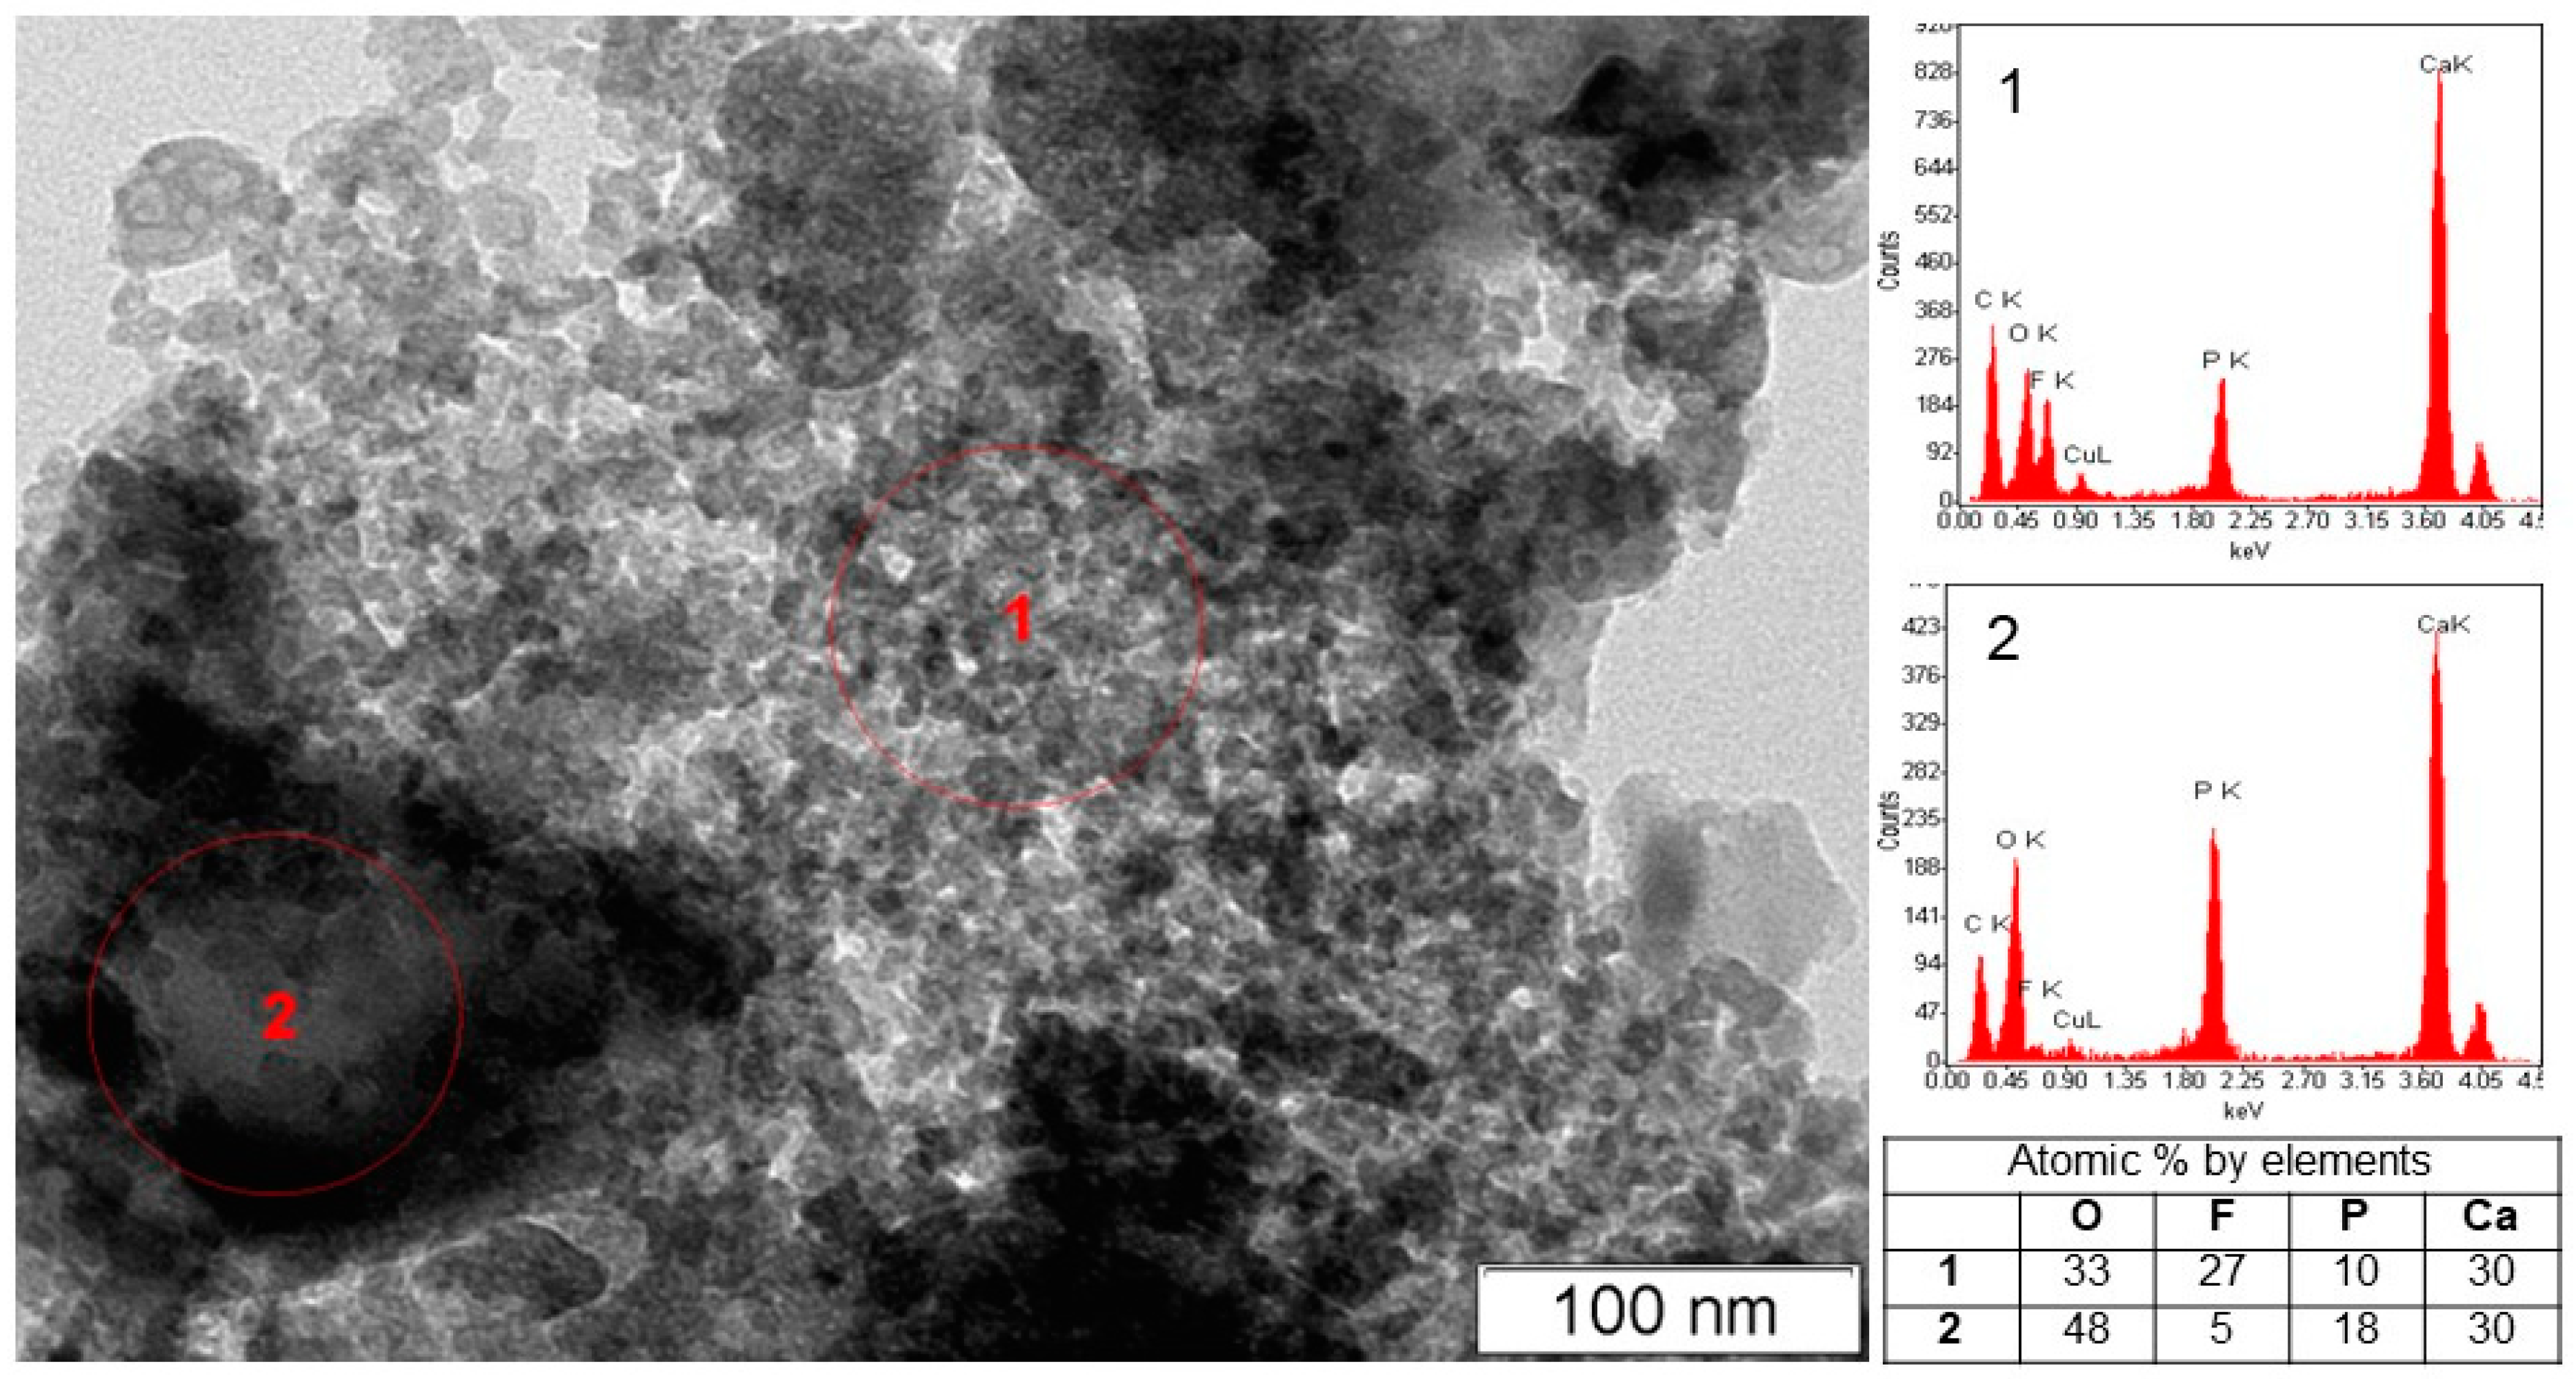
Figure 3.
Electron microscopy image of the solid phase of sample #2 containing nanocrystalline fluorite (1) and a block of fluorapatite (2).
It should be noted that even in the presence of calcium, phosphorus, and fluoride ions in sufficient concentrations in the solution with the required P/F ratio, the formation of fluorapatite almost does not occur in the solid phase of sample #2, and a significant amount of the calcium and phosphorus ions remains in the solution (Table 1). In this case, the determining factor for the FAp formation is the high acidity of the liquid phase.
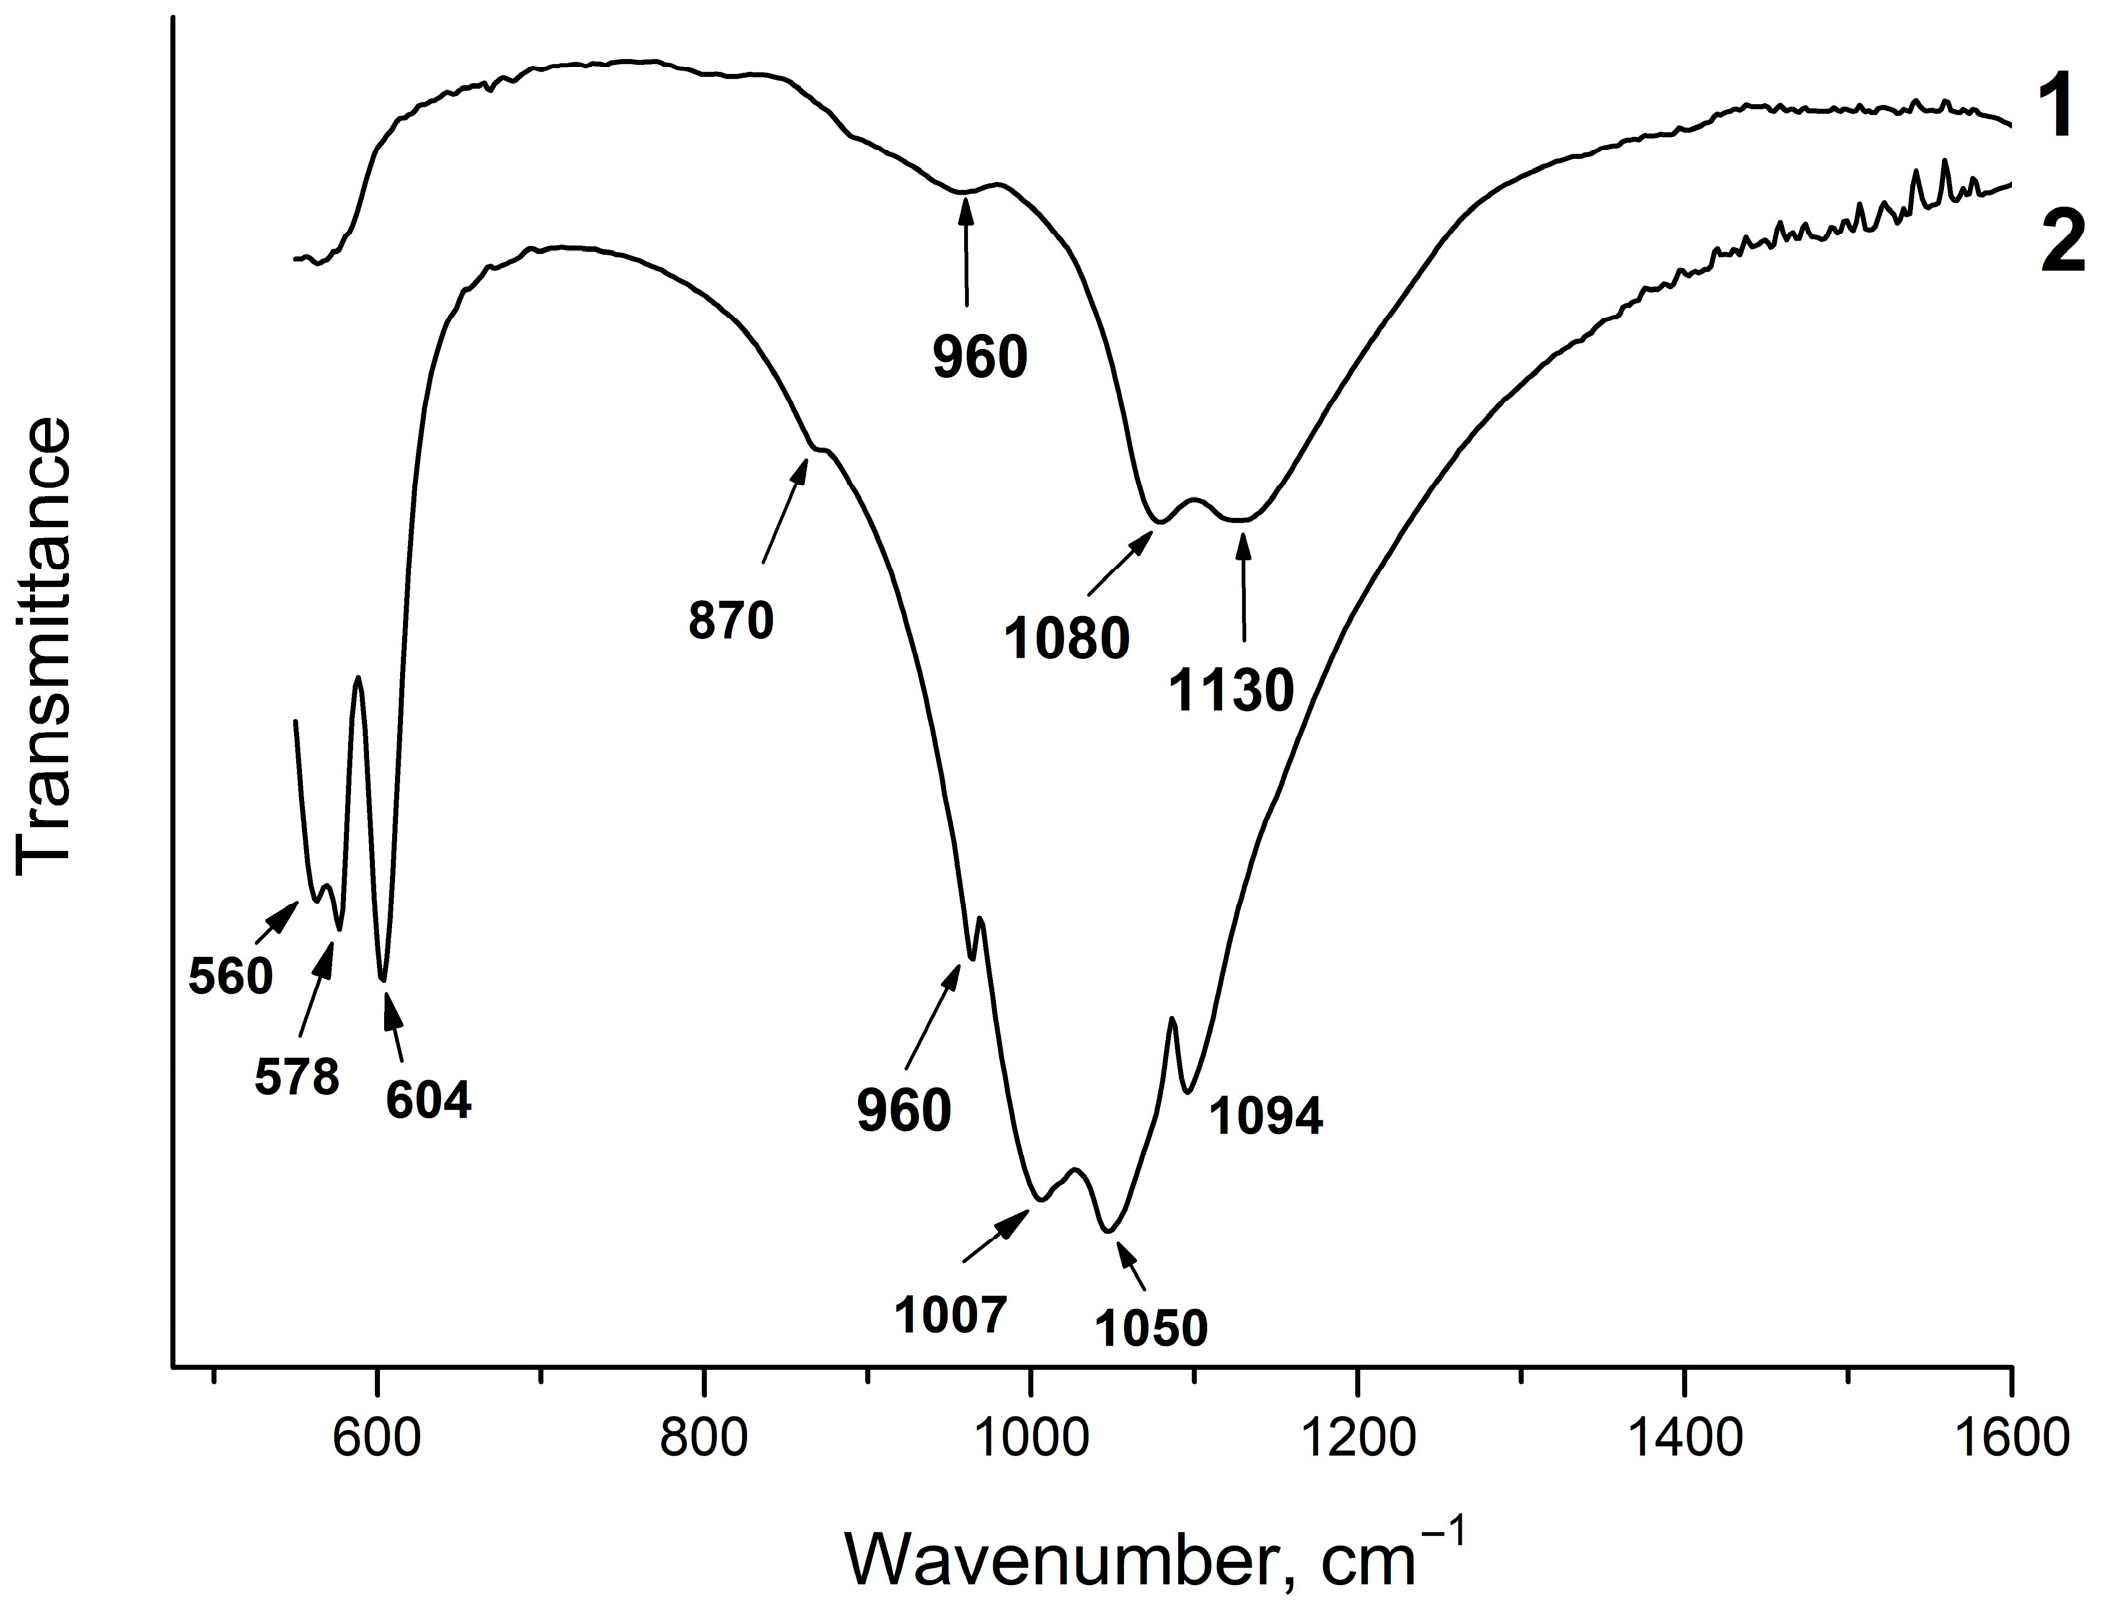
Figure 4 shows the IR spectra of the solid phases of samples #1 and #2. As seen, sample #1 has a specific IR spectrum; it has two intense absorption bands at 1080 and 1130 cm−1 and a shoulder at 960 cm−1. Similar IR spectra of amorphous calcium phosphates were obtained by Holt et al. [31]. According to this study, the intense absorption band at 1080 cm−1 can be explained by the effects of site symmetry in partially lifting the degeneracy of the asymmetric stretching mode of the phosphate tetrahedron. The shoulder at 950 cm−1 can be attributed to the symmetric stretching vibration of the bonds of the phosphate tetrahedron PO43− species when the effects of site asymmetry make the mode active in the infrared [31].
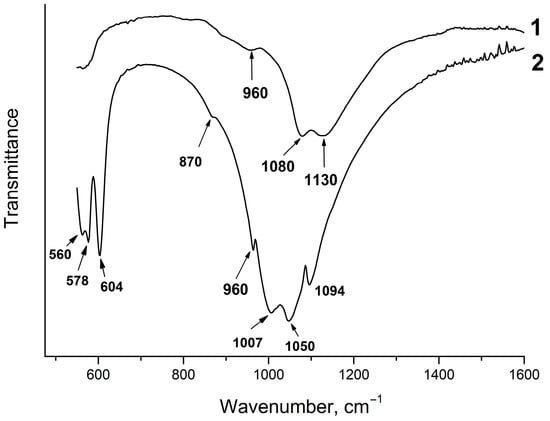
Figure 4.
IR spectra of the solid phases of samples #1 and #2.
The IR spectrum of the solid phase of sample #2 is typical for fluorapatite, although the splitting of the absorption bands of the O–P–O bending vibrations ν4 at 560 and 578 cm−1 occurs. Apart from that, the absorption bands of the P–O stretching vibrations ν3 at 1007 cm−1 and 1050 cm−1 are shifted and split (Figure 4). An increase in the number of absorption bands in the IR spectrum of the phosphate tetrahedron indicates a change in the coordination environment and a decrease in the symmetry of the phosphate ion. The absorption band at 870 cm−1 may indicate the presence of the HPO42− group [13].
As the pH values of the equilibrium liquid phase increase (Table 1, samples #3 and #4), the absorption bands of the P–O stretching vibrations in the IR spectra change their positions; as a result, the spectra become more similar to those of the FAp (Figure 5). However, the splitting of the absorption bands of the O–P–O bending vibrations remains unchanged. This can be explained by the formation of nonstoichiometric fluorapatites of variable composition in the acid region of the CaO–P2O5–HF–H2O system at pH < 7 with partial replacement of the PO43− ions by the HPO42− groups. An absorption band at 870 cm−1 in the IR spectra indicates the presence of HPO42− groups in the fluorapatite structure (Figure 4). As known, the mineral component of bone tissue consists of apatite, in the structure of which some of the PO43− groups are replaced by HPO42− and CO32− ions [32]. Hayek and Link called these apatites “hydrogenphosphate–carbonate–apatite”, abbreviated as HPCA. By analogy with these compounds, fluorapatites containing HPO42− groups can be called “hydrogenphosphate–fluorapatite” and denoted as HPFAp. Since the experiments in this study were carried out in a nitrogen atmosphere, the HPFAp structure should not contain the carbonate groups. Apart from that, if these groups were in the apatite structure, together with the band at 870 cm−1, more intense bands at 1400–1470 cm−1 would appear in the IR spectra [30], which is not the case (Figure 4 and Figure 5).
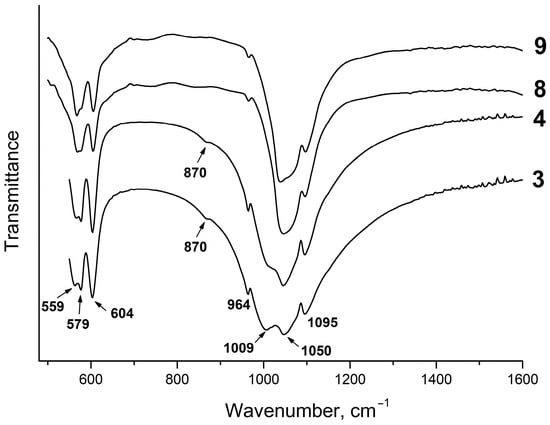
Figure 5.
IR spectra of samples #3 and #4, containing HPO42− groups, and samples #8 and #9 not containing these groups.
The as-synthesized compounds of variable composition can be represented by the general formula Ca10−x(PO4)6−x(HPO4)xF2−x, where 0 < x ≤ 1. Non-stoichiometric apatites with partial substitution of PO43− by the HPO42− ion are formed in the surface layers of hydroxyapatite upon its dissolution [33], and they were observed in the ternary and quaternary phosphate aqueous systems we had studied earlier [29,30].
As the pH of the equilibrium liquid phase increases to pH = 7.0, the concentration of calcium, phosphorus, and fluoride ions in it decreases (Table 1). In an alkaline environment, the content of calcium ions begins to increase (Table 1, samples #8–#10), while the concentration of phosphorus and fluoride ions continues to decrease. The invariant point with Ca(OH)2 is reached at pH = 11.57 in the equilibrium liquid phase containing w(CaO) = 0.0111 wt%, w(P2O5) = 0.1 × 10⁻⁴ wt%, and w(F) = 0.41 × 10⁻³ wt% (Table 1, sample #10).
The lowest concentration of phosphate and calcium ions in the liquid phase was reached at the neutral point of the isotherm at pH = 7.1 (Table 1, sample #7). At this point of the isotherm, at pH~7 and above, the stoichiometric FAp with the chemical formula Ca10(PO4)6F2 is formed. In the IR spectra of the solid samples formed under neutral and alkaline conditions, an absorption band at 875 cm−1, assigned to the HPO42− group, is absent (Figure 5, samples #8 and #9). The spectra become more similar to the FAp spectrum.
It should also be noted that FAp, which does not contain the acid groups, precipitates from the initial solution at a Ca/P ratio of >1.67, which is needed for FAp to form.
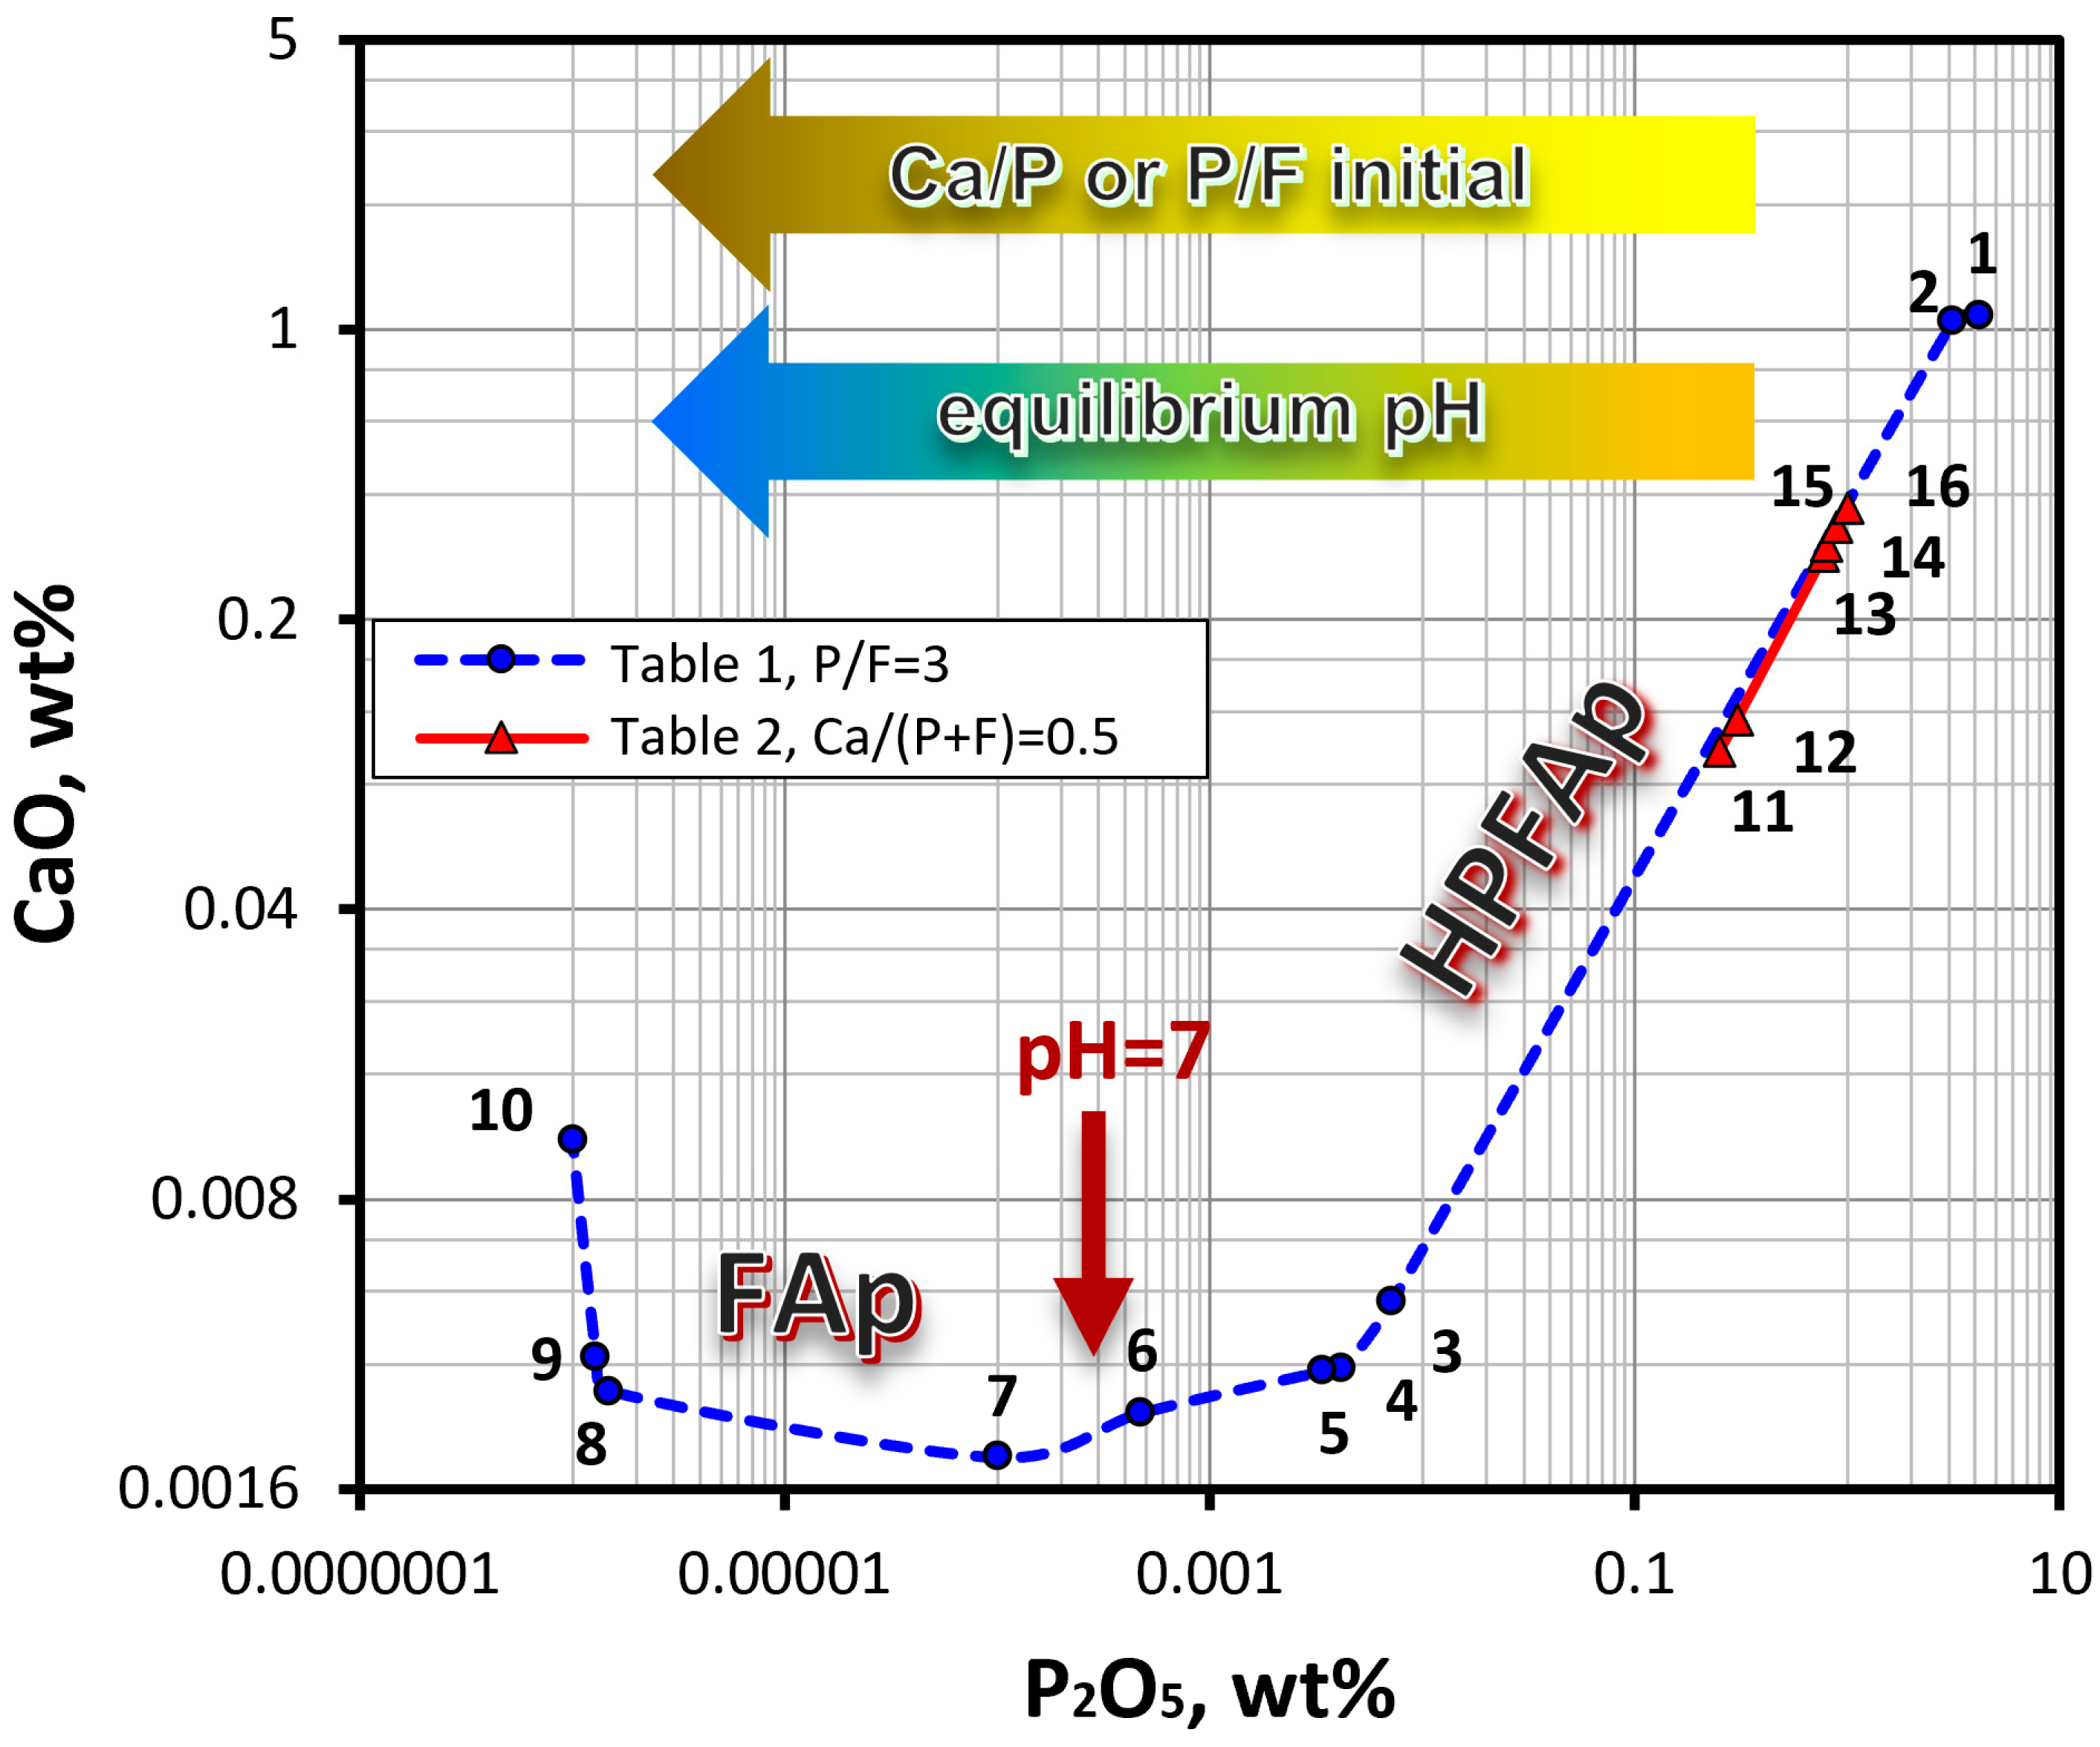
Based on the data obtained, an orthogonal projection of the isotherm of the CaO–P2O5–HF–H2O system onto the CaO–H2O–P2O5 coordinate plane was drawn (Figure 6). This diagram clearly shows that the composition of the solid phases, which are in equilibrium with the liquid phase, depends on the equilibrium pH, which in turn, is determined by the ratio of the components in the initial solution. Thus, in an acid medium, fluorapatite containing the HPO42− group (HPFAp) is formed, while in a neutral and alkaline medium, the formation of stoichiometric fluorapatite (FAp) takes place. Similar phase diagrams of the quaternary CaO–P2O5–HF–H2O and the ternary CaO–P2O5–H2O systems were reported in studies [8,9] and [34], respectively.
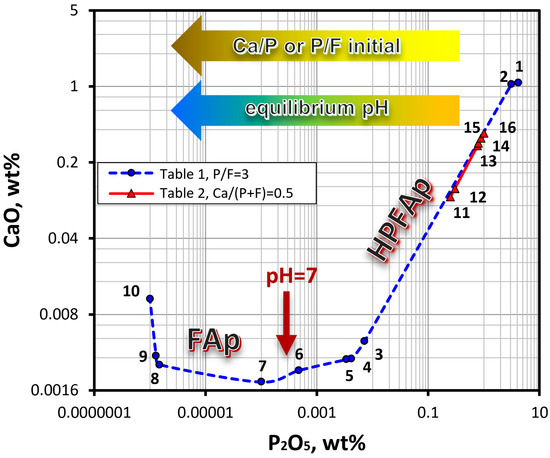
Figure 6.
Orthogonal projection of the CaO–P2O5–HF–H2O isotherm at 298 K onto the CaO–P2O5–H2O coordinate plane, based on the data in Table 1 and Table 2. Numbers on the graph indicate the sample numbers. Multi-colored arrows show the direction of increasing the ratio of the components in the initial solution, as well as the pH of the medium in the equilibrium state. The brown arrow indicates the transition region between FAp and HPFAp.
3.2. Section II
Unlike Section I, where the P/F ratio in the initial solution was a stoichiometric and constant value of 3, in Section II, this ratio varied from 1 to 20 (Table 2). The data in Table 2 show that an increase in the P/F ratio in the initial solution results in a decrease in the pH of the equilibrium liquid phase and changes the composition of the equilibrium liquid and solid phases. As seen in Figure 6, the compositions of the equilibrium liquid phase of the samples from Section II (points #11–#16, taken from Table 2) fall on the isotherm in the interval between samples #2 and #3 from Section I (Table 1). The composition of the liquid phase of the samples from Section II complements the diagram of the composition of the liquid phase of the samples from Section I.
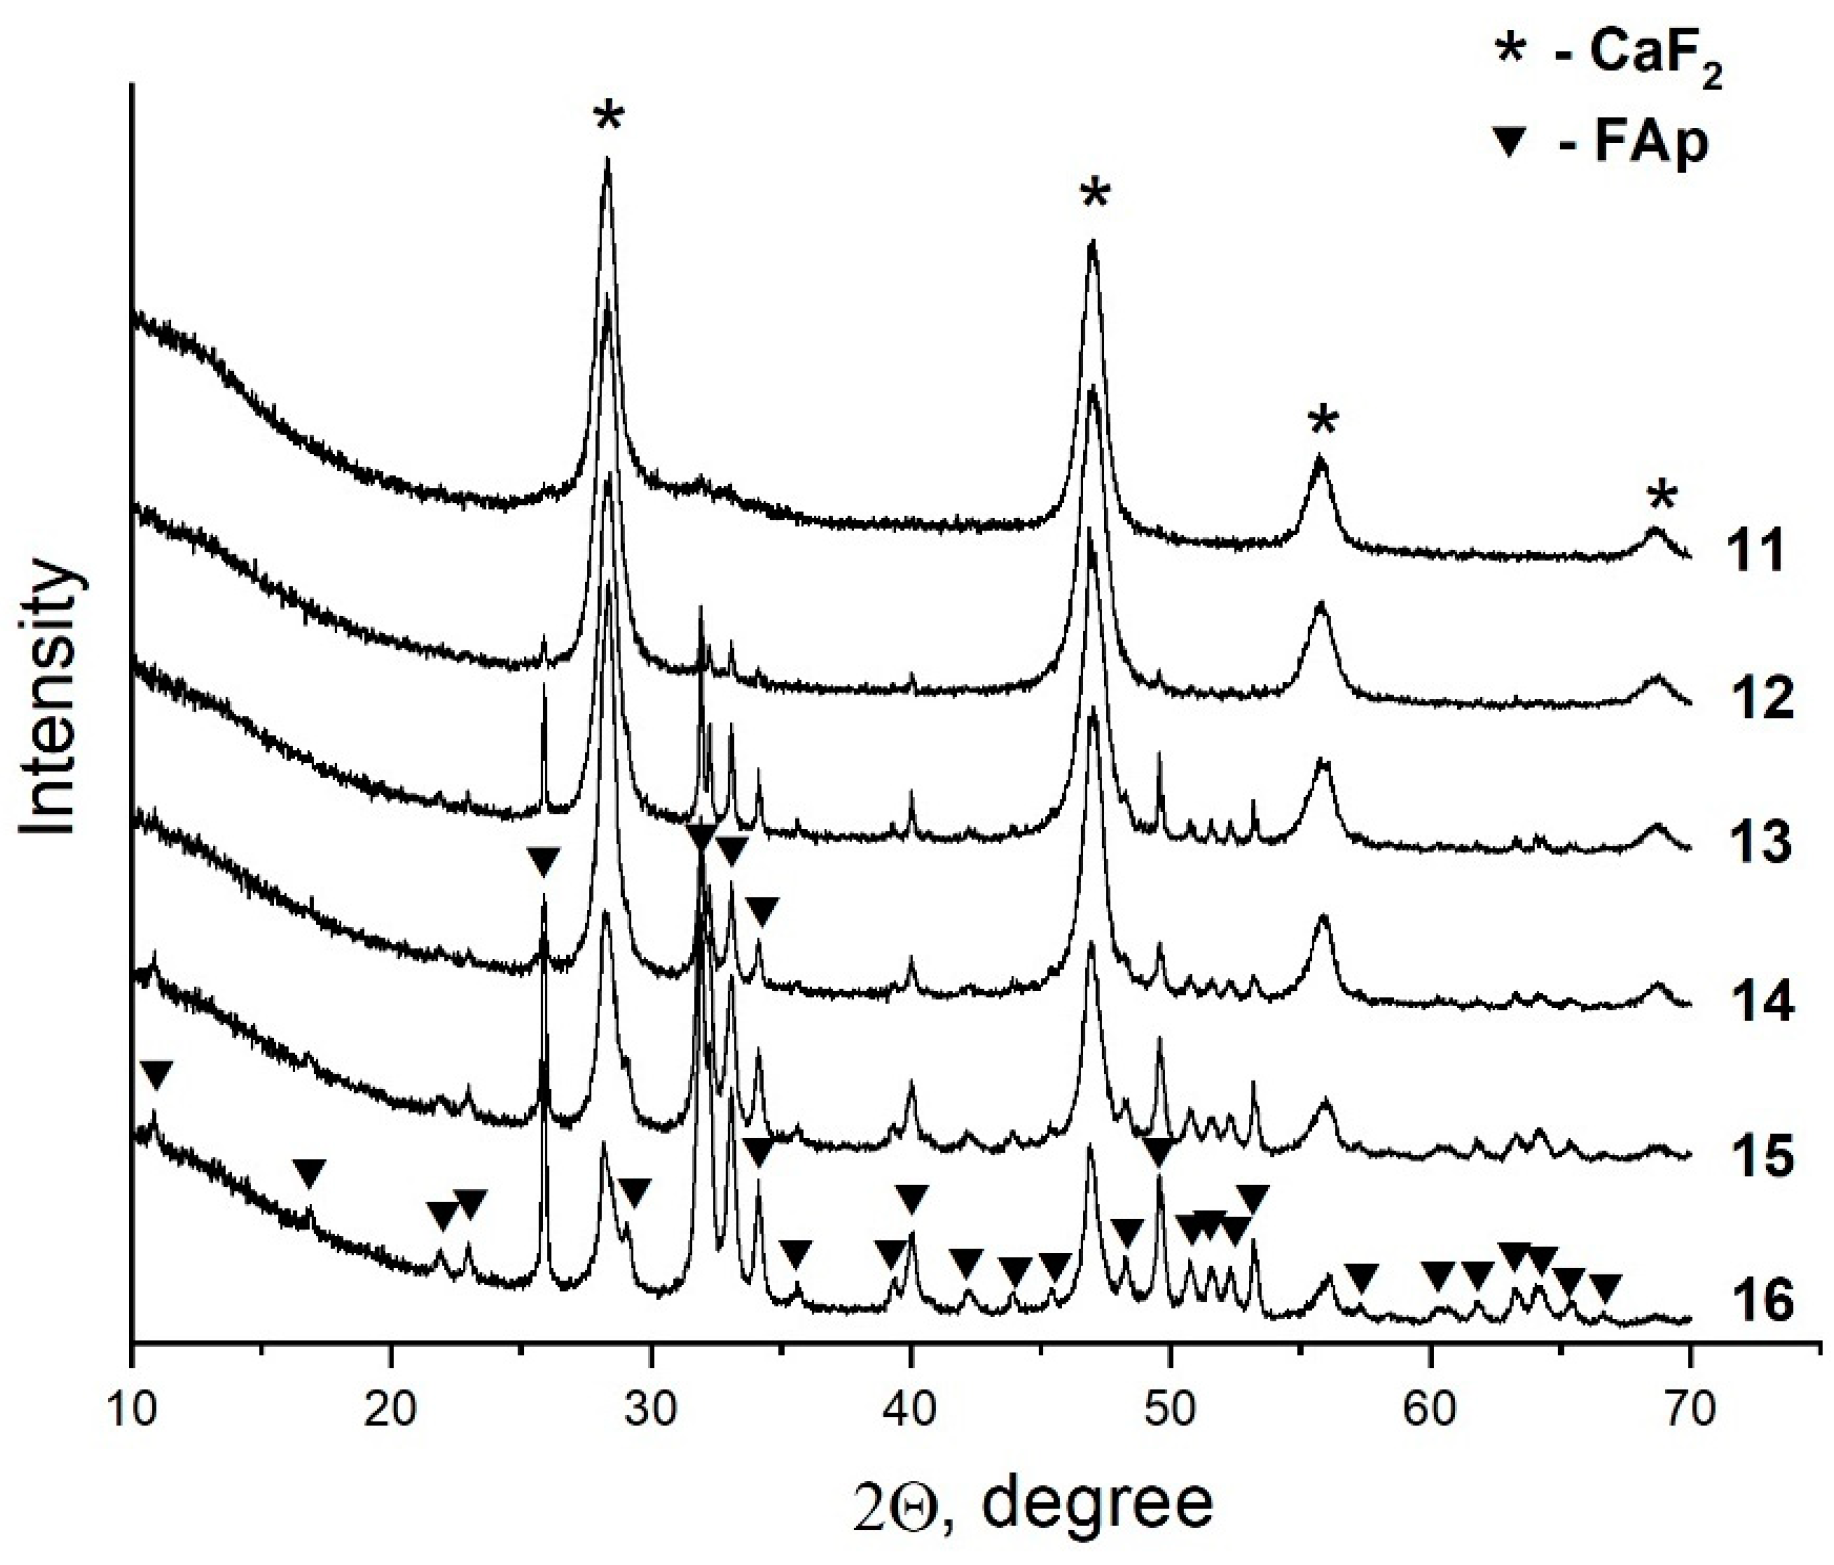
Analysis of the data obtained showed that the ratio of the components in the equilibrium solid phases is dependent on the P/F ratio in the initial solution (Figure 7). Thus, an increase in the phosphorus concentration in the initial solution results in an increase in the concentration of fluorapatite and a decrease in the content of fluorite. This can be seen when comparing the intensities of the reflections of the phases in the XRD patterns shown in Figure 7. It should be noted that as the fraction of the fluorapatite phase increases, its crystallite size decreases from 100 nm (sample #12) to 35 nm (sample #16). The latter sample is composed of 78 wt% apatite phase.

Figure 7.
XRD patterns of solid phases of the samples from Section II.
Figure 8 shows the IR spectra of the samples from Section II. As seen, they are very much similar to those obtained in the same range of the liquid phase concentrations from Section I (Figure 5). Analysis of the spectra of the equilibrium solid phases of the samples from Section II revealed that the P/F ratio in the initial solution affects the phosphate structure. Thus, the IR spectrum of sample #11, which, according to the XRD data, mainly consists of fluorite with a small content of amorphous apatite, has triply degenerated bending vibrations of phosphate and a band at 1073 cm−1 attributed to the P–O stretching vibrations ν3 (Figure 8), which is close to a similar band of the sample #1 (Figure 3). With an increase in the concentration of phosphorus in the initial solution up to a stoichiometric value of fluorapatite (P/F = 3) and higher, fluorapatite containing the HPO42− group (HPFAp) is formed. In the IR spectra of these samples, the bands attributed to the O–P vibrations ν3 appear in the 1000–1060 cm−1 range (Figure 8). A characteristic feature of the IR absorption in HPFAp is the splitting of the bands of the O–P–O bending vibrations ν4 in the 500–620 cm−1 range (Figure 8). It can be assumed that the presence of both the HPO42− groups and fluoride ions in the structure of fluorapatite lowers the symmetry of a PO43- tetrahedron, which is evident in the splitting of the absorption bands in the IR spectra. The shift of the phosphate bands is due to the variable composition of the samples, which is most likely caused by the different concentrations of the HPO42− group.
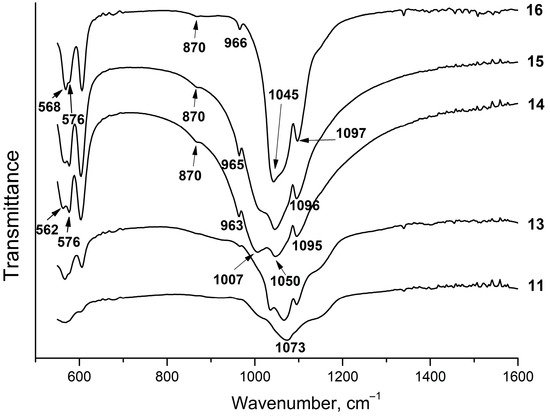
Figure 8.
IR spectra of solid phases of the samples from Section II.
4. Conclusions
The phase equilibria in the CaO–P2O5–HF–H2O system at 298 K in an atmosphere of nitrogen gas at low concentrations of the liquid phase components have been studied. The concentration range started at the invariant point between fluorapatite and monetite and ended at the levels limited by the sensitivity of analytical methods used. It has been established that all of the as-synthesized samples showed the presence of the fluorite phase. In addition to CaF2, compounds of variable composition with the fluorapatite structure are present in the acid and neutral regions of the isotherm. Depending on the ratio of the components in the initial solution and pH in the equilibrium state, the following equilibrium solid phases with the fluorapatite structure were found:
(1) Hydrogen phosphate fluorapatite, HPFAp, existing in an acid environment, at 7.1 > pH ≥ 1.9, with a part of the PO43− groups replaced by HPO42− ions. The excess charge of this heterovalent substitution is compensated by the calcium ion vacancies. The HPFAp composition can be described by the formula Ca10−x(HPO4)x(PO4)6−xF2−x, where 0 < x ≤ 1. The invariant point between three solid phases, HPFAp, CaHPO4 and CaF2, exists when the equilibrium liquid phase contains w(CaO) = 1.040 wt%, w(P2O5) = 3.127 wt%, w(F) = 1.85 × 10⁻³ wt% and pH = 1.84;
(2) Stoichiometric fluorapatite Ca10(PO4)6F2 is formed at pH = 7.1–7.58 at the lowest concentration of phosphate and calcium in the equilibrium solution. Under alkaline conditions, for the equilibrium liquid phase at pH = 11.54 containing w(CaO) = 0.040 wt%, w(P2O5) = 0.1 × 10⁻⁴ wt%, and w(F) = 0.41 × 10⁻³ wt%, fluorapatite has the invariant point with Ca(OH)2.
Supplementary Materials
The following supporting information can be downloaded at: https://www.mdpi.com/article/10.3390/cryst13081264/s1. Table S1. EDX analysis of element composition of the crystals.
Author Contributions
Conceptualization, M.V.C.; methodology, M.V.C.; software, N.V.B.; validation, M.V.C.; formal analysis, I.Y.P. and A.V.I.; investigation, I.Y.P., A.V.I., M.V.C., and N.V.B.; resources, M.V.C.; writing—original draft preparation, M.V.C.; writing—review and editing, N.V.B.; visualization, N.V.B.; supervision, M.V.C. All authors have read and agreed to the published version of the manuscript.
Funding
This research was carried out within a state assignment to the Institute of Solid State Chemistry and Mechanochemistry SB RAS (project No. 121032500064-8).
Data Availability Statement
The raw/processed data required to reproduce these results are included in the Materials and Methods section.
Acknowledgments
Electron microscopy studies were carried out on the basis of the Center for Collective Use, “National Center for the Study of Catalysts”.
Conflicts of Interest
The authors declare no conflict of interest.
References
- Ptáček, P. (Ed.) Phosphate rocks. In Apatites and Their Synthetic Analogues—Synthesis, Structure, Properties and Applications; InTech: Rijeka, Croatia, 2016; pp. 335–381. Available online: https://www.intechopen.com/chapters/49984 (accessed on 13 April 2016). [CrossRef]
- Van Wazer, J.R. Phosphorus and its compounds. In Chemistry; Wiley Interscience: New York, NY, USA, 1958; Volume 1, 2046p. [Google Scholar]
- Van Wazer, J.R. Phosphorus and its compounds. In Technology, Biological Functions and Applications; Interscience: New York, NY, USA, 1961; Volume 2, 957p. [Google Scholar]
- Baturin, G.N. Phosphorites on the Sea Floor. Origin, Composition and Distribution; Elsevier Scientific Publishing Company: Amsterdam, The Netherlands; Oxford, UK; New York, NY, USA, 1982; 355p. [Google Scholar]
- Ptáček, P. (Ed.) Utilization of apatite ores. In Apatites and Their Synthetic Analogues—Synthesis, Structure, Properties and Applications; InTech: Rijeka, Croatia, 2016; pp. 417–453. Available online: https://www.intechopen.com/chapters/49965 (accessed on 13 April 2016). [CrossRef]
- Leroy, N.; Bres, E. Structure and substitution in fluorapatite. Eur. Cells Mater. 2001, 2, 36–48. [Google Scholar] [CrossRef] [PubMed]
- Elliott, J.C. Structure and Chemistry of Apatite and Other Calcium Orthophosphates, 1st ed.; Elsevier: Amsterdam, The Netherlands, 1994; pp. 1–404. ISBN 0-444-81582-1. [Google Scholar]
- Farr, T.D.; Tarbutton, G.; Lewis, H.T. System CaO–P2O5–HF–H2O. J. Phys. Chem. 1962, 66, 318–321. [Google Scholar] [CrossRef]
- Kazakov, A.V. Fluorapatite equilibrium system under the conditions of sedimentary rock formation. Tr. Inst. Geol. Akad. Nauk SSSR Ser. Geol. 1950, 114, 7–21. [Google Scholar]
- Margolis, H.C.; Moreno, E.C.; Murphy, B.J. Effect of low levels of fluoride in solution on enamel demineralization in vitro. Dent. Res. 1986, 65, 23–29. [Google Scholar] [CrossRef] [PubMed]
- Yamazaki, H.; Litman, A.; Margolis, H.C. Effect of fluoride on artificial caries lesion progression and repair in human enamel: Regulation of mineral deposition and dissolution under in vivo-like conditions. Arch. Oral Biol. 2007, 52, 110–120. [Google Scholar] [CrossRef] [PubMed]
- Moreno, E.C.; Kresak, M.; Zahradnik, R.T. Physicochemical aspects of fluoride-apatite systems relevant to the study of dental caries. Caries Res. 1977, 11 (Suppl. 1), 142–171. [Google Scholar] [CrossRef] [PubMed]
- Arends, J.; Davidson, C.L. HPO42− Content in enamel and artificial carious lesion. Calcif. Tissue Res. 1975, 18, 65–79. [Google Scholar] [CrossRef] [PubMed]
- Verbeeck, R.M.H.; Thun, H.P.; Driessens, F.C.M. Solubility behaviour of defective fluorapatite and fluorhydroxyapatites. Ber. Bunsenges Phys. Chem. 1980, 84, 159–163. [Google Scholar] [CrossRef]
- Dowker, S.E.P.; Anderson, P.; Elliot, J.C.; Gao, X.J. Crystal chemistry and dissolution of calcium phosphate in dental enamel. Mineral. Mag. 1999, 63, 791–800. [Google Scholar] [CrossRef]
- Duff, E.J. Orthophosphates. Part I. Formation of apatites from calcium phosphates in potassium fluoride solutions. J. Inorg. Nucl. Chem. 1970, 32, 3707–3718. [Google Scholar] [CrossRef]
- Duff, E.J. Orthophosphates. Part II. The transformation brushite-fluorapatite and monetite-fluor-apatite in aqueous potassium fluoride solution. J. Chem. Soc. A 1971, 1, 33–38. [Google Scholar] [CrossRef]
- Duff, E.J. Orthophosphates. Part IV. Stability relationship of orthophosphates within the system CaO–P2O5–H2O and CaF2–CaO–P2O5–H2O under aqueous condition. J. Chem. Soc. A 1971, 8, 921–926. [Google Scholar] [CrossRef]
- Duff, E.J. Orthophosphates. Part V. Phase equilibria in the system calcium oxide-phosphorus pentoxide-calcium fluoride-water along the fluorapatite join under aqueous conditions. J. Chem. Soc. A 1971, 11, 1895–1898. [Google Scholar]
- Combes, C.; Cazalbou, S.; Rey, C. Apatite biominerals. Minerals 2016, 6, 34. [Google Scholar] [CrossRef]
- GOST (State Standard) 18309-2014; Water. Methods for Determination of Phosphorus-Containing Matters. Standartinform: Moscow, Russia, 2015; 24p.
- ISO 6878:2004; Water Quality—Determination of Phosphorus—Ammonium Molybdate Spectrometric Method. 2nd ed. ISO: Geneva, Switzerland, 2019; 21p.
- GOST (State Standard) 24 596.2-2015; Feed Phosphates. Methods for Determination of Phosphates. Standartinform: Moscow, Russia, 2015; 12p.
- GOST (State Standard) 31954-2012; Drinking Water. Methods for Determining Hardness. Standartinform: Moscow, Russia, 2014; 17p.
- Harris, D.C. Quantitative Chemical Analysis, 6th ed.; W.H. Freeman and Company: New York, NY, USA, 2003; Volume 259–267, pp. 272–277. [Google Scholar]
- GOST (State Standard) 24596.7-81; Feed Posphates. Methods for Determination of Fluorine. Standartinform: Moscow, Russia, 1982; 5p.
- GOST (State Standard) 24596.7-2015; Feed Phosphates. Method for Determination of Fluorine. Standartinform: Moscow, Russia, 2020; 3p.
- Cheary, R.W.; Coelho, A.A. A fundamental parameters approach of X-ray line-profile fitting. J. Appl. Crystallogr. 1992, 25, 109–121. [Google Scholar] [CrossRef]
- Chaikina, M.V.; Bulina, N.V. Formation of calcium phosphate apatite in system CaO–P2O5–H2O: Equilibrium at 298 K under a nitrogen atmosphere. Curr. Appl. Mater. 2023, 2, e061022209632. [Google Scholar] [CrossRef]
- Chaikina, M.V.; Bulina, N.V.; Prosanov, I.Y.; Gerasimov, K.B.; Makarova, S.V. Formation of carbonated apatite in equilibrium system CaO–P2O5–H2CO3–H2O at 298 K in air. Chem. Pap. 2023, 2895. [Google Scholar] [CrossRef]
- Holt, C.; Van Kemenade, M.J.J.M.; Harries, J.E.; Nelson, L.S.; Bailey, R.T.; Hukins, D.W.L.; Hasnain, S.S.; de Bruyn, P.L. Preparation of amorphous calcium-magnesium phosphates at pH 7 and characterization by X-ray absorption and fourier transform infrared spectroscopy. J. Cryst. Growth 1988, 92, 239–252. [Google Scholar] [CrossRef]
- Hayek, E.; Link, H. Hydrogen phosphate and carbonate in synthetic calcium phosphate and in the bone mineral. In Colloques Internationaux du Centre National de la Recherche Scientifique; CNRS: Paris, France, 1975; pp. 101–104. [Google Scholar]
- Brown, P.W.; Martin, R.I. An analysis of hydroxyapatite surface layer formation. J. Phys. Chem. B 1999, 103, 1671–1675. [Google Scholar] [CrossRef]
- Brown, P.W. Phase relationships in the ternary system CaO–P2O5–H2O at 25 °C. J. Am. Ceram. Soc. 1992, 75, 17–22. [Google Scholar] [CrossRef]


Disclaimer/Publisher’s Note: The statements, opinions and data contained in all publications are solely those of the individual author(s) and contributor(s) and not of MDPI and/or the editor(s). MDPI and/or the editor(s) disclaim responsibility for any injury to people or property resulting from any ideas, methods, instructions or products referred to in the content. |
© 2023 by the authors. Licensee MDPI, Basel, Switzerland. This article is an open access article distributed under the terms and conditions of the Creative Commons Attribution (CC BY) license (https://creativecommons.org/licenses/by/4.0/).