Article

Investigation of the High-Pressure Behaviors of Amblygonite by Single-Crystal X-ray Diffraction, Raman Spectroscopy, and DFT Calculations

1
School of Earth Sciences and Resources, China University of Geosciences (Beijing), Beijing 100083, China
2
School of Earth and Space Sciences, Peking University, Beijing 100871, China
3
State Key Laboratory of Tibetan Plateau Earth System Science, Resources and Environment (TPESRE), Institute of Tibetan Plateau Research, Chinese Academy of Sciences, Beijing 100101, China
4
School of Ocean and Earth Science and Technology, Hawai’i Institute of Geophysics and Planetology, University of Hawaii at Manoa, Honolulu, HI 96822, USA
*
Author to whom correspondence should be addressed.
Crystals 2023, 13(8), 1269; https://doi.org/10.3390/cryst13081269
Submission received: 30 June 2023 / Revised: 11 August 2023 / Accepted: 12 August 2023 / Published: 17 August 2023
(This article belongs to the Section Mineralogical Crystallography and Biomineralization)

Abstract

:
In the present study, we extensively explored the high-pressure behaviors and vibrational properties of amblygonite LiAlPO4F with elevated pressures up to 34.3 GPa based on single-crystal X-ray diffraction measurements, Raman spectroscopy, and DFT calculations. The compressibility and elastic properties of amblygonite were determined first. Specifically, the obtained isothermal bulk modulus of LiAlPO4F is 128(4) GPa and the triclinic phase exhibited anisotropic compression with axial compressibility βc > βa > βb with a ratio of 1.11:1.00:1.20. The Raman spectra showed no indication of phase transformation and were used to obtained mode Grüneisen parameters. The average Grüneisen parameter for PO4 tetrahedral sites was smaller than for the LiO4F sites. Our results provide new insights into the phase stability and elastic properties of lithium-fluorite granites at extreme conditions.

1. Introduction

The behaviors of lithium-fluorite minerals and their related granites under high-pressure conditions have been studied broadly over a few decades, and knowledge about such minerals has important applications in tracing the pegmatite-forming process [1,2,3,4]. Amblygonite (LiAlPO4F)–montebrasite (LiAlPO4OH), cassiterite, and Nb-Ta oxides are the most common accessory minerals in all the dykes of the pegmatite fields, and members of the amblygonite–montebrasite series are common constitutents of Li- and F-rich granitic pegmatites [5,6,7]. Hence, the amblygonite–montebrasite monitor can provide some basic knowledge of the peraluminous granitic and pegmatitic melts. The distribution of fluorine between amblygonite–montebrasite solid solutions has also long been investigated during the crystallization of these magmatic phases and associated phases as well [2,8]. Therefore, the knowledge of high-pressure behaviors of amblygonite helps understand the detailed crystal chemistry of such Li-bearing granites and can reflect the fundamental distinctions in the conditions of magma origin. However, comprehensive studies on the crystal structural evolution and physical properties of amblygonite LiAlPO4F at extreme conditions have not been fully investigated yet.
Natural faceted gemstones of amblygonite–montebrasite isomorphous series show complete solid solutions with an ideal chemical composition of LiAlPO4(F,OH). The minerals are open-framework alumino-phosphate series with triclinic structure. As members of the amblygonite–montebrasite series are common constituents of Li and F-rich granitic pegmatites, most previous studies have focused on the determination of the F contents and F/(F+OH) ratio of such solid-solution series [2,9]. Moreover, the F-OH substitution in LiAlPO4(F,OH) has attracted much attention due to its possible variations in crystal structural and geochemical and physical properties as well [10,11]. For example, F substitution into the lawsonite framework would likely stabilize the crystal structure since it would remove the H-H repulsion [12]. Groat et al. [11] described the crystal structure of the amblygonite–montebrasite series using a C-centered cell and also suggested that the pseudo-monoclinic structure was topologically identical to the titanite group minerals such as lacroixite NaAlPO4F with a monoclinic phase. Recently, the microstructure of amblygonite–montebrasite was demonstrated by Shirose and Uehare [3] using powder X-ray diffraction and transmission electron microscope techniques. However, the structural behaviors and compressibility of amblygonite at high pressures are more sparse. Further investigation is needed to study the precise and accurate structural information and vibrational properties of amblygonite LiAlPO4F at high-pressure conditions.
In this work, we undertook high-precision, single-crystal structure determinations of amblygonite up to ~34 GPa in situ using synchrotron-based single-crystal X-ray diffraction and theoretical calculations. High-pressure vibrational properties of amblygonite were also determined by Raman spectroscopy. These results firstly provide a comprehensive understanding of the crystallographic information of such lithium-fluorite granites under high-pressure or high-temperature conditions, thus improving our knowledge of proper elastic and chemical properties of these alumino-phosphates in pegmatites and shedding new light on alkali reservoirs in the Earth’s upper mantle.

2. Materials and Methods

2.1. Experimental Setup

High-quality single-crystal samples of natural, cream-colored amblygonite were used for the current study. The amblygonite sample measured in this study had the same chemical composition as that of Dias et al. [1], including 49.58% P2O5, 35.19% Al2O3, 5.89% H2O, and 10.25% Li2O as well as some minor components 0.02% Na2O and 0.40% F. We screened several chips polished to ~15 μm thickness of the sample for high-pressure measurements. At room P-T conditions, the LiAlPO4F crystal was characterized with a Bruker SMART CCD diffractometer using a sealed-tube X-ray source (MoKα radiation, λ = 0.71073 Å) operating at 45 kV and 35 mA at the China University of Geosciences (Beijing).
A short symmetric-type DAC fitted with 300 μm Boehler-Almax diamond anvils mounted into a seat with a 56° opening was used for high-pressure measurements. A 160 μm diameter hole was drilled in a pre-indented ~45 μm rhenium gasket with an initial thickness of 250 μm to act as a sample chamber. The polished amblygonite crystal and a gold foil were loaded together into the sample chamber, followed by gas loading with neon as the pressure-transmitting medium using the COMPRES/GSECARS gas-loading system [13]. XRD patterns of gold were collected at each pressure before and after sample data collection [14].
In situ high-pressure single-crystal XRD experiments were conducted at up to 34.4 GPa and room temperature at the 13-BM-C experimental station of the Advanced Photon Source, Argonne National Laboratory. The incident X-ray beam at the 13-BM-C was monochromated to 0.4340 Å with a focal spot size of 15 × 15 μm2. XRD patterns were recorded with a MAR165 charge-coupled device detector that was placed about 170 mm away from the sample. The experimental details were also described previously [15,16]. To obtain an adequate number of diffraction peaks of samples and increase the coverage of the reciprocal space, we collected data at four different detector positions. Wide-scan and stepped-φ exposures were collected in a rotation range from –90° to +90° with a typical exposure time of one second per degree. Data were analyzed by the APEX3 Crystallography Software Suite, VESTA software, and the SHELXL package [17,18,19]. P-V data were fitted by the EoSFit7-GUI program [20].
High-pressure Raman spectroscopy for the amblygonite was performed at up to 28.6 GPa and at room temperature using Princeton-style diamond cells with 300 μm ultra-low fluorescent diamond anvils. Rhenium gaskets were pre-indented as sample chambers to a thickness of ~40 μm with a hole of ~160 μm in diameter drilled by laser at the center of the indentation. The diamond cells for Raman spectroscopy were gas loaded with neon at HPSTAR and ruby was used for pressure calibration [21]. Reported pressure uncertainties reflect the difference between pressure measurements performed before and after each data collection, which did not vary by more than ±0.2 GPa. Raman spectra were collected on a Renishaw inVia reflex Raman spectrometer with a 532 nm diode-pumped solid-state laser at Peking University. The spectra were collected in black-scattering geometry using a charge-coupled device detector with a resolution of 1 cm−1. All spectra were fitted with pseudo-Voigt functions to determine the peak positions.

2.2. Computer Simulations

DFT-based first-principle calculations were performed utilizing the projected augmented wave method using the Vienna Ab initio Simulation Package [22,23,24,25,26]. The generalized gradient approximations with the Perdew–Burke–Ernzerhof (PBE) version were adopted to treat the exchange and correlation (XC) function [27]. We employed pseudopotentials to model the ion-electron interaction. The plane wave energy cutoff was set to 800 eV and the energy convergence criterion for the electronic self-consistent calculations was 10−5 eV. The force difference was converged to 1 × 10⁻³ eV/Å (less than 0.1 GPa). The k-points grids were set as 5 × 5 × 4 in the Brillouin zone for amblygonite in structural relaxation calculations using the Monkhorst–Pack method [28]. The geometry optimization was conducted from about −2 to 27 GPa at 0 K. We changed the pressure by scaling the volume of each crystalline phase. The atomic positions and unit cell parameters were allowed to relax at each given volume to obtain the minimum total energy.

3. Results

3.1. Sample Characterization

The natural sample used in this work was obtained from Divino das Laranjeiras, the district of Linópolis, Minas Gerais in Brazil; the composition in this study is close to that published by Dias et al. [1] which is also from the same location. A small chip of amblygonite single crystal, extracted from a larger specimen, was used for the sample characterization with single-crystal diffraction, which agrees well with previous studies [29]. All observed reflections could be indexed to a triclinic primitive unit cell. The results confirmed that the amblygonite sample possess space group P-1 structure, and its lattice parameters were a = 5.0338(3) Å, b = 5.191(1) Å, c = 7.0160(6) Å, α = 106.63(1)°, β = 109.26(1)°, γ = 97.933(1)°, and V = 160.3(1) Å3. The crystallographic information file for amblygonite at room P-T is provided in the supporting information. The disorder in the Li site is caused by the substitution of F for OH; therefore, it would also give the OH/F disorder in the nearest sites within the structure [10]. The amblygonite structure is characterized by chains of corner-linked AlO4F2 octahedra that run parallel to the c-axis. These octahedral chains are linked laterally by edge-sharing PO4 tetrahedra and larger LiO4F-polyhedra [16] (Figure 1).

3.2. Room-T compressibility

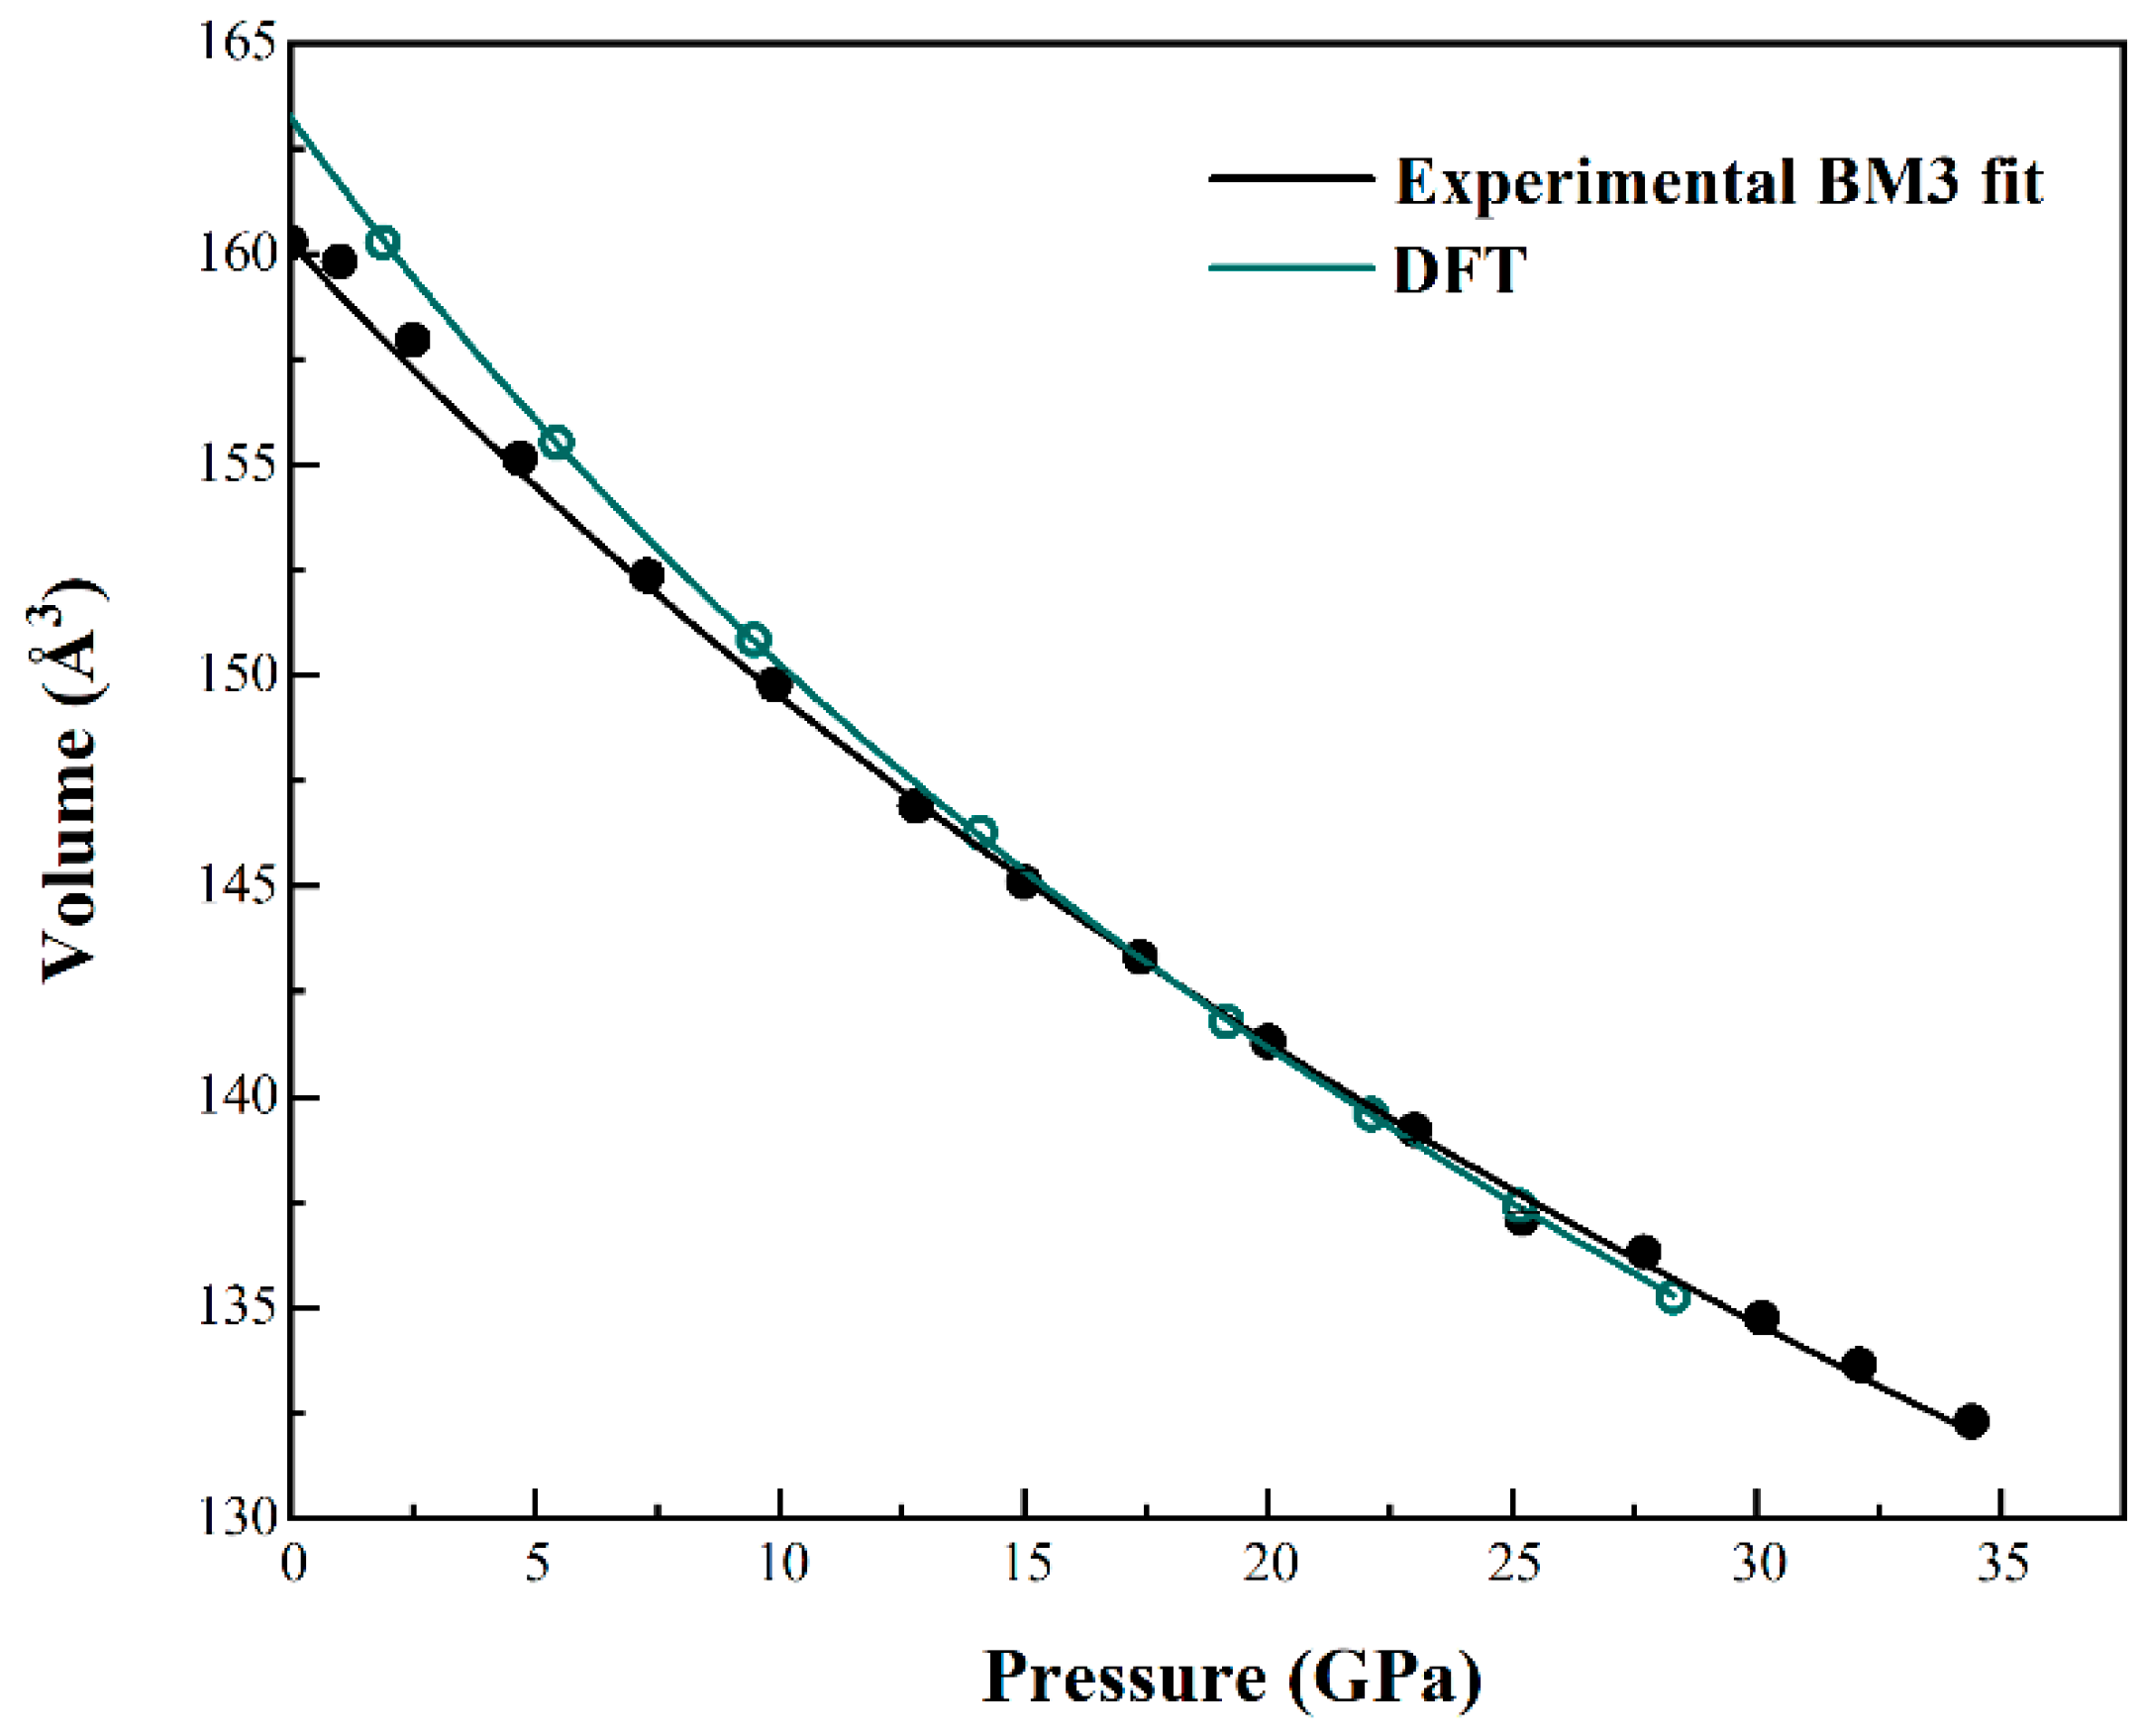
Lattice parameters and the unit–cell volume of amblygonite at high-pressure conditions were analyzed using the APEX3 v2018.7-2 software (Bruker) Figure 2 shows the single-crystal diffraction pattern at 1.0 GPa, and all diffraction spots collected can be readily indexed with the triclinic LiAlPO4F structure. There was no indication of phase transition up to 34.4 GPa at room temperature (Table S1, see in Supplementary Materials). However, the high-pressure crystal structure could not be refined due to the limited opening angle of the diamond cell and the low symmetry of amblygonite. The obtained unit–cell reference volume, VT0 = 160.27(1.7) Å3, is consistent with the previously reported value [29]. To obtain the EoS parameters, we then fit the P-V data to a third-order Birch–Murnaghan equation of state (BM3-EoS) using error-weighted least squares with EoSFit7c [30]. The resulting BM3-EoS parameters were as follows: VT0 = 160.3(1) Å3, KT0 = 128(4) GPa, and KT0′ = 3.4(4) (Figure 2). The P-V data yielded values of KT0 = 122(1) GPa when assuming a pressure derivative of KT0′ = 4.
To verify the XRD experimental results, we then carried out the theoretical calculation using Density Functional Theory. Energy–volume results were also fitted with the BM3-EoS [31,32], which yields VT0 = 163.2(1) Å3, KT0 = 102(1) GPa, and KT0′ = 4.2(2). The bulk modulus from the DFT calculation was slightly smaller than the experimental results (Figure 3). The calculated equilibrium volumes were generally underestimated by 3% in comparison to the experimental results, which is typical for PBE method computations. Our fitted values are comparable with those reported typical values of phosphates [33].
The trend of lattice parameters relative to a (a/a0), b (b/b0), c (c/c0), α, β, and γ angles with pressure are plotted in Figure 3. To determine the axial compressibility of each axis in amblygonite, we used a linearized BM3 fitting where each axial dimension is cubed and treated as a volume in the BM formulation [30]. The zero-pressure axial compressibility of linear dimension l, defined as βl0 = −(l−1)(δlP)P=0, is related to the linear modulus (linear incompressibility) by Kl0 = (βl0)−1. For amblygonite, our fitted linear moduli to a, b, and c were 387(7), 430(5), and 359(9) GPa, respectively, corresponding to axial compressibility values of βa = 2.58(1) × 10−3, βb = 2.33(2) × 10−3, and βc = 2.79(3) × 10−3 GPa−1. There is a considerable anisotropy in axial compressibility with βc > βa > βb and the ratio of zero-pressure axial compressibility in amblygonite is 1.11:1.00:1.20. The DFT calculated results are more scattering than the experimental data (experimental results: solid symbols, DFT: open circle), but both results are in agreement with each. The interaxial angles α, β, and γ showed a steady trend in compression up to ~35 GPa, supported by the experimental and calculation evidence (Figure 4).

3.3. Polyhedral Compression and Distortion

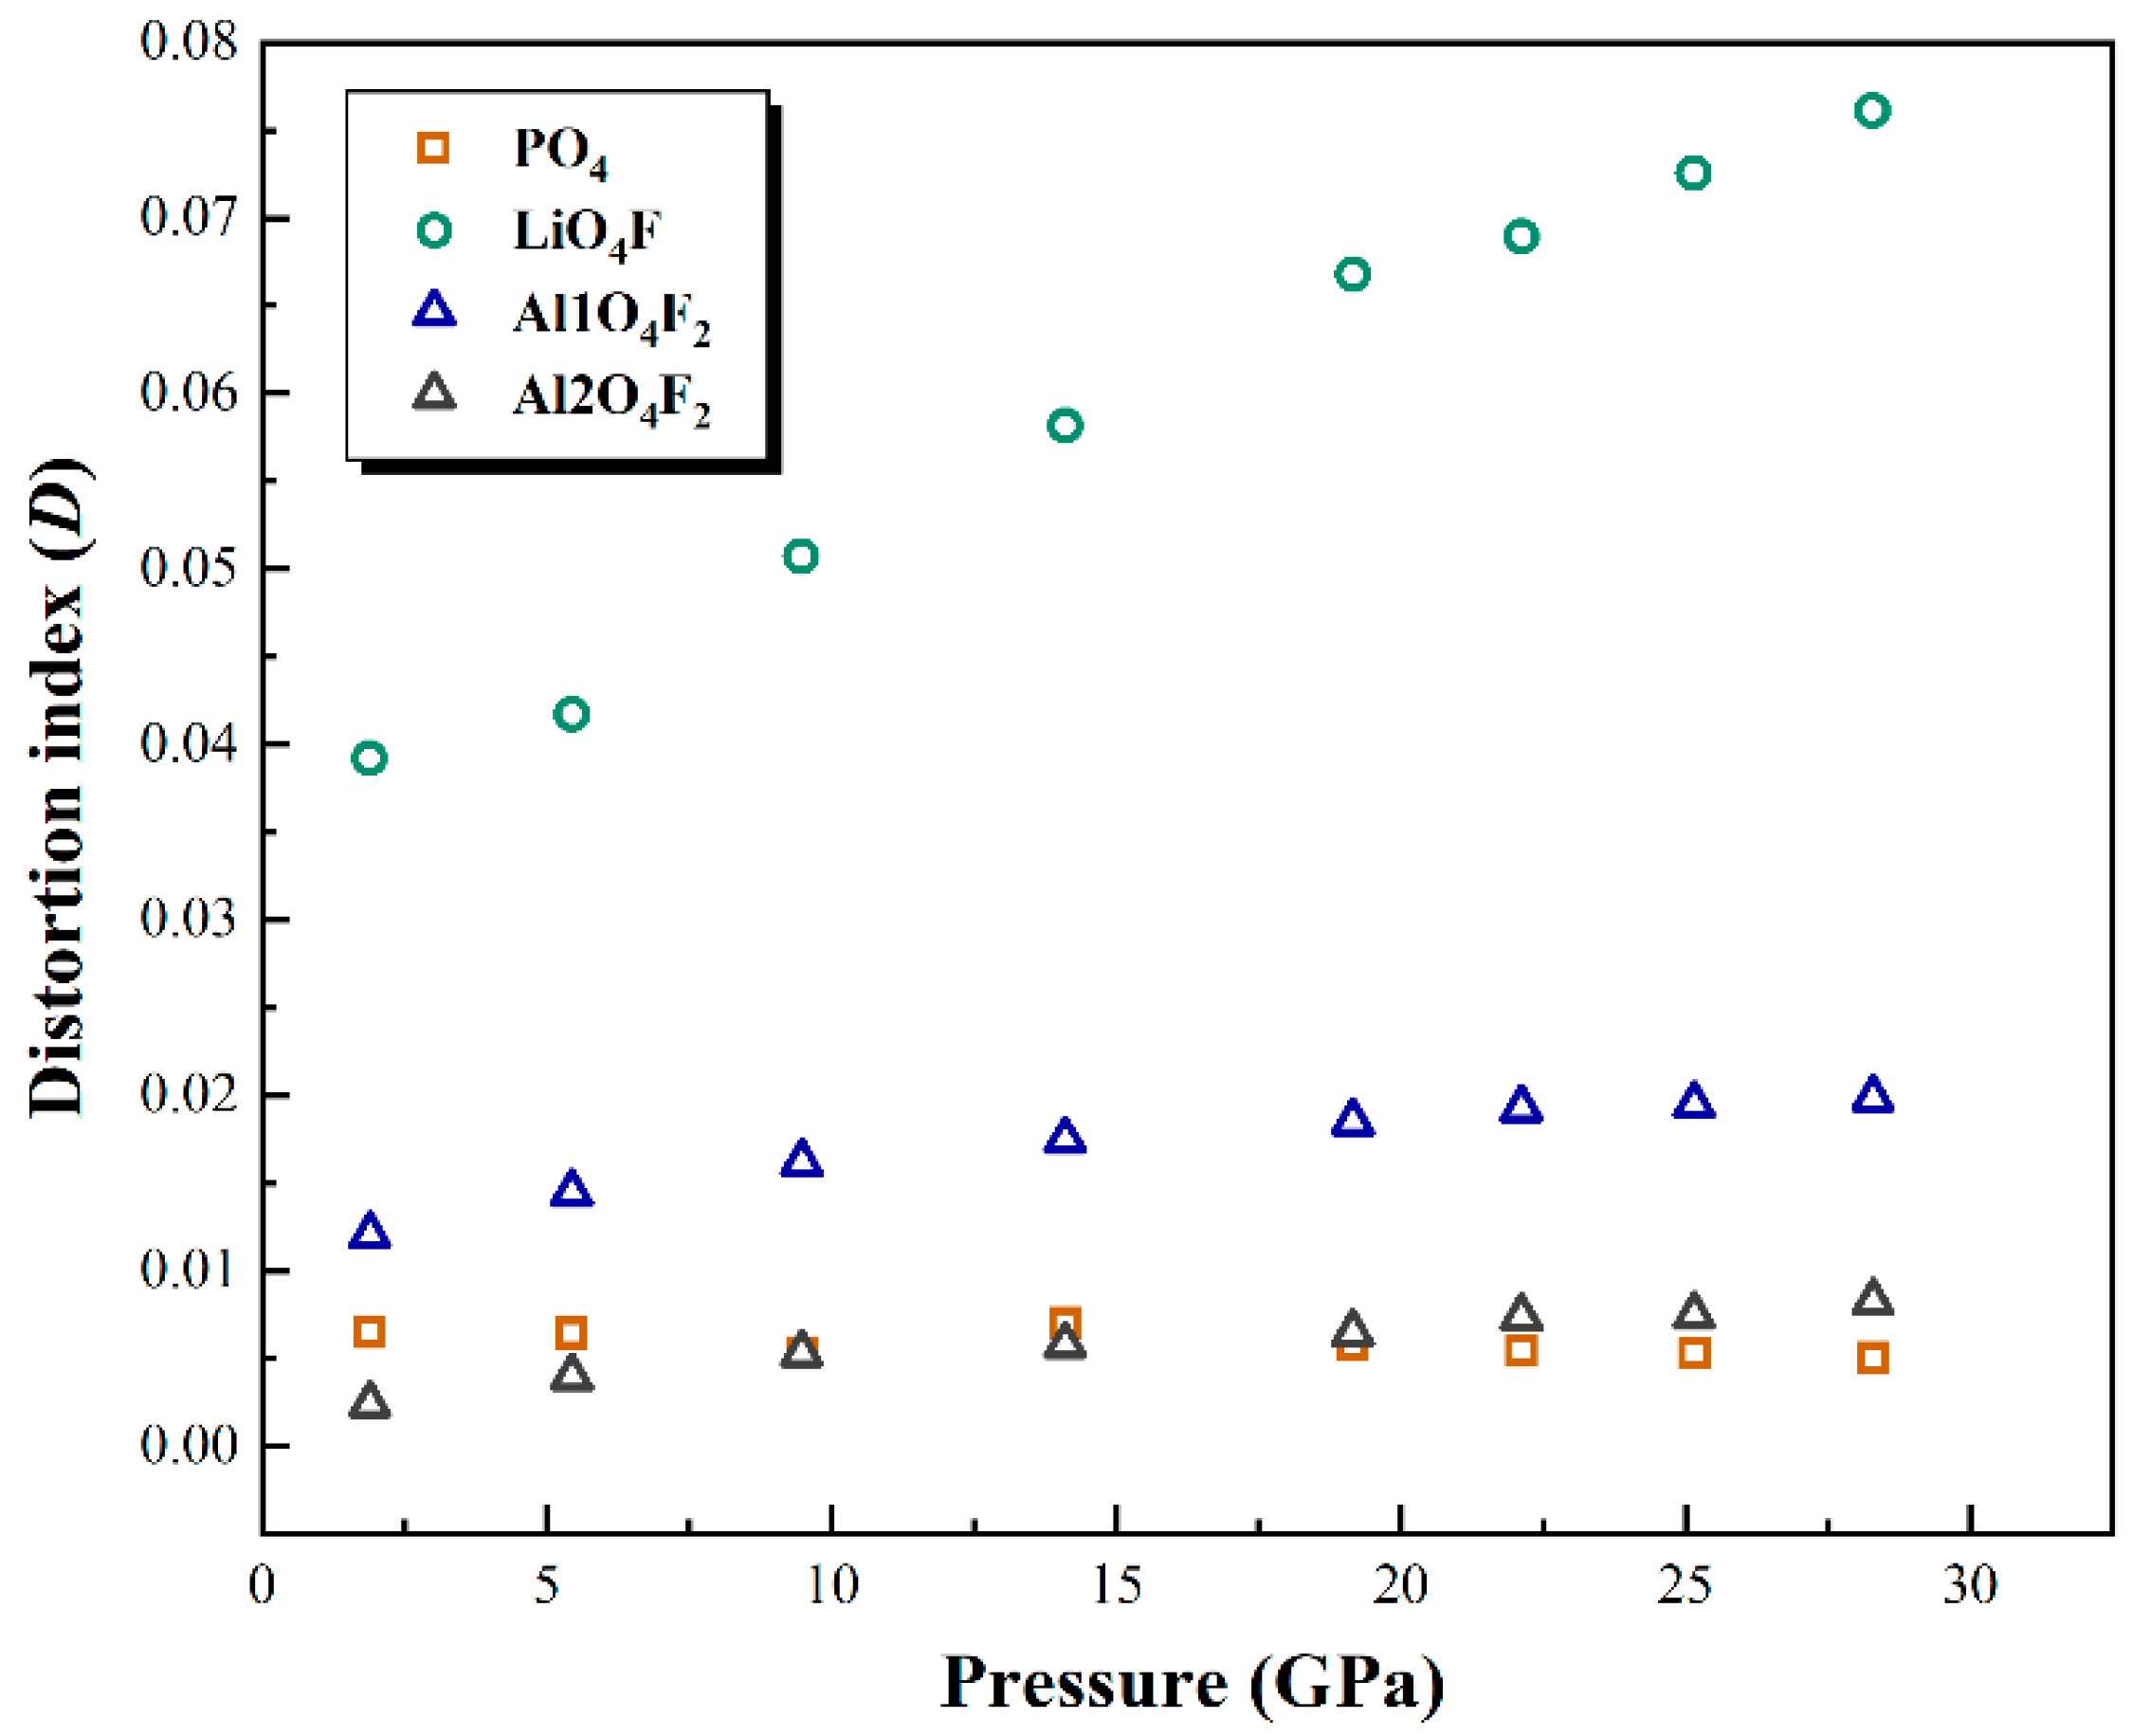
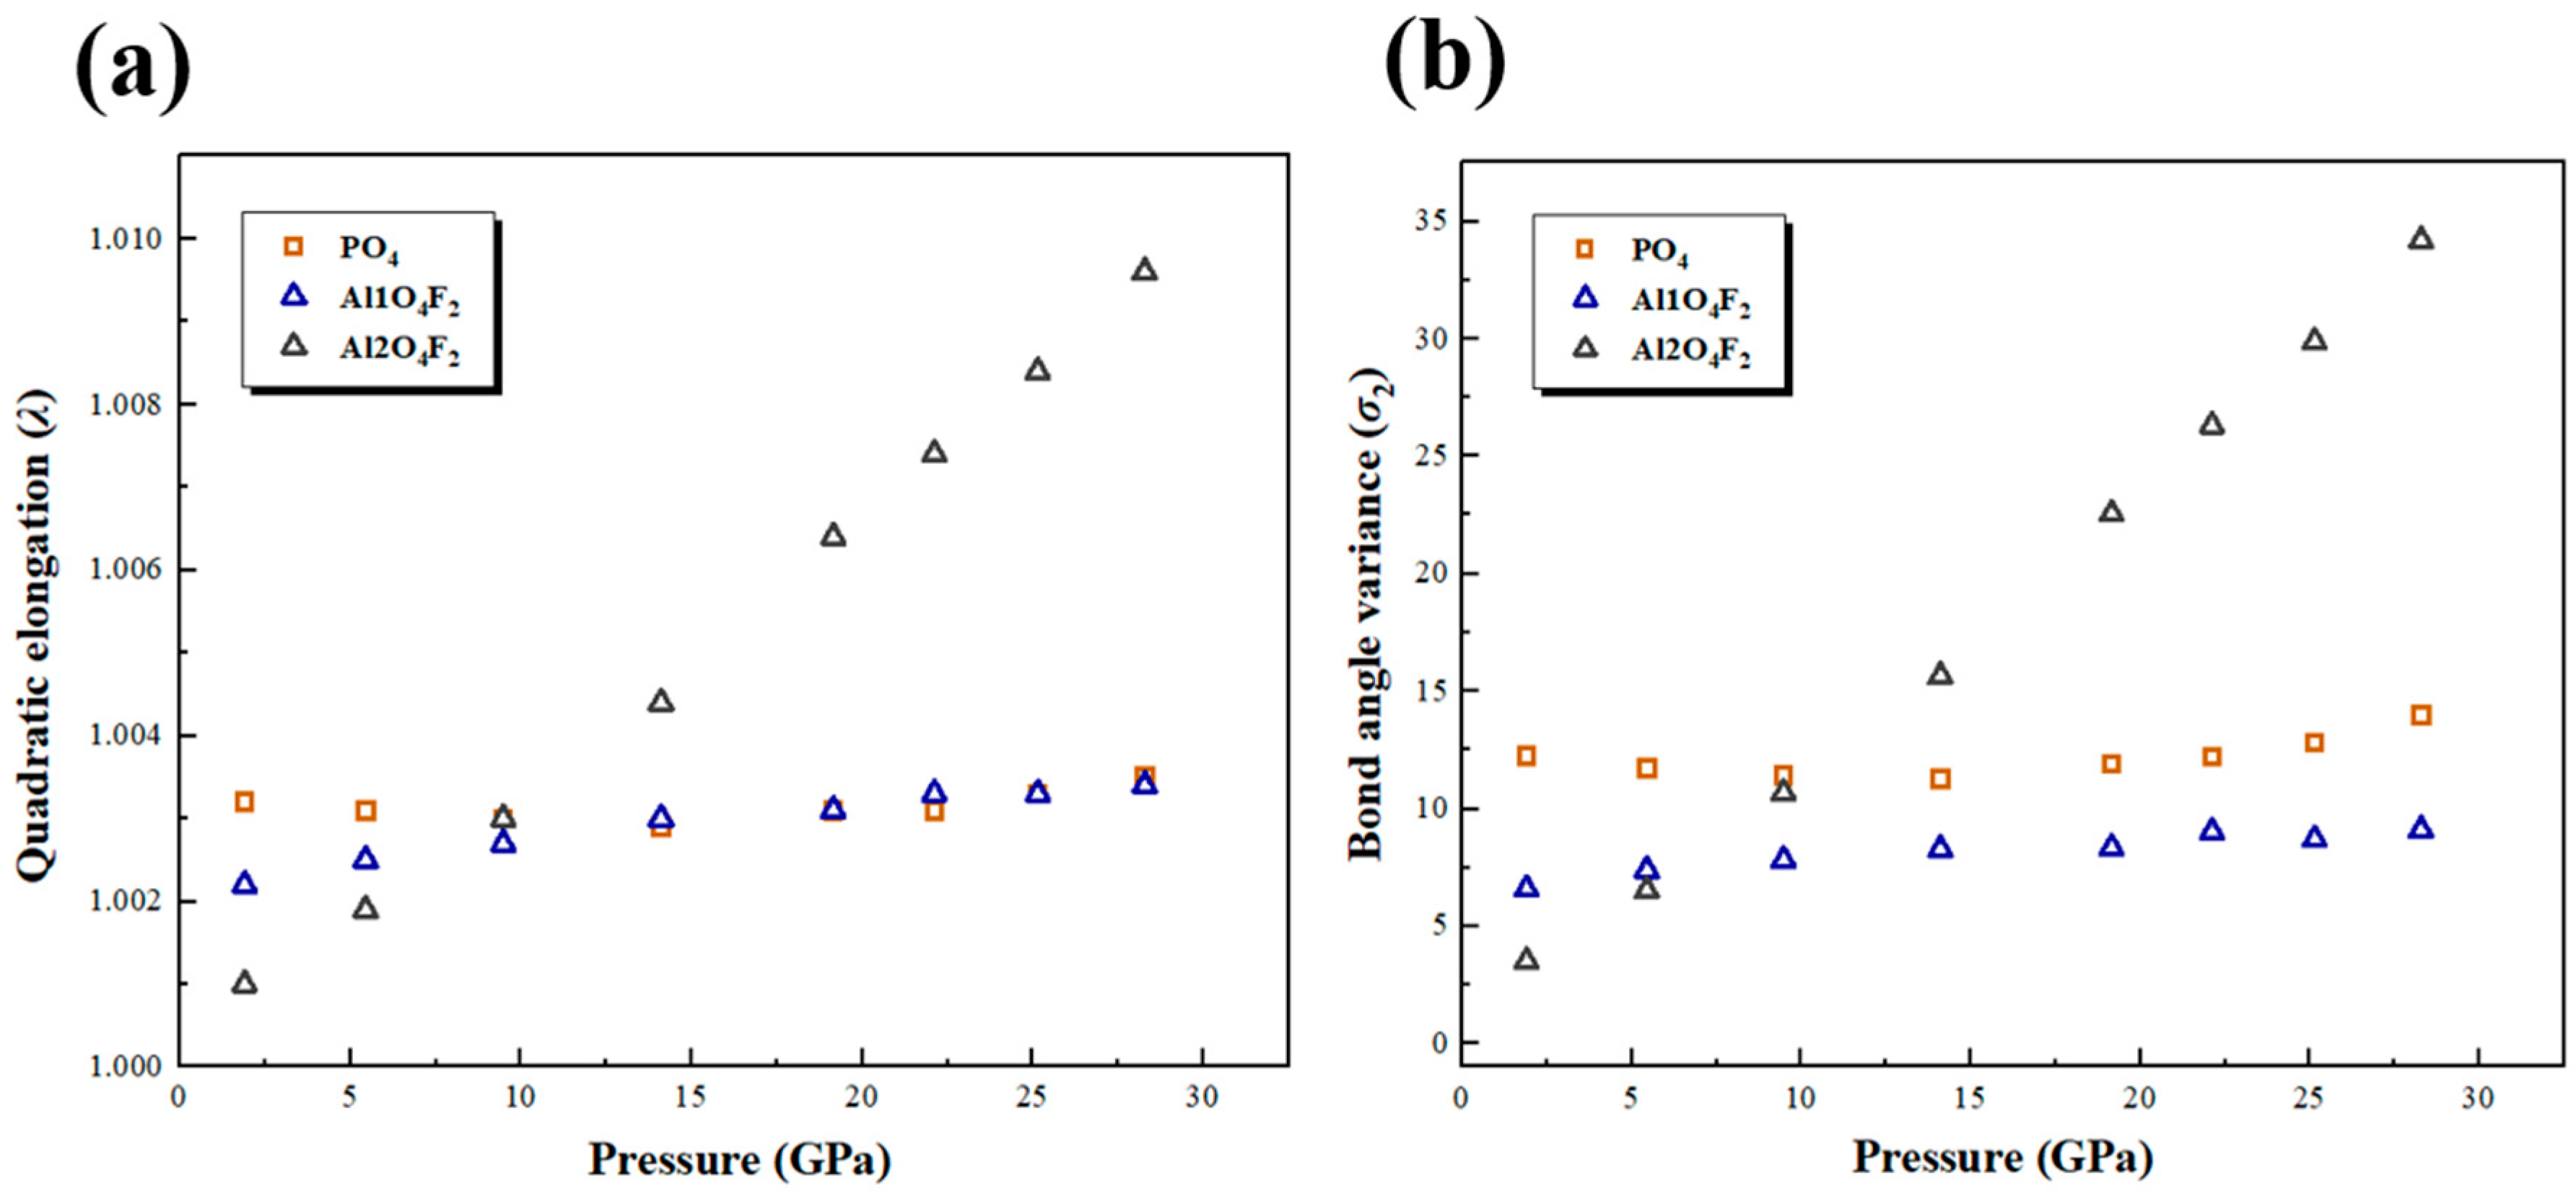
Bond lengths, angles, and polyhedral volumes are useful parameters to characterize the distortion of each polyhedron. The compressibilities calculated based on theoretical (DFT) results of three polyhedra (AlO4F2, PO4, and LiO4F) are significant. There were two distinct octahedral sites (Al1 and Al2), two distorted hexahedral sites (Li1 and Li2), and two P positions (P1 and P2) (Table S2). Bond length (Å), polyhedral volume (Å3), distortion index (D), and quadratic (λ) and bond angle variance (σ2) for various polyhedra at different pressures are shown in Table S2.
Among these three types of polyhedra, PO4 tetrahedra showed little or no compression, while LiO4F polyhedra showed the greatest compression (Figure 5). The average AlO4F2 volume was 9.125 Å3 at 1.9 GPa and decreased to 7.725 Å3 at 28.3 GPa, and the average volume in LiO4F polyhedra was about 7.072 Å3 at 1.9 GPa and changed to 5.377 Å3 at the highest pressure. Between 1.9 and 28.3 GPa, the PO4 tetrahedra showed the least compression, decreasing from 1.919 to 1.793 Å3 in the amblygonite sample. Slopes of the polyhedral volumes as a function of pressure were obtained from a linear fit. It can be concluded that the distorted trigonal prismatic geometry of the LiO4F unit is more compressible than the PO4 rigid polyhedral unit. On the other hand, the partial replacement of Li by Na might decrease Li-O bond strength, thus making the LiO4F polyhedra softer. The OH-F substitution is also giving rise to the less rigid LiO4F and AlO4F2 polyhedra. Therefore, the unit–cell volume decrease on compression is dominated by the compression of the AlO4F2 octahedra and LiO4F polyhedra.
We first calculated the distortion index, quadratic elongation, and bond angle variance to quantify the distortion of each polyhedron. The distortion index (D), defined as D = 1 n i = 1 n l i l a v l a v , where li is the distance from the central cation to the ith surrounding oxygen and lav is the average distance. Quadratic elongation (λ) and bond angle variance (σ2) were employed to describe the deviation from the regular shape of polyhedra [34,35]. The bond angle variance and quadratic elongation were defined as σ2 = i = 1 n ( θ i θ 0 ) 2 n 1 and λ = i = 1 n ( l i l 0 ) 2 n , respectively, where θi is the ith angle, θ0 is the ideal bond angle for the perfect regular polyhedron, li is the ith center-to-vertex distance, and l0 is the ith center-to-vertex distance for the regular polyhedron.
As a consequence, the degree of distortion within the LiO4F polyhedra showed a significant increase with pressure, while the other AlO4F2 octahedra and PO4 tetrahedra showed little or no increase as indicated by the D values (Figure 6). At 1.9 GPa, both the AlO4F2 and PO4 polyhedra in LiAlPO4F were close to being regular with average D = 0.006 and changes to 0.014 and 0.005 at 28.3 GPa, respectively. The evolutions of the values of σ2 and λ for AlO4F2 and PO4 polyhedra showed similar trends as the pressure changed (Figure 7). The σ2 value of PO4 tetrahedra slowly reduced from 12.25 at 1.9 GPa to 11.25 at 28.3 GPa (for λ value, from 1.0032 to 1.0029), and then increased to 13.96 (1.0035 for the λ value) at the highest pressure. The resulting values of σ2 and λ for AlO4F2 octahedra were more responsive to pressure change than the PO4 tetrahedra. The λ value of Al2O4F2 octahedra rapidly increased from 1.001 to 1.0096 (for σ2, from 3.50 to 34.19) between 1.9 and 28.3 GPa, while the values of σ2 and λ for Al1O4F2 octahedra displayed a moderate trend as pressure elevated, which increased from 1.0022 to 1.0034 and from 6.57 to 9.09 for λ and σ2, respectively. (Figure 6). This difference is likely due to the different structural configurations in the two distinct Al sites.

3.4. Vibrational Properties

To date, there is no detailed high-pressure Raman spectroscopic study on amblygonite. Figure 8 shows in situ Raman spectra of LiAlPO4F recorded from ~100 to 1300 cm−1 at various pressures up to 28.6 GPa. All observed Raman peaks shifted to a higher frequency with increasing pressure. In the 1000–1150 cm−1 region, there were prominent peaks located at 1019, 1053, 1066, and 1116 cm−1 that can be assigned to various P–O stretching modes [36]. The spectra were more complex below 650 cm−1, and the mixed region composed of P–O bending and AlO4F2 stretching vibrations mainly contributed to the absorption in this domain [37]; therefore, some vibration modes merged together with increasing pressure. The intense band at 486 cm−1 is attributed to the symmetric Al–O–Al stretching mode in the network. Some Raman modes located between 400–650 cm−1 may be assigned to the O–P–O deformation modes, which are in accordance with the results from Cooper et al. [38]. Lower frequencies from 140 to 330 cm−1 can be attributed to the O–Li–O (or F) bending and Li–O bond vibrations. which are in agreement with the spectroscopic study of lithium pyroxenes [39,40]. This shows that modes v1, v2, and v3 spread out non-monotonically with increasing pressure and it might be caused by the asymmetric stretching and bending of O–Li–O and O–Li–F bonds (Figure 8). It should be noted that there were no obvious peaks broadening observed for all spectra, indicating that the structural disorder over the lattice sites was insignificant up to the highest pressure.
Grüneisen parameters (γi) describe the effect of changing volume of solid matter on vibrational motions of atoms; thus, the γi, particularly its volume dependence, is profound in the field of thermoelastic properties of solids. Mode Grüneisen parameters (γi) were calculated using γi = (K0/νi) (dνi/dP)T, where νi is the wavenumber of the ith mode and K0 is the bulk modulus at room temperature. Here, we used the isothermal bulk modulus K0 of 128(4) GPa for amblygonite to calculate the mode Grüneisen parameters. The resulting mean pressure coefficient of the whole structure for LiAlPO4F was 2.22(3) cm−1/GPa, and correspondingly, the calculated mode Grüneisen parameters determined in this study ranged from 0.22(1) to 1.44(2), with average value from all observed bands of 0.62(2). As for the PO4 tetrahedral site vibrations, the calculated γ values generally fell in the range of 0.43(2)–0.44(2), and were smaller than the 0.97(3) found in LiO4F polyhedral sites.
The amblygonite–montebrasite series from petalite-bearing localities can include various contents of lacroixite, while the lower-temperature pegmatite with spodumene LiAlSi2O6 either did not possess or involved very low lacroixite contents [3]. Some researchers also indicated that the fluorine contents had a positive correlation with the sodium contents in the amblygonite–montebrasite series [11]. Moreover, the enriched fluxing components such as Li, F, and P in the amblygonite–montebrasite series can provide relevant information on the crystallization of the fluxing component during pegmatite formation. Although alkalis, such as lithium and sodium, are significantly enriched in continental crust compared with oceanic crust, Li and Na are important incompatible elements in the upper mantle [41,42]. Silicates are almost the exclusive hosts for Li, and Li+ and Na+ are expected to replace each other in the structure [43]. The detailed investigation of the structural evolution of such lithium-fluorite minerals under compression will give some insight into possible systematic trends in the amblygonite–montebrasite series and provide direct evidence on the alkali-rich minerals at extreme conditions in the pegmatite-forming process.

4. Conclusions

The high-pressure behaviors of amblygonite were investigated by synchrotron-based single-crystal XRD, Raman spectroscopy, and DFT calculations at pressures up to ~34 GPa. The isothermal pressure–volume relationship of LiAlPO4F is described by the BM3-EoS, yielding KT0 = 128(4) GPa, and KT0′ = 3.4(4). In combination with Raman measurements performed to 28.6 GPa, we found no evidence for phase transformation over this pressure range. The OH-F substitution gave rise to the less rigid of both LiO4F and AlO4F2 polyhedra and the distorted LiO4F geometry was more compressible than the PO4 tetrahedral unit. The average γ value of PO4 vibration modes was 0.44(3), which is smaller than the γ value for the LiO4F polyhedra. The findings contribute to broadening our knowledge of the crystal chemistry of amblygonite at high-pressure conditions, thus giving a better understanding of lithium-fluorite minerals and some related granites [44].

Supplementary Materials

The following supporting information can be downloaded at: https://www.mdpi.com/article/10.3390/cryst13081269/s1, Table S1: Lattice parameters of amblygonite at various pressures; Table S2: Bond length (Å), Polyhedral Volume (Å3), Distortion index (D), Quadratic (λ) and Bond angle variance (σ2) for various polyhedra in Amblygonite at pressures up to 28.4 GPa.

Author Contributions

All authors contributed to the study conception and design. The organization of the final data and the first draft of the manuscript was written by F.Q., F.Q. and D.Z. carried out the experiments, and K.H. and F.Q. performed the data analysis and interpretation. B.H. and J.N. conducted the DFT calculations. All authors commented on previous versions of the manuscript. All authors have read and agreed to the published version of the manuscript.

Funding

This research was supported by National Natural Science Foundation of China (grant 42202040) and the SinoProbe laboratory of Chinese Academy of Geological Sciences (grant 202208). JJN acknowledges support from the National Natural Science Foundation of China (grant 42102034). Work performed at GSECARS (Sector 13) of the Advanced photon Source (APS) is supported by the NSF EAR-1634415 and the Department of Energy (DOE) DE-FG02-94ER1446. The APS at Argonne National Laboratory is supported by the DOE, Office of Science, under Contract No. DE-AC02-06CH11357. Experiments at Sector 13-BM-C of the APS used the PX^2 facility, supported by GSECARS and COMPRES under NSF Cooperative Agreement EAR-1661511. Use of the COMPRES-GSECARS gas loading system was supported by COMPRES under NSF Cooperative Agreement EAR-1606856.

Data Availability Statement

The data used for research described in this manuscript are available upon request from corresponding author: Fei Qin ([email protected]).

Conflicts of Interest

The authors declare no conflict of interest.

References

  1. Dias, L.N.; Pinheiro, M.V.B.; Moreira, R.L.; Krambrock, K.; Guedes, K.J.; Filho, L.M.; Karfunkel, J.; Scholz, R. Spectroscopic characterization of transition metal impurities in natural montebrasite/amblygonite. Am. Mineral. 2011, 96, 42–52. [Google Scholar] [CrossRef]
  2. London, D.; Morgan Vi, G.B.; Wolf, M.B. Amblygonite-montebrasite solid solutions as monitors of fluorine in evolved granitic and pegmatitic melts. Am. Mineral. 2001, 86, 225–233. [Google Scholar] [CrossRef]
  3. Shirose, Y.; Uehara, S. Microtexture investigation of amblygonite–montebrasite series with lacroixite: Characteristics and formation process in pegmatites. Am. Mineral. J. Earth Planet. Mater. 2018, 103, 75–84. [Google Scholar] [CrossRef]
  4. Trunilina, V.A.; Orlov, Y.S.; Zaitsev, A.I.; Roev, S.P. High-phosphorous lithium–fluorine granites of Eastern Yakutia (Verkhoyansk–Kolyma orogenic region). Russ. J. Pac. Geol. 2019, 13, 82–98. [Google Scholar] [CrossRef]
  5. Garate-Olave, I.; Roda-Robles, E.; Gil-Crespo, P.P.; Pesquera, A. Phosphate mineral associations from the Tres Arroyos aplite-pegmatites (Badajoz, Spain): Petrography, mineral chemistry, and petrogenetic implications. Can. Mineral. 2020, 58, 747–765. [Google Scholar] [CrossRef]
  6. Roda-Robles, E.; Pesquera, A.; Gil-Crespo, P.P.; Vieira, R.; Lima, A.; Garate-Olave, I.; Martins, T.; Torres-Ruiz, J. Geology and mineralogy of Li mineralization in the Central Iberian Zone (Spain and Portugal). Mineral. Mag. 2016, 80, 103–126. [Google Scholar] [CrossRef]
  7. Roda-Robles, E.; Villaseca, C.; Pesquera, A.; Gil-Crespo, P.P.; Vieira, R.; Lima, A.; Garate-Olave, I. Petrogenetic relationships between Variscan granitoids and Li-(FP)-rich aplite-pegmatites in the Central Iberian Zone: Geological and geochemical constraints and implications for other regions from the European Variscides. Ore Geol. Rev. 2018, 95, 408–430. [Google Scholar] [CrossRef]
  8. Veksler, I.V.; Thomas, R. An experimental study of B-, P-and F-rich synthetic granite pegmatite at 0.1 and 0.2 GPa. Contrib. Mineral. Petrol. 2002, 143, 673–683. [Google Scholar] [CrossRef]
  9. Greiner, D.J.; Bloss, F.D. Amblygonite-montebrasite optics; response to (OH (super-)) orientation and rapid estimations of F from 2V. Am. Mineral. 1987, 72, 617–624. [Google Scholar]
  10. Groat, L.A.; Chakoumakos, B.C.; Brouwer, D.H.; Hoffman, C.M.; Fyfe, C.A.; Morell, H.; Schultz, A.J. The amblygonite (LiAlPO4F)-montebrasite (LiAlPO4OH) solid solution: A combined powder and single-crystal neutron diffraction and solid-state 6Li MAS, CP MAS, and REDOR NMR study. Am. Mineral. 2003, 88, 195–210. [Google Scholar] [CrossRef]
  11. Groat, L.A.; Raudsepp, M.; Hawthorne, F.C.; Ercit, T.S.; Sherriff, B.L.; Hartman, J.S. The amblygonite-montebrasite series; characterization by single-crystal structure refinement, infared spectroscopy, and multinuclear MAS-NMR spectroscopy. Am. Mineral. 1990, 75, 992–1008. [Google Scholar]
  12. Williams, Q. A vibrational spectroscopic study of hydrogen in high pressure mineral assemblages. High-Press. Res. Appl. Earth Planet. Sci. 1992, 67, 289–296. [Google Scholar]
  13. Rivers, M.; Prakapenka, V.B.; Kubo, A.; Pullins, C.; Holl, C.M.; Jacobsen, S.D. The COMPRES/GSECARS gas-loading system for diamond anvil cells at the Advanced Photon Source. High Press. Res. 2008, 28, 273–292. [Google Scholar] [CrossRef]
  14. Dewaele, A.; Torrent, M.; Loubeyre, P.; Mezouar, M. Compression curves of transition metals in the Mbar range: Experiments and projector augmented-wave calculations. Phys. Rev. B 2008, 78, 104102. [Google Scholar] [CrossRef]
  15. Qin, F.; Wu, X.; Zhang, D.; Qin, S.; Jacobsen, S.D. Thermal Equation of State of Natural Ti-Bearing Clinohumite. J. Geophys. Res. Solid Earth 2017, 122, 8943–8951. [Google Scholar] [CrossRef]
  16. Zhang, D.; Dera, P.K.; Eng, P.J.; Stubbs, J.E.; Zhang, J.S.; Prakapenka, V.B.; Rivers, M.L. High pressure single crystal diffraction at PX^ 2 JoVE. J. Vis. Exp. 2017, 119, e54660. [Google Scholar]
  17. Bruker. APEX3 Crystallography Software Suite, v2018.7-2; Bruker AXS Inc.: Madison, WI, USA, 2016. [Google Scholar]
  18. Momma, K.; Izumi, F. VESTA 3 for three-dimensional visualization of crystal, volumetric and morphology data. J. Appl. Crystallogr. 2011, 44, 1272–1276. [Google Scholar] [CrossRef]
  19. Sheldrick, G.M. A short history of SHELX. Acta Crystallogr. Sect. A 2008, 64, 112–122. [Google Scholar] [CrossRef]
  20. Gonzalez-Platas, J.; Alvaro, M.; Nestola, F.; Angel, R.J. EosFit7-GUI: A new GUI tool for equation of state calculations, analyses, and teaching. J. Appl. Crystallogr. 2016, 49, 1377–1382. [Google Scholar] [CrossRef]
  21. Mao, H.K.; Xu, J.; Bell, P.M. Calibration of the ruby pressure gauge to 800 kbar under quasi-hydrostatic conditions. J. Geophys. Res. 1986, 91, 4673–4676. [Google Scholar] [CrossRef]
  22. Hohenberg, P.; Kohn, W. Inhomogeneous electron gas. Phys. Rev. 1964, 136, B864. [Google Scholar] [CrossRef]
  23. Kohn, W.; Sham, L.J. Self-consistent equations including exchange and correlation effects. Phys. Rev. 1965, 140, A1133. [Google Scholar] [CrossRef]
  24. Kresse, G.; Furthmüller, J. Efficiency of ab-initio total energy calculations for metals and semiconductors using a plane-wave basis set. Comput. Mater. Sci. 1996, 6, 15–50. [Google Scholar] [CrossRef]
  25. Kresse, G.; Furthmüller, J. Efficient iterative schemes for ab initio total-energy calculations using a plane-wave basis set. Phys. Rev. B 1996, 54, 11169. [Google Scholar] [CrossRef] [PubMed]
  26. Kresse, G.; Hafner, J. Ab initio molecular dynamics for liquid metals. Phys. Rev. B 1993, 47, 558. [Google Scholar] [CrossRef]
  27. Perdew, J.P.; Burke, K.; Ernzerhof, M. Generalized gradient approximation made simple. Phys. Rev. Lett. 1996, 77, 3865. [Google Scholar] [CrossRef]
  28. Monkhorst, H.J.; Pack, J.D. Special points for Brillouin-zone integrations. Phys. Rev. B 1976, 13, 5188. [Google Scholar] [CrossRef]
  29. Baur, W.H. Die Kristallstruktur des Edelamblygonits LiAlPO4(OH, F). Acta Crystallogr. 1959, 12, 988–994. [Google Scholar] [CrossRef]
  30. Angel, R.J.; Gonzalez-Platas, J.; Alvaro, M. EosFit7c and a Fortran module (library) for equation of state calculations. Z. Kryst. 2014, 229, 405–419. [Google Scholar] [CrossRef]
  31. Birch, F. Finite elastic strain of cubic crystals. Phys. Rev. 1947, 71, 809. [Google Scholar] [CrossRef]
  32. Murnaghan, F.D. The compressibility of media under extreme pressures. Proc. Natl. Acad. Sci. USA 1944, 30, 244–247. [Google Scholar] [CrossRef]
  33. Errandonea, D.; Achary, S.N.; Diaz-Anichtchenko, D.; Bandiello, E.; Marqueño, T.; Shukla, R.; Tyagi, A.K.; Popescu, C.; Alabarse, F.G. Equations of State and Crystal Structures of KCaPO4, KSrPO4, and K2Ce(PO4)2 under High Pressure: Discovery of a New Polymorph of KCaPO4. Cryst. Growth. Des. 2023, 23, 2782–2794. [Google Scholar] [CrossRef]
  34. Baur, W.H. The geometry of polyhedral distortions. Predictive relationships for the phosphate group. Acta Crystallogr. Sect. B Struct. Crystallogr. Cryst. Chem. 1974, 30, 1195–1215. [Google Scholar] [CrossRef]
  35. Robinson, K.; Gibbs, G.V.; Ribbe, P.H. Quadratic elongation: A quantitative measure of distortion in coordination polyhedra. Science 1971, 172, 567–570. [Google Scholar] [CrossRef]
  36. Errandonea, D.; Gomis, O.; Rodríguez-Hernández, P.; Muñoz, A.; Ruiz-Fuertes, J.; Gupta, M.; Achary, S.N.; Hirsch, A.; Manjon, F.J.; Peters, L.; et al. High-pressure structural and vibrational properties of monazite-type BiPO4, LaPO4, CePO4, and PrPO4. J. Phys-Condens. Mat. 2018, 30, 065401. [Google Scholar] [CrossRef] [PubMed]
  37. Rondeau, B.; Fritsch, E.; Lefevre, P.; Guiraud, M.; Fransolet, A.M.; Lulzac, Y. A Raman investigation of the amblygonite–montebrasite series. Can. Mineral. 2006, 44, 1109–1117. [Google Scholar] [CrossRef]
  38. Cooper, M.A.; Hawthorne, F.C.; Abdu, Y.A.; Ball, N.A.; Ramik, R.A.; Tait, K.T. Wopmayite, ideally Ca6Na3Mn(PO4)3(PO3OH)4, a new phosphate mineral from the Tanco Mine, Bernic Lake, Manitoba: Description and crystal structure. Can. Mineral. 2013, 51, 93–106. [Google Scholar] [CrossRef]
  39. Ding, X.; Li, J.; Chou, I.M.; Chen, Z.; Li, S. Raman spectroscopic identification of cookeite in the crystal-rich inclusions in spodumene from the Jiajika lithium pegmatite deposit, China, and its geological implications. Eur. J. Mineral. 2020, 32, 67–75. [Google Scholar] [CrossRef]
  40. Pommier, C.J.S.; Denton, M.B.; Downs, R.T. Raman spectroscopic study of spodumene (LiAlSi2O6) through the pressure-induced phase change from C2/c to P21/c. J. Raman Spectrosc. 2003, 34, 769–775. [Google Scholar] [CrossRef]
  41. Hofmann, A.W. Chemical differentiation of the Earth: The relationship between mantle, continental crust, and oceanic crust. Earth Planet. Sci. Lett. 1988, 90, 297–314. [Google Scholar] [CrossRef]
  42. Tang, Y.J.; Zhang, H.F.; Deloule, E.; Su, B.X.; Ying, J.F.; Santosh, M.; Xiao, Y. Abnormal lithium isotope composition from the ancient lithospheric mantle beneath the North China Craton. Sci. Rep. 2014, 4, 4274. [Google Scholar] [CrossRef] [PubMed]
  43. Ottolini, L.; Le Fèvre, B.; Vannucci, R. Direct assessment of mantle boron and lithium contents and distribution by SIMS analyses of peridotite minerals. Earth Planet. Sci. Lett. 2004, 228, 19–36. [Google Scholar] [CrossRef]
  44. Gonzalez-Platas, J.; Rodriguez-Hernandez, P.; Muñoz, A.; Rodríguez-Mendoza, U.R.; Nénert, G.; Errandonea, D. A high-pressure investigation of the synthetic analogue of chalcomenite, CuSeO3∙2H2O. Crystals 2019, 9, 643. [Google Scholar] [CrossRef]
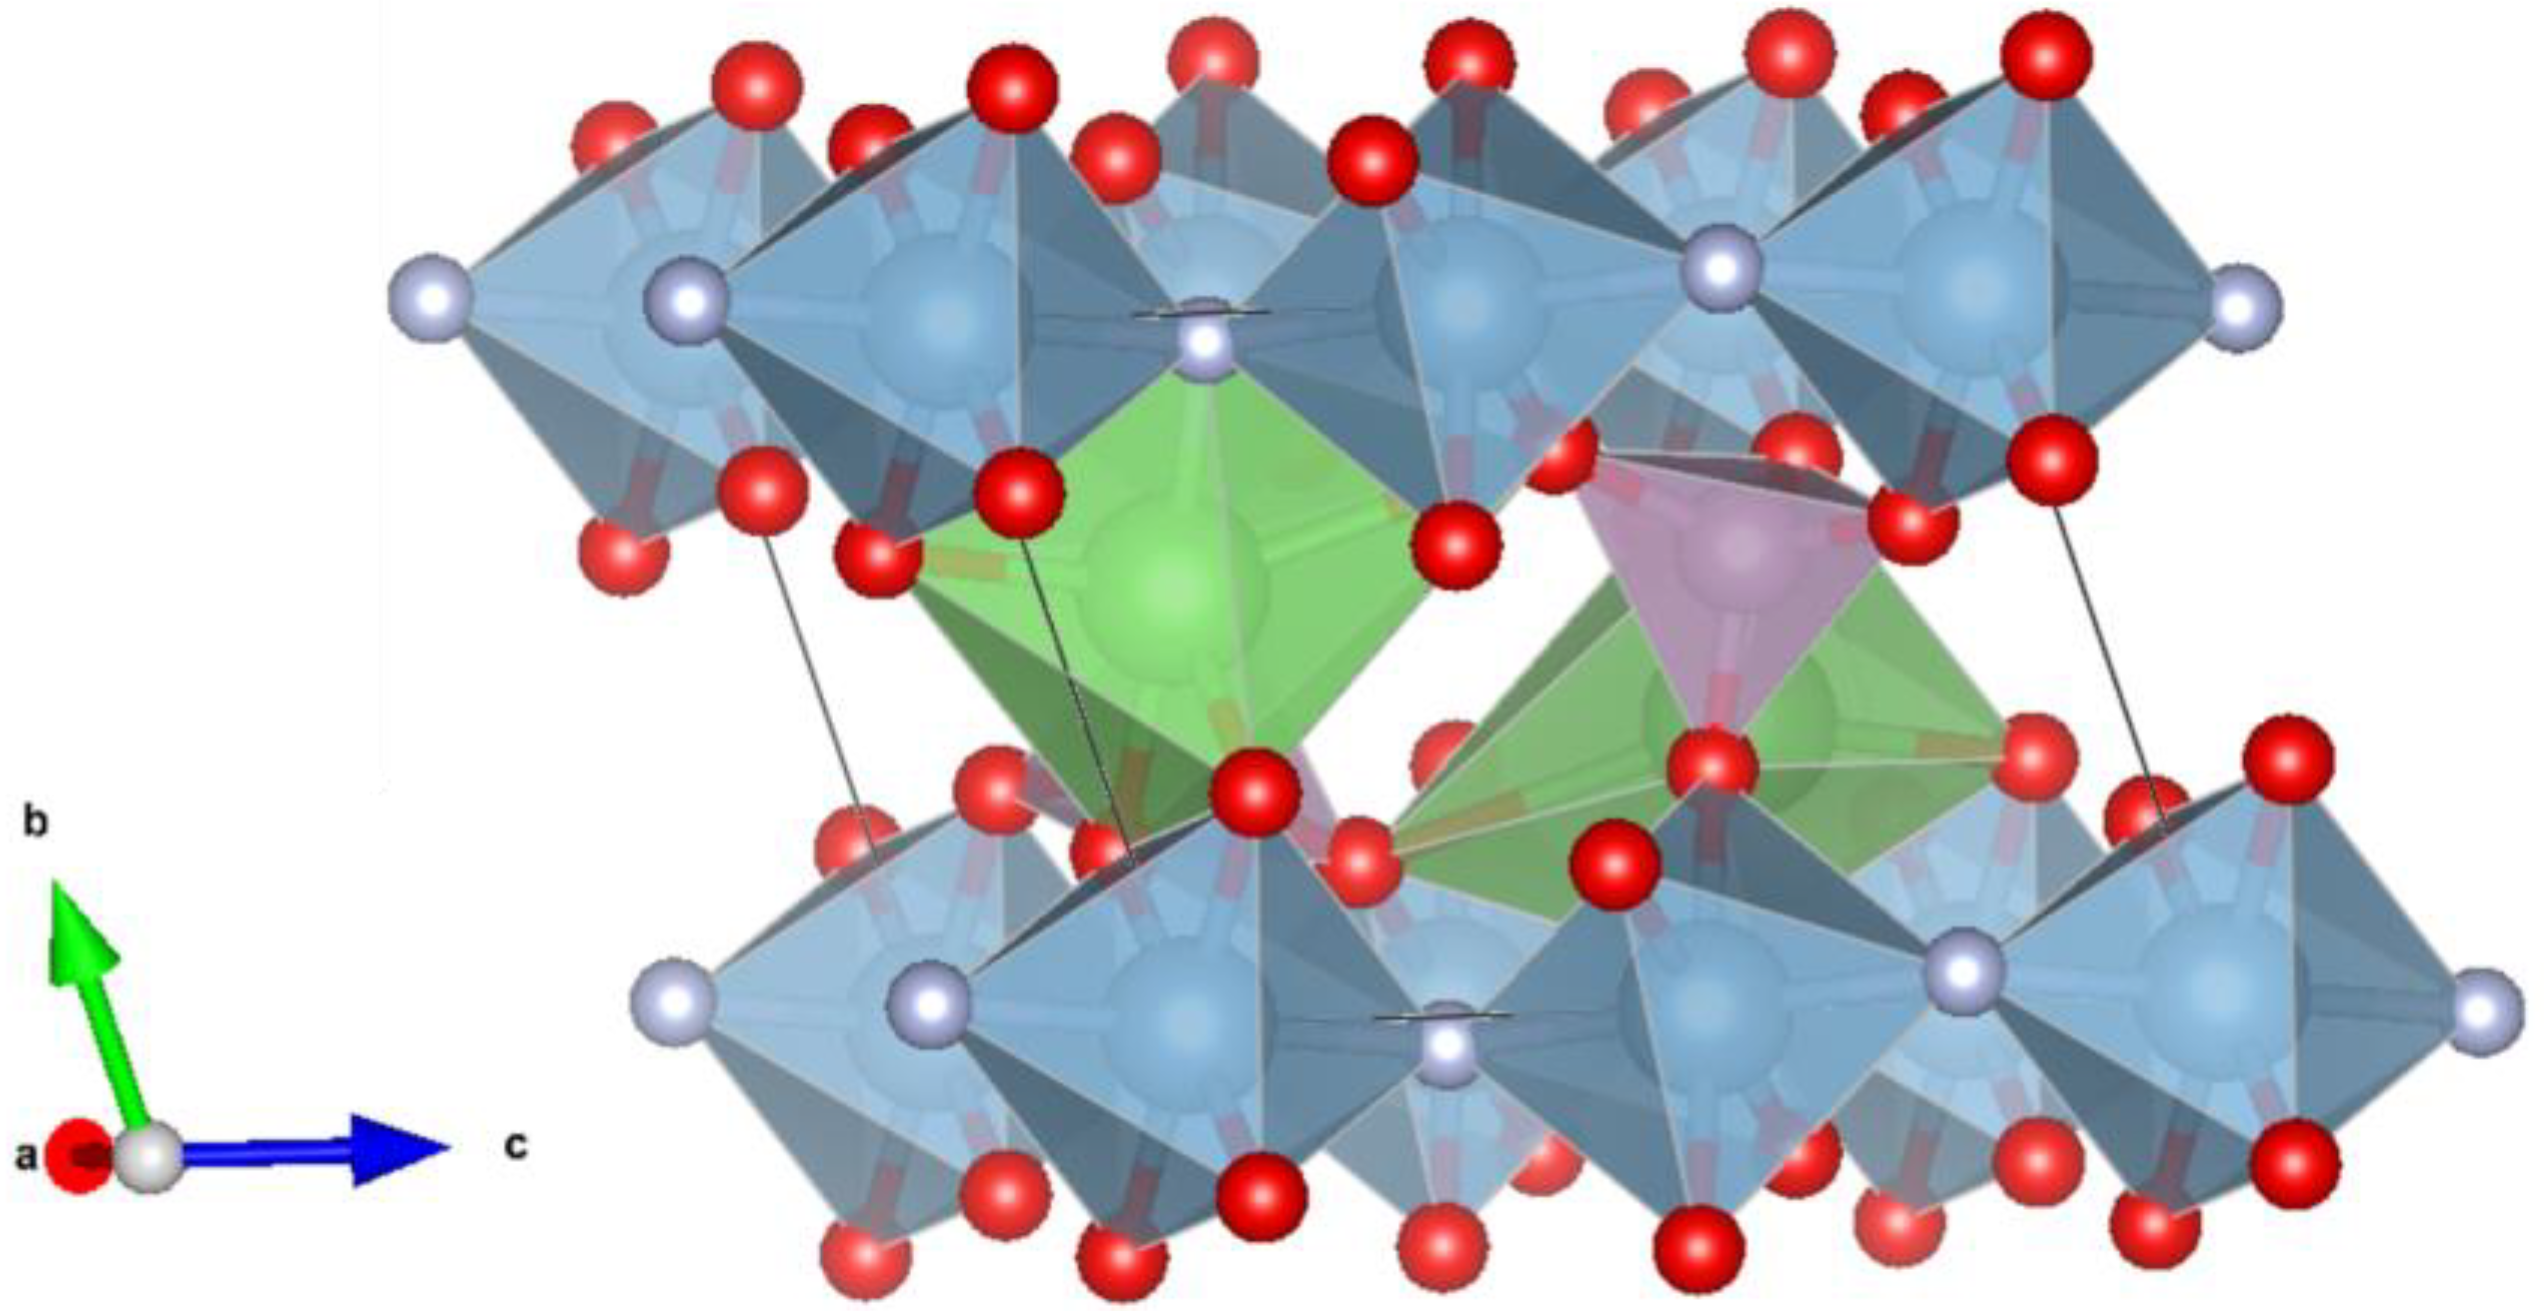
Figure 1. The crystal structure of amblygonite. Blue-colored polyhedra represent AlO4F2 octahedra, green-colored represent LiO4F polyhedra, and purple-colored shapes are PO4 tetrahedra.
Crystals 13 01269 g001
Figure 2. X-ray diffraction pattern showing the diffraction spots of single-crystal amblygonite at 1 GPa.
Crystals 13 01269 g002
Figure 3. The volume of amblygonite as a function of pressure. Isothermal compression curves are represented by the solid lines from the BM3-EoS.
Crystals 13 01269 g003
Figure 4. Pressure dependence of normalized cell lengths (a, b, and c) of triclinic LiAlPO4F (a). Pressure dependence of internal angles (α, β, and λ) (b). The solid and open symbols represented the results from single-crystal X-ray measurements and DFT calculations, respectively.
Crystals 13 01269 g004
Figure 5. Pressure dependence of the average octahedral and tetrahedral volumes in amblygonite.
Crystals 13 01269 g005
Figure 6. The pressure dependence of the distortion index (D) in amblygonite.
Crystals 13 01269 g006
Figure 7. The pressure dependence of the quadratic elongation (λ) (a) and bond angle variance (σ2) (b) in amblygonite, respectively.
Crystals 13 01269 g007
Figure 8. The Raman spectra of amblygonite at various pressures. Raman pattern from the RRUFF database (#R040006) for amblygonite is also shown for comparison.
Crystals 13 01269 g008
Disclaimer/Publisher’s Note: The statements, opinions and data contained in all publications are solely those of the individual author(s) and contributor(s) and not of MDPI and/or the editor(s). MDPI and/or the editor(s) disclaim responsibility for any injury to people or property resulting from any ideas, methods, instructions or products referred to in the content.