Abstract
In this work, the synthesis and structure of an antimony complex with an aromatic, asymmetric tridentate ligand without an Sb-C bond were studied. Ethoxy(2-salicylidenaminophenolato)antimony(III) was studied with NMR, UV-Vis, and IR spectroscopy and the molecular structure was determined by single crystal X-ray diffraction. The antimony atom is formally tetracoordinate in this molecule. Coordinative unsaturation becomes visible in the solid-state structure where intermolecular Sb…O interactions supplement the coordination sphere of the antimony atom to be hexacoordinated. Quantum chemical calculations were performed in order to obtain a better understanding of the bond properties in the antimony complex. These show a spherical distribution of the lone pair at antimony and polar shared bonds from antimony to the heteroatoms of the tridentate ligand.
1. Introduction
The chemistry and usages of antimony compounds are versatile, especially because of the three stable oxidation states +1, +3 and, +5. Additionally, the many different structures of the compounds and bond types between the antimony and the bonding partners are important, whereby the properties of the antimony compounds, for example, the stability of low valent oxidation states, can be adjusted [1].
Because of the different oxidation states of antimony and the possibility to easily transform them into each other, the complexes are interesting for sensors, like fluorine sensors [2,3,4,5]. Antimony compounds can be used as ligands in transition metal complexes because of their good σ-donor and π-acceptor properties, analogous to phosphorous compounds. Through oxidation or reduction of the antimony or the attachment of the analyte to the antimony, the geometry of the transition metal center changes, which has an influence on its color. For example, Jones et al. [5]. investigated the detection of fluoride ions in aqueous solutions with palladium complexes.
There are many other successfully investigated ways to possibly apply these complexes is catalysis [5,6,7,8,9,10]. The activation of small molecules with transition metal complexes was investigated by Gericke [11]. He found that the complexation and activation of nitrogen at antimony ruthenium complexes is possible. Antimony compounds without transition metals are also catalytically active. The most common usage is the synthesis of polyethyleneterephthalate with Sb2O3 as the catalyst [12]. Furthermore, the formation of amides during the reaction of carbonic acids and amines with a Ph3SbO/P4S10 catalyst is positively influenced [13].
Antimony as the central atom in complexes is also versatile, because it can act as both a Lewis base and Lewis acid [14,15]. This property is more pronounced compared to the lighter pnictogens because of the higher planarity compared to arsenic and phosphorus [16]. The coordination environment around the antimony center of compounds with tridentate chelate ligands tends to be planar because of the higher differences in electronegativity between the central atoms and the atoms of the ligands, as well as the higher count of electrons. The difference in electronegativity affects the influence of the orbitals and electrostatic interactions. The count of electrons affects the Pauli repulsion. Another, although smaller, influence is the tension of the ligands due to their deformation. High tension forces the central atom out of the plane of the ligand system [14]. Through the higher planarity, the LUMO has a lower energy and therefore both the Lewis acidity and the trend for the formation of the oxidation state +1 increase [17]. Despite the versatility of antimony complexes, the usage is low because of their toxicity [1].
To pronounce Lewis acid and Lewis base properties, the ligand system has a significant influence. Hence, electron-withdrawing ligands increase the Lewis acidity of the antimony center [15]. As a flexible ligand system, Schiff bases can be used. Metal–Schiff-base complexes are quite common, e.g., [18,19,20,21,22,23,24]. These complexes have many different biomedical applications [25,26], as well as the use as catalysts (e.g., [10]), as sensors for copper [27], for use in non-linear optics [28], and for the generation of polynuclear magnetic complexes [29,30,31]. Despite these numerous examples of Schiff-base complexes, Schiff-base complexes of antimony without halide or carbon ligands have rarely been investigated [32].
High Lewis acidity in combination with sterical demanding ligands can lead to coordinatively unsaturated compounds, e.g., [33,34]. This unsaturation results in the possibility of an addition of molecules to saturate these compounds. This property is interesting for the previously shown applications. The addition of a specific molecule can, for example, lead to a sensor [2,3,4,5]. Since antimony has multiple stable oxidation states and can act as both a Lewis base and Lewis acid, antimony complexes are also very interesting for investigations in catalysis [16]. Additionally, coordinative undersaturation can facilitate the addition of a substrate in the catalytic cycle [35].
Previous investigations mostly dealt with symmetric complexes with Sb-C bonds. Complexes with asymmetric ligands or without an Sb-C bond are investigated rarely, despite the results of Arduengo and Stewart of the tricoordinated hypervalent pnictogene complexes without Pn-C bonds [36,37]. The existing investigations indicate interesting properties and bond types; however, deep analyses have not yet taken place. To open new application areas, the goal of this work was the synthesis and characterization of a new antimony complex with an asymmetric tridentate Schiff-base ligand without an Sb-C bond. The bonding situation in the synthesized complex was investigated with quantum chemical calculations.
2. Materials and Methods
2.1. Calculations
For the quantum chemical optimization of the given structures and the calculation of IR, UV/Vis, and Raman spectra the program ORCA [38] was used. The optimization of the structures and the calculation of IR and Raman spectra were performed using the method B97-3c [39]. UV/Vis calculations were conducted using the CPCM model [40] for the solvent. IBO analysis was performed with the IBOview [41]. The calculation of the wave function for the AIM analysis was conducted using the hybrid functional PBE0 [42,43] with the basis set def2-TZVPP [44] first as geometry optimization and then with the NOECP option to exclude any pseudopotential from the AIM analysis. The calculation of the UV/Vis spectra was performed using the functional STEOM-DLPNO-CCSD [45] with the basis set def2-TZVP/C [44] for the free ligand H2L, and for the complex LSb the functional B3LYP [46,47,48] with the basis set DEF2-TZVP [44] was used.
2.2. Methods
The source and purification of the used chemicals can be found in the Supplementary Material.
NMR spectra were measured with a BRUKER AVANCE III 500 MHz (frequencies: 1H: 500.13 MHz; 13C: 125.76 MHz) spectrometer or BRUKER Nanobay 400 MHz (frequencies: 1H: 400.13 MHz; 13C: 100.61 MHz) spectrometer in DMSO-d6 or CDCl3 with TMS as the internal standard if not stated otherwise.
UV/Vis spectra were measured with a JASCO V-650 UV/Vis photometer in acetonitrile. For measurement, a quartz capillary with a diameter of 1 mm was used. As reference, another quartz capillary filled with acetonitrile from the same charge was used.
IR spectra were measured using a Nicolet 380 (Thermo Fisher, Waltham, MA, USA) at room temperature. Therefore, the solid material was mortared together with dry KBr to a tablet.
Raman spectra were measured using the FT-Raman spectrometer BRUKER RFS 100/S with a Nd-YAG laser with a wavelength of 1064 nm and a nitrogen-cooled Ge detector.
Mass spectra were recorded using an Advision expressionCMS1L using ACPI as the ionization method and a quadrupole as the detector.
Melting points were measured using variant B of the method described by M. Herbig [49].
Dryness of the used solvents (ethanol and cyclopentyl methyl ether) was determined using a Mettler Toledo C20 Coulometric KF Titrator.
Single crystal X-ray diffraction data of LSb were collected on a STOE IPDS-II image plate diffractometer equipped with a low-temperature device with Mo-Kα radiation (λ = 0.71073 Å) using ω and φ scans. Crystal data and details of structure refinement are summarized in Table 1. Software for data collection was X-AREA, for cell refinement X-AREA, and for data reduction X-RED [50]. Preliminary structure models were derived by direct methods [51] and the structures were refined by full-matrix least-squares calculations based on F2 for all reflections using SHELXL [52]. All hydrogen atoms were included in the models in calculated positions and were refined as constrained to the bonded atoms.

Table 1.
Crystal data and structure refinement parameters.
CCDC 2281213 contain the supplementary crystallographic data for this paper. These data can be obtained free of charge from The Cambridge Crystallographic Data Center via www.ccdc.cam.ac.uk/data_request/cif (accessed on 1 June 2023).
2.3. Materials
Ethoxy(2-salicylidenaminophenolato)antimony(III) (LSb)
In a 100 mL flask with a magnetic stirrer, 0.830 g (3.892 mmol) of H2L was solved in 20 mL ethanol at 30 °C. In a 20 mL syringe, 10 mL of dry ethanol and 1.022 g (3.978 mmol) of Sb(OEt)3 were mixed and added to the solution of H2L. Thereby, an orange solid precipitated. The suspension was stirred overnight and filtered, which gave an orange solid and an orange solution. The solid was washed three times with 5 mL ethanol each and dried in vacuum. The crude product was recrystallized from dry cyclopentylmethylether, which gave 0.889 g (2.352 mmol, 60.4%) of complex LSb. The obtained crystals were suitable for X-ray diffraction. The purity was checked with Thin Layer Chromatography (TLC) with a reversed stationary phase (C18) and acetonitrile as the eluent and with powder XRD. The results of TLC were compared with intentionally hydrolyzed material to show the absence of hydrolyzed compounds in our batch product (see Figure S7). All results are shown in the Supplementary Material. The IUPAC name of the compound LSb is 11-ethoxy-10,12-dioxa-2-aza-11-stibatricyclo[11.4.0.04,9]heptadeca-1(17),2,4,6,8,13,15-heptaene. We use throughout this publication the more descriptive name Ethoxy(2-salicylidenaminophenolato)antimony(III).
mp. = 180–190 °C (decomp., multiple crystals).
1H NMR (500 MHz, DMSO): δ (ppm) = 9.15 (s, 1 H, H-7), 7.72 (dd, 1 H, 3J(H) = 8.20 Hz, 4J(H) = 1.40 Hz, H-5), 7.66 (dd, 1 H, 3J(H) = 7.88 Hz, 4J(H) = 1.78 Hz, H-9), 7.49 (ddd, 1 H, 3J(H) = 8.45 Hz, 3 J(H) = 7.00 Hz, 4J(H) = 1.85 Hz, H-11), 7.17 (ddd, 1 H, 3J(H) = 8.06 Hz, 3J(H) = 7.29 Hz, 4J(H) = 1.46 Hz, H-3), 6.80 (ddd, 1 H, 3J(H) = 7.75 Hz, 3J(H) = 7.05 Hz, 4J(H) = 1.05 Hz, H-10), 6.79 (d, 1 H, 3J(H) = 8.45 Hz, H-12), 3.57 (q, 2 H, 3J(H) = 6.99 Hz, H-14), 0.81 (t, 3 H, 3J(H) = 6.93 Hz, H-15).
13C NMR (125 MHz, DMSO): δ (ppm) = 166.6 (C-7), 160.0 (C-13), 159.9 (C-1), 136.7 (C-11), 135.9 (C-9), 132.1 (C-8), 129.2 (C-3), 121.1 (C-12), 117.9 (C-6), 117.5 (C-2), 116.8 (C-5), 116.7 (C-10), 116.3 (C-4), 58.1 (C-14), 19.4 (C-15).
IR (KBr): ν (cm−1) = 511 (m), 590 (m), 608 (m), 740 (s), 762 (s), 836 (m), 1048 (m), 1125 (m), 1150 (m), 1263 (s), 1296 (s), 1382 (s), 1436 (s), 1468 (s), 1538 (s), 1584 (s), 1604 (s), 2972 (w).
UV/Vis: λ (nm) = 198 (ε = 42,030 cm2 mmol−1), 307 (ε = 7862 cm2 mmol−1), 441 (ε = 7916 cm2 mmol−1).
3. Results and Discussion
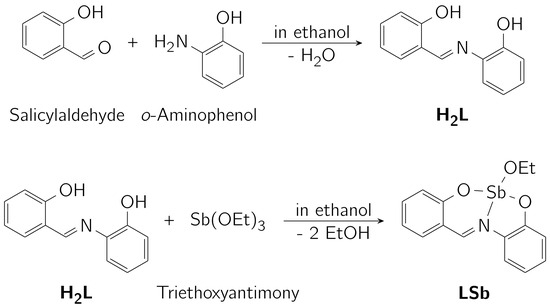
The investigated complex consists of a Schiff-base ligand derived from salicylaldehyde and o-aminophenol. This ligand (H2L) was reacted with triethoxyantimony (Sb(OEt)3) [53] to form the complex (LSb) under the release of two equivalents of ethanol (see Scheme 1).
Scheme 1.
Synthesis of the ligand H2L and the investigated complex LSb.
3.1. Analytical Methods
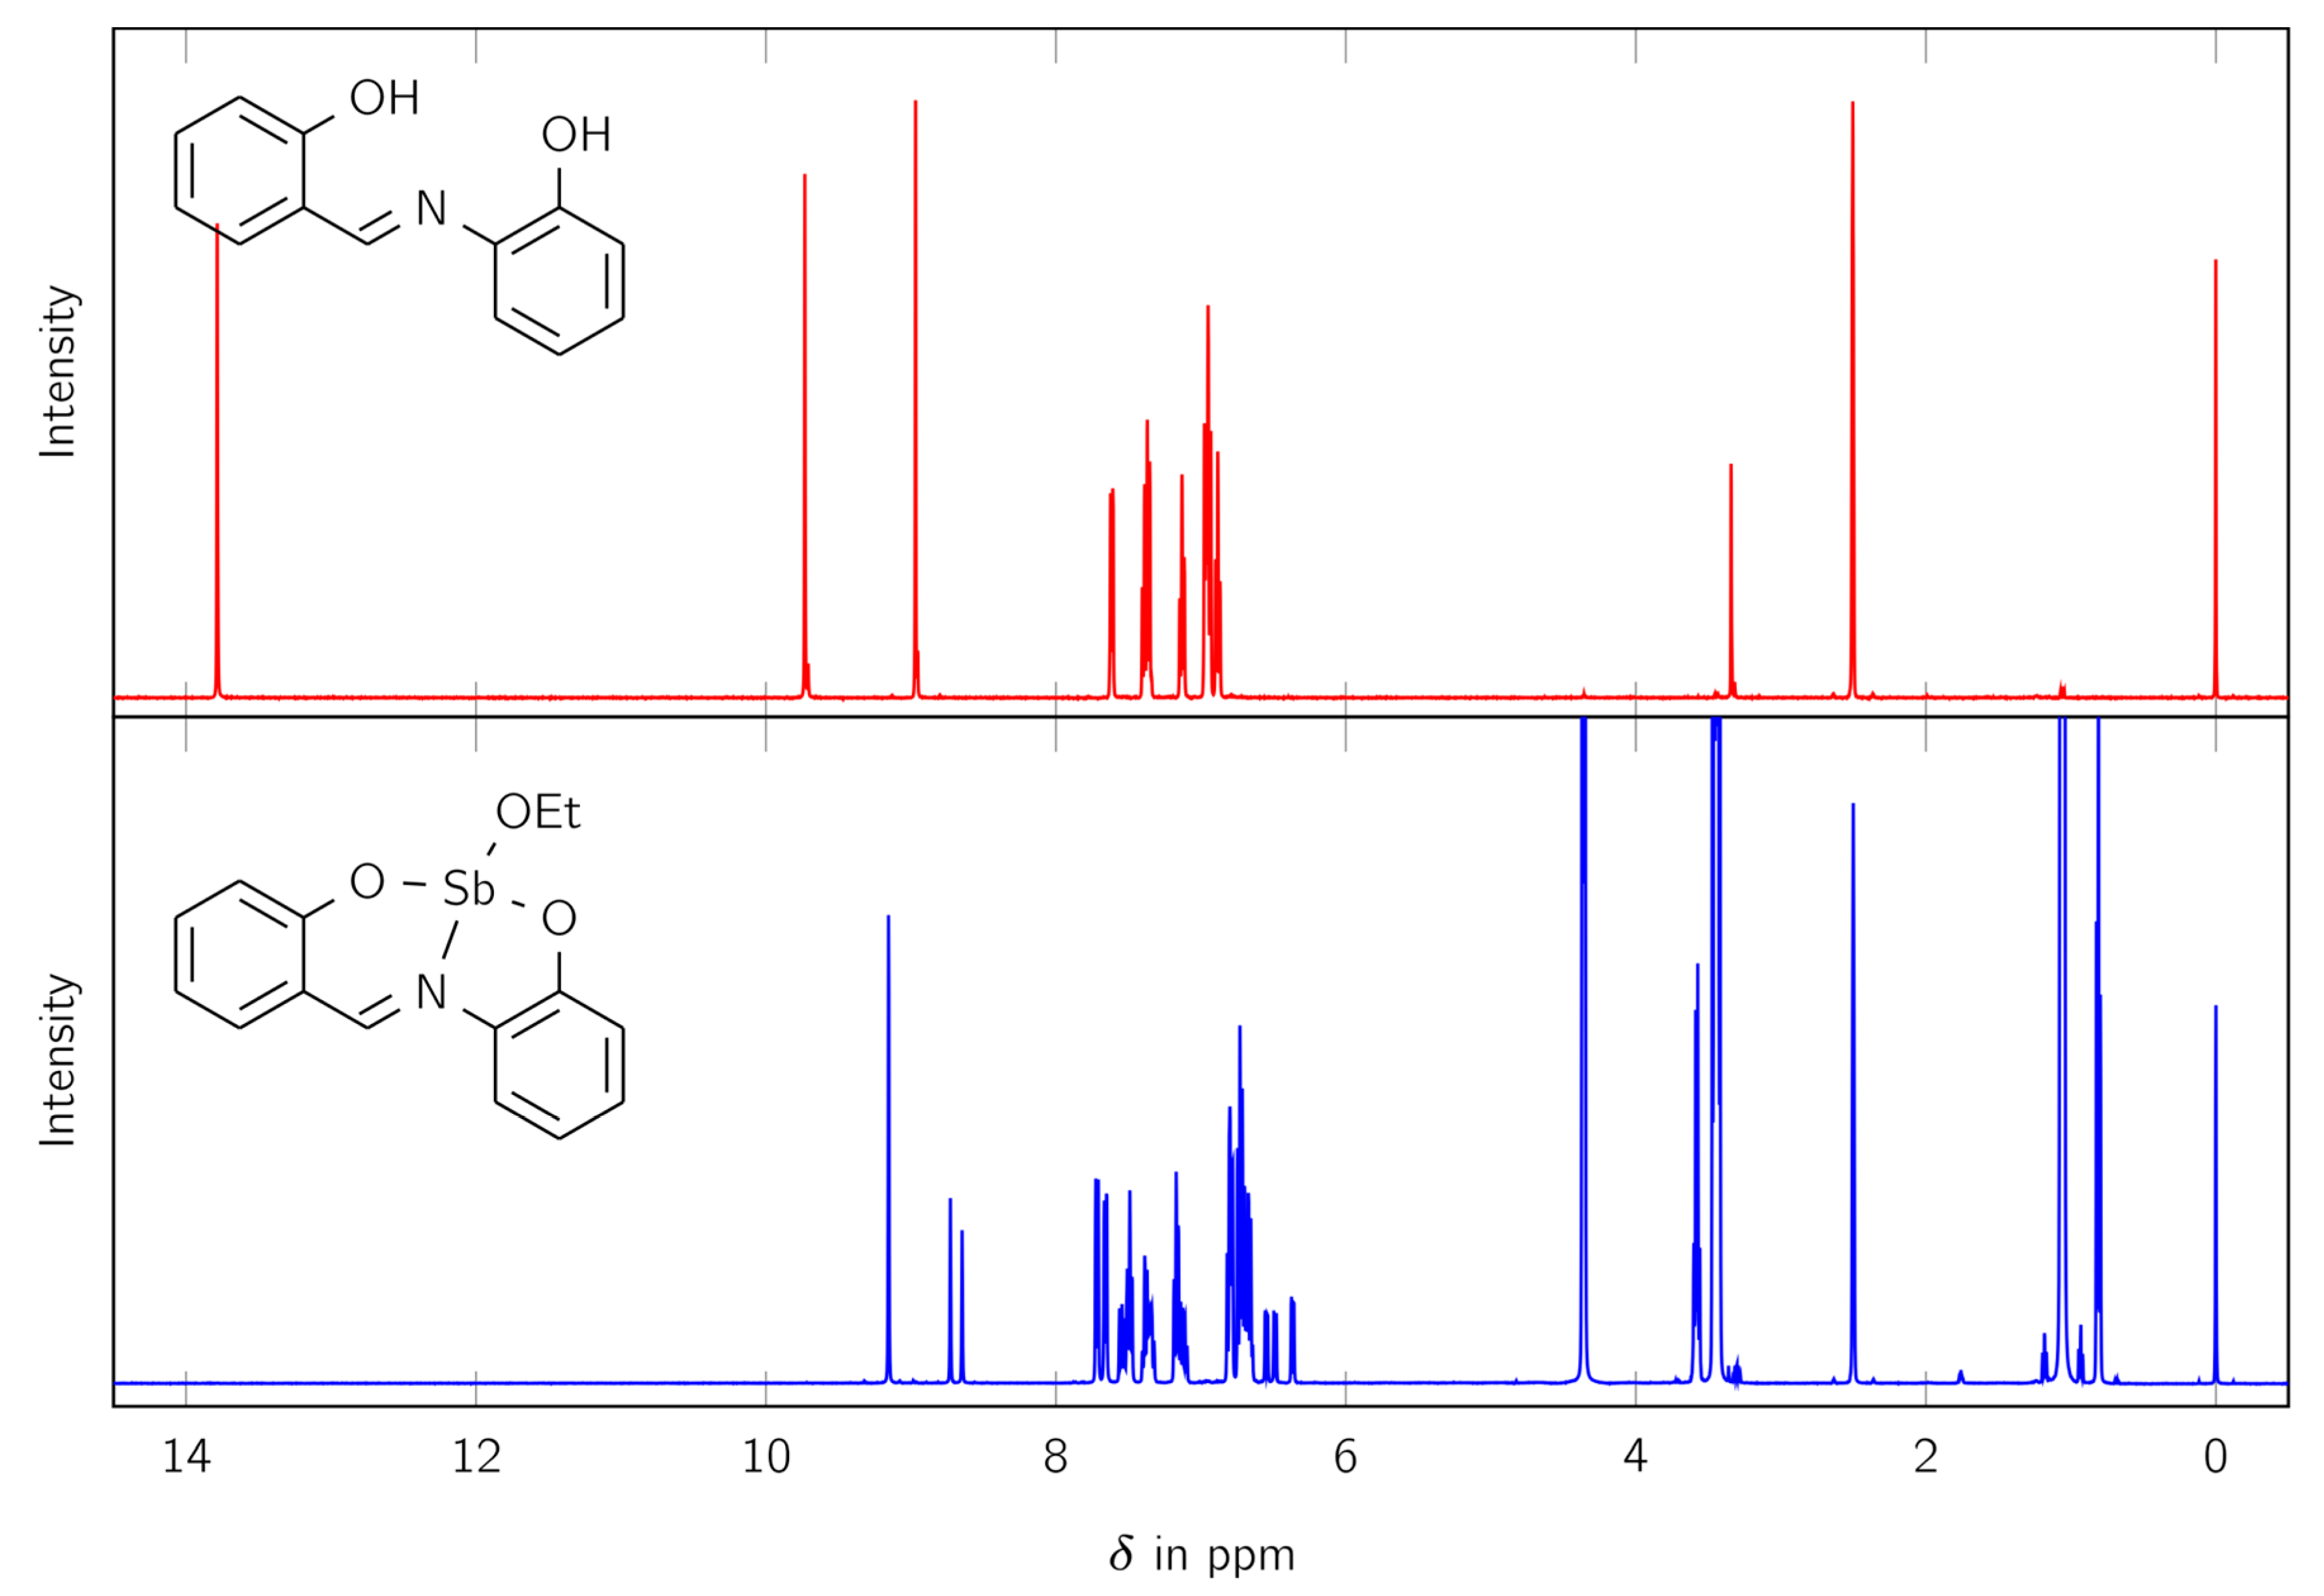
The synthesized complex LSb was studied with various analytical methods. Firstly, 1H and 13C NMR spectra were measured to identify the product and determine its purity. The 1H NMR spectra comparing the free ligand H2L and the complex LSb are shown in Figure 1.
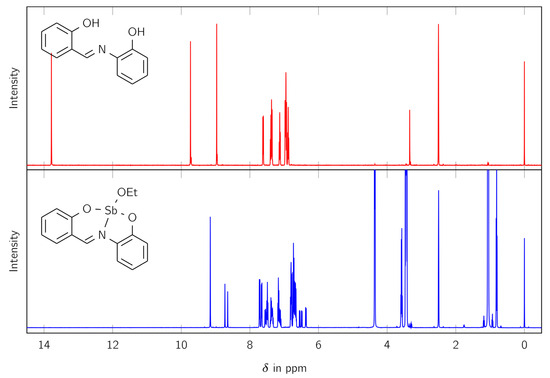
Figure 1.
The 1H NMR spectra of the free ligand H2L (red) and the complex LSb (blue).
The 1H NMR spectrum of LSb shows no signal for an OH moiety (at 9.73 and 13.79 ppm) and therefore suggests the formation of a complex. Furthermore, the signal for the CH moiety splits from one signal in the free ligand (at 8.97 ppm) to three signals in the synthesized complex (at 9.15, 8.73, and 8.66 ppm). The signals at 0.81 and 3.57 ppm indicate the presence of an ethoxy group. Integration of the 1H NMR spectra shows that the ethoxy moiety fits to the larger signal for the CH group at 9.15 ppm. Therefore, more than one species is present in solution.
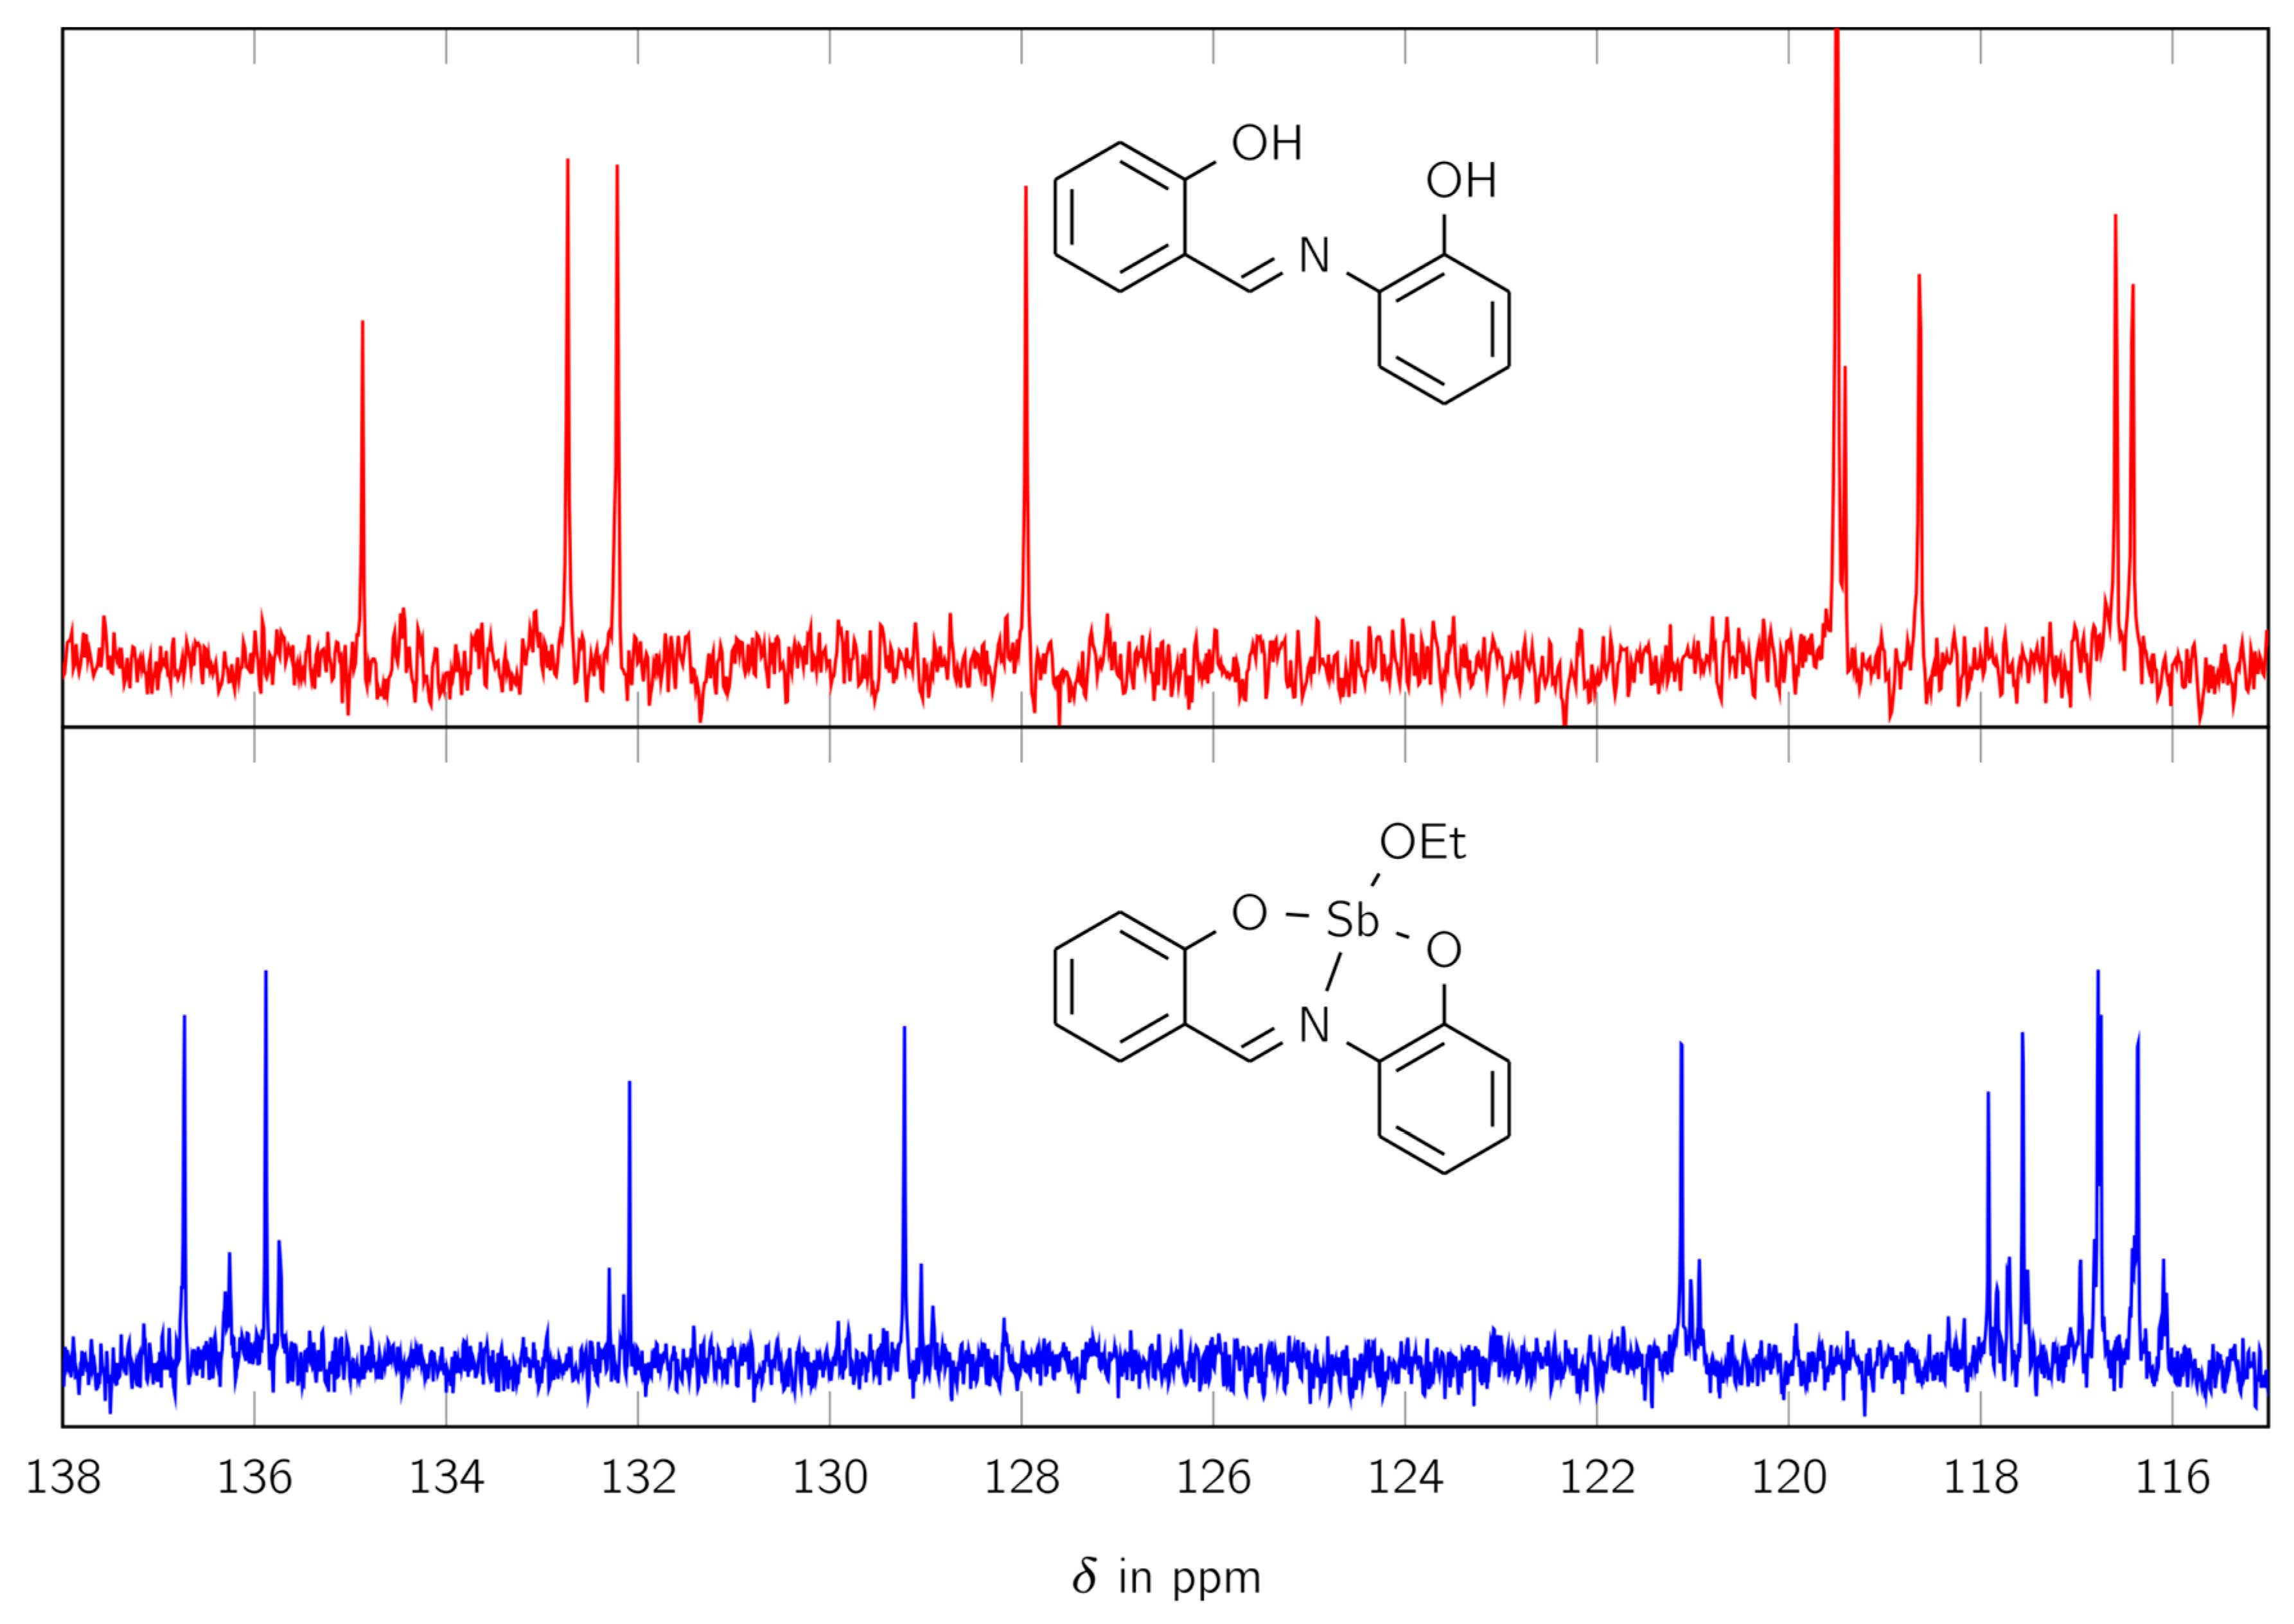
The 13C NMR spectrum, shown in Figure 2, exhibits similar behavior. It shows 13 large signals and 26 smaller ones in the aromatic region between 115 and 170 ppm. For better visualization, only the range between 115 and 138 ppm is shown in Figure 3.
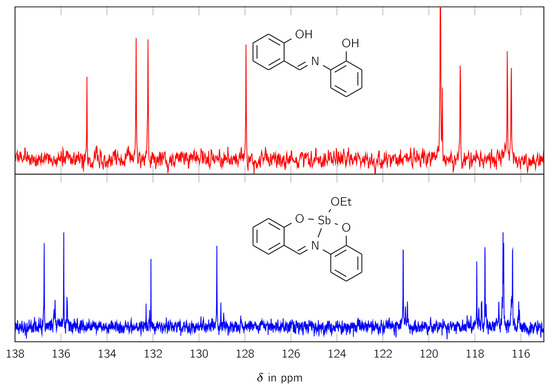
Figure 2.
The 13C NMR spectra of the free ligand H2L (red) and the complex LSb (blue) in the range of 115 and 138 ppm.
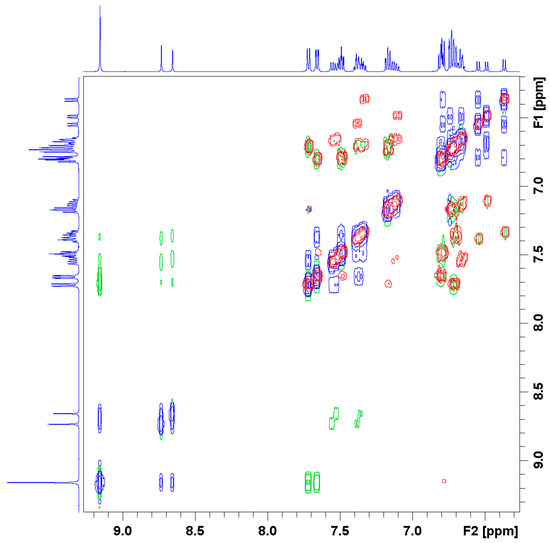
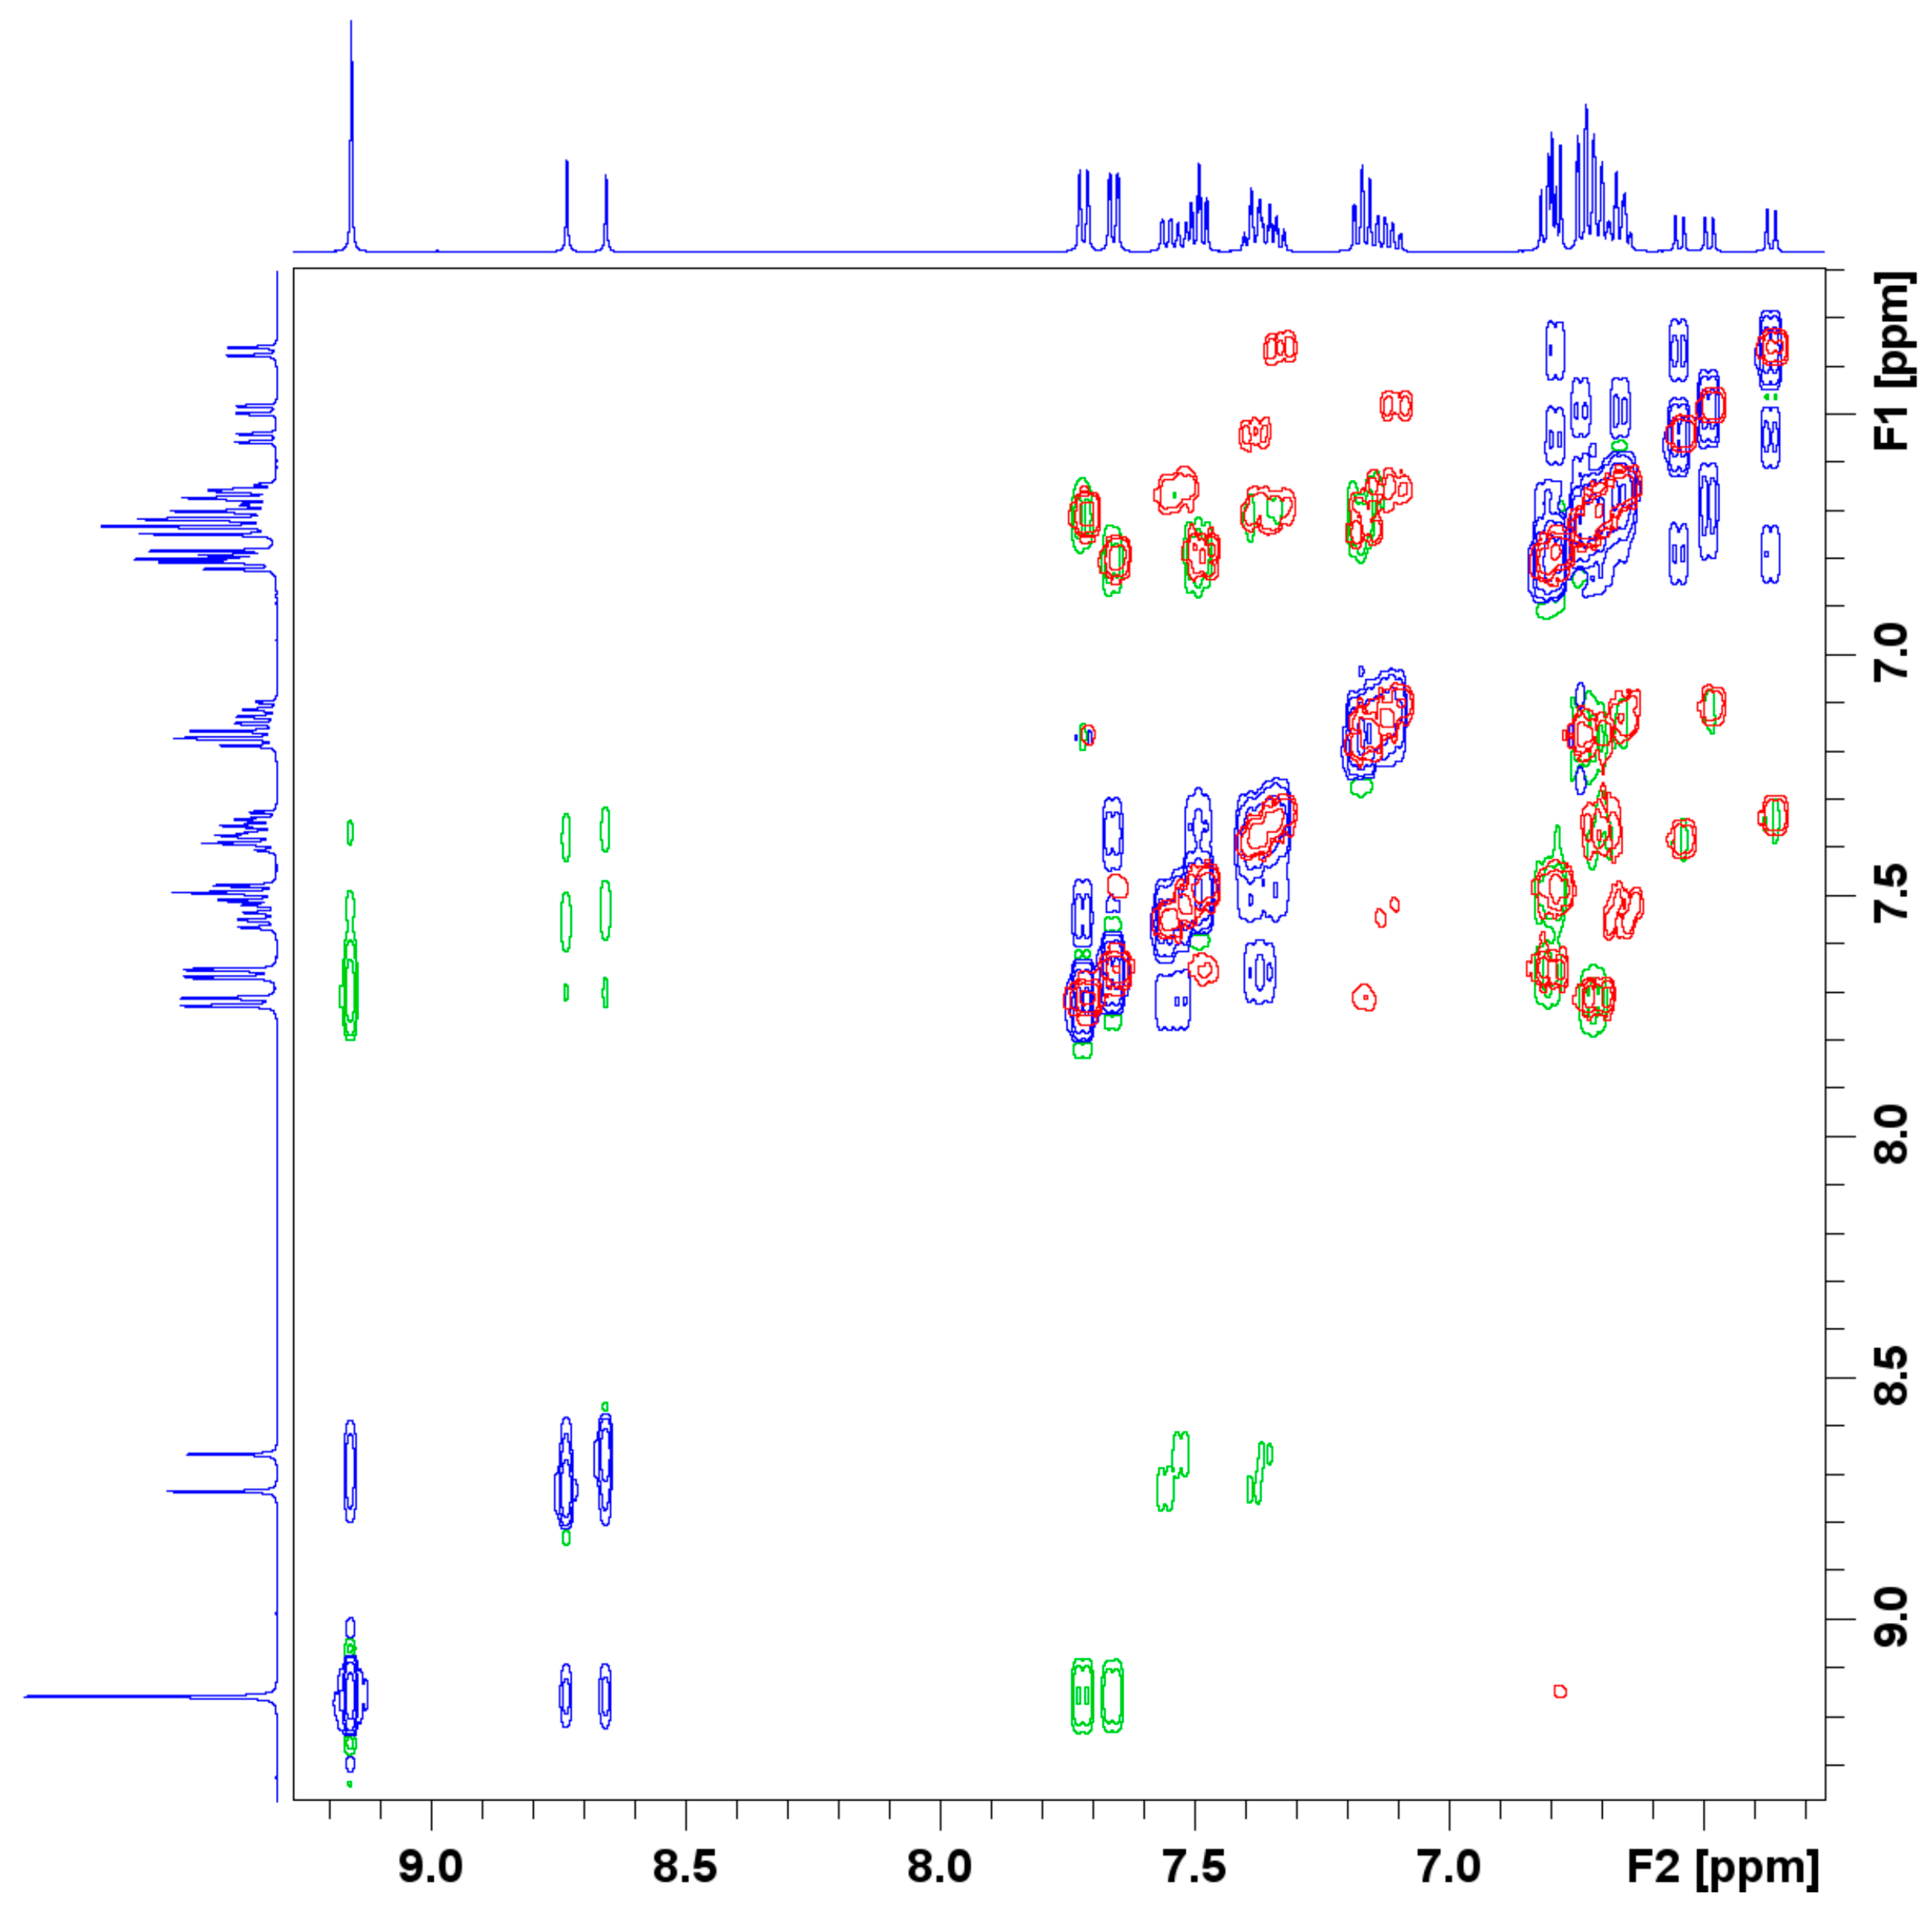
Figure 3.
Excerpt of the COSY and NOESY spectra of the complex LSb. The positive signals of the NOESY spectra are blue, the negative green. The signals of the COSY spectra are red.
Thereby, two small signals are located near one large signal, similar to the signals for the CH group in the 1H NMR spectrum. The 13C NMR spectrum also shows signals for an ethoxy moiety at 18 and 56 ppm.
The 1D 1H and 13C NMR spectra thus indicate the formation of three similar complexes in solution. The possibility of the formation of a dimer was investigated by measuring the 2D COSY and NOESY spectra of the product. The COSY spectrum shows coupling hydrogen atoms and was also used for the assignment of the signals to the corresponding atoms. The NOESY spectrum shows spatially close hydrogen atoms (green) and interchanging hydrogen atoms (blue). To exclude close atoms in the same molecule, the COSY (blue and green) and NOESY (red) spectra were stacked. The resulting spectrum, shown in Figure 3, does not show any other close hydrogen atoms that are not in the same molecule. These results do not exclude any formation of dimers but any dimer with intermolecular close hydrogen atoms. Other dimers or oligomers could be, for example, oxo-bridged dimers with an Sb-O-Sb moiety. The formation of adducts with the solvent, in this case DMSO-d6, is unlikely because no signals for the coordinating DMSO-d6 molecules showed up in the 1D NMR spectra and no coupling of the DMSO-d6 signal with the complexes could be seen in the 2D NMR spectra.
In light of the NMR data, we conclude with caution that the formation of dimers or oligomers might occur in solution.
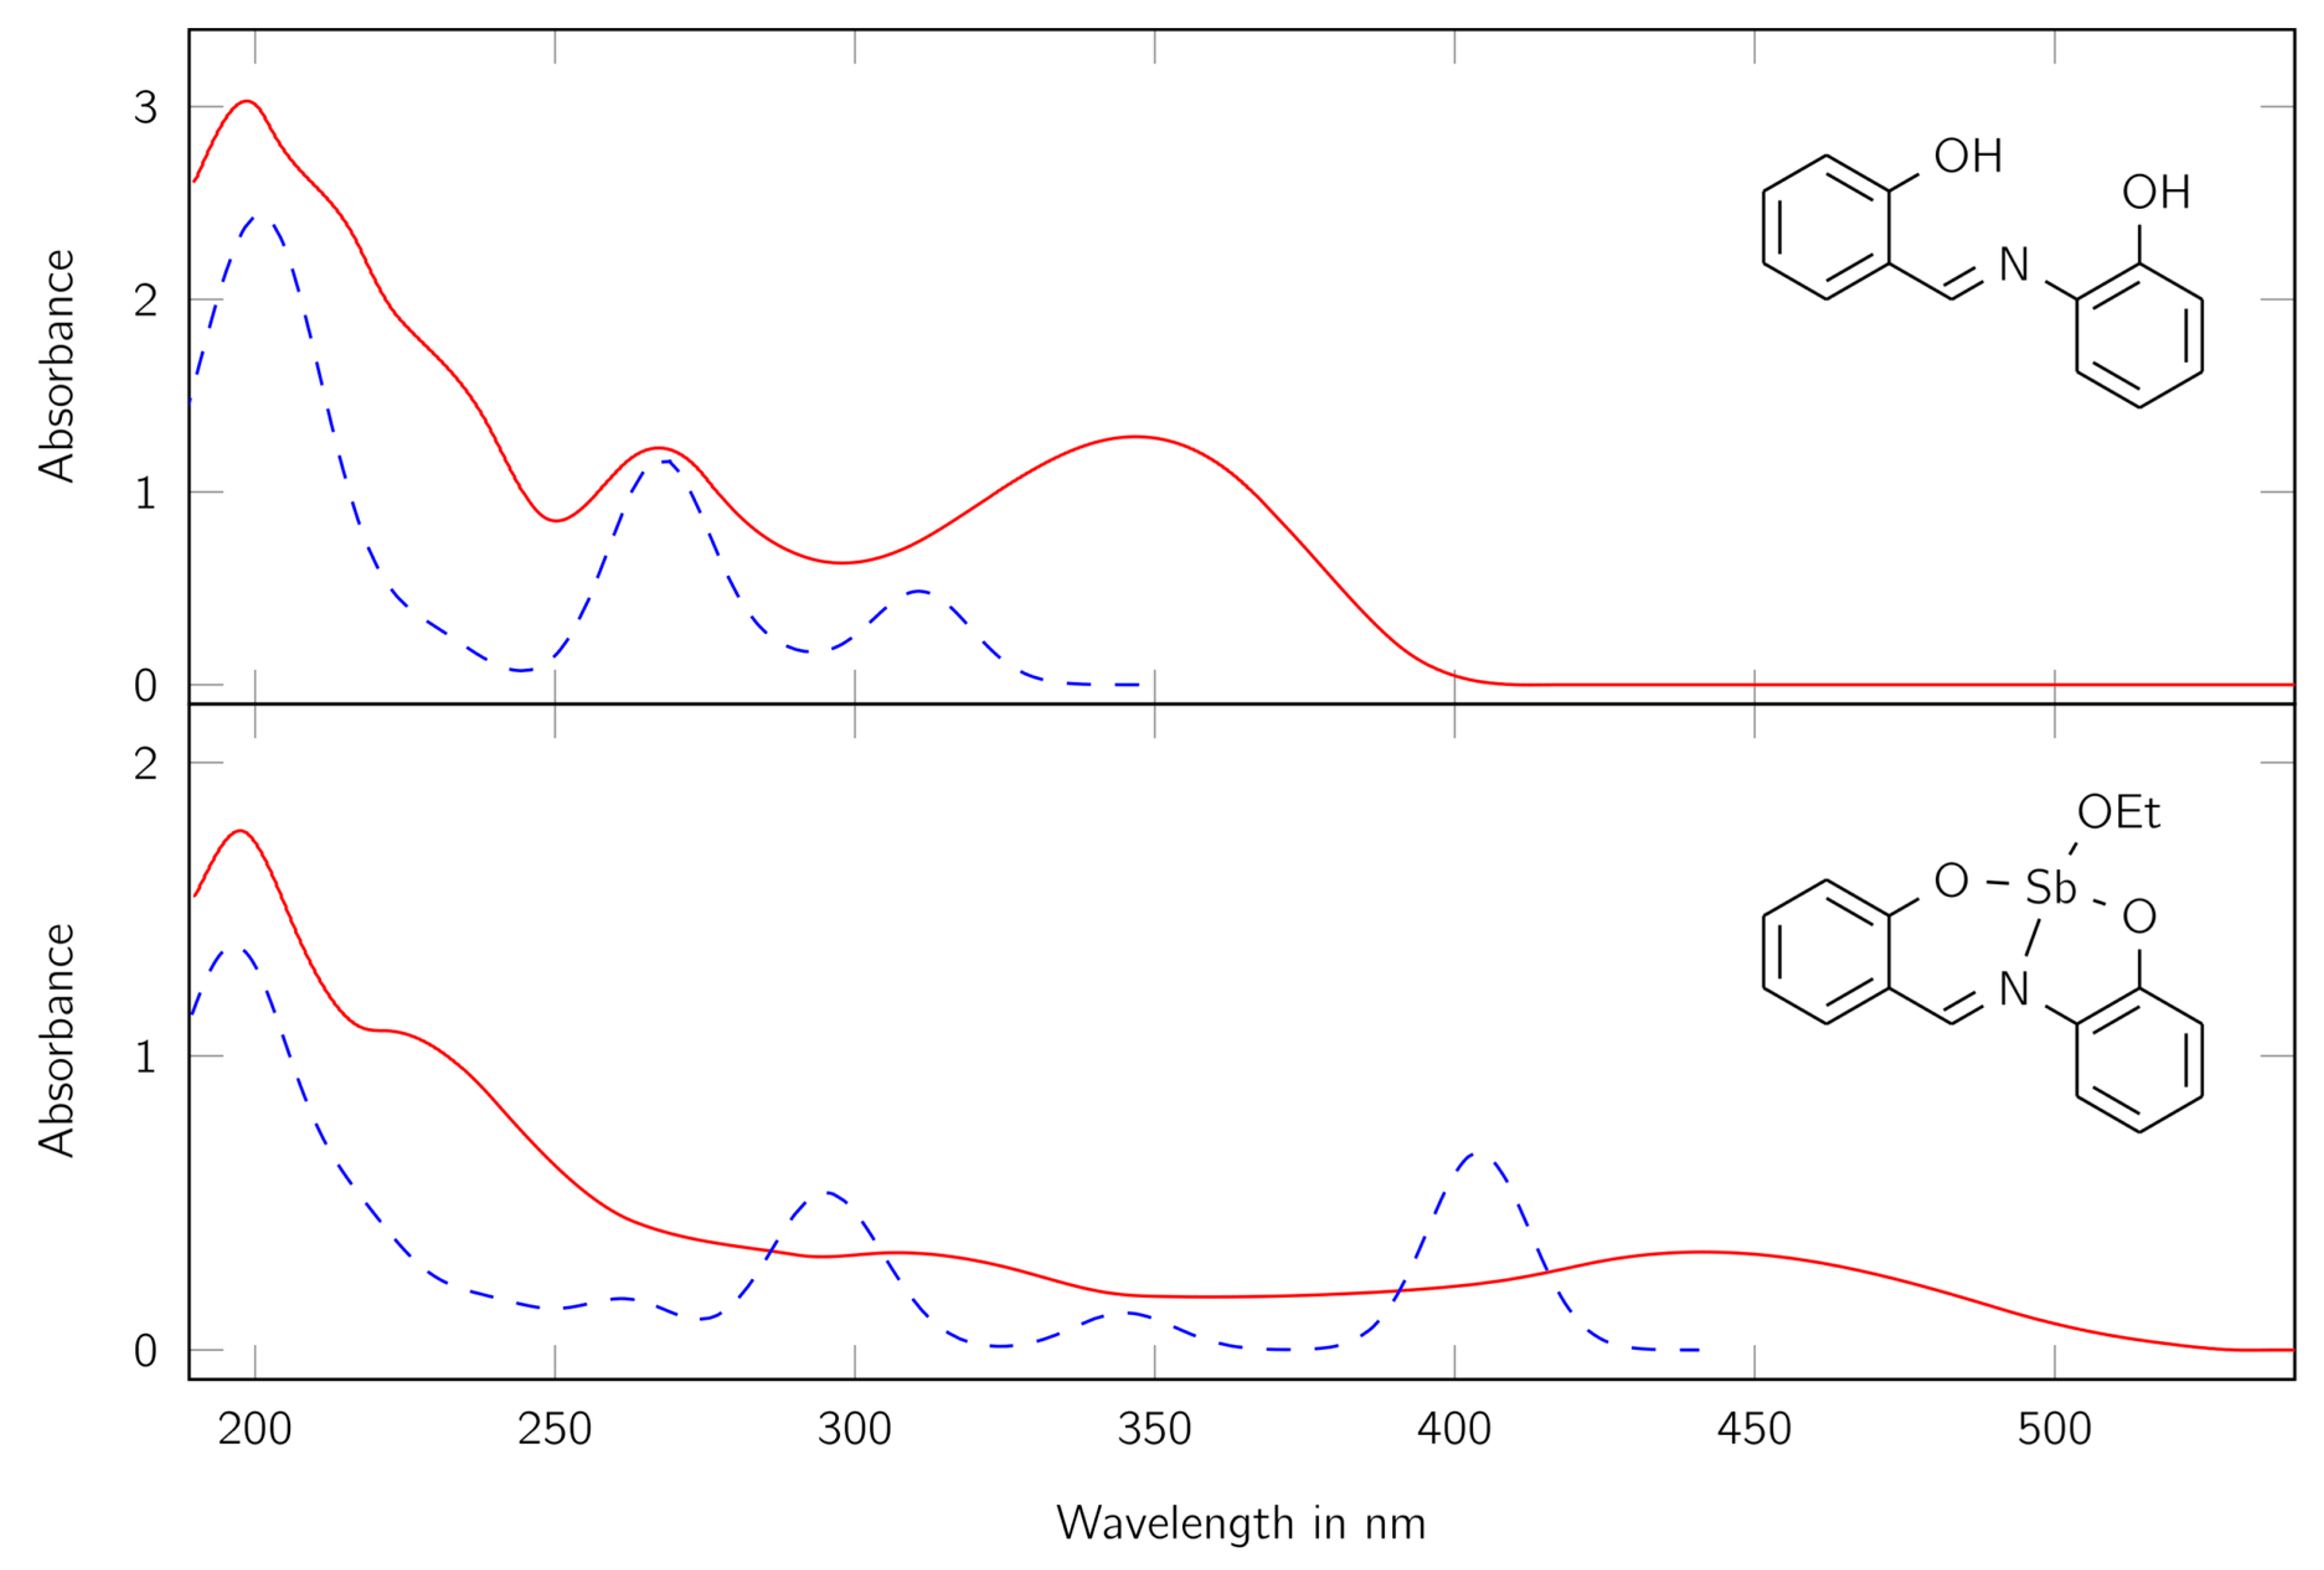
Because of the strong coloring of the product, it offered the investigation with UV/Vis spectroscopy. For comparison, the spectra of the free ligand H2L and the complex LSb were measured in dry acetonitrile. Furthermore, the spectra were calculated with quantum chemical methods. The spectra can be found in Figure 4.
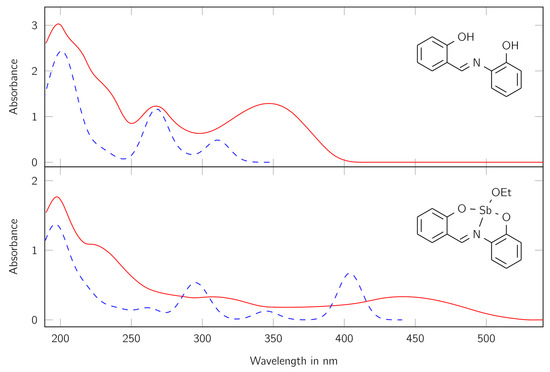
Figure 4.
UV/Vis spectra of the ligand H2L (top) and the complex LSb (bottom). Red lines show the measured spectra, blue lines the calculated ones. The calculated spectra were scaled to fit the first maxima of the measured spectra. The values at the y axis apply to the experimental data. Absorbance maxima for the complex λ (nm) = 198 (ε = 42,030 cm2 mmol−1), 307 (ε = 7862 cm2 mmol−1), and 441 (ε = 7916 cm2 mmol−1); for the ligand λ (nm) = 198 (ε = 24,843 cm2 mmol−1), 267 (ε = 10,077 cm2 mmol−1), and 347 (ε = 10,556 cm2 mmol−1).
First, a good correlation between the calculated and measured spectra can be found. The differences can be traced back to the optimization method, which optimizes the molecular structure in the gas phase. Furthermore, the absorption maxima of the complex LSb are at higher wavelengths and have higher absorption coefficients compared to the free ligand H2L. This indicates the formation of a complex, where the antimony center is involved in the delocalized system. The recorded spectrum of the complex LSb shows three large maxima at 198, 307, and 441 nm and one shoulder at about 240 nm. These signals indicate the presence of a large delocalized π-electron system.
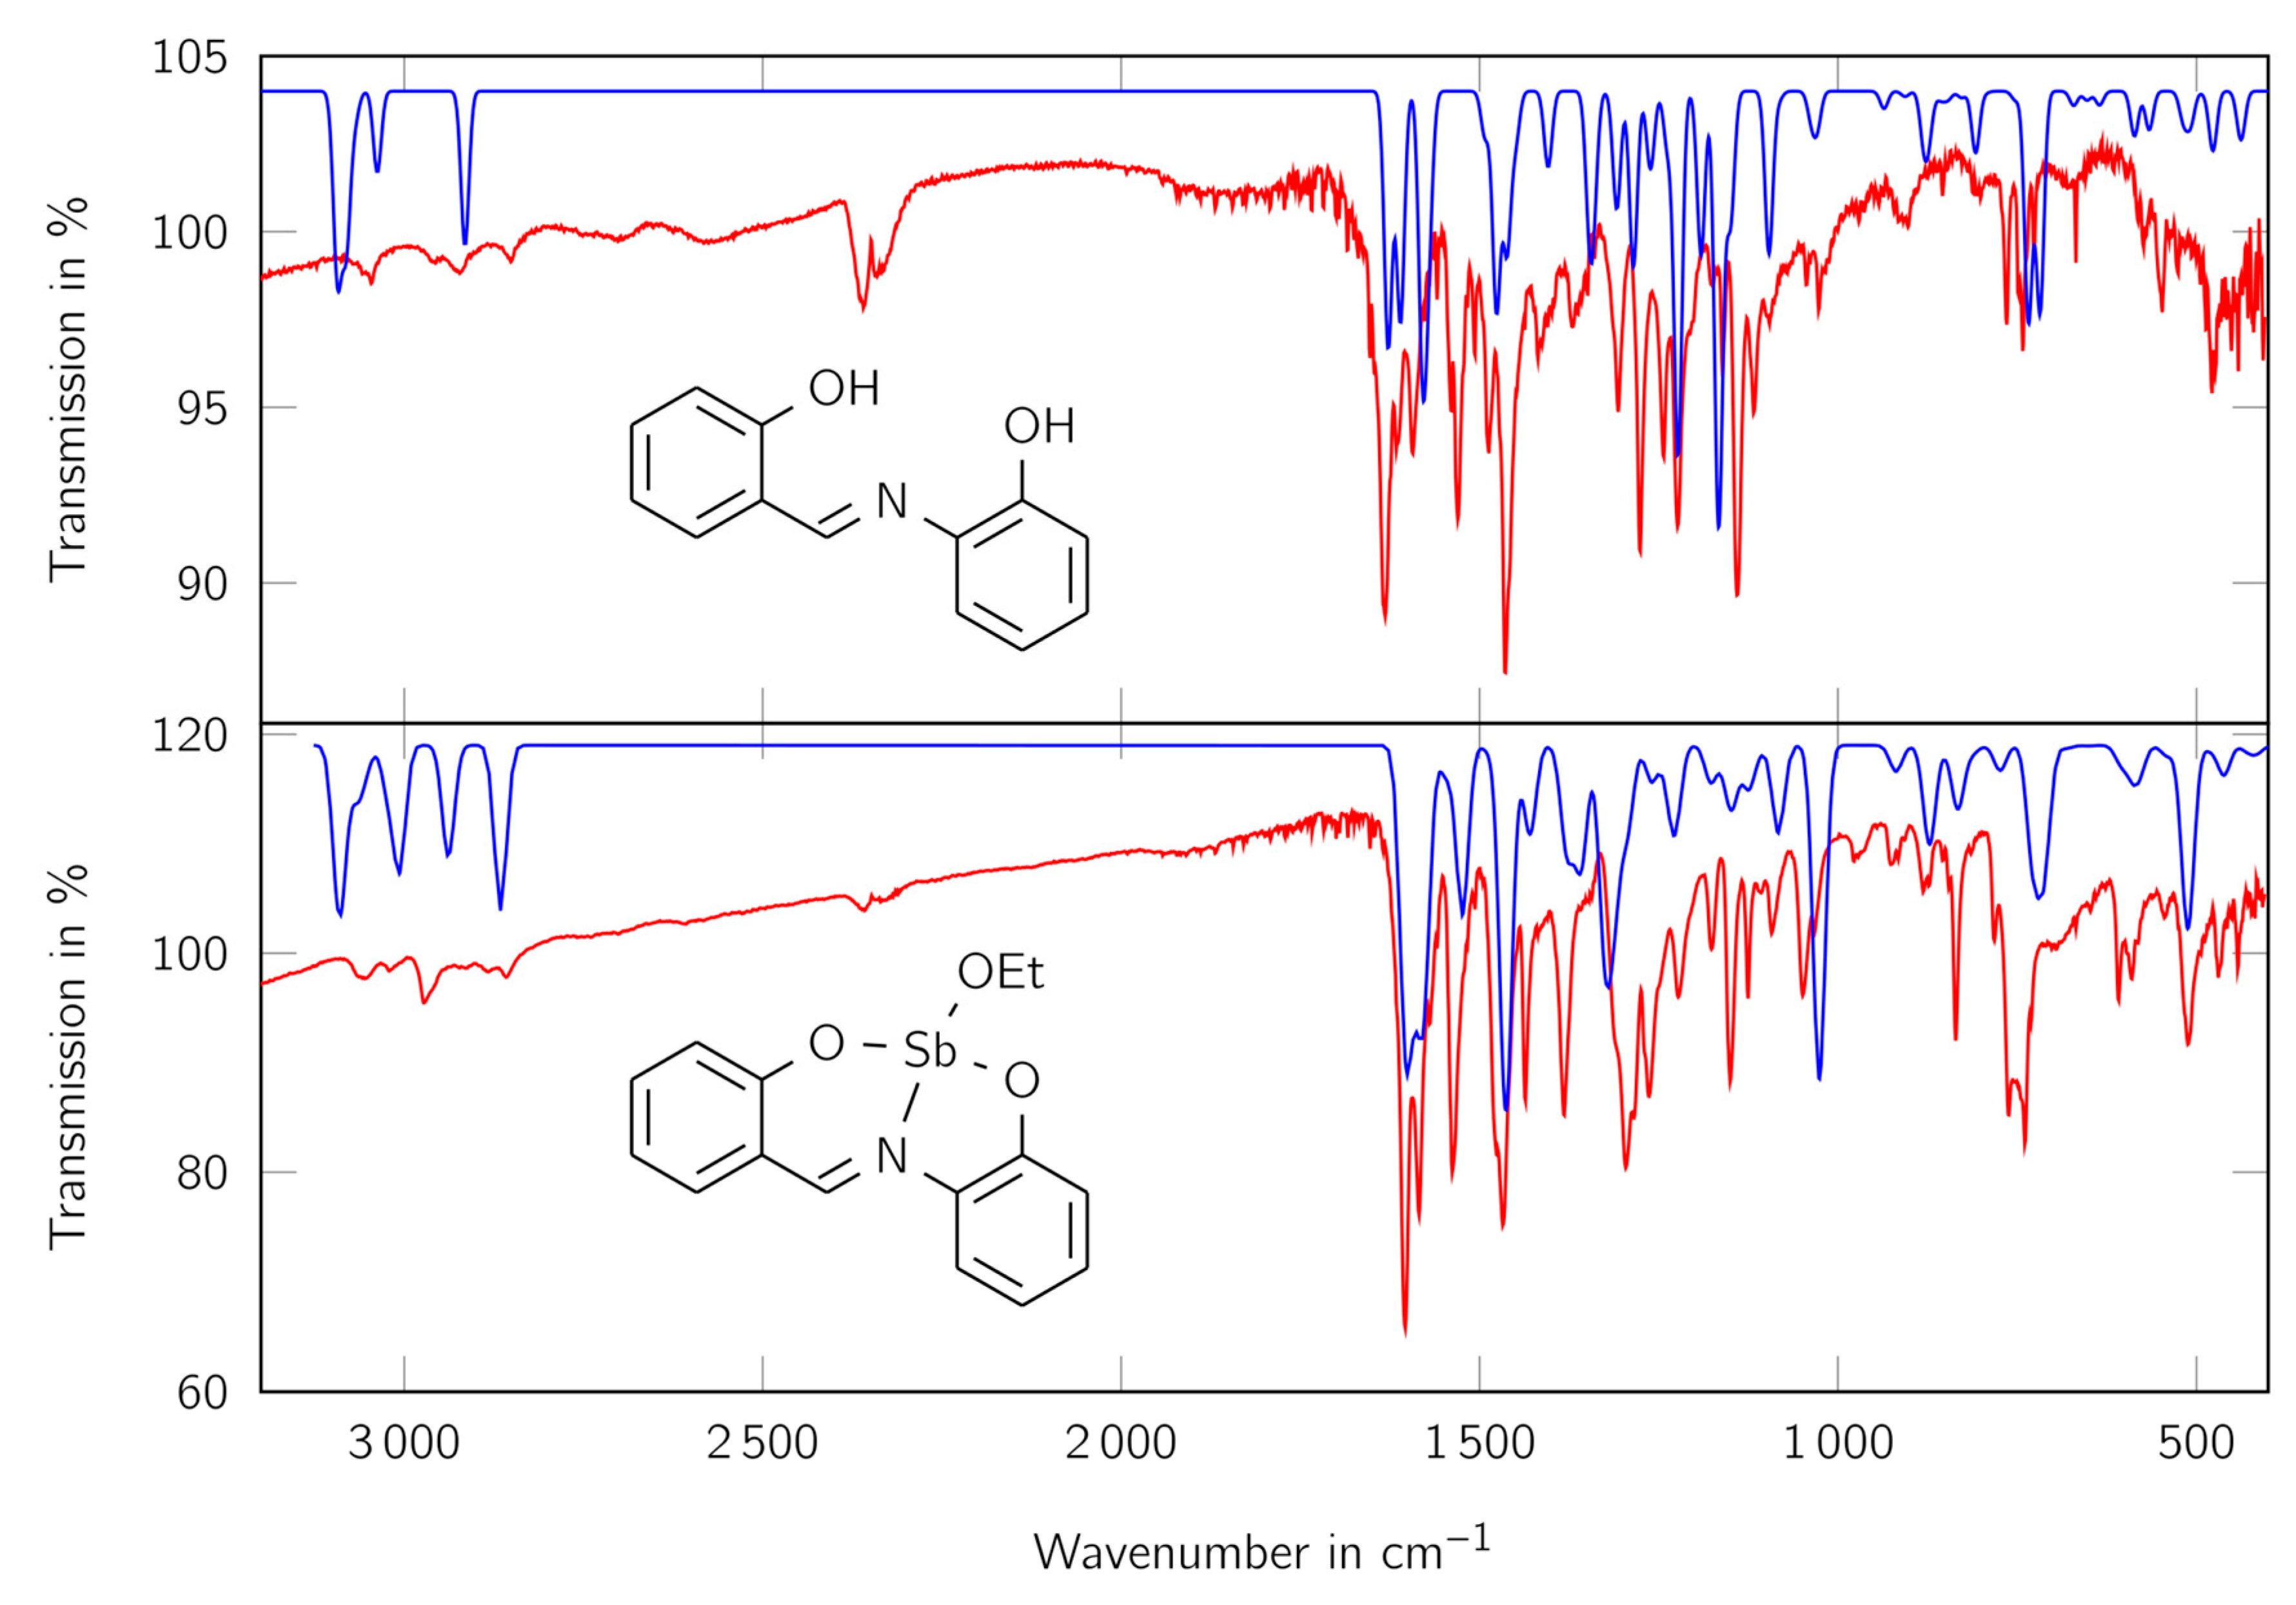
For further investigation of the substitution pattern of the aromatic systems and other functional groups, IR spectra of the free ligand H2L and the complex LSb were recorded and calculated using quantum chemical methods (see Figure 5).

Figure 5.
IR spectra of the ligand H2L (top) and the complex LSb (bottom). Red lines show the measured spectra, blue lines the calculated ones. Wavelength of the calculated spectra are scaled according to Katsyuba et al. [54]. The values at the y axis apply to the experimental data.
The calculated and measured spectra are in good consistency with each other. In both measured spectra the bands for aromatic CH vibrations at above 3000 cm−1 can be observed. Furthermore, at the complex more aliphatic CH vibrations are evident for the complex than for the free ligand, indicating the presence of an additional aliphatic component. The bands at about 600 cm−1 indicate the Sb-O bonds, because they cannot be seen in the free ligand and are in a similar range as Sb-O bonds known in literature [53]. The bands just below 800 cm−1, which can be seen in both spectra, indicate the presence of 1,2-disubstituated benzene derivatives. The signal at about 1580 cm−1 shows the presence of a C=N group, which is connected to an aromatic system.
The Raman spectra of the free ligand and the complex, shown in Figure S4 in the Supplementary Material, show the same results as the IR spectra, and thus are not discussed further.
The batch product was analyzed by powder XRD to investigate the phase purity since the NMR shows some signals that cannot be assigned to the main product. For comparison, a diffraction pattern generated from the single crystal structure analysis (see Section 3.2) was used. Despite differences caused by the different measurement temperatures, the batch product shows good agreement with the generated diffractogram. Additional reflexes can be generated by oxo-bridge dimers and oligomers, discussed earlier. When the compound is exposed to humid air for several hours, hydrolysis occurs and the powder XRD pattern changes significantly. The diffractograms can be seen in Figure S8 in the Supplementary Material.
3.2. Crystal Structure
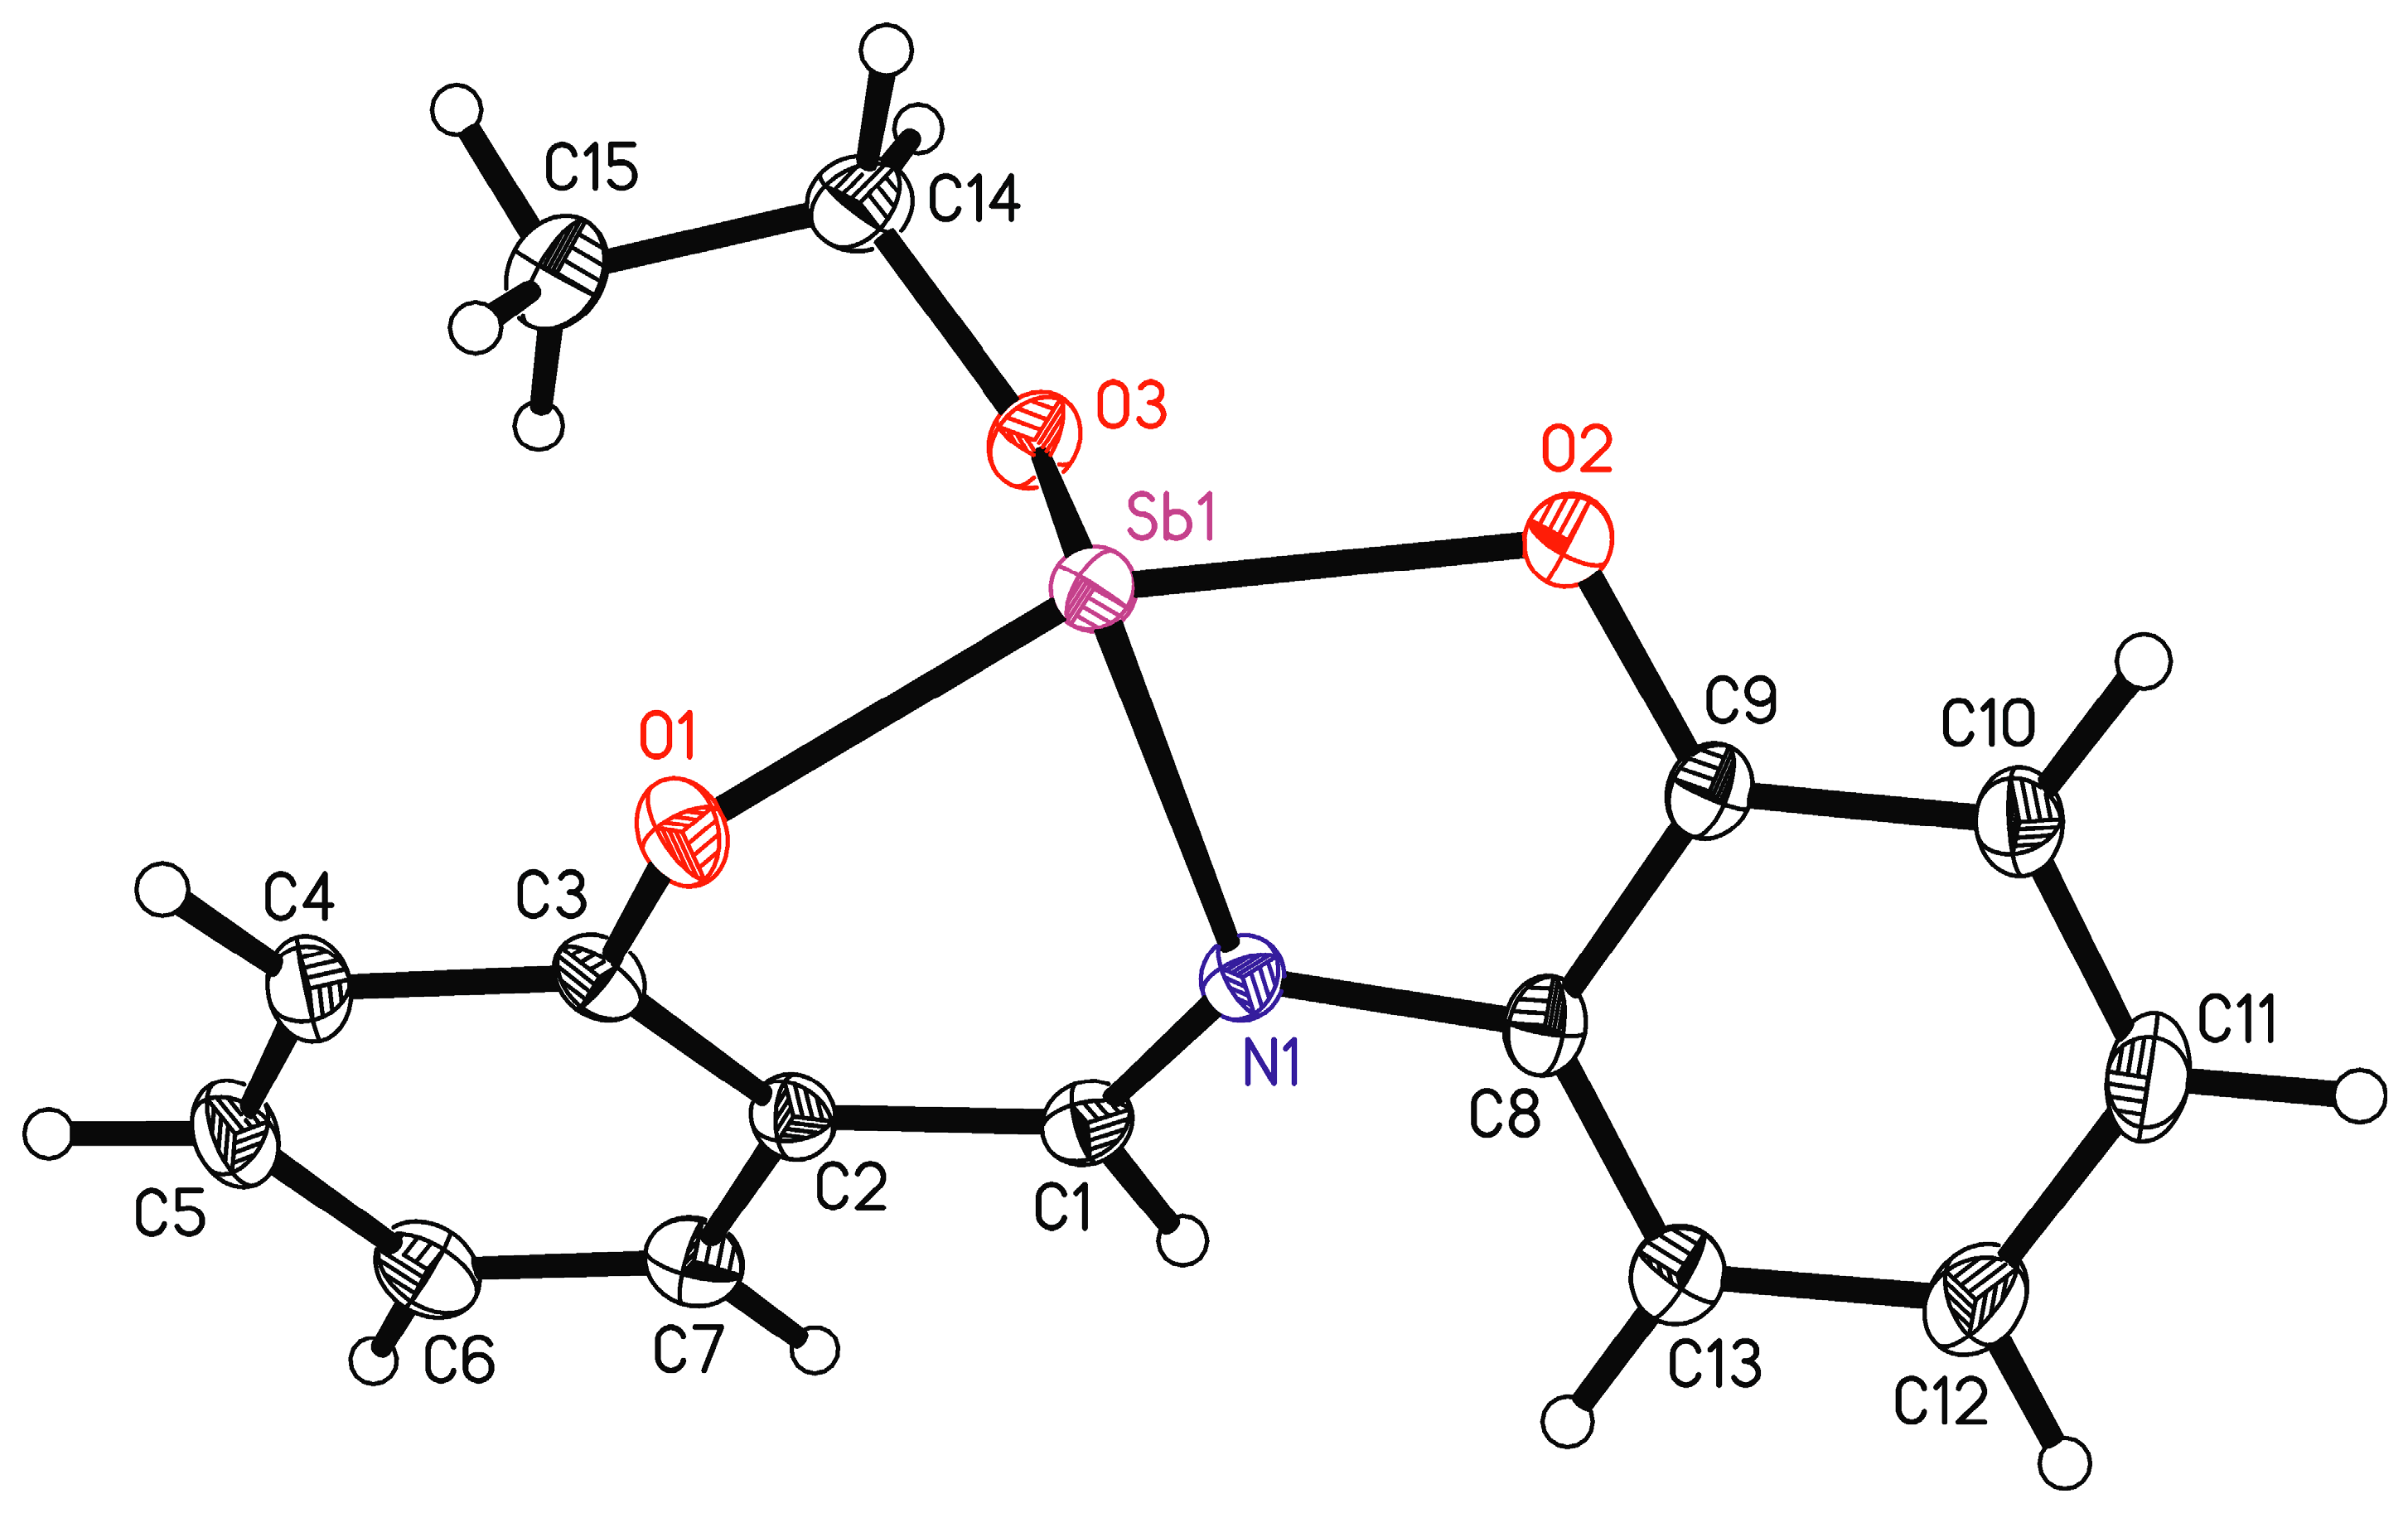
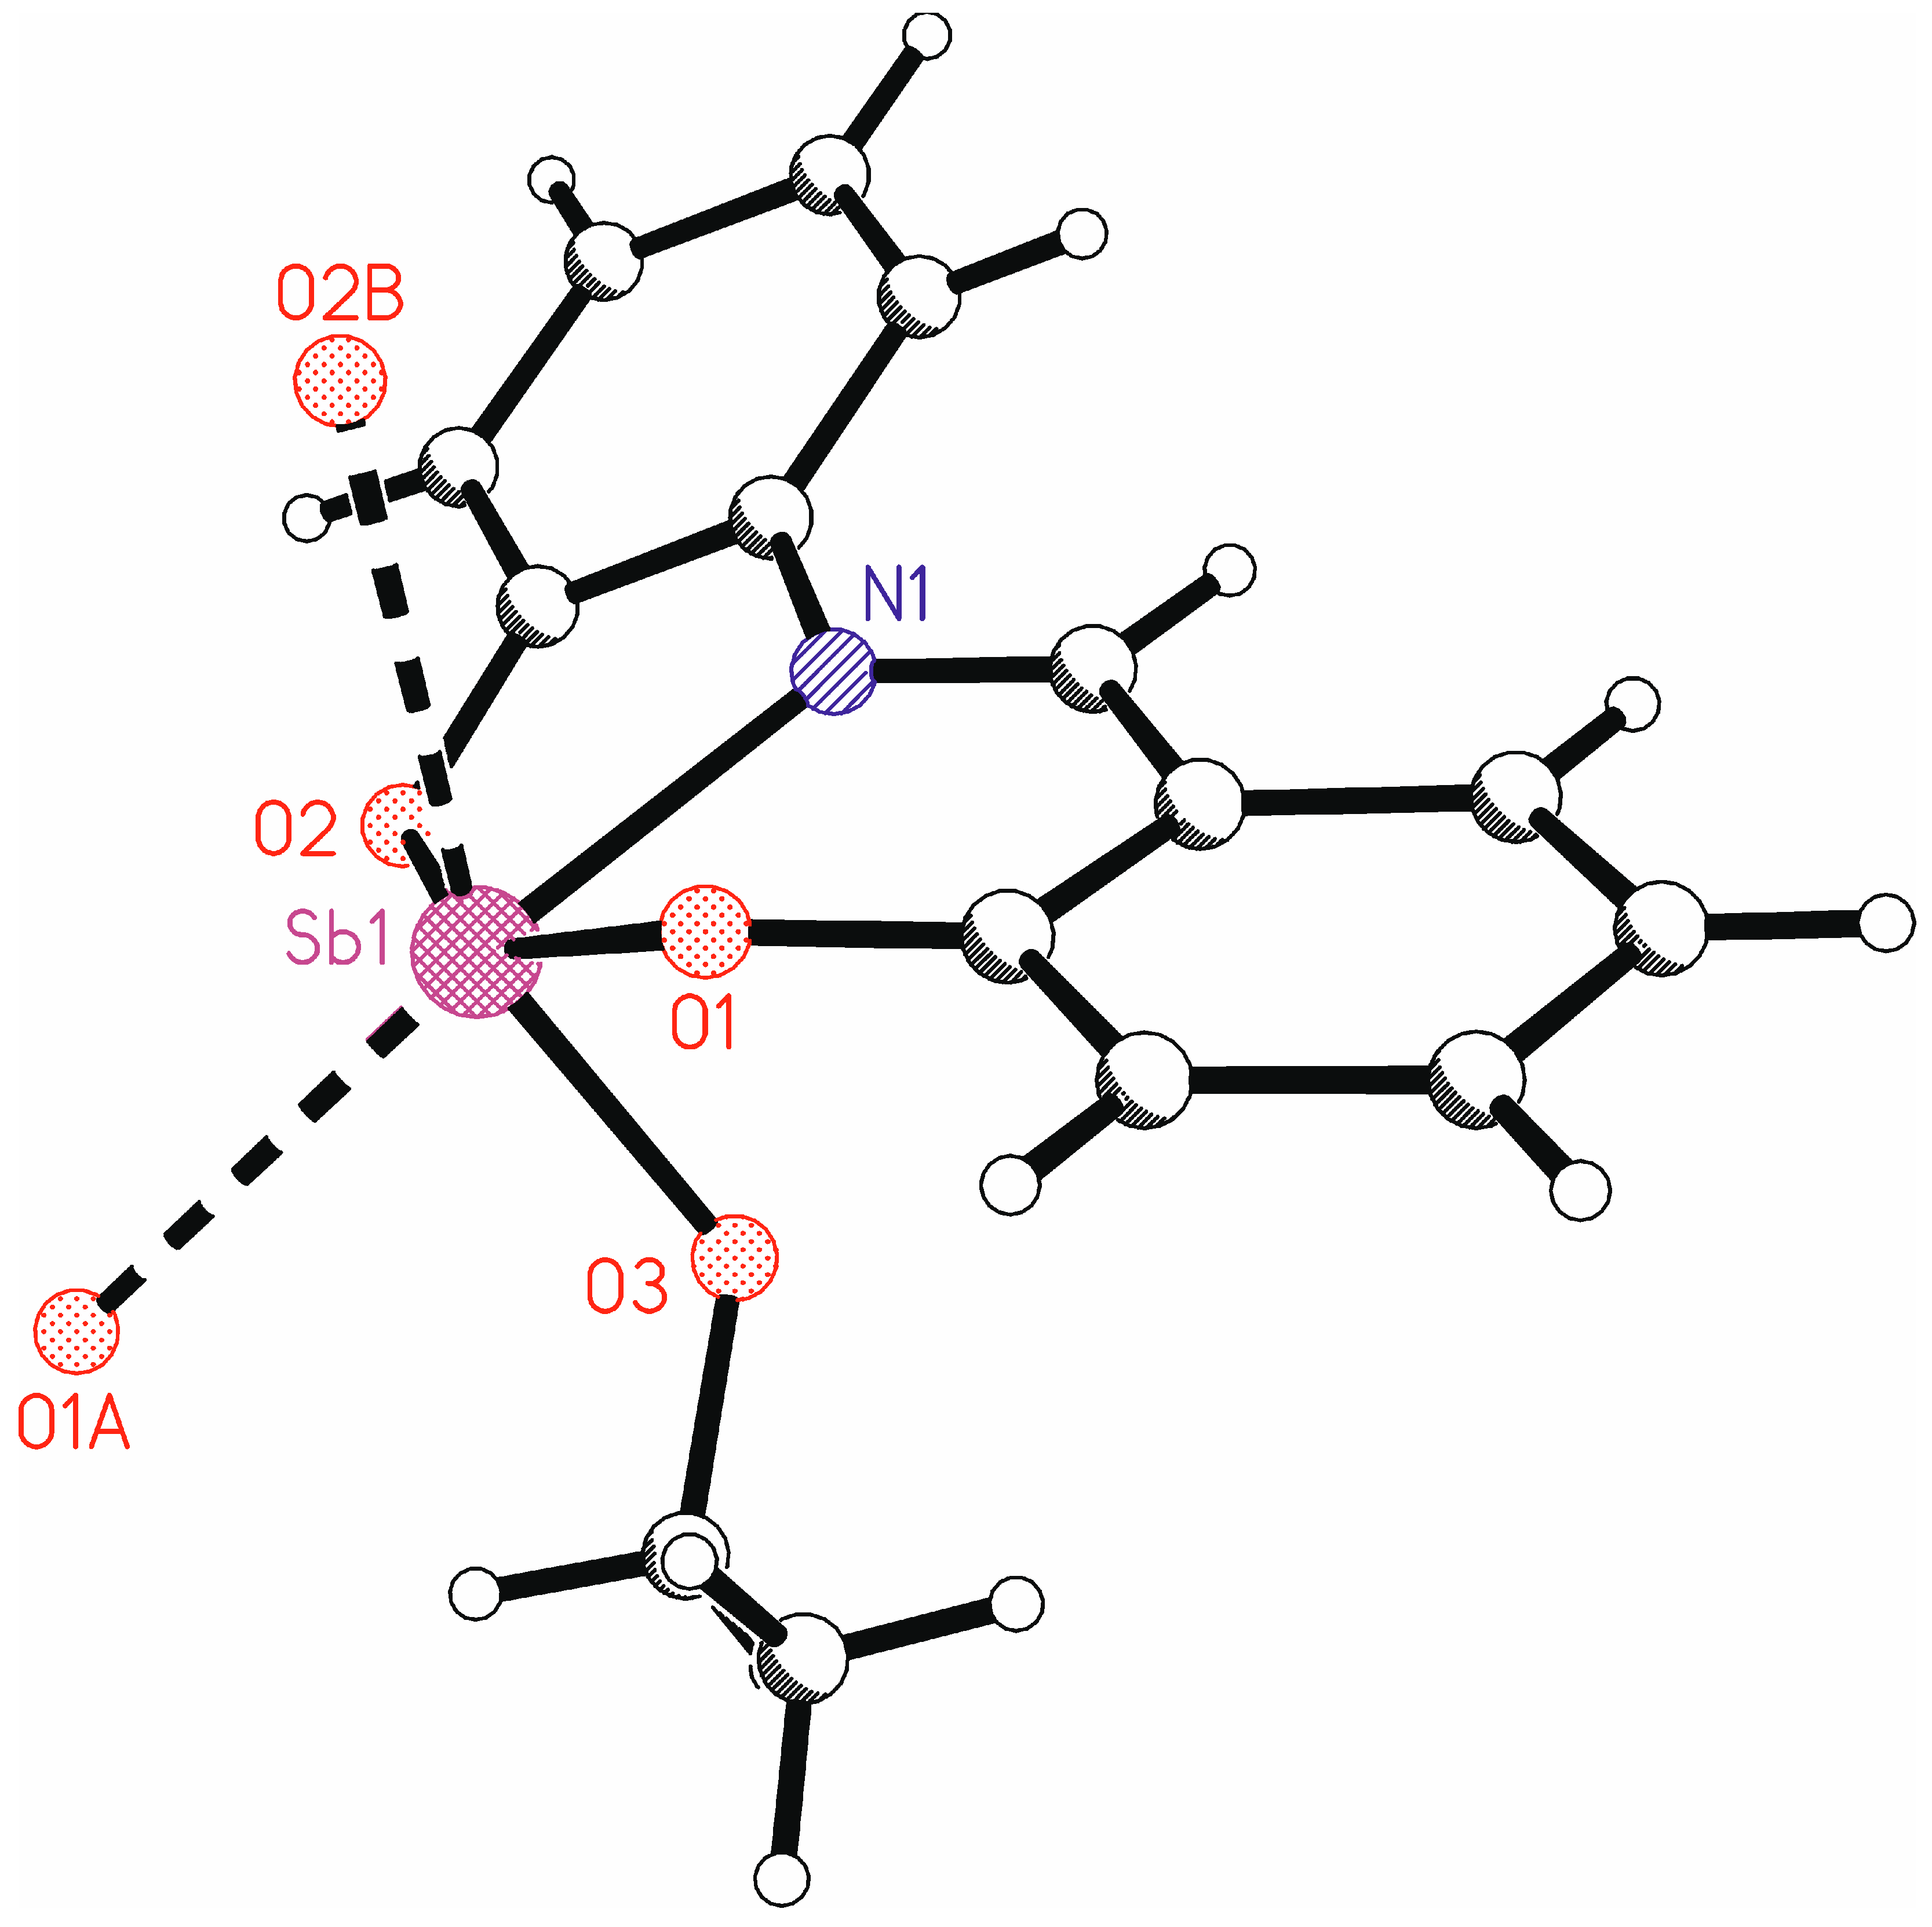
The ORTEP view with an atom numbering scheme of the compound LSb is shown in Figure 6 and selected bond lengths and angles are listed in Table 2. Compound LSb crystallizes in the monoclinic space group P21/c. The asymmetric unit contains one molecule of LSb. The chelate ligand is coordinated via the atoms O1, O2, and N1 to the antimony atom. The 2-salicylidenaminophenolato ligand has two phenyl rings that are connected by an aldimine group. This represents a system of conjugated double bonds from which planarity can be expected. However, the coordination of the antimony atom leads to a substantial torsion of the ligand anion. The torsion angle between the planes of the phenyl groups C2–C7 and C8–C13 is 31.2(1)°. The unit O1-N1-O2-Sb1 is planar and forms torsion angles of 25.9(1)° with the plane of the phenyl ring C2-C7 and of 21.5(1)° with the plane of the phenyl ring C8-C18.
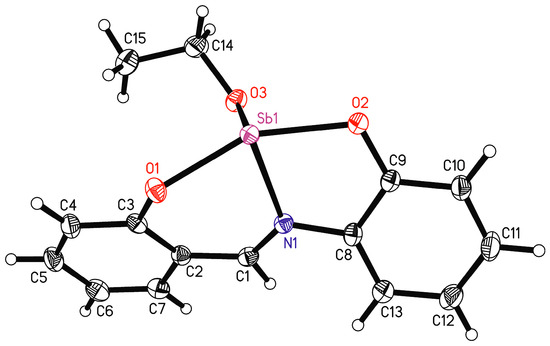
Figure 6.
Molecule structure of LSb with atomic numbering scheme, shown with 50% probability ellipsoids.
Table 2.
Atomic distances [Å] and angles [°] for LSb.
There are a large number of comparable structures in the Cambridge Structural Database which contain the 2-salicylidenaminophenolato ligand or a derivative thereof and a tetracoordinate central atom [55,56]. It is worth considering the torsion angles between the planes of the phenyl groups in these complexes. There are 92 transition metal complexes with Ni, Cu, Pd, and Pt as divalent central ions. In these complexes, the mean value for the angle between planes of phenyl groups is 6.9° (minimum angle of 0.5°, maximum angle of 27.5°). Furthermore, there are 25 boron complexes with a minimum angle of 9.2°, a maximum angle of 31.2°, and a mean value of 20.7°. There exists one tin(II)-complex which occurs to be a dimer in the solid-state structure (angle between planes of phenyl groups is here 42.9°) [57]. This variability in the angles shows the flexibility of the ligand system.
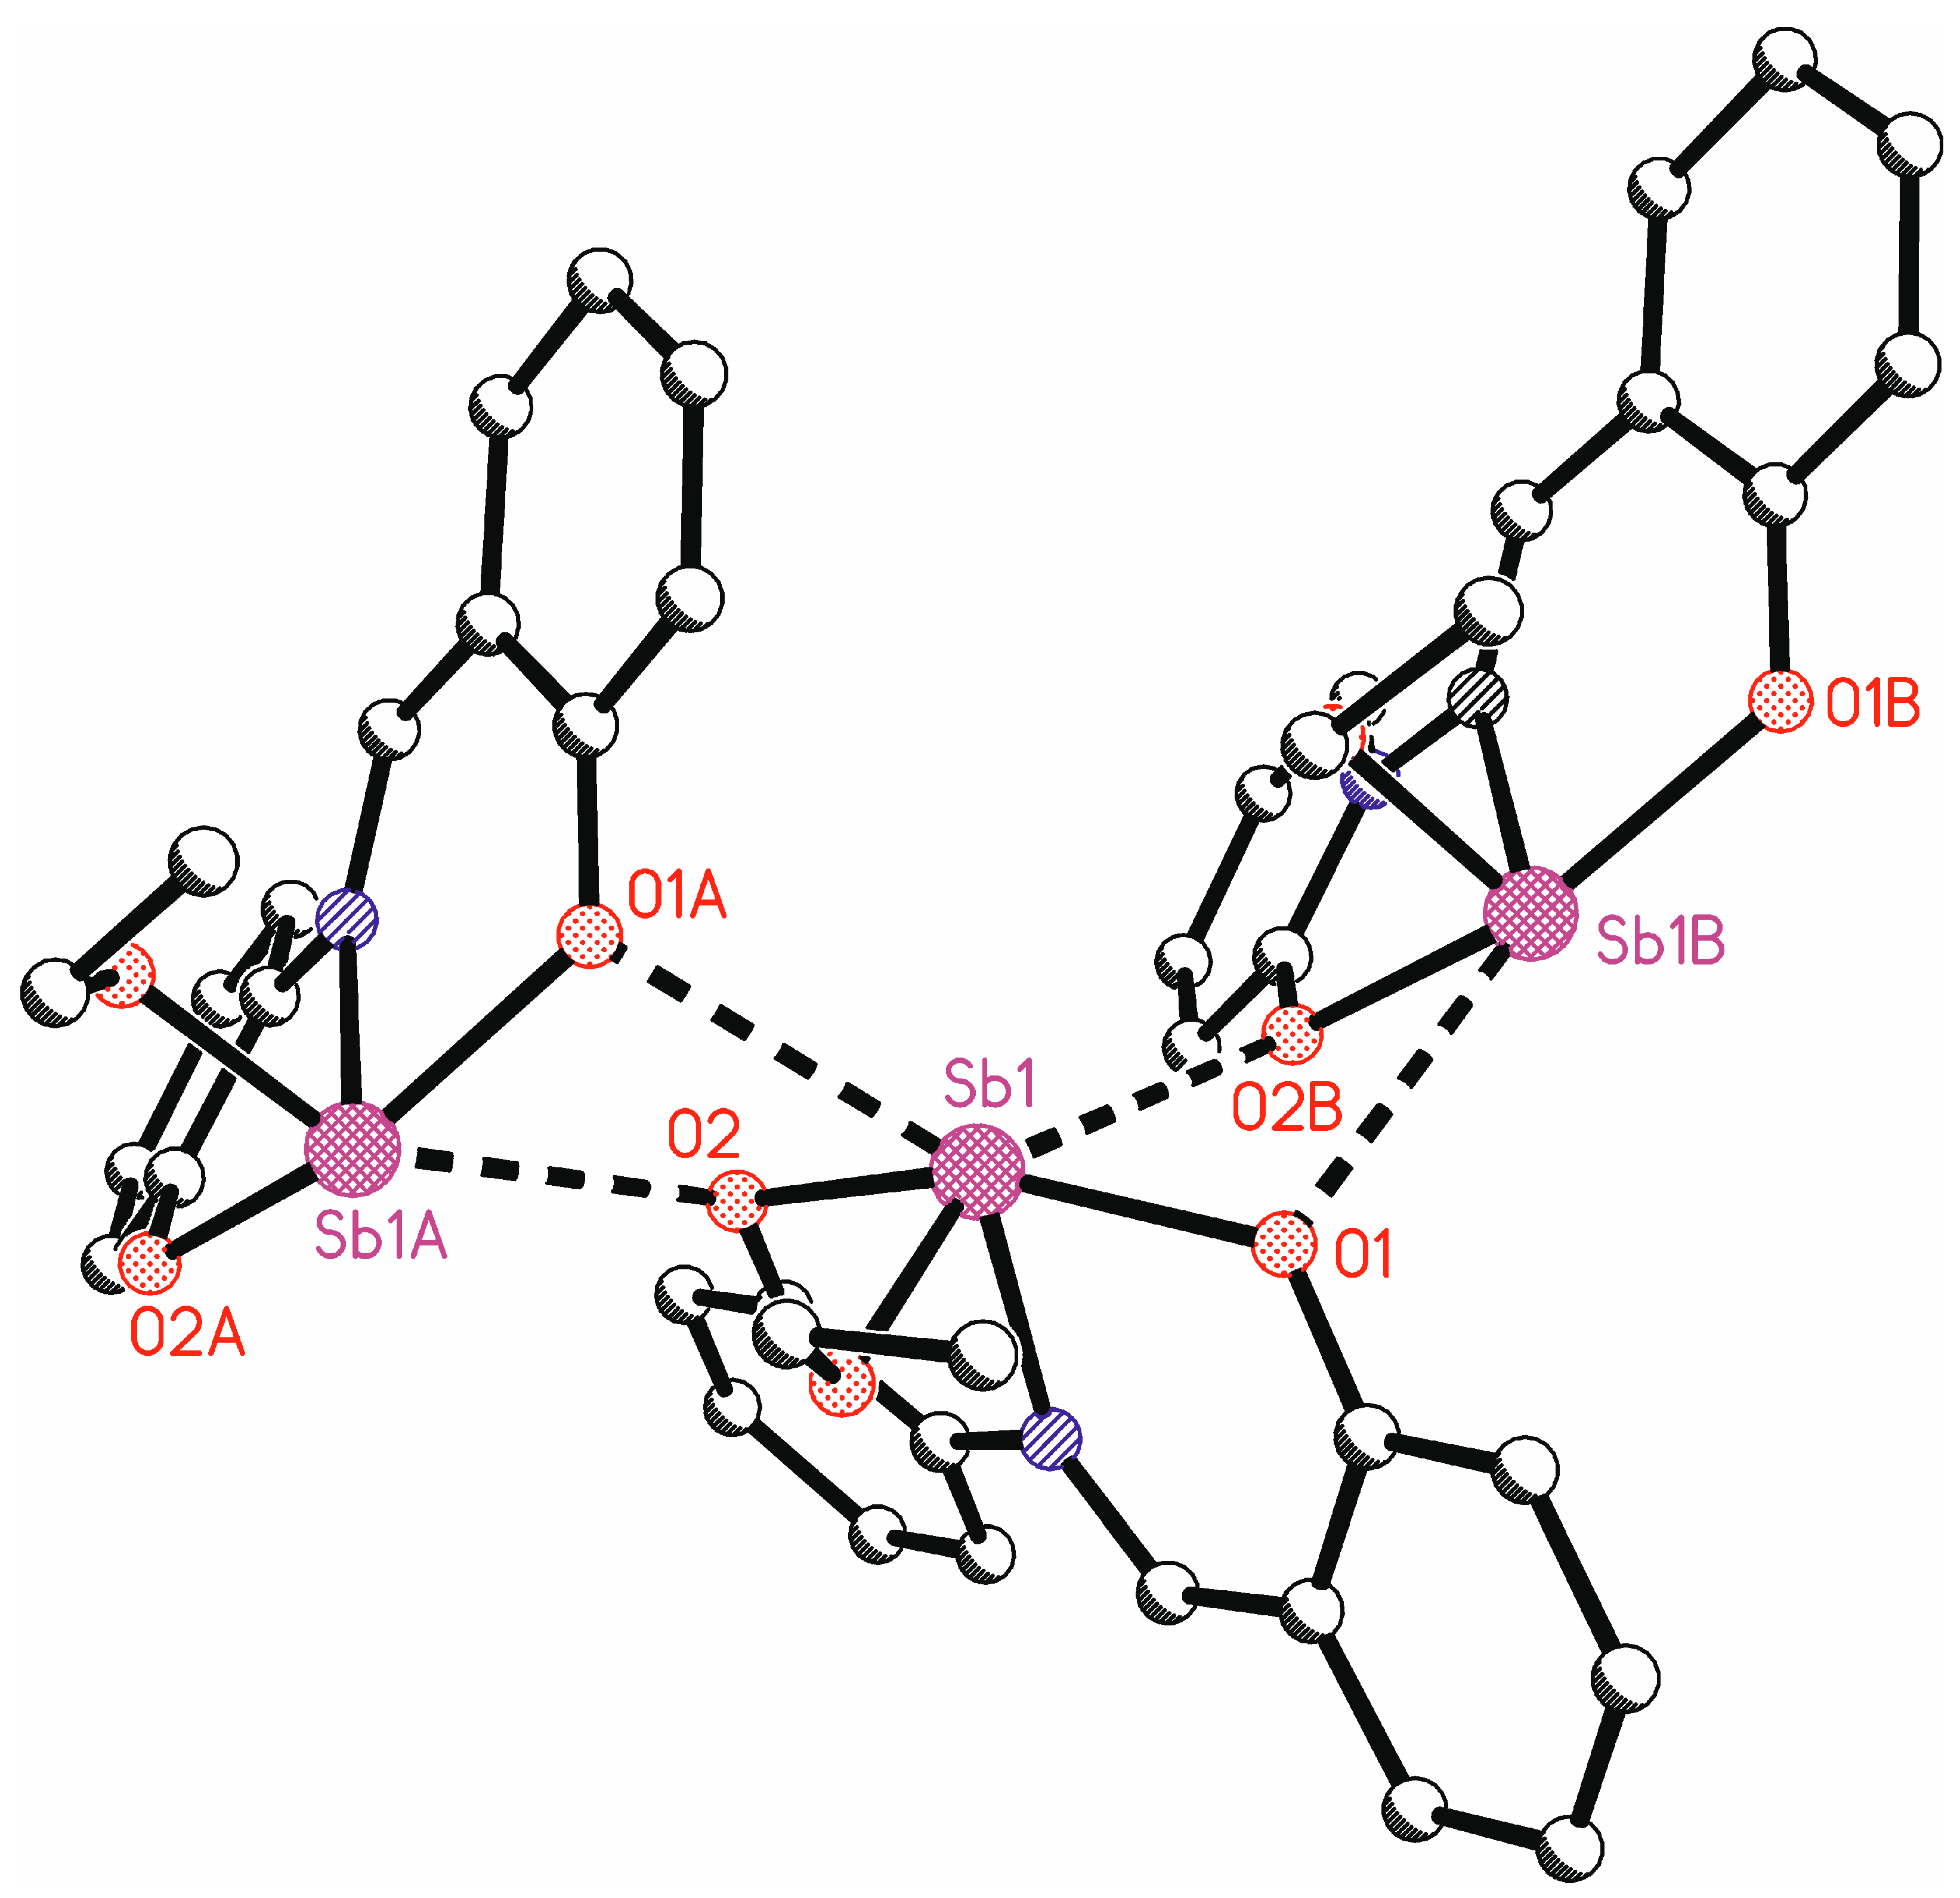
In addition to the tridentate ligand, there is also an ethoxy group bound to the antimony atom. This leads formally to a tetracoordinate antimony atom. The bond angles at antimony vary between 74.20(7)° (O2-Sb1-N1) and 91.48(7)° (O3-Sb1-O2) for neighboring ligand atoms (Table 2). Only the bond angle O1-Sb1-O2 is larger, at 154.27(7)°. Such bond angles are unusual for a tetracoordinate complex and indicate coordinative unsaturation. There are indeed intermolecular interactions from neighboring molecules to the antimony atom (Figure 7). The symmetry equivalent molecules are generated by glide planes. The interactions Sb1…O1A and Sb1…O2B make the antimony atoms hexacoordinate. This explains the bond angles at antimony near 90°. These intermolecular interactions lead to ladder-type chains parallel to the crystallographic ac plane. These intermolecular interactions show the unsaturated character of this complex. In the solid state, the antimony center is saturated by the neighboring complexes, which cannot be assumed in the solution state.
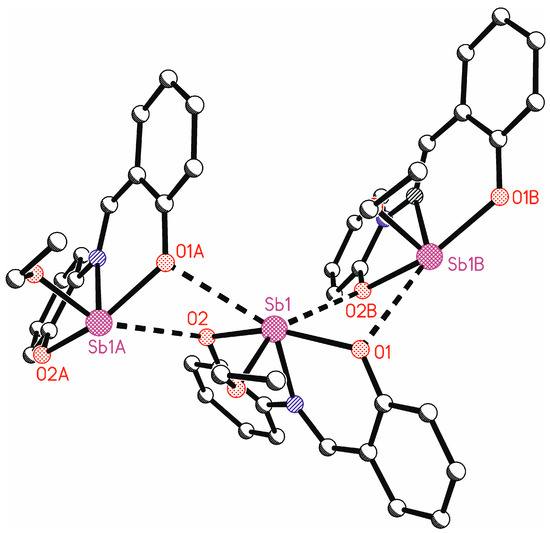
Figure 7.
Intermolecular interactions to the antimony atoms in the crystal structure of LSb. Hydrogen atoms are omitted for clarity (symmetry-equivalent molecule A is generated by symmetry operation x, 0.5 − y, −0.5 + z; symmetry-equivalent molecule B is generated by symmetry operation x, 0.5 − y, 0.5 + z.).
At this point, it is worth looking at the atomic distances between antimony and the neighboring atoms. Intramolecular Sb-O distances range from 1.9716(18) Å for Sb1-O3 to 2.1496(18) Å for Sb1-O2. This corresponds well with the sum of atomic radii of antimony and oxygen of 2.07 Å [58]. The same holds for the distance of Sb1-N1 at 2.194(2) Å, which corresponds quite well with the sum of covalent radii (2.11 Å) [55]. The imine bond length N1-C1 [1.299(3) Å] in LSb is well comparable to the bond lengths in other complexes with the same ligand type [22,59,60,61,62]. The intermolecular Sb…O distances are at 2.9344(18) Å (Sb1-O2B) and 2.9834(18) Å (Sb1-O1A). These are below the sum of the Van der Waals radii of 3.58 Å [63].
A closer inspection of the coordination polyhedron of the antimony atom including the contacts to the oxygen atoms O1A and O2B shows that a strongly distorted octahedral coordination around antimony is present in the solid-state structure (Figure 8). This can be seen, for instance, at the trans angles O1-Sb1-O2, N1-Sb1…O1A, and O3-Sb…O2B with values between 137.71(6) and 154.27(7)°, which are far away from 180°. A quantitative description of the distortion is possible using the parameters ζ, Σ, and Θ as defined by Ketkaew et al. [64]. These parameters give values very close to or equal to zero for a perfect octahedron, while in the present study the values are ζ = 2.25, Σ = 196.3, and Θ = 725.8.
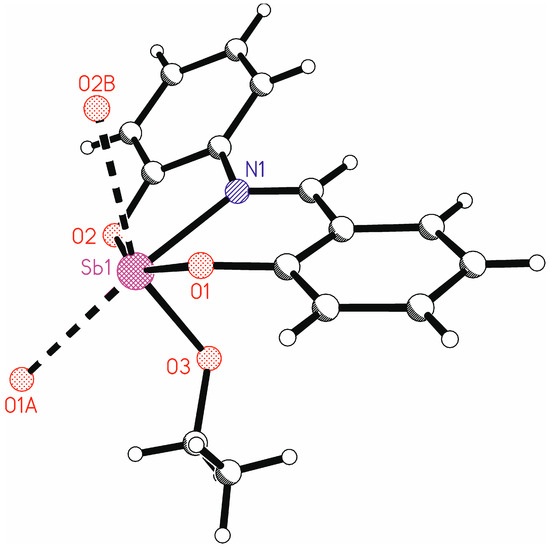
Figure 8.
Graphical representation of the coordination environment of Sb1 including the oxygen atoms from neighboring molecules.
There is one directly comparable antimony complex in the literature [19]. Therein, the 2-(salicylidenamino)phenolato ligand is bound to an SbMe3 unit. This is an antimony(V)-complex with a hexacoordinate central atom. The Sb-O distances were found to be 2.06 and 2.07 Å, which are somewhat shorter than in LSb. The distance Sb-N was found to be 2.34 Å, which is substantially longer than in LSb.
Potential donor atoms of LSb like oxygen and nitrogen are all engaged in coordination to the central antimony atom. Therefore, only one hydrogen bond is present in the solid-state structure. This is the intermolecular hydrogen bond of C14-H14B...O1i (i x, 0.5 − y, −0.5 + z) with a distance of 2.50 Å between H14B and O1. The distance of C14…O1i is 3.262(3) Å and the angle of C14-H14B…O1i is 133.5°.
3.3. Intrinsic Bond Orbital (IBO) Analysis
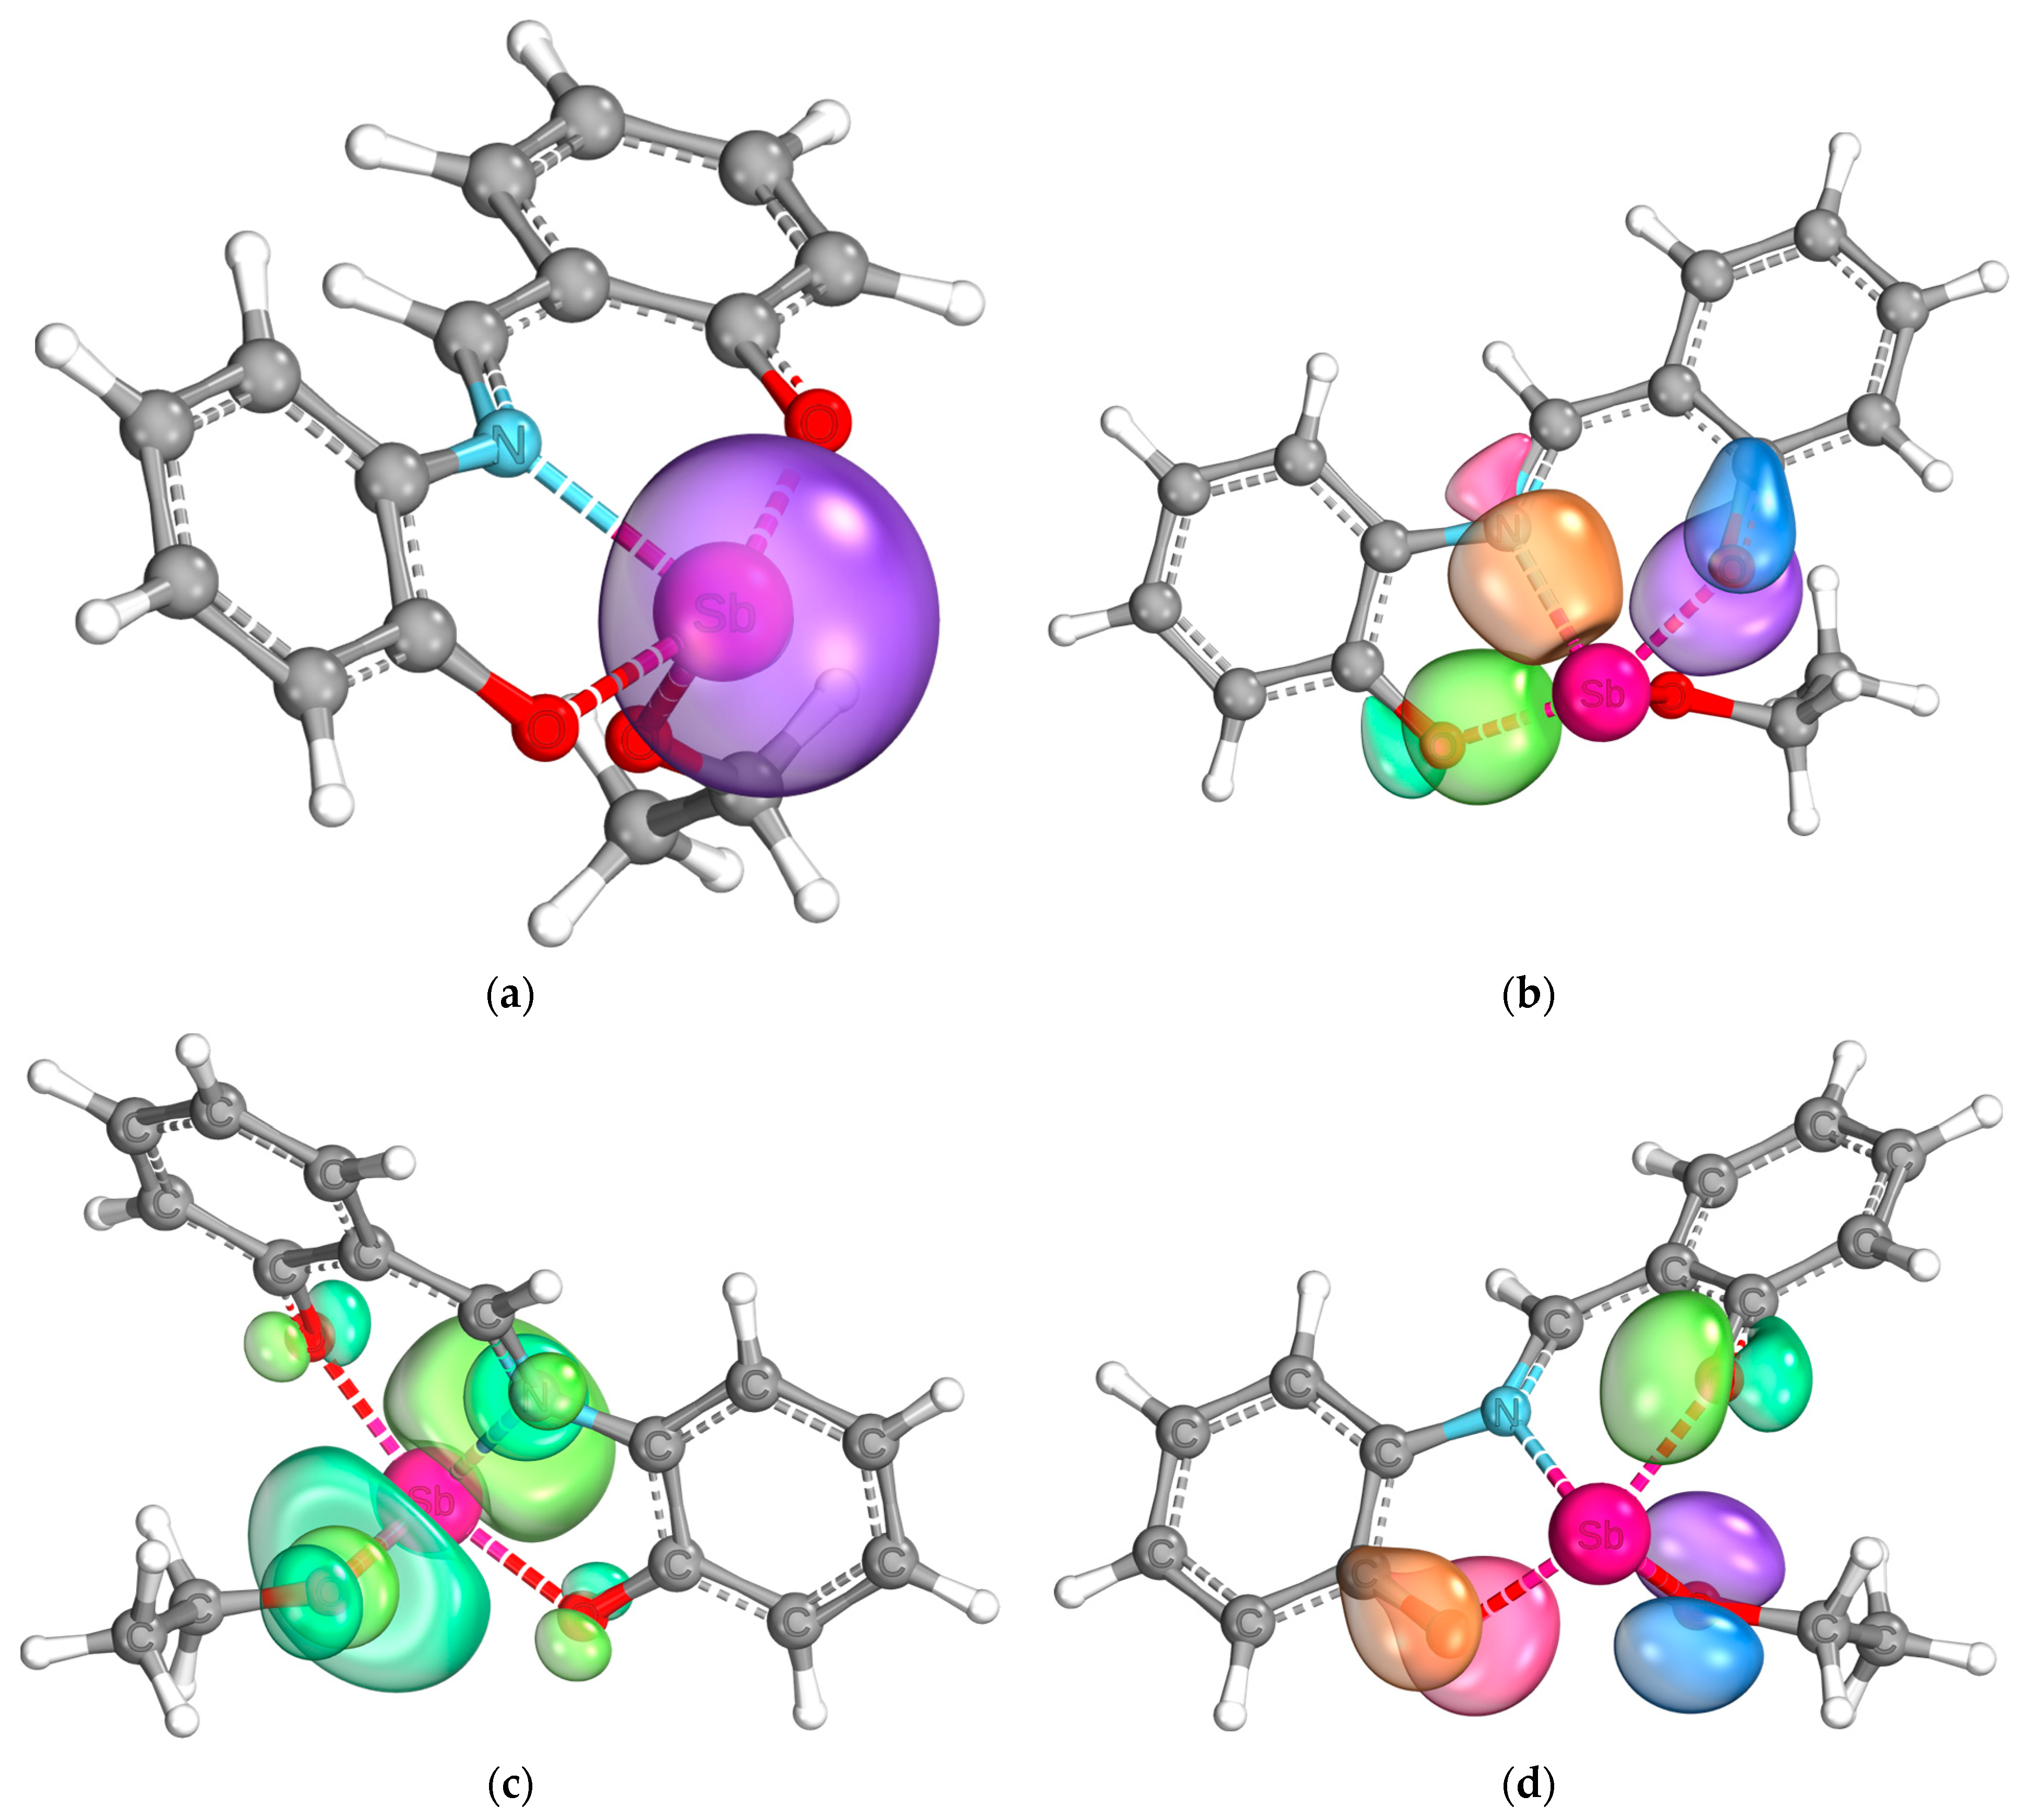
For further understanding of the bond situation in the complex, the IBOs [41] were calculated. The analysis shows a pronounced s-character of the lone pair of the antimony center (Figure 9a). Furthermore, the binding orbitals of the bonds between the heteroatoms of the ligands and the antimony center could be shown (Figure 9b). Both the Sb-N and Sb-O bonds show a covalent character, as expected from the molecular structure. It is interesting to note that they are not fully located between the two bonding partners but are slightly delocalized towards the neighbored carbon atoms. A similar behavior is shown by a pair of free electrons at each of the oxygen atoms of the tridentate ligand, as shown in Figure 9d. They are not fully located at the oxygen atoms, but delocalized between the antimony center, the oxygen atom, and the neighboring carbon atom. The electron pairs of the oxygen atom of the ethoxy moiety do not show such behavior. These results indicate a delocalization of electron density over the antimony center, which would explain the findings of the UV/Vis analyses. The electron system between the two phenyl rings in the ligand backbone is broken, which is also confirmed by this analysis (see Figures S5 and S6 in the Supplementary Material). Lastly, the lowest unoccupied intrinsic binding orbital is shown in Figure 9c in the bottom left. It is mainly localized at the antimony center, which speaks for the possibility of a nucleophilic attack on the antimony atom.

Figure 9.
Intrinsic bond orbitals of the lone pair of the antimony center (a), the bond orbitals between the antimony center and the heteroatoms of the tridentate ligand (b), the lowest unoccupied intrinsic bond orbital (c), and one lone pair each of the oxygen atoms (d).
3.4. Atoms in Molecules (AIM) Analysis
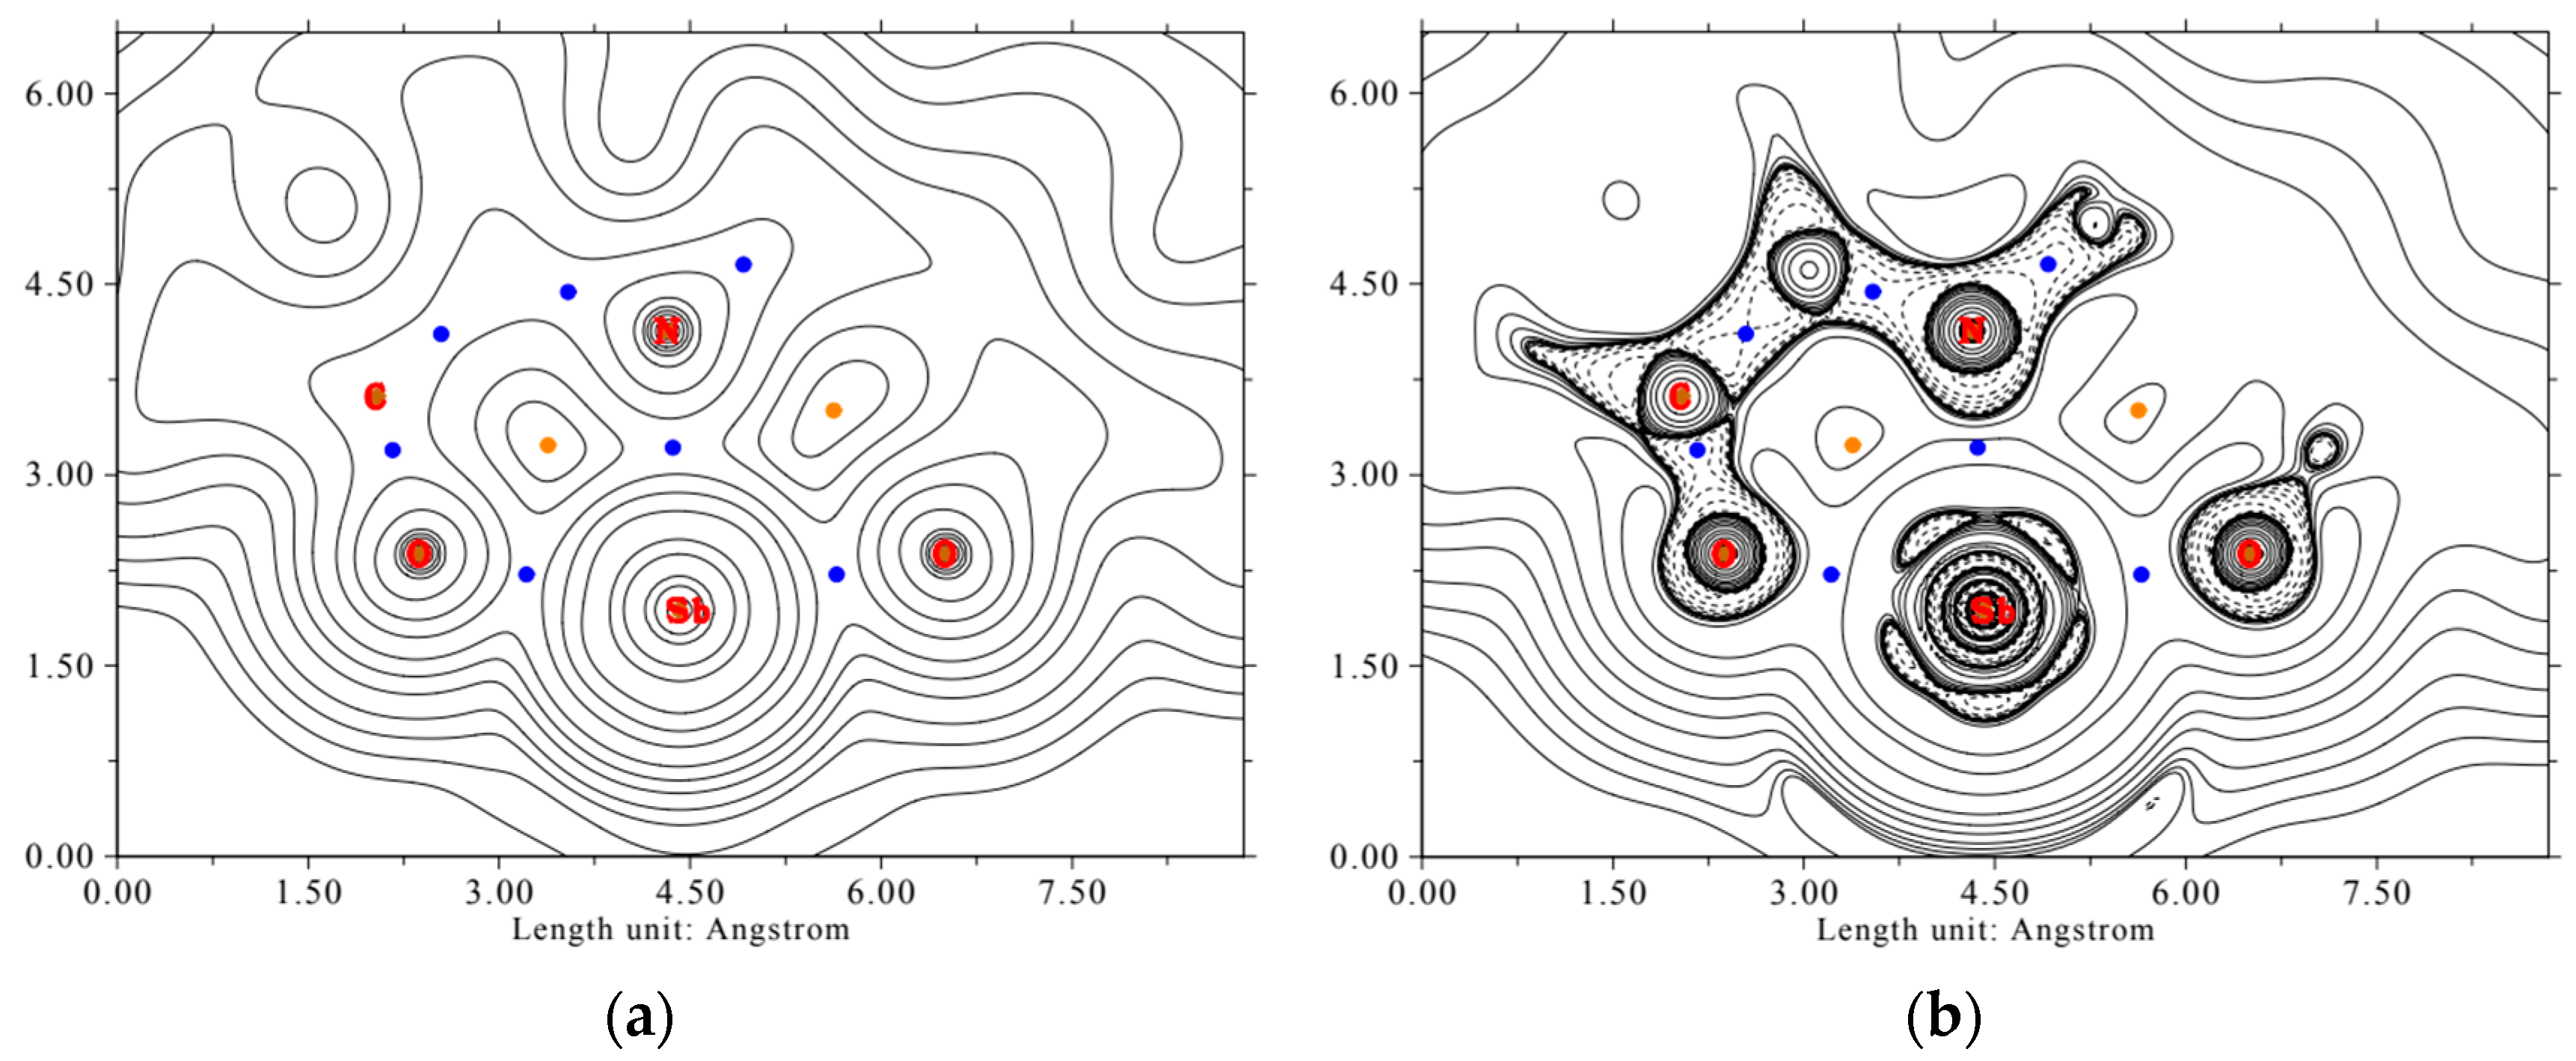
For the AIM analysis, the electron density map and the Laplacian of the electron density in the ONO plane are calculated and shown in Figure 10.
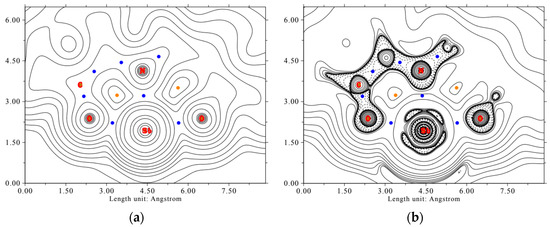
Figure 10.
Electron density map (a) and Laplacian of the electron density (b) of the complex LSb in the O1-N-O2 plane. Bond critical points are shown in blue, ring critical points in orange. Full lines indicate positive values, dashed lines indicate negative values. The values of the contour lines for the electron density map (in e a0−3) and for the Laplacian of the electron density map (in Eh e−1) are 0.001, 0.002, 0.004, 0.008, 0.02, 0.04, 0.08, 0.2, 0.4, 0.8, 2, 4, 8, 20, 40, 80, 200, 400, and 800.
It is recognizable that the electron density around the antimony center is nearly spherical, indicating the s-character of the free electron pair. In the direction of the heteroatoms of the tridentate ligand, a depletion of electron density can be seen. This indicates polar shared bonds. This bond type is confirmed by the values of the bond critical points for the electron density ρ(r), the Lagrangian kinetic energy G(r), the Laplacian of electron density L(r), and the energy density H(r). These are shown in Table 3.
Table 3.
Parameters for the electron density ρ(r), the Lagrangian kinetic energy G(r), the Laplacian of electron density L(r), and the energy density H(r) for the determination of the bond types of LSb according to the criteria defined by Macchi et al. [65].
4. Conclusions
In this work, a new antimony complex with an asymmetric tridentate Schiff-base ligand was synthesized. The molecular structure in solution and as a solid was characterized using various analytical methods. NMR measurements indicate the presence of three similar species in solution, which are probably oxo-bridged dimers and oligomers. The batch product is pure LSb, as it was demonstrated with TLC. The IR, Raman, and UV/Vis measurements show the presence of the π-electron system of the ligand and the disubstituted nature of the both phenyl rings. All spectra are in good consistency with the calculated spectra. Additionally, they show the presence of a C=N-group. The single crystal structure analysis reveals the molecular structure of LSb. In the solid state, the antimony atom is coordinatively saturated by the oxygen atoms of the neighboring complexes, similar to what was described in [53]. The molecular structure shows the elongation of the Sb-O bonds between the antimony center and the oxygen atoms of the tridentate ligand. The Sb-N bond is only slightly larger than the sum of covalent radii and a lot shorter than Van der Waals radii, indicating a covalent bond. This observation was confirmed by quantum chemical calculations. The calculation of the IBOs show the covalent character of the Sb-N and Sb-O bonds, whereas the AIM analysis confirms the polar covalent character through the properties of the bond critical points. Furthermore, the s-character of the lone pair of the antimony center was demonstrated by the IBO analysis. These analyses also show that in each case one lone pair of the oxygen atoms of the tridentate ligand is slightly delocalized over the antimony center, the oxygen atom, and the neighbored carbon atom, which indicates a large, delocalized electron system. In the solid state, the antimony center is hexacoordinated through intermolecular contacts. In solution, this behavior cannot be assumed, and therefore the complex should have an unsaturated character.
In further work, we will try to crystallize oxo-bridged dimers of LSb and investigate the reactivity of LSb and similar compounds in the view of their unsaturated character, which makes them interesting, e.g., for applications in catalysis.
Supplementary Materials
The following supporting information can be downloaded at: https://www.mdpi.com/article/10.3390/cryst13091300/s1, Table S1: Used chemicals under specification of the manufacturer, purity, and type of purification. Figure S1: The 1H (top) and 13C (bottom) NMR spectra of the compound Sb(OEt)3. Figure S2: The 1H (top) and 13C (bottom) NMR spectra of the compound H2L. Figure S3: The 1H (top) and 13C (bottom) NMR spectra of the compound LSb. Figure S4: Raman spectra of the ligand H2L (top) and the complex LSb (bottom). Red lines show the measured spectra, blue lines the calculated ones. Wavelengths of the calculated spectra are scaled according to Katsyuba et al. [51]. The values at the y axis apply to the experimental data. Figure S5: Intrinsic bond orbitals of the aromatic orbitals of the compound LSb. Figure S6: Intrinsic bond orbital of the C=N π-bond of the compound LSb. Figure S7: TLC plates. Left with the complex LSb and right with the complex after hydrolysis in acetonitrile (with drops of water). The complex is pure, as can be seen on the left TLC plate. No migration of the hydrolysis product occurs, as can be seen on the right TLC plate. Figure S8: XRD analysis of the pure complex LSb from storing under Ar atmosphere, the diffractogram generated from single crystal structure, and the powder of LSb after one night in humid air. Differences between the pure LSb and the calculated diffractogram originate from temperature differences. Section S7: Synthesis of Sb(OEt)3 and H2L.
Author Contributions
S.K.—Conceptualization, Data Curation, Formal Analysis, Investigation, Methodology, Visualization, Writing—Original Draft. U.B.—Data Curation, Formal Analysis, Investigation, Visualization, Writing—Original Draft. M.H.—Project Administration, Supervision, Writing—Original Draft. All authors have read and agreed to the published version of the manuscript.
Funding
Deutsche Forschungsgemeinschaft (DFG).(Grant Number 397252409).
Data Availability Statement
The datasets generated during and/or analyzed during the current study are available from the corresponding author on reasonable request.
Acknowledgments
The authors thank TU Bergakademie Freiberg (Freiberg, Germany) for financial support. B. Kutzner and E. Brendler (Institut für Analytische Chemie, TU Bergakademie Freiberg) are acknowledged for help with the NMR measurements. E. Schumann (Institut für Physikalische Chemie, TU Bergakademie Freiberg) is acknowledged for his help with powder XRD. The authors acknowledge computing time on the compute cluster of the Faculty of Mathematics and Computer Science of Technische Universität Bergakademie Freiberg, operated by the computing center (URZ) and funded by Deutsche Forschungsgemeinschaft (DFG) under DFG grant number 397252409.
Conflicts of Interest
The authors declare no conflict of interest.
References
- Elschenbroich, C. Organometallchemie (Teubner Studienbücher Chemie) (German Edition); Vieweg + Teubner Verlag: Wiesbaden, Germany, 2003; p. 746. ISBN 9783835101678. [Google Scholar]
- Ke, I.-S.; Myahkostupov, M.; Castellano, F.N.; Gabbaï, F.P. Stibonium Ions for the Fluorescence Turn-on Sensing of F− in Drinking Water at Parts Per Million Concentrations. J. Am. Chem. Soc. 2012, 134, 15309–15311. [Google Scholar] [CrossRef] [PubMed]
- Hirai, M.; Gabbaï, F.P. Lewis Acidic Stiborafluorenes for the Fluorescence Turn-on Sensing of Fluoride in Drinking Water at Ppm Concentrations. Chem. Sci. 2014, 5, 1886–1893. [Google Scholar] [CrossRef]
- Li, L.; Zhang, Y.; Li, Y.; Duan, Y.; Qian, Y.; Zhang, P.; Guo, Q.; Ding, J. Polymeric Membrane Fluoride-Selective Electrodes Using Lewis Acidic Organo-Antimony(V) Compounds as Ionophores. ACS Sens. 2020, 5, 3465–3473. [Google Scholar] [CrossRef]
- Jones, J.S.; Gabbaï, F.P. Coordination- and Redox-Noninnocent Behavior of Ambiphilic Ligands Containing Antimony. Acc. Chem. Res. 2016, 49, 857–867. [Google Scholar] [CrossRef] [PubMed]
- Akiba, K.-Y.; Ohnari, H.; Ohkata, K. Oxidation of α-Hydroxyketones with Triphenylantimony Dibromide and Its Catalytic Cycle. Chem. Lett. 1985, 14, 1577–1580. [Google Scholar] [CrossRef]
- Huang, Y.; Shen, Y.; Chen, C. Bromodiphenylstibine-Mediated Oxidation of Benzyl Alcohols by Bromine. Synthesis 1985, 1985, 651–652. [Google Scholar] [CrossRef]
- Yang, M.; Tofan, D.; Chen, C.-H.; Jack, K.M.; Gabbaï, F.P. Digging the Sigma-Hole of Organoantimony Lewis Acids by Oxidation. Angew. Chem. Int. Ed. 2018, 57, 13868–13872. [Google Scholar] [CrossRef]
- Yang, M.; Pati, N.; Bélanger-Chabot, G.; Hirai, M.; Gabbaï, F.P. Influence of the Catalyst Structure in the Cycloaddition of Isocyanates to Oxiranes Promoted by Tetraarylstibonium Cations. Dalton Trans. 2018, 47, 11843–11850. [Google Scholar] [CrossRef]
- Shraim, A.M.; Salih, K.S.M.; Al-Soufi, R.E.; Al-Mhini, S.R.; Ahmad, M.I.; Warad, I. Synthesis of Novel Aqua 4-NNNO/Cu(II) Complexes as Rapid and Selective Oxidative Catalysts for O-Catechol: Fluorescence, Spectral, Chromotropism and Thermal Analyses. Crystals 2021, 11, 1072. [Google Scholar] [CrossRef]
- Gericke, R. Neuartige Pnictogen-Ruthenium-Komplexe Mit Bidentaten (O,N)-Brückenliganden. Ph.D. Thesis, TU Bergakademie Freiberg, Freiberg, Germany, 2018. [Google Scholar]
- Hovenkamp, S.G. Kinetic Aspects of Catalyzed Reactions in the Formation of Poly(ethylene Terephthalate). J. Polym. Sci. Part A-1 Polym. Chem. 1971, 9, 3617–3625. [Google Scholar] [CrossRef]
- Nomura, R.; Nakano, T.; Yamada, Y.; Matsuda, H. Facile One-Pot Amidation of Carboxylic Acids by Amines Catalyzed by Triphenylstibine Oxide/tetraphosphorus Decasulfide (Ph3SbO/P4S10). J. Org. Chem. 1991, 56, 4076–4078. [Google Scholar] [CrossRef]
- Marczenko, K.M.; Zurakowski, J.A.; Bamford, K.L.; MacMillan, J.W.M.; Chitnis, S.S. Hydrostibination. Angew. Chem. Int. Ed. 2019, 58, 18096–18101. [Google Scholar] [CrossRef] [PubMed]
- Tofan, D.; Gabbaï, F.P. Fluorinated Antimony(V) Derivatives: Strong Lewis Acidic Properties and Application to the Complexation of Formaldehyde in Aqueous Solutions. Chem. Sci. 2016, 7, 6768–6778. [Google Scholar] [CrossRef] [PubMed]
- Lipshultz, J.M.; Li, G.; Radosevich, A.T. Main Group Redox Catalysis of Organopnictogens: Vertical Periodic Trends and Emerging Opportunities in Group 15. J. Am. Chem. Soc. 2021, 143, 1699–1721. [Google Scholar] [CrossRef] [PubMed]
- Abbenseth, J.; Goicoechea, J.M. Recent Developments in the Chemistry of Non-Trigonal Pnictogen Pincer Compounds: From Bonding to Catalysis. Chem. Sci. 2020, 11, 9728–9740. [Google Scholar] [CrossRef]
- Siedzielnik, M.; Pantazis, D.A.; Bruniecki, J.; Kaniewska-Laskowska, K.; Dołęga, A. The Reactivity of the Imine Bond Within Polynuclear Nickel(II) Complexes. Crystals 2021, 11, 512. [Google Scholar] [CrossRef]
- Novoa-Ramírez, C.S.; Silva-Becerril, A.; Olivera-Venturo, F.L.; García-Ramos, J.C.; Flores-Alamo, M.; Ruiz-Azuara, L. N/N Bridge Type and Substituent Effects on Chemical and Crystallographic Properties of Schiff-Base (Salen/Salphen) Niii Complexes. Crystals 2020, 10, 616. [Google Scholar] [CrossRef]
- Baul, T.S.B.; Chaurasiya, A.; Rabha, M.; Khatua, S.; Lyčka, A.; Schollmeyer, D.; Jurkschat, K. Diorganotin Compounds Containing -Aminoacidato Schiff Base Ligands Derived from Functionalized 2-Hydroxy-5-(Aryldiazenyl)benzaldehyde. Syntheses, Structures and Sensing of Hydrogen Sulfide. Eur. J. Inorg. Chem. 2020, 2020, 1803–1813. [Google Scholar] [CrossRef]
- Böhme, U.; Wiesner, S.; Günther, B. Easy Access to Chiral Penta- and Hexacoordinate Silicon Compounds. Inorg. Chem. Commun. 2006, 9, 806–809. [Google Scholar] [CrossRef]
- Paul, L.E.H.; Foehn, I.C.; Schwarzer, A.; Brendler, E.; Böhme, U. Salicylaldehyde-(2-Hydroxyethyl)imine—A Flexible Ligand for Group 13 and 14 Elements. Inorg. Chim. Acta 2014, 423, 268–280. [Google Scholar] [CrossRef]
- Schwarzer, S.; Böhme, U.; Fels, S.; Günther, B.; Brendler, E. (S)-N-[(2-Hydroxynaphthalen-1-Yl)methylidene]valine—A Valuable Ligand for the Preparation of Chiral Complexes. Inorg. Chim. Acta 2018, 483, 136–147. [Google Scholar] [CrossRef]
- Warncke, G.; Böhme, U.; Günther, B.; Kronstein, M. Racemization Versus Retention of Chiral Information During the Formation of Silicon and Tin Complexes with Chiral Schiff Base Ligands. Polyhedron 2012, 47, 46–52. [Google Scholar] [CrossRef]
- Soroceanu, A.; Bargan, A. Advanced and Biomedical Applications of Schiff-Base Ligands and Their Metal Complexes: A Review. Crystals 2022, 12, 1436. [Google Scholar] [CrossRef]
- Nath, M.; Saini, P.K. Chemistry and Applications of Organotin(iv) Complexes of Schiff Bases. Dalton Trans. 2011, 40, 7077. [Google Scholar] [CrossRef]
- Sanmartín-Matalobos, J.; García-Deibe, A.; Zarepour-Jevinani, M.; Aboal-Somoza, M.; Bermejo-Barrera, P.; Fondo, M. Exploring the Chelating Potential of an Easily Synthesized Schiff Base for Copper Sensing. Crystals 2020, 10, 235. [Google Scholar] [CrossRef]
- Kamaal, S.; Mehkoom, M.; Muslim, M.; Afzal, S.M.; Alarifi, A.; Afzal, M.; Alowais, A.; Muddassir, M.; Albalwi, A.N.; Ahmad, M. Crystal Structure, Topological and Hirshfeld Surface Analysis of a Zn(II) Zwitterionic Schiff Base Complex Exhibiting Nonlinear Optical (NLO) Properties Using Z-Scan Technique. Crystals 2021, 11, 508. [Google Scholar] [CrossRef]
- You, Z.; Luo, Y.; Herringer, S.; Li, Y.; Decurtins, S.; Krämer, K.W.; Liu, S.-X. Formation of Tetranuclear Nickel(II) Complexes with Schiff-Bases: Crystal Structures and Magnetic Properties. Crystals 2020, 10, 592. [Google Scholar] [CrossRef]
- Raptopoulou, C.P. Heterometallic Complexes Containing the NiII-LnIII-NiII Moiety—Structures and Magnetic Properties. Crystals 2020, 10, 1117. [Google Scholar] [CrossRef]
- Dermitzaki, D.; Panagiotopoulou, A.; Pissas, M.; Sanakis, Y.; Psycharis, V.; Raptopoulou, C.P. Synthesis, Crystal Structures and Magnetic Properties of Trinuclear {Ni2Ln} (LnIII = Dy, Ho) and {Ni2Y} Complexes with Schiff Base Ligands. Crystals 2022, 12, 95. [Google Scholar] [CrossRef]
- Sharma, P.; Cabrera, A.; Singh, S.; Jha, N.K. Schiff Base Complexes of Antimony: A Review. Main Group Met. Chem. 1997, 20, 551–566. [Google Scholar] [CrossRef]
- Stephan, D.W.; Erker, G. Frustrated Lewis Pair Chemistry: Development and Perspectives. Angew. Chem. Int. Ed. 2015, 54, 6400–6441. [Google Scholar] [CrossRef]
- Stephan, D.W. Discovery of Frustrated Lewis Pairs: Intermolecular FLPs for Activation of Small Molecules. In Topics in Current Chemistry; Springer: Berlin/Heidelberg, Germany, 2012; pp. 1–44. [Google Scholar] [CrossRef]
- Greb, L.; Ebner, F.; Ginzburg, Y.; Sigmund, L.M. Element-Ligand Cooperativity with p-Block Elements. Eur. J. Inorg. Chem. 2020, 2020, 3030–3047. [Google Scholar] [CrossRef]
- Arduengo, A.J.; Stewart, C.A.; Davidson, F.; Dixon, D.A.; Becker, J.Y.; Culley, S.A.; Mizen, M.B. The Synthesis, Structure, and Chemistry of 10-Pn-3 Systems: Tricoordinate Hypervalent Pnicogen Compounds. J. Am. Chem. Soc. 1987, 109, 627–647. [Google Scholar] [CrossRef]
- Stewart, C.A.; Harlow, R.L.; Arduengo, A.J. Chemistry and Structure of the First 10-Sb-3 Species. J. Am. Chem. Soc. 1985, 107, 5543–5544. [Google Scholar] [CrossRef]
- Neese, F. Software Update: The ORCA Program system—Version 5.0. WIREs Comput. Mol. Sci. 2022, 12, e1606. [Google Scholar] [CrossRef]
- Brandenburg, J.G.; Bannwarth, C.; Hansen, A.; Grimme, S. B97-3c: A Revised Low-Cost Variant of the B97-D Density Functional Method. J. Chem. Phys. 2018, 148, 064104. [Google Scholar] [CrossRef] [PubMed]
- Barone, V.; Cossi, M. Quantum Calculation of Molecular Energies and Energy Gradients in Solution by a Conductor Solvent Model. J. Phys. Chem. A 1998, 102, 1995–2001. [Google Scholar] [CrossRef]
- Knizia, G. Intrinsic Atomic Orbitals: An Unbiased Bridge Between Quantum Theory and Chemical Concepts. J. Chem. Theory Comput. 2013, 9, 4834–4843. [Google Scholar] [CrossRef]
- Adamo, C.; Barone, V. Toward Reliable Density Functional Methods without Adjustable Parameters: The PBE0 Model. J. Chem. Phys. 1999, 110, 6158–6170. [Google Scholar] [CrossRef]
- Perdew, J.P.; Ernzerhof, M.; Burke, K. Rationale for Mixing Exact Exchange with Density Functional Approximations. J. Chem. Phys. 1996, 105, 9982–9985. [Google Scholar] [CrossRef]
- Weigend, F.; Ahlrichs, R. Balanced Basis Sets of Split Valence, Triple Zeta Valence and Quadruple Zeta Valence Quality for H to Rn: Design and Assessment of Accuracy. Phys. Chem. Chem. Phys. 2005, 7, 3297. [Google Scholar] [CrossRef] [PubMed]
- UVVis Spectroscopy. Available online: https://www.orcasoftware.de/tutorials_orca/spec/UVVis.html (accessed on 24 July 2023).
- Becke, A.D. Density-Functional Thermochemistry. III. the Role of Exact Exchange. J. Chem. Phys. 1993, 98, 5648–5652. [Google Scholar] [CrossRef]
- Stephens, P.J.; Devlin, F.J.; Chabalowski, C.F.; Frisch, M.J. Ab Initio Calculation of Vibrational Absorption and Circular Dichroism Spectra Using Density Functional Force Fields. J. Phys. Chem. 1994, 98, 11623–11627. [Google Scholar] [CrossRef]
- Vosko, S.H.; Wilk, L.; Nusair, M. Accurate Spin-Dependent Electron Liquid Correlation Energies for Local Spin Density Calculations: A Critical Analysis. Can. J. Phys. 1980, 58, 1200–1211. [Google Scholar] [CrossRef]
- Herbig, M. Reaktivität Von CO2 Gegenüber Si-N-Bindungen. Ph.D. Thesis, TU Bergakademie Freiberg, Freiberg, Germany, 2020. [Google Scholar]
- Stoe & Cie GmbH, X-RED and X-AREA, Version 1.53 and Version 1.55; Stoe & Cie GmbH: Darmstadt, Germany, 2009.
- Sheldrick, G.M. A Short History of SHELX. Acta Crystallogr. Sect. A: Found. Crystallogr. 2007, 64, 112–122. [Google Scholar] [CrossRef]
- Sheldrick, G.M. Crystal Structure Refinement with SHELXL. Acta Crystallogr. Sect. C: Struct. Chem. 2015, 71, 3–8. [Google Scholar] [CrossRef]
- Böhme, U.; Herbig, M. New Complexes of Antimony(III) with Tridentate O,E,O-Ligands (E = O, S, Se, Te, NH, NMe) Derived from N-Methyldiethanolamine. Molecules 2023, 28, 4959. [Google Scholar] [CrossRef]
- Katsyuba, S.A.; Zvereva, E.E.; Grimme, S. Fast Quantum Chemical Simulations of Infrared Spectra of Organic Compounds with the B97-3c Composite Method. J. Phys. Chem. A 2019, 123, 3802–3808. [Google Scholar] [CrossRef] [PubMed]
- Cambridge Structural Database, Verson 5.44 (April 2023). Available online: https://www.ccdc.cam.ac.uk/ (accessed on 1 June 2023).
- Vandenbergen, A.M.; Cashion, J.D.; Fallon, G.D.; West, B.O. Crystal Structures, Mössbauer Spectra and Reactivity of Sn,II Salicylideneimines. Aust. J. Chem. 1990, 43, 1559. [Google Scholar] [CrossRef]
- Noller, H. (Ed.) Values for Atomic Radii Taken from: Pauling, L. Die Natur Der Chemischen Bindung, 3rd ed.; Verl. Chemie: Weinheim/Bergstraße, Germany, 1962; Values are: R(Sb) = 1.41, r(O) = 0.66, r(N) = 0.7 Å. [Google Scholar]
- Bianca, F.D.; Rivarola, E.; Spek, A.L.; Meinema, H.A.; Noltes, J.G. Investigations on Organoantimony Compounds: XI. Triorganoantimony(V) Compounds Containing Potentially Tridentate Ligands. J. Organomet. Chem. 1973, 63, 293–300. [Google Scholar] [CrossRef]
- Böhme, U.; Günther, B. Five and Six-Coordinate Silicon Complexes with an O,N,O′-Chelating Ligand Derived from O-Hydroxyacetophenone–N-(2-Hydroxyethyl)imine. Inorg. Chem. Commun. 2007, 10, 482–484. [Google Scholar] [CrossRef]
- Böhme, U.; Foehn, I.C. Two Modifications of a Five-Coordinate Silicon Complex. Acta Crystallogr. Sect. C Cryst. Struct. Commun. 2007, 63, o613–o616. [Google Scholar] [CrossRef] [PubMed]
- Schwarzer, A.; Paul, L.E.H.; Böhme, U. Enantiotropic Phase Transition in a Binuclear Tin Complex with an O,N,O-Tridentate Ligand. Acta Crystallogr. Sect. C Cryst. Struct. Commun. 2013, 69, 1336–1339. [Google Scholar] [CrossRef]
- Values for Van der Waals-radii taken from: Mantina, M.; Chamberlin, A.C.; Valero, R.; Cramer, C.J.; Truhlar, D.G. Consistent Van Der Waals Radii for the Whole Main Group. J. Phys. Chem. A 2009, 113, 5806–5812, Values are: R(Sb) = 2.06, r(O) = 1.52. [Google Scholar] [CrossRef]
- Ketkaew, R.; Tantirungrotechai, Y.; Harding, P.; Chastanet, G.; Guionneau, P.; Marchivie, M.; Harding, D.J. OctaDist: A Tool for Calculating Distortion Parameters in Spin Crossover and Coordination Complexes. Dalton Trans. 2021, 50, 1086–1096. [Google Scholar] [CrossRef]
- Macchi, P.; Proserpio, D.M.; Sironi, A. Experimental Electron Density in a Transition Metal Dimer:0.167em Metal-Metal and Metal-Ligand Bonds. J. Am. Chem. Soc. 1998, 120, 13429–13435, : , 2015; p. 914. [Google Scholar] [CrossRef]
- Schwetlick, K. Organikum, Organisch-Chemisches Grundpraktikum, 24. Aufl.; Wiley-VCH: Weinheim, Germany, 2015; p. 914. [Google Scholar]

Disclaimer/Publisher’s Note: The statements, opinions and data contained in all publications are solely those of the individual author(s) and contributor(s) and not of MDPI and/or the editor(s). MDPI and/or the editor(s) disclaim responsibility for any injury to people or property resulting from any ideas, methods, instructions or products referred to in the content. |
© 2023 by the authors. Licensee MDPI, Basel, Switzerland. This article is an open access article distributed under the terms and conditions of the Creative Commons Attribution (CC BY) license (https://creativecommons.org/licenses/by/4.0/).