Next Article in Journal
Structural Analysis and Reactivity Insights of (E)-Bromo-4-((4-((1-(4-chlorophenyl)ethylidene)amino)-5-phenyl-4H-1,2,4-triazol-3-yl)thio)-5-((2-isopropylcyclohexyl)oxy) Furan-2(5H)-one: A Combined Approach Using Single-Crystal X-ray Diffraction, Hirshfeld Surface Analysis, and Conceptual Density Functional Theory
Article

Microstructure and Defect Analysis of 17-4PH Stainless Steel Fabricated by the Bound Metal Deposition Additive Manufacturing Technology

Department of Industrial Engineering and Mathematical Sciences (DIISM), Polytechnic University of Marche, Via Brecce Bianche 12, 60131 Ancona, Italy
*
Author to whom correspondence should be addressed.
Crystals 2023, 13(9), 1312; https://doi.org/10.3390/cryst13091312
Submission received: 21 July 2023 / Revised: 18 August 2023 / Accepted: 22 August 2023 / Published: 28 August 2023
(This article belongs to the Special Issue Microstructure and Mechanical Behaviour of Structural Materials)

Abstract

:
Metal additive manufacturing (AM) technologies can be classified according to the physical process involving the raw material as fusion-based and solid-state processes. The latter includes sintering-based technologies, which are aligned with conventional fabrication techniques, such as metal injection molding (MIM), and take advantage of the freeform fabrication of the initial green part. In the present work, 17-4PH stainless steel samples were fabricated by material extrusion, or rather bound metal deposition (BMD), a solid-state AM technology. The powder-based raw material was characterized together with samples fabricated using different angular infill strategies. By coupling different characterization technologies, it was possible to identify and classify major properties and defects of the raw material and the fabricated samples. In addition, microstructural modifications were found to be linked with the mesostructural defects typical of the BMD solid-state additive manufacturing technology applied to metals.

1. Introduction

Additive manufacturing (AM) is a class of freeform fabrication technologies based on layer-wise material addition [1]. The ASTM F2792 [2] regulation defines AM as “a process of joining materials to make objects from 3D model data, usually layer upon layer, as opposed to subtractive manufacturing methodologies” and the key of additive manufacturing and its layer-based approach is that material can be placed only where it is needed in a component. This allows for the redefining of the shape of a part by applying topology optimization and following the Design for Additive Manufacturing (DfAM) principles [3,4,5]. This will have a crucial impact not only on the performance of the final part but also on the cost and the sustainability of AM adoption by also reducing the manufacturing waste [3,5,6,7,8].
Among a large number of available metal AM technologies, beam-based ones rely on the complete melting of the feedstock [4,5,6], which can be in the form of micrometric powder or wire, using different heat sources. The most popular fusion-based metal AM technologies are laser beam (LB) and electron beam (EB) powder bed fusion (PBF), or rather LB-PBF and EB-PBF. The former stands out for its high printing resolution, while the latter has a higher production speed [9,10,11].
On the other hand, solid-state AM technologies rely on the use of mechanical deformation or sintering to achieve a strong metallurgical bonding between subsequent layers of material [12]. Among the sintering-based ones, it is worth mentioning that material extrusion and binder jetting have similar features since both rely on a multistep approach based on the use of an organic binder to 3D print the desired geometry [13].
One of the latest additions to the solid-state AM technology is Bound Metal Deposition (BMD), a material extrusion process provided by the Desktop Metal (DM) Studio System, which is characterized by three fabrication steps: 3D printing, debinding, and sintering. Typically, further postprocessing actions are performed to increase the mechanical properties and the surface finishing of the fabricated part [8,10,14]. The computer-aided design model of the object must be subjected to slicing, as all the 3D-printing processes, while the DM Fabricate software allow for the definition of the BMD processing parameters, such as part orientation, number of perimeter-wall layers, number of bottom and top layers, infill pattern, and infill-pattern density. As clarified by Abe et al. [11] compared to as-designed dimensions, the software increases the as-sliced dimensions by approximately 18.6%, 18.6%, and 19.5% in the x, y, and z directions, respectively, to account for the shrinkage taking place during the final sintering step. The BMD feedstock comprises composite rods made up of a thermoplastic media (wax and polymer binder) filled with metal powder of the chosen alloy [15]. These rods are extruded by a heated nozzle having a diameter of 250 or 400 µm. Supports are fabricated using the same material but with a different printing strategy and they are separated from the surface of the object by a ceramic-interface layer deposited by an additional print head. This ceramic interface facilitates the separation between the part and the supports during the furnace sintering. During 3D printing, the alloy and the interface material are extruded onto the build plate, shaping the final 3D part (the so-called “green part”) layer by layer, according to the original and sliced geometry. Once the component is printed, the green part is placed in a tank and immersed in a proprietary DM organic solvent to dissolve most of the binder. The part resulting from the debinding process is called “the brown part”. The final step is a thermal sintering which removes the remaining binder and densifies the part by applying a thermal treatment that promotes the necking formation and the following interparticle adhesion. Postprocessing steps include the easy removal of the raft and supports, followed by machining and heat treatments (if needed) which could affect the inner porosity and/or modify the microstructure and the mechanical performance of the part [8,16]. BMD process steps are comparable to metal injection molding (MIM) ones; although both use a polymer-wax binder within green state parts and take advantage of debinding and sintering steps, the main difference between the two technologies is how the green state part is obtained. Whereas BMD performs 3D printing via material extrusion, MIM injects the build material into a mold. Therefore, BMD parts will benefit from a larger design freedom but will be characterized by a higher roughness compared to MIM parts [14,17,18].
A chromium–nickel–copper precipitation-hardened steel, 17-4PH is used in a wide range of industrial applications, including those characterized by mildly corrosive environments and high-strength requirements [11,14,19,20,21]; 17-4PH has a martensitic microstructure in the annealed condition and is further strengthened by a low-temperature heat treatment, which results in the precipitation of a copper-rich phase in the alloy. Precipitation-hardening steels are difficult to manufacture with conventional fabrication technologies and, therefore, AM has the potential to be disruptive for this class of stainless steels [22].
Currently, several 17-4PH-based filaments are available on the market and can be processed by material extrusion-based 3D printers [23,24,25], while the novelty of the BMD process stands in the use of rigid rods instead of filaments, which guarantees a higher metal-to-binder ratio. Pellegrini et al. [23] investigated the effect of two aging treatments applied on 17-4PH samples fabricated by three material extrusion technologies, such as BMD, fused filament fabrication (FFF), and atomic diffusion additive manufacturing (ADAM). Akessa [26], Bjørheim, et al. [10] and Gonzalez-Gutierrez et al. [24] fabricated specimens for tensile tests, the first two with the ADAM technology and the latter with a highly filled polymeric filament of 17-4PH; the authors attributed the high standard deviation (up to 38%) of the measured tensile data to the large number of defects and to the lack of cohesion between the layers and deposited tracks. Galati et al. [25] mainly evaluated the density, accuracy, and surface roughness of cubic and complex reference samples, fabricated by the ADAM technology. Kedziora et al. [27] performed a comparison between 316L and 17-4PH stainless steels fabricated by fused filament fabrication (FFF) and selective laser melting (SLM), in order to validate the use of FFF for the fabrication of structural parts. For this purpose, the paper focused on tensile, fatigue, and impact mechanical properties as well as the surface roughness and hardness of the fabricated samples, showing the detrimental impact of internal defects on the randomness of the results.
Most papers addressing material extrusion of metals are focused on the density and mechanical performance of the fabricated samples; therefore, the current literature lacks a study focused on the microstructural implications of process parameter variations and the related defects formation.
The goal of the present study is to give an overview of the solid-state AM technology called Bound Metal Deposition (BMD), from feedstock characterization to the final as-sintered structures fabricated with two different infill deposition strategies, in order to identify the main defects, define their nature, and classify them accordingly.

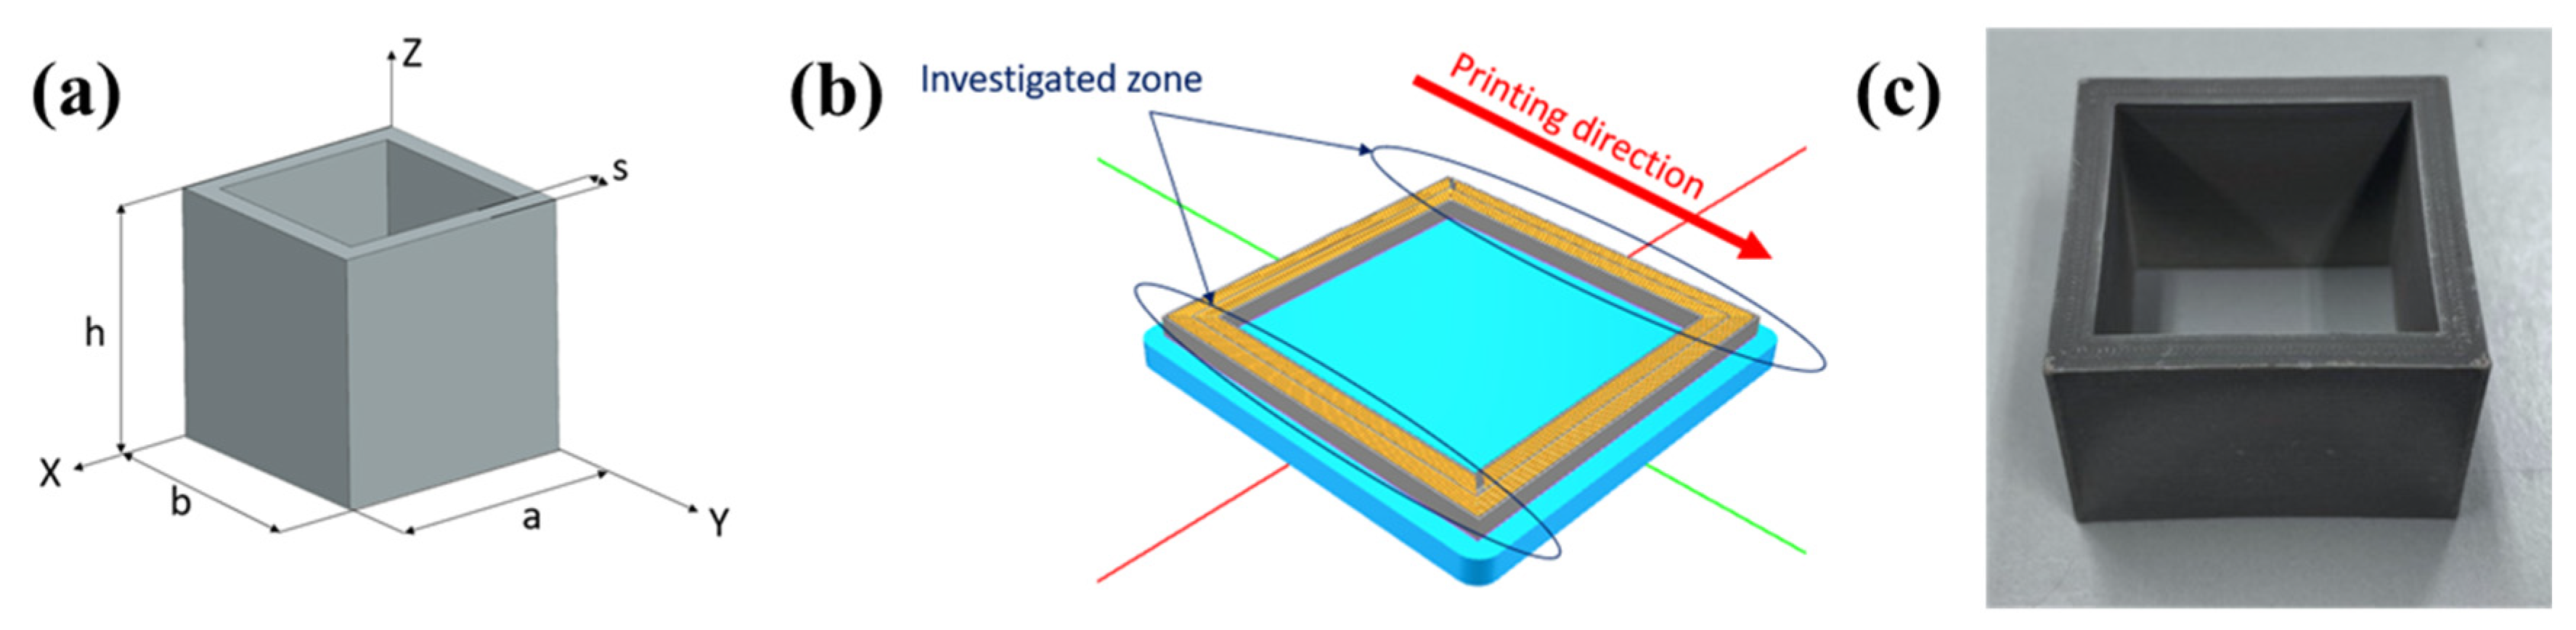
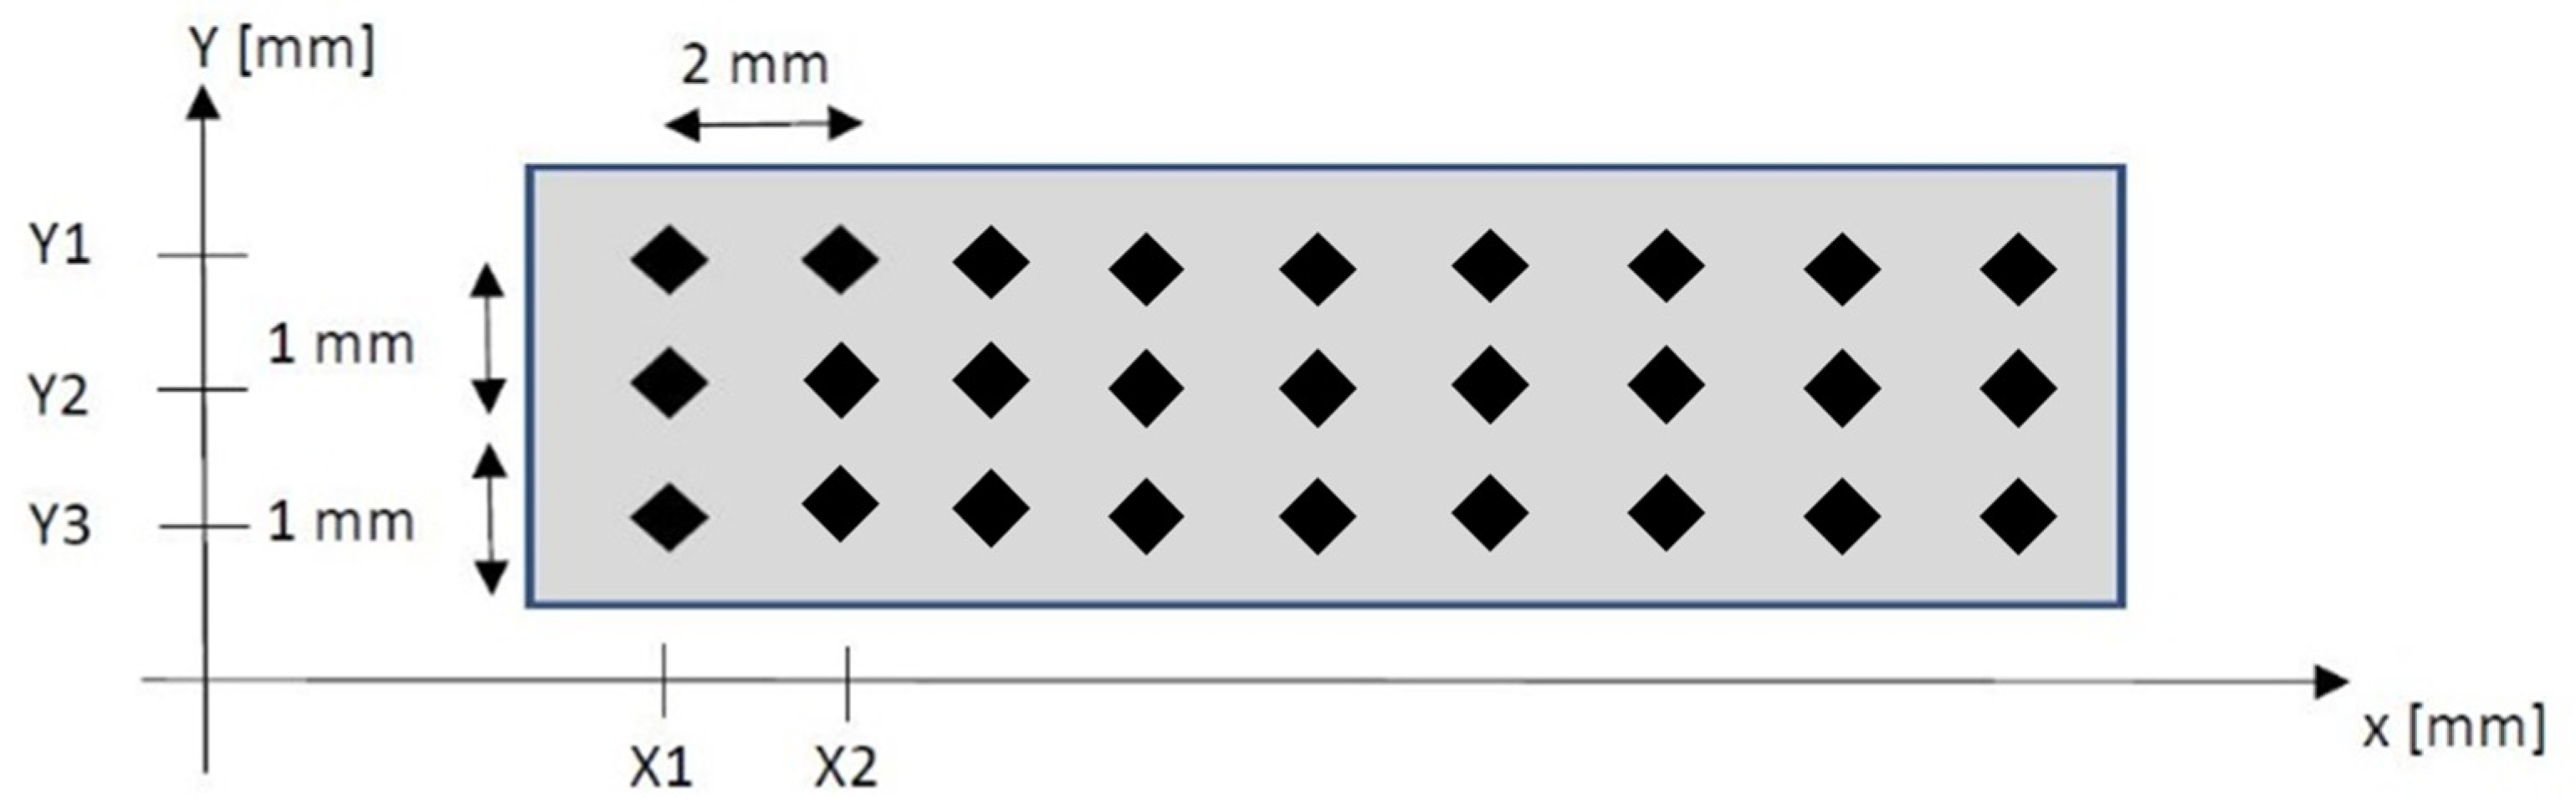
2. Materials and Methods

The feedstock material used in the BMD process is stainless steel 17-4PH micrometric powder, embedded in a polymeric binder to form composite rods. The chemical composition (wt.%) of the alloy provided by Desktop Metal [28] is reported in Table 1.
The investigated sample was fabricated in the form of a hollow square for two main reasons: (i) to maximize the success rate of solvent debinding, thermal debinding, and sintering and (ii) to simplify the fixing and cutting phases. The schematic of the 3D-printed sample is reported in Figure 1a and the indicated dimensions are as follows: h = 50 mm, s = 5 mm, a = 50 mm, b = 50 mm.
Figure 1b shows a section for the printed sample in the Fabricate software for build preparation. It is worth noting that the printing direction indicates the direction in which the printing head is moving along the single deposited layer; this direction is fixed during the 3D-printing process.
The BMD process was performed with Desktop Metal Studio System equipment, with the combination of process parameters reported in Table 2.
Two different sets of two hollow square samples were fabricated by maintaining the same processing parameters and using a different deposition strategy in terms of infill direction with respect to the 3D-printed perimeter wall (Figure 2):
  • BMD_90 sample, with a 90° deposition strategy;
  • BMD_45 sample, with a 45° deposition strategy.
As per the BMD process specifications, the samples were fabricated on top of a raft and a ceramic interface layer, which are used to hold the part during the printing process and the final sintering step. After printing, the sample (green part) was subjected to the debinding operation for a time duration of about 30 h. To eliminate a large part of the polymeric binder, the debinding process was performed with the Desktop Metal equipment where the parts are immersed in a 300 × 300 × 300 mm3 volume of solvent. After this step, the 3D-printed part becomes very fragile (brown part) since the metal-powder particles are still separated and kept together by the residual polymeric binder. The final step of the Desktop Metal process is the sintering of the brown part. The process was performed in a furnace under an inert gas atmosphere (Ar + 3%H2) and consisted of two phases, an initial thermal debinding during which the residual binder is dissolved by heat, followed by a thermal cycle (sintering), during which metal particles are finally sintered at a temperature up to 1350 °C. The total sintering time was 35 h; the first 5 h are dedicated to thermal debinding, followed by 10 h for sintering, and the remaining time for cooling.
Specimens were cut from the original part in section XY (plane parallel to the build plate) and YZ (along the growth direction) and embedded in a phenolic resin for the metallographic preparation. Samples were then ground and polished on a Struers Tegramin-20 automatic grinding machine. Mirror-polished surfaces were used to investigate the pore formation and to quantify their dimensions and distribution. For this purpose, 20 optical micrographs were collected and all the defects were characterized using the software ImageJ (version 1.53 v21) [29]. To reveal the microstructure, samples were subjected to etching by immersion in a solution of 10 mL HNO3 + 15 mL HCl + 12 mL acetic acid for 1 min and then washed with ethylic alcohol. A Leica DMi8 optical microscope was used to acquire micrographs on the mirror-polished and etched surfaces of all the samples. Phase quantification was performed on 5 micrographs acquired in a position close to the edge of the samples and 5 micrographs acquired on the core of the samples; quantification was performed according to the ASTM E562 standard [30] for the volume fraction manual point count, using the software ImageJ [29].
X-ray diffraction (XRD) patterns were acquired using a Bruker D8 Advance diffractometer operating at V = 40 kV and I = 40 mA, with a Bragg–Brentano geometry and Cu-Kα radiation. Measurements were performed on the YZ plane direction of both samples, using an angular range 2θ = 20–80° with a step size of 2θ = 0.02° and a dwell time of 2 s. Lattice parameters were extracted by Rietveld refinement performed using the Profex software (version 5.2.2) [31].
In order to fully characterize the features of the 17-4PH feedstock (composite rods) and as-built BMD samples, field-emission gun scanning electron microscopy (FEGSEM) observations were performed using a Zeiss Supra 40 microscope, equipped with a Bruker Quantax Z200 microanalysis to perform energy dispersive spectroscopy (EDS) investigations. EDS was used to analyze the chemical composition and to characterize inclusions and other defects. Backscattered electrons signal (BSE) was used for all the SEM investigations. Postacquisition statistical analysis on the SEM micrographs was performed using the ImageJ software [29]. Particle size distribution (PSD), cumulative fraction, and other representative granulometric quantities (i.e., percentiles D10, D50 D90) related to the metal-powder fraction of the rods were calculated from five SEM micrographs.
Hardness Rockwell C measurements were performed with an Ernst Hardness tester, using a load of 150 kgf. Five indentations were performed along the XY plane and five along the growth direction (YZ plane).
The punctual characterization of the mechanical response of the 3D-printed steel was performed by Vickers microhardness measurements using a REMET HX-1000 tester with a load of 300 gf and a dwell time of 10 s. Microhardness was tested by performing three systematic indentations every 2 mm 13 times in the XY plane (Figure 3) and three indentations every 2 mm 22 times in the YZ plane, in order to cover all the available space throughout the sample.

3. Results and Discussion

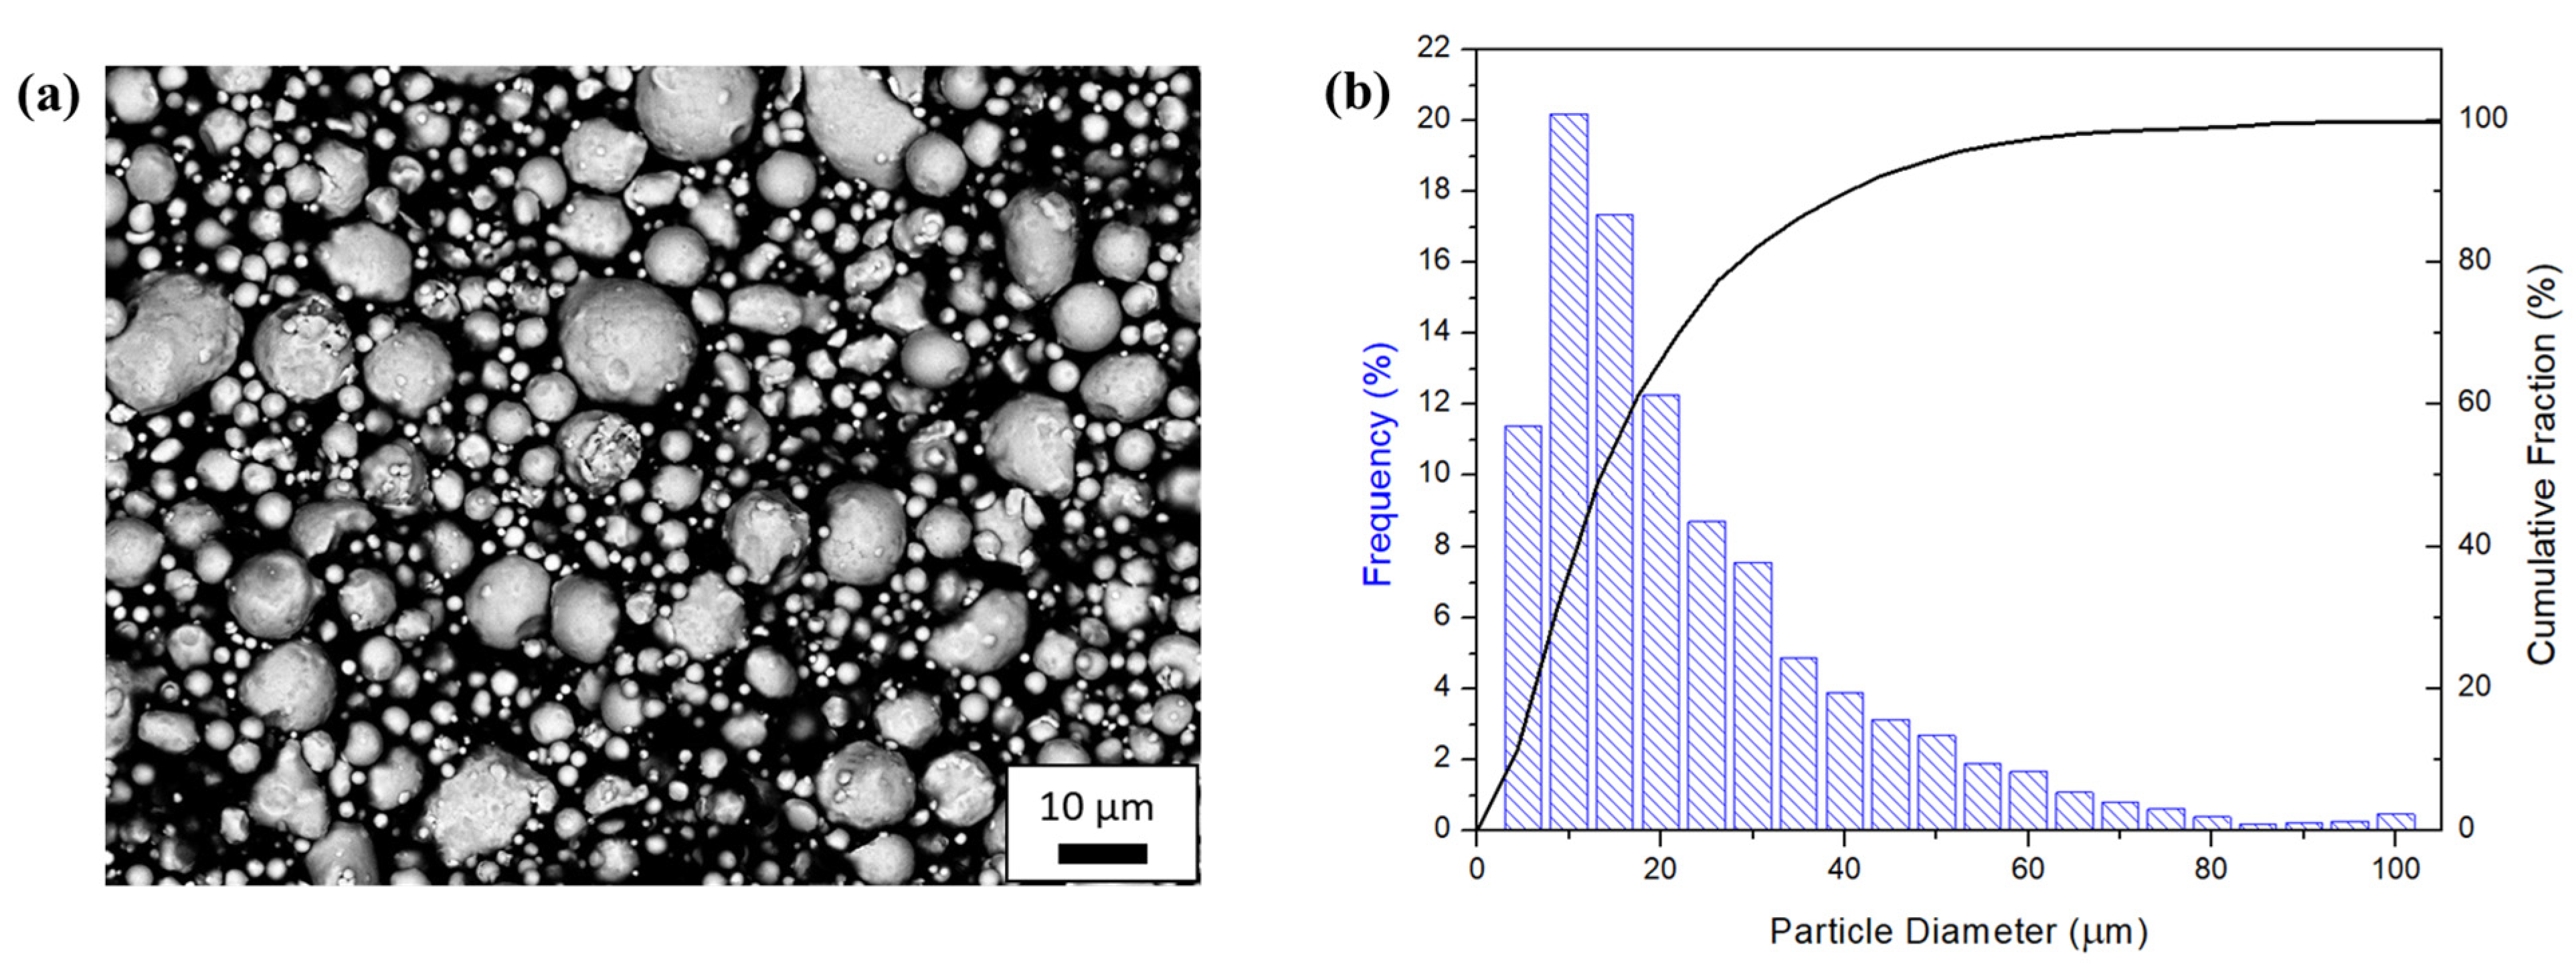
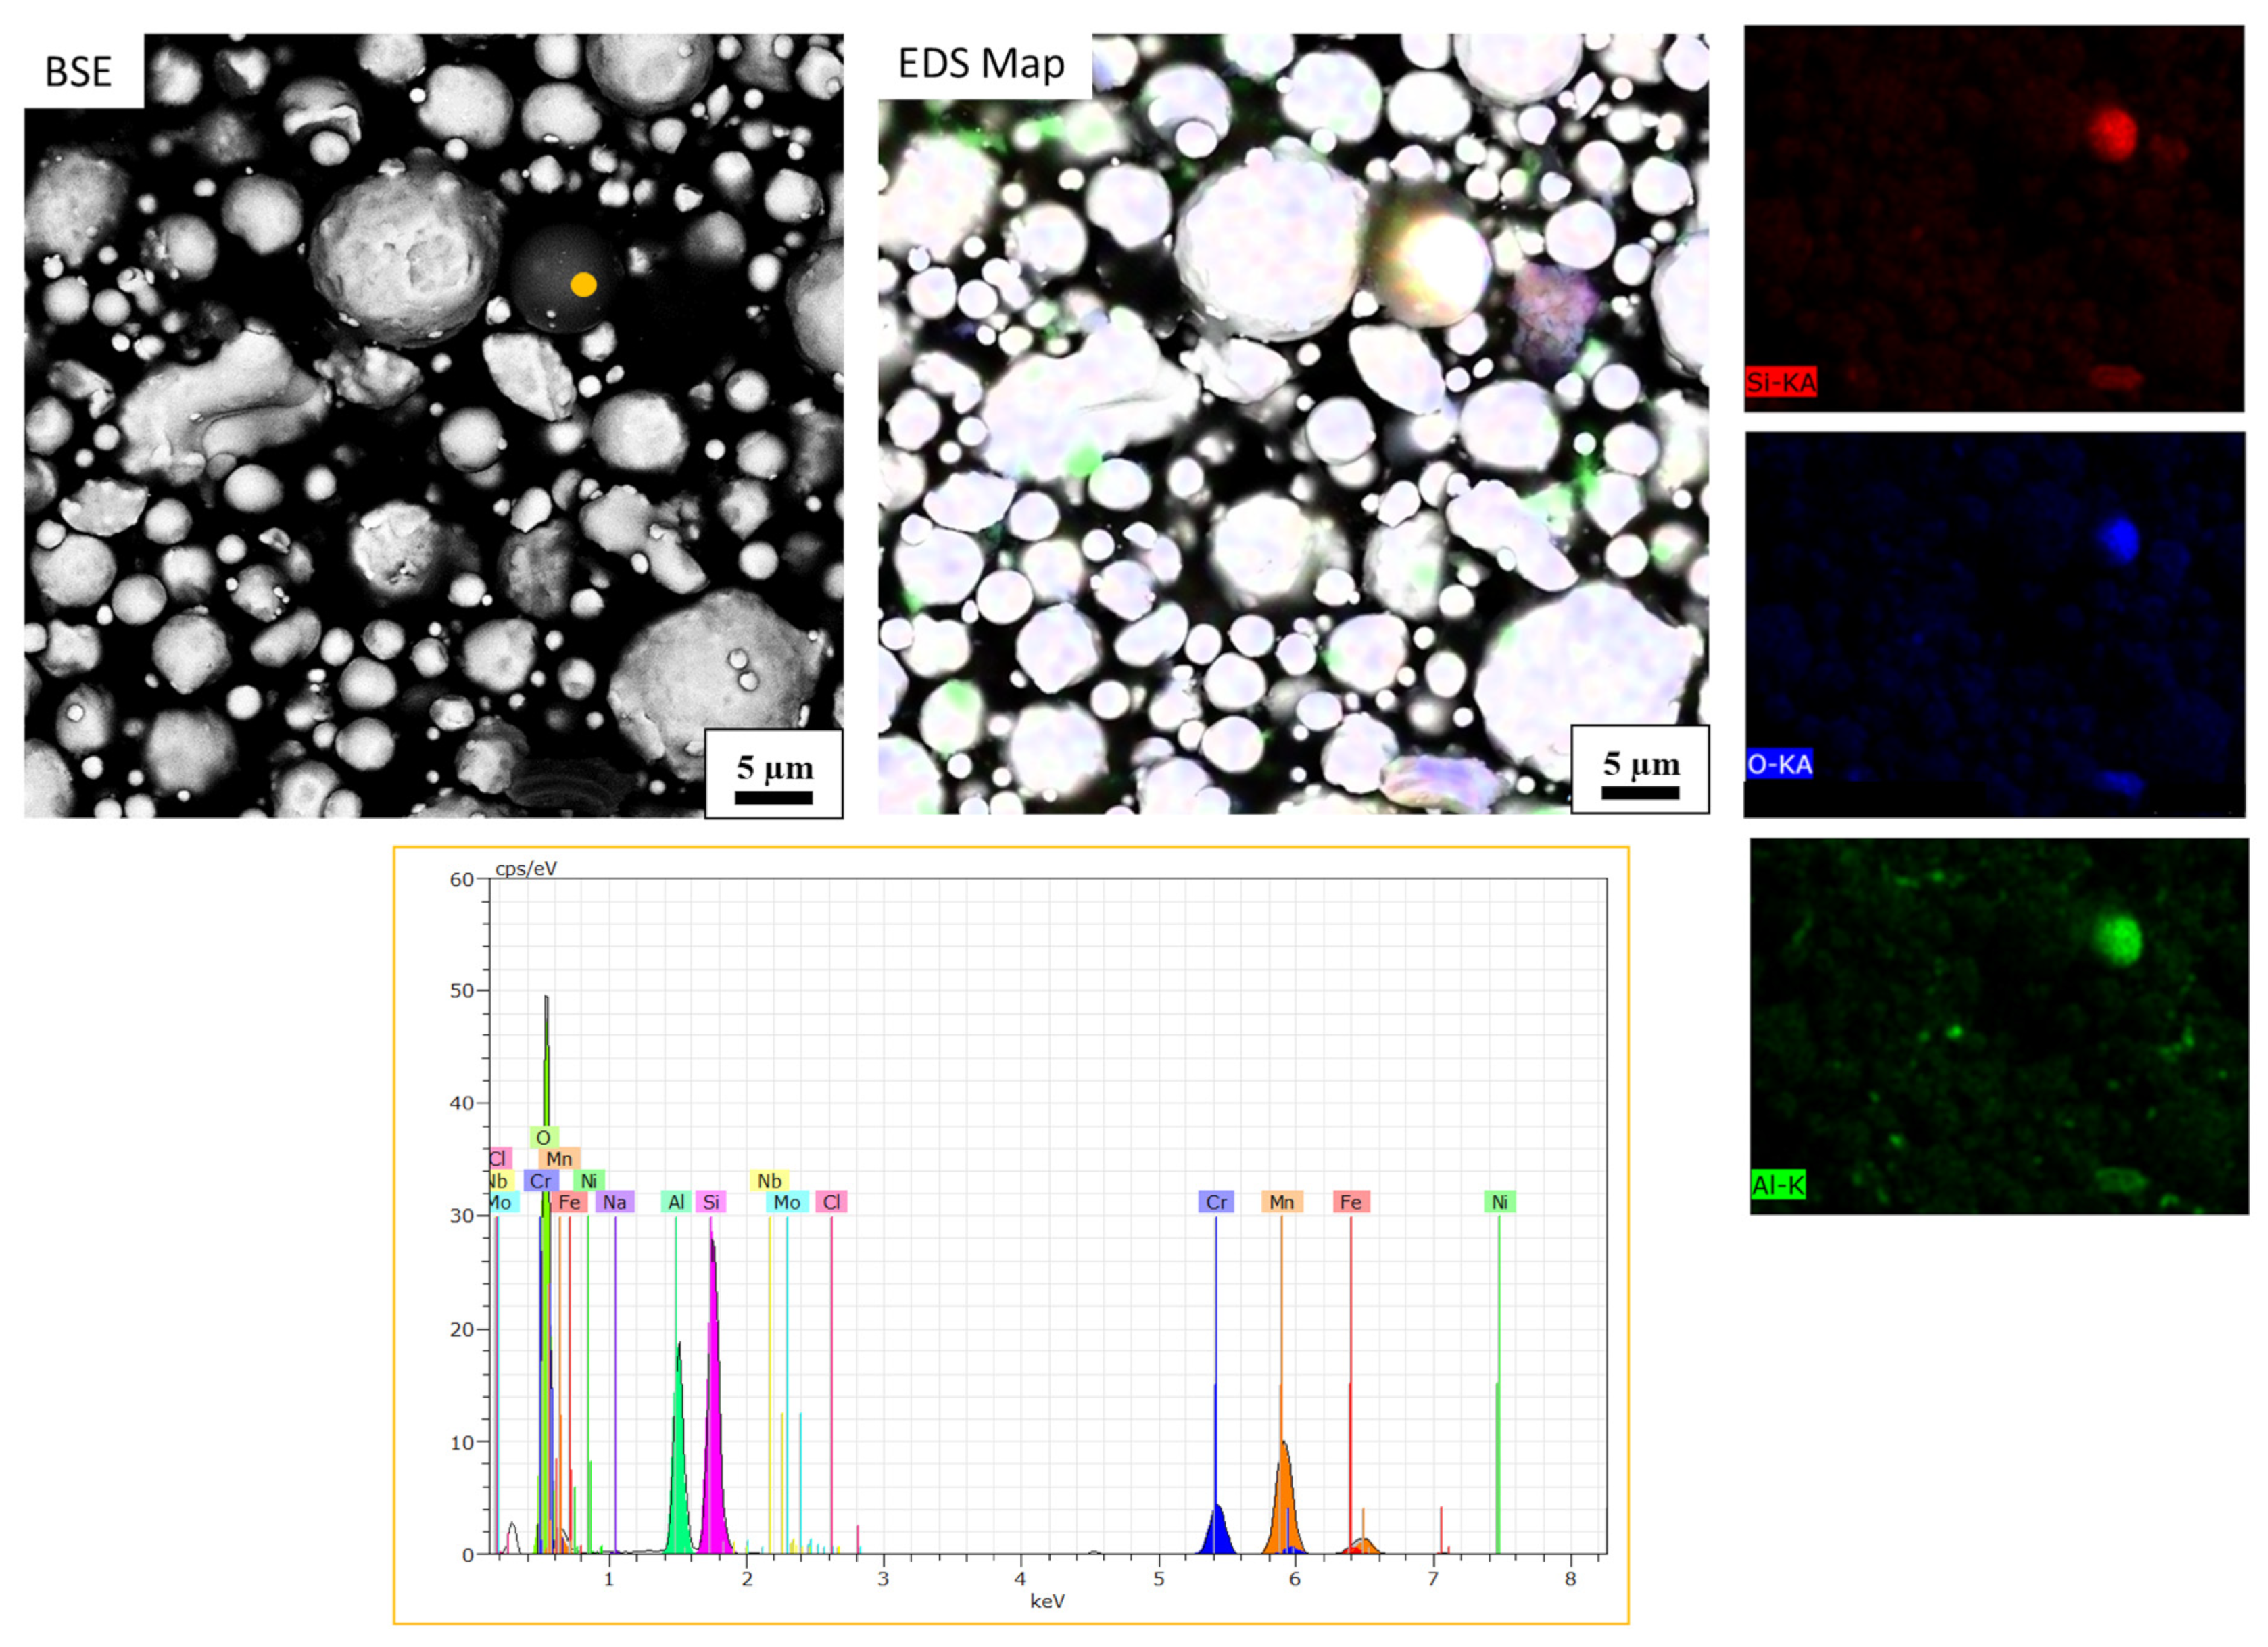
3.1. Feedstock Characterization

The SEM analysis of the starting 17-4PH composite rods revealed the presence of mainly circular 17-4PH particles (Figure 4a), with the calculated particle size distribution and cumulative fraction reported in Figure 4b. From the data reported in Figure 4, representative percentiles have been calculated corresponding to the 10%, 50%, and 90% of the obtained particles’ diameters (D10, D50, and D90, respectively); values are reported in Table 3.
In principle, based on the paper by Hausnerova et al. [32], the same properties of the MIM powder feedstock can apply for the BMD composite rods, including shape, size distribution, loading, and packing density, which are properties also shared with the powder bed fusion feedstock. In particular, powder particle size plays a crucial role in realizing a dense sintered part with limited shrinkage, either with MIM or any other binder jetting or material extrusion-based (i.e., BMD) technology [33,34]. The particle population in Figure 4 comprises a large amount (more than half) of very fine particles, showing a diameter lower than 20 µm. The width distribution or distribution slope parameter, Sw, can be calculated using the following equation (Equation (1)) [35]:
S w = 2.56 log d 90 d 10
Using the percentile values calculated on multiple SEM micrographs and reported in Table 3, the Sw value of the present distribution is 5.5 and clearly indicates a very wide distribution, as can be evinced also by the SEM-BSE micrograph reported in Figure 4. This wide dimensional range of the powder particles has no influence on the 3D-printing step of the BMD technology, being that the printing conditions are influenced only by the properties of the polymeric binder material. However, it is during the final sintering phase that the particle size dimension (PSD) becomes crucial because a dimensional range as wide as the one reported in Table 3 will result in the formation of pores due to the stacking of powder particles one on top of the other. While this phenomenon is mitigated during the MIM process owing to the pressure applied to the feedstock by the molds, the BMD freeform fabrication technology leads to residual porosities related to the particle size dimension of the metallic fraction.
While the investigation of the particle size distribution and the sphericity of the powder particles was performed with scanning electron microscopy, the energy dispersive spectroscopy (EDS) detector was used to investigate peculiarities in the chemical composition of the feedstock. Figure 5 shows the EDS elemental map acquired on the area indicated by the BSE micrograph and highlights the presence of contaminant particles with high concentrations of silicon, oxygen, aluminum, and manganese as well. It is worth mentioning that the contrast of the EDS map micrograph was intentionally enhanced in order to highlight the presence of a contaminant particle that was not visible with the standard contrast-balanced BSE micrograph.
While other papers in the literature report on silicon oxide formation on the surface of atomized metal-powder particles and on sintered stainless steels [36,37,38], the results of this investigation show that these oxides are in the form of free particles with the same granulometric size of the base alloy and totally different composition, owing also to the presence of high percentage of aluminum and total absence of Fe (confirmed by the peaks deconvolution reported in the spectrum of Figure 5). This suggests that, while the low atomization temperature and slow cooling rates can play a major role in the oxides formation, it is also reasonable to consider them as particles with a totally different nature inside the feedstock.

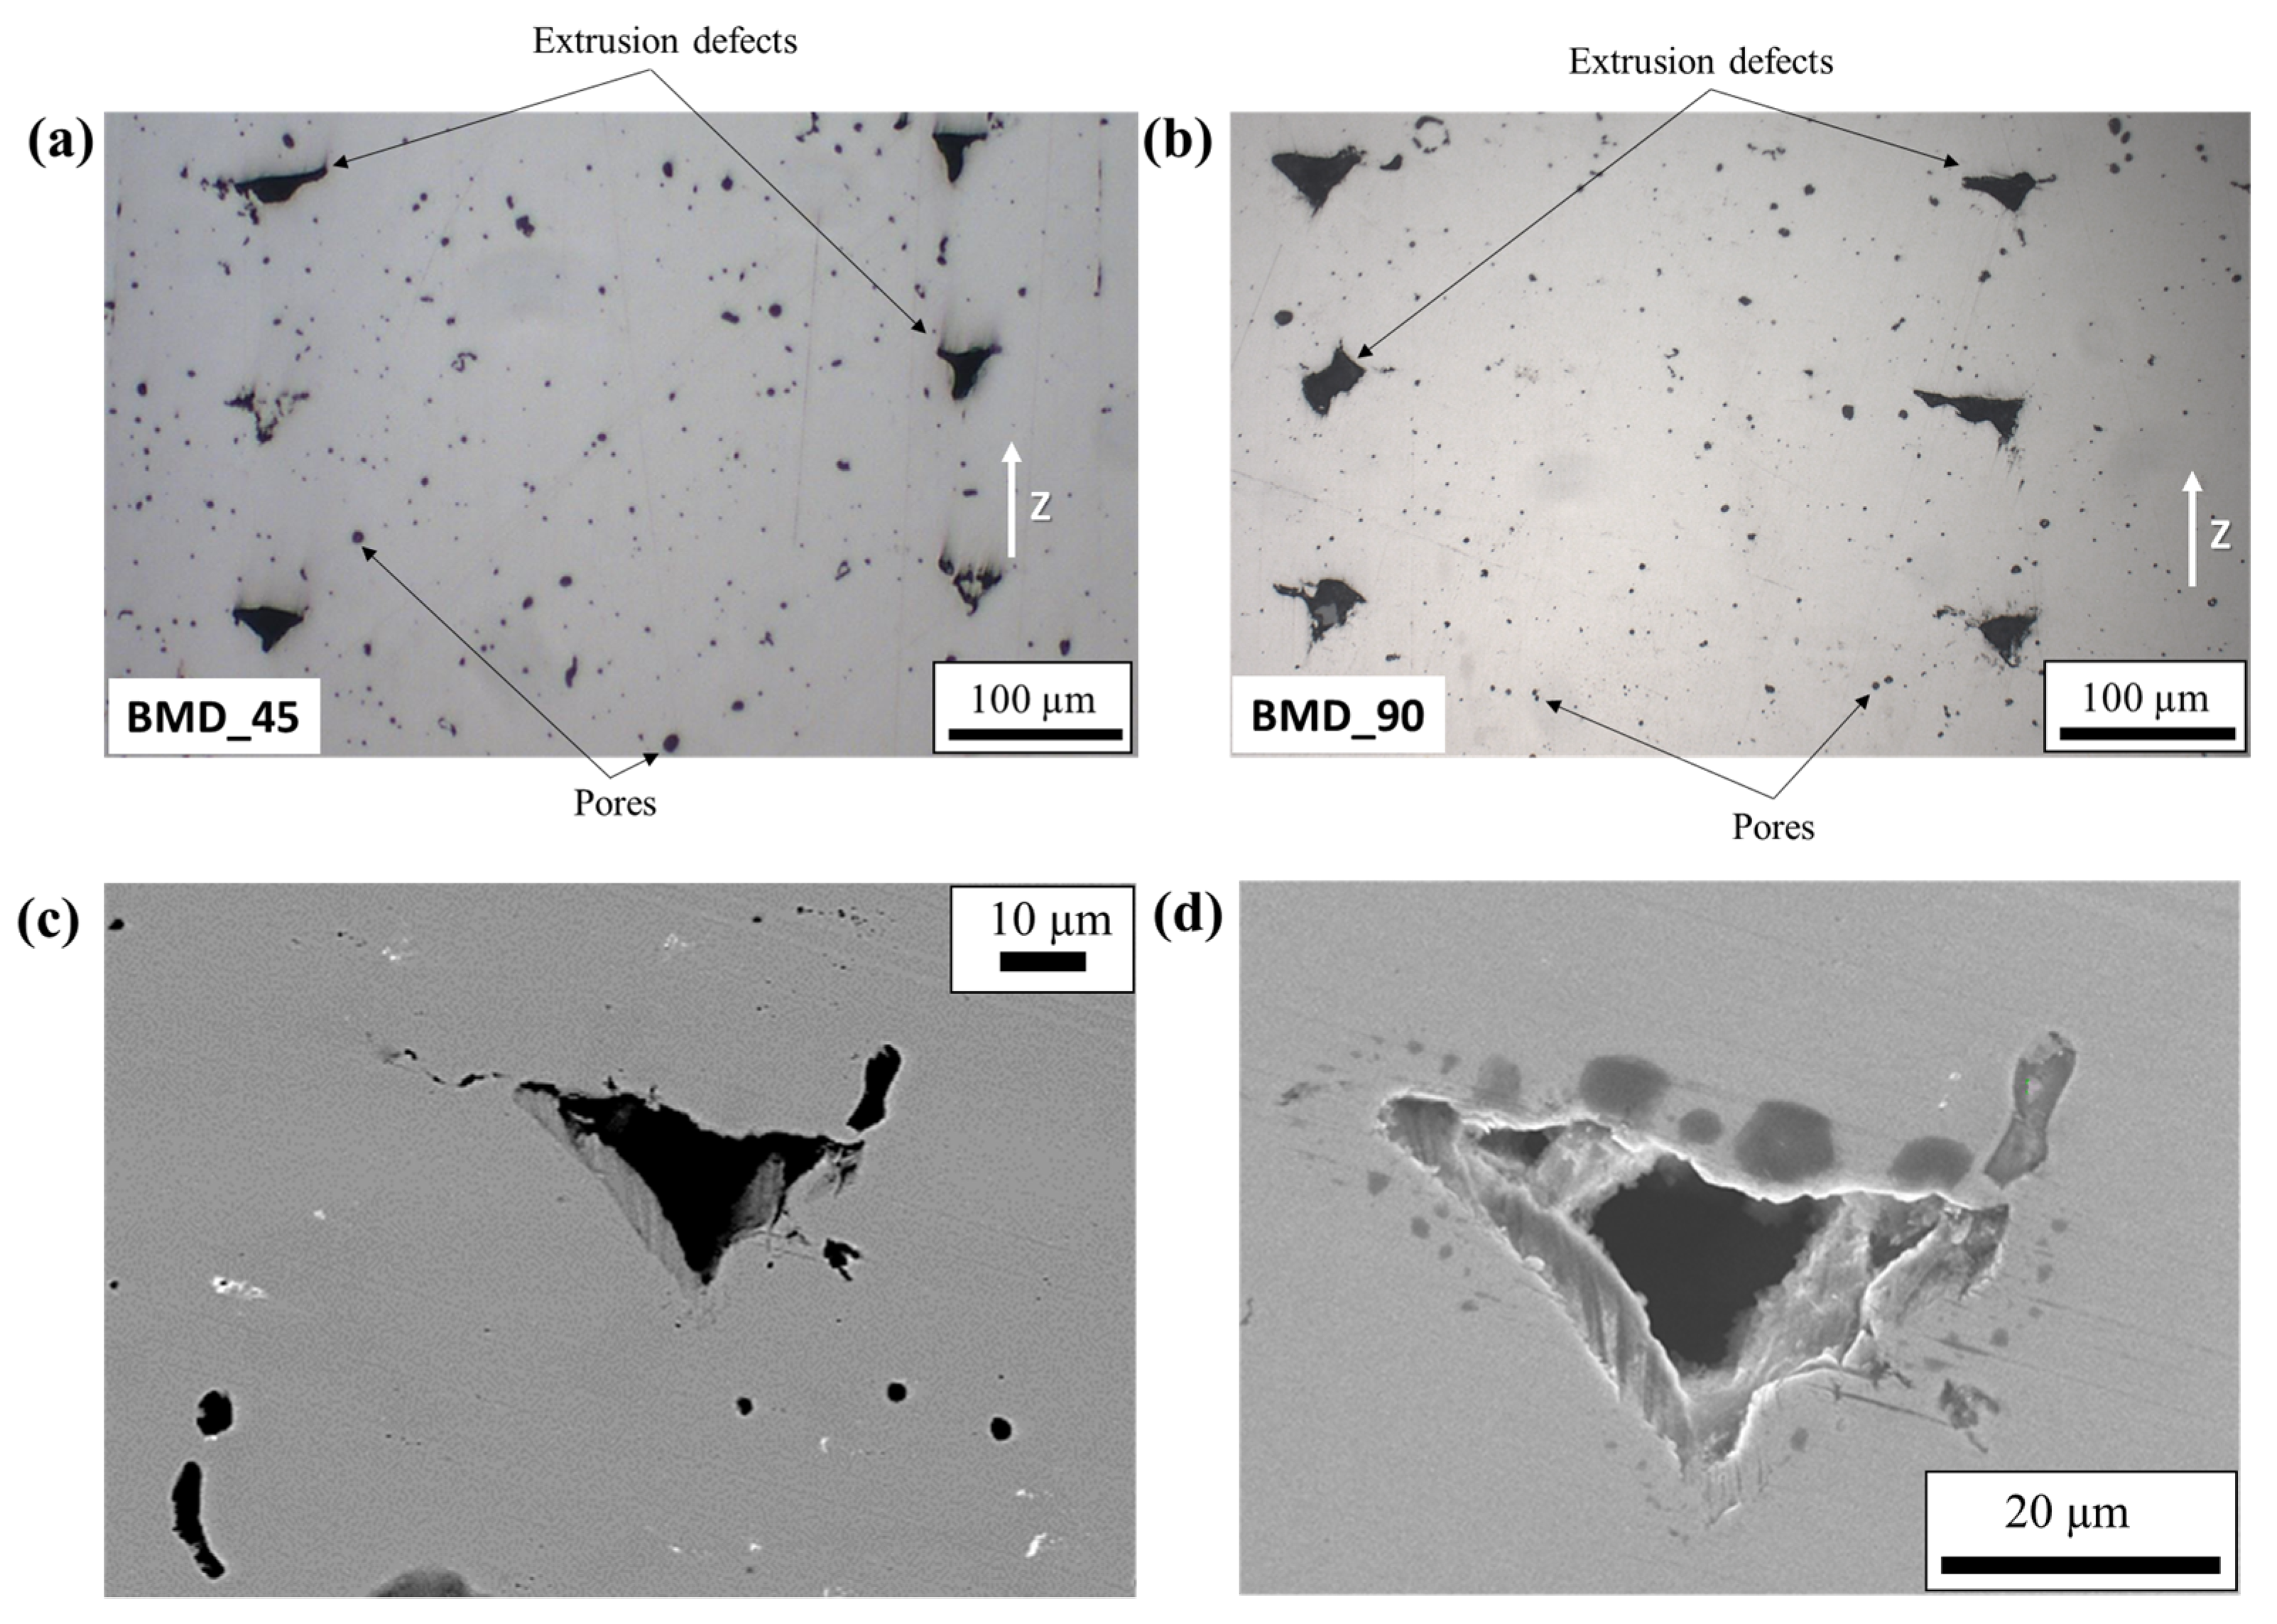
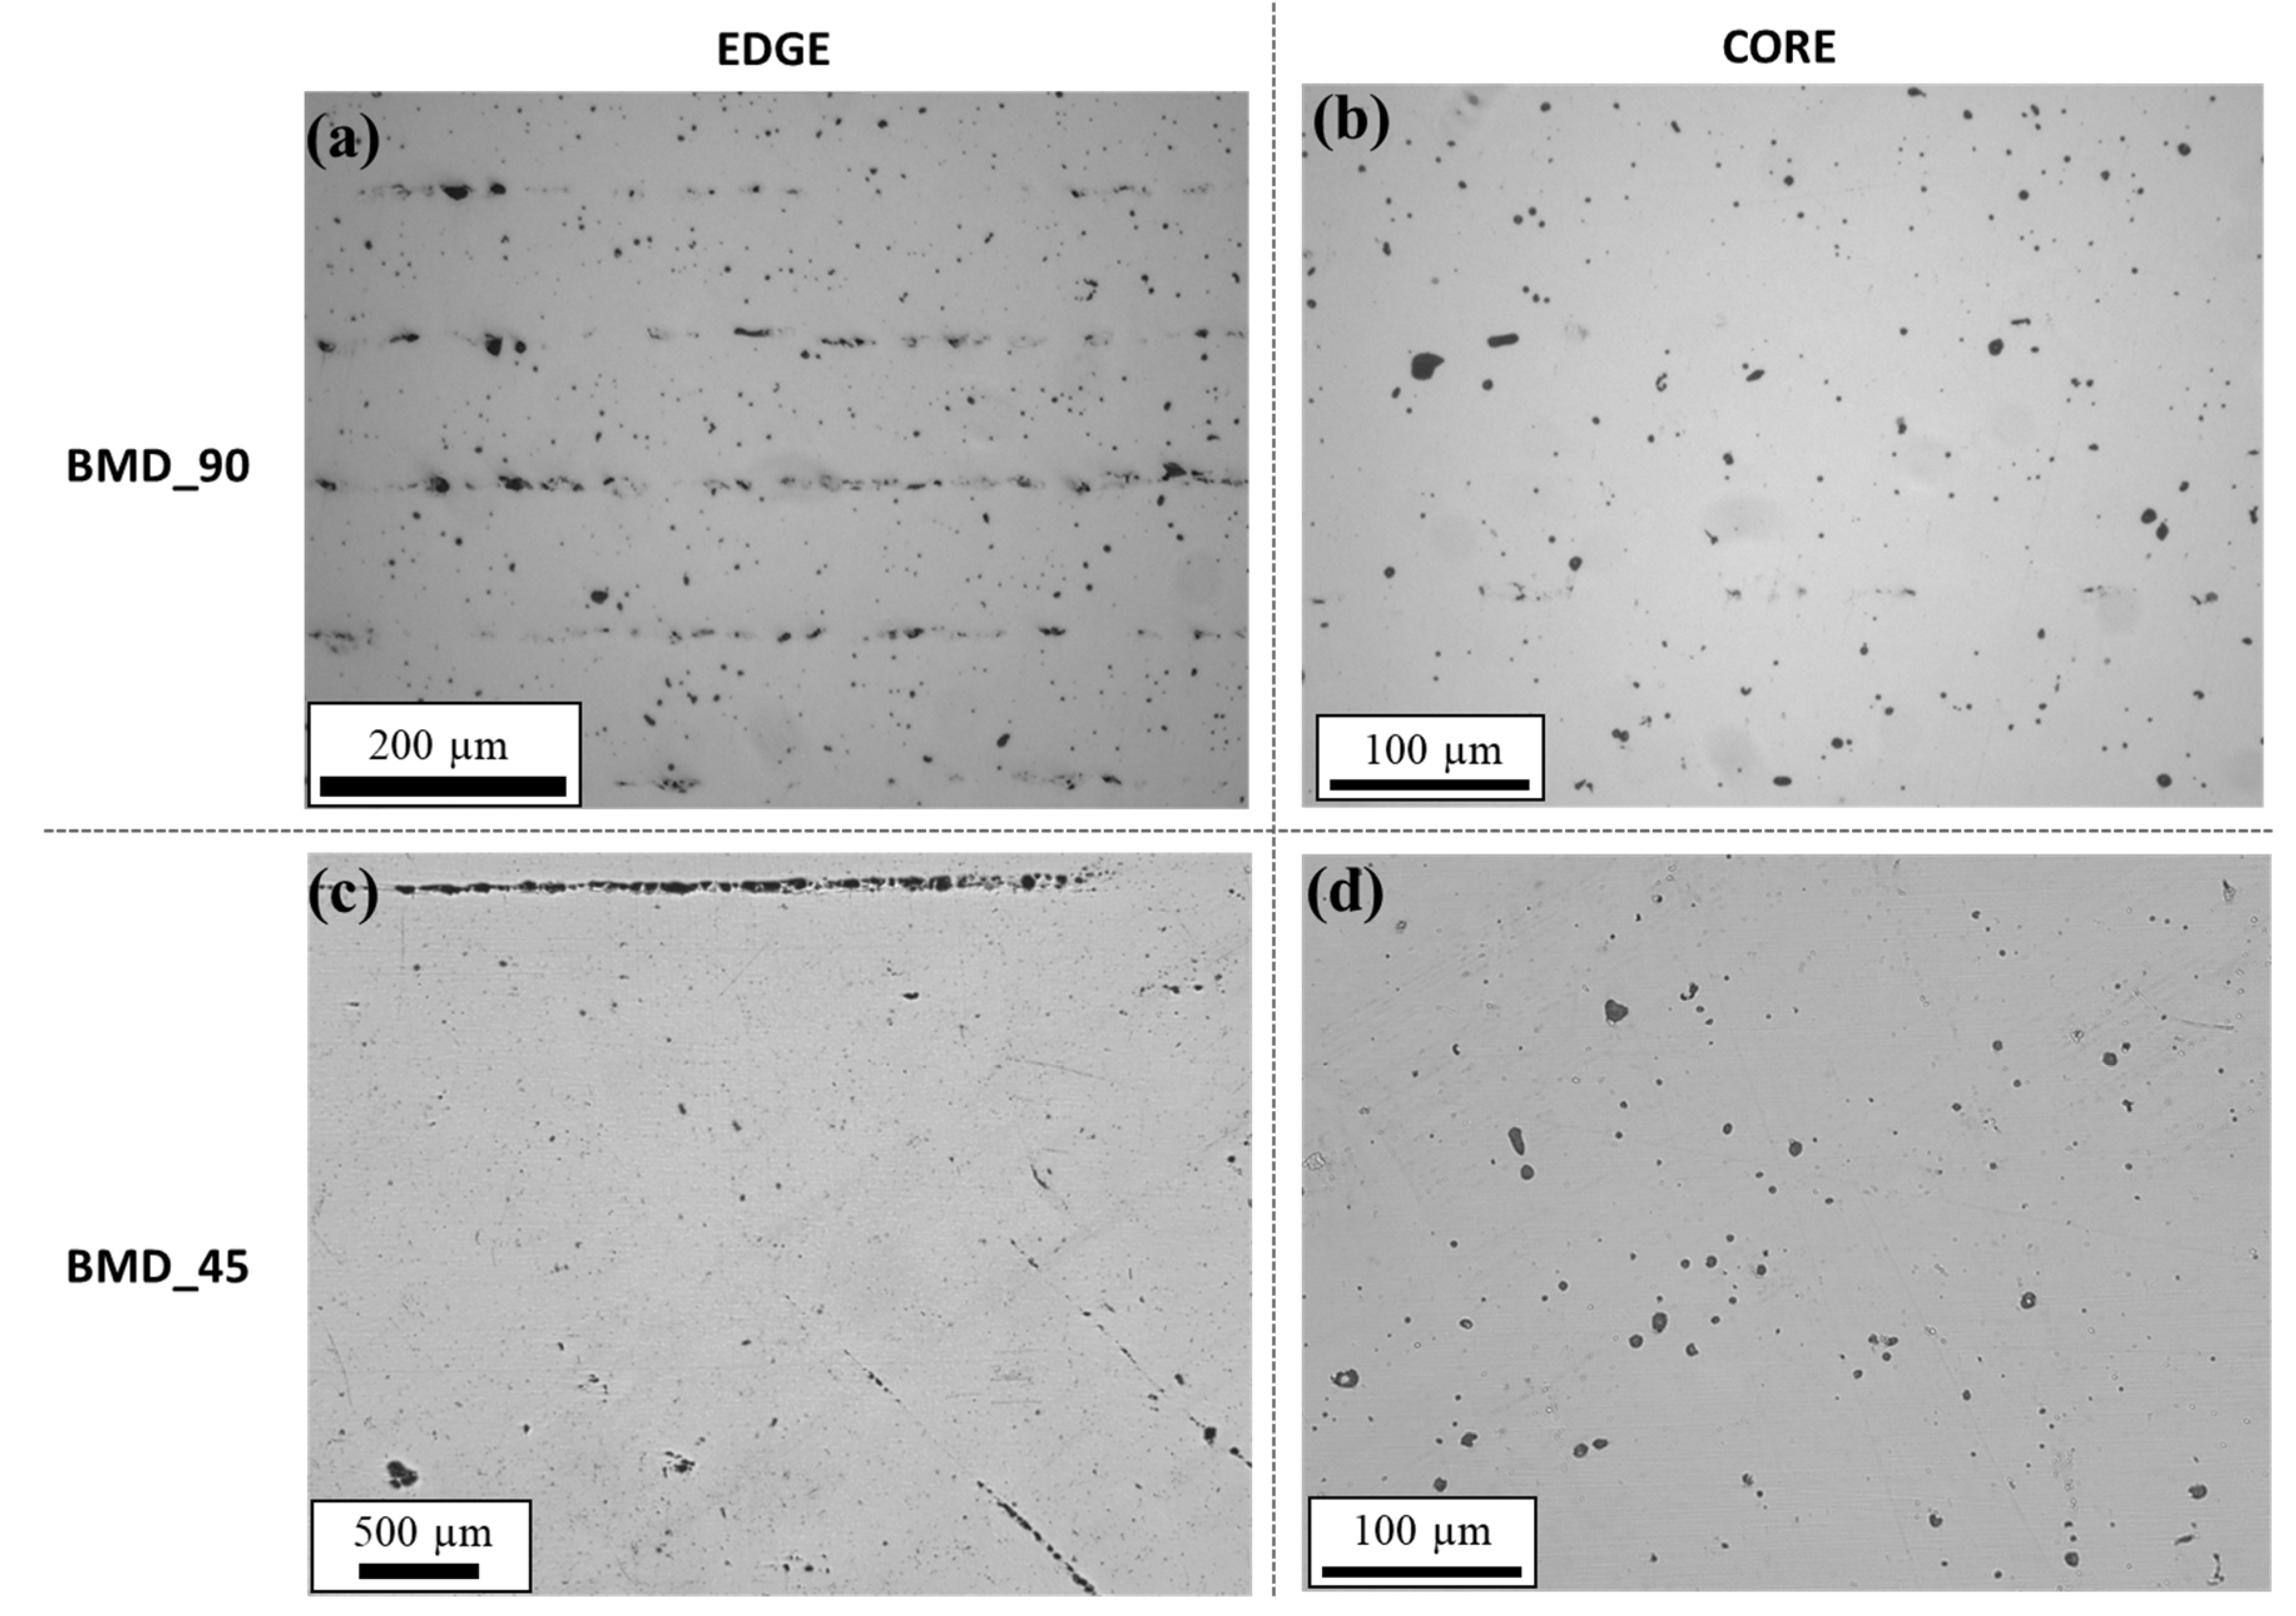
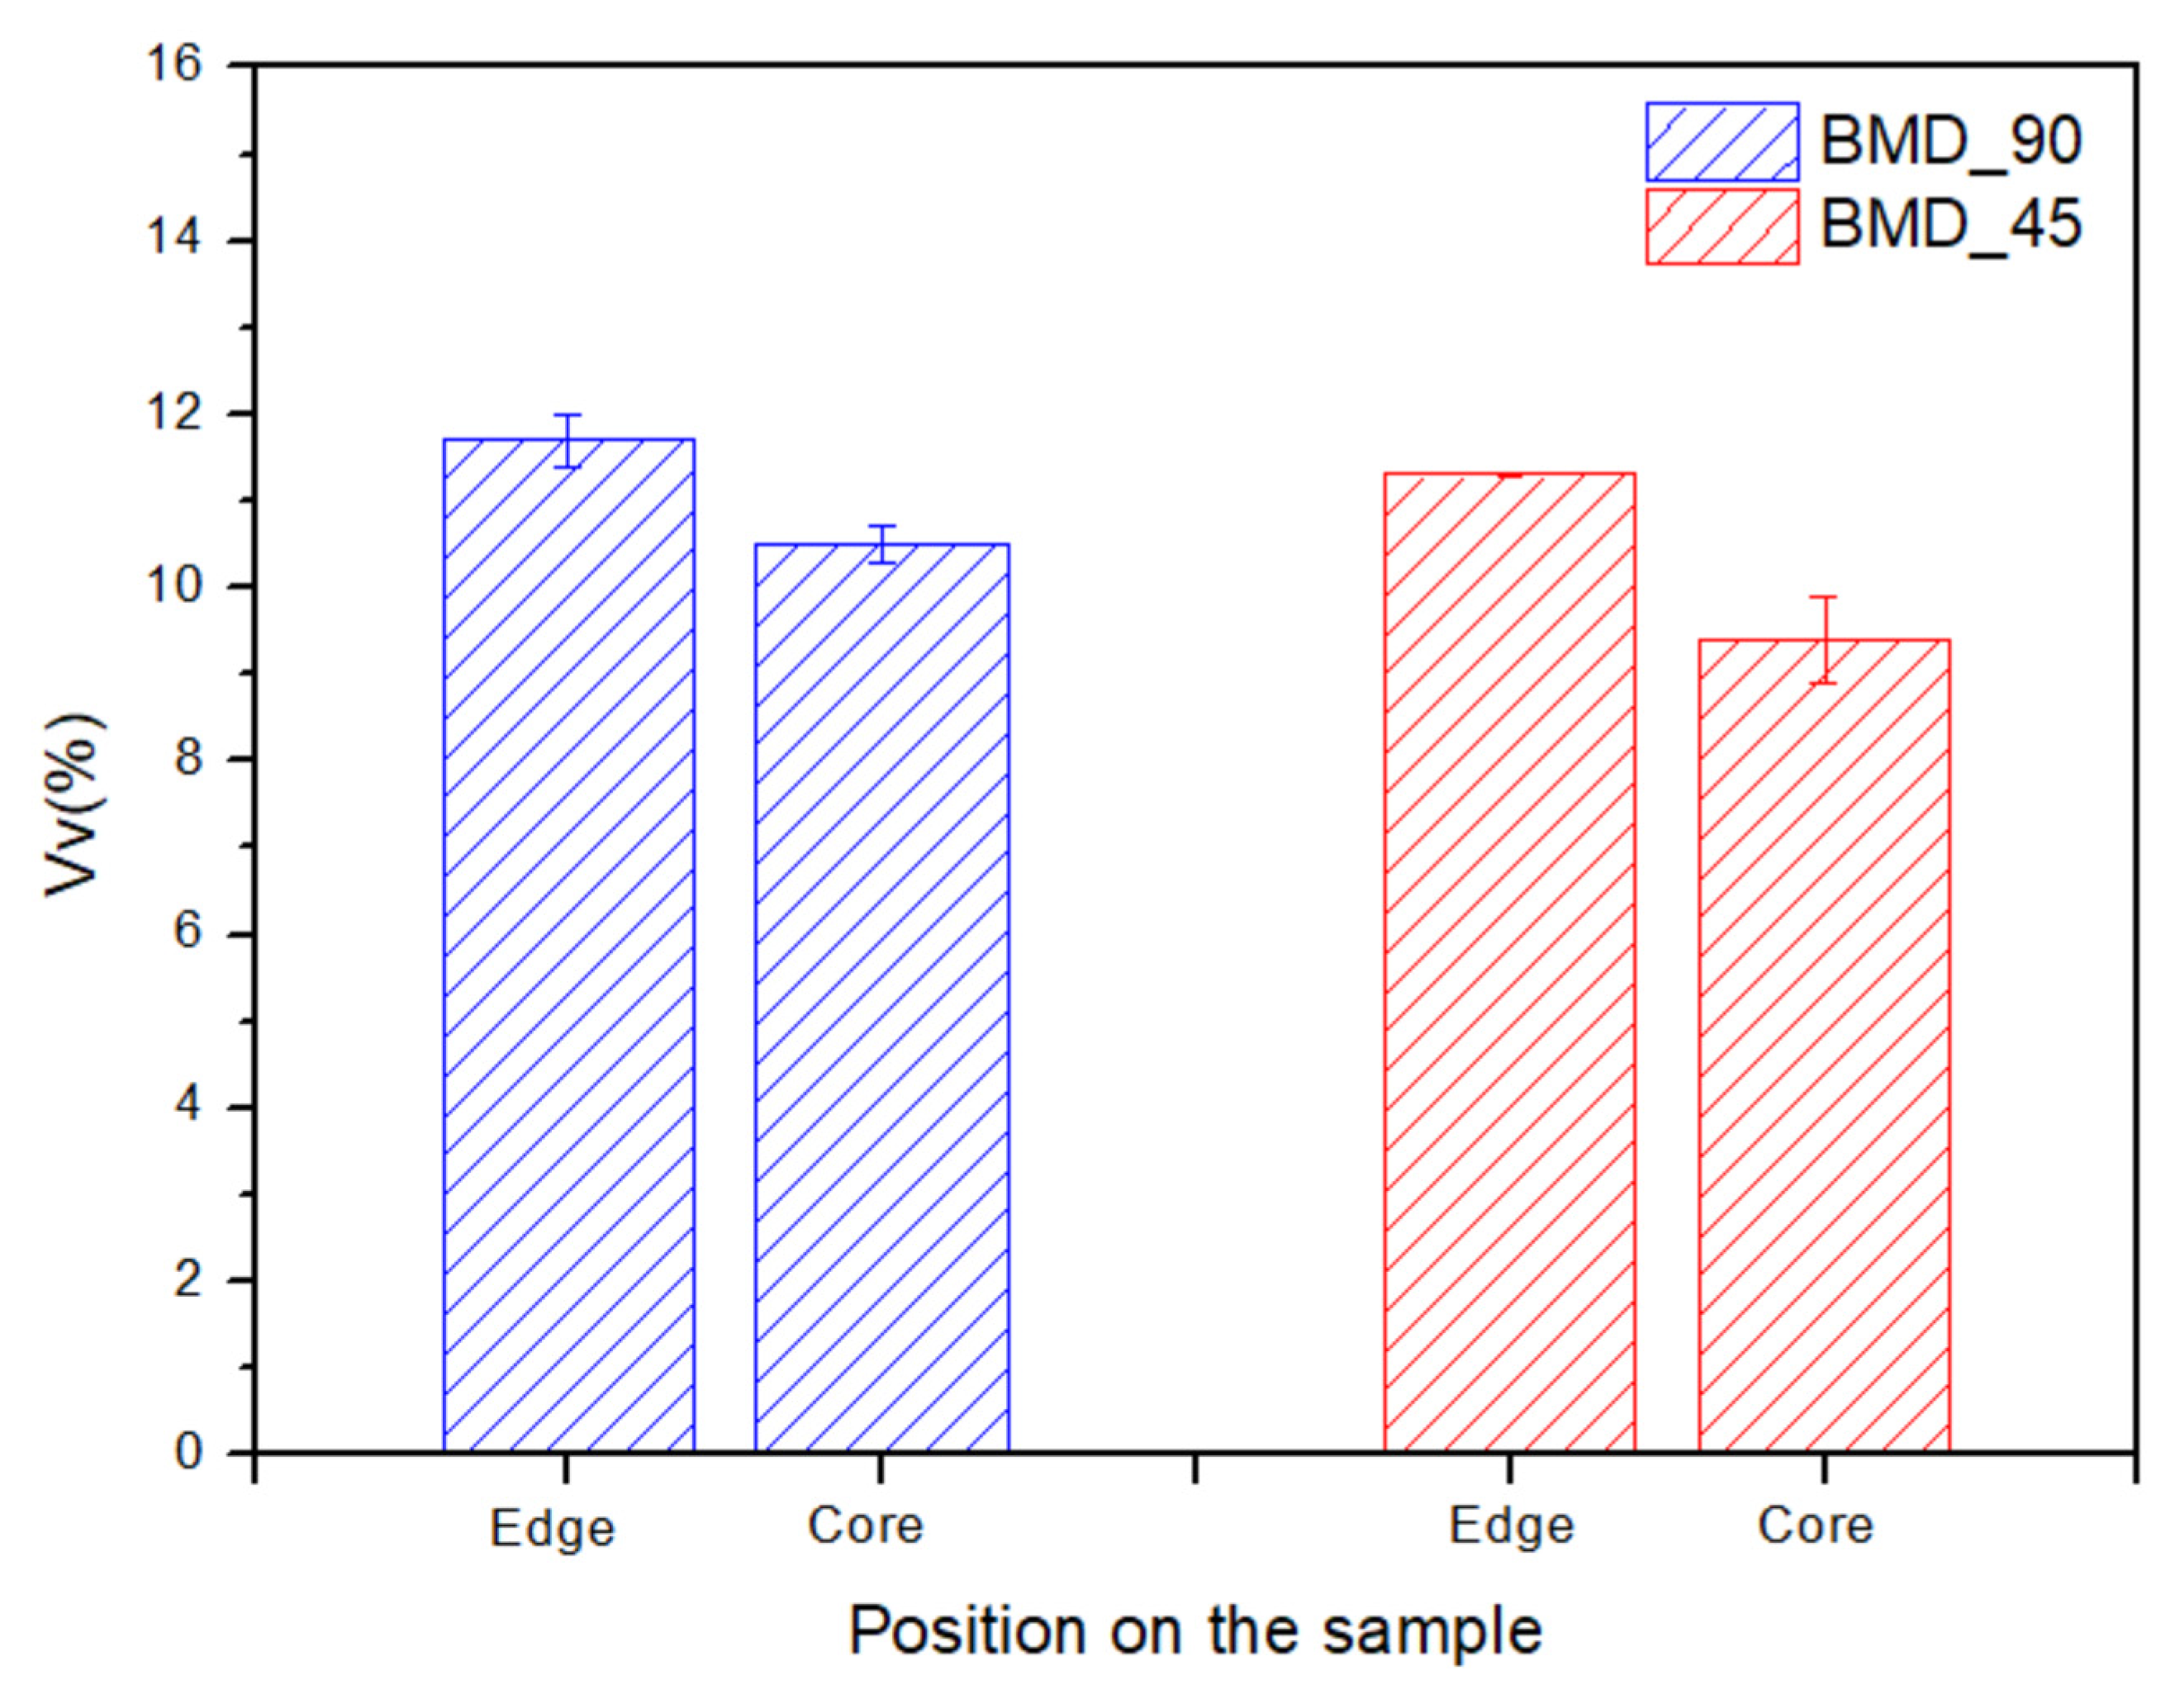
3.2. Analysis and Classification of Defects

The mirror-polished surfaces of the 17-4PH BMD_90 and BMD_45 samples allowed for the characterization of the structural integrity of the part and the eventual presence of pores within the structure. Figure 6 shows the optical microscopy results of the YZ section investigation and the SEM-BSE details of the extrusion defects.
Figure 6 highlights the presence of pores with a particular geometrical shape which can be ascribed to the space left by the extrusion of the composite material during the 3D-printing process, beyond the specific deposition strategy. It is worth mentioning that owing to the different deposition angles, pores related to the YZ plane of the BMD_45 sample (Figure 6a) appear smaller than for the YZ BMD_90 sample, thus increasing the density in the realized section perpendicular to the square. Figure 6 shows the structure of the BMD_45 and BMD_90 samples along the growth direction (YZ plane). The orientation of the pores is directly connected with the printing strategy and is enhanced by the binder dissolution and evaporation during the debinding and sintering phases, respectively. This suggests that the final thermal process is not able to limit the presence of such large defects and that a low bond between subsequent layers can be expected. The presence of the triangular-like defects highlights how the deposition of tracks and the following squash of the melted composite material by the extrusion nozzle play a major role in defining the shape of the pores. These findings are in line with the literature concerning the material extrusion of metals where, despite a different form of the starting feedstock (composite wire instead of composite rods), large geometrically shaped voids are found in the final part, confirming the link between the defect and the 3D-printing process itself [10,26,39].
Figure 6c,d show SEM-BSE micrographs acquired at different magnifications and using different levels of brightness–contrast. It is worth noting that while Figure 6c allows for highlighting the presence of very bright inclusions, the high brightness option used for Figure 6d enables the detection of darker areas concentrated around the edge of the extrusion-related pore corresponding to high concentrations of silicon oxides as the ones that will be discussed later in the paper.
The highly bright inclusions shown in Figure 6c were characterized by energy dispersive spectroscopy and the results showed the high presence of Nb and C (~40 ± 10 wt.% Nb, 10 ± 2 wt.% C, calculated by averaging the EDS values acquired from every bright region), suggesting that these inclusions correspond to niobium carbides (NbC). The presence of these carbides can be expected since the temperatures reached during the sintering phase and the corresponding dwell times are similar to the conditions at which solution annealing is typically performed on 17-4PH stainless steel (also known as “condition A”) [26,40]. Compared to the recently published results by Akessa et al. [26], niobium carbides in the sample fabricated by BMD are located in different positions across the analyzed surface, while in the samples obtained by using the ADAM technology, carbides are found on the edges of the pores [26].
The optical micrographs of the BMD_45 and BMD_90 XY mirror-polished samples are shown in Figure 7.
The planar arrangement of the deposited tracks (Figure 7) close to the edge of the fabricated square (Figure 7a,c) and in the central area (Figure 7b,d) for both the BMD_45 and BMD_90 samples is quite peculiar. A remarkable decohesion between different tracks is clearly visible in the areas closer to the outer edge of both samples (Figure 7a,c); the structure of both samples densifies with limited large defects formed next to the samples’ core. Edge micrographs have a different scale bar to highlight the impact of the infill deposition strategy on the evolution of the defects.
The structure of the samples in the plane perpendicular to the growth direction shows large defects appearing as void lines close to the edges of the samples and aligned with the infill strategy (Figure 7a,c), while a higher density is reached in the core of the samples (Figure 7b,d). This effect is indeed independent of the infill deposition angle and is likely to be due to the combination of printing parameters such as the deposition strategy, overlap, and density profile chosen for the fabrication. While the literature shows continuous void lines [10,26,39], Figure 7a highlights discontinuous void lines preferentially located close to the outer wall of the 3D sample and suggests a better overall performance. During the sintering process, the evaporated residual binder increases the content of the pores since this thermal process takes place without the application of pressure and there is no further infiltration with additional material. Therefore, while the thermal cycle is able to densify the part and completely dissolve the polymeric binder, a residual porosity content should always be expected. Furthermore, as outlined above, the wide range of powder dimensions increases the inherent porosity and results in the formation of the round-shaped pores visible in the optical micrographs of Figure 6 and Figure 7
Scanning electron microscopy investigations, together with element microanalysis, have been also performed on the polished surfaces of both sets of samples and the findings referring to the BMD_90 sample (YZ plane) are reported in Figure 8. It is worth mentioning that similar results were obtained in BMD_90 and BMD_45 samples.
The BSE signal allowed for the highlighting of differences in the chemical composition of the final part (Figure 8) and the use of the energy dispersive microanalysis performed on specific positions (being A the matrix and B the discontinuity) allows identifying the presence of an inclusion rich in silicon and oxygen. It resulted that particles with a high amount of O, Si, Al, and Mn were found inside the metal-powder feedstock (Figure 5) and these are likely to be the cause of the inclusions reported here in Figure 8, with an associated redistribution of alloying elements during surface and volumetric diffusion occurring in the sintering furnace. These oxide particles are also responsible for the darker BSE contrast areas in Figure 6d and highlight how their concentration is particularly remarkable near extrusion-related pores.
Investigations allowed for the isolation of different defects and to correlate their nature with different production steps as (i) extrusion-related defects, related to large pores having remarkable dimensions (i.e., 20 microns) and a particular geometrical arrangement (from triangular to star-shaped in the growth direction) and (ii) feedstock-related defects, which include all the discontinuities inside the final part depending on the feedstock only. With reference to the latter, an additional classification of the feedstock’s defects can be suggested: (i) chemistry-related defects, that is defects and inclusions connected with the chemical composition and peculiar metallurgical behavior of the alloy and (ii) geometry-related defects, such as rounded pores connected with the sintering of the metal particles. In this latter case, the surfaces of the particles impinge on one another and cause gaseous inclusions to form in the remaining space after the binding removal. These small, rounded pores are typical of AM sintering-based technologies, as well as MIM, and are linked with the formation of necks between metal particles during furnace sintering [18,23,24,25,26,27,35]. Decohesion of the deposited tracks, as highlighted in Figure 7, can be classified as an additional extrusion-related defect, being due to the particular BMD 3D-printing process. It is worth pointing out that chemistry-related defects are due to the presence of peculiar particles in the feedstock rods and to the formation of silicon oxides due to the high percentage of Si in the chemical composition to prevent the formation of other detrimental oxides [36].

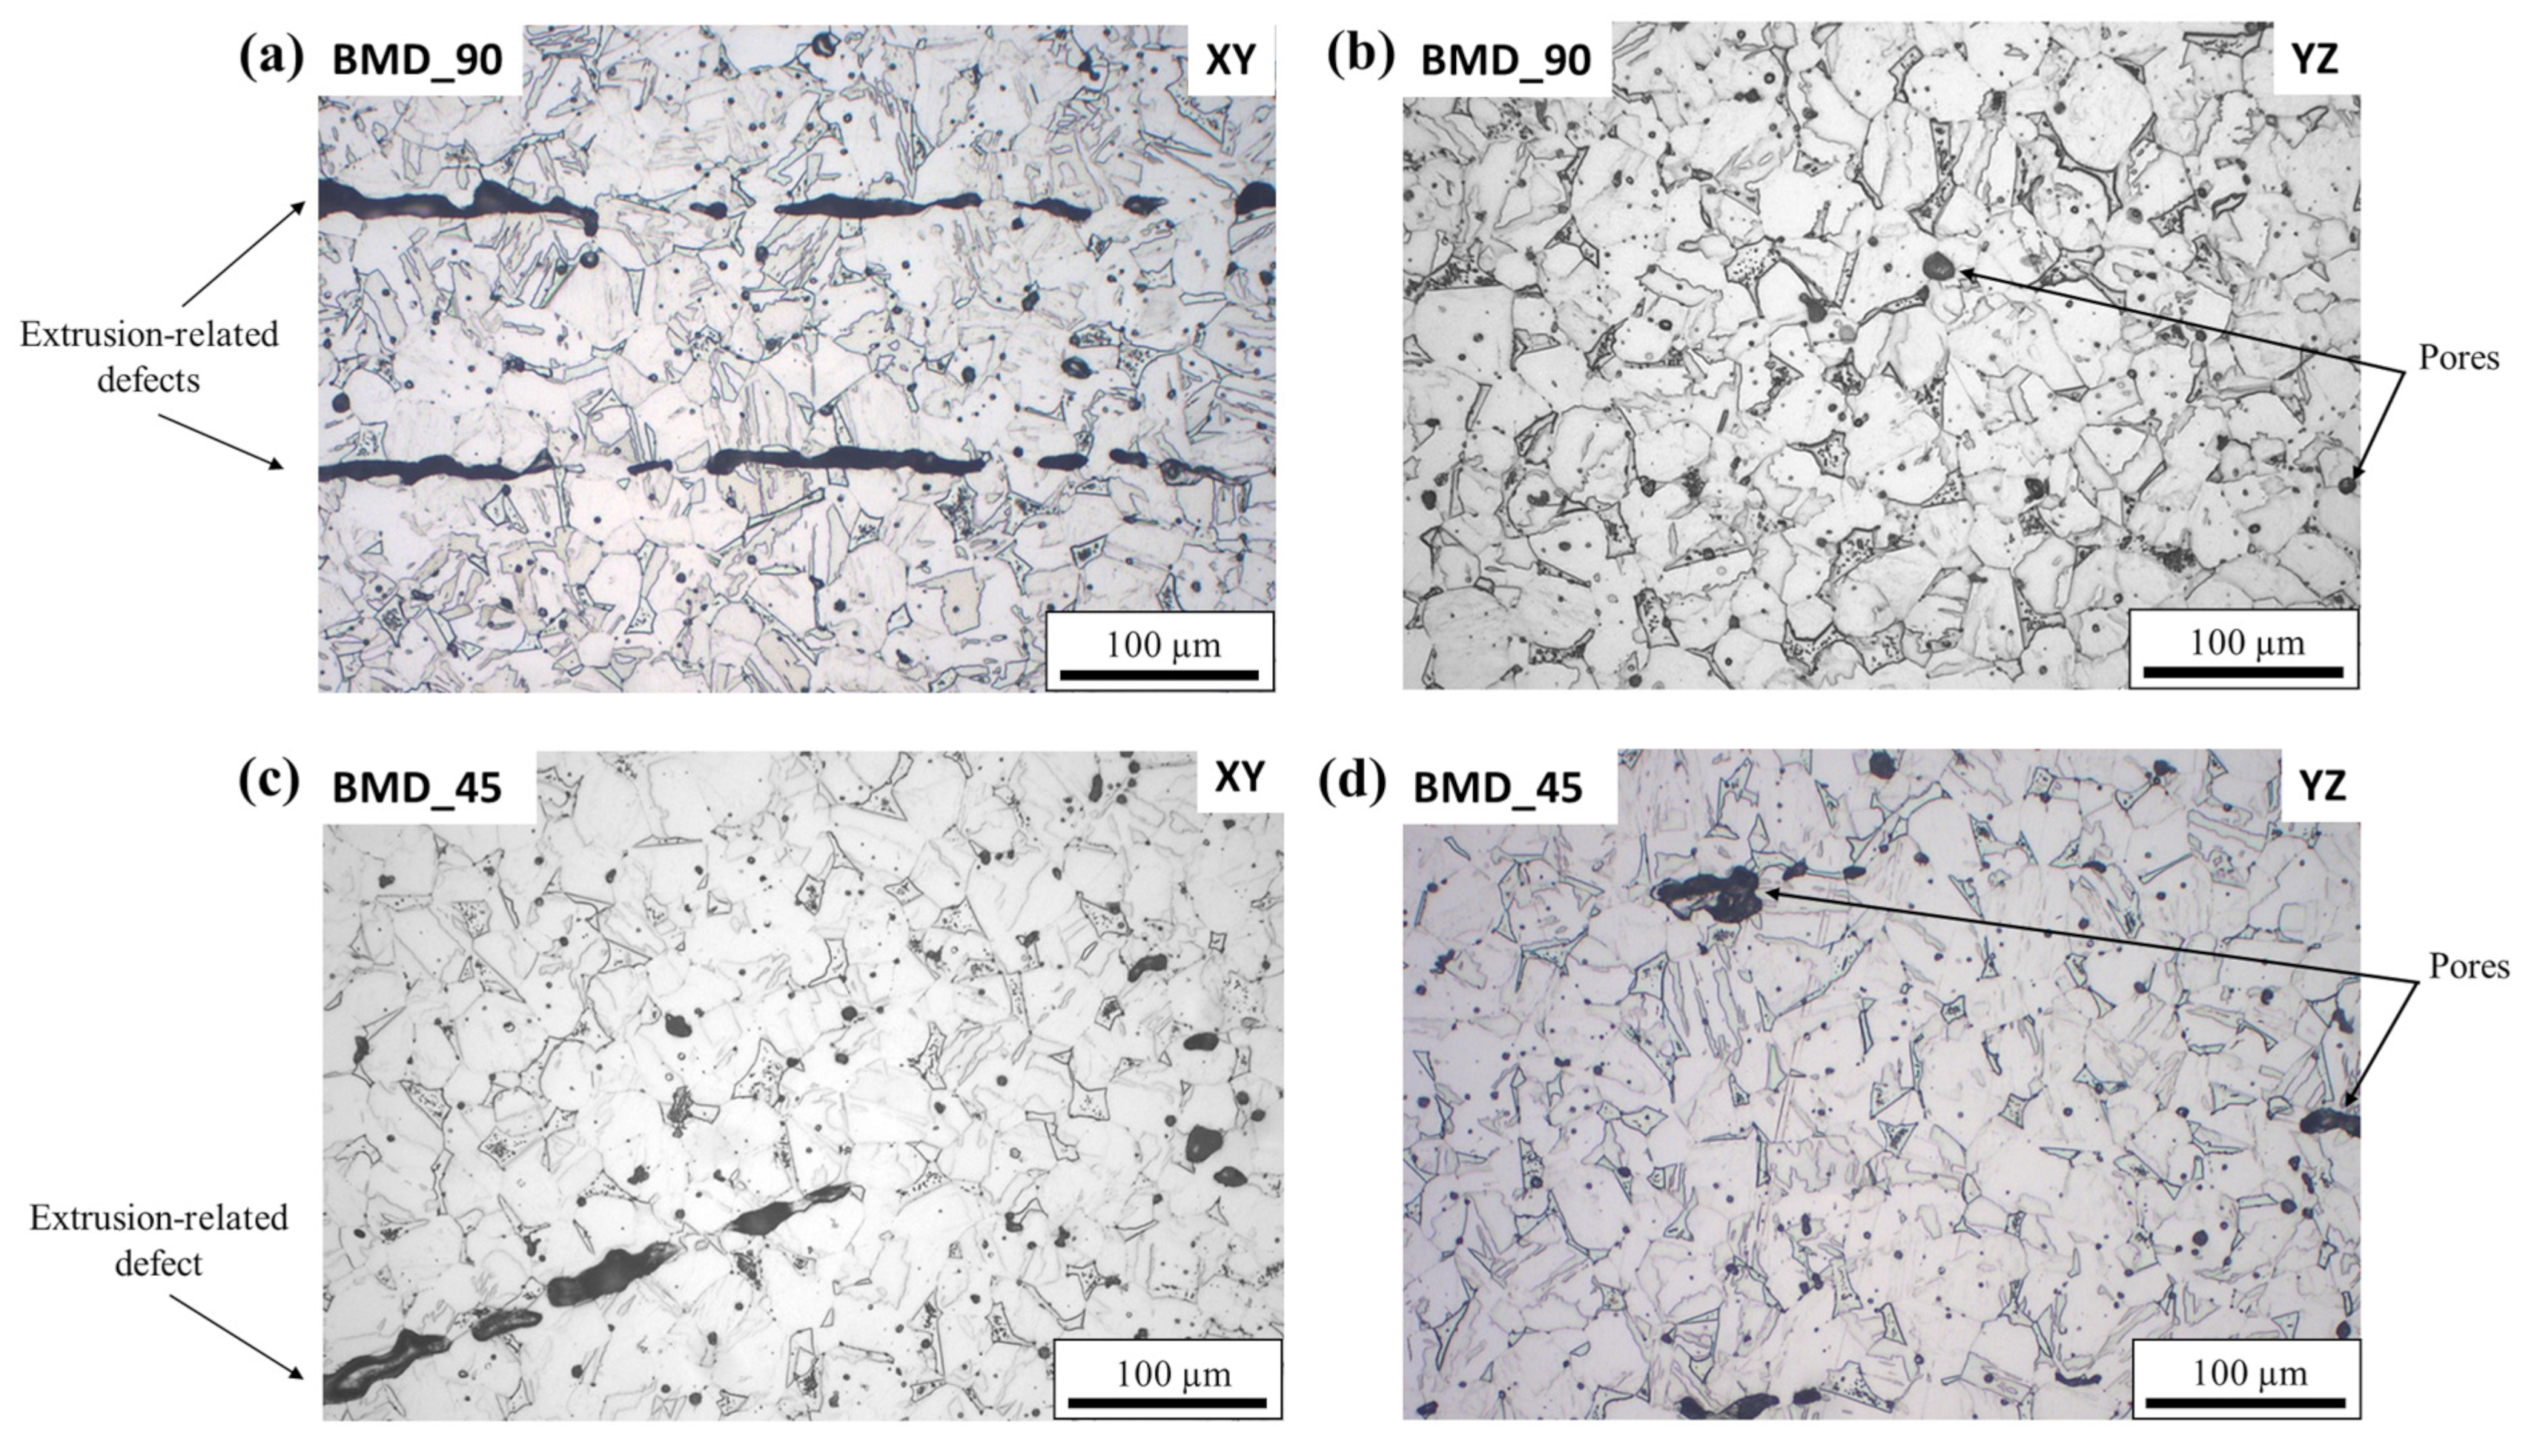
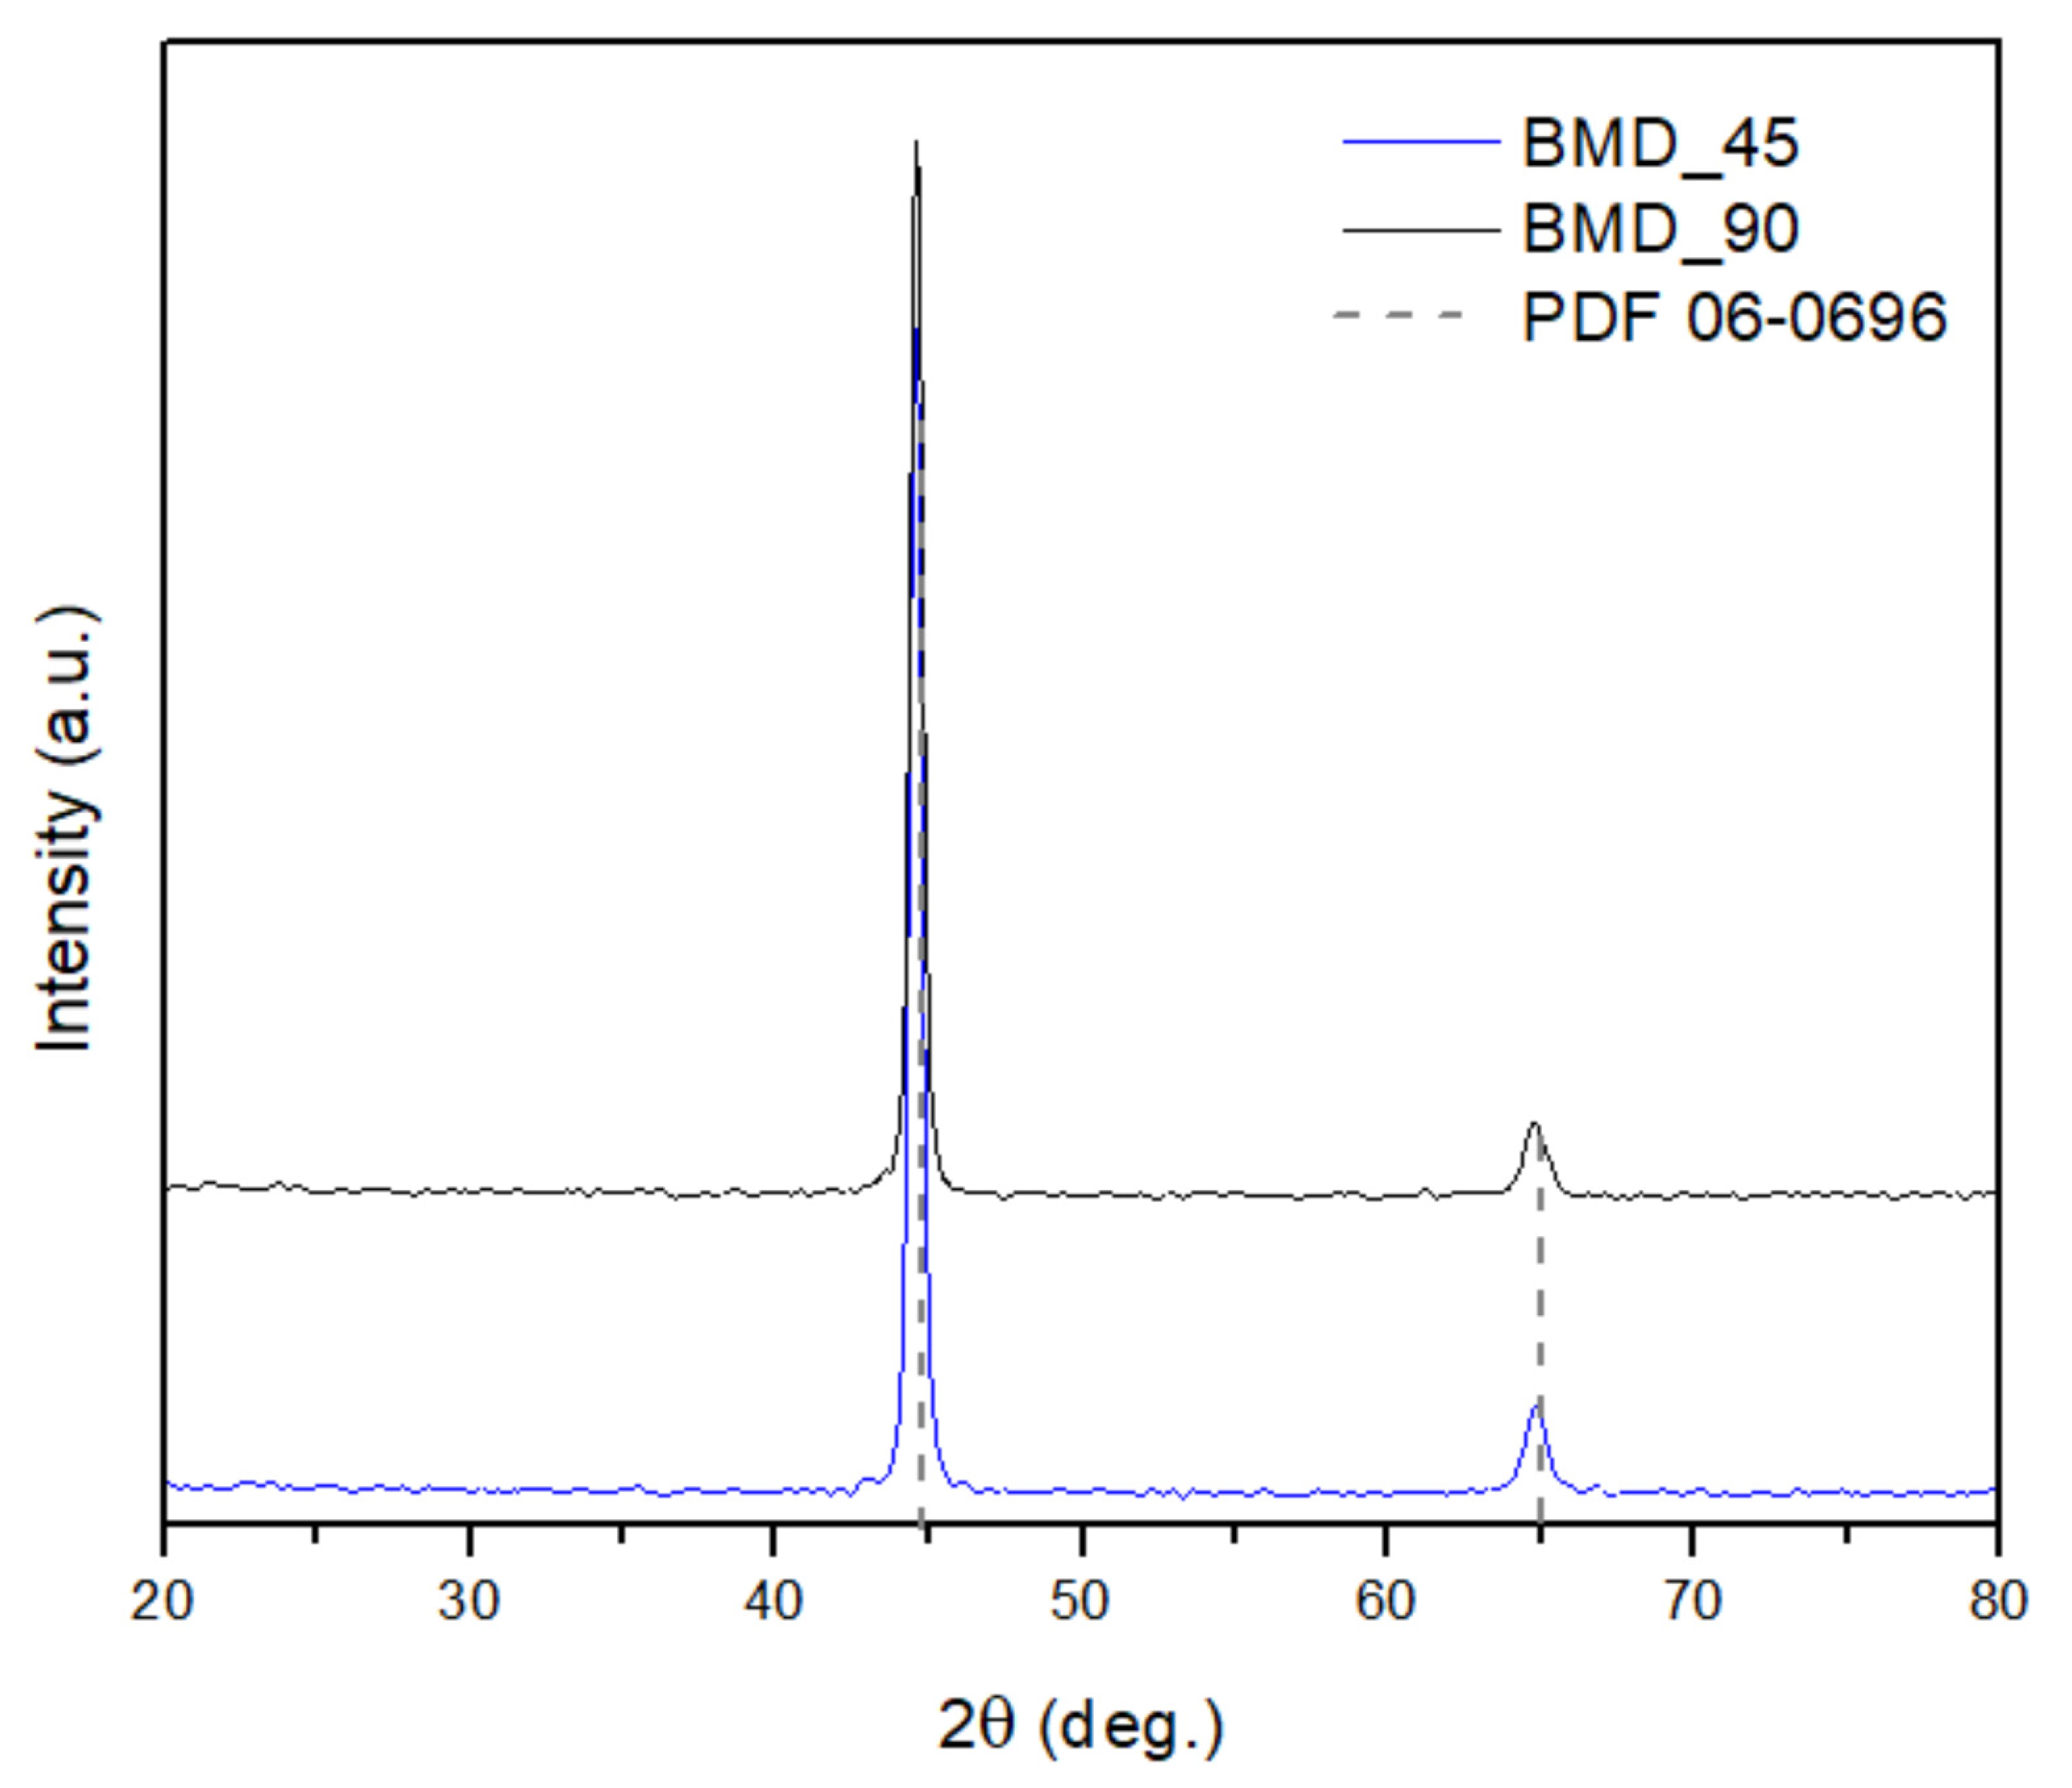
3.3. Microstructural Characterization

Mirror-polished samples were subjected to etching to reveal the microstructure and the results are shown by the optical micrographs reported in Figure 9.
The microstructure of all the samples revealed by optical microscopy (Figure 9) is a combination of ferrite and martensite; no remarkable differences can be highlighted between the two sets of samples.
Concerning the microstructure, Figure 9 shows the presence of ferrite and martensite for both the BMD_45 and BMD_90 samples; the phase distribution is consistent with the “condition A” status, that is, after a solubilization process [26,40,41]. In this respect, quantification of the δ-ferrite phase according to the ASTM E562 standard was performed for both samples in two different regions, close to the edge and in the core of the sample. In particular, the edges of both the BMD_45 and BMD_90 samples are characterized by higher δ-ferrite percentages, a trend which is more pronounced for the former sample, whose core shows the lowest δ-ferrite amount. As reported in the literature by Wu et al. [42] carbon diffusion is the driving mechanism of δ-ferrite formation in 17-4PH fabricated by injection molding. Diffusion is determined by the sintering temperature and dwell time and can lead to a remarkable variation of the martensite–ferrite contents in martensitic stainless steels [42,43]. Sintering parameters cannot be varied in the BMD system used in the present study and this suggests that any microstructural modification between edge and core must be related to the structural defects of the samples. The large linear pores (Figure 7) corresponding to tracks’ decohesion occurring at the edges of the analyzed samples enhanced carbon diffusion and, therefore, the formation of a larger amount of δ-ferrite compared to the core of the samples. Therefore, the results of this quantification reported in Figure 10 highlight that the phase distribution is determined by the mesostructure of the sample.
This result can be considered in good agreement with the current literature about binder jetting of 17-4PH [43] and highlights that phase composition can be tailored with material extrusion by changing the extrusion pattern. This is of particular importance since a δ-ferrite content below 10% allows for the mitigation of potentially detrimental effects on the mechanical properties of the final parts [18,44].
The volume fraction of δ-ferrite was quantified from optical micrographs taken on the edge and in the core (see Figure 2) of both the BMD_45 and BMD_90 samples; the corresponding quantitative analyses are reported in Figure 10.
Calculated values of the δ-ferrite phase show a variation between 9% and 12%, with a significantly lower value recorded on the cores of both samples (Figure 10), a trend more pronounced for the BMD_45 sample. In the latter (Figure 10, red bars) the different deposition strategies of the filling pattern are shown to have a remarkable influence not only on the pore distribution (Figure 7) but also on the phase evolution during sintering.
To further investigate the phase distribution and crystallinity of the samples, X-ray diffraction was performed and the results are shown in Figure 11.
The X-ray diffraction patterns of the BMD_45 (black line) and BMD_90 (blue line) samples reported in Figure 11 were acquired along the growth direction (YZ plane). The gray dashed lines identify the δ-ferrite peak positions, corresponding to the PDF card 06-0696. No peaks related to the fcc γ-iron phase are visible in the acquired patterns [26].
It is known that the lattice parameters of the bct martensite crystal vary with carbon content and temperature. In particular, in the case of low-carbon steels (<0.6 wt% C), the tetragonality of the martensite crystal is almost nonexistent [45,46,47]. For this reason, while the presence of both δ-ferrite and martensite has been clearly detected with metallography (Figure 9), X-ray diffraction patterns show only two clear peaks related to the bcc phase [48,49]. Rietveld refinement was performed on both the diffraction patterns of Figure 11 and the comparison between experimental values of the bcc and bct lattice parameters are reported in Table 4, together with the comparison with the nominal lattice parameter value of the ferrite PDF card 06-9606. Rietveld refinement performed on the X-ray diffraction patterns of both samples allowed for the calculation of the lattice parameters of both phases (Table 4) and to compare them with the reference PDF cards (06-0696 PDF card for ferrite and 44-1290 PDF card for martensite).
The values of Table 4 show how the a and c parameters of the tetragonal body-centered lattice structure of martensite are strongly deformed, making this crystalline structure closer to a body-centered one, leading to the diffraction peaks visible in Figure 11. While the obtained ferrite/martensite peaks overlap is typical of 17-4PH stainless steel and similar diffraction patterns can be found in the literature [48,49], the current results are in contrast with the literature about ADAM processing of the same alloy [26], since no peaks related to retained austenite are visible.

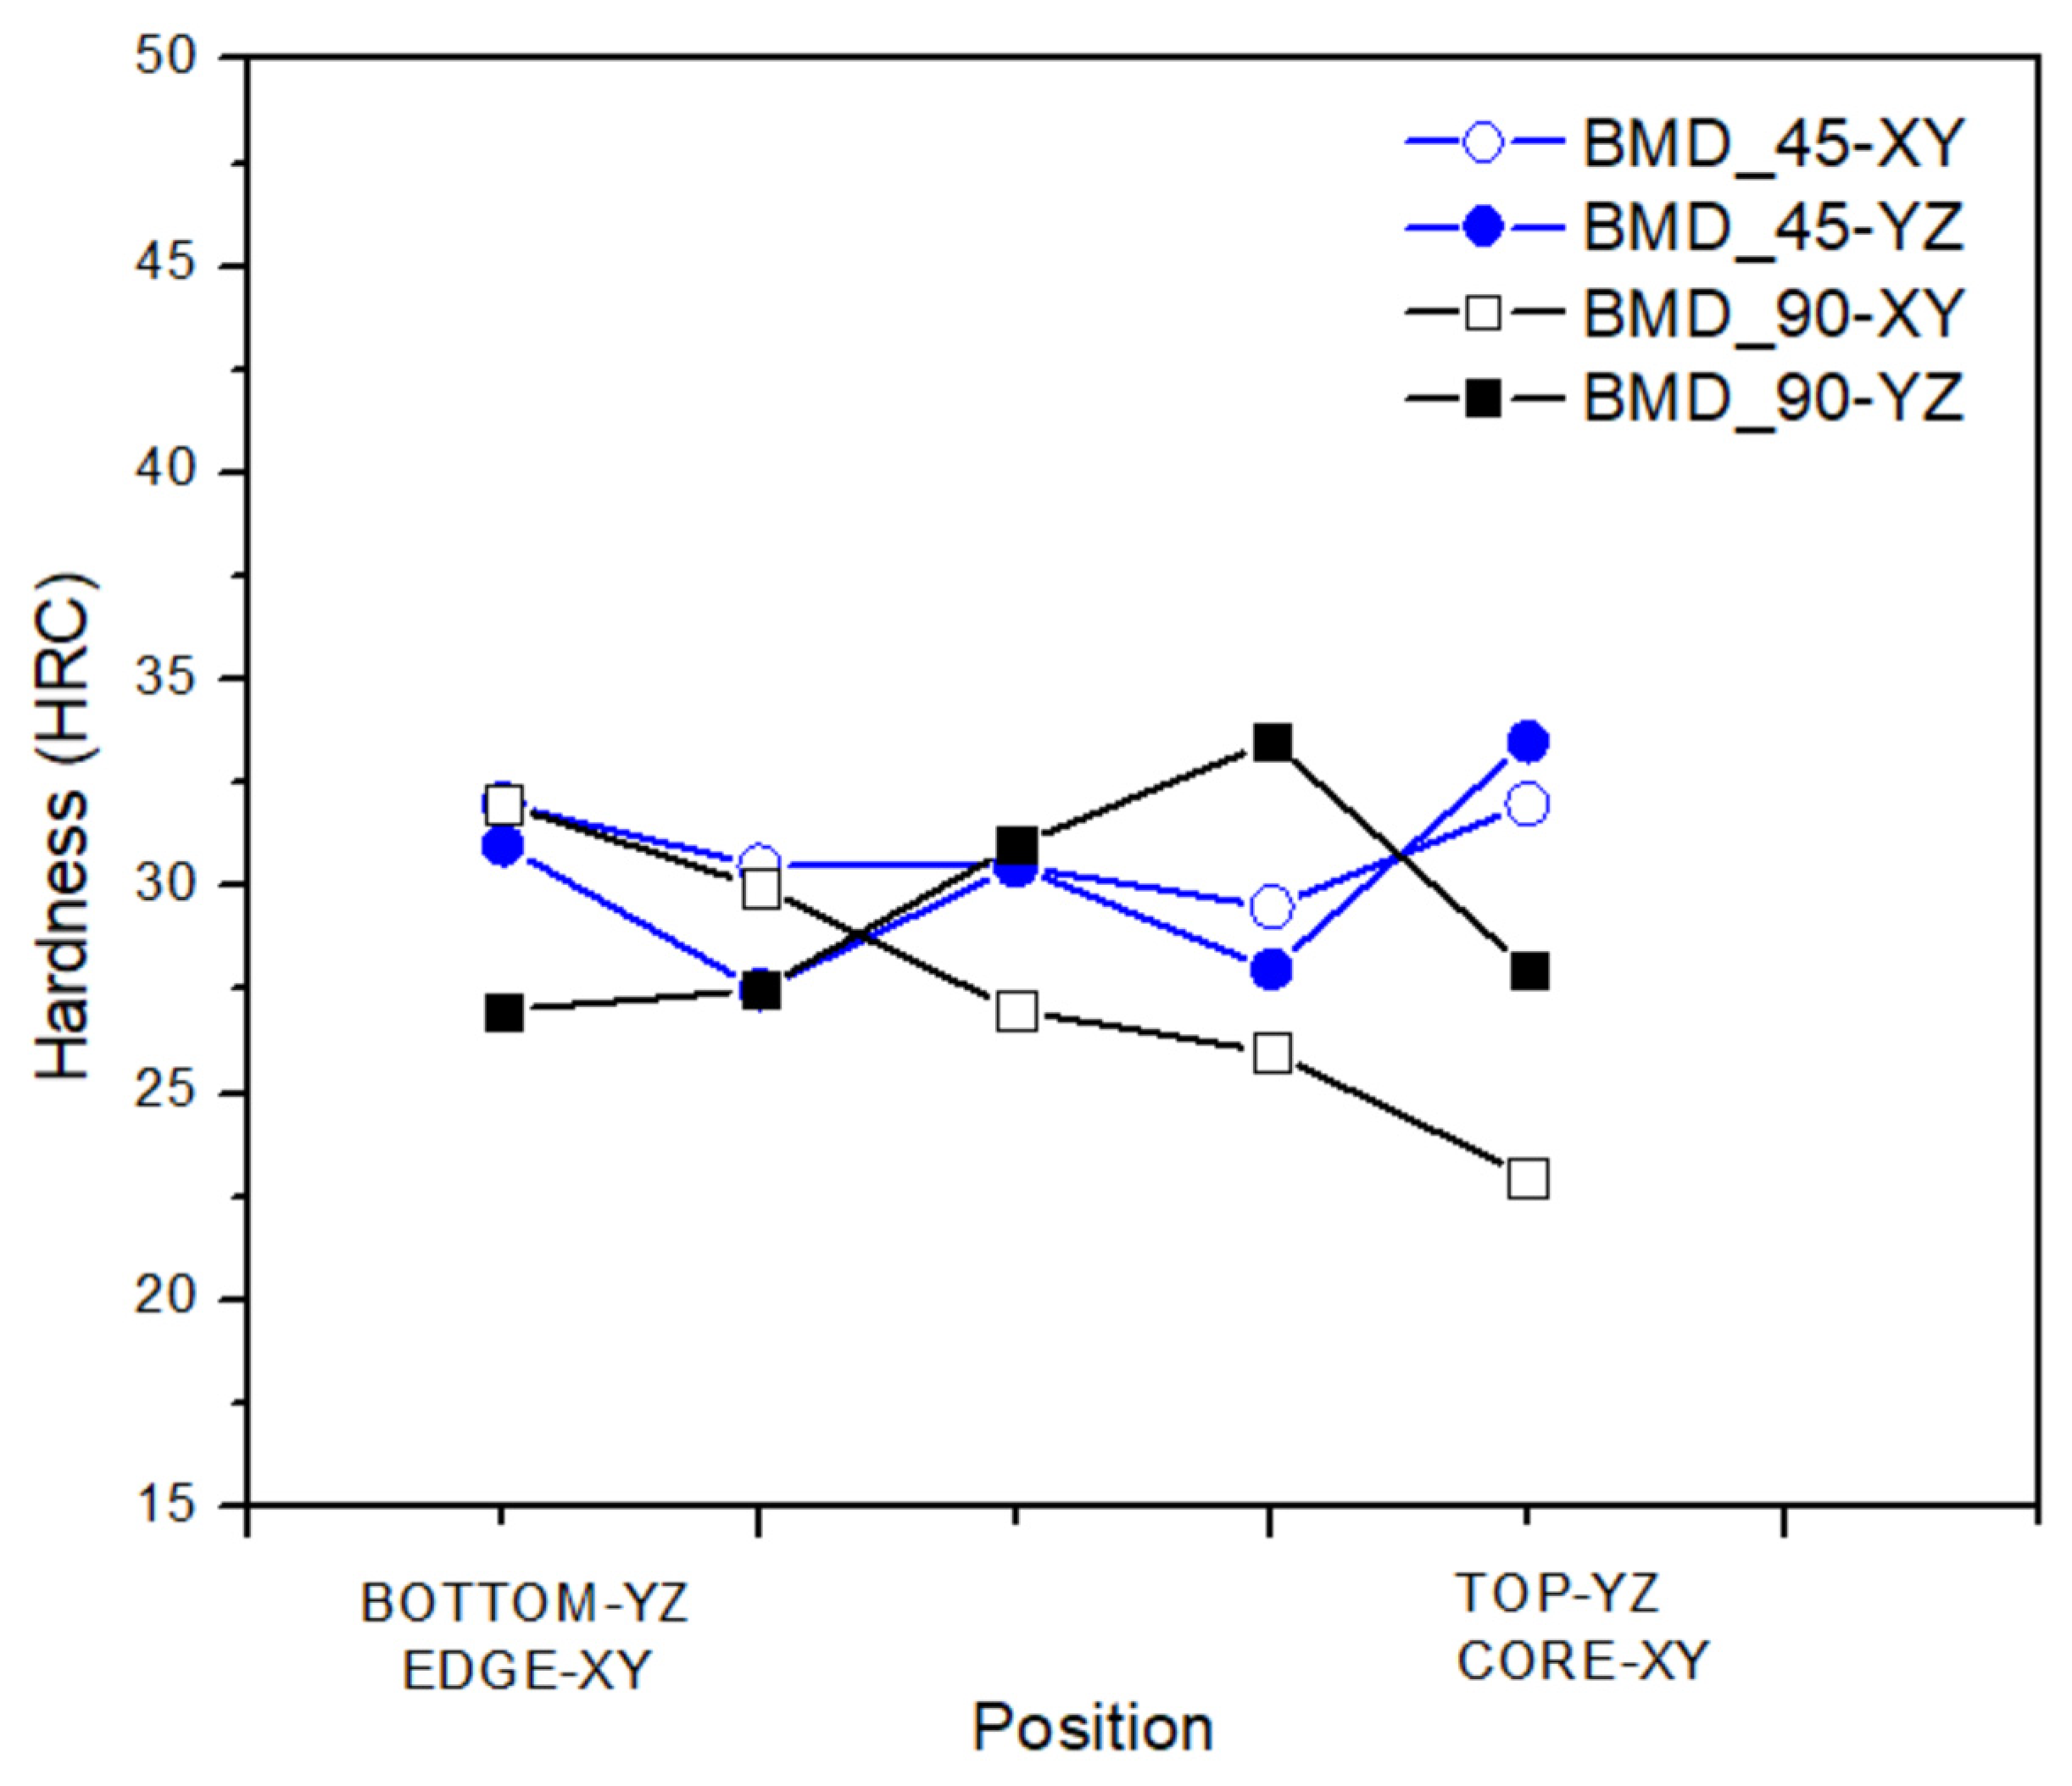
3.4. Mechanical Characterization

Figure 12a shows the microhardness (µHV, 300 gf) profiles for the BMD_90 sample along the growth direction (YZ plane) and remarkable differences can be highlighted between this plane and the XY base plate one (Figure 12b). Along the growth direction, the average microhardness value varies between 289 and 303 HV, without following a particular trend. On the other hand, the average microhardness value on the XY plane varies between 252 and 262 HV. It should be mentioned that some spikes in the µHV average values characterized by a related large standard deviation can be noted in both directions; these can be ascribed to the presence of a large number of pores with different dimensions, ranging between ~5 and ~60 µm, as well as to the presence of inclusions having a chemical composition which differs from the 17-4PH one.
Figure 13 shows the microhardness profiles of the BMD_45 sample in the two considered planes. Along the growth direction, the average microhardness value varies between 279 and 297 HV, on the XY plane values vary between 283 and 293 HV.
Microhardness values of the BMD_45 samples show a trend towards lower average values from the bottom to the top of the YZ sample (Figure 12a), while in the XY direction (Figure 13b) values are quite in line with each other and there is no remarkable trend to be pointed out.
Microhardness results acquired on the XY and YZ planes are reported in Figure 12 for the BMD_90 and in Figure 13 for the BMD_45 one. There is an interesting trend followed by the BMD_45 sample towards lower average values from the bottom to the top of the YZ sample (Figure 13a), while in the XY direction (Figure 13b), values are quite in line with each other. By comparing Figure 12b and Figure 13b, it is clear that the infill deposition strategy impacts also the microhardness values, together with the phase composition. The microhardness values obtained with the 45° (BMD_45) infill deposition strategy are remarkably higher compared to the 90° (BMD_90) strategy. Since all the samples were 3D printed and postprocessed in the same batch and with the same processing conditions, the microhardness results suggest that extrusion-related defects and decohesion of deposited tracks and layers play a major role in determining the local mechanical properties.
Figure 13a suggests a major role for the sintering process, with a pronounced relaxation of the microstructure compared to the bottom side, where the locking effect of the raft and the ceramic interphase layer is consistent. In the XY plane of the BMD_90 sample (Figure 12b), microhardness values seem to be influenced more by the process parameter than by the sintering process. This explains the µHV trend towards higher values moving from the outer area; that is, the contour or the outer border of the sample to the core. While in the former (contour), the printing parameters are optimized to improve the surface finishing, close to the core the printing parameters are optimized to enhance the mechanical properties. In this regard, to improve the surface finishing, the printer extrudes less material on the edge than it does in the inner zone and the applied forces on the layer during the deposition phase are low. This behavior is typical of metal AM processes in general, where the hatching strategy influences the mechanical properties regardless of the nature of the process and the specific alloy, as demonstrated by Saboori et al. [50]. The shown anisotropy is in line with the typical behavior of material extrusion AM parts, suggesting how the combination of the extrusion technology for the green part production and the debinding and sintering operations to get the brown and the final 100% metallic part, are essential and represent an added value peculiar of the BMD technology.
A different mechanical behavior was observed during the Rockwell hardness (HRC) analysis because the measurement was less affected by the printing deposition strategy. Figure 14 summarizes and compares the hardness of three different fabrication processes applied to the 17-4PH stainless steel. Rockwell hardness results for BMD (Figure 14) show a lower value compared to casting since the cooling phase typical of the casting technology is higher than the BMD one. MIM and BMD show comparable hardness values despite the large and well-oriented defects of the latter.
The Results obtained for the BMD_45 and BMD_90 samples, and shown in Figure 14, refer to top-to-bottom YZ plane and to edge-to-core XY plane. The decrease of HRC values for the BMD_90 YZ sample suggests a local anchoring effect of the interface ceramic layer and the raft, which keeps the sample in a fixed position during the furnace sintering. This effect is remarkably influenced by the infill deposition strategy within the first fabricated layers since it is not relevant in the BMD_45 YZ sample nor in the rest of the two YZ samples. A comparison of the obtained values with the literature confirms that this solid-state AM technology is outperforming MIM (ca. 27 HRC, in the as-sintered condition [23]). In particular, comparing experimental values with the literature results concerning other material extrusion AM processes, such as fused filament fabrication (22 HRC [51] to 26 HRC [27]), the performance improvement due to the higher metal-to-binder ratio of the BMD feedstock is remarkable.

4. Conclusions

The purpose of the present paper was to characterize the microstructure and the integrity of samples fabricated by the solid-state AM technology called bound metal deposition (BMD) using 17-4PH stainless steel, using two different infill deposition strategies, namely 45° (BMD_45) and 90° (BMD_90). The main conclusions can be listed as follows:
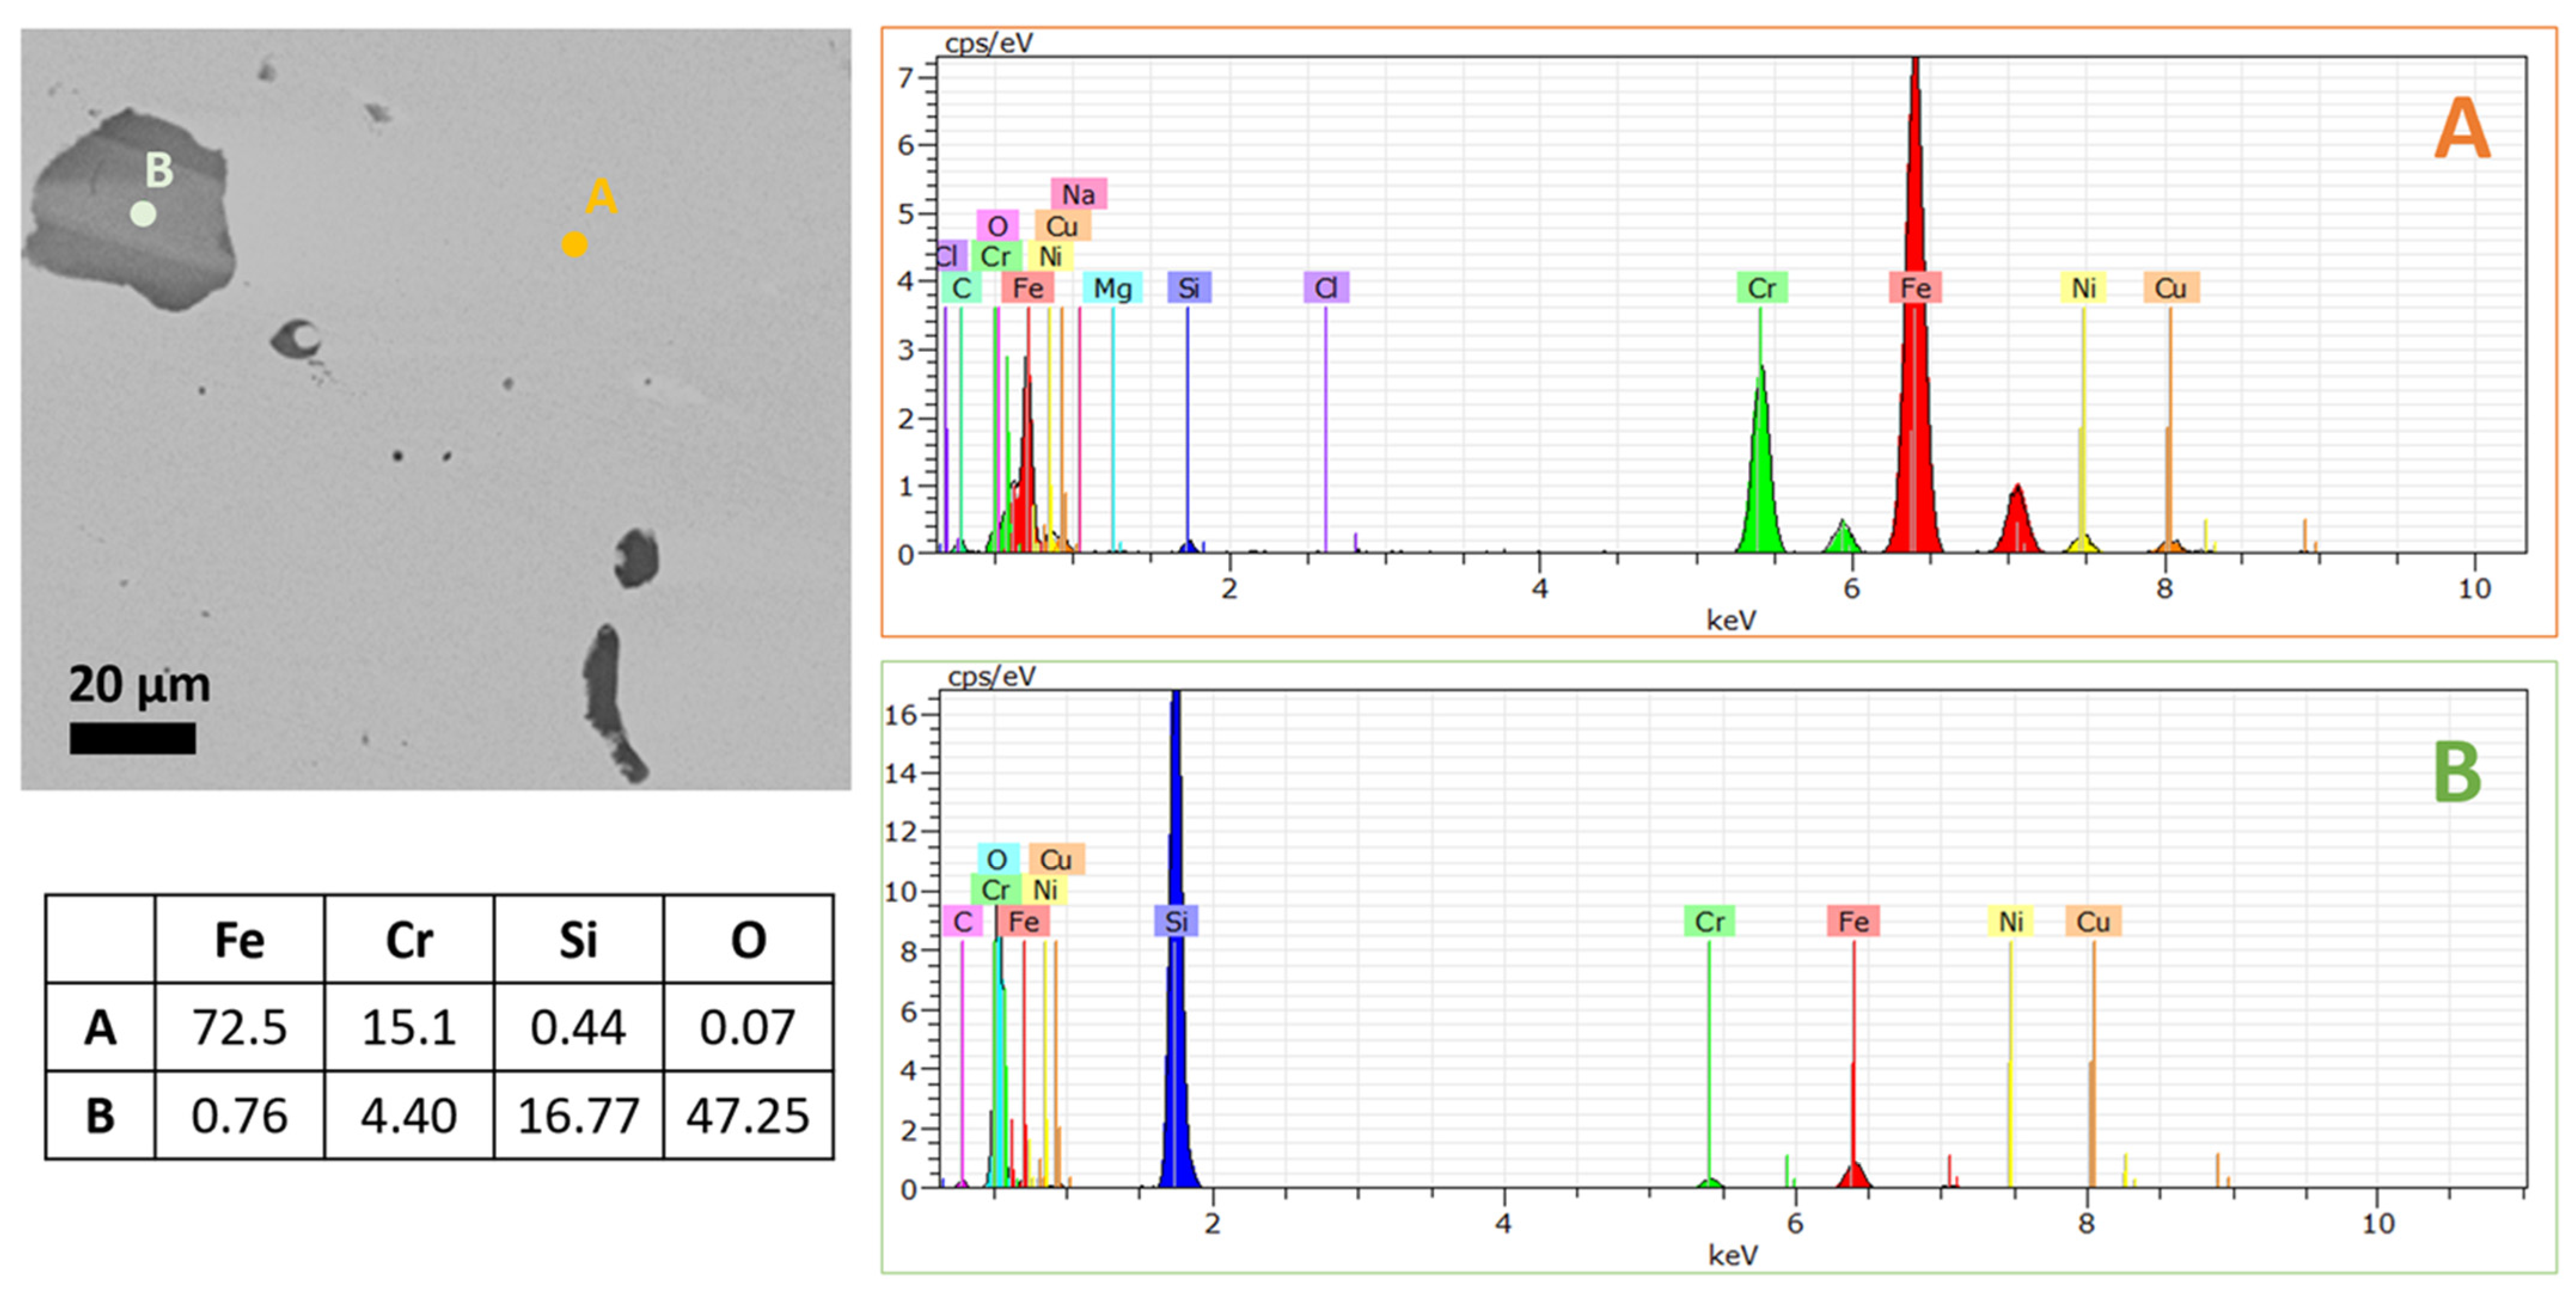
  • − The composite feedstock rods characterization highlighted the presence of contaminant particles, whose nature shall be further investigated;
  • − Oxide particles with a high percentage of silicon, oxygen, aluminum, and manganese were found inside the feedstock rod. Their presence was spotted as well on the as-fabricated sample;
  • − Investigations allowed for the isolation of different defects and to correlate their nature with the AM process and/or the feedstock quality;
  • − The infill deposition strategy was shown to have a direct influence on the phase composition and the microhardness of the fabricated samples. The 45° infill strategy is shown to be the most reliable option when limited δ-ferrite content and high hardness are required.

Author Contributions

Conceptualization, V.D.P., E.S.; methodology, S.S.; validation, V.D.P., A.S., K.S.; investigation, M.C., A.S., V.D.P. and K.S.; writing—original draft preparation, E.S., V.D.P.; writing—review and editing, K.S., M.C. and S.S. All authors have read and agreed to the published version of the manuscript.

Funding

This research was partially funded by the Grant of Excellence Departments, MIUR-Italy (ARTICOLO 1, COMMI 314–337 LEGGE 232/2016). Financed by the European Union-NextGenerationEU (National Sustainable Mobility Center CN00000023, Italian Ministry of University and Research Decree n. 1033-17/06/2022, Spoke 11- Innovative Materials and Lightweighting), and National Recovery and Resilience Plan (NRRP), Mission 04 Component 2 Investment 1.5-NextGenerationEU, Call for tender n. 3277 dated 30 December 2021. The opinions expressed are those of the authors only and should not be considered representative of the European Union or the European Commission’s official position. Neither the European Union nor the European Commission can be held responsible for them.

Data Availability Statement

The data presented in this study are freely available on request from the corresponding author.

Conflicts of Interest

The authors declare no conflict of interest.

References

  1. Klocke, F.; Arntz, K.; Teli, M.; Winands, K.; Wegener, M.; Oliari, S. State-of-the-art Laser Additive Manufacturing for Hot-work Tool Steels. Procedia CIRP 2017, 63, 58–63. [Google Scholar] [CrossRef]
  2. ASTM F2792-12; Standard Terminology for Additive Manufacturing Technologies. ASTM International: West Conshohocken, PA, USA, 2012.
  3. Khorasani, M.; Loy, J.; Ghasemi, A.H.; Sharabian, E.; Leary, M.; Mirafzal, H.; Cochrane, P.; Rolfe, B.; Gibson, I. A review of Industry 4.0 and additive manufacturing synergy. Rapid Prototyp. J. 2022, 28, 1462–1475. [Google Scholar] [CrossRef]
  4. Herzog, D.; Seyda, V.; Wycisk, E.; Emmelmann, C. Additive manufacturing of metals. Acta Mater. 2016, 117, 371–392. [Google Scholar] [CrossRef]
  5. Reza Jandaghi, M.; Pouraliakbar, H.; Shim, S.H.; Fallah, V.; Hong, S.I.; Pavese, M. In-situ alloying of stainless steel 316L by co-inoculation of Ti and Mn using LPBF additive manufacturing: Microstructural evolution and mechanical properties. Mater. Sci. Eng. A 2022, 857, 144114. [Google Scholar] [CrossRef]
  6. Reza Jandaghi, M.; Pouraliakbar, H.; Iannucci, L.; Fallah, V.; Pavese, M. Comparative assessment of gas and water atomized powders for additive manufacturing of 316 L stainless steel: Microstructure, mechanical properties, and corrosion resistance. Mater. Charact. 2023, 204, 113204. [Google Scholar] [CrossRef]
  7. Galati, M.; Calignano, F.; Viccica, M.; Iuliano, L. Additive Manufacturing Redesigning of Metallic Parts for High Precision Machines. Crystals 2020, 10, 161. [Google Scholar] [CrossRef]
  8. Zhai, Y.; Lados, D.A.; LaGoy, J.L. Additive Manufacturing: Making Imagination the Major Limitation. JOM 2014, 66, 808–816. [Google Scholar] [CrossRef]
  9. DebRoy, T.; Wei, H.L.; Zuback, J.S.; Mukherjee, T.; Elmer, J.W.; Milewski, J.O.; Beese, A.M.; Wilson-Heid, A.; De, A.; Zhang, W. Additive manufacturing of metallic components–Process, structure and properties. Prog. Mater. Sci. 2018, 92, 112–224. [Google Scholar] [CrossRef]
  10. Bjørheim, F.; La Torraca Lopez, I.M. Tension testing of additively manufactured specimens of 17-4 PH processed by Bound Metal Deposition. IOP Conf. Ser. Mater. Sci. Eng. 2021, 1201, 012037. [Google Scholar] [CrossRef]
  11. Abe, Y.; Kurose, T.; Santos, M.V.A.; Kanaya, Y.; Ishigami, A.; Tanaka, S.; Ito, H. Effect of Layer Directions on Internal Structures and Tensile Properties of 17-4PH Stainless Steel Parts Fabricated by Fused Deposition of Metals. Materials 2021, 14, 243. [Google Scholar] [CrossRef]
  12. Tuncer, N.; Bose, A. Solid-State Metal Additive Manufacturing: A Review. JOM 2020, 72, 3090–3111. [Google Scholar] [CrossRef]
  13. Gabilondo, M.; Cearsolo, X.; Arrue, M.; Castro, F. Influence of Build Orientation, Chamber Temperature and Infill Pattern on Mechanical Properties of 316 L Parts Manufactured by Bound Metal Deposition. Materials 2022, 15, 1183. [Google Scholar] [CrossRef]
  14. Watson, A.; Belding, J.; Ellis, B.D. Characterization of 17-4 PH Processed via Bound Metal Deposition (BMD). In TMS 2020, 149th Annual Meeting & Exhibition Supplemental Proceedings; The Minerals, Metals & Materials Series; Springer: Cham, Switzerland, 2020. [Google Scholar]
  15. Strano, M.; Rane, K.; Briatico Vangosa, F.; Di Landro, L. Extrusion of metal powder-polymer mixtures: Melt rheology and process stability. J. Mater. Process. Technol. 2019, 273, 116250. [Google Scholar] [CrossRef]
  16. Machaka, R. Metal injection moulding of a 17-4 PH stainless steel: A comparative study of mechanical properties. IOP Conf. Ser. Mater. Sci. Eng. 2018, 430, 012033. [Google Scholar] [CrossRef]
  17. Sung, H.-J.; Ha, T.K.; Ahn, S.; Chang, Y.W. Powder injection molding of a 17-4 PH stainless steel and the effect of sintering temperature on its microstructure and mechanical properties. J. Mater. Process. Technol. 2002, 130–131, 321–327. [Google Scholar] [CrossRef]
  18. German, R.M. MIM 17–4 PH stainless steel: Processing, properties and best practice. Powder Inject. Mould. Int. 2018, 12, 49–76. [Google Scholar]
  19. Di Pompeo, V.; Santoni, A.; Santecchia, E.; Spigarelli, S. On the Short-Term Creep Response at 482 °C (900 °F) of the 17-4PH Steel Produced by Bound Metal Deposition. Metals 2022, 12, 477. [Google Scholar] [CrossRef]
  20. Specialty Steel Supply. 17-4PH Stainless Steel. Available online: http://www.specialtysteelsupply.com/17-4ph-stainless-steel (accessed on 16 May 2022).
  21. Markforged. 17-4PH Stainless Steel Datasheet. Available online: https://markforged.com/materials/metals/17-4-ph-stainless-steel (accessed on 8 May 2022).
  22. Zai, L.; Zhang, C.; Wang, Y.; Guo, W.; Wellmann, D.; Tong, X.; Tian, Y. Laser Powder Bed Fusion of Precipitation-Hardened Martensitic Stainless Steels: A Review. Metals 2020, 10, 255. [Google Scholar] [CrossRef]
  23. Pellegrini, A.; Lavecchia, F.; Guerra, M.G.; Galantucci, M.L. Influence of aging treatments on 17–4 PH stainless steel parts realized using material extrusion additive manufacturing technologies. Int. J. Adv. Manuf. Technol. 2023, 126, 163–178. [Google Scholar] [CrossRef]
  24. Gonzalez-Gutierrez, J.; Arbeiter, F.; Schlauf, T.; Kukla, C.; Holzer, C. Tensile properties of sintered 17–4PH stainless steel fabricated by material extrusion additive manufacturing. Mater. Lett. 2019, 248, 165–168. [Google Scholar] [CrossRef]
  25. Galati, M.; Minetola, P. Analysis of Density, Roughness, and Accuracy of the Atomic Diffusion Additive Manufacturing (ADAM) Process for Metal Parts. Materials 2019, 12, 4122. [Google Scholar] [CrossRef] [PubMed]
  26. Akessa, A.D.; Tucho, W.M.; Lemu, H.G.; Grønsund, J. Investigations of the Microstructure and Mechanical Properties of 17-4 PH ss Printed Using a MarkForged Metal X. Materials 2022, 15, 6898. [Google Scholar] [CrossRef]
  27. Kedziora, S.; Decker, T.; Museyibov, E.; Morbach, J.; Hohmann, S.; Huwer, A.; Wahl, M. Strength Properties of 316L and 17-4 PH Stainless Steel Produced with Additive Manufacturing. Materials 2022, 15, 6278. [Google Scholar] [CrossRef] [PubMed]
  28. Desktop Metal. 17-4PH Datasheet. Available online: https://www.desktopmetal.com/uploads/BMD-SPC-MDS-17-4ph-211112_c.pdf (accessed on 10 May 2022).
  29. Rasband, W.S. ImageJ; U.S. National Institutes of Health: Bethesda, MD, USA, 2016.
  30. ASTM E562-19e1; Standard Test Method for Determining Volume Fraction by Systematic Manual Point Count. ASTM International: West Conshohocken, PA, USA, 2022.
  31. Döbelin, N.; Kleeberg, R. Profex: A graphical user interface for the Rietveld refinement program BGMN. J. Appl. Crystallogr. 2015, 48, 1573–1580. [Google Scholar] [CrossRef]
  32. Hausnerova, B.; Mukund, B.N.; Sanetrnik, D. Rheological properties of gas and water atomized 17-4PH stainless steel MIM feedstocks: Effect of powder shape and size. Powder Technol. 2017, 312, 152–158. [Google Scholar] [CrossRef]
  33. Contreras, J.M.; Jiménez-Morales, A.; Torralba, J.M. Influence of the Morphology and Particle Size on the Processing of Bronze 90/10 Powders by Metal Injection Moulding (MIM). Mater. Sci. Forum 2007, 534–536, 365–368. [Google Scholar] [CrossRef]
  34. Seerane, M.; Ndlangamandla, P.; Machaka, R. The influence of particle size distribution on the properties of metal injection-moulded 17-4 PH stainless steel. J. S. Afr. Inst. Min. Metall. 2016, 116, 935–940. [Google Scholar] [CrossRef]
  35. German, R.M.; Bose, A. Injection Molding of Metals and Ceramics; Metal Powder Industries Federation: Princeton, NJ, USA, 1997. [Google Scholar]
  36. Forcellese, P.; Mancia, T.; Simoncini, M.; Bellezze, T. Investigation on Corrosion Resistance Properties of 17-4 PH Bound Metal Deposition As-Sintered Specimens with Different Build-Up Orientations. Metals 2022, 12, 588. [Google Scholar] [CrossRef]
  37. Nyborg, I.; Tunberg, T.; Wang, P.X. Surface product formation during water atomization and sintering of austenitic stainless steel powder. Met. Powder Rep. 1990, 45, 750–753. [Google Scholar] [CrossRef]
  38. Wu, M.-W.; Huang, Z.-K.; Tseng, C.-F.; Hwang, K.-S. Microstructures, Mechanical Properties, and Fracture Behaviors of Metal-Injection Molded 17-4PH Stainless Steel. Met. Mater. Int. 2015, 21, 531–537. [Google Scholar] [CrossRef]
  39. Suwanpreecha, C.; Manonukul, A. On the build orientation effect in as-printed and as-sintered bending properties of 17-4PH alloy fabricated by metal fused filament fabrication. Rapid Prototyp. J. 2022, 28, 1076–1085. [Google Scholar] [CrossRef]
  40. Li, K.; Sridar, S.; Tan, S.; Xiong, W. Effect of homogenization on precipitation behavior and strengthening of 17-4PH stainless steel fabricated using laser powder bed fusion. arXiv 2021, arXiv:2112.06289. [Google Scholar]
  41. Stoudt, M.R.; Ricker, R.E.; Lass, E.A.; Levine, L.E. The Influence of Post-Build Microstructure on the Electrochemical Behavior of Additively Manufactured 17-4 PH Stainless Steel. JOM 2017, 69, 506–515. [Google Scholar] [CrossRef]
  42. Wu, Y.; German, R.M.; Blaine, D.; Marx, B.; Schlaefer, C. Effects of residual carbon content on sintering shrinkage, microstructure and mechanical properties of injection molded 17-4 PH stainless steel. J. Mater. Sci. 2022, 37, 3573–3583. [Google Scholar] [CrossRef]
  43. Huber, D.; Vogel, L.; Fischer, A. The effects of sintering temperature and hold time on densification, mechanical properties and microstructural characteristics of binder jet 3D printed 17-4 PH stainless steel. Addit. Manuf. 2011, 46, 102114. [Google Scholar] [CrossRef]
  44. Kazior, J. Influence of Sintering Atmosphere, Temperature and the Solution-Annealing Treatment on the Properties of Precipitation-Hardening Sintered 17-4 PH Stainless Steel. Materials 2023, 16, 760. [Google Scholar] [CrossRef]
  45. Abbaschian, R.; Abbaschian, L.; Reed-Hill, R.E. Physical Metallurgy Principles, 4th ed.; Cengage Learning: Stamford, CA, USA, 2009. [Google Scholar]
  46. Hutchinson, B.; Hagström, J.; Karlsson, O.; Lindell, D.; Tornberg, M.; Lindberg, F.; Thuvander, M. Microstructures and hardness of as-quenched martensites (0.1–0.5% C). Acta Mater. 2011, 59, 5845–5858. [Google Scholar] [CrossRef]
  47. Gyhlesten Back, J.; Babu Surreddi, K. Microstructure analysis of martensitic low alloy carbon steel samples subjected to deformation dilatometry. Mater. Charact. 2019, 157, 109926. [Google Scholar] [CrossRef]
  48. Lou, J.; He, H.; Li, Y.; Zhang, H.; Fang, Z.; Wei, X. Effects of Trace Carbon Contents on Lattice Distortion and Nano-Copper Phase Precipitation in Metal Injection-Molded 17-4PH Stainless Steel. JOM 2019, 71, 1073–1081. [Google Scholar] [CrossRef]
  49. Schroeder, R.; Hammes, G.; Binder, C.; Klein, A.N. Plasma Debinding and Sintering of Metal Injection Moulded 17-4PH Stainless Steel. Mater. Res. 2011, 14, 564–568. [Google Scholar] [CrossRef]
  50. Saboori, A.; Piscopo, G.; Lai, M.; Salmi, A.; Biamino, S. An investigation on the effect of deposition pattern on the microstructure, mechanical properties and residual stress of 316L produced by Directed Energy Deposition. Mater. Sci. Eng. A 2020, 780, 139179. [Google Scholar] [CrossRef]
  51. Zhang, Y.; Roch, A. Fused filament fabrication and sintering of 17-4PH stainless steel. Manuf. Lett. 2022, 33, 29–32. [Google Scholar] [CrossRef]
Figure 1. Details of the sample used in the current study: (a) Schematic design of the 3D-printed stainless steel sample used in the present work; (b) Section of the sample in the build preparation software printing software, (c) Picture of one of the fabricated samples. Investigated areas are arrowed in blue, while the printing direction is indicated in red.
Crystals 13 01312 g001
Figure 2. Schematics of the XY cross-section of the characterized samples: (a) BMD_90, (b) BMD_45. Microstructural investigations were performed on the edge (blue dot) and on the core (red rectangle) of the samples.
Crystals 13 01312 g002
Figure 3. Schematic representation of the microhardness test plan indentations of the present work (number of indentations in the schematic is not representative).
Crystals 13 01312 g003
Figure 4. The 17-4PH composite rod analysis: (a) SEM-BSE micrograph and (b) particle size distribution and cumulative fraction.
Crystals 13 01312 g004
Figure 5. BSE micrograph and EDS elemental map of silicon and oxygen in the 17-4PH composite feedstock. The reported EDS spectrum was acquired in the orange dot position. Different colors of the EDS map correspond to Silicon (red), Oxygen (blue), and Aluminum (green).
Crystals 13 01312 g005
Figure 6. Optical micrographs of the YZ samples: (a) BMD_45, (b) BMD_90, and SEM-BSE micrographs of the mirror-polished YZ surface (BMD_90): (c) low magnification image with low brightness–high contrast balance to highlight the brightest inclusions, (d) high magnification image with high brightness–mid contrast balance to highlight the darker areas surrounding the extrusion-related pore.
Crystals 13 01312 g006
Figure 7. Optical micrographs of the XY samples: (a) BMD_90 close to the edge, (b) BMD_90 core of the sample, (c) BMD_45 close to the edge, and (d) BMD_45 core of the sample.
Crystals 13 01312 g007
Figure 8. Energy dispersive spectroscopy (EDS) spectra taken in positions A and B of the SEM micrograph on the left (BMD_90 sample). Quantitative (wt.%) amounts of the main elements varying between point A and point B are also reported.
Crystals 13 01312 g008
Figure 9. Optical micrographs of the etched investigated samples: (a) BMD_90 XY, (b) BMD_90 YZ, (c), BMD_45 XY, and (d) BMD_45 YZ.
Crystals 13 01312 g009
Figure 10. The δ-ferrite volume fraction resulting from phase quantification (ASTM E562) on the edge and on the core of both the BMD_90 (blue bars) and BMD_45 (red bars) samples. The error bar of the BMD_45 edge condition is very thin and overlaps with the contour of the bar itself.
Crystals 13 01312 g010
Figure 11. X-ray diffraction patterns of the two samples. Grey dashed lines are the peak positions identified by the PDF card 06-0696 (bcc ferrite).
Crystals 13 01312 g011
Figure 12. HV microhardness profiles (300 gf) of the BMD_90 sample collected: (a) on the growth direction (plane YZ) and (b) on the XY plane.
Crystals 13 01312 g012
Figure 13. HV microhardness profiles (300 gf) of the BMD_45 sample collected: (a) and on the growth direction (plane YZ) and (b) on the XY plane.
Crystals 13 01312 g013
Figure 14. Comparison of HRC hardness values acquired on the growth direction and on the XY plane of the BMD_45 (blue dots) and BMD_90 (black squares) samples.
Crystals 13 01312 g014
Table 1. Chemical composition (wt.%) of the 17-4PH stainless steel feedstock.
FeCrCuNiNb + TaMnC
Bal.15.5–17.53–53–50.29<1.00<0.07
Table 2. List of the process parameters used for the 3D-printing process.
Process ParameterValue
Nozzle diameter [mm]400
Printing speed [mm/s]30
Infill strategy100%
Overlap0%
Layer height [mm]0.15
Table 3. Representative percentiles calculated from SEM micrographs of the composite rod (AVG stands for average and SD for standard deviation).
D10D50D90
AVG4.515.545.0
SD0.50.52.0
Table 4. Experimental lattice parameters were calculated from peak position in the XRD patterns by Rietveld refinement. First row shows the nominal lattice parameter value from the ferrite 06-0696 PDF card and martensite 44-1290 PDF card.
Sampleδ-Ferrite (nm)α-Martensite (nm)
Referencea = 0.2866 (PDF 06-0696)a = 0.2859 (PDF 44-1290)
c = 0.2937
BMD_45a = 0.2863 ± 0.0001a = 0.2851
c = 0.2878 ± 0.0001
BMD_90a = 0.2863 ± 0.0001a = 0.2851
c = 0.2877 ± 0.0001
Disclaimer/Publisher’s Note: The statements, opinions and data contained in all publications are solely those of the individual author(s) and contributor(s) and not of MDPI and/or the editor(s). MDPI and/or the editor(s) disclaim responsibility for any injury to people or property resulting from any ideas, methods, instructions or products referred to in the content.

