Abstract
Nanoparticles have a negative effect on the preparation of Gallium Nitride (GaN) by Metal-Organic Chemical Vapor Deposition (MOCVD). We developed a particle tracking and particle-wall collision model coupled with the bulk gas flow solver to investigate the motion and deposition of nanoparticles in single-wafer and multi-wafer reactors. The results indicated that for the single-wafer reactor, there is no particle deposition on the reactor wall and susceptor, but there is the endless movement of some particles within the reactor, which should be avoided. For the multi-wafer reactors, some of the nanoparticles are deposited near the axis, and those whose initial position is beyond a certain position from the axis are trapped in a vortex above the receptor, resulting in more complex by-products, although no particles are trapped in endless motion. Moreover, the effects of the rotational speed of the susceptor on the deposition rate for both the single-wafer reactor and the multi-wafer reactor were also simulated and analyzed.
1. Introduction
III-V nitride semiconductors (AlN, GaN, and AlGaN) have great potential for ultraviolet LEDs and laser diodes [1,2,3]. Commercially, GaN/AlN is grown by Metal-Organic Chemical Vapor Deposition (MOCVD). To obtain the desired properties, MOCVD is carried out at high temperatures for growing GaN/AlN, which may result in some additional reactions [4,5,6,7,8]. The formation of GaN/AlN nanoparticles is one of the well-known by-products. It has been experimentally observed that nanoparticles are formed just above the hot susceptor, which not only consumes the gas source but also impairs the properties of GaN/AlN films, especially in rotary reactors [7]. According to the flow direction of the source gas, there are two types of reactors, horizontal reactors and vertical reactors [9,10]. In a horizontal reactor, the gas introduced into the reactor flows parallel to the susceptor, while in a vertical reactor, the gas flows perpendicular to the susceptor. The GaN/AlN films deposited in a rotating vertical reactor are more uniform and have better performance than those in a horizontal reactor. However, the flow in a vertical reactor is much more complicated due to rotation, resulting in a more perplexed motion of nanoparticles. The exact behavior of the particles is not well understood, and a better understanding might lead to improved reactor designs that may reduce the waste of raw materials and improve the performance of the film.
The flow field in MOCVD reactors has been of great concern. By varying the process parameters (pressure, rotation speed, and gas flow rate), Li et al. [11] confirmed the internal flow stability of the reactor, temperature boundary layer distribution, thin film thickness, and deposition rate uniformity, and predicted the optimal process parameters. Wang et al. [12] combined the results of the flow field with the machine learning method KNN to achieve the growth of a high deposition rate, with a 30% improvement in uniformity at a steady flow state of plug flow. Using computational fluid dynamics (CFD), Wang et al. [13] explained the influence of the flow field change on the deposition rate and film uniformity by analyzing the temperature and flow fields of the reactor. Wu et al. [14] found that temperature variations directly affect the axial and lateral uniformity of deposition but had a minor impact on the size and position of transverse rolls by assessing the mixed convective flow and heat transfer inside the reactor chamber. In recent years, progress has been made in the research of nanoparticles in MOCVD reactors. Lin et al. [15] established a numerical model to understand the particle transport phenomenon during the pulsed MOCVD process. Iliescu et al. [16] found that the amorphous chromium carbide coating, which is deposited by DLIMOCVD at temperatures between 325 and 500 °C, could be described as amorphous nanocomposite coatings composed of disordered free-C nanoparticles embedded in an amorphous carbide matrix. Li et al. [17] proposed a chemical reaction-transfer model for the formation of ZnO by the reaction of DEZn with O2 during MOCVD and revealed the effect of nucleation and formation of nanoparticles on the growth of the films. Tang et al. [18] calculated the formation path of large-sized molecules that have the possibility to become a nanoparticle nucleus during MOCVD gas phase growth and explained the mechanism of the gas phase scavenging effect. However, the motion of nanoparticles in rotary vertical MOCVD reactors for growing GaN still remains unknown. The purpose of this study is to numerically investigate the motion and deposition of nanoparticles in two rotary vertical MOCVD reactors for growing GaN with flow and thermal fields, trajectories of the particles, final states of particles, and the effects of the rotational speed of the susceptor on the deposition rate in the rotary reactors.
2. Numerical Model
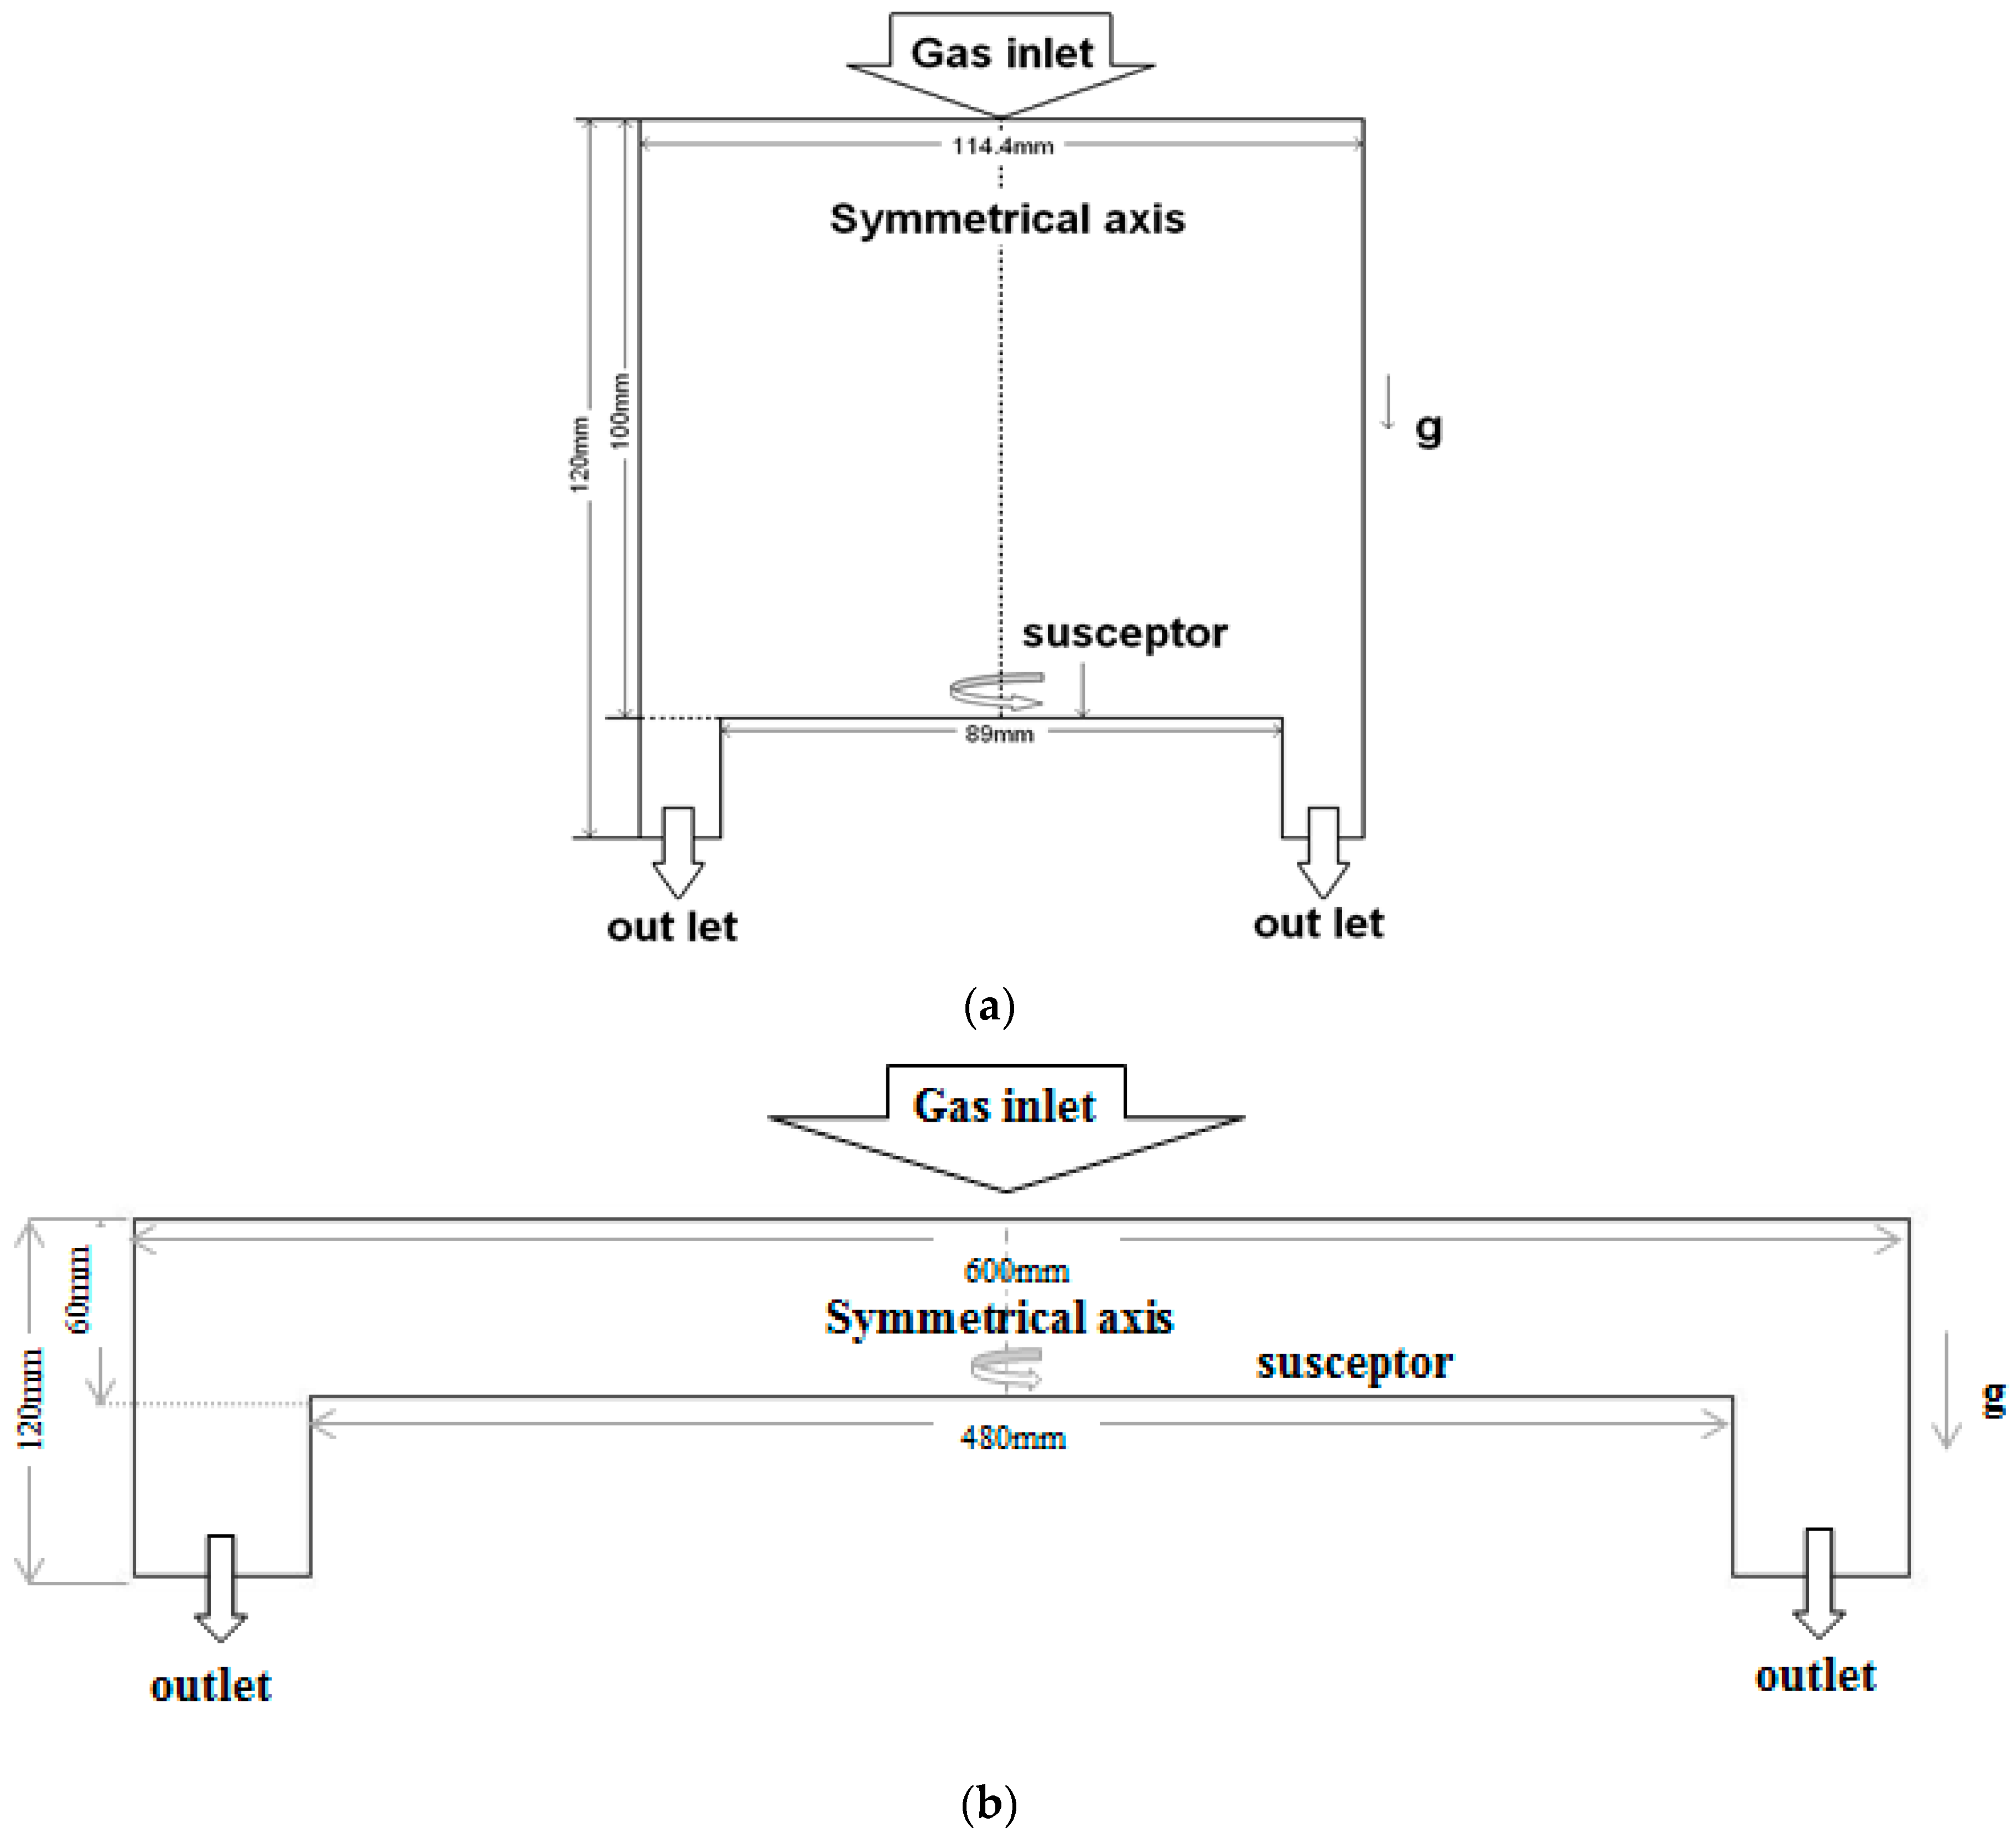
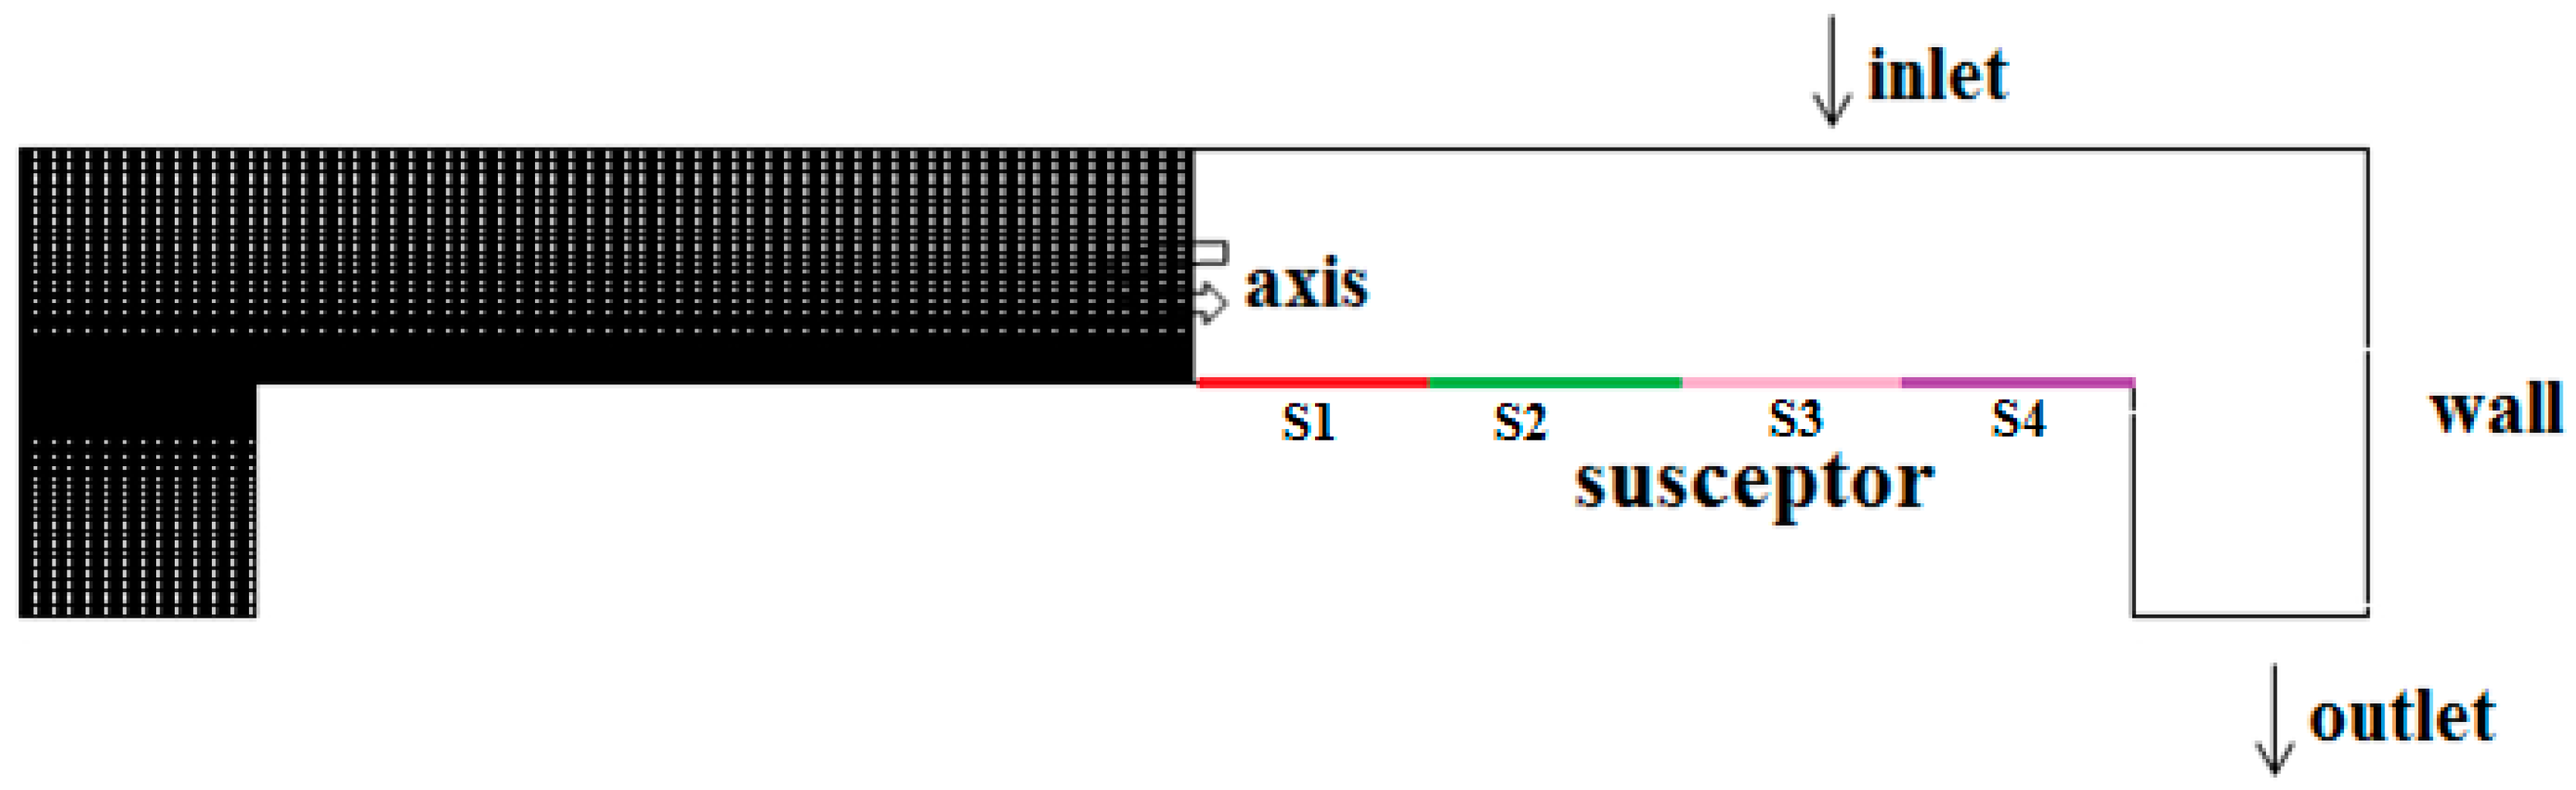
To study the motion and deposition of nanoparticles in rotary MOCVD reactors for the growth of GaN semiconductor thin films, two types of rotary MOCVD reactors are employed, a single-wafer reactor and a multi-wafer reactor, which are schematically shown in Figure 1. In the single-wafer reactor shown in Figure 1a, the diameter of the susceptor is 89 mm, and only one wafer is placed at the center of the susceptor and rotates with the susceptor. Meanwhile, in the multi-wafer reactor shown in Figure 1b, multiple wafers with the same radii are symmetrically placed on the susceptor, in which the diameter of the susceptor is 480 mm. The diameter of the wafer for both single-wafer and multi-wafer reactors is approximately 2 inches (50.8 mm), and the gaps between the wafers in the multi-wafer reactor are ignored. It is also assumed that the thickness of the wafers is ignored, and the wafers are covered on the susceptor. In both types of reactors, the carrier gas is hydrogen and nitrogen, and the flow rate of H2 and N2 is 60 and 40 L/min, respectively. The temperature of the inlet gas and wall is 300 K and that of the susceptor is 1300 K, and the average density is approximately 0.55 kg/m3. The operation pressure is Pa. The rotating speed of the susceptor is 80–120 rad/s.
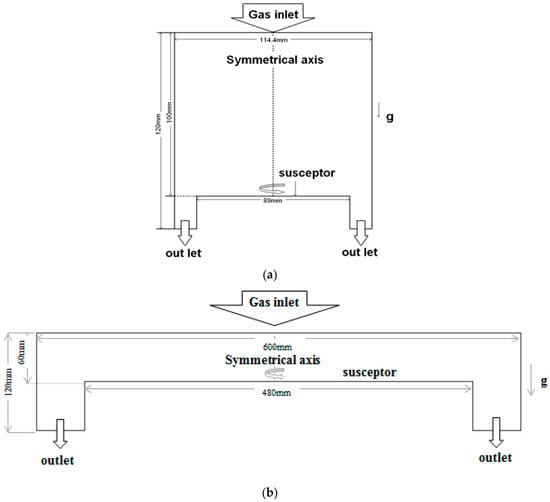
Figure 1.
Schematic diagram of MOCVD reactors: (a) Single-wafer and (b) multi-wafer reactors.
To facilitate numerical simulation and analysis of the flow field and thermal field inside the reactor, the following assumptions are made: (1) The gas in the reactor is Newtonian fluid and incompressible. (2) The density of the gas is approximated by Boussinesq assumption. Based on these assumptions, the governing equations for the flow and thermal field are established as follows.
where is the velocity vector, is the density of the gas, is the pressure, is the temperature, is the kinetic viscosity, is the heat capacity, and is the thermal coefficient, which are all temperature dependent.
The radiative heat transport is also considered in the model. Let stand for a radiative enclosure. The surface temperature and the net heat flux of are related by the following integral relationship [19]:
where and are infinitesimal radiative surface elements on . is the area of the infinitesimal surface element . is the surface view factor between and .
The Reynolds number is always used to indicate whether the airflow is laminar or turbulent [20], and this study will discuss the effects of the rotating speed of the susceptor, so the Reynolds number corresponding to susceptor rotation is defined as
where is the radius of the rotary susceptor, is the rotating speed, and is the kinematic viscosity of the gas, which is . The Reynolds numbers of the flow in the single-wafer reactor and the multi-wafer reactor are 3369 and , respectively, which indicate that the flow in the single-wafer reactor and the multi-wafer reactor is laminar and turbulent, respectively.
Experimental observations by JR Creighton show that GaN nanoparticles are formed just above the susceptor, and the diameter of the particles ranges from 20 nm to a few microns [7]. Therefore, the particles were initialized 0.1 mm above the susceptor with an initial velocity of zero, and the diameter of the particles in the simulation is 100 nm in this study. The study mainly focuses on the movement and deposition of the GaN nanoparticles in the furnace, so the chemical composition of the gas phase and the chemical aspect of gas-phase nucleation are not taken into account. Since the volume fraction of particles is very small in the gas flow, we assumed that the particles are affected by the gas flow, but do not affect the flow, and the interactions between particles were ignored. The trajectories of nanoparticles were simulated using the Langevin equation, which is written as
where is the mass of a nanoparticle and is the velocity. is the Brownian force due to the molecules of the background flow colliding with nanoparticles. is thermophoresis force resulting from the temperature gradient in the reactor. , , and are the Saffman lift force, the viscous drag force, and the gravity, respectively. The exact mathematical model for each force can be found in Refs. [21,22,23,24].
The velocity of the particle at each point along the trajectory can be obtained by the integration of time in Equation (6), and the trajectory can be predicted by
where X is the position vector of the particle.
After the particles collide with the wall, they may bounce off or deposit on the wall, as shown in Figure 2. To accurately calculate the ratio of deposited particles and the velocity of ejected particles, a particle–wall collision model based on previous experimental studies is established, in which the secondary rebound of particles is not considered, that is, the particles will no longer rebound after deposition. The particle velocity and restitution coefficient of the bounce angle can be expressed as
where and are the velocities of particles before and after the collision, while and are the incident and ejection angles of particles before and after the collision [25,26], respectively.
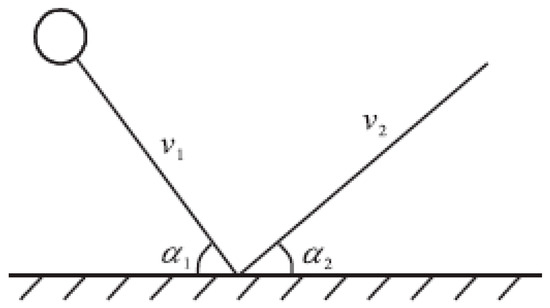
Figure 2.
Schematic diagram of particle-wall collision.
The particle–wall collision model is coupled with the bulk gas flow solver to determine the state of a particle after collision with a wall or susceptor. When simulating the particle–wall collision, the value of the Stokes number of the particle is first judged. If it is less than 15, the particle will not bounce away, and the final state of the particle is recorded as deposition, which is included in the deposition rate, and the tracking is stopped [25,26]. If the Stokes number is larger than 15, the particles will bounce away from the wall after collision and return to the flow field. Then, we continue to calculate the particle trajectory with the particle tracking model until the particles are deposited on the wall or moved to the outlet of the reactor. Finally, we record the final state of the particles as they escape and stop tracking.
3. Results and Discussion
3.1. Single-Wafer Reactor
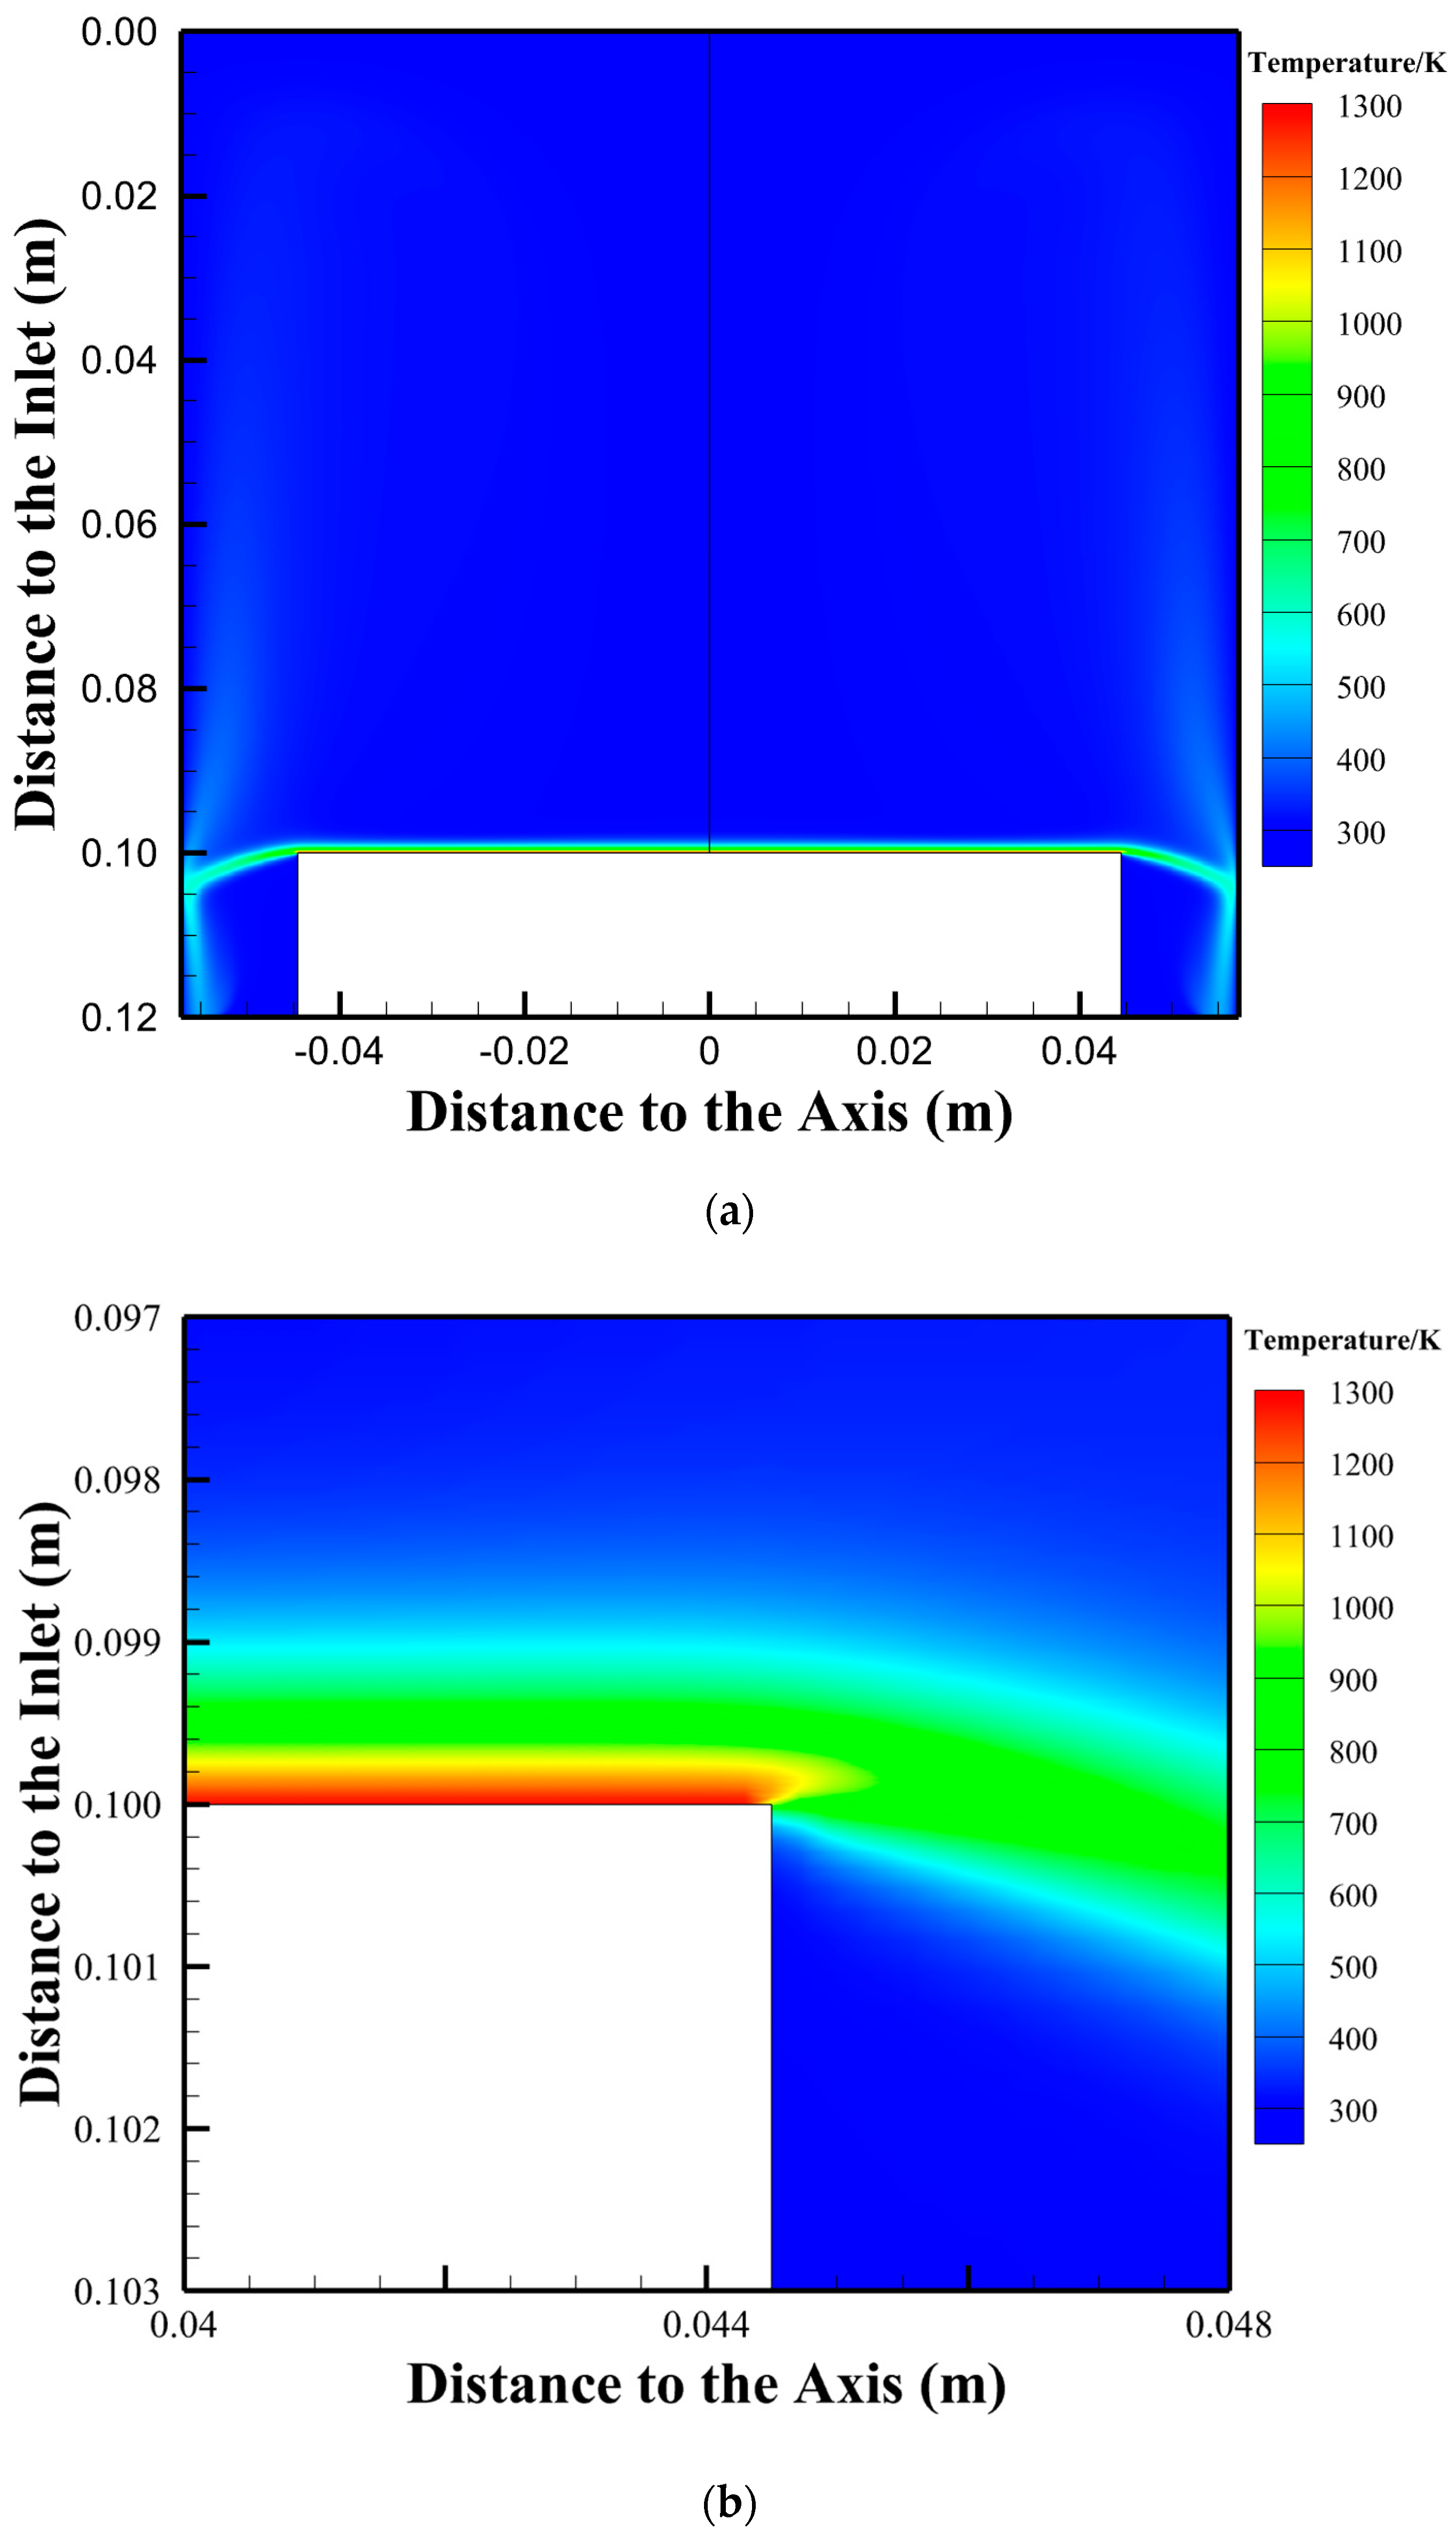
Firstly, a rotary vertical MOCVD single-wafer reactor for growing GaN at the rotational speed of 120 rad/s was carried out to investigate the motion and deposition of nanoparticles. Figure 3 shows the temperature distribution in the single-wafer reactor. As shown in Figure 3a, the temperature of most areas in the reactor is below 400 K, and the surface area of the susceptor is affected by the high-temperature susceptor (1300 K), forming a high temperature gradient and a thin temperature boundary layer. From Figure 3b, it can be found that the thickness of the temperature boundary layer is nearly 2 mm above the hot susceptor. The reason is that the high-speed rotation of the susceptor results in a large radial flow velocity of the surface airflow, and in the flow field, the axial velocity gradient is small and the radial velocity gradient is large, especially the flow on the surface of the susceptor. This also makes the thickness of the velocity boundary layer close to 2 mm. During the process of GaN growth by MOCVD, both the gas-phase chemical reaction and surface chemical reaction occur in the temperature boundary layer, which is also the main region for the formation and movement of by-product particles. The temperature gradient will cause significant thermophoresis force on the particles, which drives the particles away from the hot susceptor.
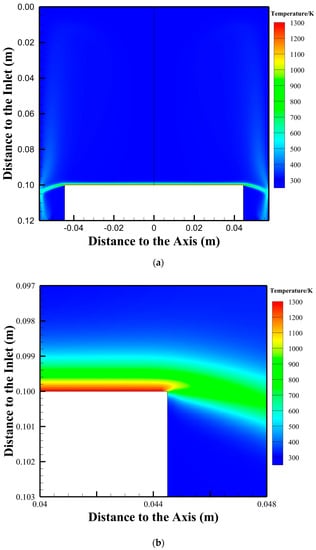
Figure 3.
Temperature distribution in the single−wafer reactor: (a) Temperature distribution in the whole area, (b) local amplification of temperature distribution near the edge of susceptor.
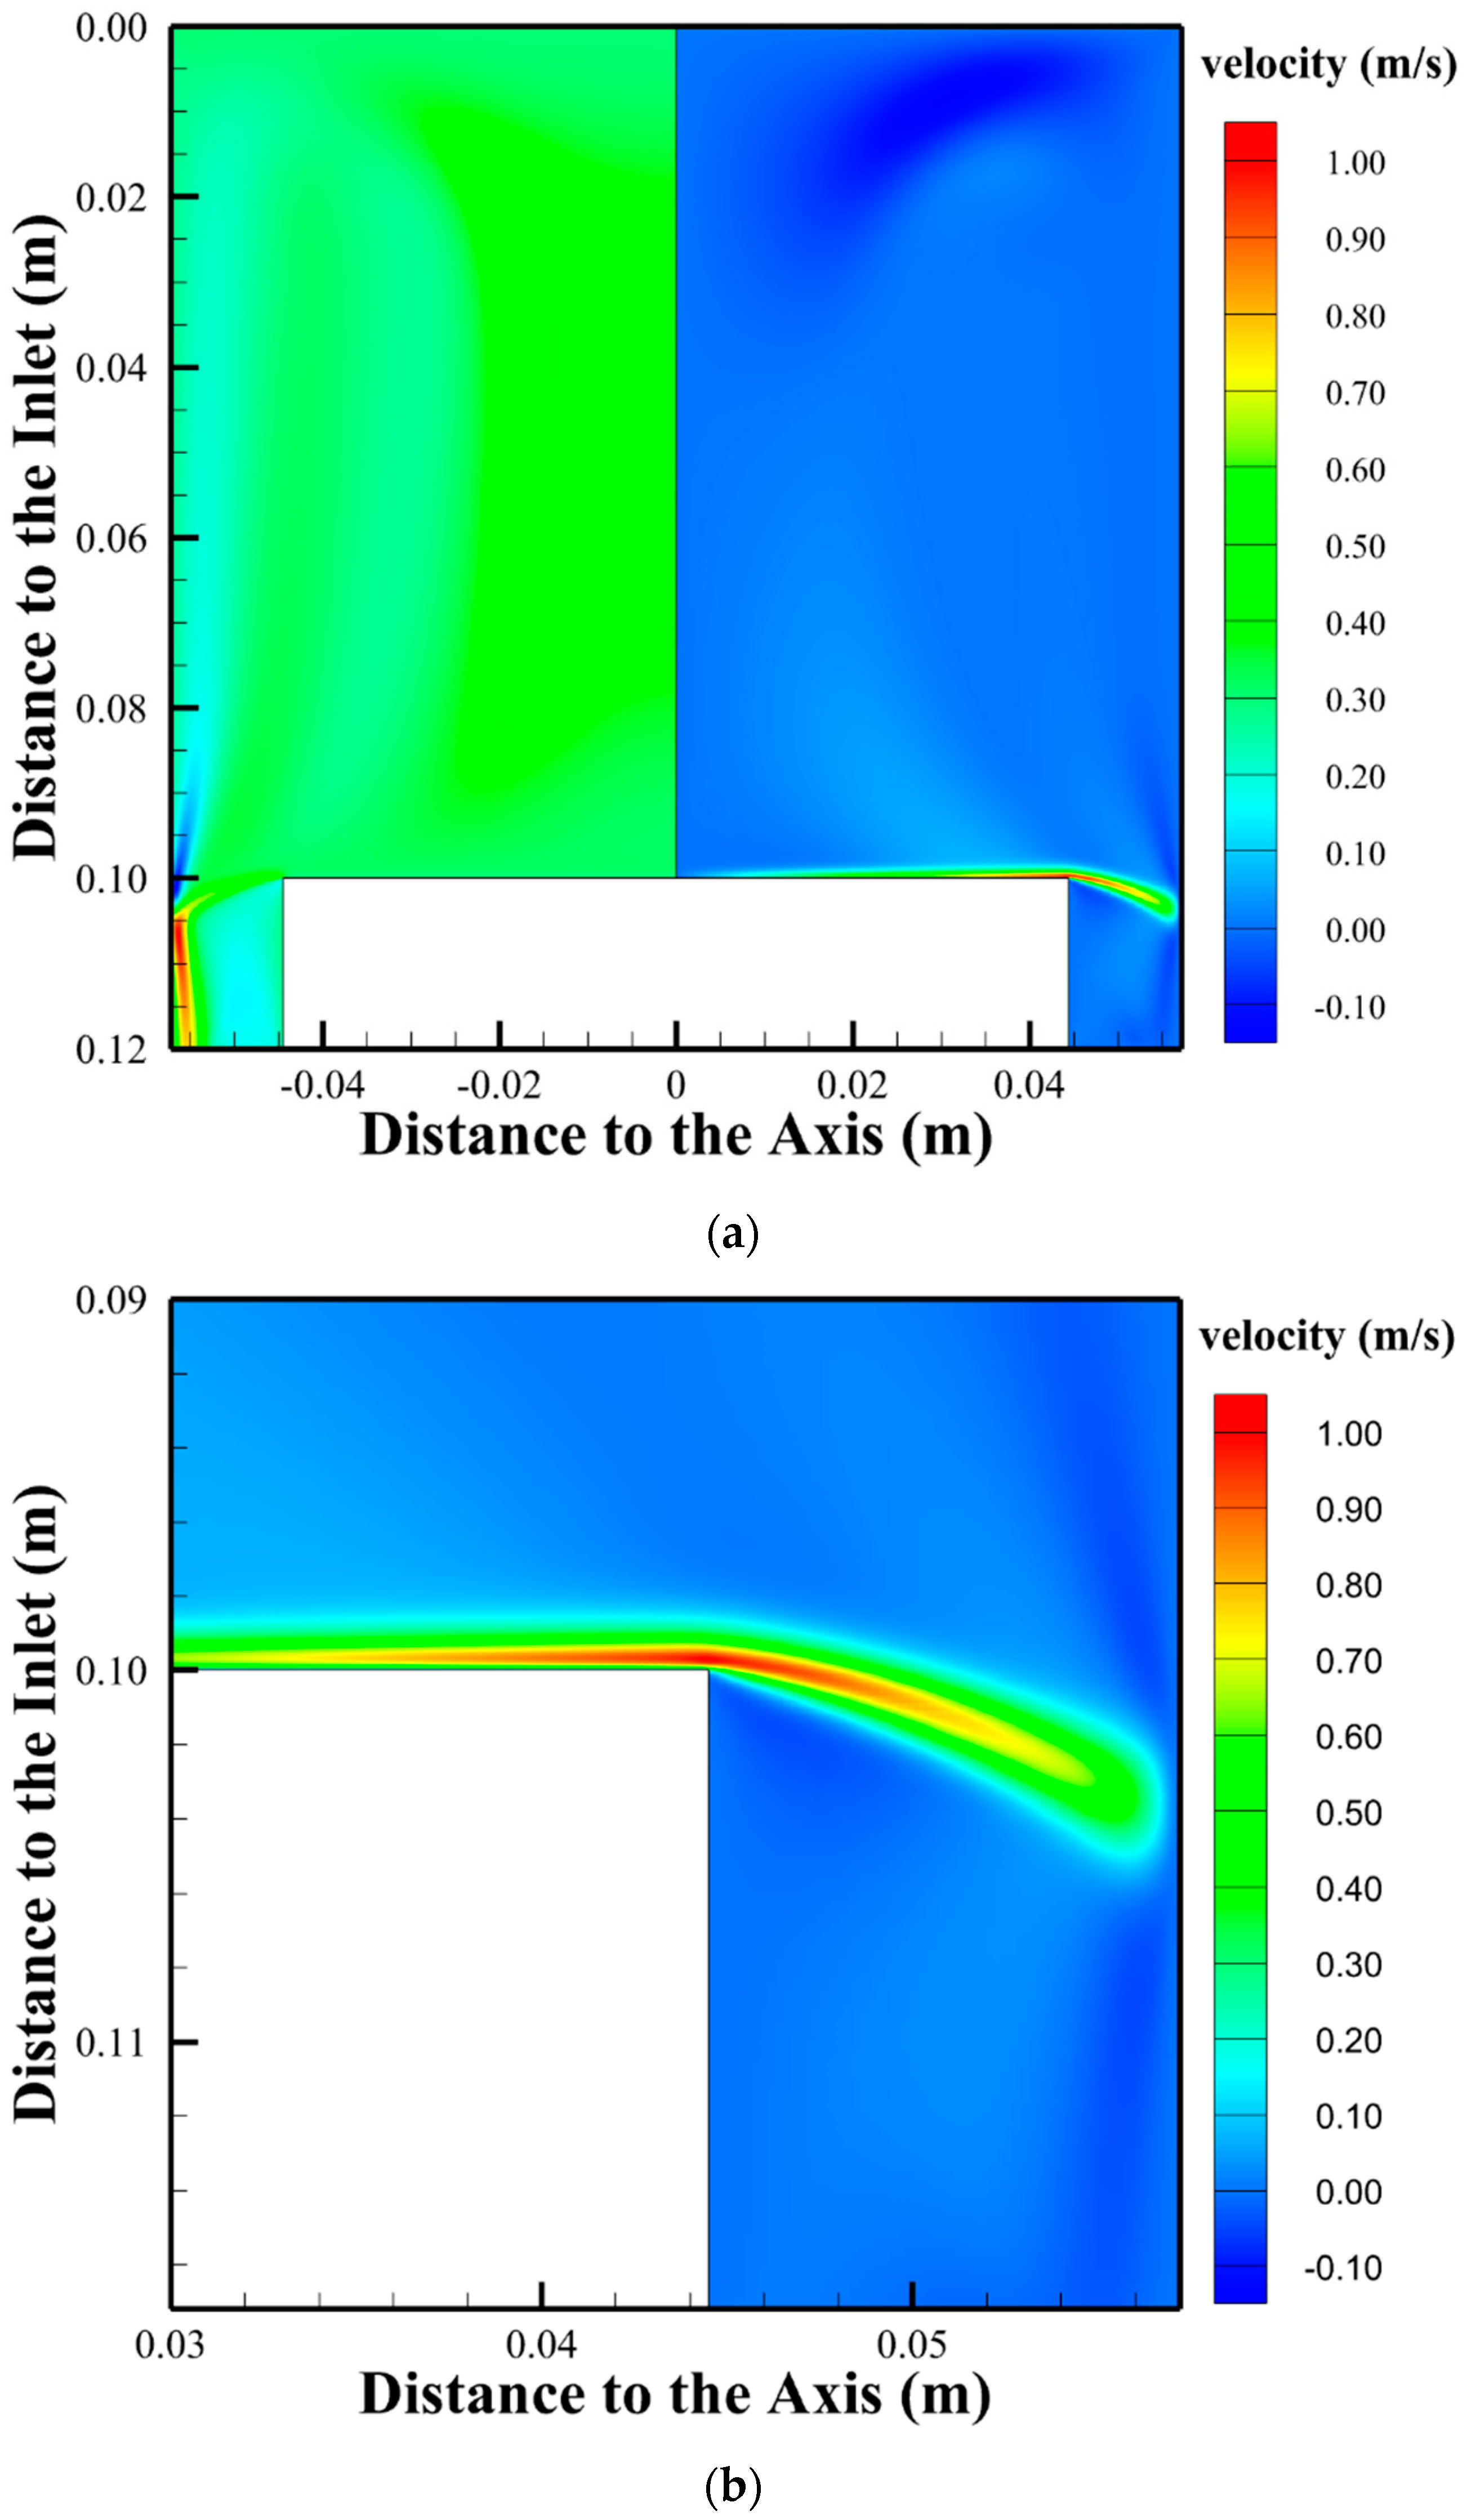
Figure 4 shows the distribution of axial velocity and radial velocity of the flow field in the single-wafer reactor. Figure 4a is the velocity distribution of the whole flow field, in which the left side is the axial velocity and the right side is the radial velocity. As shown in the figure, the high-speed rotation of the susceptor results in a large radial flow velocity of the surface gas flow, with a maximum value of approximately 0.95 . In the flow field, the axial velocity gradient is small, and the radial velocity gradient is large, especially for the flow on the surface of the susceptor. From the local amplification of radial velocity distribution near the edge of the susceptor shown in Figure 4b, it can be also found that there is a velocity boundary layer approximately 2 mm thick near the basement.
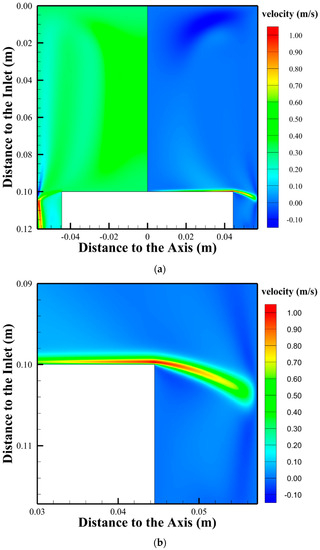
Figure 4.
Velocity distribution in the single−wafer reactor: (a) Axial (left part) and radial (right part) velocity distribution in the whole area, (b) local amplification of radial velocity distribution near the edge of susceptor.
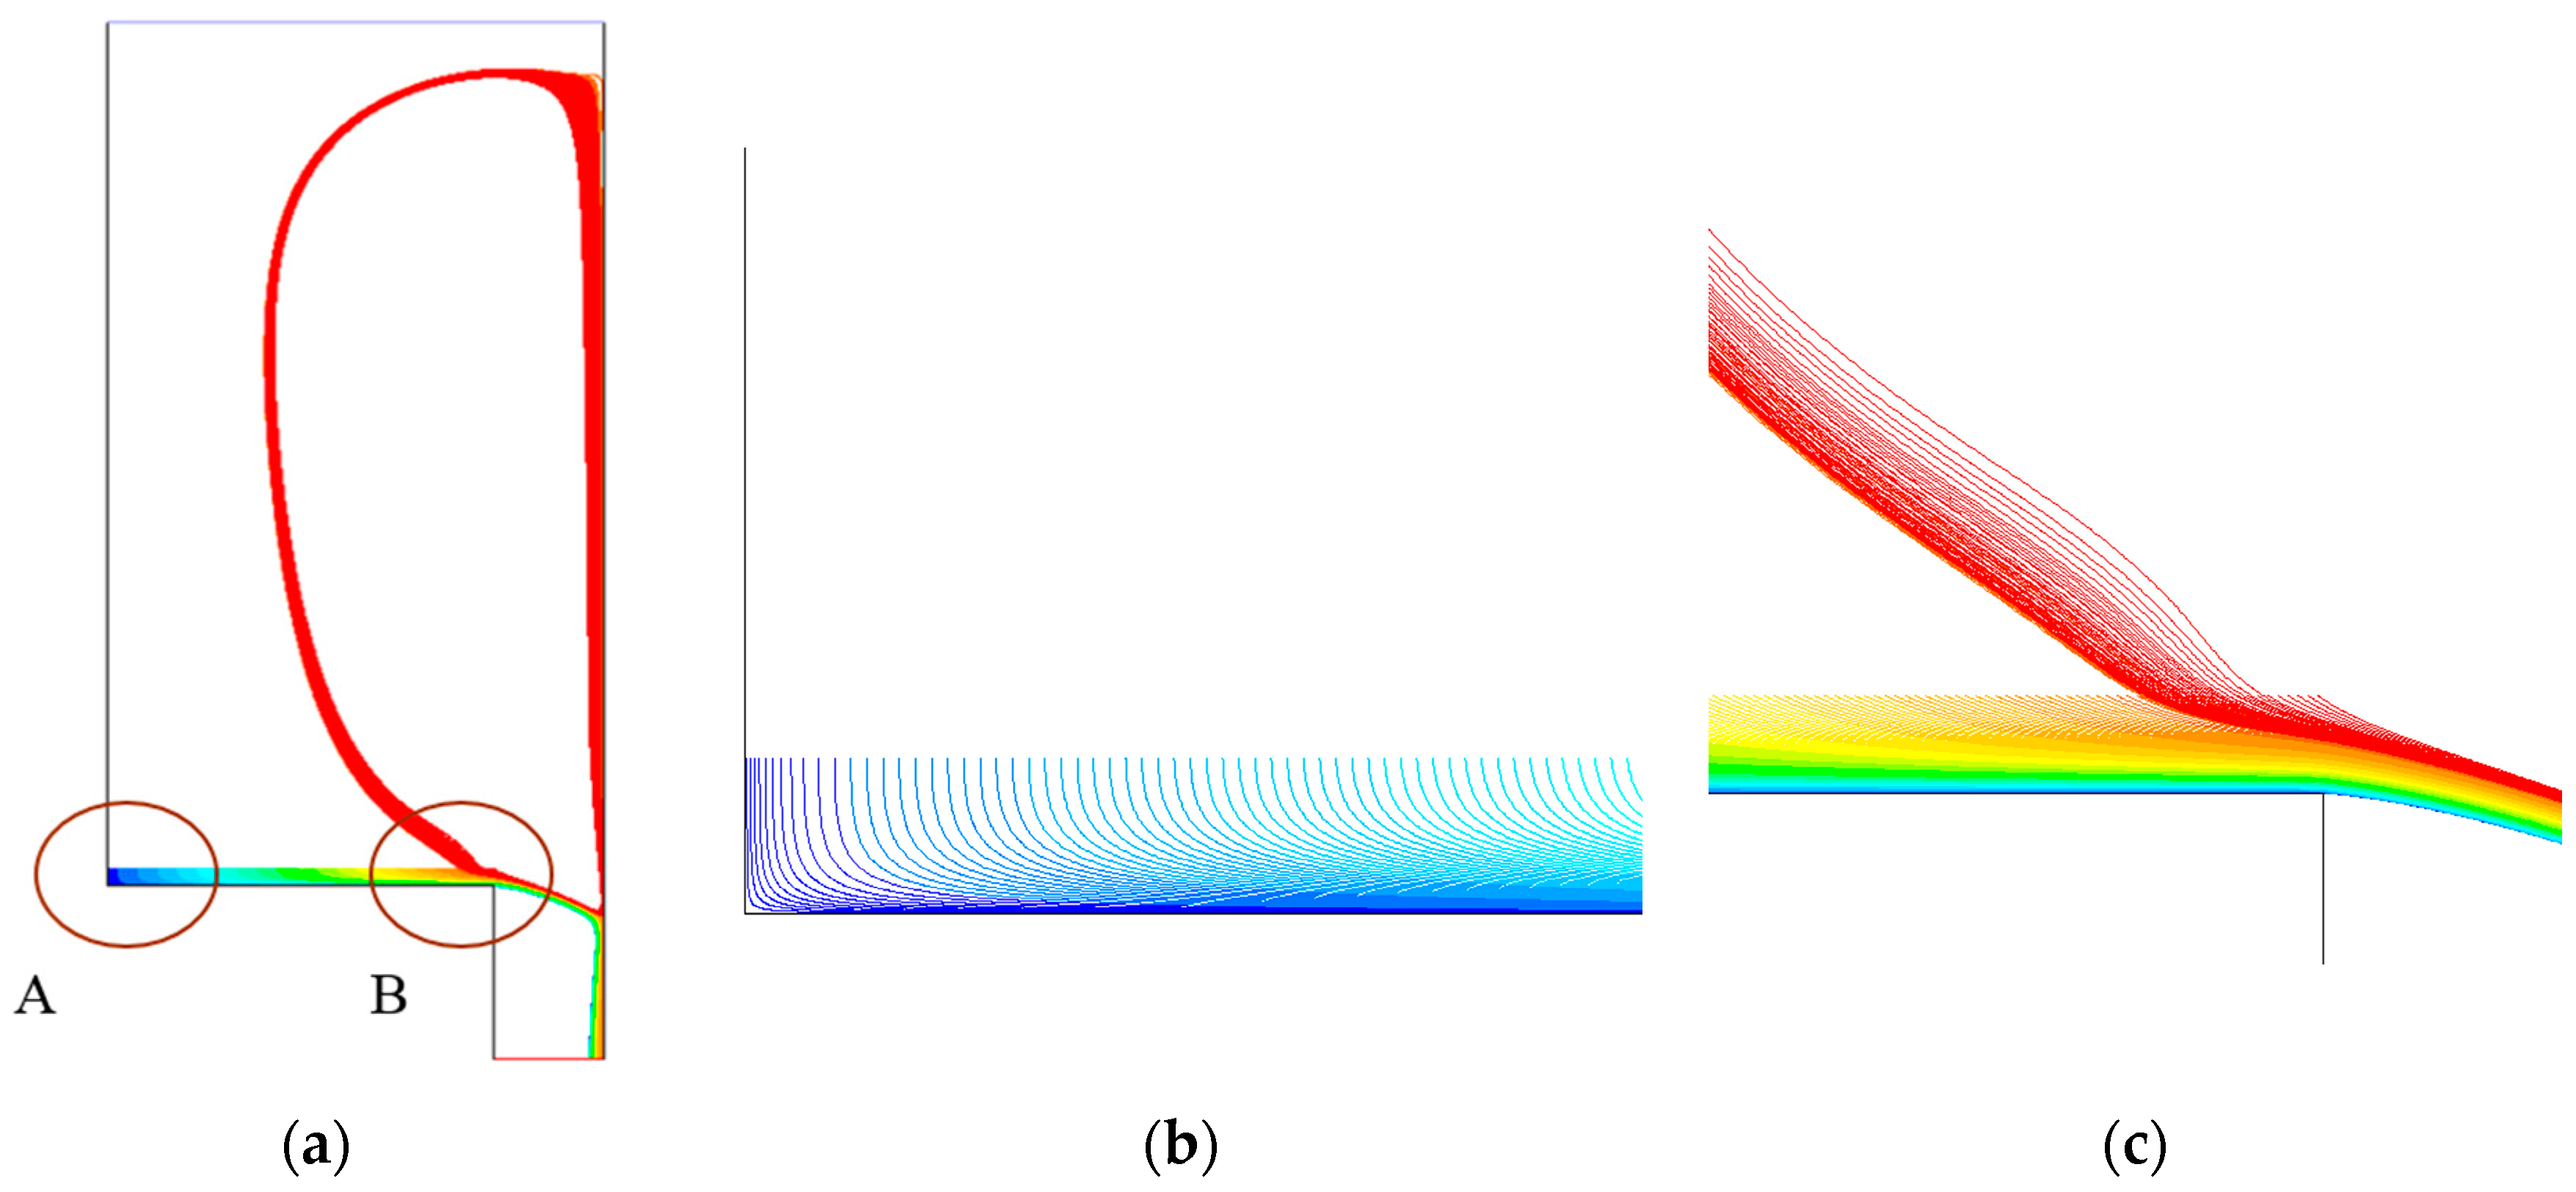
In order to obtain the trajectory of particles, it is necessary to release a certain number of tracer particles (at least 1000 [27]) in the flow field. Therefore, after the flow field is stable, 2200 particles were released into the flow field and their trajectories were tracked by the particle tracking and particle–wall collision model. In this study, 2200 particles were uniformly distributed and continuously supplied on a plane 2 mm away from the susceptor with an equal radius to the susceptor, and the initial velocity of the particles was 0. Figure 5 shows the predicted trajectories of the particles in the single-wafer reactor, and the color represents the serial number of particles, from blue to green to red, indicating particles 1 to 2200 in sequence. The results shown in the figure are the final trajectories of the particles starting to move and eventually stabilizing, which takes approximately 7.7 s. As shown in the figure, after the particle is released from its initial position, it is affected by the gas flow and temperature distribution, first moving towards the susceptor and then flowing radially into the outlet channel along the susceptor. During the movement process, the particle trajectories gradually converge, but they are not mixed with each other, with obvious layering, as shown in Figure 5b,c. The particles near the edge of the susceptor are sucked into a vortex in the outlet channel, and the remaining particles flow out of the reactor with the gas flow. It should be noted from the whole trajectories in Figure 5a that, if the structure of the outlet changes, such as narrowing the outlet, particles could collide with the wall and some particles may deposit on the wall.
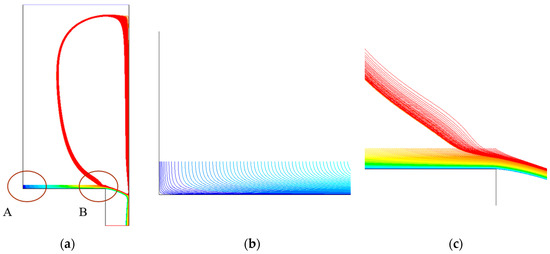
Figure 5.
The trajectories of particles in the single-wafer reactor: (a) Radial trajectories of particles in the entire field, (b) local amplification of particles in zone A, and (c) local amplification of particles in Zone B.
Table 1 shows the final states of the particles in the single-wafer reactor. From the data, it can be found that approximately 9.3% of particles affected by vortices in the flow field move endlessly in the reactor and remain in the reactor, while the remaining 90.7% of particles eventually leave the reactor, and there is no particle deposition on the reactor wall and susceptor. The initial position of 9.3% of the particles involved in the vortex is beyond 40.5 mm from the axis. The endless movement of particles within the reactor should be avoided. In actual growth, the formation of particles can be reduced by controlling the temperature in the region beyond 40.5 mm from the axis, thereby reducing the number of particles trapped in the reactor.

Table 1.
Final states of particles in the single-wafer reactor.
Similarly, in a stationary reactor, the particles are driven by composite forces, moving away from the susceptor, and some particles may deposit on the wall [27]. In the smaller rotary vertical reactor, the particles move a longer distance at a faster speed than that in a stationary reactor, due to the swirling flow. Whether more particles will deposit on the wall in the rotary reactor depends on the structure of the reactor and the flow conditions.
Different rotational speeds of the susceptor are carried out to investigate the effect of speed on the deposition rate. Table 2 shows the final states of particles in the single-wafer reactor at speeds of 80, 100, and 120 rad/s, respectively. The results show that there is no deposition of particles in the reactor under all three speed conditions. Meanwhile, at the speed of 80 rad/s, all particles escape from the reactor outlet. As the rotational speed increases, particles begin to be drawn into the vortex for endless motion. The higher the rotational speed, the more particles are drawn into the vortex. The results indicate that it is an effective way to reduce particle retention in the reactor by reducing speed in industrial production, and the rotation speed cannot be reduced too much, otherwise the flow pattern would be ruined.
Table 2.
Final states of particles in the single-wafer reactor for different rotational speeds of the susceptor.
3.2. Multi-Wafer Reactor
Firstly, a rotary vertical MOCVD multi-wafer reactor for growing GaN at the rotational speed of 120 rad/s was carried out to investigate the motion and deposition of nanoparticles. Figure 6 shows the simplified model of the multi-wafer reactor and the structured grid with refined boundary layers near the susceptor for simulation. To study the deposition of particles on different areas, the susceptor is uniformly divided into four parts, numbered S1, S2, S3, and S4.

Figure 6.
Computational grid and simplified model of the multi-wafer reactor.
Figure 7 shows the temperature distribution in the multi-wafer reactor. The temperature gradient near the susceptor surface is approximately , and it is much smaller than that of the single-wafer reactor, which is approximately . However, the thickness of the temperature boundary layer on the susceptor surface in the multi-wafer reactor is not uniform. The thickness at the center of the susceptor is approximately 25 mm, while near the edge of the susceptor, it is approximately 50 mm and in other areas, it is approximately 20 mm. Due to the large temperature gradient in the temperature boundary layer, the thermophoresis effect is significant, so the effect of thermophoresis must be considered when tracking the trajectory of particles.
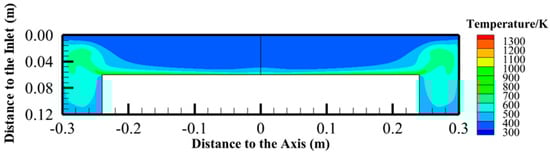
Figure 7.
Temperature distribution in the multi−wafer reactor.
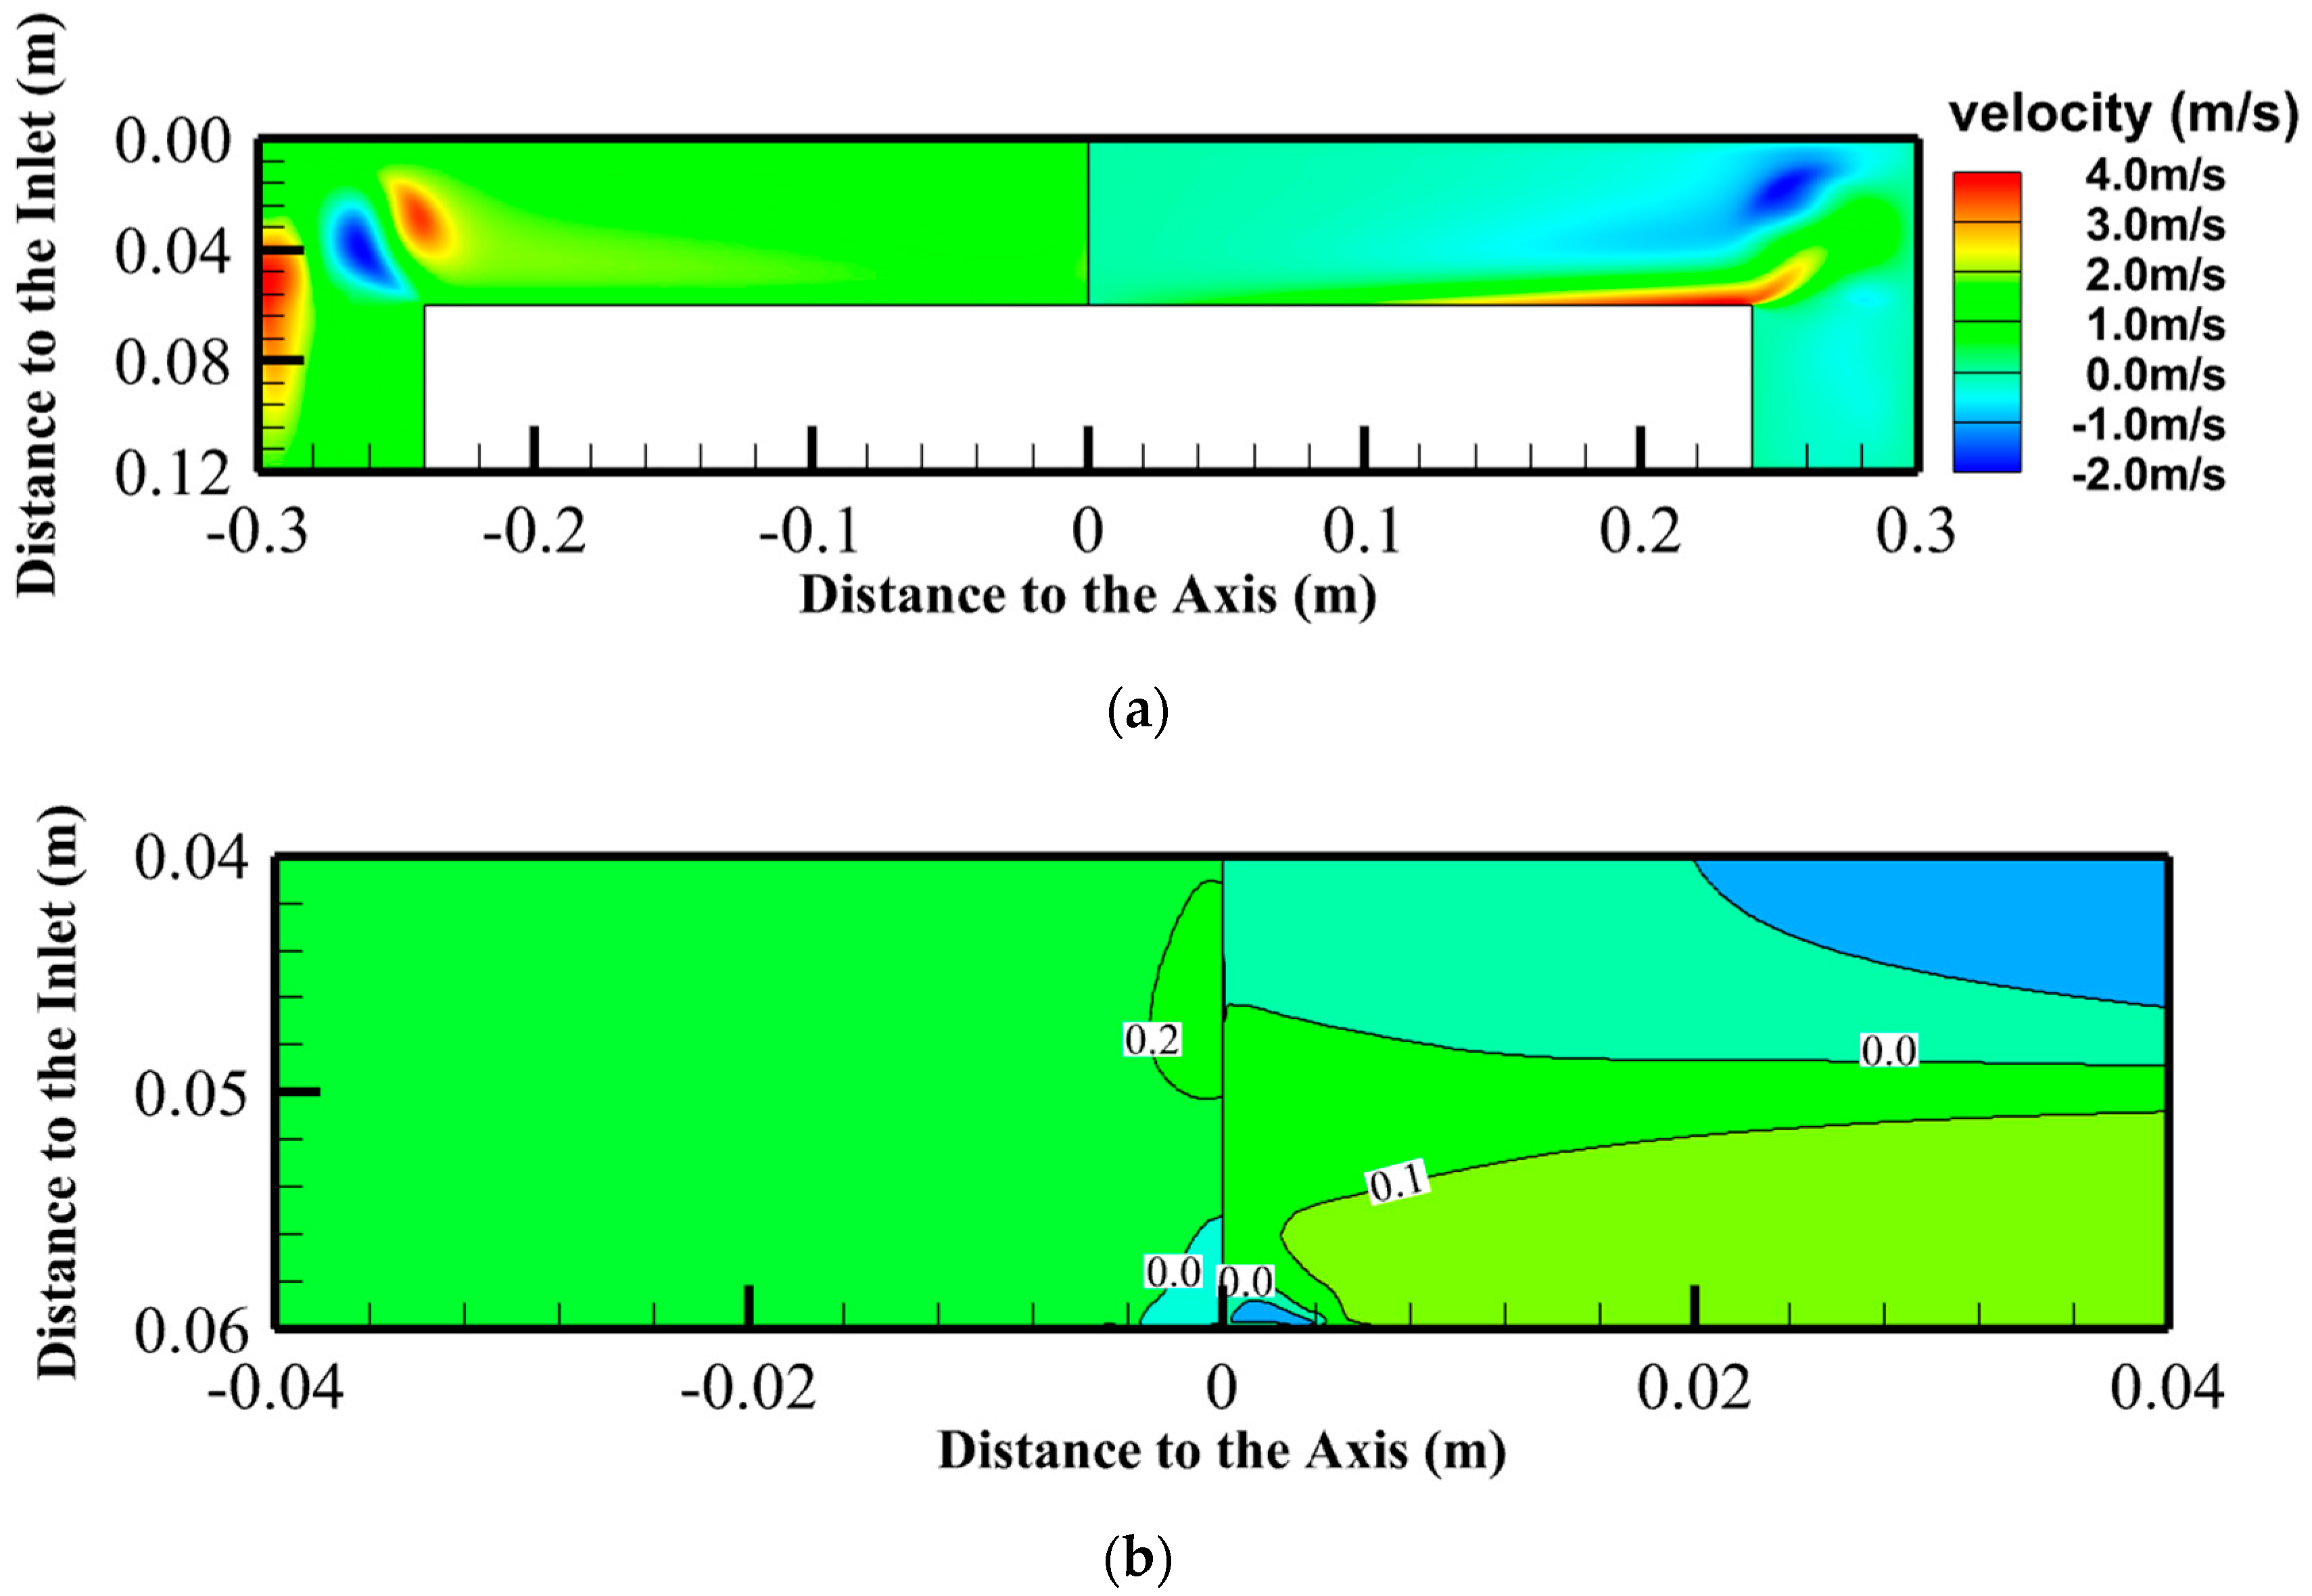
Figure 8a shows the velocity distribution of the whole flow field in the multi-wafer reactor, with the axial velocity on the left and the radial velocity on the right. It can be seen from the figure that the axial velocity gradient in the flow field is small, and the radial velocity gradient is large, especially for the gas flow on the surface of the susceptor. Due to the high-speed rotation of the susceptor, the radial velocity of the surface gas flow is high, with a maximum value of approximately 3.5 . There is also a velocity boundary layer approximately 12 mm thick near the basement. Figure 8b shows a local amplification of the velocity field near the central region of the susceptor. It can be seen from the figure that in the small vortex area near the axis, the radial velocity is negative, that is, the radial velocity of the gas flow points to the axis direction, while the axial velocity is also negative, and the radial velocity of the gas flow points to the reactor inlet.
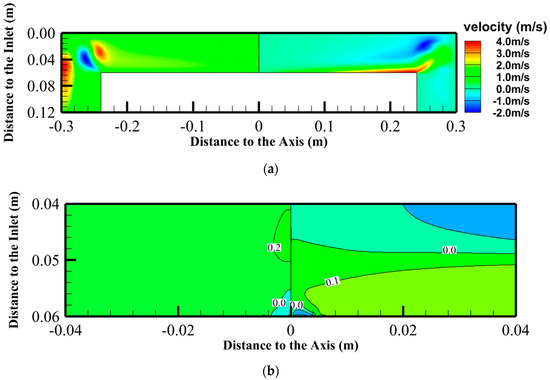
Figure 8.
Velocity distribution in the multi−wafer reactor: (a) Axial (left part) and radial (right part) velocity distribution in the whole area, (b) local amplification of the velocity field near the central region of the susceptor.
Based on the flow and thermal field, 2399 particles were uniformly released into the reactor and their trajectories were tracked by the particle tracking model and particle–wall collision model. Similar to the single-wafer reactor, particles were uniformly distributed on a plane 2 mm away from the susceptor and with an equal radius to the susceptor, and the initial velocity of the particles was 0. Figure 9 shows the predicted trajectories of the particles in the multi-wafer reactor, and the color also represents the serial number of particles, from blue to green to red, indicating particles 1 to 2399 in sequence. As the figure shows, the trajectory of particles in the multi-wafer reactor exhibits significant stratification and gradually converges on the susceptor surface. The smaller the number of particles is, the closer the initial position is to the axis, and the more the trajectory of particles is in the lower layer, closer to the susceptor.
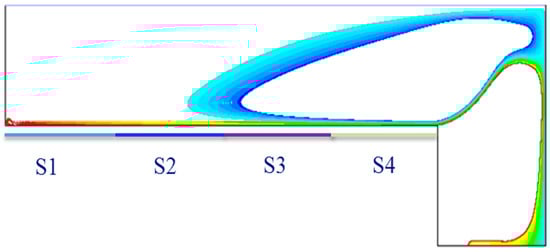
Figure 9.
The trajectories of particles in the multi-wafer reactor.
Table 3 shows the final states of particles in the multi-wafer reactor by MOCVD. From the table, it can be found that approximately 1.67% of the particles are deposited in the reactor and are located in the S1 region, within a distance of 60 mm from the axis. The initial position of these particles is within a distance of approximately 4 mm from the axis. Moreover, 29.47% of the particles are first drawn into the vortex above the susceptor, moving with the gas flow to the vicinity of the wall, and then escaping from the outlet. The initial position of these particles is beyond a distance of 170 mm from the axis. The remaining 68.86% of particles directly escape from the outlet. The results indicate that particles deposited in the S1 region will directly contaminate the wafers placed in this area, and the particles trapped in the vortex may undergo chemical reactions with the gas again, producing more complex byproducts. Therefore, the temperature should be controlled to reduce the formation of particles in the S1 region within a distance of 60 mm from the axis, thereby reducing particle deposition. Alternatively, one could avoid placing wafers in this region to reduce particle contamination of the wafers. The temperature in the area beyond 170 mm from the axis should also be controlled to reduce the formation of particles in this area, thereby reducing the number of particles trapped in the reactor.
Table 3.
Final states of particles in the multi-wafer reactor.
Furthermore, different rotational speeds of the susceptor are carried out to investigate the effect of the speed on the deposition rate in a multi-wafer reactor. Table 4 shows the final states of particles in the multi-wafer reactor at speeds of 80, 100, and 120 rad/s, respectively. As shown in the table, as the rotational speed increases, the deposition rate of particles gradually increases, but the total amount is still small, not exceeding 2%. The number of particles involved in the vortex significantly increased as the rotational speed increased, while the number of particles that directly escaped decreased with the increase in the rotational speed. The results indicate that a lower rotational speed could help suppress the deposition of particles on the susceptor, thereby reducing direct contamination of particle wafers. It can also reduce the number of particles trapped in the reaction chamber and avoid synthesizing more complex by-products or indirectly contaminating the wafer. Moreover, the rotation speed cannot be reduced too much, otherwise the flow pattern would be ruined.
Table 4.
Final states of particles in the multi-wafer reactor for different rotational speeds of the susceptor.
4. Conclusions
The motion of particles in single-wafer and multi-wafer rotary MOCVD reactors was numerically investigated to understand the trajectories and deposition of nanoparticles and the effects of rotational speed on the deposition of particles. The results indicated that for the single-wafer reactor, the temperature in the region beyond 40.5 mm from the axis should be controlled to reduce the formation of particles, thereby reducing the number of particles trapped in the reactor. Meanwhile, for the multi-wafer reactor, the temperature should be controlled to reduce the formation of particles in the S1 region within 60 mm from the axis, thereby reducing particle deposition, and the temperature in the area beyond 170 mm from the axis should also be controlled to reduce the formation of particles, thereby reducing the number of particles trapped in the reactor. Finally, the results also revealed that reducing the rotational speed of the susceptor is an effective way to reduce particle retention in the single-wafer reactor in industrial production, and a lower rotational speed could help to suppress the deposition of particles on the susceptor in a multi-wafer reactor, thereby reducing the direct contamination of particle wafers.
Author Contributions
Conceptualization, P.S.; Methodology, D.L. and J.L.; Investigation, Y.S.; Writing—original draft, P.S.; Writing—review & editing, G.Z.; Supervision, L.L. All authors have read and agreed to the published version of the manuscript.
Funding
This research received no external funding.
Data Availability Statement
The data that supports the main findings of this study are available within the article. The data not shown in the discussion part of the manuscript can be obtained from the corresponding author.
Acknowledgments
This work was supported by the Natural Science Basic Research Plan in Shaanxi Province of China (No. 2014JZ014).
Conflicts of Interest
The authors declare that they have no known competing financial interest or personal relationships that could have appeared to influence the work reported in this paper.
References
- Taniyasu, Y.; Kasu, M.; Makimoto, T. An aluminium nitride light-emitting diode with a wavelength of 210 nanometres. Nature 2006, 441, 325–328. [Google Scholar] [CrossRef] [PubMed]
- Akasaki, I.; Amano, H. Crystal growth and conductivity control of group III nitride semiconductors and their application to short wavelength light emitters. Jpn. J. Appl. Phys. 1997, 36, 5393–5408. [Google Scholar] [CrossRef]
- Nakamura, S.; Senoh, M.; Iwasa, N.; Nagahama, S.; Yamada, T.; Mukai, T. Superbright green InGaN single-quantum-well-structure light-emitting diodes. Jpn. J. Appl. Phys. 1995, 34, L1332–L1335. [Google Scholar] [CrossRef]
- Zhao, D.G.; Zhu, J.J.; Jiang, D.S.; Yang, H.; Liang, J.W.; Li, X.Y.; Gong, H.M. Parasitic reaction and its effect on the growth rate of AlN by metalorganic chemical vapor deposition. J. Cryst. Growth 2006, 289, 72–75. [Google Scholar] [CrossRef]
- Chen, C.H.; Liu, H.; Steigerwald, D.; Imler, W.; Kuo, C.P.; Craford, M.G.; Ludowise, M.; Lster, S.; Amano, J. A study of parasitic reactions between NH3 and TMGa or TMAI. J. Electron. Mater. 1996, 25, 1004–1008. [Google Scholar] [CrossRef]
- Coltrin, M.E.; Creighton, J.R. Chemistry of AlGaN Particulate Formation; Research Briefs; National Nuclear Security Administration, Physical, Chemical, & Nano Sciences Center: Washington, DC, USA, 2005; pp. 42–43.
- Creighton, J.R.; Wang, G.T.; Breiland, W.G.; Coitrin, M.E. Nature of the parasitic chemistry during AlGaInN OMVPE. J. Cryst. Growth 2004, 261, 204–213. [Google Scholar] [CrossRef]
- Su, Z.; Kong, R.; Hu, X.; Song, Y.; Deng, Z.; Jiang, Y.; Li, Y.; Chen, H. Effect of initial condition on the quality of GaN film and AlGaN/GaN heterojunction grown on flat sapphire substrate with ex-situ sputtered AlN by MOCVD. Vacuum 2022, 201, 111063. [Google Scholar] [CrossRef]
- Moffat, H.; Jensen, K.F. Complex flow phenomena in MOCVD reactors: I. Horizontal reactors. J. Cryst. Growth 1986, 77, 108–119. [Google Scholar] [CrossRef]
- Dimitrios, I.; Kremer, A.M.; McKenna, D.R.; Jensen, K.F. Complex flow phenomena in vertical MOCVD reactors: Effects on deposition uniformity and interface abruptness. J. Cryst. Growth 1987, 85, 154–164. [Google Scholar]
- Li, J.; Wang, J.; Cai, J.D.; Xu, Y.F.; Fan, B.F.; Wang, G. Numerical simulation and analysis of process parameters of GaN-MOCVD reactor. Int. Commun. Heat Mass Transf. 2018, 91, 64–76. [Google Scholar] [CrossRef]
- Wang, J.; Li, J.; He, Y.C.; Luo, T.-C.; Li, Y.; Fan, B.-F.; Wang, G. High-speed flow field prediction and process parameters optimization in a vertical MOCVD reactor based on a hybrid RSM-KNN model. Int. Commun. Heat Mass Transf. 2021, 129, 105741. [Google Scholar] [CrossRef]
- Wang, J.; He, Y.C.; Luo, T.C.; Li, Y.; Zhou, Z.; Fan, B.F.; Wang, G. Simulation and experimental verification study on the process parameters of ZnO-MOCVD. Ceram. Int. 2021, 47, 15471–15482. [Google Scholar] [CrossRef]
- Wu, Y.Y.; Wu, R.; Zhou, X.S.; Wang, H.; Hu, Y.; Nie, D.; Bao, D. Numerical Modelling on the Effect of Temperature on MOCVD Growth of ZnO Using Diethylzinc and Tertiarybutanol. Coatings 2022, 12, 1991. [Google Scholar] [CrossRef]
- Lin, W.J.; Chen, J.C. A numerical study of the effect of pulse duration on preventing particle generation during the AlN pulsed MOCVD process. Mater. Sci. Semicon. Proc. 2022, 148, 106816. [Google Scholar] [CrossRef]
- Iliescu, L.; Gazal, Y.; Michau, A.; Addou, F.; Duguet, T.; Monsifrot, E.; Schuster, F.; Maury, F. Low temperature Direct Liquid Injection MOCVD of amorphous CrCx coatings in large-scale reactors: An original route to nanostructured multilayer coatings. Surf. Coat. Tech. 2021, 416, 127174. [Google Scholar] [CrossRef]
- Li, J.; Gan, H.L.; Xu, Y.F.; Wang, C.; Gu, F.L.; Wang, G. Chemical reaction-transport model of oxidized diethylzinc based on quantum mechanics and computational fluid dynamics approaches. Rsc. Adv. 2018, 8, 1116–1123. [Google Scholar] [CrossRef] [PubMed]
- Tang, L.; Zuo, R.; Zhang, H. Quantum chemical study on nanoparticles formation mechanism in AlGaN MOCVD growth. J. Cryst. Growth 2019, 525, 125201. [Google Scholar] [CrossRef]
- Liu, L.; Kakimoto, K. Partly three-dimensional global modeling of a silicon Czochralski furnace. I. Principles, formulation and implementation of the model. Int. J. Heat Mass Transf. 2005, 48, 4481–4491. [Google Scholar] [CrossRef]
- Breiland, W.G.; Coltrin, M.E.; Creighton, J.R.; Hou, H.Q.; Moffat, H.K.; Tsao, J.Y. Organometallic vapor phase epitaxy (OMVPE). Mater. Sci. Eng. R 1999, 24, 241–274. [Google Scholar] [CrossRef]
- Saffman, P.G.T. The lift on a small sphere in a slow shear flow. J. Fluid Mech. 1965, 22, 385–400. [Google Scholar] [CrossRef]
- Mazo, R.M. Brownian Motion: Fluctuations, Dynamics, and Applications, 1st ed.; OUP: Oxford, UK, 2008. [Google Scholar]
- Talbot, L.; Cheng, R.K.; Schefer, R.W.; Willis, D.R. Thermophoresis of particles in a heated boundary layer. J. Fluid Mech. 1980, 101, 737–758. [Google Scholar] [CrossRef]
- Haider, A.; Levenspiel, O. Drag coefficient and terminal velocity of spherical and nonspherical particles. Powder Technol. 1989, 58, 63–70. [Google Scholar] [CrossRef]
- Sommerfeld, M. Modelling of particle-wall collisions in confined gas-particle flows. Int. J. Multiph. Flow 1992, 18, 905–926. [Google Scholar] [CrossRef]
- Joseph, G.G.; Zenit, R.; Hunt, M.L.; Rosenwinkel, A.M. Particle–wall collisions in a viscous fluid. J. Fluid Mech. 2001, 433, 329–346. [Google Scholar] [CrossRef]
- Endres, D.; Mazumder, S. Brownian dynamics study of particles in chemical vapor deposition of aluminum nitride. Int. J. Heat Mass Transf. 2012, 55, 2714–2718. [Google Scholar] [CrossRef]


Disclaimer/Publisher’s Note: The statements, opinions and data contained in all publications are solely those of the individual author(s) and contributor(s) and not of MDPI and/or the editor(s). MDPI and/or the editor(s) disclaim responsibility for any injury to people or property resulting from any ideas, methods, instructions or products referred to in the content. |
© 2023 by the authors. Licensee MDPI, Basel, Switzerland. This article is an open access article distributed under the terms and conditions of the Creative Commons Attribution (CC BY) license (https://creativecommons.org/licenses/by/4.0/).