
Exploring the CAM18 Crystal as a Potential Reference Material for U–Pb Analysis of Zircon
Abstract
:1. Introduction
2. Materials and Methods
3. Results
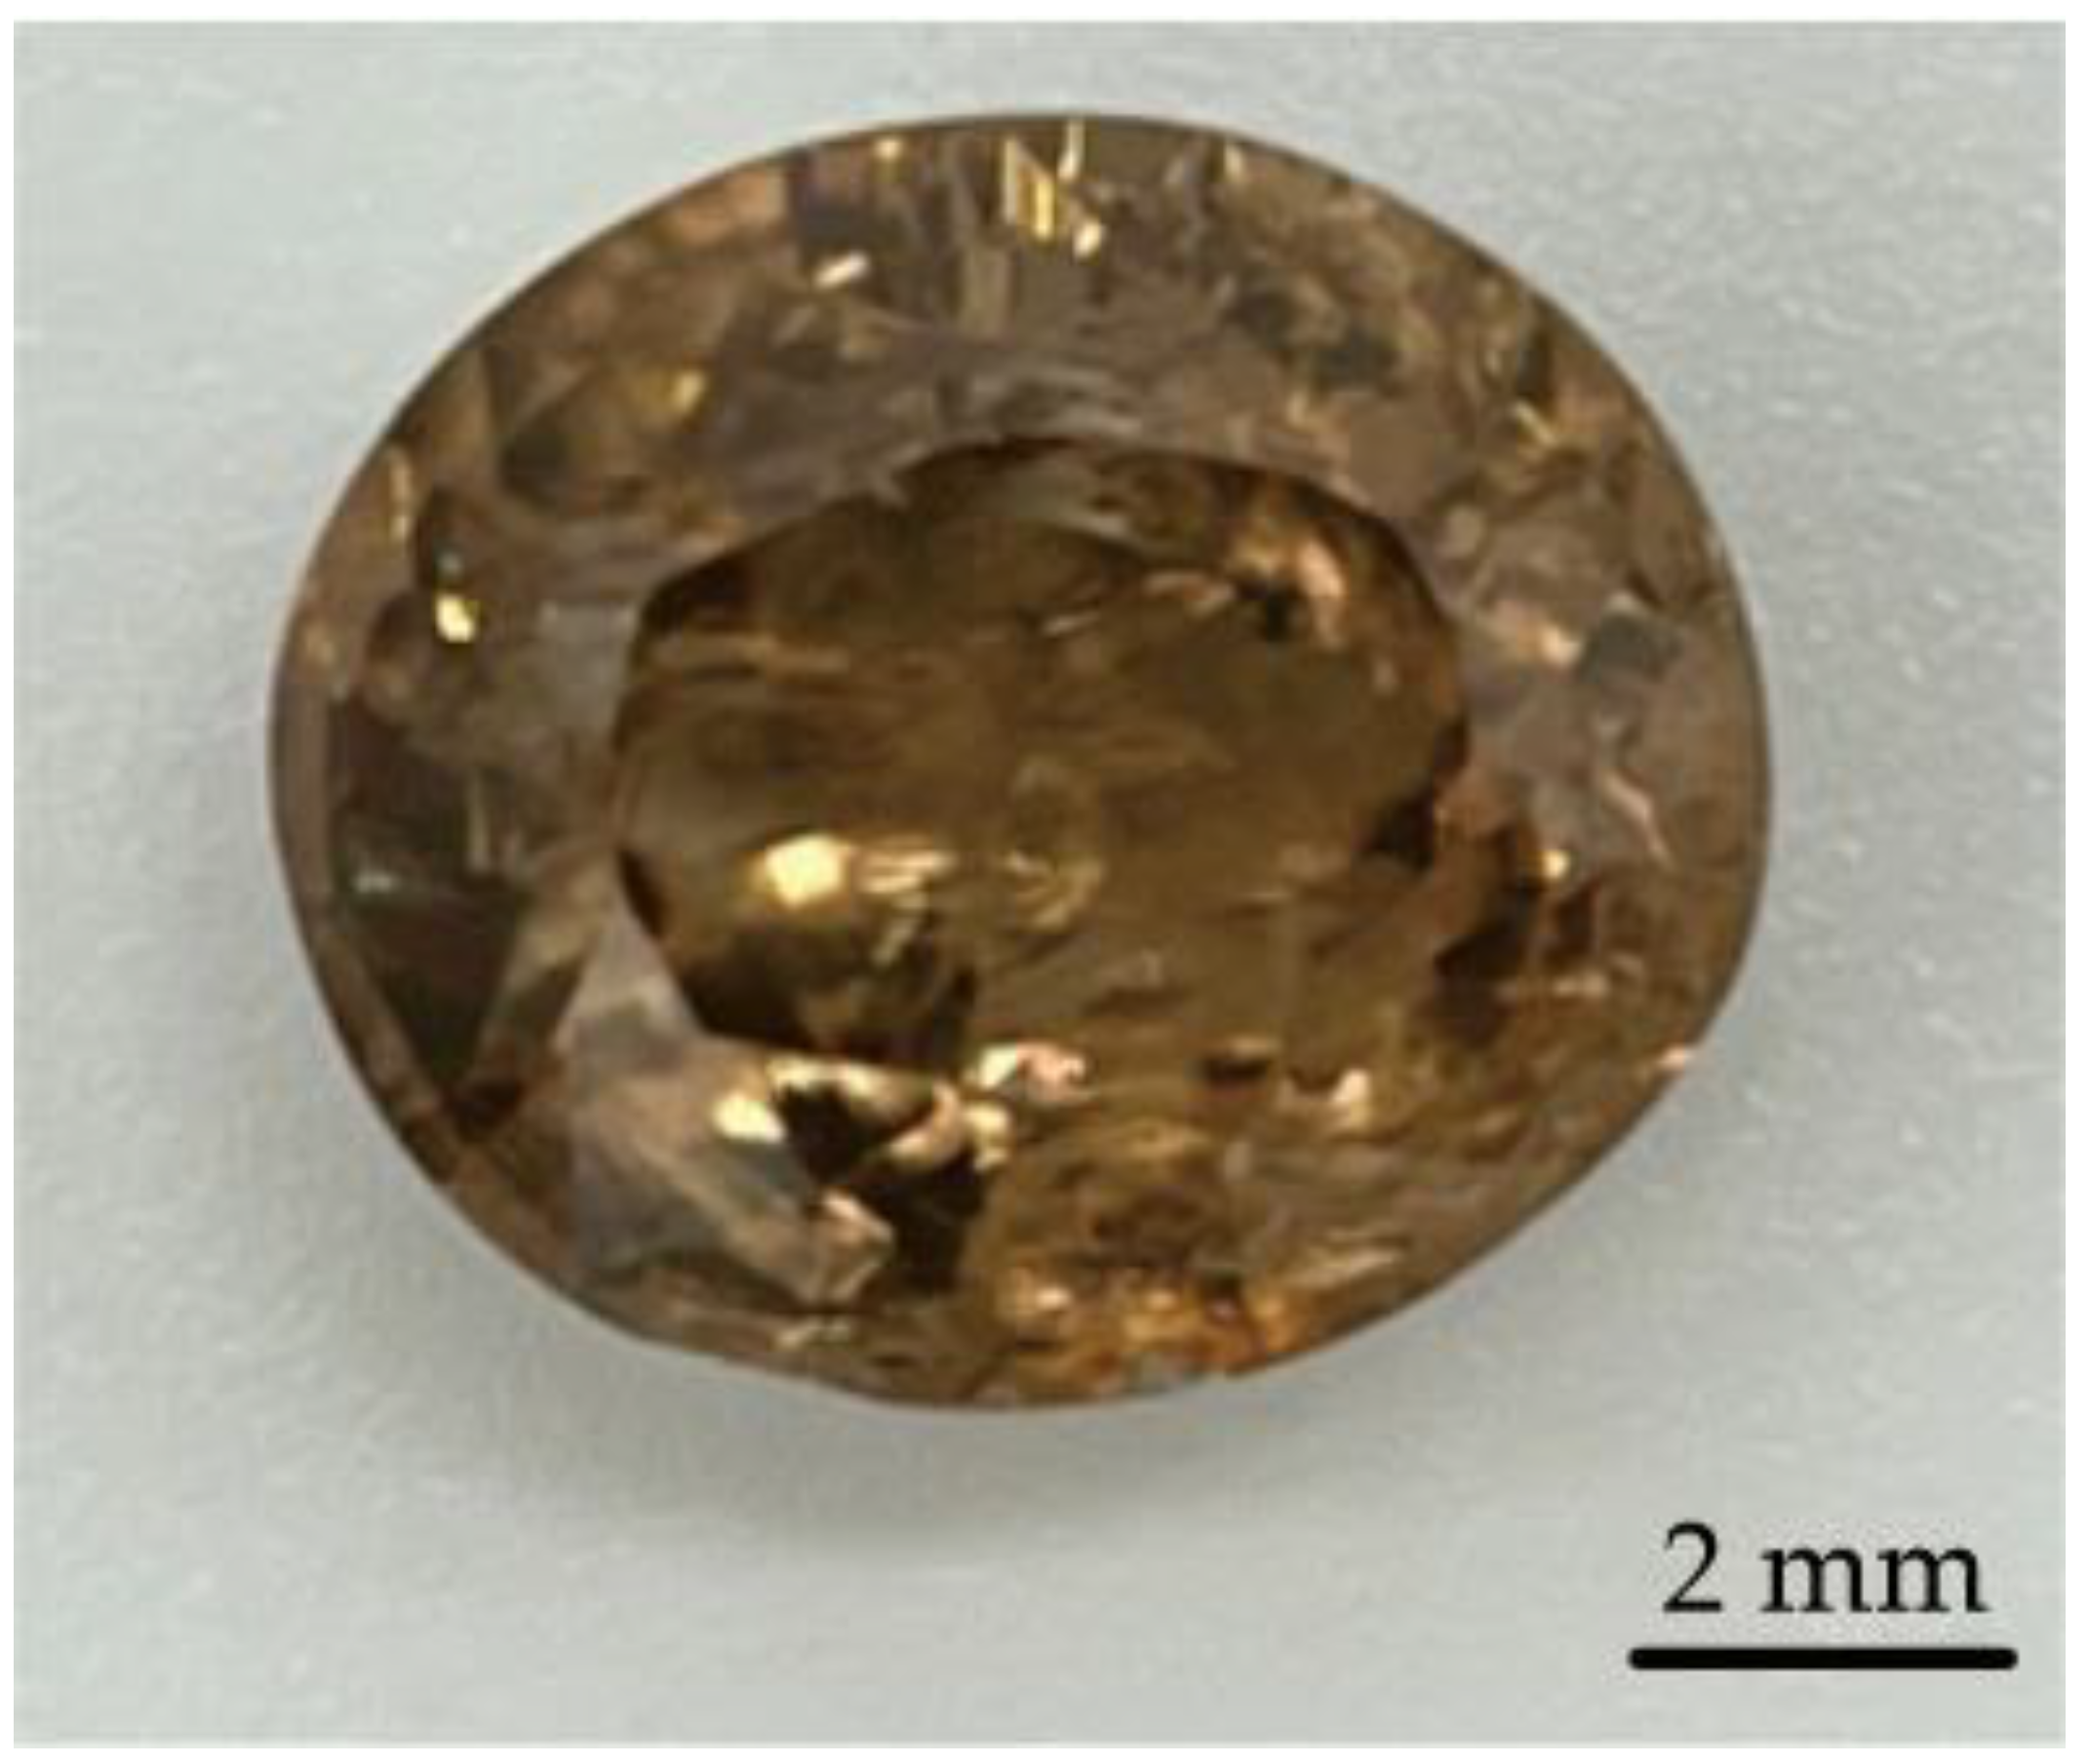
3.1. Gemmological Properties
3.2. Spectral Characteristics
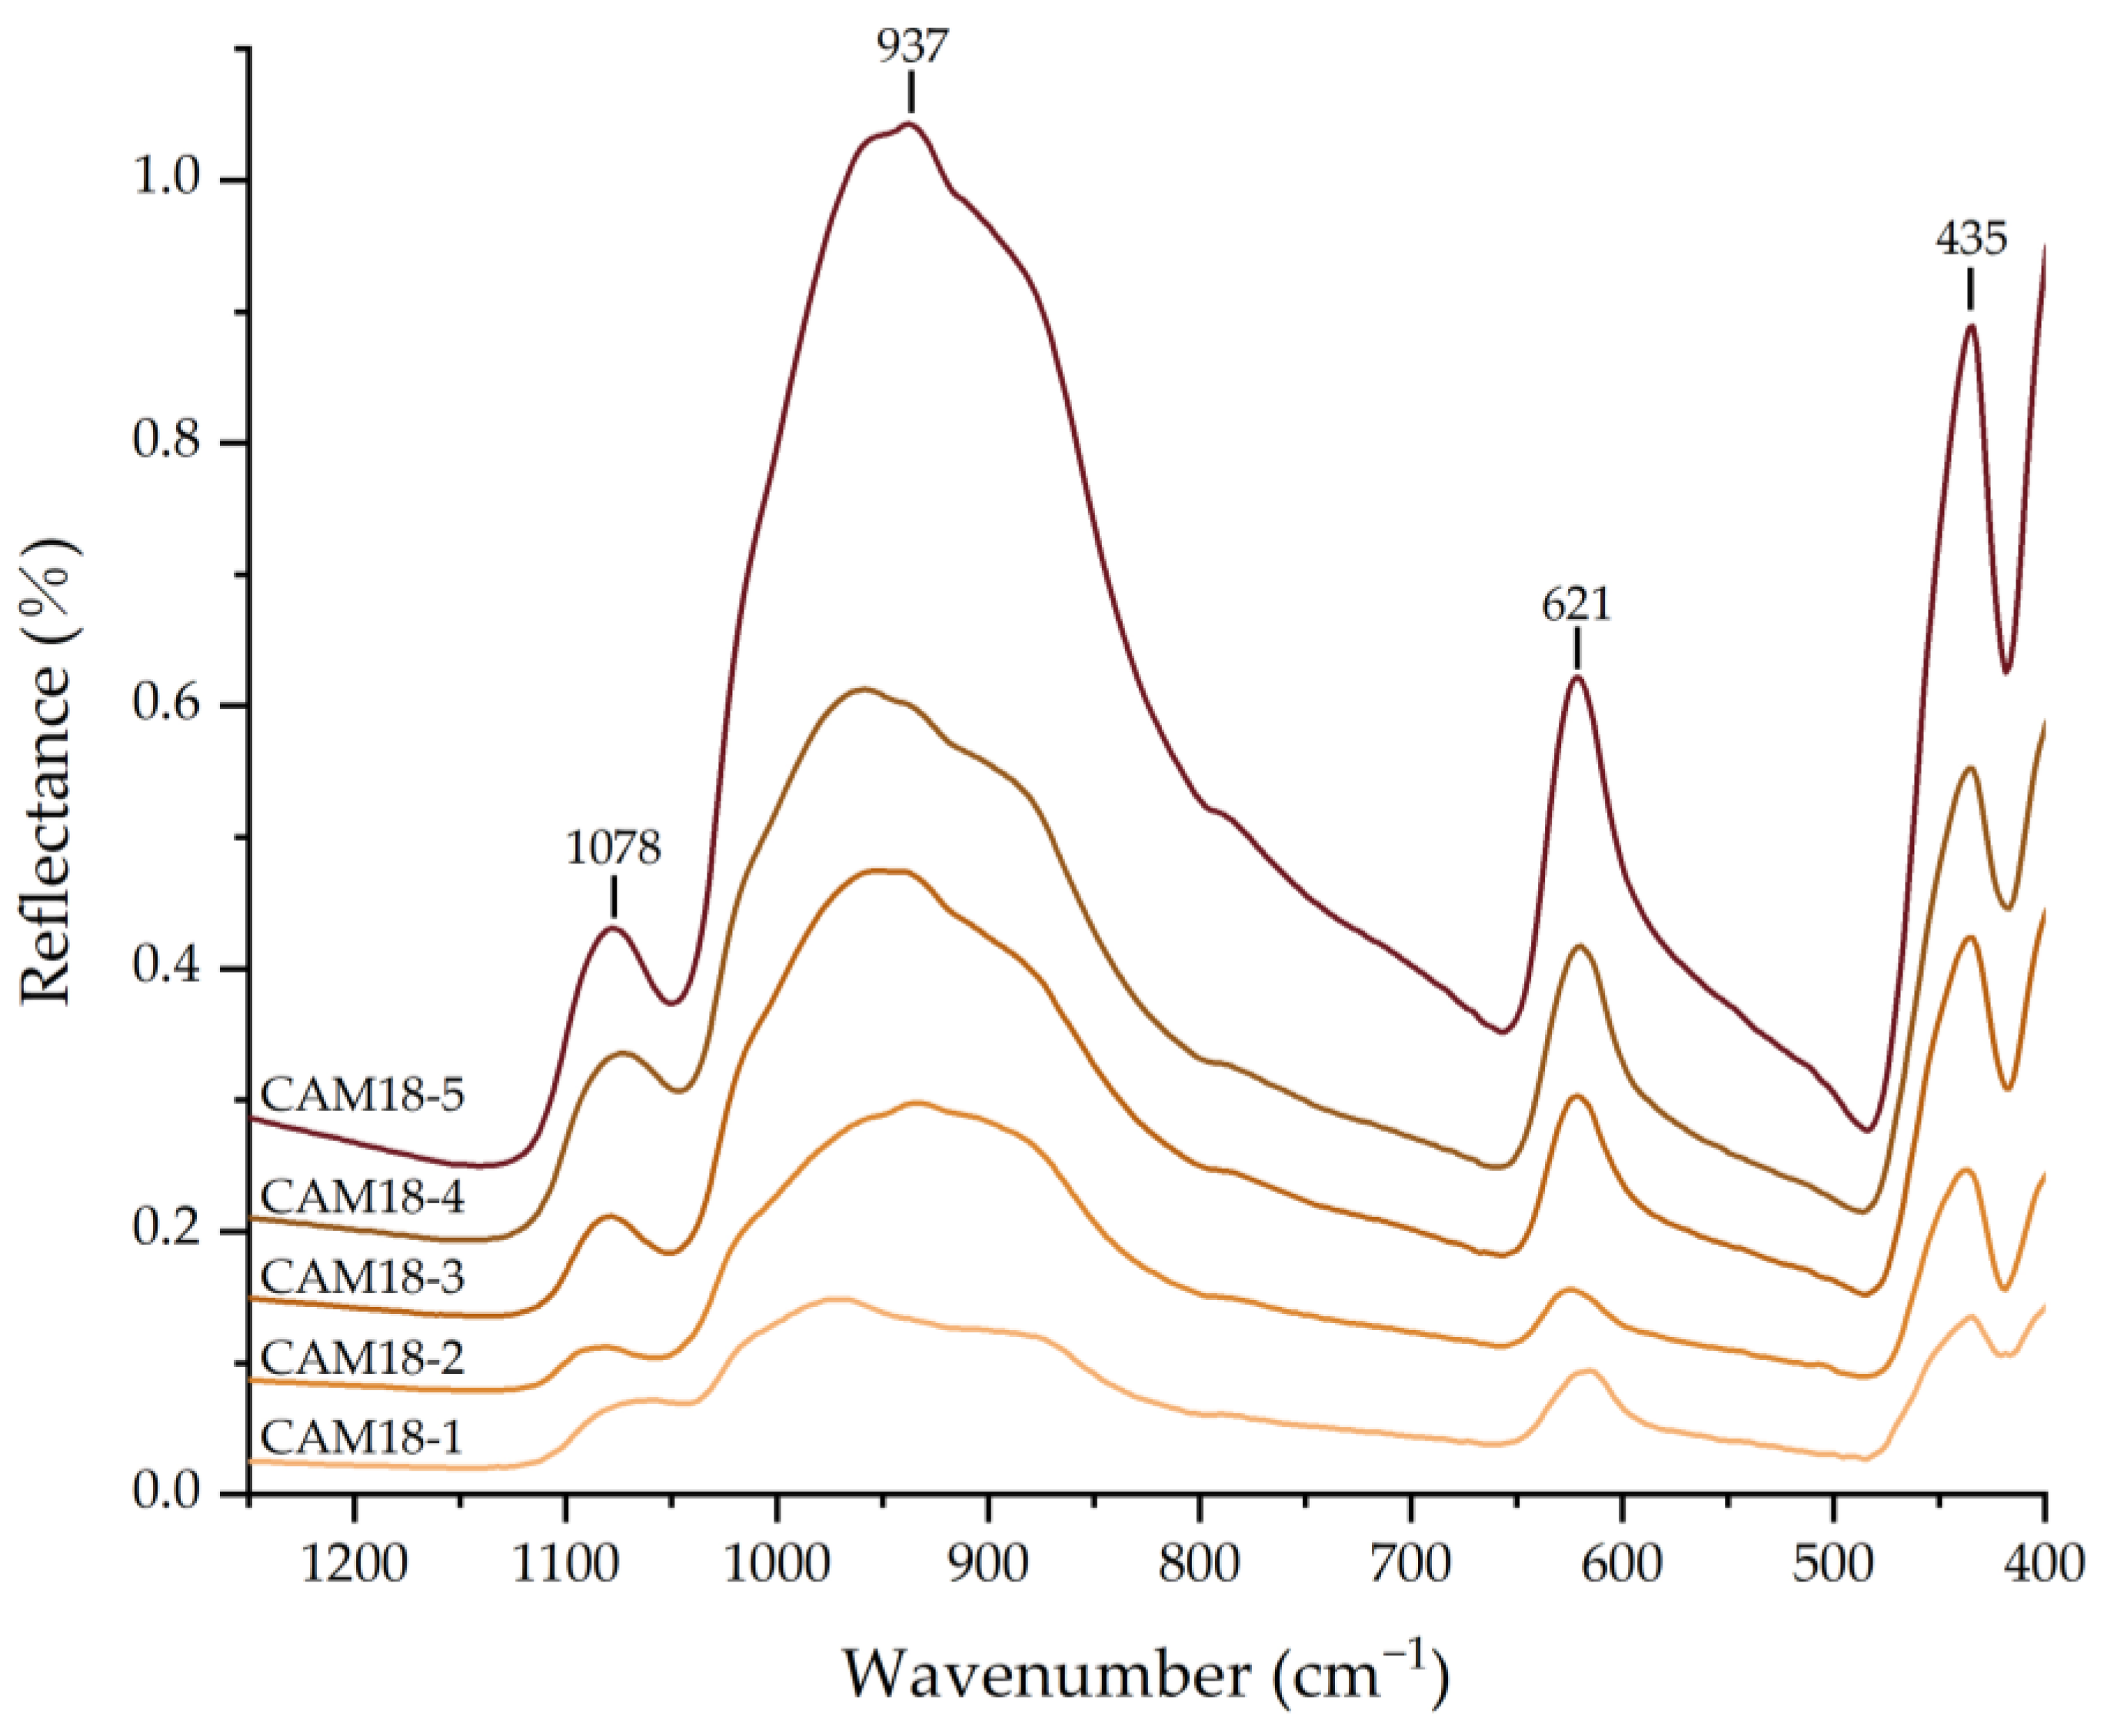
3.2.1. FTIR Spectra
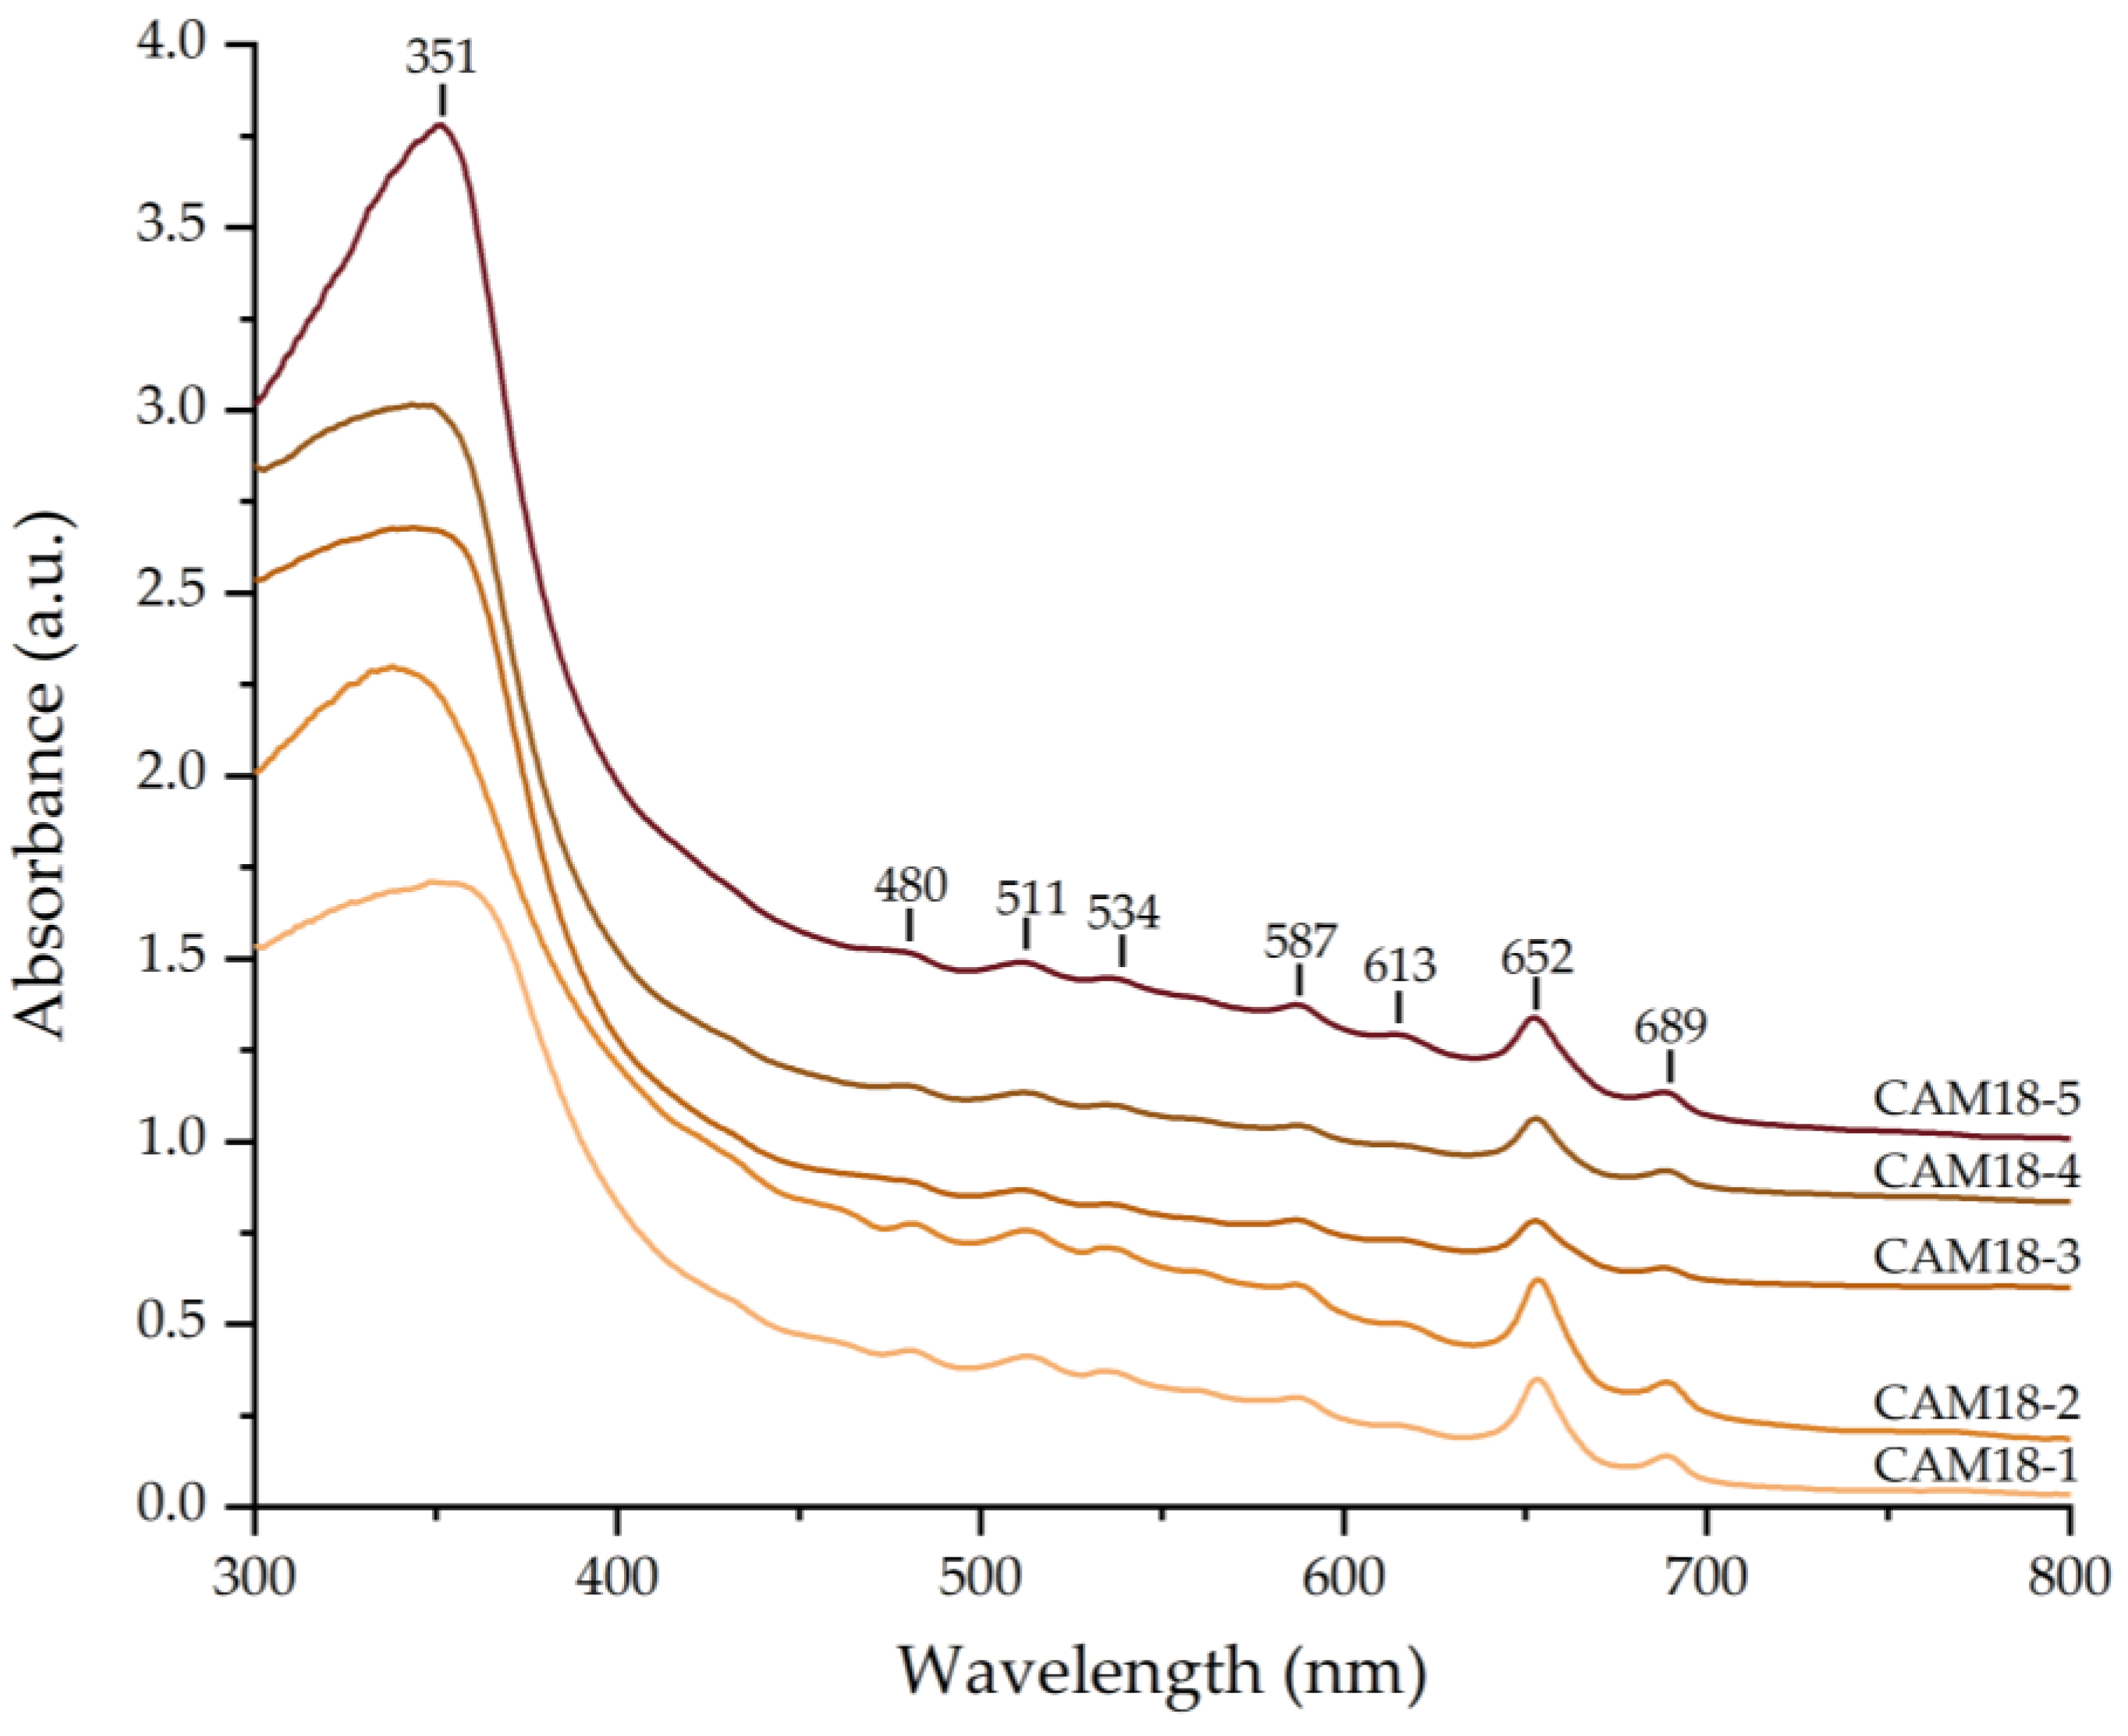
3.2.2. UV–Vis–NIR Spectra
3.2.3. Raman Spectra
3.3. U–Pb Ages
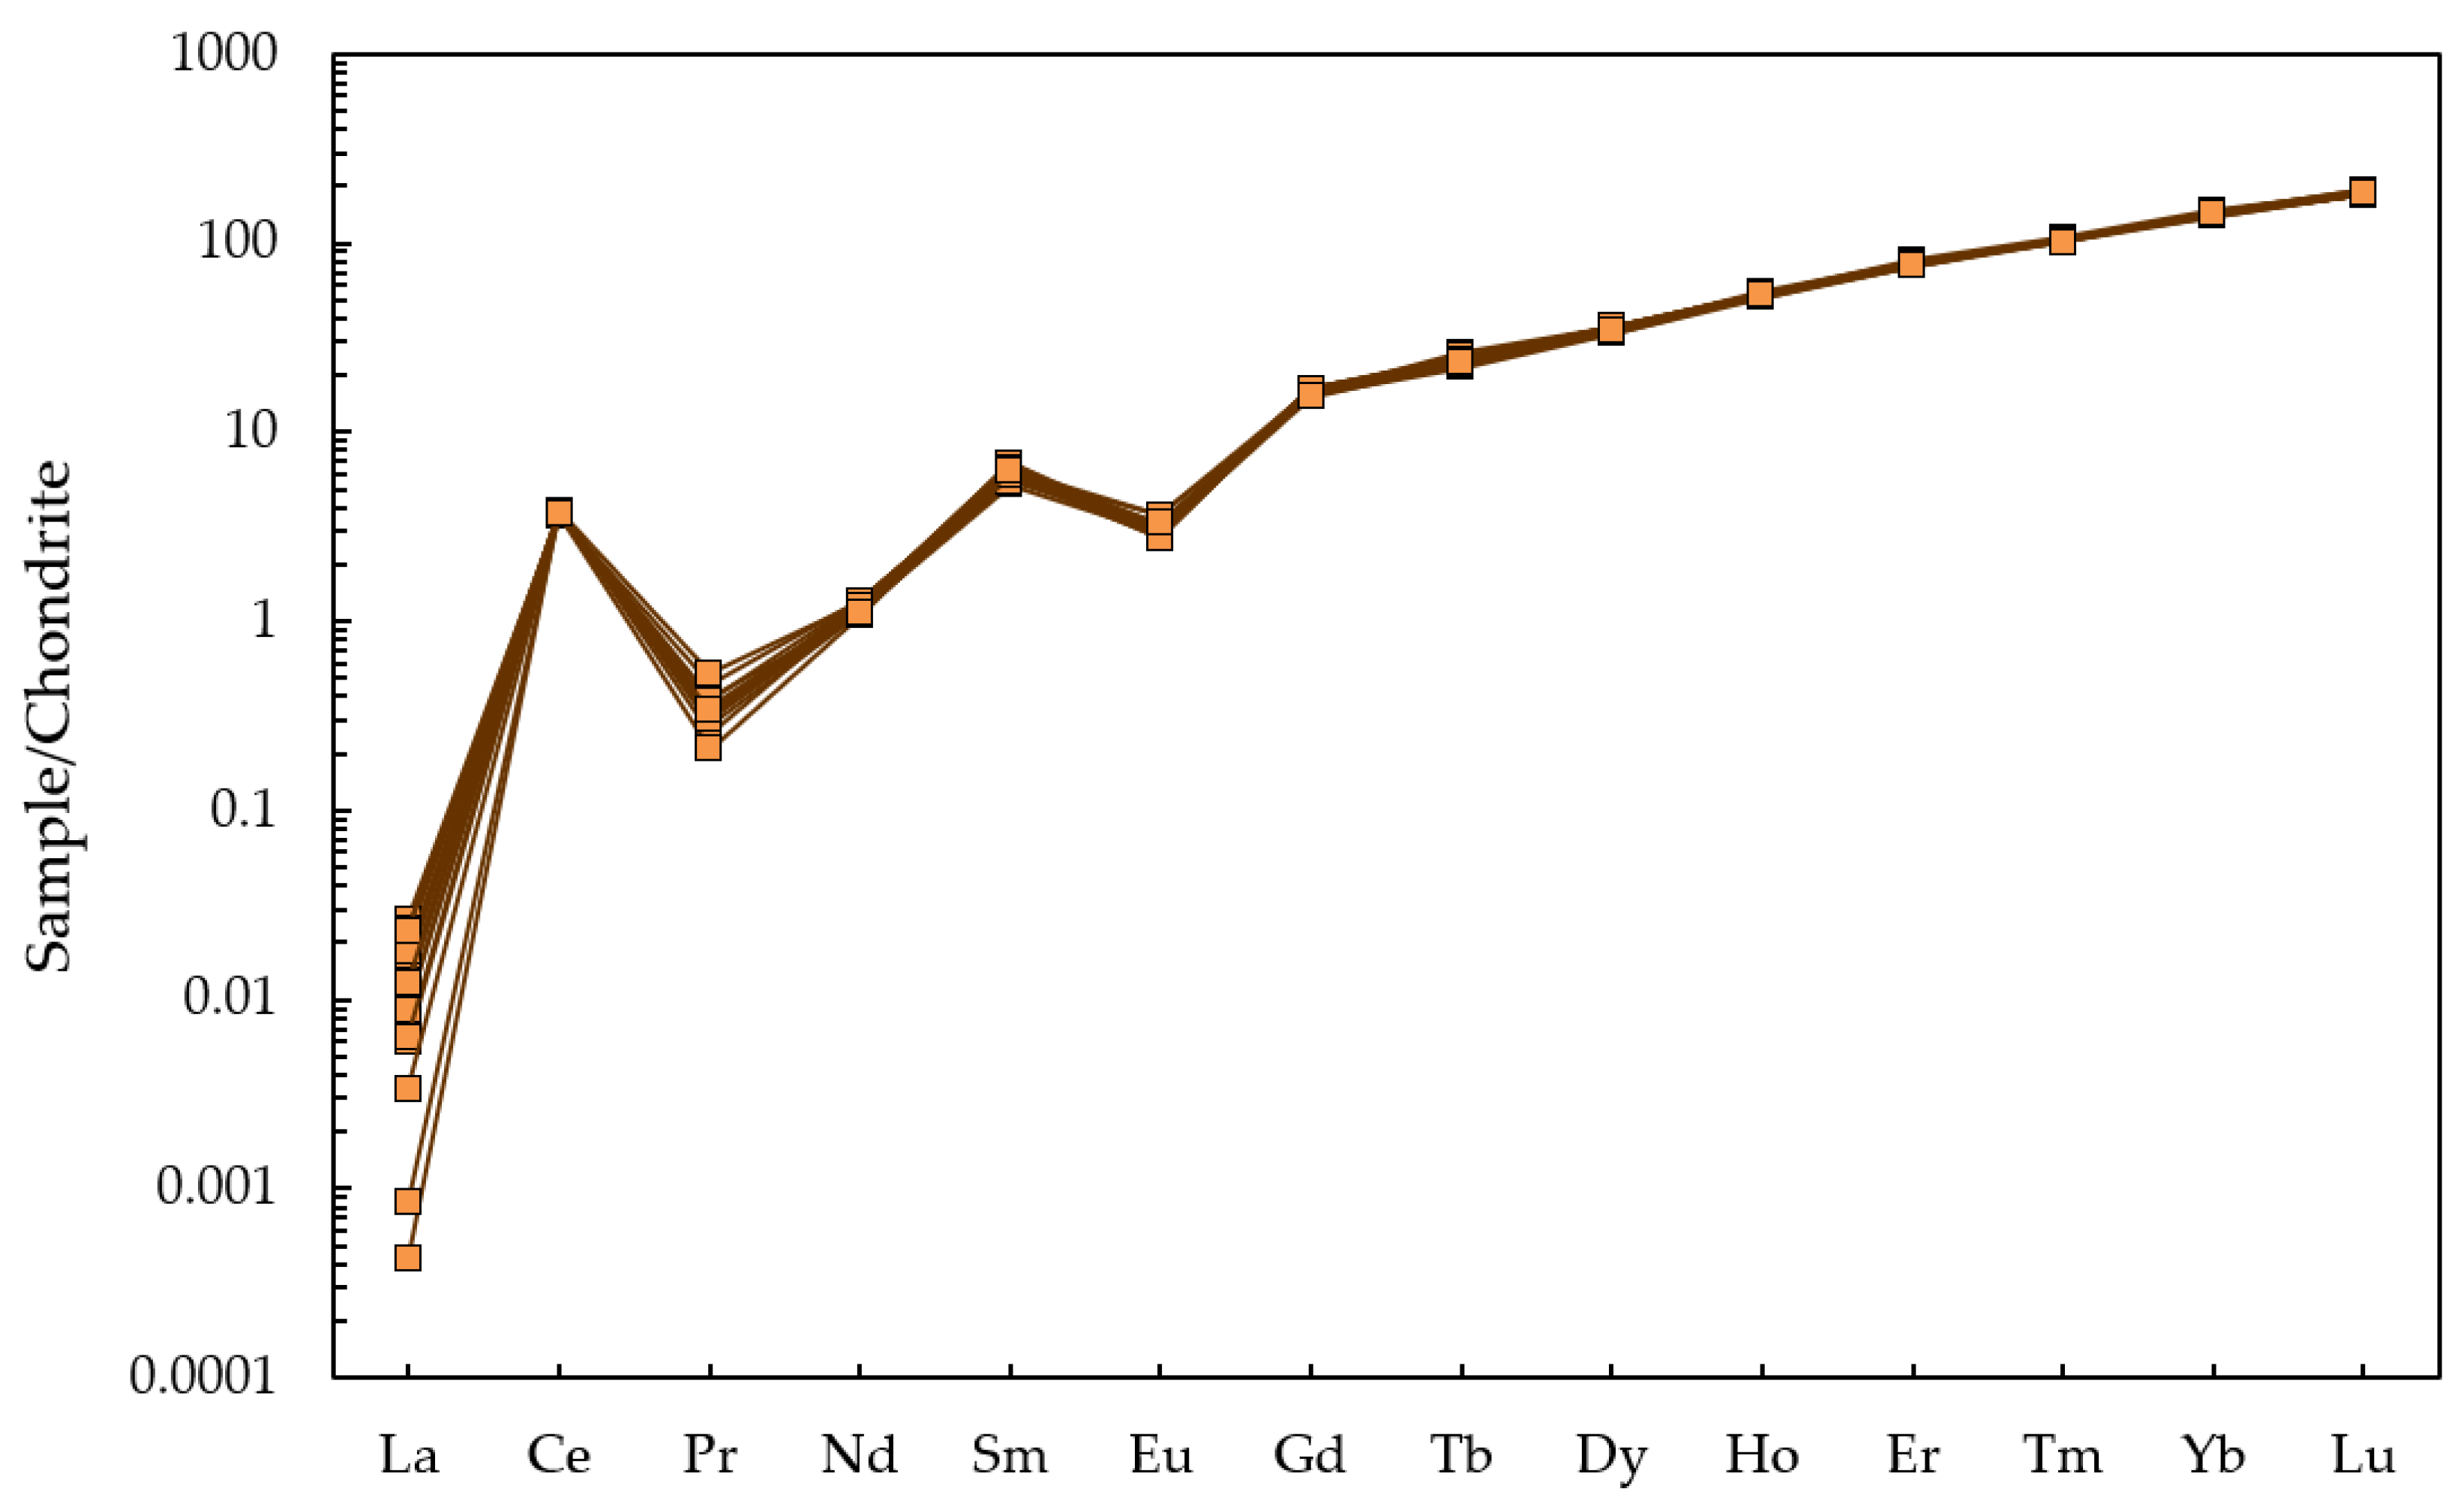
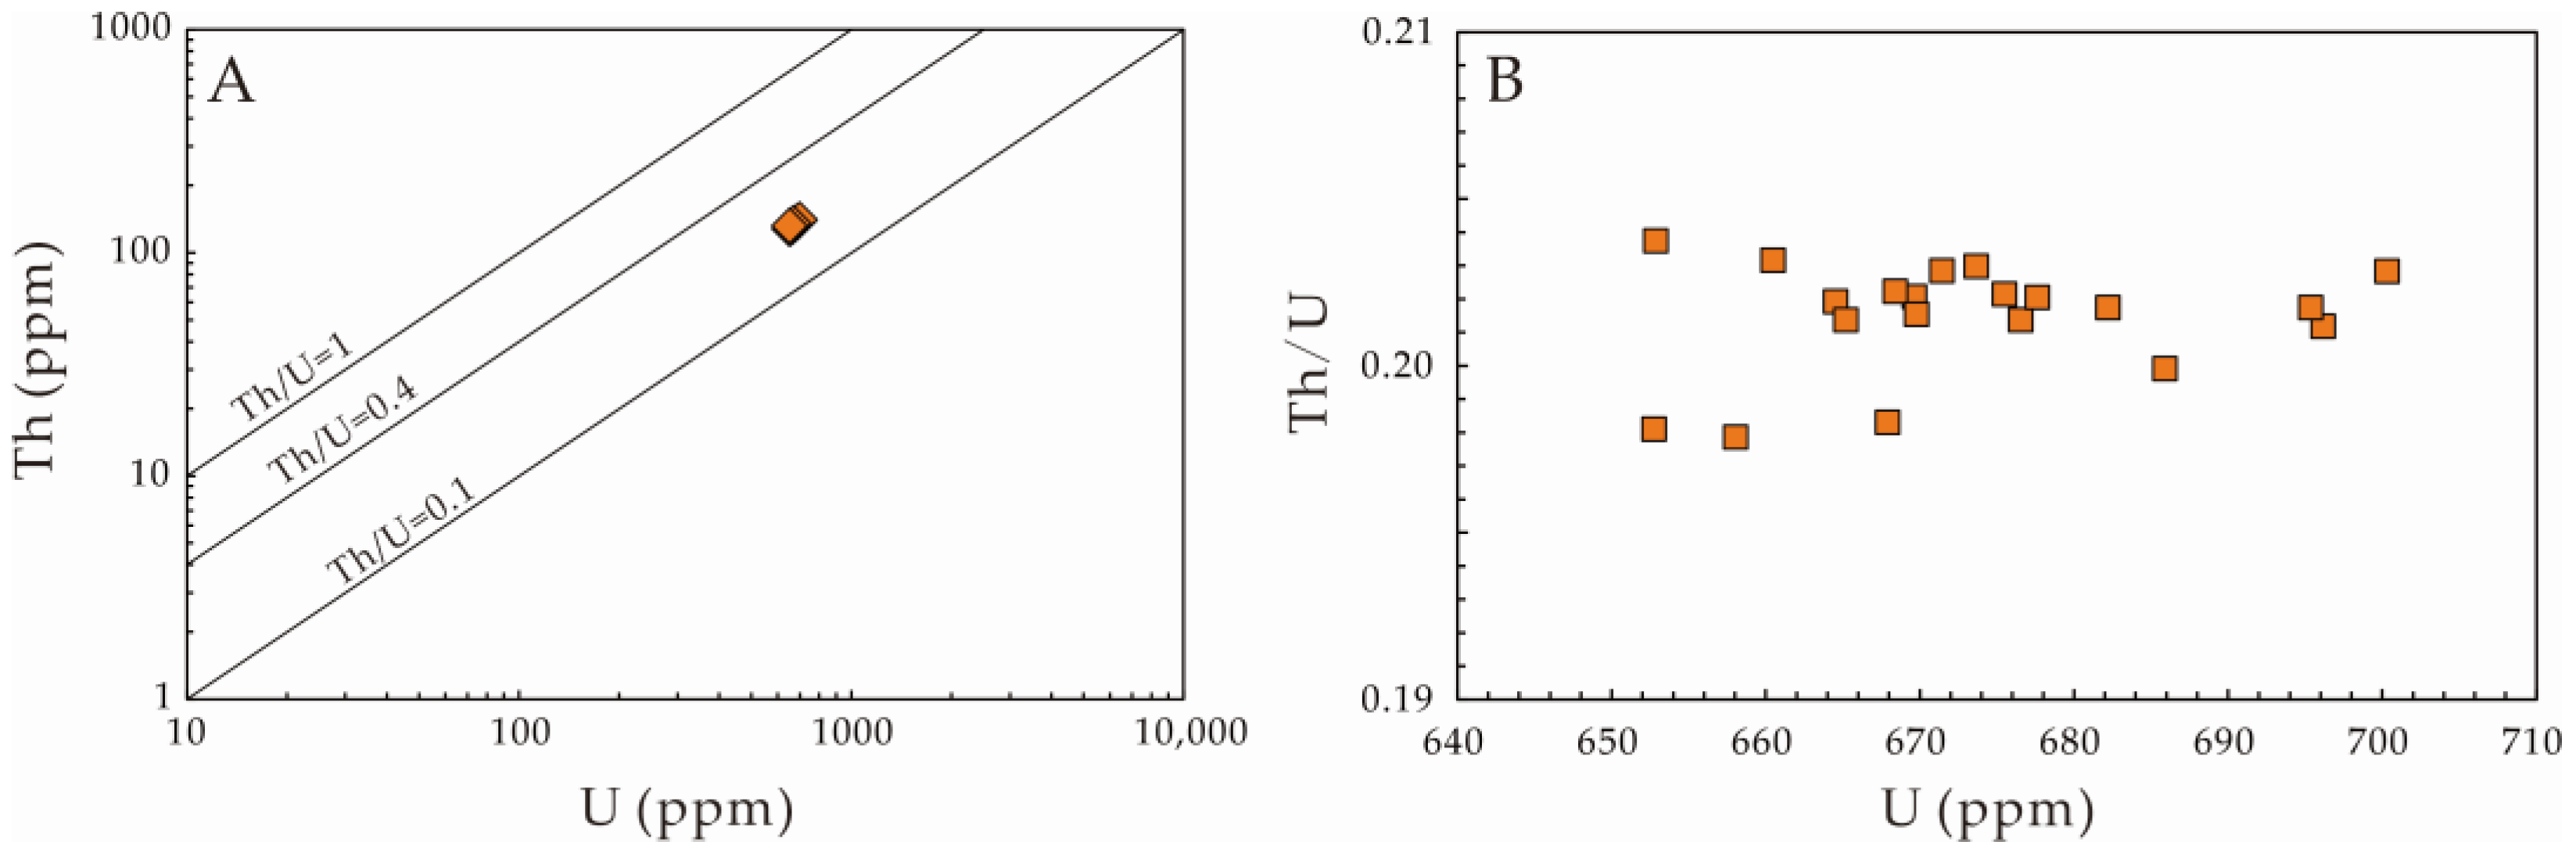
3.4. Trace Elements
4. Discussion
4.1. Structural State and Radiation Damage
4.2. U–Pb Geochronology
4.3. Magmatic Genesis
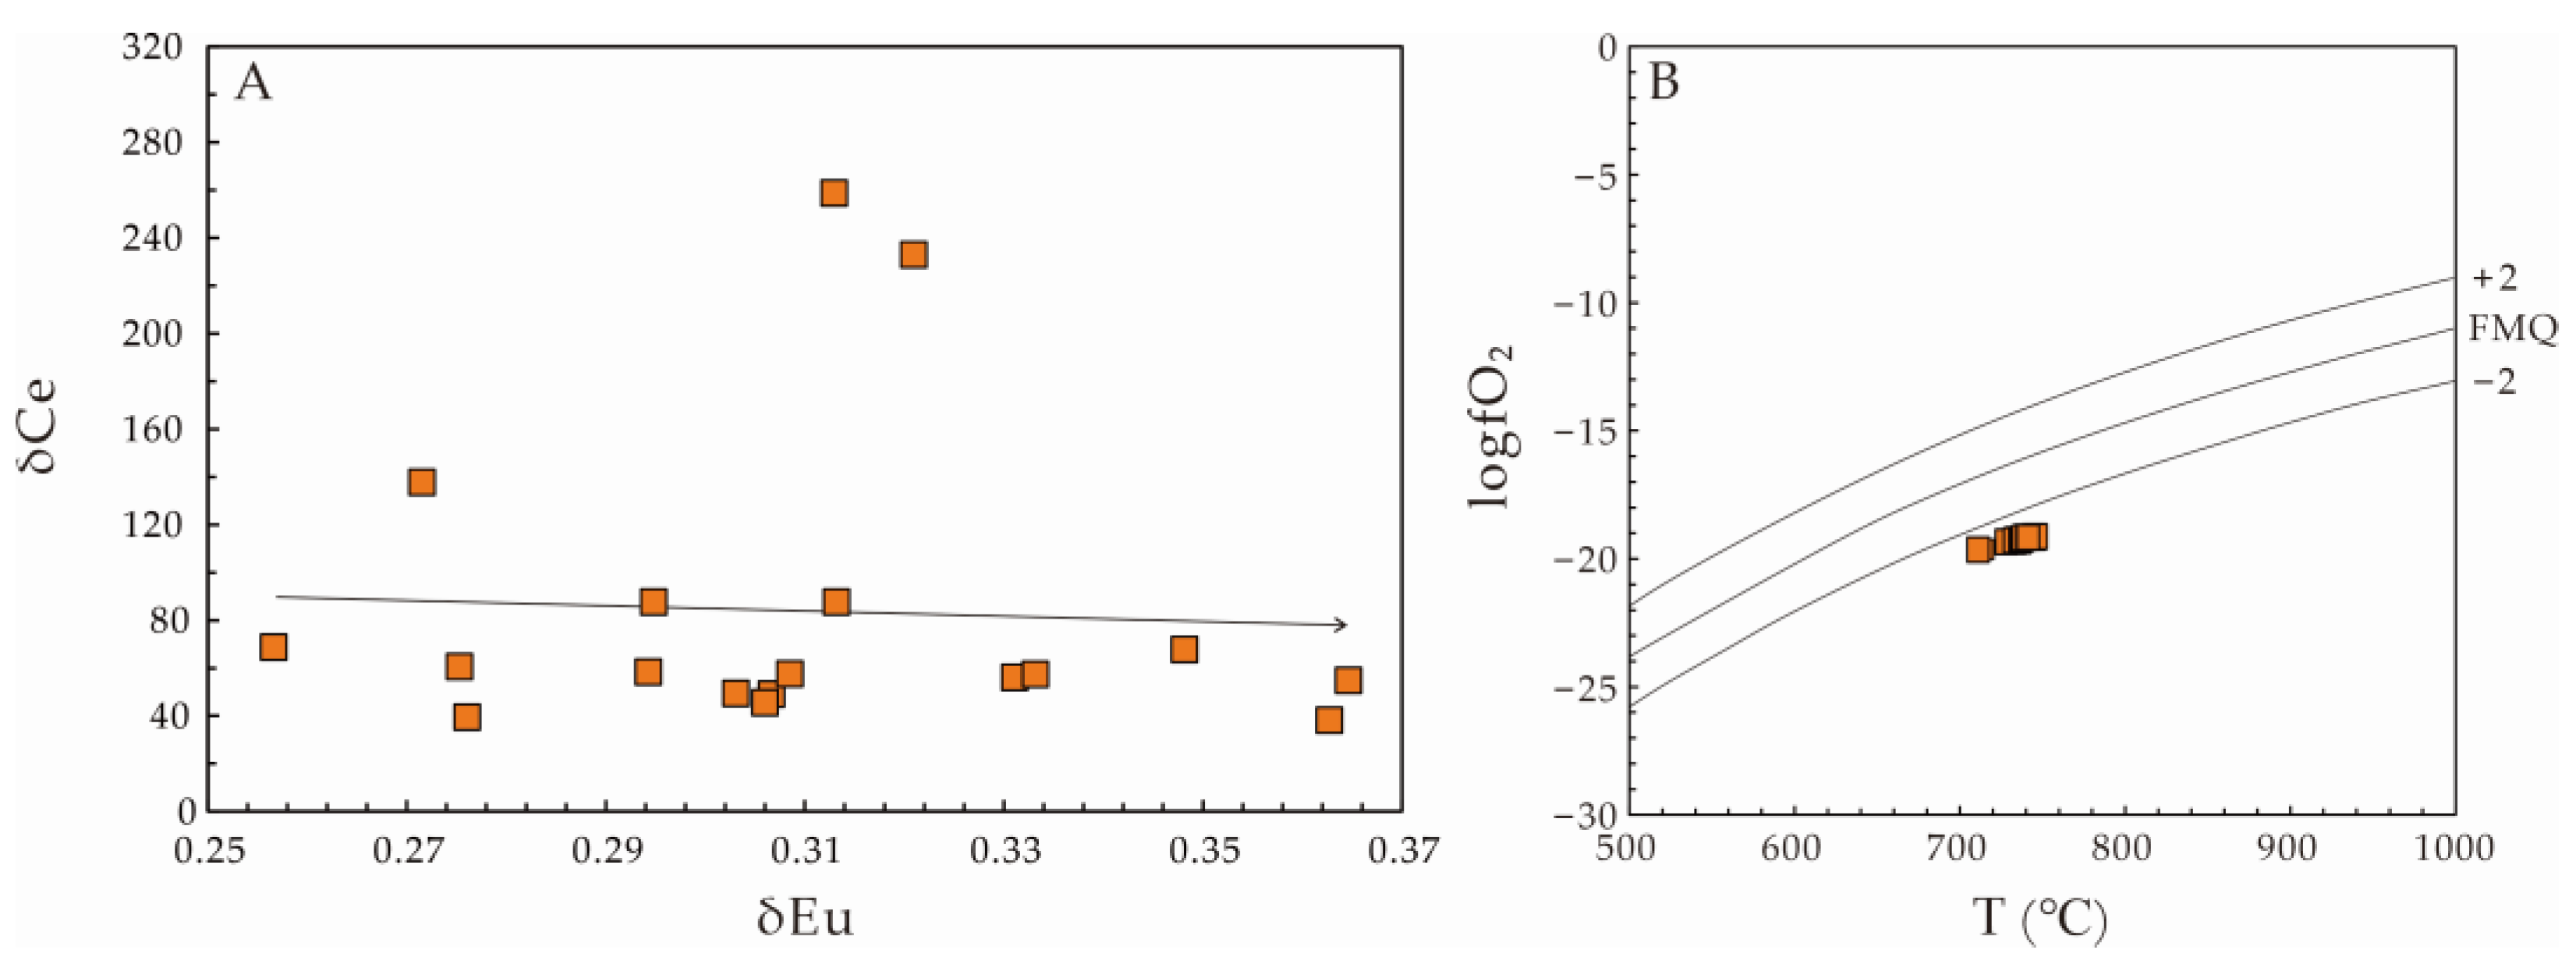
4.4. Magma Oxidization State
5. Conclusions
Author Contributions
Funding
Data Availability Statement
Acknowledgments
Conflicts of Interest
Appendix A

| 204(Pb + Hg) | Radiogenic Isotope Ratios | Isotopic Ages (Ma) | Dα (×1018 α/g) | ||||||||||||||||
|---|---|---|---|---|---|---|---|---|---|---|---|---|---|---|---|---|---|---|---|
| 207Pb/206Pb | 1σ | 208Pb/232Th | 1σ | 207Pb/235U | 1σ | 206Pb/238U | 1σ | rho | 207Pb/235U | 1σ | 206Pb/238U | 1σ | 207Pb/206Pb | 1σ | 208Pb/232Th | 1σ | |||
| CAM18 | |||||||||||||||||||
| 1 | 0.53 | 0.0584 | 0.0007 | 0.0277 | 0.0004 | 0.7391 | 0.0093 | 0.0916 | 0.0006 | 0.4928 | 562 | 5.5 | 565 | 3.4 | 546 | 27.8 | 552 | 8.7 | 1.39 |
| 2 | 0.81 | 0.0588 | 0.0007 | 0.0278 | 0.0004 | 0.7517 | 0.0096 | 0.0926 | 0.0006 | 0.4895 | 569 | 5.6 | 571 | 3.4 | 561 | 27.8 | 555 | 8.5 | 1.37 |
| 3 | 0.58 | 0.0584 | 0.0007 | 0.0278 | 0.0004 | 0.7496 | 0.0092 | 0.0929 | 0.0006 | 0.5157 | 568 | 5.3 | 572 | 3.5 | 546 | 25.9 | 554 | 8.8 | 1.35 |
| 4 | 0.53 | 0.0585 | 0.0007 | 0.0278 | 0.0004 | 0.7444 | 0.0088 | 0.0921 | 0.0005 | 0.4894 | 565 | 5.1 | 568 | 3.2 | 550 | 24.1 | 555 | 7.6 | 1.40 |
| 5 | bd (1) | 0.0591 | 0.0006 | 0.0279 | 0.0004 | 0.7536 | 0.0087 | 0.0922 | 0.0005 | 0.4719 | 570 | 5.1 | 569 | 3.0 | 572 | 24.1 | 556 | 8.3 | 1.39 |
| 6 | 0.23 | 0.0580 | 0.0007 | 0.0280 | 0.0004 | 0.7411 | 0.0090 | 0.0925 | 0.0005 | 0.4807 | 563 | 5.3 | 570 | 3.2 | 532 | 30.6 | 558 | 8.5 | 1.34 |
| 7 | 0.62 | 0.0597 | 0.0007 | 0.0283 | 0.0004 | 0.7640 | 0.0093 | 0.0926 | 0.0006 | 0.4960 | 576 | 5.4 | 571 | 3.3 | 594 | 25.9 | 564 | 8.8 | 1.38 |
| 8 | 0.25 | 0.0585 | 0.0007 | 0.0282 | 0.0005 | 0.7465 | 0.0091 | 0.0923 | 0.0006 | 0.4935 | 566 | 5.3 | 569 | 3.3 | 550 | 25.9 | 562 | 9.0 | 1.40 |
| 9 | 0.44 | 0.0598 | 0.0007 | 0.0286 | 0.0004 | 0.7684 | 0.0096 | 0.0931 | 0.0006 | 0.4889 | 579 | 5.5 | 574 | 3.4 | 594 | 25.9 | 571 | 8.6 | 1.43 |
| 10 | bd (1) | 0.0600 | 0.0008 | 0.0283 | 0.0005 | 0.7615 | 0.0101 | 0.0919 | 0.0006 | 0.4606 | 575 | 5.8 | 567 | 3.3 | 606 | 27.8 | 564 | 9.5 | 1.38 |
| 11 | 0.34 | 0.0607 | 0.0007 | 0.0289 | 0.0004 | 0.7744 | 0.0093 | 0.0924 | 0.0006 | 0.5126 | 582 | 5.4 | 570 | 3.4 | 628 | 21.3 | 576 | 8.8 | 1.42 |
| 12 | 0.13 | 0.0591 | 0.0007 | 0.0287 | 0.0005 | 0.7567 | 0.0087 | 0.0928 | 0.0006 | 0.5554 | 572 | 5.0 | 572 | 3.5 | 569 | 25.9 | 573 | 9.0 | 1.37 |
| 13 | 0.20 | 0.0596 | 0.0007 | 0.0291 | 0.0004 | 0.7626 | 0.0091 | 0.0927 | 0.0005 | 0.4873 | 576 | 5.2 | 571 | 3.2 | 587 | 24.1 | 579 | 8.4 | 1.36 |
| 14 | 0.40 | 0.0596 | 0.0006 | 0.0299 | 0.0004 | 0.7682 | 0.0086 | 0.0934 | 0.0005 | 0.5161 | 579 | 4.9 | 575 | 3.2 | 587 | 22.2 | 595 | 8.7 | 1.37 |
| 15 | 0.22 | 0.0600 | 0.0007 | 0.0293 | 0.0005 | 0.7733 | 0.0092 | 0.0934 | 0.0006 | 0.5131 | 582 | 5.3 | 575 | 3.4 | 606 | 20.2 | 584 | 9.2 | 1.37 |
| 16 | bd (1) | 0.0598 | 0.0007 | 0.0294 | 0.0004 | 0.7667 | 0.0093 | 0.0928 | 0.0005 | 0.4769 | 578 | 5.4 | 572 | 3.2 | 598 | 30.5 | 586 | 8.1 | 1.68 |
| 17 | 0.59 | 0.0598 | 0.0006 | 0.0295 | 0.0005 | 0.7691 | 0.0083 | 0.0932 | 0.0006 | 0.5563 | 579 | 4.8 | 574 | 3.3 | 594 | 24.1 | 588 | 9.2 | 1.35 |
| 18 | 0.68 | 0.0590 | 0.0007 | 0.0288 | 0.0004 | 0.7548 | 0.0089 | 0.0926 | 0.0006 | 0.5237 | 571 | 5.2 | 571 | 3.4 | 569 | 24.1 | 574 | 8.5 | 1.36 |
| 19 | 0.020 | 0.0600 | 0.0008 | 0.0293 | 0.0005 | 0.7726 | 0.0102 | 0.0932 | 0.0006 | 0.4872 | 581 | 5.8 | 574 | 3.5 | 606 | 27.8 | 585 | 8.9 | 1.37 |
| 20 | 0.74 | 0.0594 | 0.0008 | 0.0299 | 0.0005 | 0.7624 | 0.0101 | 0.0929 | 0.0006 | 0.5133 | 575 | 5.8 | 572 | 3.7 | 583 | 27.8 | 595 | 9.3 | 1.34 |
| 91500 | |||||||||||||||||||
| 1 | 0.82 | 0.0763 | 0.0012 | 0.0563 | 0.0010 | 1.8885 | 0.0306 | 0.1792 | 0.0014 | 0.4876 | 1077 | 10.8 | 1063 | 7.8 | 1106 | 36.1 | 1108 | 19.7 | |
| 2 | 0.38 | 0.0734 | 0.0017 | 0.0517 | 0.0013 | 1.8119 | 0.0399 | 0.1791 | 0.0015 | 0.3868 | 1050 | 14.4 | 1062 | 8.4 | 1026 | 41.7 | 1020 | 24.9 | |
| 3 | 0.23 | 0.0752 | 0.0012 | 0.0548 | 0.0010 | 1.8577 | 0.0302 | 0.1791 | 0.0014 | 0.4735 | 1066 | 10.7 | 1062 | 7.6 | 1073 | 31.5 | 1078 | 19.1 | |
| 4 | 0.35 | 0.0746 | 0.0014 | 0.0533 | 0.0014 | 1.8427 | 0.0354 | 0.1793 | 0.0014 | 0.4150 | 1061 | 12.7 | 1063 | 7.8 | 1057 | 38.6 | 1049 | 27.1 | |
| 5 | 0.29 | 0.0763 | 0.0015 | 0.0526 | 0.0013 | 1.8887 | 0.0381 | 0.1795 | 0.0016 | 0.4419 | 1077 | 13.4 | 1064 | 8.8 | 1103 | 40.7 | 1036 | 24.1 | |
| 6 | 0.22 | 0.0735 | 0.0013 | 0.0555 | 0.0011 | 1.8117 | 0.0307 | 0.1788 | 0.0014 | 0.4530 | 1050 | 11.1 | 1061 | 7.5 | 1028 | 35.2 | 1092 | 20.7 | |
| GJ-1 | |||||||||||||||||||
| 1 | 0.37 | 0.0587 | 0.0008 | 0.0300 | 0.0010 | 0.7971 | 0.0112 | 0.0983 | 0.0006 | 0.4602 | 595 | 6.4 | 604 | 3.8 | 567 | 29.6 | 598 | 19.2 | |
| 2 | 0.28 | 0.0608 | 0.0008 | 0.0307 | 0.0008 | 0.8248 | 0.0114 | 0.0983 | 0.0006 | 0.4760 | 611 | 6.3 | 604 | 3.8 | 635 | 28.5 | 611 | 16.2 | |
| 3 | 0.51 | 0.0604 | 0.0009 | 0.0318 | 0.0010 | 0.8152 | 0.0116 | 0.0977 | 0.0006 | 0.4556 | 605 | 6.5 | 601 | 3.7 | 617 | 30.4 | 632 | 19.3 | |
| CAM 18-1 | CAM 18-2 | CAM 18-3 | CAM 18-4 | CAM 18-5 | CAM 18-6 | CAM 18-7 | CAM 18-8 | CAM 18-9 | CAM 18-10 | CAM 18-11 | CAM 18-12 | CAM 18-13 | CAM 18-14 | CAM 18-15 | CAM 18-16 | CAM 18-17 | CAM 18-18 | CAM 18-19 | CAM 18-20 | |
|---|---|---|---|---|---|---|---|---|---|---|---|---|---|---|---|---|---|---|---|---|
| Ti (ppm) | 3.08 | 3.28 | 3.27 | 3.32 | 3.23 | 2.61 | 3.22 | 3.61 | 3.33 | 3.44 | 3.40 | 3.35 | 3.60 | 3.39 | 3.57 | 3.47 | 3.49 | 3.64 | 3.47 | 3.48 |
| La (ppm) | 0.0049 | 0.0028 | 0.0014 | 0.0022 | 0.0041 | 0.0021 | 0.0028 | bd (1) | 0.0035 | 0.0030 | 0.0015 | 0.0028 | 0.0063 | 0.0042 | 0.0056 | 0.0001 | 0.0002 | 0.0008 | bd (1) | 0.0029 |
| Ce (ppm) | 2.32 | 2.29 | 2.28 | 2.26 | 2.26 | 2.23 | 2.31 | 2.35 | 2.30 | 2.34 | 2.36 | 2.27 | 2.22 | 2.32 | 2.29 | 2.36 | 2.29 | 2.25 | 2.26 | 2.26 |
| Pr (ppm) | 0.027 | 0.033 | 0.029 | 0.044 | 0.031 | 0.030 | 0.031 | 0.034 | 0.030 | 0.033 | 0.029 | 0.024 | 0.032 | 0.037 | 0.036 | 0.050 | 0.029 | 0.020 | 0.029 | 0.032 |
| Nd (ppm) | 0.51 | 0.57 | 0.53 | 0.60 | 0.60 | 0.57 | 0.53 | 0.55 | 0.59 | 0.51 | 0.55 | 0.55 | 0.54 | 0.51 | 0.60 | 0.59 | 0.52 | 0.50 | 0.56 | 0.51 |
| Sm (ppm) | 0.99 | 0.92 | 0.81 | 0.90 | 0.95 | 1.05 | 1.03 | 1.04 | 0.92 | 0.95 | 1.04 | 0.87 | 0.97 | 0.91 | 0.91 | 0.99 | 0.84 | 0.96 | 0.90 | 0.95 |
| Eu (ppm) | 0.18 | 0.17 | 0.17 | 0.19 | 0.18 | 0.16 | 0.17 | 0.17 | 0.21 | 0.18 | 0.18 | 0.19 | 0.21 | 0.17 | 0.16 | 0.19 | 0.18 | 0.16 | 0.16 | 0.19 |
| Gd (ppm) | 3.33 | 3.39 | 3.40 | 3.42 | 3.39 | 3.46 | 3.46 | 3.33 | 3.37 | 3.35 | 3.35 | 3.20 | 3.23 | 3.17 | 3.45 | 3.48 | 3.50 | 3.38 | 3.46 | 3.20 |
| Tb (ppm) | 0.98 | 0.90 | 0.89 | 0.90 | 0.93 | 0.91 | 0.90 | 0.90 | 0.91 | 0.91 | 0.91 | 0.82 | 0.89 | 0.87 | 0.85 | 0.94 | 0.87 | 0.94 | 0.90 | 0.88 |
| Dy (ppm) | 9.14 | 8.58 | 8.47 | 8.86 | 9.17 | 8.87 | 9.12 | 9.04 | 9.10 | 8.75 | 8.95 | 8.45 | 8.99 | 8.63 | 8.92 | 8.97 | 8.58 | 9.09 | 8.67 | 8.83 |
| Ho (ppm) | 3.02 | 3.03 | 2.90 | 3.06 | 2.95 | 3.05 | 2.92 | 3.03 | 3.09 | 3.01 | 3.11 | 2.99 | 3.01 | 2.94 | 2.98 | 3.10 | 2.95 | 2.99 | 3.00 | 2.98 |
| Er (ppm) | 13.14 | 13.09 | 12.57 | 13.09 | 12.81 | 12.86 | 12.84 | 12.76 | 12.93 | 12.63 | 12.96 | 12.76 | 12.85 | 12.78 | 12.77 | 13.42 | 12.76 | 12.86 | 13.06 | 12.58 |
| Tm (ppm) | 2.70 | 2.62 | 2.63 | 2.68 | 2.67 | 2.68 | 2.70 | 2.61 | 2.70 | 2.66 | 2.67 | 2.62 | 2.64 | 2.63 | 2.70 | 2.72 | 2.67 | 2.67 | 2.66 | 2.57 |
| Yb (ppm) | 24.86 | 23.54 | 23.49 | 24.24 | 24.66 | 24.56 | 24.45 | 24.96 | 24.78 | 23.86 | 24.79 | 24.58 | 23.89 | 24.28 | 24.57 | 25.22 | 24.14 | 23.97 | 24.57 | 24.21 |
| Lu (ppm) | 4.73 | 4.57 | 4.58 | 4.63 | 4.76 | 4.81 | 4.66 | 4.79 | 4.82 | 4.65 | 4.71 | 4.57 | 4.62 | 4.66 | 4.74 | 4.74 | 4.59 | 4.65 | 4.67 | 4.61 |
| Hf (ppm) | 10,778 | 10,776 | 10,738 | 10,793 | 10,774 | 10,789 | 10,783 | 10,727 | 10,716 | 10,750 | 10,689 | 10,758 | 10,708 | 10,695 | 10,755 | 10,672 | 10,721 | 10,765 | 10,724 | 10,731 |
| total Pb (ppm) | 67.70 | 67.73 | 66.61 | 69.06 | 68.44 | 65.96 | 68.53 | 69.00 | 71.09 | 68.05 | 70.64 | 68.03 | 67.64 | 68.40 | 68.56 | 71.28 | 67.45 | 67.37 | 68.48 | 66.41 |
| Th (ppm) | 136 | 135 | 130 | 137 | 137 | 129 | 137 | 138 | 140 | 137 | 140 | 135 | 134 | 132 | 135 | 142 | 134 | 134 | 136 | 133 |
| U (ppm) | 677 | 670 | 658 | 686 | 678 | 653 | 675 | 682 | 696 | 674 | 695 | 668 | 665 | 668 | 670 | 700 | 660 | 665 | 671 | 653 |
| Th/U | 0.20 | 0.20 | 0.20 | 0.20 | 0.20 | 0.20 | 0.20 | 0.20 | 0.20 | 0.20 | 0.20 | 0.20 | 0.20 | 0.20 | 0.20 | 0.20 | 0.20 | 0.20 | 0.20 | 0.20 |
| δCe (2) | 49.45 | 58.41 | 87.73 | 56.32 | 49.15 | 68.88 | 60.79 | 50.04 | 55.03 | 57.66 | 87.73 | 67.89 | 38.33 | 45.63 | 39.54 | 258.77 | 233.13 | 137.91 | 43.87 | 57.52 |
| δEu (3) | 0.30 | 0.29 | 0.31 | 0.33 | 0.31 | 0.26 | 0.28 | 0.28 | 0.36 | 0.31 | 0.29 | 0.35 | 0.36 | 0.31 | 0.28 | 0.31 | 0.32 | 0.27 | 0.28 | 0.33 |
| ΔFMQ (4) | −2.98 | −3.04 | −3.03 | −3.10 | −3.06 | −2.87 | −3.02 | −3.10 | −3.08 | −3.05 | −3.06 | −3.08 | −3.17 | −3.05 | −3.12 | −3.08 | −3.09 | −3.16 | −3.12 | −3.10 |
| logfO2 (5) | −19.39 | −19.32 | −19.32 | −19.35 | −19.37 | −19.63 | −19.34 | −19.17 | −19.33 | −19.23 | −19.26 | −19.31 | −19.25 | −19.26 | −19.22 | −19.24 | −19.23 | −19.22 | −19.28 | −19.25 |
| T (°C) (6) | 728 | 734 | 733 | 735 | 732 | 714 | 732 | 742 | 735 | 738 | 737 | 735 | 742 | 736 | 741 | 738 | 739 | 743 | 738 | 739 |
References
- Wu, Y.; Zheng, Y. Genesis of zircon and its constraints on interpretation of U–Pb age. Chin. Sci. Bull. 2004, 49, 1554–1569. [Google Scholar] [CrossRef]
- Hu, Z.; Li, X.H.; Luo, T.; Zhang, W.; Crowley, J.; Li, Q.; Ling, X.; Yang, C.; Li, Y.; Feng, L.; et al. Tanz zircon megacrysts: A new zircon reference material for the microbeam determination of U–Pb ages and Zr–O isotopes. J. Anal. At. Spectrom. 2021, 36, 2715–2734. [Google Scholar] [CrossRef]
- Chen, T.; Ai, H.; Yang, M.; Zheng, S.; Liu, Y. Brownish Red Zircon from Muling, China. Gems Gemol. 2011, 47, 36–41. [Google Scholar] [CrossRef]
- Xu, B.; Hou, Z.Q.; Griffin, W.L.; Zheng, Y.C.; Wang, T.; Guo, Z.; Hou, J.; Santosh, M.; O’Reilly, S.Y. Cenozoic lithospheric architecture and metallogenesis in Southeastern Tibet. Earth-Sci. Rev. 2021, 214, 103472. [Google Scholar] [CrossRef]
- Xu, B.; Hou, Z.Q.; Griffin, W.L.; Lu, Y.; Belousova, E.; Xu, J.F.; O’Reilly, S.Y. Recycled volatiles determine fertility of porphyry deposits in collisional settings. Am. Mineral. 2021, 106, 656–661. [Google Scholar] [CrossRef]
- Finch, R.J.; Hanchar, J.M. Structure and chemistry of zircon and zircon-group minerals. Rev. Mineral. Geochem. 2003, 53, 1–25. [Google Scholar] [CrossRef]
- Robinson, K.; Gibbs, G.V.; Ribbe, P.H. The structure of zircon: A comparison with garnet. Am. Mineral. J. Earth Planet. Mater. 1971, 56, 782–790. [Google Scholar]
- Xu, B.; Hou, Z.Q.; Griffin, W.L.; O’Reilly, S.Y. Apatite halogens and Sr–O and zircon Hf–O isotopes: Recycled volatiles in Jurassic porphyry ore systems in southern Tibet. Chem. Geol. 2022, 605, 120924. [Google Scholar] [CrossRef]
- Xu, B.; Hou, Z.-Q.; Griffin, W.L.; O’Reilly, S.Y.; Zheng, Y.C.; Wang, T.; Xu, J.F. In-situ mineralogical interpretation of the mantle geophysical signature of the Gangdese Cu-porphyry mineral system. Gondwana Res. 2022, 111, 53–63. [Google Scholar] [CrossRef]
- Sláma, J.; Košler, J.; Condon, D.J.; Crowley, J.L.; Gerdes, A.; Hanchar, J.M.; Horstwood, M.S.; Morris, G.A.; Nasdala, L.; Norberg, N.; et al. Plešovice zircon—A new natural reference material for U–Pb and Hf isotopic microanalysis. Chem. Geol. 2008, 249, 1–35. [Google Scholar] [CrossRef]
- Wiedenbeck, M.; Hanchar, J.M.; Peck, W.H.; Sylvester, P.; Valley, J.; Whitehouse, M.; Kronz, A.; Morishita, Y.; Nasdala, L.; Fiebig, J.; et al. Further characterisation of the 91500 zircon crystal. Geostand. Geoanal. Res. 2004, 28, 9–39. [Google Scholar] [CrossRef]
- Nasdala, L.; Hofmeister, W.; Norberg, N.; Martinson, J.M.; Corfu, F.; Dörr, W.; Kamo, S.L.; Kennedy, A.K.; Kronz, A.; Reiners, P.W.; et al. Zircon M257—A homogeneous natural reference material for the ion microprobe U–Pb analysis of zircon. Geostand. Geoanal. Res. 2008, 32, 247–265. [Google Scholar] [CrossRef]
- Elhlou, S.; Belousova, E.; Griffin, W.L.; Pearson, N.J.; O’Reilly, S.Y. Trace element and isotopic composition of GJ-red zircon standard by laser ablation. Geochim. Et Cosmochim. Acta 2006, 70, 158. [Google Scholar] [CrossRef]
- Black, L.P.; Kamo, S.L.; Allen, C.M.; Davis, D.W.; Aleinikoff, J.N.; Valley, J.W.; Mundil, R.; Campbell, I.P.; Korsch, R.J.; Williams, I.S.; et al. Improved 206Pb/238U microprobe geochronology by the monitoring of a trace-element-related matrix effect; SHRIMP, ID-TIMS, ELA-ICP-MS and oxygen isotope documentation for a series of zircon standards. Chem. Geol. 2004, 205, 115–140. [Google Scholar] [CrossRef]
- Frei, D.; Gerdes, A. Precise and accurate in situ U–Pb dating of zircon with high sample throughput by automated LA-SF-ICP-MS. Chem. Geol. 2009, 261, 261–270. [Google Scholar] [CrossRef]
- Vermeesch, P. IsoplotR: A free and open toolbox for geochronology. Geosci. Front. 2018, 9, 1479–1493. [Google Scholar] [CrossRef]
- Nasdala, L.; Zhang, M.; Kempe, U.; Panczer, G.; Gaft, M.; Andrut, M.; Plotze, M. Spectroscopic methods applied to zircon. Rev. Mineral. Geochem. 2003, 53, 427–467. [Google Scholar] [CrossRef]
- Dawson, P.; Hargreave, M.M.; Wilkinson, G.R. The vibrational spectrum of zircon (ZrSiO4). J. Phys. C Solid State Phys. 1971, 4, 240. [Google Scholar] [CrossRef]
- Woodhead, J.A.; Rossman, G.R.; Silver, L.T. The metamictization of zircon: Radiation dose-dependent structural characteristics. Am. Mineral. 1991, 76, 74–82. [Google Scholar]
- Huong, L.T.T.; Vuong, B.S.; Thuyet, N.T.M.; Nguyen, N.K.; Satitkune, S.; Wanthanachaisaeng, B.; Hofmeister, W.; Hager, T.; Hauzenberger, C. Geology, gemmological properties and preliminary heat treatment of gem-quality zircon from the central highlands of Vietnam. J. Gemmol. 2016, 35, 308. [Google Scholar] [CrossRef]
- Deliens, M.; Delhal, J.; Tarte, P. Metamictization and U–Pb systematics—A study by infrared absorption spectrometry of Precambrian zircons. Earth Planet. Sci. Lett. 1977, 33, 331–344. [Google Scholar] [CrossRef]
- Klinger, M.; Kempe, U.; Pöppl, A.; Bottcher, R.; Trinkler, M. Paramagnetic hole centres in natural zircon and zircon colouration. Eur. J. Mineral. 2012, 24, 1005–1016. [Google Scholar] [CrossRef]
- Kempe, U.; Trinkler, M.; Poppl, A.; Himcinschi, C. Coloration of natural zircon. Can. Mineral. 2016, 54, 635–660. [Google Scholar] [CrossRef]
- Cao, J.; Wen, G.; Ma, Z.; Yi, W.; Wang, F. Chemical composition and some spectroscopic characteristics of gem-quality zircon. Acta Mineral. Sin. 1988, 8, 111–118. [Google Scholar]
- Syme, R.W.G.; Lockwood, D.J.; Kerr, H.J. Raman spectrum of synthetic zircon (ZrSiO4) and thorite (ThSiO4). J. Phys. C Solid State Phys. 1977, 10, 1335. [Google Scholar] [CrossRef]
- Ai, H.; Zhao, X.; Chen, Q.; Long, Q.; Qin, J. Gemmological and Geochemical Characteristic of Zircon Megacryst Related to Cenozoic Alkaline Basalt from Eastern China. J. Gems Gemol. 2018, 20, 1–13. [Google Scholar]
- Kolesov, B.A.; Geiger, C.A.; Armbruster, T. The dynamic properties of zircon studied by single-crystal X-ray diffraction and Raman spectroscopy. Eur. J. Mineral. 2001, 13, 939–948. [Google Scholar] [CrossRef]
- Nasdala, L.; Irmer, G.; Wolf, D. The degree of metamictization in zircon: A Raman spectroscopic study. Eur. J. Mineral. 1995, 7, 471–478. [Google Scholar] [CrossRef]
- Rubatto, D.; Gebauer, D. Use of cathodoluminescence for U-Pb zircon dating by ion microprobe: Some examples from the Western Alps. In Cathodoluminescence in Geosciences; Springer: Berlin/Heidelberg, Germany, 2000; pp. 373–400. [Google Scholar]
- Zhang, B.L. Systematic Gemmology, 2nd ed.; Geology Press: Beijing, China, 2006; pp. 286–293. [Google Scholar]
- Wang, X.L.; Coble, M.A.; Valley, J.W.; Shu, X.J.; Kitajima, K.; Spicuzza, M.J.; Sun, T. Influence of radiation damage on Late Jurassic zircon from southern China: Evidence from in situ measurements of oxygen isotopes, laser Raman, U–Pb ages, and trace elements. Chem. Geol. 2014, 389, 122–136. [Google Scholar] [CrossRef]
- Nasdala, L.; Corfu, F.; Valley, J.W.; Spicuzza, M.J.; Wu, F.Y.; Li, Q.L.; Yang, Y.H.; Fisher, C.; Munker, C.; Kennedy, A.K.; et al. Zircon M127–A homogeneous reference material for SIMS U–Pb geochronology combined with hafnium, oxygen and, potentially, lithium isotope analysis. Geostand. Geoanal. Res. 2016, 40, 457–475. [Google Scholar] [CrossRef]
- Chang, Z.; Vervoort, J.D.; McClelland, W.C.; Knaack, C. U–Pb dating of zircon by LA-ICP-MS. Geochem. Geophys. Geosyst. 2006, 7, Q05009. [Google Scholar] [CrossRef]
- Kroslakova, I.; Günther, D. Elemental fractionation in laser ablation-inductively coupled plasma-mass spectrometry: Evidence for mass load induced matrix effects in the ICP during ablation of a silicate glass. J. Anal. At. Spectrom. 2007, 22, 51–62. [Google Scholar] [CrossRef]
- Koch, J.; Wälle, M.; Pisonero, J.; Günther, D. Performance characteristics of ultra-violet femtosecond laser ablation inductively coupled plasma mass spectrometry at∼265 and∼200 nm. J. Anal. At. Spectrom. 2006, 21, 932–940. [Google Scholar] [CrossRef]
- Schaltegger, U.; Ovtcharova, M.; Gaynor, S.P.; Schoene, B.; Wotzlaw, J.F.; Davies, J.F.; Farina, F.; Greber, N.D.; Szymanowski, D.; Chelle-Michou, C. Long-term repeatability and interlaboratory reproducibility of high-precision ID-TIMS U–Pb geochronology. J. Anal. At. Spectrom. 2021, 36, 1466–1477. [Google Scholar] [CrossRef]
- Wiedenbeck, M.; Alle, P.; Corfu, F.; Griffin, W.L.; Meier, M.; Oberli, F.; Von Quadt, A.; Roddick, J.C.; Spiegel, W. Three natural zircon standards for U–Th–Pb, Lu–Hf, trace element and REE analyses. Geostand. Newsl. 1995, 19, 1–23. [Google Scholar] [CrossRef]
- Black, L.P.; Kamo, S.L.; Allen, C.M.; Aleinikoff, J.N.; Davis, D.W.; Korsch, R.J.; Foudoulis, C. TEMORA 1: A new zircon standard for Phanerozoic U–Pb geochronology. Chem. Geol. 2003, 200, 155–170. [Google Scholar] [CrossRef]
- Huang, C.; Wang, H.; Yang, J.H.; Ramezani, J.; Yang, C.; Zhang, S.B.; Yang, Y.H.; Xia, X.P.; Feng, L.J.; Lin, J.; et al. SA01—A proposed zircon reference material for microbeam U-Pb age and Hf–O isotopic determination. Geostand. Geoanalytical Res. 2020, 44, 103–123. [Google Scholar] [CrossRef]
- Li, X.H.; Tang, G.Q.; Gong, B.; Yang, Y.H.; Hou, K.J.; Hu, Z.C.; Li, Q.L.; Liu, Y.; Li, W.X. Qinghu zircon: A working reference for microbeam analysis of U–Pb age and Hf and O isotopes. Chin. Sci. Bull. 2013, 58, 4647–4654. [Google Scholar] [CrossRef]
- Maas, R.; Kinny, P.D.; Williams, I.S.; Froude, D.O.; Compston, W. The Earth’s oldest known crust: A geochronological and geochemical study of 3900–4200 Ma old detrital zircons from Mt. Narryer and Jack Hills, Western Australia. Geochim. Et Cosmochim. Acta 1992, 56, 1281–1300. [Google Scholar] [CrossRef]
- Cui, L.; Peng, N.; Liu, Y.; Qiao, D.; Liu, Y. Detrital Zircon Geochronology and Tectonic Evolution Implication of the Middle Jurassic Zhiluo Formation, Southern Ordos Basin, China. Minerals 2023, 13, 45. [Google Scholar] [CrossRef]
- Clifford, T.N.; Barton, E.S.; Stern, R.A.; Duchesne, J.C. U–Pb zircon calendar for Namaquan (Grenville) crustal events in the granulite-facies terrane of the O’okiep copper district of South Africa. J. Petrol. 2004, 45, 669–691. [Google Scholar] [CrossRef]
- Harley, S.L.; Kelly, N.M.; Moller, A. Zircon behaviour and the thermal histories of mountain chains. Elements 2007, 3, 25–30. [Google Scholar] [CrossRef]
- Hinton, R.W.; Upton, B.G. The chemistry of zircon: Variations within and between large crystals from syenite and alkali basalt xenoliths. Geochim. Et Cosmochim. Acta 1991, 55, 3287–3302. [Google Scholar] [CrossRef]
- Ballard, J.R.; Palin, M.J.; Campbell, I.H. Relative oxidation states of magmas inferred from Ce (IV)/Ce (III) in zircon: Application to porphyry copper deposits of northern Chile. Contrib. Mineral. Petrol. 2002, 144, 347–364. [Google Scholar] [CrossRef]
- Guo, J.; O’Reilly, S.Y.; Griffin, W.L. Zircon inclusions in corundum megacrysts: I. Trace element geochemistry and clues to the origin of corundum megacrysts in alkali basalts. Geochim. Et Cosmochim. Acta 1996, 60, 2347–2363. [Google Scholar] [CrossRef]
- Belousova, E.A.; Griffin, W.L.; O’Reilly, S.Y.; Fisher, N.L. Igneous zircon: Trace element composition as an indicator of source rock type. Contrib. Mineral. Petrol. 2002, 143, 602–622. [Google Scholar] [CrossRef]
- Wang, F.; Liu, S.A.; Li, S.; He, Y. Contrasting zircon Hf–O isotopes and trace elements between ore-bearing and ore-barren adakitic rocks in central-eastern China: Implications for genetic relation to Cu–Au mineralization. Lithos 2013, 156, 97–111. [Google Scholar] [CrossRef]
- Trail, D.; Watson, E.B.; Tailby, N.D. The oxidation state of Hadean magmas and implications for early Earth’s atmosphere. Nature 2011, 480, 79–82. [Google Scholar] [CrossRef]
- Dilles, J.H.; Kent, A.J.; Wooden, J.L.; Tosdal, R.M.; Koleszar, A.; Lee, R.G.; Farmer, L.P. Zircon compositional evidence for sulfur-degassing from ore-forming arc magmas. Econ. Geol. 2015, 110, 241–251. [Google Scholar] [CrossRef]
- Claiborne, L.L.; Miller, C.F.; Wooden, J.L. Trace element composition of igneous zircon: A thermal and compositional record of the accumulation and evolution of a large silicic batholith, Spirit Mountain, Nevada. Contrib. Mineral. Petrol. 2010, 160, 511–531. [Google Scholar] [CrossRef]
- Shen, P.; Hattori, K.; Pan, H.; Jackson, S.; Seitmuratova, E. Oxidation condition and metal fertility of granitic magmas: Zircon trace-element data from porphyry Cu deposits in the Central Asian orogenic belt. Econ. Geol. 2015, 110, 1861–1878. [Google Scholar] [CrossRef]
- Loucks, R.R.; Fiorentini, M.L.; Henríquez, G.J. New magmatic oxybarometer using trace elements in zircon. J. Petrol. 2020, 61, egaa034. [Google Scholar] [CrossRef]
- Trail, D.; Watson, E.B.; Tailby, N.D. Ce and Eu anomalies in zircon as proxies for the oxidation state of magmas. Geochim. Et Cosmochim. Acta 2012, 97, 70–87. [Google Scholar] [CrossRef]


| ICP-MS Conditions | Dwell Time | ||
|---|---|---|---|
| RF power | 1350 W | 204(Pb + Hg) | 20 ms |
| Feedback power | <5 W | 206Pb | 20 ms |
| RF matching | 1.37 V | 207Pb | 30 ms |
| Sampling depth | 7.0 mm | 208Pb | 15 ms |
| Plasma gas | 15 L/min | 232Th | 10 ms |
| Auxiliary gas | 1 L/min | 238U | 15 ms |
| Make-up gas (Ar) | 0.8–1 L/min | Other elements | 6 ms |
| Laser Parameters | |||
| Wavelength | 193 nm | ||
| Pulse duration | 5 ns | ||
| Ablation style | Single spot | ||
| Energy density | 4–8 J/cm2 | ||
| Carrier gas (He) | 800–900 mL/min | ||
| Ablation spot size | 35 μm | ||
| Repetition rate | 6–8 Hz | ||
| Reference Material | Average U Concentration (ppm) | Age (Ma, 2s 1) | Reference |
|---|---|---|---|
| 91500 | 80 | 1065.4 ± 0.6 | [11,37] |
| TEMORA-1 | 195 | 416.8 ± 0.2 | [38] |
| SA01 | 161 | 535.1 ± 0.4 | [39] |
| M127 | 896 | 524.4 ± 0.2 | [32] |
| Qinghu | 1042 | 159.5 ± 0.2 | [40] |
| CAM18 | 672 | 571.4 ± 3.0 | This study |
Disclaimer/Publisher’s Note: The statements, opinions and data contained in all publications are solely those of the individual author(s) and contributor(s) and not of MDPI and/or the editor(s). MDPI and/or the editor(s) disclaim responsibility for any injury to people or property resulting from any ideas, methods, instructions or products referred to in the content. |
© 2023 by the authors. Licensee MDPI, Basel, Switzerland. This article is an open access article distributed under the terms and conditions of the Creative Commons Attribution (CC BY) license (https://creativecommons.org/licenses/by/4.0/).
Share and Cite
Li, W.; Xu, B.; Miao, Z.; Zhao, Z.; Liu, H. Exploring the CAM18 Crystal as a Potential Reference Material for U–Pb Analysis of Zircon. Crystals 2023, 13, 1364. https://doi.org/10.3390/cryst13091364
Li W, Xu B, Miao Z, Zhao Z, Liu H. Exploring the CAM18 Crystal as a Potential Reference Material for U–Pb Analysis of Zircon. Crystals. 2023; 13(9):1364. https://doi.org/10.3390/cryst13091364
Chicago/Turabian StyleLi, Wurui, Bo Xu, Zhuang Miao, Zheyi Zhao, and Hangyu Liu. 2023. "Exploring the CAM18 Crystal as a Potential Reference Material for U–Pb Analysis of Zircon" Crystals 13, no. 9: 1364. https://doi.org/10.3390/cryst13091364