Article

Atomic-Level Description of Chemical, Topological, and Surface Morphology Aspects of Oxide Film Grown on Polycrystalline Aluminum during Thermal Oxidation—Reactive Molecular Dynamics Simulations

by
Marcela E. Trybula
1,*,
Arkadiusz Żydek
1,
Pavel A. Korzhvayi
2 and
Joanna Wojewoda-Budka
1
1
Institute of Metallurgy and Materials Science, Polish Academy of Sciences, Reymonta 25, 30-059 Krakow, Poland
2
Department of Materials Science and Engineering, KTH Royal Institute of Technology, S-100 44 Stockholm, Sweden
*
Author to whom correspondence should be addressed.
Crystals 2023, 13(9), 1376; https://doi.org/10.3390/cryst13091376
Submission received: 4 July 2023 / Revised: 3 September 2023 / Accepted: 9 September 2023 / Published: 14 September 2023
(This article belongs to the Section Crystalline Metals and Alloys)

Abstract

:
Oxidation results in the formation of an oxide film whose properties and structure can be tailored by controlling the oxidation conditions. Reactive molecular dynamics simulations were performed to study thermal oxidation of polycrystalline Al substrates as a function of O2 density and temperature. The structural, chemical, and topological aspects of polycrystalline Al (poly-Al) substrates and oxide films formed upon oxidation were studied. The studies were supported by surface topography and morphology analyses before and after oxidation. An analysis of Al–O atomic pair distribution showed the development of long-range order in the oxide films grown upon exposure to low-density (0.005 g/cm3) and high-density (0.05 g/cm3) O2 gas. The long-range order was more apparent for the high-density environment, as the oxide films formed in low-density O2 gas did not fully cover the poly-Al surface. The dominance of over-coordinated polyhedral units in a tightly packed structure was indicative of medium- and long-range atomic order in the oxide films. The two-phase structure of the oxide was found in the films, with a crystalline phase at the metal/oxide interface and an amorphous phase at the oxide/O2 interface. The combination with topological analyses supported the conclusions of the chemical analysis and enabled us to capture an amorphous-to-crystalline phase transformation in the oxide films with increasing oxygen density and temperature. An important effect of Al surface roughness before oxidation on the behavior of the metal/oxide interface and on the oxide film structure was observed.

1. Introduction

The thin oxide film that develops spontaneously on Al surfaces exposed to oxygen-containing environment is known as a native oxide film. Knowledge about the role of defects present in the metal substrate and the oxidation conditions in the oxide film structure is crucial for controlling and designing an oxide coating with the desired properties.
Recent experimental and modeling studies have provided knowledge about low-index Al surfaces in contact with oxygen gas of different densities. Various aspects of thin oxide films grown on Al(111) and Al(100) have been the subject of long debate, including chemical atom environment, structure of oxide film, as well as its growth kinetics [1,2,3]. Although some articles have considered the dependence of oxide film growth on Al surface orientation [1,4,5], film growth on structurally complex materials such as polycrystals is still an open problem. For practical and fundamental reasons, it is important to consider realistic polycrystalline models of Al substrate material to observe the behavior of grain boundaries upon thermal oxidation and their influence on the oxide film development on the metal surface. Most of the modeling and experimental studies in the literature provide descriptions of early and late oxidation stages for Al surfaces [6,7,8,9], Al nanoparticles (ANPs) [10,11], and Al alloys [12,13,14] as a function of temperature and oxygen gas pressure. Interestingly, orientation-dependent structures have also been captured for oxide films formed on low-index Al surfaces resulting from differences in the oxidation mechanism [4,6,15]. In particular, a stress-free oxide film was found to develop on an Al(100) surface, while an intrinsic tensile stress was incorporated into the oxide film during its growth on an Al(111) surface at 300 K [4,16]. Our recent study using molecular dynamics (MD) simulations with a reactive force field (ReaxFF) [7,15] confirmed experimentally observed differences in oxidation mechanisms, which finally led to the formation of amorphous oxide films on two low-indexed Al surfaces. Another study by Hong and van Duin [10] shed some light on “hot spot” region formation on a bare Al surface, representing an easy path of oxygen penetration through the developing oxide film due to its amorphous nature and limited thickness. Both experimental and modeling approaches provided evidence in support of the Cabrera–Mott model exhibiting two-stage oxidation kinetics at a low oxidation temperature [17]. This corresponds to rapid oxide film growth at the first stage, followed by the second, significantly slower, stage resulting from the increased charge separation across the growing oxide layer.
Generally, amorphous thin oxide films form on Al surfaces at low oxidation temperatures. A gradual increase of oxygen content in the amorphous oxide film occurs at an increased oxidation temperature, leading to the formation of pseudo-crystalline γ-Al2O3 [2]. According to literature data, bulk γ-Al2O3 has a highly defective spinel structure that becomes amorphous-like when grown at room temperature. However, it can transform into a pseudo-crystalline structure at a high temperature [16,18]. On the other hand, amorphous oxide films may be represented in terms of a structural unit model as composed of edge- and corner-sharing AlO4, AlO5, and AlO6 polyhedral units, where the Al cations are tetrahedrally, pentahedrally, and octahedrally coordinated by tightly packed oxygen anions. Particular interests was attracted to [AlO5] building blocks, which were found to be responsible for structural disorder in both thin films and bulk amorphous alumina [19]. Their fraction diminished with an increasing annealing time in favor of both AlO4 and AlO6 units [19,20,21]. The latter two are the most frequent building blocks found in crystalline alumina. Quite interestingly, recent experimental studies on amorphous oxide films grown on Al surfaces have shed light on their structural resemblance to bulk γ-Al2O3 [15]. Consequently, a low content of AlO5 and AlO3 units in favor of an increase in AlO4 and AlO6 structural motifs was measured [15]. NMR-based data obtained by Lee and Ahn [22] regarding a 2D confined oxide film provided an interesting interpretation of the difference in structure between these ultra-thin films and bulk alumina in terms of the coordination of Al sites governed by the presence of AlO5 structural units. Recent modeling studies have also provided an interesting view on ultra-thin oxide film structure corresponding to the formation of peroxide-like bridging configurations on the top surface or a decrease in the fraction of AlO4 units [7,15]. The O–O bridging configurations might have been responsible for the formation of nanostructures, such as pores, which violate medium-range atomic ordering or suppress amorphous-to-crystalline phase transformation.
The present work aimed to provide an atomic-level picture of oxide film growth on polycrystalline Al substrates in contact with an oxygen gas environment. Based on literature data, there is still very little known about the role of grain orientation in the structure or growth kinetics of such oxide films. Recent investigations have provided data about simple cases such as Al single crystals with various surface orientations. Our modeling studies were motivated by previous HRTEM and XPS investigations finding differences in the microstructural evolution of oxide films grown on Al(100) and Al(111) surfaces. In turn, we provided an atomic-level description of the surface orientation dependence of the growing oxide film structure [7,15]. In this contribution, we considered a structurally complex (polycrystalline) Al substrate.
The purpose of this work was to provide a detailed atomic-level description of the structural, chemical, and topological aspects of oxide films formed on polycrystalline aluminum by performing reactive molecular dynamics simulations. We were particularly interested in describing the development of long-range atomic order in oxide films growing on polycrystalline Al substrate in contact with low- and high-density O2 gas at 300 K and 673 K. First, we focused on the formation of a two-phase oxide film on polycrystalline Al substrates to demonstrate amorphous-to-crystalline phase transformation. Second, we extended our investigation to analyzing (using Voronoi diagrams) and discussing the topology of interatomic bond networks in oxide films formed upon thermal oxidation as well as a poly-Al substrate before and after oxidation. We also conducted a three-dimensional (3D) n-ring analysis and computed bond-angle distributions to probe the structural similarity of the grown oxide films with crystalline, amorphous, or liquid alumina compounds.

2. Materials and Methods

Molecular dynamics simulations based on the reactive force field method (ReaxFF-MD) were performed as implemented in LAMMPS software [23]. ReaxFF is an empirical potential method taking into account the relationships between bond distance and bond order to properly describe bond formation and breakage during reactions taking place on a surface. ReaxFF also accounts for Coulomb and van der Waals interactions to describe non-bonded interactions for each atomic pair. The complete mathematical formalism behind the ReaxFF method has been described in detail by van Duin [24,25]. We used the ReaxFF parametrization developed by Hong and van Duin [10] that is dedicated to the study of the Al/oxide interface. Our present study was an extension of our previous studies to the case of a polycrystalline Al substrate to inspect the importance of grain structure on the structure, kinetics, and interatomic bond topology in both the growing oxide formed and the underlying Al substrate.
ReaxFF-MD simulations of the thermal oxidation of polycrystalline Al substrates were performed for up to 2 ns. A simulation box with dimensions of 100 × 80 × 100 Å3 and randomly oriented grains in polycrystalline Al were prepared using Atomsk software [26]. The polycrystalline Al substrate was composed of 16,529 atoms. The initial structure of the polycrystalline Al metal base composed of 8 randomly oriented grains was equilibrated at 300 K for 0.5 ns before exposure to an oxygen gas environment. It was then heated up to 673 K and thermalized for 1 ns. Additional oxygen-containing boxes with two different oxygen densities of 0.005 g/cm3 and 0.05 g/cm3 were built. They were added along the y direction to one side of the poly-Al surface. Thus, periodic boundary conditions (PBC) were imposed within the xz plane, leaving the y direction free from them. The equations of motion were integrated using the Verlet [27] algorithm with a step of 0.5 fs. A Nose–Hoover thermostat was used to keep the target temperature constant throughout the ReaxFF-MD simulations.
Chemical descriptors of the structure were determined by computing the radial distribution function as implemented in LAMMPS [23]. Then, the bond length and coordination number, CNαβ (R), were determined and compared with available experimental data. The chemical composition of the developed oxide films was also determined. The thickness of the films formed on the poly-Al substrate was calculated using a Python script developed in-house. This program divided the surface using a grid of 3 × 3 Å2. Film thickness was computed for each of the cells in this mesh, and the obtained data were then used to compute the average thickness, as described in our previous paper [28]. The 3D maps of the height profile, representing topography maps, were obtained in a similar way. The 3D space was divided into smaller 3 × 3 Å2 columns, in which the highest and lowest points were determined. A 3D map of the distribution of the highest and lowest positions was then created using ORIGINLAB software [23]. Bond-angle distribution functions were determined for the final structures of the oxide films taken from ReaxFF-MD simulations. The cutoff distance of each respective α–β atomic pair was taken from the radial distribution function for the α–β pairs, gαβ(r). It corresponded to the first minimum of gαβ(r). Then, the average bond angle distribution functions for the α–β–α and β–α–β angles were calculated for 100 different oxide film structures.

Voronoi Analysis

Voronoi analysis (VA) was performed according to the protocols described in our previous papers [29,30,31]. The VA method is based on Voronoi tessellation and provides a detailed picture of the geometrical linkage among neighboring atoms in three-dimensional space. More details about Voronoi tessellation can be found in original works by Stukowski [32,33] and related papers [29,34,35]. The perpendicular bisectors between the central atom and neighboring atoms form a polyhedron, which is known as a Voronoi cell (VC). Each VC is described by a Voronoi index in the form of (n3, n4, n5, n6, n7, n8), where ni corresponds to the number of i-edged faces in the polyhedron. For example, a (0.6.0.8.0.0.) VC index represents a Voronoi cell with 6 four-edged faces and 8 six-edged faces. The family of VC types denoted as (1.x.x.x.x.x.) refers to VC cells containing one three-edged face and non-zero numbers (indicated by x) of remaining faces, including four-, five-, six-, seven-, and eight-edged faces (n4, n5, n6, n7, n8). The Voronoi tessellations in 3D were computed using the Voro++ library [36]. An in-house program was developed for indexing the Voronoi cells and for computing the statistics to choose the most abundant VC types.

3. Results and Discussion

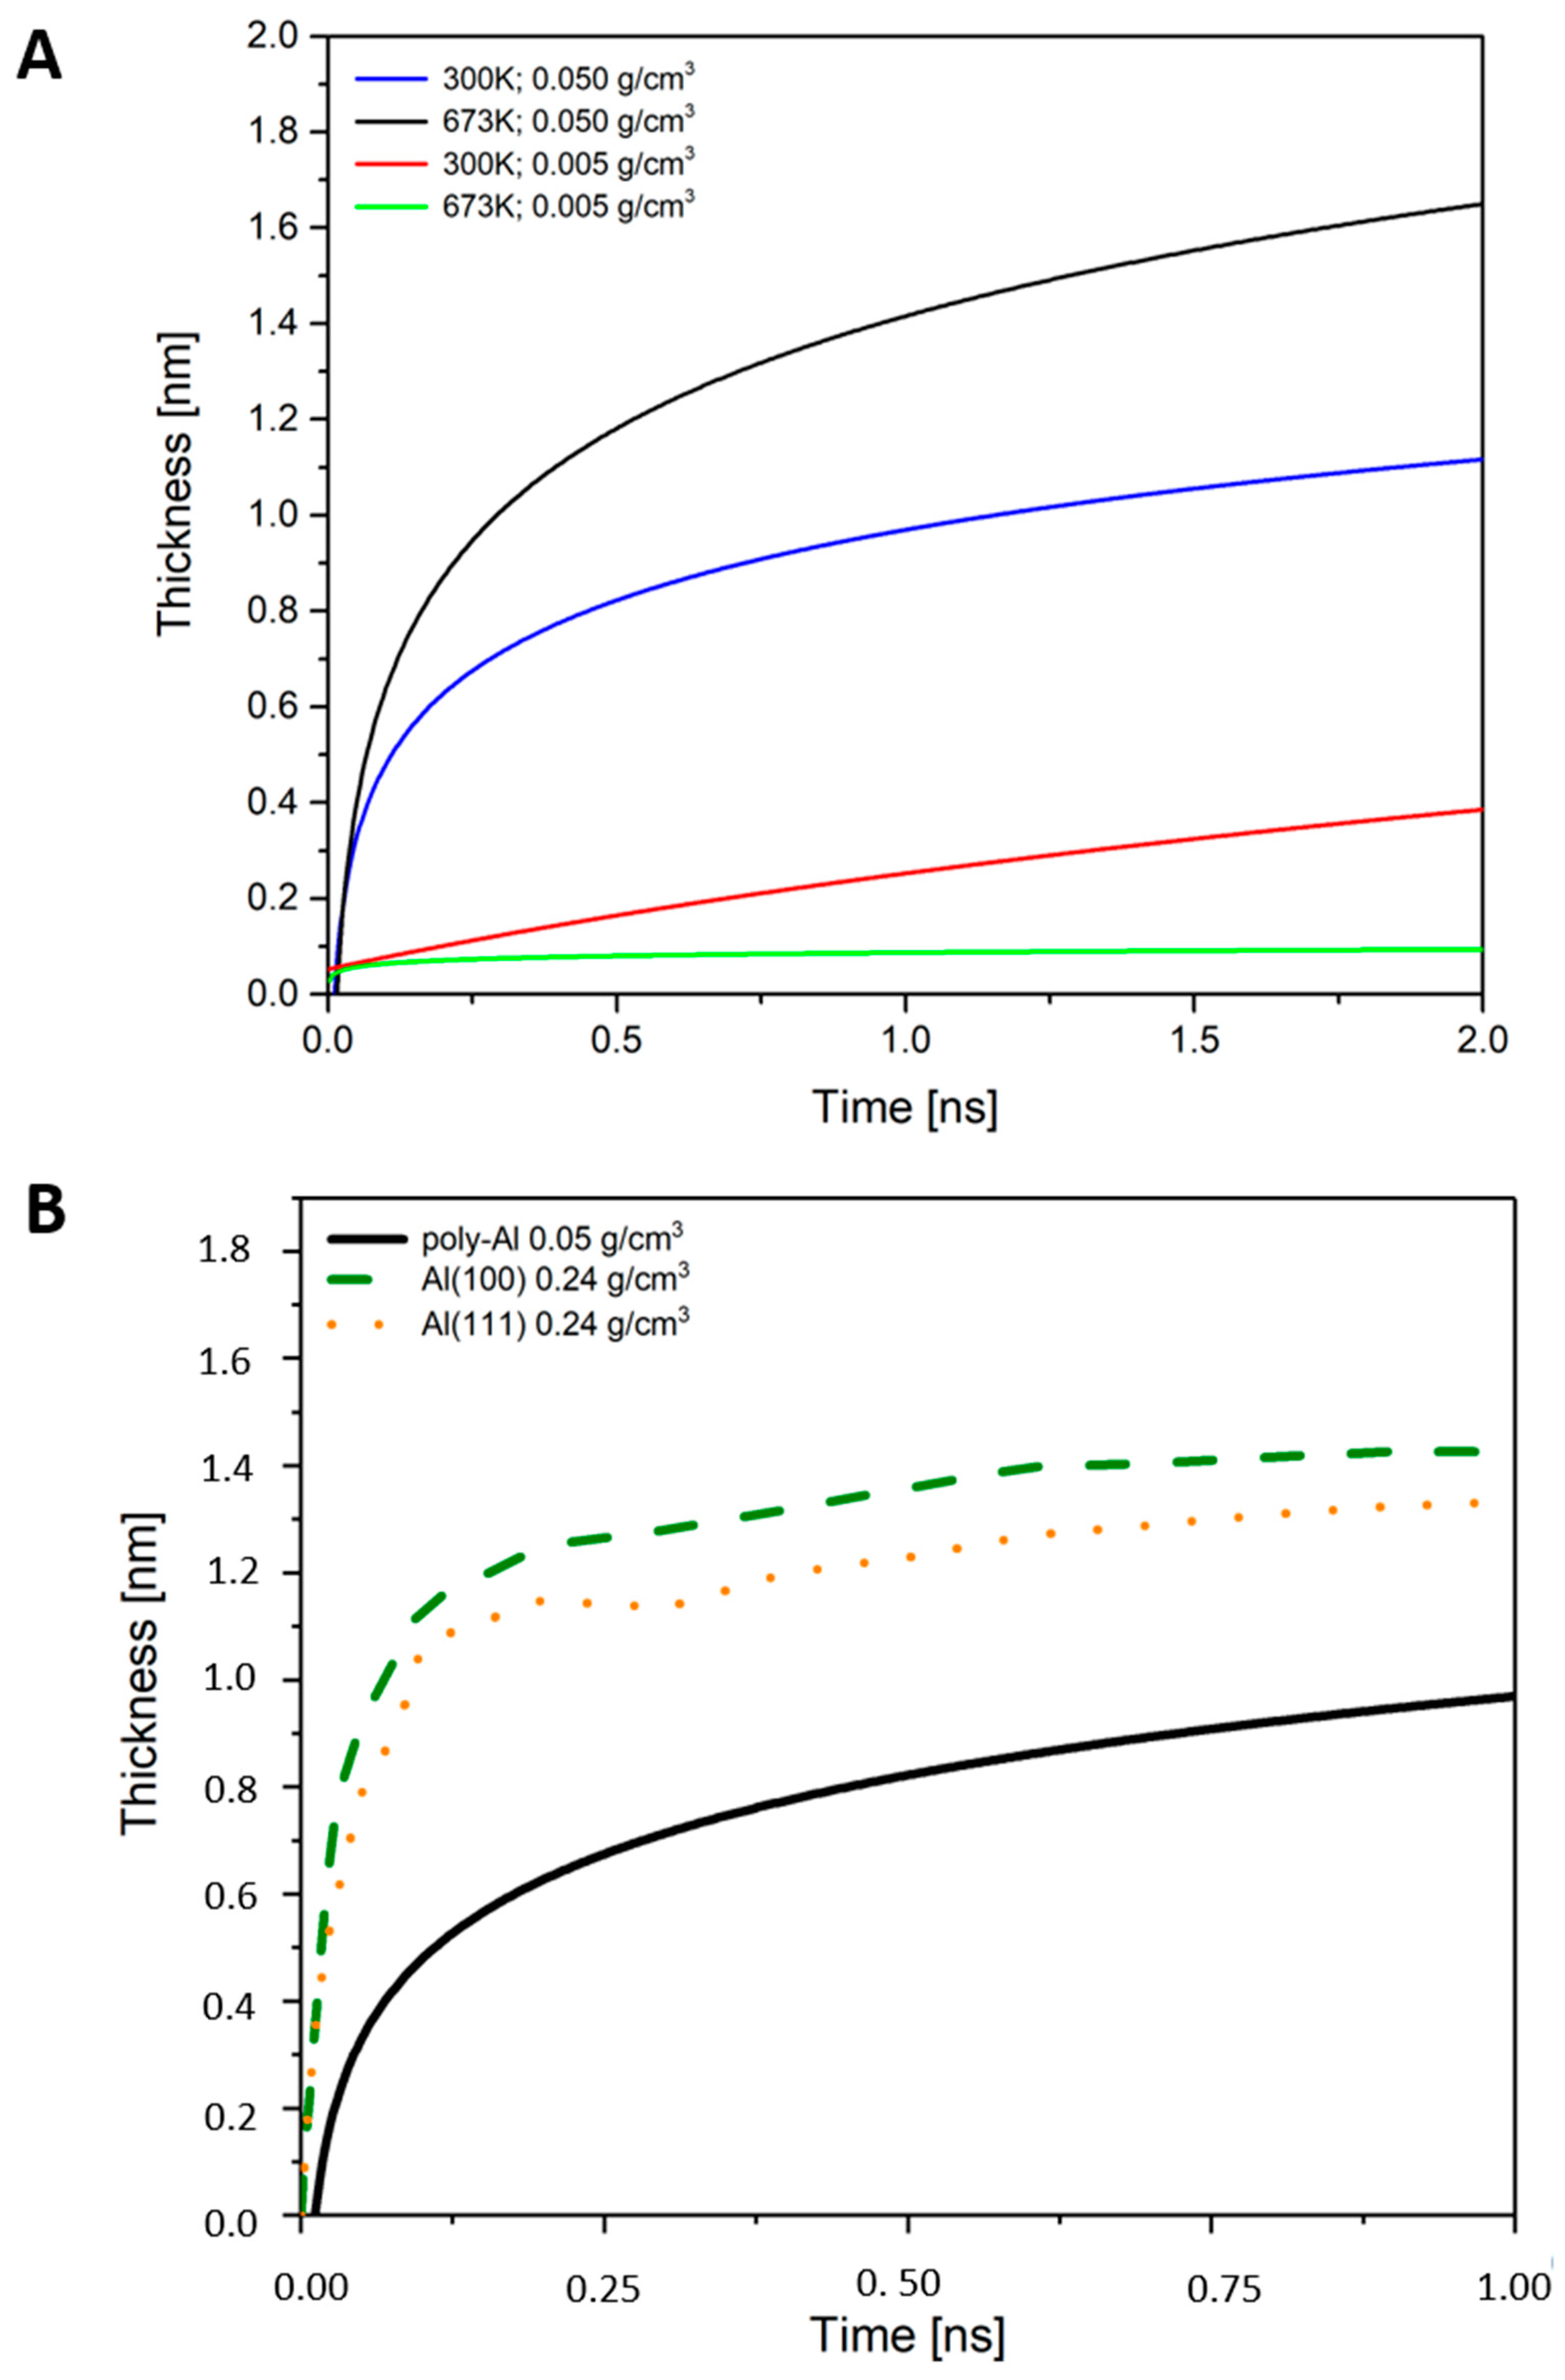
3.1. Thickness of Oxide Films

The thickness change for the oxide films grown on the poly-Al substrate at 300 K and 673 K for low (0.005 g/cm3) and high (0.05 g/cm3) oxygen densities are presented in Figure 1A. It can be easily seen that thicker oxide films were formed when exposed to a high-oxygen-content environment at each considered oxidation temperature as compared to those films formed in a low-oxygen-density environment. The observed thickness changes of the oxide films grown at a high O2 density followed two kinetic regimes, under which rapid oxide film growth was followed by slow oxide film growth at 2 ns, with a film thickness of about 0.9 nm at 300 K and 1.65 nm at 673 K. The kinetic regime differed slightly for oxide films grown at a low oxygen density at 300 K, however. Importantly, the oxidation of the poly-Al substrate at 300 K and 0.005 g/cm3 occurred locally, making it impossible to obtain a continuous oxide film on the poly-Al surface. A similar problem appeared for the oxide film grown at 673 K at a low O2 density. This resulted from the build-up of “free volume” in the oxide film and oxide-free patches on the poly-Al surface after oxidation continued up to 2 ns. Therefore, the temperature behavior of the oxide film growth on the poly-Al substrate was also studied. A comparison of the oxide film thickness obtained at a 0.05 g/cm3 oxygen density and at temperatures ranging between 300 K and 673 K is presented in Figure S1 of the Supporting Information. A non-linear increase in thickness was observed in the interval of oxidation temperature between 300 K and 475 K, which could be indicative of long-range atom development in the oxide film at the metal/oxide interface. A logarithmic equation was used for describing the oxide film thickness as a function of O2 density and oxidation temperature. The equation governing thickness of the oxide films is given in Table S1 of the Supporting Information, together with fitting parameters.
To visualize the role of grain boundaries in the polycrystalline Al substrate, we compare the oxide film thickness between poly-Al substrate and Al single crystal in Figure 1B. The dashed and dotted lines represent thickness curves determined from ReaxFF-MD simulations for the thin oxide films developed on two Al single crystals at 300 K for a 0.24 g/cm3 oxygen density [15]. One can see that a higher oxygen density resulted in more rapid oxide film growth, corresponding to the formation of a thicker film. The thickness ranged between 1.28 Å and 1.4 Å for oxide films formed on the Al(100) and Al(111) single crystals, respectively [15]. For comparison, experimental data for thermally oxidized Al single crystals showed that ultra-thin oxide films developed on Al single crystals exposed to pO2 = 1 × 10⁻⁴ Pa for 6000 s [6]. The thickness of the oxide film depends on the crystallographic orientation of the Al surface and the oxidation temperature. Films grown on Al(100) and Al(111) surfaces reach thicknesses ranging between 0.5 nm and 0.7 nm at oxidation temperatures between 350 K and 600 K [18]. Films grown on the poly-Al surface attained these thicknesses at a five-times higher O2 density, suggesting the role of oxygen density in the acceleration of oxidation. A relatively small effect of grain structure on thickness change was also observed. The exposure of the poly-Al substrate to a 10-times higher O2 density would result in a 4.5 Å thick oxide film at 300 K, which is thicker than the oxide films grown on the Al single crystals. Based on this result, diffusion of ions through the growing oxide film is mainly controlled by the oxygen density (corresponding to the chemical potential gradient), but also by the presence of defects in the metal substrate. Importantly, a recent ES + MD study of Al(100) surface oxidation provided data about electric-field-assisted oxide film growth [37]. Based on this, we concluded that electric field affects the rate of oxide film growth by accelerating the overall kinetics of oxidation reaction and leading to the formation of thicker oxide films. However, a reduction in the oxygen density translates to the better control of the oxidation mechanism of the polycrystalline Al substrate.

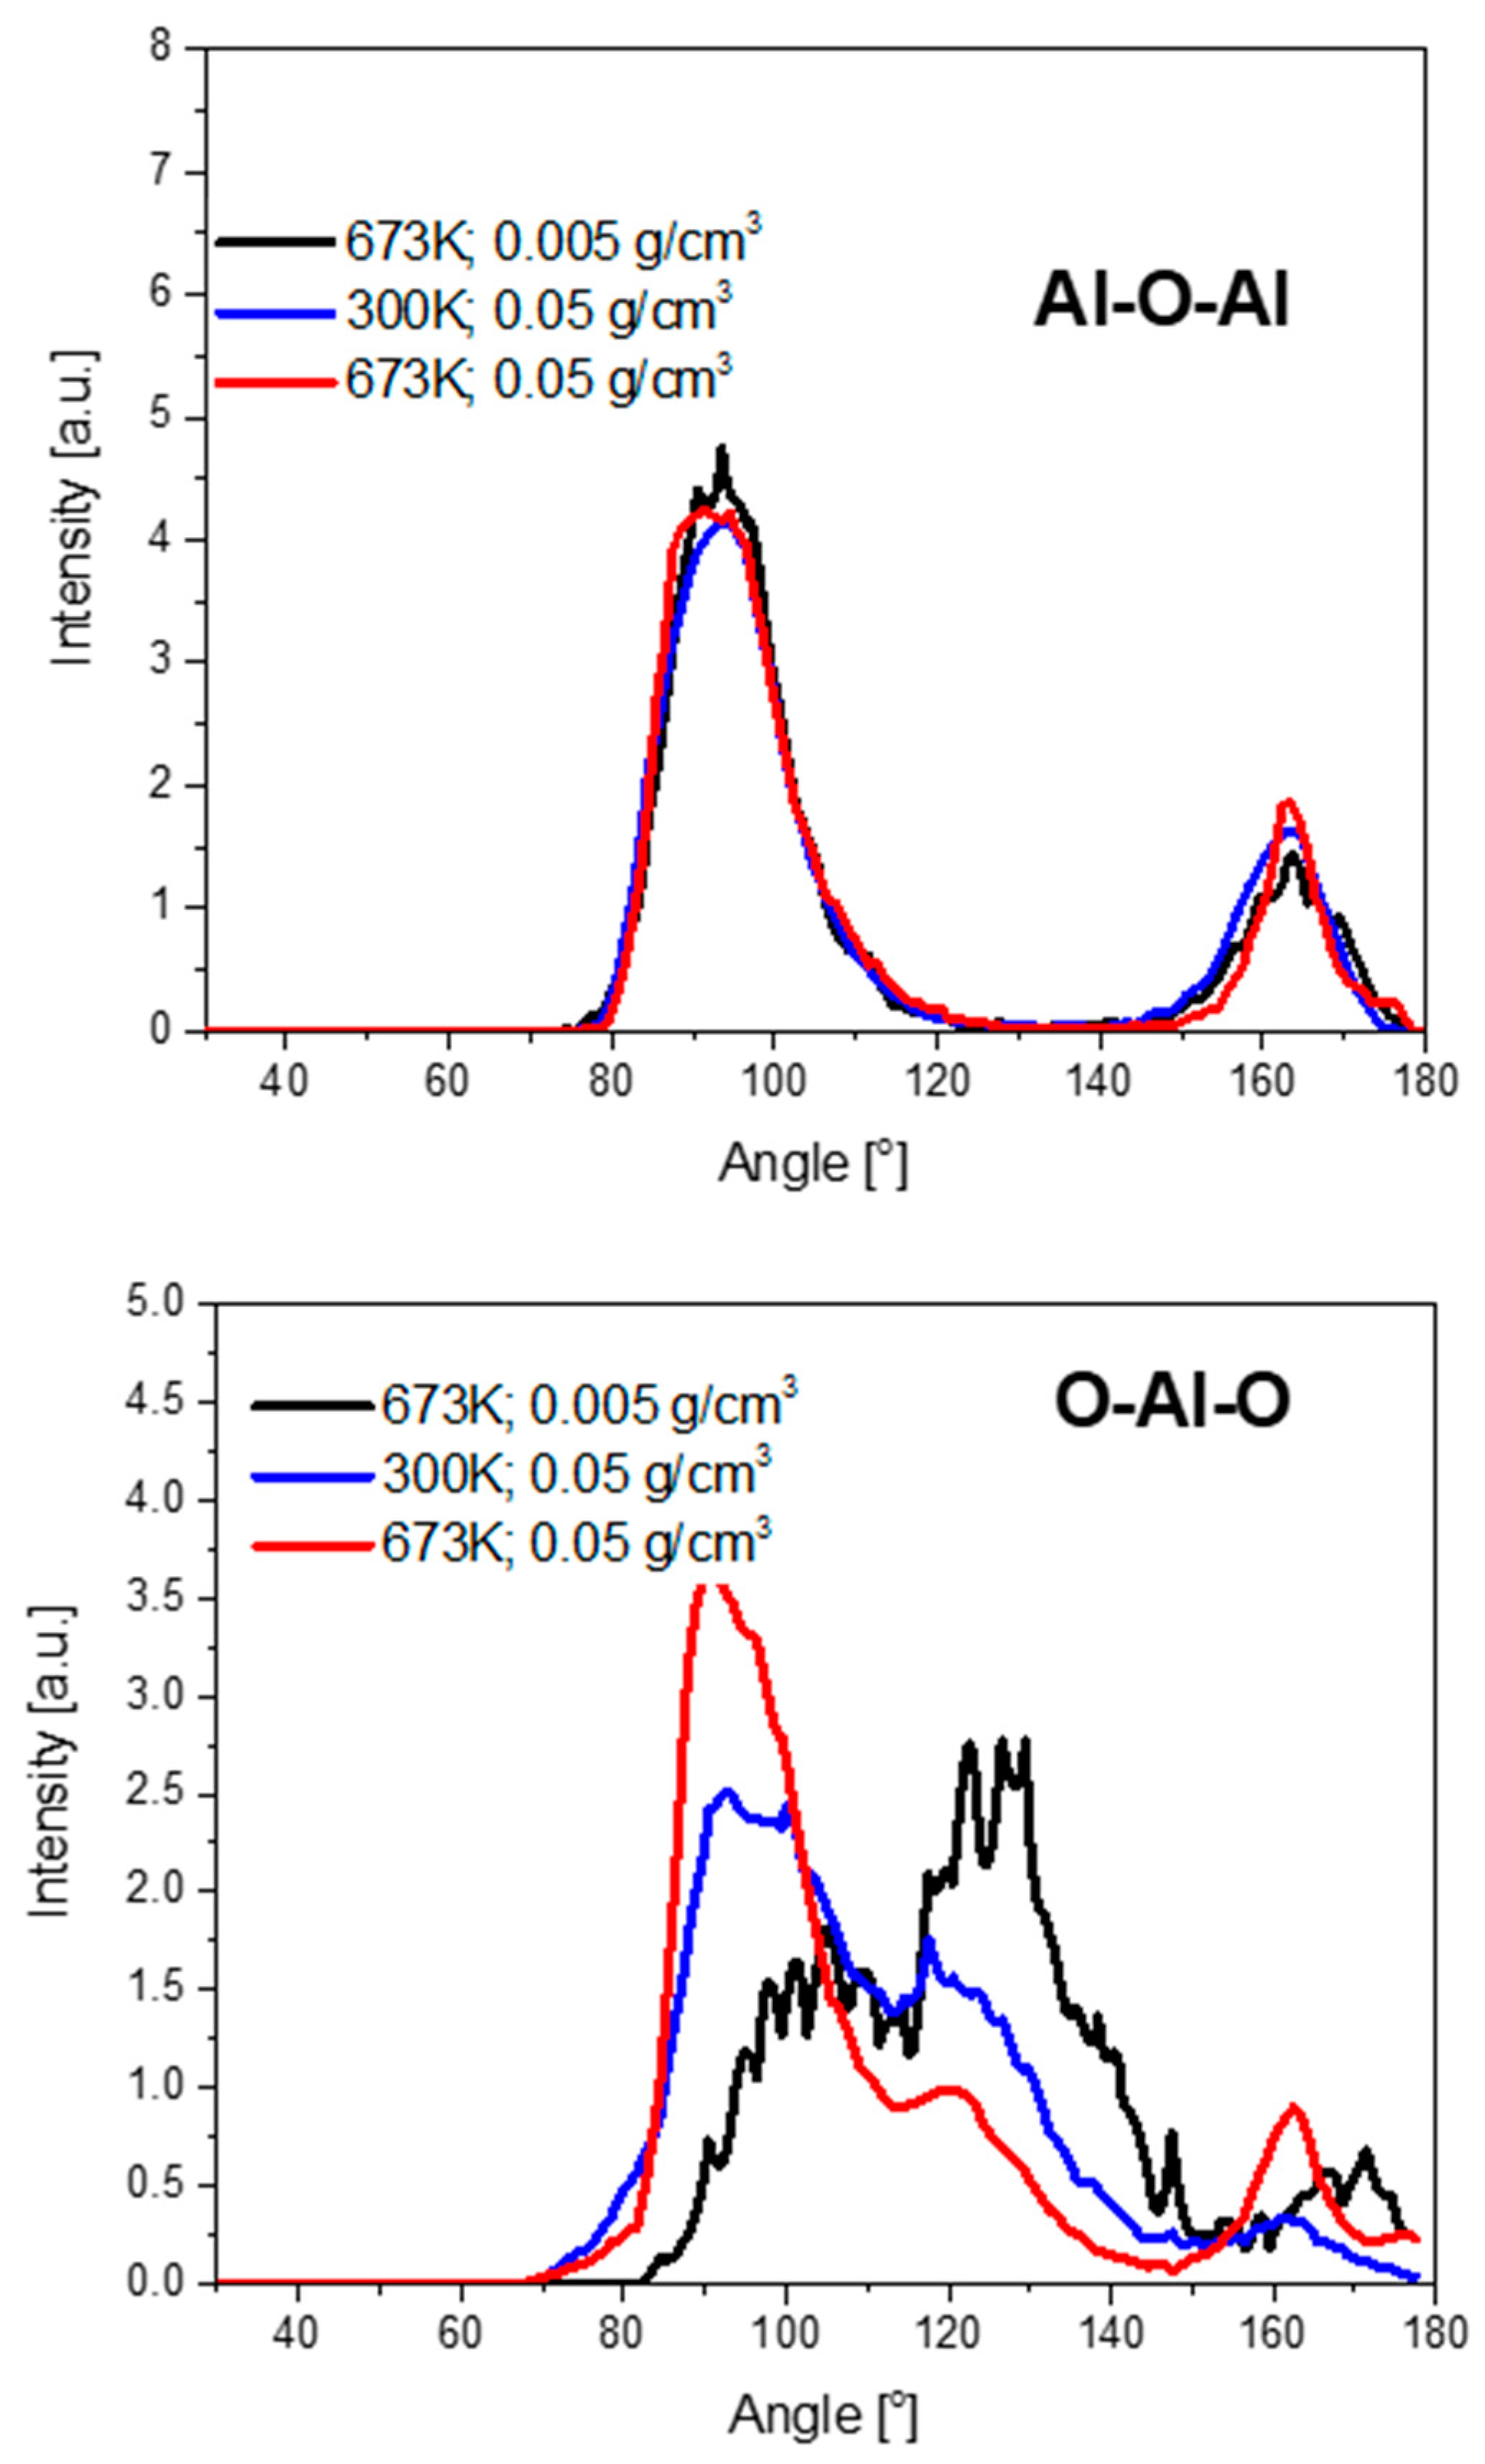
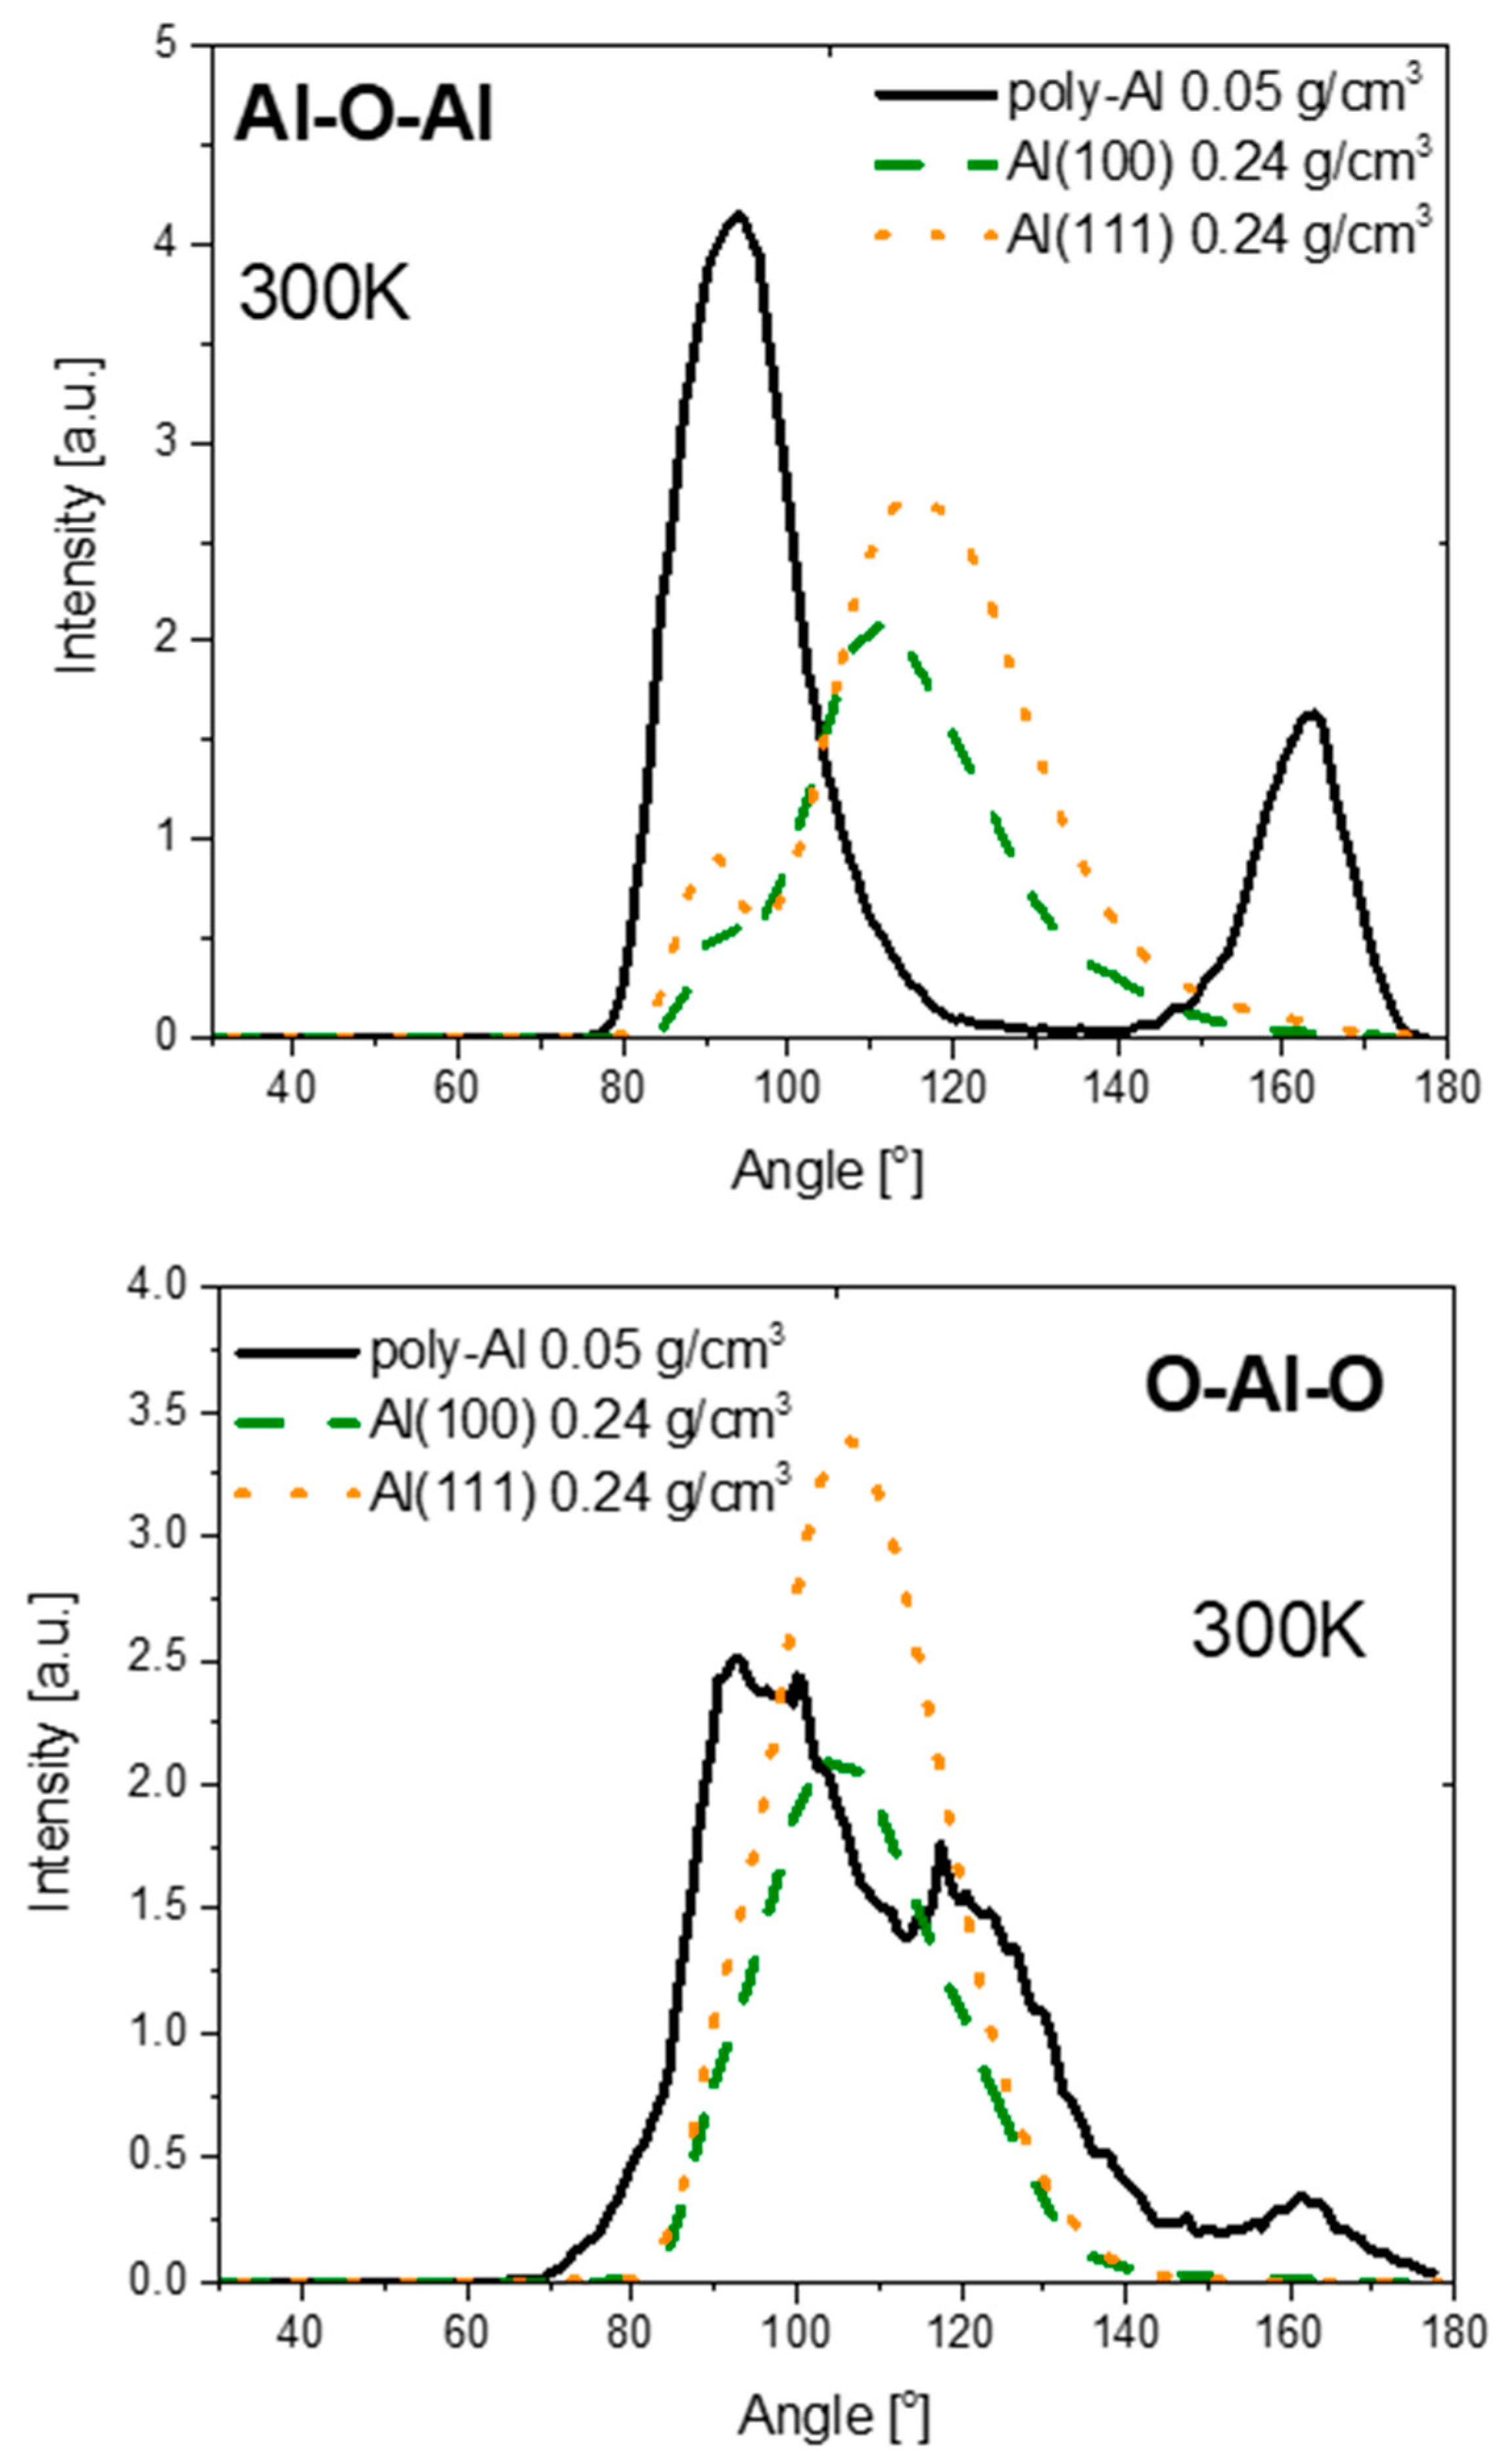
3.2. Structure of Oxide Films

Figure 2 shows the total radial distribution function, g(r), computed for the thicker oxide film grown on the poly-Al substrate at 300 K (black line). For comparison, the g(r) function simulated for oxide films grown on Al(100) and Al(111) single crystals at 300 K and 0.24 g/cm3 (dashed and dotted lines, respectively) is also included [15]. Experimental data for porous anodic oxide film are represented by an asterisk in Figure 2 [38]. The visible peaks represent respective coordination shells, and the most intense peak corresponds to the first neighbor coordination shell, whose position corresponds to the Al–O bond length. The high-intensity first peak is accompanied by lower-intensity peaks located at about 1.5 Å and above 3 Å for oxide films grown on poly-Al. The position of the latter peak corresponds to the O–O bond length. A small mismatch in the intensity of the most pronounced peak was observed between oxide films grown on poly-Al and Al single crystals. This was related to a difference in the structure due to the presence of long-range atomic order in the oxide films developed on the polycrystalline Al substrate at 300 K and an oxygen density of 0.05 g/cm3. The mismatch in the intensity becomes more visible when comparing with the experimental data (asterisk in Figure 1), resulting from the difference in thickness and the presence of pores incorporated into the structure of porous anodic aluminum oxide (PAAO). Despite the abovementioned structural diversity between oxide films, the position of the highest intensity peak for the oxide film grown on the poly-Al substrate was located at about 1.91 Å. This corresponds to a slightly higher Al–O bond distance compared to that for oxide films grown on Al single crystals, about 1.83 Å. Interestingly, the Al–O bond distance for the oxide film grown on the poly-Al substrate almost perfectly matched that of PAA film, which is about 1.93 Å. On the other hand, the nearest-neighbor Al atom environment influences the Al–O bond length and can change it from 1.71 Å to 1.79 Å in non-crystalline alumina compounds, including amorphous and liquid ones. Importantly, higher Al–O bond distances are found in crystalline alumina polymorphs, ranging from 1.941 Å for γ- to 1.97 Å for α-alumina [20]. Therefore, the shift in the Al–O bond length could be an indicative of long-range atomic order in the oxide film grown on poly-Al substrate, which is also confirmed by the presence of strong spatial correlations between Al and O, extending to the third and fourth coordination shells (distances above 4 Å). These correlations may be an indicative of dual phase formation, namely, crystalline at the oxide/substrate interface and amorphous in an oxide/oxygen environment. Due to the relatively low oxidation temperature, 300 K, observations were difficult. A more detailed consideration of the dual-phase structure of the oxide films formed on poly-Al substrate will be performed below.
Figure 3 shows partial radial distribution function for the Al–O atom pair, gAl-O(r), simulated for the oxide films formed at 300 K and 673 K. Figure 3A compares the gAl-O(r) computed for oxide films grown on the poly-Al substrate at 300 K and 673 K with oxygen densities of 0.005 g/cm3 and 0.05 g/cm3. It should be noted, in passing, that the gAl-O(r) simulated for oxide film grown at the lowest oxygen density and temperature (0.005 g/cm3 and 300 K) was not included due to the presence of too much “free volume” in the formed oxide film.
Comparison of partial radial distribution function of Al–O pair for oxide films grown at oxidation temperatures between 300 K and 673 K with an oxygen density of 0.05 g/cm3 is presented in Figure S2 of the Supporting Information. A more apparent long-range atomic order was perceived for the oxide films grown at a higher oxygen density with an oxidation temperature increasing from 300 K to 673 K due to the difference in oxide film thickness discussed above. One can see that the spatial correlations between Al and O at distances above 3 Å became slightly stronger with an increasing temperature for the 0.05 g/cm3 oxygen gas density. This might be indicative of a structural change resulting from the development of long-range atomic order in the oxide film at the metal/oxide interface. On the other hand, a good match in the position of the most pronounced peak was seen for each oxide film formed at the respective temperature, located at about 1.93 Å. For the peaks representing the second and higher coordination shells, both their intensity and positions changed. More apparent changes were observed for oxide films formed at 673 K in low- and high-density O2 gas, which supported the difference in thickness behavior discussed above, illustrating the changes in the Al and O atom environments during the thermal oxidation of poly-Al substrates.
To provide the first evidence for the role of grain boundaries in oxide structure formation, in Figure 3B,C the partial radial distribution functions gAl-O(r) calculated for the oxide films grown on the poly-Al (this work) are compared with those for films grown on Al single crystals (Ref. [15]) at 300 K and 673 K, respectively. This comparison clearly illustrates that the spatial correlations, being present in the oxide films grown on the poly-Al substrate at 300 K and 673 K, extended to medium- and long-range distances. They seemed to be weak for the oxide films grown on Al(100) and Al(111) single crystals due to their amorphous structure, which manifested as a total loss of the long-range atomic order. This also caused a decrease in the intensity of the most pronounced peak and a shorter Al–O bond distance for those oxide films formed at 300 K and 673 K. On the other hand, the observed structural differences signified differences in the oxidation state of the Al atoms corresponding to a transition from the reference metallic Al state to various oxidation states of Al in the formed oxide film layers. Using the nomenclature of oxidation states devised by Hong and van Duin [10] for Al metal substrates, four oxidation states could be found for the oxide films formed on poly-Al substrates at 673 K in low- and high-oxygen-density environments. One fewer oxidation state was present in the oxide film grown at 300 K with a 0.05 g/cm3 O2 density, for which the fraction of super-oxide/peroxide states (containing a peroxide group) dominated over the fractions of oxide or sub-oxide states. Our present findings also confirmed the dominance of the oxide state in thick oxide films, whose fraction decreased for the oxide film grown at 673 K with a 0.05 g/cm3 O2 density. This was related to the gradient of oxygen content between the oxide/metal and oxide/gas interfaces that also influenced the arrangement of AlOx building blocks. Similar observations were noted in our previous studies for oxide films grown on Al single crystals, for which a decrease in the oxygen gradient was observed with a decreasing oxygen gas density at 300 K as well as at the metal/oxide interface [15].
The chemical composition of the oxide films formed on the poly-Al surface is presented in Table 1 as a function of temperature and oxygen density and in Table S2 of the Supporting Information as a function of temperature for a 0.05 g/cm3 O2 density. Oxygen-deficient oxide films formed on the poly-Al substrate for both low and high oxygen densities at various oxidation temperatures. A significantly Al-enriched oxide film developed under a low O2 density at 673 K, which increased to a 45.6 at.% oxygen content in the higher-O2-density environment at 673 K. In turn, an increase of about 12.5 at.% was observed, resulting from the exposure of the poly-Al to an environment with a 10-times higher O2 density. We should mention that the Al content might have been slightly higher for the oxide film developed under a 0.005 g/cm3 O2 density at 673 K due to the existence of oxide-free patches on the surface, posing a problem for Al segregation between the areas belonging to the oxide thin film and those belonging to the Al substrate.

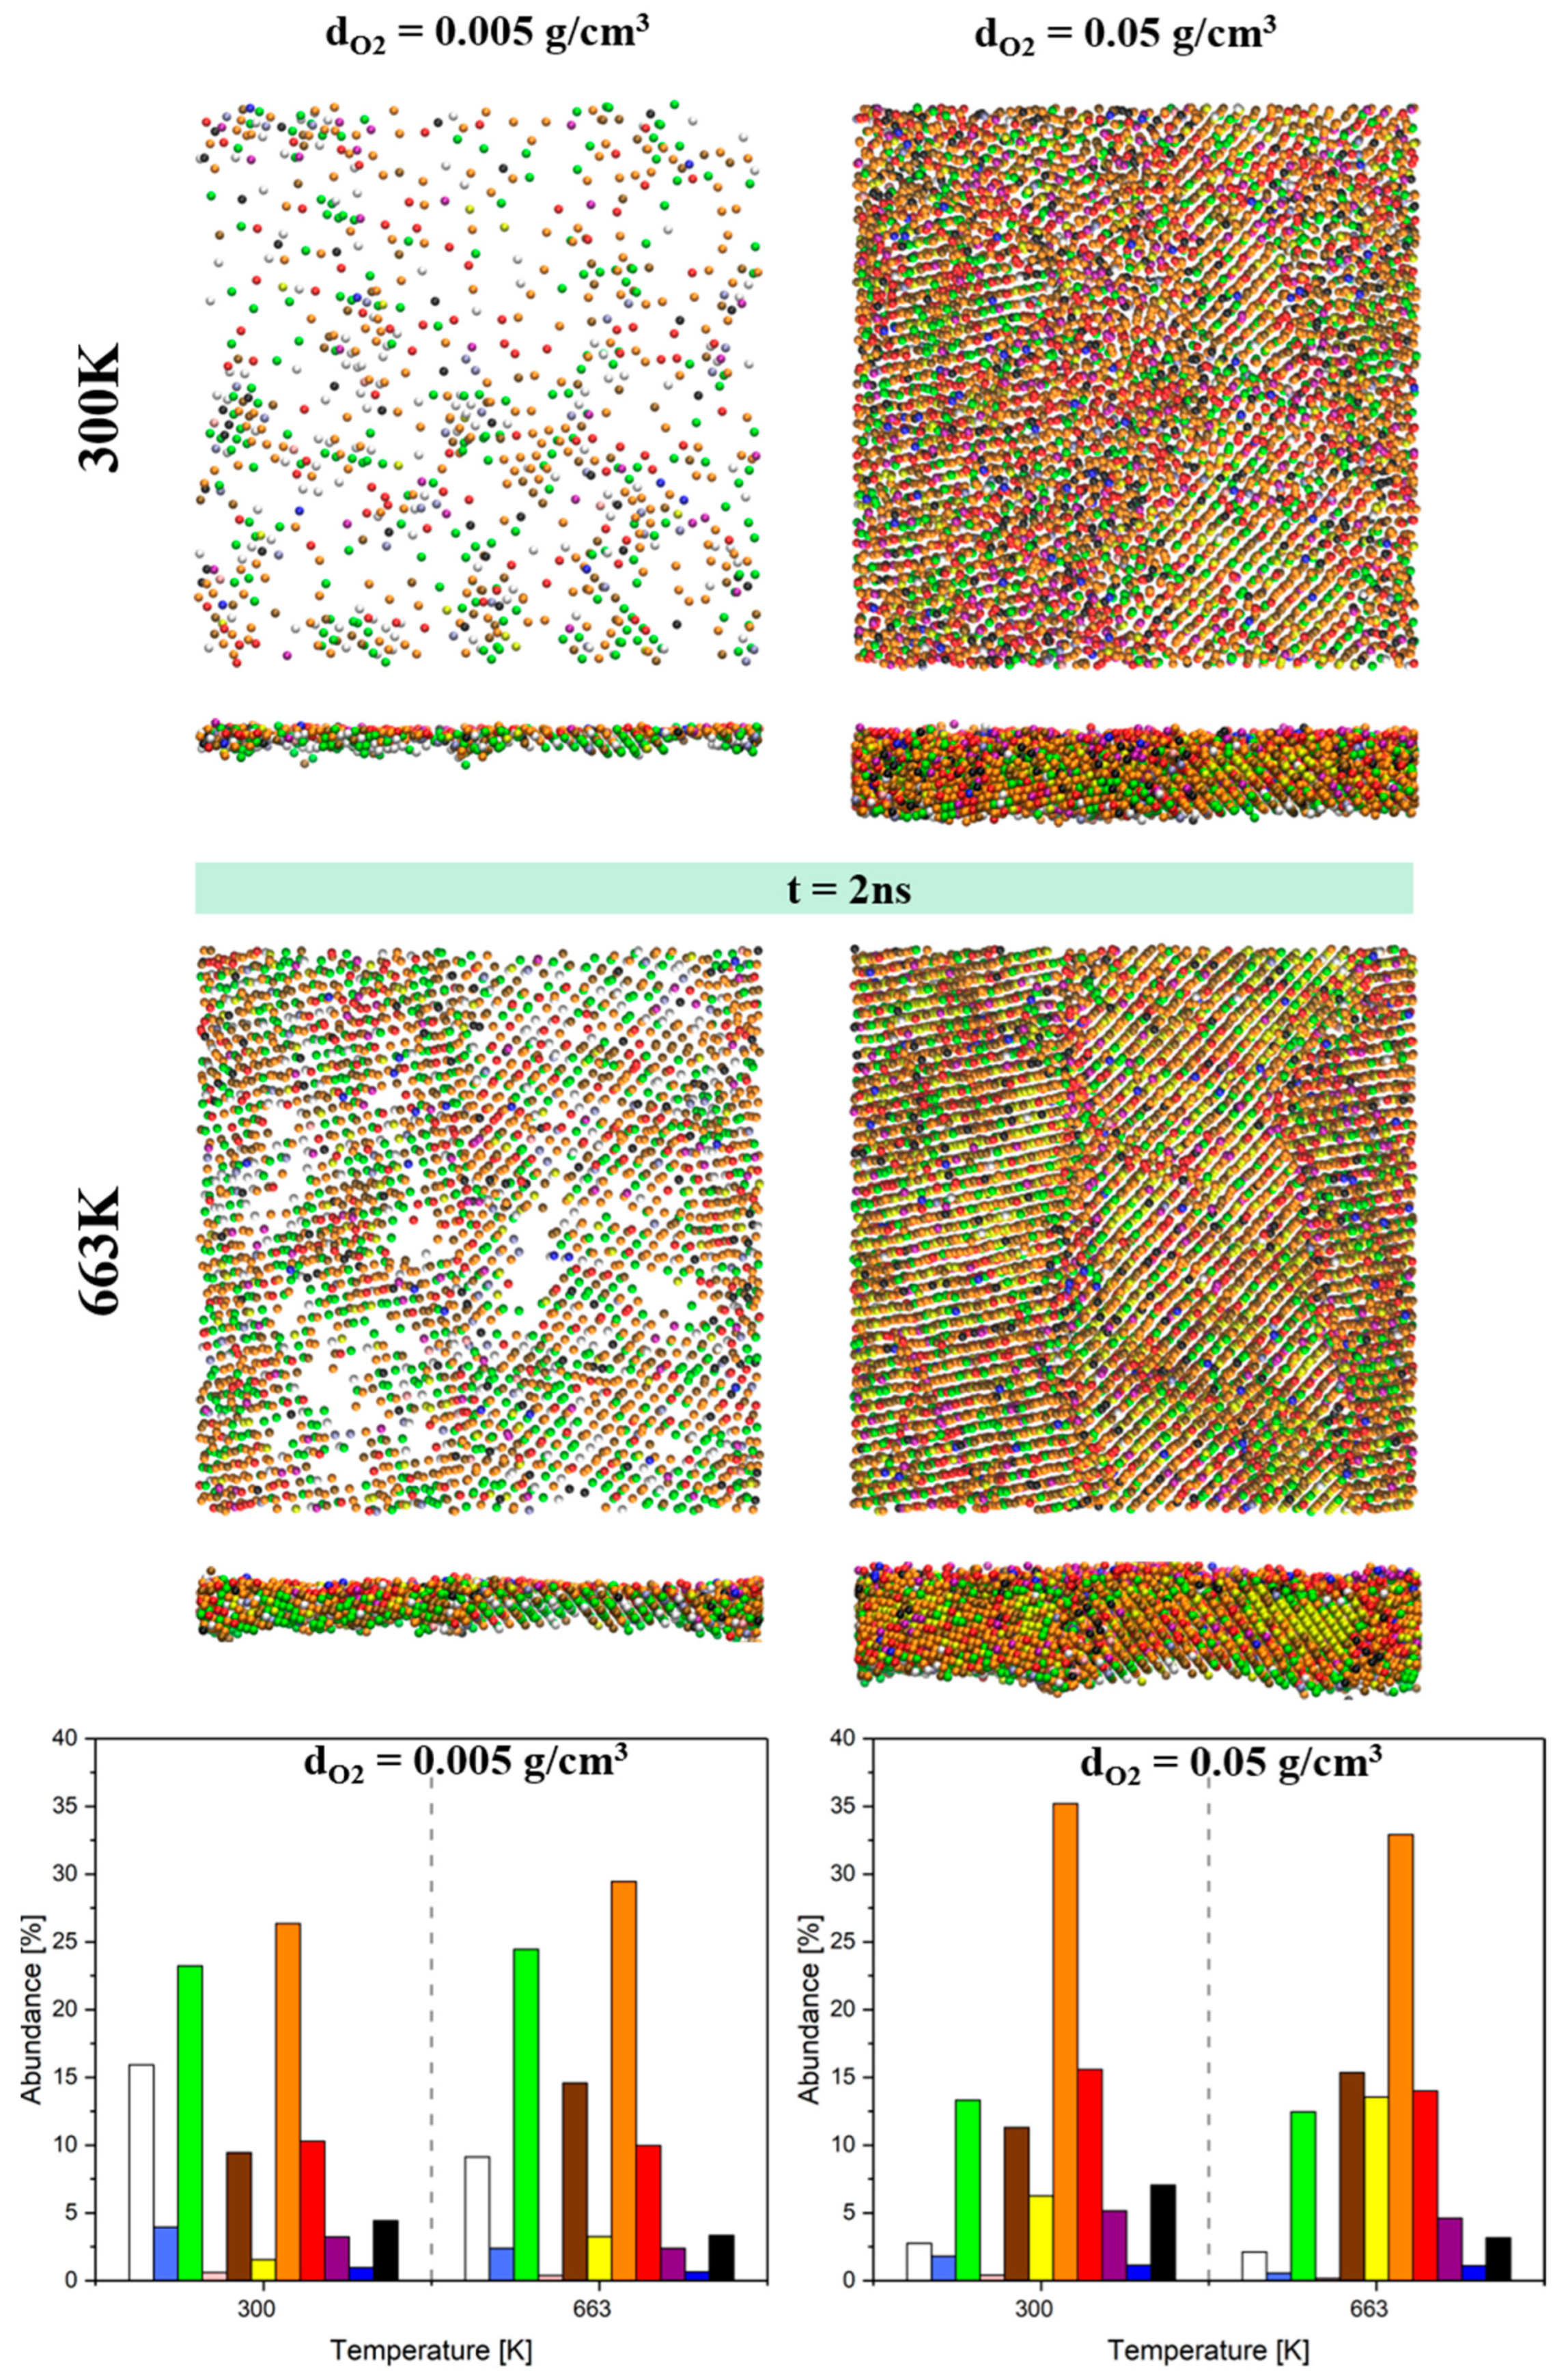
3.3. Topological Aspects of Oxide Films and Al Substrates

3.3.1. Structural Unit Model

The discussion of the topological aspects should start by analyzing the structural unit connectivity in the oxide films grown on poly-Al substrates. The analysis of structural unit network is presented in Figure 4 for the oxide films grown on the poly-Al substrate at 300 K and 673 K with 0.05 and 0.005 g/cm3 O2 densities, and the Al–O–Al (upper panel) and O–Al–O (lower panel) bond-angle distributions are plotted. The structural atom network as a function of the oxidation temperature at a 0.05 g/cm3 O2 density is presented in Figure S3 of the Supporting Information. Two peaks located around 90° and 165° were seen for the Al–O–Al bond angle, while one more peak appeared in the O–Al–O bond-angle distribution. The intensity decreases with an increasing oxidation temperature. The O–Al–O bond distribution for the oxide films grown at the higher oxygen density differs from that for the oxide films grown at the lower oxygen density. Importantly, the broad peak located between 90° and 100° is accompanied by a shoulder at about 120°. For the oxide film grown at the lower oxygen density, the peaks shifted to higher angles, and a shoulder appeared accompanying the second peak located at about 130°. The observed change in bond-angle distribution, in particular for O–Al–O, revealed a difference in local O and Al atom environments influencing topological atom network in the ultra-thin oxide film as well as in the thicker one. Changes in the position and intensity are observed when comparing the O–Al–O bond angle distribution for oxide films grown at varying oxidation temperature and at 0.05 g/cm3 oxygen density. The most intense peak shifts to lower angle values and the second peak is strongly damped for the O–Al–O bond angle at 673 K. The peak located around 160° splits into peaks of different intensity. Hence, the observed behavior of the O–Al–O bond angle can be indicative of a phase transformation leading to the development of long-range atomic order in the oxide film grown on the poly-Al substrate at 673 K and at 0.05 g/cm3 O2 density.
A comparison of the O–Al–O and Al–O–Al bond-angles between oxide films grown on the poly-Al substrate and on Al(100) and Al(111) surfaces [15] at 300 K is presented in Figure 5. It confirms the diversity of the atomic connectivity topology that can be described in terms of AlOx motif. Invoking our recent ReaxFF-MD results, the AlO4 structural motifs were the predominant ones for ultra-thin oxide films, contributing to the structure of oxide films grown on Al single crystals at 300 K. A deeper analysis allowed us to identify the two most common ways of adjoining AlO4 structural units in amorphous covalent oxide systems, namely, corner sharing and edge sharing. In general, a mixed network of AlOx structural motifs was found for ultra-thin oxide films grown on Al single crystals composed of edge-sharing and corner-sharing units. Importantly, the splitting of the mean peak of the Al–O–Al located at about 120° was suggestive of the simultaneous presence of two means of AlO4 unit connectivity. On the other hand, the corner sharing of AlO4 units was the most apparent structural motif of amorphous alumina. It is noteworthy that the dominant of the two distinct means of unit connectivity could change depending on the oxide film thickness. Thus, the 1 Å oxide film was mainly composed of edge-sharing AlOx units whose fraction decreased in favor of corner-sharing units with an increasing thickness of the oxide film. Observations by Gutierrez and coworkers [21] provided important knowledge that allowed us to understand the diversity in the distribution of the two bond-angle types. A small peak located at about 90° for the Al–O–Al bond angle was suggestive of the presence of AlO3 and AlO5 polyhedra. A deeper analysis of the structural unit network for the oxide film grown on the poly-Al substrate confirmed the dominance of AlO3 and AlO5 units represented by a peak of high intensity around 90°, while a less intense peak at around 160° was suggestive of AlO6 motif occurrence. Invoking NMR-based results for γ-Al2O3 formed upon the crystallization of amorphous am-Al2O3, two- and three-coordinated [2,3]O atoms linked to six-coordinated [6]Al atoms formed edge-sharing structural motifs that dominated by a large margin over [3]O atomic species coordinated to [5]Al. Our present ReaxFF-MD results showed the dominance of over-coordinated polyhedral units in tightly compacted oxide films, suggesting the development of atomic order at medium- and long-range distances. On the other hand, we could observe the formation of a two-phase (dual-phase) structure where a pseudo-crystalline phase was present at the metal/oxide interface and an amorphous phase at the oxide/gas interface. To prove the formation of a dual-phase structure, the simulated O–Al–O bond-angle distribution is compared in Table 2 to those of liquid, amorphous, and crystalline alumina compounds. Importantly, multiple peaks appeared in the distribution for γ-alumina, while their number was reduced to four for α-alumina and two for bulk amorphous and liquid alumina. For the present ReaxFF-MD study (blue and red lines in Figure 4), one can see the two most prominent and broad peaks: the first one has the highest intensity and is accompanied by a broad shoulder at higher angles, and the second peak is located above 160°. Based on this, it could be concluded that a phase change might have occurred from a fully amorphous structure to an amorphous-and-crystalline structure in the oxide films grown on poly-Al substrates at the higher oxygen density with an increasing oxidation temperature. A comparison with the data listed in Table 2 suggests the similarity of the oxide film structures obtained in the present ReaxFF-MD study to bulk am-alumina and γ-alumina. The prevalence of five- and six-coordinated Al atoms ([5]Al and [6]Al) was in agreement with experimental findings concerning the importance of [5]Al in the formation of bulk am-alumina.

3.3.2. Ring Structure Distribution

For the second stage of the discussion on the topological atom network, n-ring analysis was performed for the oxide film structures and is graphically presented in Figure 6. This graph shows five different ring types found in the oxide films formed on poly-Al substrates at low and high oxygen densities, represented by differently colored bars. A ring is defined as the shortest closed path consisting of 2n alternating Al–O bonds. Similar trends in n-fold ring distribution were observed for the oxide film structures. Four-fold rings occurred in the majority of the oxide film structures formed at a high oxygen density, at both 300 K and 673 K, but they were of lowest abundancy in the oxide film grown at a low oxygen density and 673 K. Importantly, two-fold, three-fold, and four-fold rings prevailed over high 2n-member rings for the oxide film formed at a high oxygen density and 673 K compared to that formed at 300 K. Consequently, high n-fold rings (5n and 6n) were of greater abundancy, which would suggest the presence of an amorphous phase. The topology of the network of rings for the oxide films formed at a low oxygen density looked quite similar to that observed for the oxide film formed at 300 K. Specifically, five-fold and six-fold rings were of higher abundance compared to two-fold rings. To the best of our knowledge, two-fold and three-fold rings build up the corundum structure, while high n-fold rings appear for defect-containing γ-alumina. A comparison of the n-fold ring distribution for oxide films formed at a 0.05 g/cm3 oxygen density and temperatures in the range of 300 K to 673 K is graphically presented in Figure S4 of the Supporting Information. One can see an increase in the abundance of two-fold, three-fold, and four-fold rings with an increasing oxidation temperature. Quite different distributions appeared for five-fold and six-fold rings, which were the majority for oxide films formed at temperatures between 425 K and 545 K. The changes observed for low-fold rings suggested that a phase transformation took place, leading to pseudo-crystalline oxide film formation at the metal/oxide interface. On the other hand, the structure of the oxide films grown at a high oxygen density was tightly packed due to the prevalence of [5,6]Al coordination sites as compared to the loosely packed structures of the oxide films formed at a low oxygen density. Therefore, the observed difference in the structure of the oxide films grown at low and high oxygen densities reflected the changes in the local chemical environment of Al and O that influenced AlOx unit linkage at medium- and long-range distances.
A comparison of the 2n-member ring distributions is presented in Table 3 for oxide films grown on the poly-Al substrate (at a density dO2 = 0.05 g/cm3 and a temperature of 300 K) and Al single crystals (at dO2 = 0.24 g/cm3 and 300 K) [15], as well as crystalline, amorphous, and liquid alumina compounds [20]. It can easily be noted that the structure of the oxide films grown at a high oxygen density was a mixture of crystalline γ-alumina and amorphous alumina. Although the prevalence of two-fold and three-fold rings would suggest the presence of only a crystalline phase, the relatively low content of high-fold rings (n = 5 and 6) confirmed the presence of structural disorder due to the formation of an amorphous phase at the oxide/oxygen interface.

3.3.3. Voronoi Analysis

For a deeper insight into the atomic network topology, a Voronoi analysis was performed for the poly-Al substrate and oxide films formed thereon at low and high oxygen densities. The distribution of Voronoi cells (VCs) for Al substrates before and after oxidation at the two oxidation temperatures and two oxygen densities studied is presented in Figure 7. At the top of Figure 7, a side view of the poly-Al substrates before and after oxidation is shown. The colors of the atoms correspond to the VC types belonging to particular groups, including perfect lattice, lattice distortions, and crystal defects. We used the categorization of VC indices provided in our recent paper [31]. According to this, the perfect Al lattice sites (yellow bars in Figure 7) form Group 1 (yellow bars), composed of a single VC index (0.6.0.8.0.). The group of lattice distortions is represented by Group V (green bars in the figure), a family of (0.5.2.x.0.0.) VC indices, and Group VI (brown bars in Figure 7), a family of (0.4.4.x.0.0.) VC indices. The VC types representing liquid-like/amorphous aluminas are those belonging to Group II (purple bars), a family of (0.1.10.x.0.0.) VC types; Group III (violet bars), a family of (0.2.8.x.0.0.) VC indices; Group VIII (white bars), a family of (0.3.6.x.0.0.) VC types; and Group IX (pink bars), a family of (0.0.12.x.0.0.) VC indices. Crystal defects are represented by Group IV (red bars), a family of {(1.3.4.x.x.0.), (1.3.5.x.x.0.), and (1.4.3.x.x.0.)} VC types, and Group VII (orange bars), which is a mixture of (1.0.9.x.x.0.) and (1.1.8.x.1.0.) VC types. Black bars represent VC types with an abundance lower than 0.01%. Grains and grain boundaries (GBs) were observed, whose number decreased with an increasing oxidation temperature. Grains evolved with an increasing temperature by changing shape. The content of the VC type representing a perfect f.c.c. lattice (yellow bars) increased for the Al substrate after oxidation at a constant oxygen density (dO2 = 0.005 g/cm3) as temperature was raised to 673 K. This led to a decrease in the representation of the (0.6.0.8.0.) VC index for the oxide films grown in the high-oxygen-density environment. Oxygen gas density had a less substantial impact on the abundance of the VC type family representing lattice distortions, whose content was almost kept constant. A comparison of the Voronoi cell distribution for poly-Al substrates before and after thermal oxidation at varying temperatures is presented in Figure S5 of the Supporting Information. A non-linear change in the VC type representing a perfect Al lattice was observed with an increasing oxidation temperature. The abundance of the (0.6.0.8.0) VC index increased with an increasing oxidation temperature up to 475 K, which was followed by a sharp decrease at 545 K, and the highest abundance was reached at 673 K. Quite similar behavior was observed for the second most abundant group of VC indices, representing lattice distortions. Based on the observations, increased grain ordering, followed by a decrease at an oxidation temperature between 475 K and 545 K, could be indicative of an amorphous-to-crystalline phase transformation.
The distribution of the VC indices and a graph of their abundance in the oxide films grown on the poly-Al surface are presented in Figure 8. The color code of the VC indices for the oxide films is the same as in research concerning the corrosion of oxide-coated Al surfaces [28]. The colors of the bars in Figure 8 correspond to the families of various VC types. White bars are associated with a family of (0.3.6.x.x.x.) VC types; violet bars represent a family of (0.2.8.x.x.x.) VC indices; green bars represent a family of (0.4.x.x.x.) VC types; brown bars represent the (0.5.x.x.x.) family; and yellow bars present a group of {(0.6.x.x.x.) and (0.7.x.x.x.)} VC indices. All families of VC types listed above were found for the poly-Al substrate. The remaining bars in Figure 8 correspond to a non-zero VC index for a three-edged face and are typical of amorphous oxide films. They represent families of VC indices such as (1.x.x.x.x.)—orange bars; (2.x.x.x.x.)—red bars; (3.x.x.x.x.)—purple bars; and (4.x.x.x.x.)—blue bars. Black bars illustrate a group of other VC types with an abundance of less than 0.01%. VC indices with a non-zero number of three-edged faces were found to be the most abundant VC types. The second most abundant VC indices were those representing lattice distortions of Al substrate, (0.4.x.x.x.). Their abundance was of a great significance for the oxide films grown in a low-oxygen-density environment, but it became less dominant for oxide films grown at a high oxygen density. The observed differences in the distribution and abundance of the VC indices resulted from thickness difference of the simulated oxide films. The thicker oxide films formed more compact structures as compared to the thinner films, which had remaining oxide-free patches representing “voids”. The loosely packed structure was most pronounced for the ultra-thin oxide film grown at 300 K. Importantly, thicker oxide films (grown at 0.05 g/cm3) exhibited epitaxial oxide film growth, becoming more apparent for the oxide film grown at 673 K. A predominance of the amorphous phase over the crystalline phase was observed for the thicker oxide film grown at 300 K, for which long-range atom order could not be easily perceived. A comparison of the Voronoi cell distribution for oxide films grown on poly-Al substrates at varying oxidation temperatures and a constant oxygen density (0.05 g/cm3) is illustrated in Figure S6 of the Supporting Information. An increase in oxidation temperature for a constant oxygen density (0.05 g/cm3) led to a more apparent change in structure, resulting in the development of long-range atomic order, which was confirmed by Voronoi analysis. As a consequence, three grains appeared, which were of different crystallographic orientations.

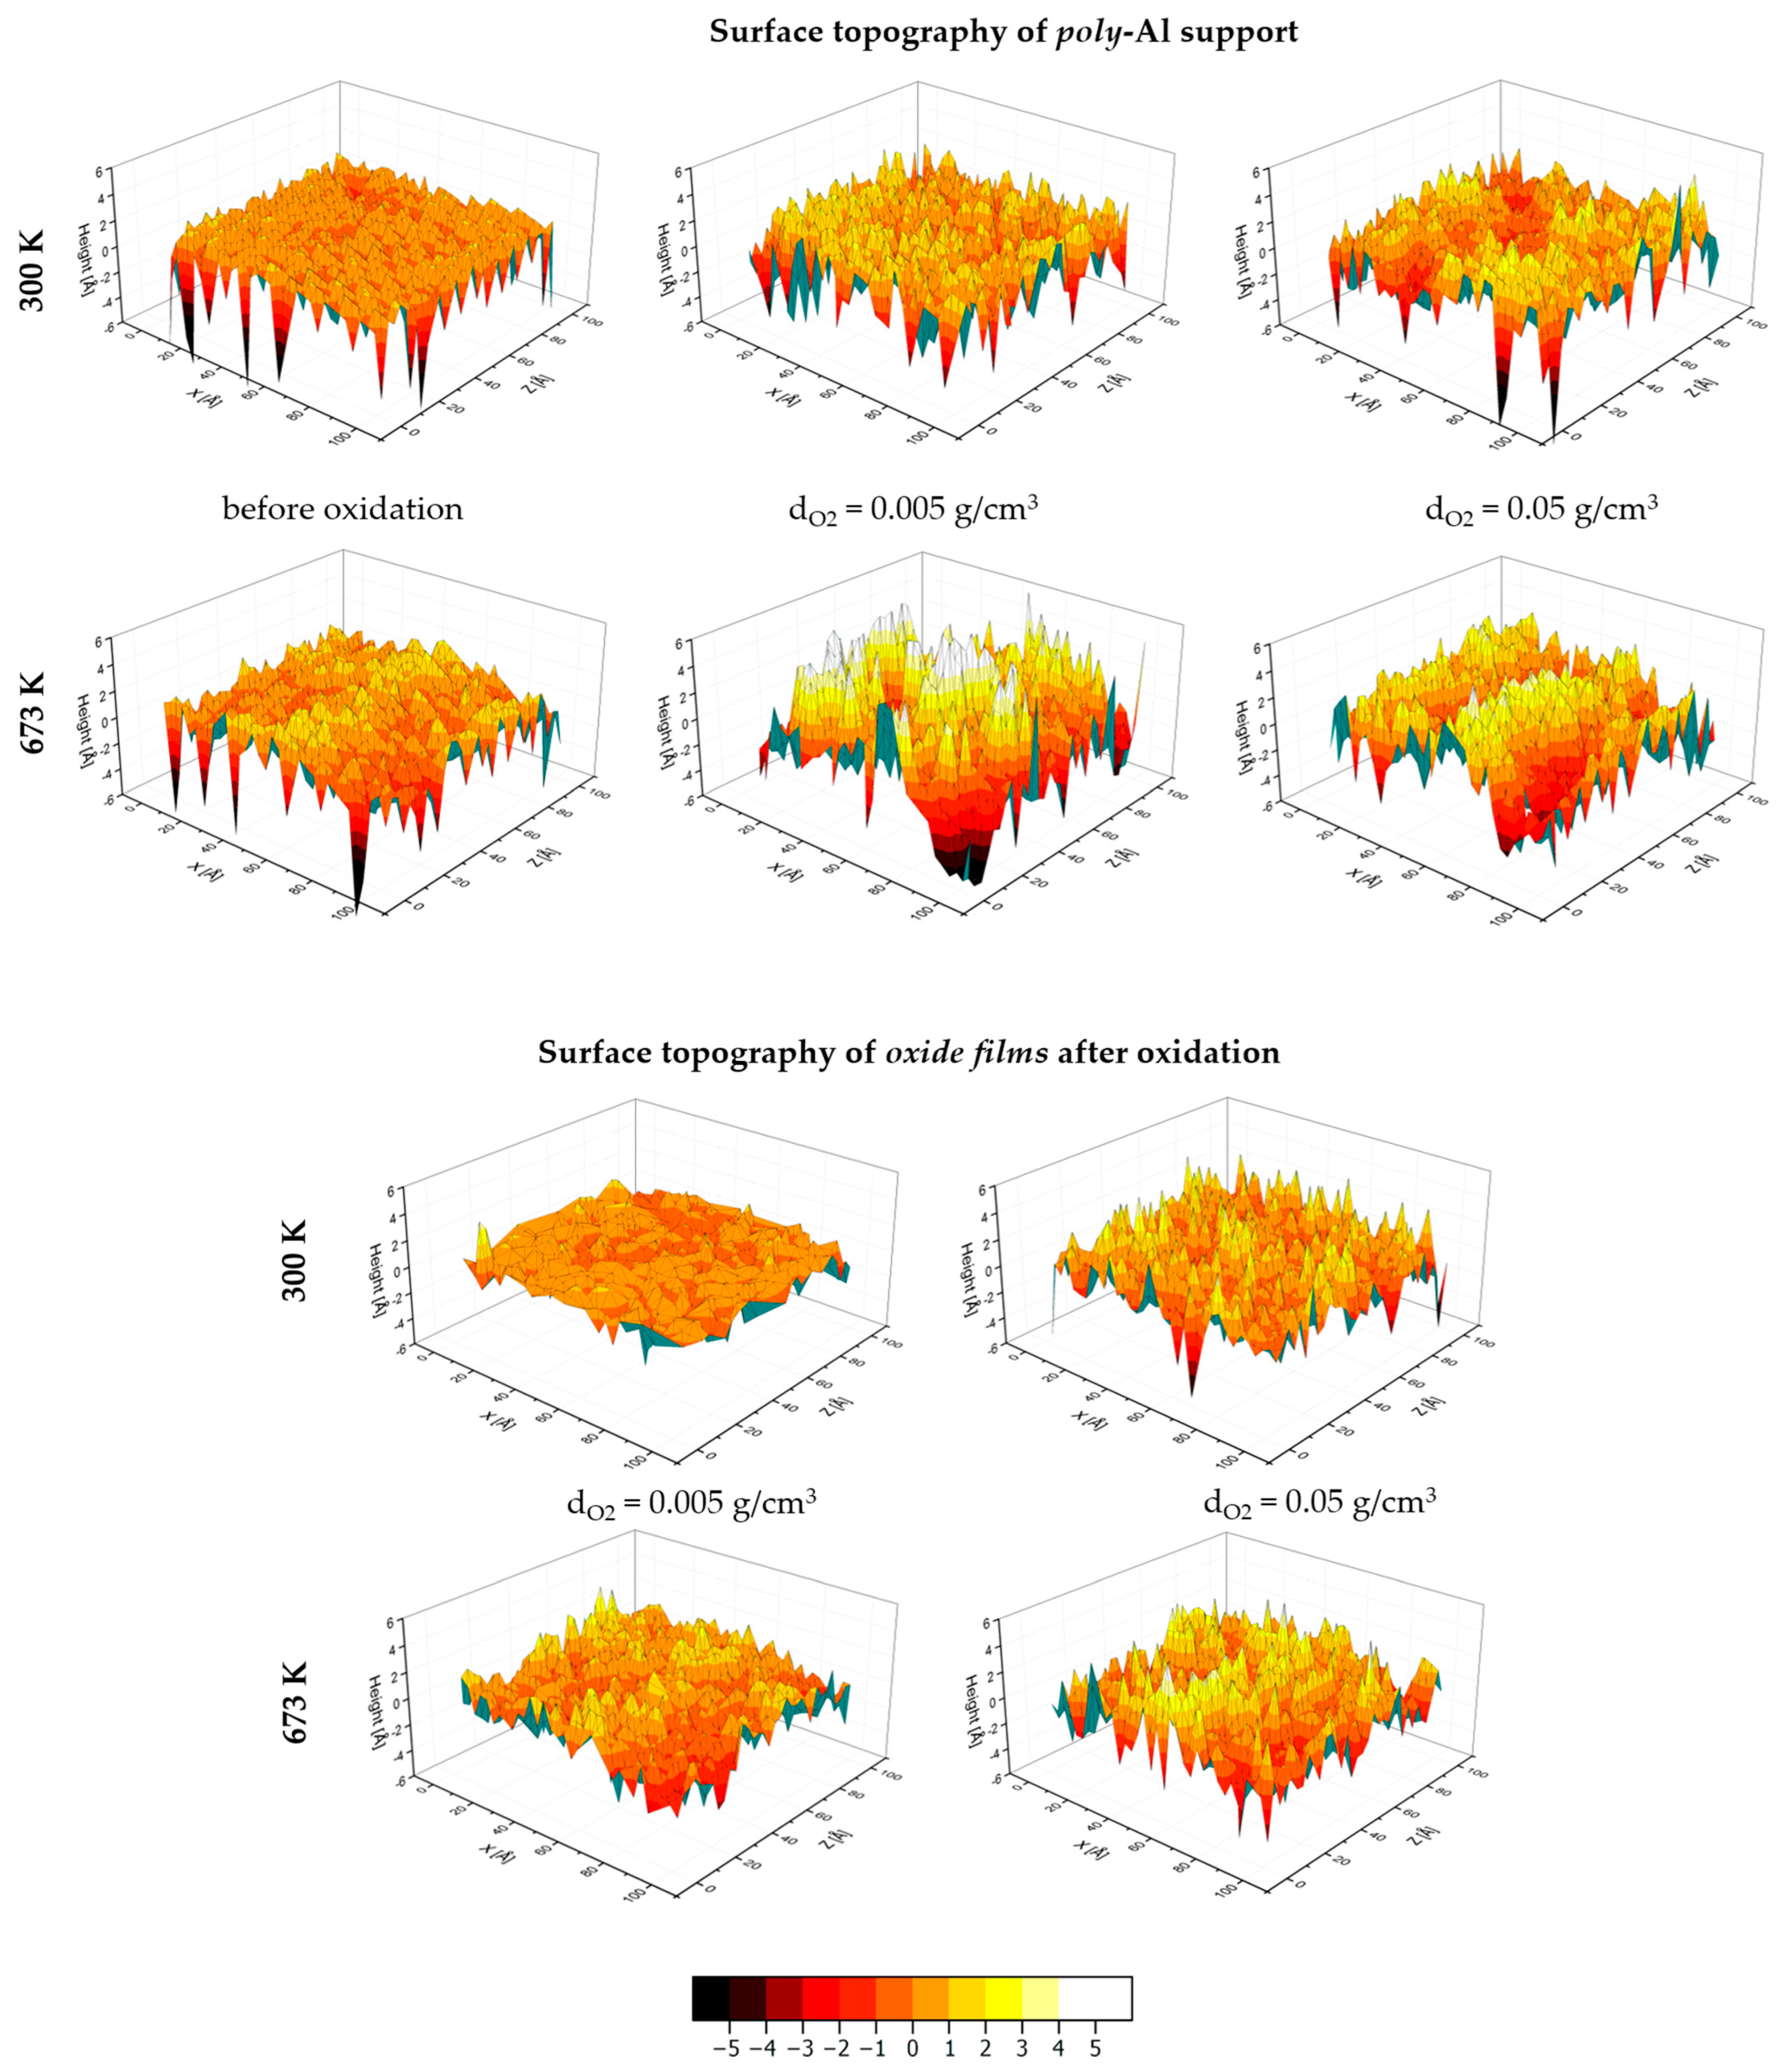
3.4. Surface Topography and Surface Morphology

To look more closely at the behavior of the oxide/oxygen and metal/oxide interfaces after thermal oxidation, 3D maps representing the height profile were computed for oxide films grown on poly-Al surfaces. Figure 9 shows the surface topographies for the poly-Al support (metal/oxide interface) after thermal oxidation for up to 2 ns at 300 K and 673 K under low and high oxygen densities. The temperature behavior of the surface topographies for the metal at the metal/oxide interface before and after oxidation (left panel) is presented in Figure S7 of the Supporting Information. Bright areas represent the highest points of the 3D maps, and dark areas correspond to the lowest points of the 3D map for the oxide films. For comparison, the surface topography of the poly-Al before thermal oxidation was also added to Figure 9 and Figure S7.
Visible changes in surface topography were observed for the metal/oxide interface after thermal oxidation at the considered oxidation temperatures and oxygen gas densities. The changes were more apparent for the poly-Al surface exposed to a high oxygen density. Changes in surface topography were also observed with an increasing oxidation temperature. Just three regions could be found for the bottom side of the oxide, corresponding to the metal/oxide interface, before oxidation. A similar number of regions could also be found for the oxide film grown at the higher oxygen density and the highest oxidation temperatures. The number and distribution of grain boundaries at the metal/oxide interface at a low oxygen density were different. The surface topography of the metal/oxide interface obtained at a low oxygen density and 300 K did not differ significantly from that of the pristine metal surface before oxidation. More visible changes in surface topography appeared for the oxide film formed at high oxidation temperatures of 545 K and 673 K for a high oxygen density. These might have been indicative of the initial state of long-range atomic order development, leading to amorphous-to-crystalline phase transformation.
The surface topography of the oxide/gas interface is presented in Figure 9. An increase in oxygen density led to more apparent changes in surface topography occurring upon oxidation at 300 K and 673 K. The outermost surface of the oxide film formed at 300 K and a 0.005 g/cm3 gas density was perceived to be relatively flat as compared to the rougher surface of the oxide film developed at the same temperature with a gas density of 0.05 g/cm3. Similar changes occurred for the oxide/oxygen interface with increasing oxidation temperatures, as observed in Figure S7 of the Supporting Information. The inheritance of the oxide film structure from Al substrate became more apparent with an increasing oxidation temperature, which was correlated with the presence of grain boundaries represented by dark areas.
To quantify the surface roughness, the Ra and Rz parameters were determined for the metal/oxide and oxide/oxygen interfaces. The averaged results for both roughness parameters are collected in Table 4 for the two interfaces analyzed. The temperature dependence at a constant oxygen density of both roughness parameters for poly-Al substrates and oxide films are gathered in Table S3 of the Supporting Information. A non-linear change in both the Ra and Rz roughness parameters for the metal/oxide interface was observed with an increasing oxidation temperature at a constant oxygen density. Similar behavior for both roughness parameters appeared under the two oxygen densities at a constant oxidation temperature. This could have resulted from the presence of randomly distributed oxide islands on poly-Al substrate, leading to the occurrence of oxide-free patches on the poly-Al surface for a 0.005 g/cm3 oxygen density. On the contrary, at the higher oxygen density, a compact oxide film developed on the poly-Al substrate with a predominance of O–O bridging configurations at the oxide/oxygen interface. A non-linear change in the Ra and Rz parameters could result from atom arrangements within small grains and grain boundaries during equilibration at 300 K, which became more apparent during grain recrystallization with the annealing temperature increasing up to 673 K. We observed a decrease in the Ra parameter by about 0.27 Å with an O2 density increase at 673 K, which could also be attributed to the presence of oxide-free areas on the poly-Al substrate at the lower O2 density, as confirmed by the Voronoi analysis (see Figure 7).
Regarding the oxide/O2 interface, an increase in both the Ra and Rz parameters was obtained with increasing oxygen density and oxidation temperatures (see Table S3 of the Supporting Information). Interestingly, the values of both profile roughness parameters were lower for the uppermost oxide surface as compared to the bottom side of the oxide films in contact with the metal. A difference in the behavior of the two sides of the oxide films was related to the initial surface roughness of the poly-Al substrates before oxidation. We could see the impact of the poly-Al surface roughness and oxygen density on the behavior of the metal/oxide interface and its structure, as well as its morphology. [4]Al and [6]Al coordination sites dominated over [3]Al and [5]Al sites at the bottom sides of the oxide films grown at a 0.05 g/cm3 O2 density, which was more apparent at 673 K. In contrast, the Al-depleted outermost surface of the oxide films with an excess of –O–O– bridging configurations was observed for the oxide/oxygen interface after oxidation at 673 K with a high O2 density.

4. Conclusions

Reactive molecular dynamics simulations were performed to study the thermal oxidation of a polycrystalline Al substrate as a function of the oxygen density and temperature. The chemical and topological aspects of polycrystalline Al substrate and oxide films were discussed. The surface topography and morphology of the metal/oxide and oxide/O2 interfaces were also analyzed.
The present work provided the first atomic-level insight into the thermal oxidation of polycrystalline Al substrates. The structural and morphological changes, as well as the atomic network topology of the Al substrate and of the grown oxide films, were discussed. Independently of oxygen density, almost fully amorphous oxide films formed on the poly-Al substrate at 300 K. An increase in oxidation temperature up to 673 K resulted in the development of long-atom arrangements that could be indicative of the dual-phase structure of the oxide films. A pseudo-crystalline phase appeared at the metal/oxide interface, and an amorphous phase was present at the oxide/oxygen interface. A 10-times higher oxygen density resulted in the formation of an oxide film that was about 2.5 thicker and had a 12 at.% higher oxygen content at 673 K.
A combination of advanced tools for topological analysis, including Voronoi analysis, bond-angle distribution, and n-ring analyses, enabled us to observe the structural, morphological, and topological changes that could be indicative of an amorphous-to-crystalline phase transformation occurring upon thermal oxidation, depending on the oxygen density and oxidation temperature. We also found that surface roughness had an important effect on the development of an oxide film in contact with low-density (0.005 g/cm3) and high-density (0.05 g/cm3) oxygen gas at 300 K and 673 K.

Supplementary Materials

The following supporting information can be downloaded at: https://www.mdpi.com/article/10.3390/cryst13091376/s1, Figure S1. Thickness change for the oxide films grown on poly-Al surfaces at temperatures: 300 K, 425 K, 475 K, 545 K and 673 K; Figure S2. Comparison of partial radial distribution function of Al-O pair, gAl-O(r), for oxide films grown on poly-Al substrate at the oxidation temperature between 300 K and 673 K for oxygen density of 0.05 g/cm3; Figure S3. Comparison of Al–O–Al and O–Al–O bond angle distribution for oxide films grown on poly-Al substrate at high (0.05 g/cm3) oxygen density at 300 K, 425 K, 475 K, 545 K and 673 K; Figure S4. Comparison of n-fold rings distribution for oxide films grown at high (0.05 g/cm3) oxygen density at 300 K, 425 K, 475 K, 545 K and 673 K; Figure S5. Distribution of Voronoi cell in poly-Al substrates before and after oxidation at 300 K, 425 K, 475 K, 545 K and 673 K for O2 density of 0.05 g/cm3. Colored bars represent abundance of each respective VC index type; Figure S6. Voronoi cell type distribution in oxide films gown on poly-Al substrates before and after oxidation at 300 K and 673 K for 0.005 g/cm3 and 0.05 g/cm3 oxygen density. Legend to the Figure: VC indices found for Al substrate (white, violet, green, pink, brown and yellow bars) and VC types typical of amorphous oxide films (orange, red, purple and blue bars). Black bars represent the group of other VC types. More details on the legend is given in the text and in the article; Figure S7. 3D maps of surface topography for poly-Al support representing bottom side of oxide film (metal/oxide interface) and oxide surface (oxide/oxygen interface) formed at 300 K, 425 K, 475 K, 545 K and 673 K. Dark areas correspond to the lowest point of oxide film at metal/oxide interface as compared to bright areas representing the highest points of the oxide film at metal/oxide interface; Table S1. Fitting parameters (a, b and c) of thickness curve (Thickness = a + b * ln(c + x), with x standing for time) for oxide films grown on poly-Al surface at 300 K, 425 K, 475 K, 545 K and 673 K; Table S2. Comparison of chemical composition of the oxide films grown on poly-Al surfaces at temperatures ranging between 300 K and 673 K for 0.05 g/cm3 O2 density; Table S3. Surface roughness parameters determined for metal/oxide and oxide/oxygen interface formed upon thermal oxidation at oxidation temperature: 300 K, 425 K, 475 K, 523 K and 673 K for 0.05 g/cm3 oxygen densities.

Author Contributions

M.E.T.: conceptualization; formal analysis; data curation; validation; writing (original draft preparation, review, and editing); visualization; and supervision. A.Ż.: investigation, visualization, validation, data curation, and writing (review and editing). P.A.K.: writing (review and editing). J.W.-B.: writing (review and editing). All authors have read and agreed to the published version of the manuscript.

Funding

This research received no external funding.

Data Availability Statement

Not applicable.

Acknowledgments

The authors acknowledge the financial support provided by the Polish National Agency for Academic Exchange (NAWA) under the Programme STER–Internationalisation of doctoral schools, Project No. PPI/STE/2020/1/00020. The authors would also like to thank PL GRID Infrastructure AGH Cyfronet. The computations were partly performed using resources provided by the Hillert Modeling Laboratory funded by the Hugo Carlssons Stiftelse för vetenskaplig forskning, Sweden.

Conflicts of Interest

The authors declare no conflict of interest.

References

  1. Snijders, P.C.; Jeurgens, L.P.H.; Sloof, W.G. Structural Ordering of Ultra-Thin, Amorphous Aluminium-Oxide Films. Surf. Sci. 2005, 589, 98–105. [Google Scholar] [CrossRef]
  2. Jeurgens, L.P.H.; Sloof, W.G.; Tichelaar, F.D.; Mittemeijer, E.J. Structure and Morphology of Aluminium-Oxide Films Formed by Thermal Oxidation of Aluminium. Thin Solid Films 2002, 418, 89–101. [Google Scholar] [CrossRef]
  3. Jeurgens, L.P.H.; Sloof, W.G.; Tichelaar, F.D.F.; Mittemeijer, E.J. Growth Kinetics and Mechanisms of Aluminum-Oxide Films Formed by Thermal Oxidation of Aluminum. J. Appl. Phys. 2002, 92, 1649–1656. [Google Scholar] [CrossRef]
  4. Flötotto, D.; Wang, Z.M.; Jeurgens, L.; Mittemeijer, E.J. Intrinsic Stress Evolution during Amorphous Oxide Film Growth on Al Surfaces. Appl. Phys. Lett. 2014, 104, 091901. [Google Scholar] [CrossRef]
  5. Reichel, F.; Jeurgens, L.P.H.; Richter, G.; Van Aken, P.A.; Mittemeijer, E.J. The Origin of High-Mismatch Orientation Relationships for Ultra-Thin Oxide Overgrowths. Acta Mater. 2007, 55, 6027–6037. [Google Scholar] [CrossRef]
  6. Reichel, F.; Jeurgens, L.P.H.; Mittemeijer, E.J. The Effect of Substrate Orientation on the Kinetics of Ultra-Thin Oxide-Film Growth on Al Single Crystals. Acta Mater. 2008, 56, 2897–2907. [Google Scholar] [CrossRef]
  7. Trybula, M.E.; Korzhavyi, P.A. Temperature Dependency of Structure and Order Evolution in 2D Confined Oxide Films Grown on Al Substrates Using Reactive Molecular Dynamics. Vacuum 2021, 190, 110243. [Google Scholar] [CrossRef]
  8. Lousada, C.M.; Korzhavyi, P.A. First Stages of Oxide Growth on Al(1 1 0) and Core-Level Shifts from Density Functional Theory Calculations. Appl. Surf. Sci. 2018, 441, 174–186. [Google Scholar] [CrossRef]
  9. Lanthony, C.; Ducéré, J.M.; Rouhani, M.D.; Hemeryck, A.; Estève, A.; Rossi, C. On the Early Stage of Aluminum Oxidation: An Extraction Mechanism via Oxygen Cooperation. J. Chem. Phys. 2012, 137, 094707. [Google Scholar] [CrossRef]
  10. Hong, S.; Van Duin, A.C.T. Molecular Dynamics Simulations of the Oxidation of Aluminum Nanoparticles Using the ReaxFF Reactive Force Field. J. Phys. Chem. C 2015, 119, 17876–17886. [Google Scholar] [CrossRef]
  11. Campbell, T.; Kalia, R.K.; Nakano, A.; Vashishta, P.; Ogata, S.; Rodgers, S. Dynamics of Oxidation of Aluminum Nanoclusters Using Variable Charge Molecular-Dynamics Simulations on Parallel Computers. Phys. Rev. Lett. 1999, 82, 4866–4869. [Google Scholar] [CrossRef]
  12. Cheng, C.; Ng, K.Y.; Aluru, N.R.; Ngan, A.H.W. Simulation and Experiment of Substrate Aluminum Grain Orientation Dependent Self-Ordering in Anodic Porous Alumina. J. Appl. Phys. 2013, 113, 204903. [Google Scholar] [CrossRef]
  13. Lyapin, A.; Jeurgens, L.P.H.; Graat, P.C.J.; Mittemeijer, E.J. The Initial, Thermal Oxidation of Zirconium at Room Temperature. J. Appl. Phys. 2004, 96, 7126–7135. [Google Scholar] [CrossRef]
  14. Panda, E.; Jeurgens, L.P.H.; Mittemeijer, E.J. The Initial Oxidation of Al-Mg Alloys: Depth-Resolved Quantitative Analysis by Angle-Resolved X-ray Photoelectron Spectroscopy and Real-Time in Situ Ellipsometry. J. Appl. Phys. 2009, 106, 114913. [Google Scholar] [CrossRef]
  15. Trybula, M.E.; Korzhavyi, P.A. Atomistic Simulations of Al(100) and Al(111) Surface Oxidation: Chemical and Topological Aspects of the Oxide Structure. J. Phys. Chem. C 2019, 123, 334–346. [Google Scholar] [CrossRef]
  16. Jeurgens, L.P.H.; Reichel, F.; Frank, S.; Richter, G.; Mittemeijer, E.J. On the Development of Long-Range Order in Ultra-Thin Amorphous Al2O3 Films upon Their Transformation into Crystalline γ-Al2O3. Surf. Interface Anal. 2008, 40, 259–263. [Google Scholar] [CrossRef]
  17. Cabrera, N.; Mott, N.F. Theory of the Oxidation of Metals. Rep. Prog. Phys. 1949, 12, 163–184. [Google Scholar] [CrossRef]
  18. Reichel, F.; Jeurgens, L.P.H.; Richter, G.; Mittemeijer, E.J. Amorphous versus Crystalline State for Ultrathin Al2O3 Overgrowths on Al Substrates. J. Appl. Phys. 2008, 103, 093515. [Google Scholar] [CrossRef]
  19. Lee, S.K.; Lee, S.B.; Park, S.Y.; Yi, Y.S.; Ahn, C.W. Structure of Amorphous Aluminum Oxide. Phys. Rev. Lett. 2009, 103, 095501. [Google Scholar] [CrossRef]
  20. Gutierrez, G.; Johansson, B. Molecular Dynamics Study of Structural Properties of Amorphous Al2O3. Phys. Rev. B 2002, 65, 104202. [Google Scholar] [CrossRef]
  21. Gutierrez, G.; Belonoshko, A.B.; Ahuja, R.; Johansson, B. Structural Properties of Liquid Al2O3: A Molecular Dynamics Study. Phys. Rev. E 2000, 61, 2723–2729. [Google Scholar] [CrossRef]
  22. Lee, S.K.; Ahn, C.W. Probing of 2 Dimensional Confinement-Induced Structural Transitions in Amorphous Oxide Thin Film. Sci. Rep. 2014, 4, 4200. [Google Scholar] [CrossRef] [PubMed]
  23. Plimpton, S.J. Fast Parallel Algorithms for Short-Range Molecular Dynamics. J. Comput. Phys. 1995, 117, 1–19. [Google Scholar] [CrossRef]
  24. Van Duin, A.; Dasgupta, S.; Lorant, F. ReaxFF: A Reactive Force Field for Hydrocarbons. J. Phys. Chem. A 2001, 105, 9396–9409. [Google Scholar] [CrossRef]
  25. Senftle, T.P.; Hong, S.; Islam, M.M.; Kylasa, S.B.; Zheng, Y.; Shin, Y.K.; Junkermeier, C.; Engel-Herbert, R.; Janik, M.J.; Aktulga, H.M.; et al. The ReaxFF Reactive Force-Field: Development, Applications and Future Directions. Comput. Mater. 2016, 2, 15011. [Google Scholar] [CrossRef]
  26. Hirel, P. Atomsk: A Tool for Manipulating and Converting Atomic Data Files. Comput. Phys. Commun. 2015, 197, 212–219. [Google Scholar] [CrossRef]
  27. Verlet, L. Computer “Experiments” on Classical Fluids. I. Thermodynamical Properties of Lennard-Jones Molecules. Phys. Rev. 1967, 159, 98–103. [Google Scholar] [CrossRef]
  28. Trybula, M.E.; Zydek, A.; Korzhavyi, P.A.; Wojewoda-Budka, J. Structure and Behavior of Oxide-Coated Aluminum in Contact with Acidic and Alkaline Aqueous Solutions—A Reactive Molecular Dynamics Simulation Study. J. Phys. Chem. C 2023, 5, 2493–2507. [Google Scholar] [CrossRef]
  29. Trybula, M.E. Structure and Transport Properties of the Liquid Al80Cu20 Alloy—A Molecular Dynamics Study. Comput. Mater. Sci. 2016, 122, 341–352. [Google Scholar] [CrossRef]
  30. Trybula, M.E.; Szafranski, P.W.; Korzhavyi, P.A. Structure and Chemistry of Liquid Al-Cu Alloys: Molecular Dynamics vs Thermodynamics-Based Modelling. J. Mater. Sci. 2018, 53, 8285–8301. [Google Scholar] [CrossRef]
  31. Żydek, A.; Wermiński, M.; Trybula, M.E. Description of Grain Boundary Structure and Topology in Nanocrystalline Aluminum Using Voronoi Analysis and Order Parameter. Comput. Mater. Sci. 2021, 197, 110660. [Google Scholar] [CrossRef]
  32. Stukowski, A. Structure Identification Methods for Atomistic Simulations of Crystalline Materials. Model. Simul. Mater. Sci. Eng. 2012, 20, 045021. [Google Scholar] [CrossRef]
  33. Stukowski, A. Atomic-Scale Modeling of Nanostructured Metals and Alloys. Ph.D. Dissertation, Technical University of Darmstadt, Darmstadt, Germany, 2010. [Google Scholar]
  34. Lazar, E.A.; Han, J.; Srolovitz, D.J. Topological Framework for Local Structure Analysis in Condensed Matter. Proc. Natl. Acad. Sci. USA 2015, 112, E5769–E5776. [Google Scholar] [CrossRef]
  35. Lazar, E.A. VoroTop: Voronoi Cell Topology Visualization and Analysis Toolkit. Model. Simul. Mater. Sci. Eng. 2018, 26, 015011. [Google Scholar] [CrossRef]
  36. Rycroft, C. Voro++: A Three-Dimensional Voronoi Cell Library in C++. Chaos 2009, 19, 041111. [Google Scholar] [CrossRef]
  37. Sankaranarayanan, S.K.R.S.; Ramanathan, S. On the Low-Temperature Oxidation and Ultrathin Oxide Growth on Zirconium in the Presence of Atomic Oxygen: A Modeling Study. J. Phys. Chem. C 2008, 112, 17877–17882. [Google Scholar] [CrossRef]
  38. Lamparter, P.; Kniep, R. Structure of Amorphous Al2O3. Phys. B 1997, 234–236, 234–236. [Google Scholar] [CrossRef]
Figure 1. Thickness change for the oxide films grown on poly-Al substrates. (A) Average thickness of oxide films grown on poly-Al substrates at 300 K and 673 K with 0. 005 g/cm3 and 0.05 g/cm3 O2 densities. (B) Thickness comparison of oxide film grown on the poly-Al (this study) and Al single crystals with (100) and (111) surface orientations at 300 K [15].
Crystals 13 01376 g001
Figure 2. Total radial distribution function, g(r). Comparison for oxide films grown on poly-Al (this study) and on single crystal of Al(100) and Al(111) surfaces at 300 K [15]. Expt. represents experimental data for anodically grown alumina film [38].
Crystals 13 01376 g002
Figure 3. Radial distribution function for Al–O atomic pair computed for oxide films grown on Al surfaces. (A) Oxide films grown on poly-Al surfaces at 300 K and 673 K with 0.005 g/cm3 and 0.05 g/cm3 oxygen densities (this study). (B) Comparison between oxide films grown on poly-Al surface at 300 K with a 0.05 g/cm3 oxygen density (this study) and oxides grown on Al(100) and Al(111) single crystal surfaces at 300 K with a 0.24 g/cm3 oxygen density [15]. (C) Comparison between oxide films grown on poly-Al surface at 673 K with 0.005 g/cm3 and 0.05 g/cm3 oxygen densities (this study) and oxides grown on Al(100) and Al(111) single crystal surfaces at 673 K with a 0.24 g/cm3 oxygen density [15].
Crystals 13 01376 g003
Figure 4. Al–O–Al and O–Al–O bond-angle distribution for oxide films grown on poly-Al substrate under low (0.005 g/cm3) and high (0.05 g/cm3) oxygen densities at 300 K and 673 K.
Crystals 13 01376 g004
Figure 5. Comparison of Al–O–Al and O–Al–O bond-angle distributions for oxide films grown on poly-Al substrate and single crystals of (100) and (111) Al surface orientations at 300 K [15].
Crystals 13 01376 g005
Figure 6. Distribution of n-fold rings in oxide films grown on poly-Al substrates for low (0.005 g/cm3) and high (0.05 g/cm3) oxygen densities at 300 K and 673 K.
Crystals 13 01376 g006
Figure 7. Distribution of Voronoi cells in poly-Al substrates before and after oxidation at 300 K and 673 K for O2 densities of 0.005 g/cm3 and 0.05 g/cm3. Colored bars represent the abundance of each VC index type. Legend to the figure: perfect lattice (yellow bars, VC (0.6.0.8.0.)); lattice distortions (green and brown bars); liquid-like/amorphous (white, pink, violet, and purple bars); crystal defects (red and orange bars). Black bars represent the group of other VC types. More details about the VC types are given in the text and can be found in our previous paper [31].
Crystals 13 01376 g007
Figure 8. Voronoi cell type distribution in oxide films grown on poly-Al substrates before and after oxidation at 300 K and 673 K with 0.005 g/cm3 and 0.05 g/cm3 oxygen densities. Legend to the figure: VC indices found for Al substrate (white, violet, green, pink, brown, and yellow bars) and VC types typical of amorphous oxide films (orange, red, purple, and blue bars). Black bars represent the group of other VC types. More details on the legend are provided in the text and in our previous paper [28].
Crystals 13 01376 g008
Figure 9. 3D maps of surface topography for poly-Al support representing bottom side of oxide film (top panel) and oxide surface (bottom panel) after oxidation. Dark areas correspond to the lowest point of the oxide film at the metal/oxide interface as compared to bright areas representing the highest points of the oxide film at the metal/oxide interface.
Crystals 13 01376 g009
Table 1. Chemical composition of the oxide films grown on poly-Al surfaces at 300 K and 673 K with a 0.05 g/cm3 O2 density and the oxide film formed at 673 K with a 0.005 g/cm3 O2 density.
Density (g/cm3)T (K)Chemical Composition (%)
AlO
poly-Al0.00567366.433.6
0.0530055.244.8
67354.445.6
Table 2. Comparison of O–Al–O bond-angle distribution for thin oxide films grown on poly-Al substrate at 300 K and bulk crystalline alumina compounds.
PhaseO–Al–O Bond Angle (°)
AmorphousThin film (this work)Broad peak from 89.0 to 104.7, 117.5, 161.7
Bulk93, 171
α-Al2O3 79.53, 86.40, 101.20, 164.13
γ-Al2O3 80.57, 87.78, 86.0, 92.22, 104.53, 109.47, 119.09, 162.34, 180.0
Liquid 95, 170
Table 3. Comparison of n-ring distribution for oxide film grown on Al substrates at 300 K and bulk crystalline alumina compounds [21]. Data for thin oxide film grown on Al(100) and Al(111) surfaces were taken from Ref. [15]. Results obtained in this work are given in bold.
PhaseDensity (g/cm3)Bond Length (Å)n-Fold Ring Fraction (%)
23456
poly-Al4.311.9134362361
Al(100)3.451.836.53929.525-
Al(111)3.481.8316352720-
α-Al2O33.981.97 (1.85)4060---
γ-Al2O33.661.941404018.51.5-
am-Al2O33.31.76113741100.3
Liquid3.1751.75132532237
Table 4. Surface roughness parameters determined for metal/oxide and oxide/oxygen interface formed upon thermal oxidation at 300 K and 673 K with 0.005 g/cm3 and 0.05 g/cm3 oxygen densities.
O2
Density (g/cm3)
T (K)Metal/Oxide
Interface
Oxide/O2
Interface
Ra (Å)Rz (Å)Ra (Å)Rz (Å)
Before
oxidation
03000.644.04--
6730.855.19--
After
oxidation
0.0053001.277.840.615.71
6731.768.830.906.67
0.053001.036.770.926.88
6731.499.171.119.06
Disclaimer/Publisher’s Note: The statements, opinions and data contained in all publications are solely those of the individual author(s) and contributor(s) and not of MDPI and/or the editor(s). MDPI and/or the editor(s) disclaim responsibility for any injury to people or property resulting from any ideas, methods, instructions or products referred to in the content.

