Article

Nucleation and Growth Kinetics of Sodium Chloride Crystallization from Water and Deuterium Oxide

1
EPSRC Centre in Continuous Manufacturing and Crystallisation, c/o Department of Chemical and Process Engineering, University of Strathclyde, James Weir Building, 75 Montrose Street, Glasgow G1 1XJ, UK
2
Department of Chemical and Process Engineering, University of Strathclyde, James Weir Building, 75 Montrose Street, Glasgow G1 1XJ, UK
3
EPSRC Centre in Continuous Manufacturing and Crystallisation, c/o Strathclyde Institute of Pharmacy and Biomedical Sciences, University of Strathclyde, Technology and Innovation Centre, 99 George Street, Glasgow G1 1RD, UK
*
Author to whom correspondence should be addressed.
Crystals 2023, 13(9), 1388; https://doi.org/10.3390/cryst13091388
Submission received: 31 July 2023 / Revised: 13 September 2023 / Accepted: 15 September 2023 / Published: 18 September 2023
(This article belongs to the Section Inorganic Crystalline Materials)

Abstract

:
Despite the ubiquity of the crystallization of sodium chloride (NaCl) throughout history, few detailed, well-controlled quantitative studies of the kinetics of NaCl crystallization have been published. Taking advantage of recent advances in technology such as image analysis for crystallite counting and ‘high-throughput’ techniques for characterizing the highly stochastic nucleation process, we report on a detailed examination of the primary and secondary nucleation kinetics of NaCl, crystallized from solution, in water (H2O) and in the isotopologue D2O. We show that crystallization conditions, especially sample agitation, have a very significant effect on crystallization kinetics. We also critically evaluate the workflow employed and the associated nucleation/growth models used to interpret its results, comparing outcomes from NaCl with those from organic crystal systems with which the workflow was originally developed and demonstrated. For primary nucleation, some key assumptions of the workflow and data interpretation are called into question for the NaCl system. Even so, it can still provide direct measurements of secondary nucleation and crystal growth from crystal counting and sizing, providing valuable characterization under consistent controlled conditions to enhance and ‘bring up to date’ the literature on the crystallization of this ubiquitous system.

1. Introduction

Sodium chloride (NaCl) crystallization from aqueous solution has been employed by humans since circa 2500 BCE [1] and further represents a common natural phenomenon; for example, it occurs wherever salty water evaporates under the influence of high temperature and/or solar radiation. Yet despite this ubiquity, there is a dearth of well-controlled studies on the nucleation and growth of NaCl crystals, with an especial absence of recent studies taking advantage of modern methods. Much of the data that are easily available date from the first half of the 20th century or even earlier [2,3,4,5]. Furthermore, the available data were obtained through a wide range of methods involving quite different conditions, ranging from the titration of saturated solutions with silver nitrate to observing the temperature at which all solid material disappears from a sealed ‘glass solubility apparatus’ containing known masses of solute and solvent [6]. It is well known that crystallization conditions such as flow/agitation, heat, and mass transport can strongly affect the kinetics of nucleation and growth (as well as other factors, such as polycrystallinity, defects, and crystal size distributions), so the use of consistent methodologies and conditions is vital to obtaining clear, reliable, and quantitative information on crystallization. Moreover, crystallization (in particular nucleation) is a stochastic phenomenon, meaning that data from multiple identical samples are required to generate statistically robust measurements. Recently, a comprehensive crystallization characterization workflow based on the repeated controlled temperature cycling of multiple independent samples and quantitative optical (light transmission and image analysis) methods was developed [7,8] and demonstrated for organics, such as amino acids and amides. The value of such a well-defined workflow methodology is that it can provide a wealth of data on solubility, metastable zones, and nucleation and growth rates through consistent and well-controlled techniques, enabling the improved reliability of comparisons between conditions and systems, which is particularly useful in process development for materials such as pharmaceuticals. In this paper, we use this workflow methodology to conduct a carefully controlled exploration of primary and secondary nucleation and the growth of crystals from solutions of NaCl. We also examine a range of agitation conditions and compare two different solvent isotopologues, water (H2O) and deuterium oxide (D2O). We explore the issues that arise in obtaining unambiguous quantitative measures through the workflow and its associated analytical techniques, including the challenge of achieving controlled isothermal nucleation, the possible impact of crystal fragmentation during growth, and the confounding effects of growth rate dispersion amongst a population of crystallites. We thus demonstrate that even in such an apparently ‘simple’ and ubiquitous system as NaCl, measuring and quantitatively interpreting crystallization behavior presents significant challenges to simplistic assumptions about nucleation and growth.

1.1. Primary Nucleation, Secondary Nucleation, and Crystal Growth

The formation of a crystal from solution is generally considered to be comprised of two distinct steps: the initial nucleation of the crystal and the subsequent crystal growth [9]. Nucleation can be further classified into two categories, primary and secondary nucleation [10]. Primary nucleation refers to the formation of crystals in the absence of previously extant crystals. At small volumes, the stochastic nature of primary nucleation can be very evident, as demonstrated by potentially the wide variation of the time taken to observe the first appearance of a crystal (known as the induction time, which is dependent not only on the nucleation of a crystal but also on the time taken for crystals to grow to an observable size) across samples under otherwise identical conditions. Nevertheless, measurement of the statistical distribution of induction times from multiple measurements under identical conditions allows characteristics such as the primary nucleation rate (the number of nuclei formed per unit volume per unit time) to be estimated [11]. Following nucleation, crystals suspended in a supersaturated solution grow, as molecules or other crystal-forming units become incorporated into the crystal lattice [12]. Phase separation is completed at the point when, due to the loss of these units, relative supersaturation in the solution phase decreases to zero, i.e., the solid and solution phases are in equilibrium. Of course, this description of crystallization as combining two steps well-separated in time, nucleation followed by growth, is itself a simplification whose violation can lead to difficulties in interpreting measurements; for example, if the characteristic timescales of nucleation and growth are similar, one may observe continuing ‘new’ nucleation alongside growth, which may be difficult to separate phenomenologically, while very slow growth may lead to very long times before nucleated crystals are observable, falsely implying very slow nucleation.
In contrast to primary nucleation, secondary nucleation is defined as nucleation in the presence of pre-existing crystals [13]. The stochastic and therefore difficult-to-control nature of primary nucleation means that, in fact, many practical applications are based on seeding methods, where an initial population of pre-grown crystals is added to the supersaturated solution. Once crystals are present in the supersaturated solution, whether added through seeding or formed by primary nucleation, these can then trigger the nucleation of new crystals via secondary nucleation, which can be employed to improve the controllability of the nucleation stage in crystal manufacturing. At high supersaturation, primary nucleation tends to generate very uncontrolled results, such as wide crystal size distributions, that are usually undesirable in applications. However, because the nucleation rate decreases with decreasing supersaturation, trying to achieve better control by using primary nucleation at low levels of supersaturation is usually also impractical because it then requires very long induction times and thus very long process times. Implementing secondary nucleation through seeding allows much lower levels of supersaturation to be employed, thus improving nucleation control. The use of secondary nucleation through seeding can have other advantages, such as the production of a specific form of a crystal, e.g., a given enantiomer or polymorph, by pre-seeding with that form [14,15]. Various mechanisms of secondary nucleation have been proposed and explored, including attrition, where small parts of crystalline material are mechanically removed from the surface of an existing crystal to form ‘new’ nuclei, and so-called surface breeding, where, it is proposed, clusters of crystal-forming units form in the boundary layer of the existing crystal, where their transformation into stable crystals is accelerated. Other proposed mechanisms involve crystal-forming units forming larger structures in bulk solution, which then come into contact with the parent crystal to rapidly form a new crystal [16]. New nuclei, released from the parent crystal (for example by fluid shear), then generate further secondary nucleation through the same mechanisms, leading to the rapid proliferation of crystals [17].
It is important to realize, however, that secondary nucleation does not necessarily require seeding with a pre-grown crystal. In practice, where primary nucleation rates are relatively low, it is often found that once a first primary nucleus has formed, it acts in the same way as would an added seed, triggering secondary nucleation. Because secondary nucleation rates are more often than not significantly higher than the rate of any ongoing further primary nucleation [8,18], this ‘unseeded’ secondary nucleation then goes on to dominate further new crystal formation. A single first primary nucleus thus acts as the initial source of secondary nuclei, which then proliferate rapidly, eclipsing any further primary nucleation, a conceptual picture known as the ‘single nucleus’ hypothesis [10,14,19].
One of the critical issues in crystallization rates in many systems is found to be the role of agitation. It is often found that under conditions where nucleation would be very slow in a quiescent (non-agitated) sample, employing agitation (stirring, shaking) strongly accelerates nucleation [20,21,22,23]. There is wide discussion in the literature as to the mechanisms responsible, ranging from the role of fluid flow (including both laminar shear stress and the effects of turbulence) to mechanical factors, such as the impact between stirring devices and growing nuclei/crystallites [24,25].
Additional complexity arises when specific isotopologues are used for crystallization. Despite chemical identity, physical properties can be influenced by isotopic differences [26]. Of particular relevance in crystallization is how solubility is impacted by solvent isotopologue, of which the canonical example is the contrast solute solubility in water (H2O) compared to in deuterium oxide or so-called ‘heavy water’ (D2O). The dielectric constants of the two solvents are similar [27], and yet salts typically display a decreased solubility in D2O in comparison to H2O [28] due to the increased strength of hydrogen bonding in D2O resulting in increased solvation energy. However, some salts, such as LiF and LiCl, show an increased solubility in D2O. These latter are typically classified as “structure makers” in comparison to the majority of electrolytes termed “structure breakers” [28,29]. In amino acids, the effect of solvent isotopologue on solubility varies: the D2O solubility of glycine (at least between 10 C and 62 C) is decreased compared to H2O, while proline is more soluble in D2O than in H2O. In the case of phenylalanine, whether H2O or D2O is the better solvent depends on temperature: below 37 C, phenylalanine is more soluble in H2O, while above 37 C, it becomes more soluble in D2O [30,31]. The issue can be further complicated by the possibility of isotope exchange (H for D) between the solute and solvent [32]. For organic solutes, such as glycine in D2O, isotope exchange leads to the formation of d3-glycine, where the three hydrogen atoms that associate with the in-solution glycine zwitterion can be exchanged for the deuterium present in the deuterated aqueous solvent [33]. However, in simple salts, such as NaCl, there are no issues of potential isotope exchange.

1.2. Crystallization Characterization: Solubility, Metastable Zone Width, and Growth Rates

The first stage in any characterization of the crystallization of a solute from solution is to obtain information on the ‘baseline’ phase behavior of the system. Critical measurements include the solubility, i.e., the relationship between solute concentration and temperature which defines the phase boundary between the completely dissolved solute and crystal co-existing with the solution, and the metastable zone, which is the region of the phase diagram on the two-phase side of the phase boundary within which the sample is thermodynamically unstable but kinetically metastable. In the metastable zone, the sample is stable to concentration fluctuations up to some finite non-zero critical extent, and thus, there is some characteristic time, inversely related to the probability of fluctuations of the critical size occurring, before macroscopic phase separation commences. The solubility defines, at any sample solute concentration C and sample temperature T, the so-called sample supersaturation S = C / C * ( T ) where C * ( T ) is the solubility at temperature T. Subsequently, to characterize crystallization kinetics in the metastable zone, measures of the rate of primary nucleation and the rate of unseeded secondary nucleation and how these depend on S are required. In many industrial processes, as mentioned above, seeding systems with pre-grown crystals is employed to improve on the highly stochastic nature of primary nucleation, so it is further useful in a comprehensive characterization of crystallization to measure the rate of seeded secondary nucleation. Finally, going beyond nucleation, measuring the growth rate of crystals completes a full set of data that, in principle, should provide the required quantitative parameters to enable the design of crystallization processes, i.e., to make decisions about working temperatures, supersaturations, residence times based on desired crystal properties, such as crystallite size, and process properties, such as yield and production rate.
In what follows, we use the nucleation and growth characterization workflow developed and demonstrated recently with organic crystals [7,8] to obtain the above data for the NaCl system. The conceptual basis of the workflow is to carry out multiple simultaneous experiments under controlled conditions (including temperature protocol and agitation) to efficiently generate a rich dataset describing the crystallization characteristics of the given system. The methodology makes use of the Technobis Crystalline and Crystal 16 devices (Technobis Crystallization Systems B.V., Alkmaar, The Netherlands), which offer programmed temperature protocol and agitation control in multiple samples (16 vials of volume up to 1.5 mL in Crystal16 and 8 vials of 8 mL in Crystalline, both with a temperature precision of 0.1 C) alongside detailed in situ analytical methods for detecting crystallization/dissolution (by quantitative light transmission) and measuring nucleation rates and growth (by analysis of images from in situ cameras observing each sample, available in the Crystalline device only). The drawback of using these devices is that the scale of individual samples is relatively small, which generates greater statistical variation given the stochastic nature of nucleation. While Briuglia et al. and Cashmore et al. demonstrate the capacity of the workflow to characterize a range of organic solutes crystallizing from solution [7,8], one aspect of our work reported here is an attempt to extend this methodology, in particular to an ionic crystal with, as we shall see, a weak dependence of solubility on temperature, which, given that the method is based on crystallization by cooling, may be expected to bring challenges. In doing so, we explore the limitations of the methodology and the assumptions underlying the typical interpretation of the data it generates, illuminating where the nature of the apparently simple NaCl crystal system raises significant challenges.

2. Materials and Methods

Sodium chloride powder (≥99%, ACS Reagent) and deuterium oxide (99% D Atom) were supplied by Sigma Aldrich(St. Louis, MO, USA) and used without further purification. Deionised water was supplied from an in-house source (Millipore Ultrapure, Darmstadt, Germany, 18.2 M Ω cm).

2.1. Solubility and Metastable Zone Width Determination

For solubility and metastable zone characterization, a solution at a given solute concentration C was subjected to a controlled temperature scan from the fully dissolved phase into the two-phase solid-saturated solution coexistence region, inducing the nucleation of the crystal phase at some temperature, the so-called cloud point. This temperature was taken as the limit of the metastable zone. A second, increasing temperature scan was then carried out, with dissolution of the crystal occurring at a temperature known as the clear point, which is taken as the solubility temperature at the given concentration. The Crystal16 device enables the measurement of these clear point and cloud point temperatures in 16 multiple samples using light transmissivity. Known masses of sodium chloride were added to 1.5 mL glass vials, followed by the addition of 1 g of either deionised water or deuterium oxide. A 1.3 mm Teflon-coated stirrer bar was added to each vial; the vials were closed using a basic cap and inserted into the individual reactors of the Crystal16. Further statistical sampling was obtained by repeating the temperature decrease/increase cycle three times for each sample (note that this number of cycles was selected as a compromise between collecting substantial data in a reasonable timeframe and minimising the potential for systematic increasing error in a given sample, for example, due to the slow evaporation of the solvent). For each temperature cycle, vials were heated to 70 C at a rate of 5 C min−1 and held at this temperature for 30 min to ensure complete dissolution of the solute and to record a baseline ‘100%’ transmissivity. The temperature was then decreased at a rate of 0.3 C min−1 to 5 C. During this temperature decrease, sample transmissivity was continuously recorded, and the cloud point temperature, defined as the temperature at which transmissivity begins to drop from 100%, was obtained. The temperature was then held constant at 5 C for 30 min before being increased back to 70 C at a rate of 0.3 C min−1. The clear point temperature, where the crystal phase dissolves and solution transmissivity increases, was defined as where the transmissivity reached 90% of the high-temperature ‘100%’ level. (Note that the heating/cooling rate in the temperature scans was chosen for consistency with previous applications of this methodology [7,8] such that the rates were low enough to ensure adequate heat transfer and equilibration in the small-scale sample vials [34]). The difference in the clear and cloud point temperatures is a measure of the metastable zone width (MSZW). Throughout the temperature cycle, vials are continuously agitated via a magnetic stirrer at a speed of 700 RPM. In practice, the measured cloud and clear point temperatures and thus the metastable zone width will differ somewhat cycle-to-cycle due to the well-known stochastic nature of primary nucleation, and thus, the statistical accuracy of these measures is intrinsically limited by the number of independent samples. Once the solubility curve was measured, we could estimate the supersaturation S for any experimental condition of solute concentration C and temperature T, where S = C / C * ( T ) and C * ( T ) is the measured solubility concentration at temperature T.

2.2. Unseeded Crystallization: Induction Times at Different Sample Scales and Agitation Conditions

In isothermal unseeded crystallization, the induction time is defined as the time taken after a quench to the given fixed experimental temperature T e x p for the presence of crystals to be detected in a sample. Again, the stochastic nature of nucleation means we obtained, from multiple identical experiments, a distribution of induction times. The induction time distribution was thus measured at a given supersaturation S = C / C * ( T e x p ) , where C is the solute concentration and C * ( T e x p ) is the solubility at T e x p , by cooling multiple identical samples in the Crystalline/Crystal16 device starting from the fully dissolved state ( T = 70 C) and quenching to the fixed experimental working temperature T e x p = 25 C. For each of the multiple samples, the induction time was recorded as the time elapsed from the point when the isothermal condition was reached until measured light transmissivity dropped from the ‘100%’ high-temperature level obtained at the start of the experiment. We measured the induction time distribution at each chosen supersaturation at two different sample scales, 1 g and 3 g of solvent, in Crystal16 and Crystalline, respectively, for both solvents, H2O and D2O. Measurements were performed for a range of supersaturations, which were obtained by varying the solute concentration C, as shown in Table 1. The solubility C * ( T ) at the experimental temperature of T e x p = 25 C was determined as 0.3599 gSolute/gSolvent for H2O and 0.3071 gSolute/gSolvent for and D2O from Van’t Hoff fittings of the measured clear points [35,36].
Sample preparation and initial dissolution at 70 C were identical to the solubility/metastable zone experiments above. During the 30 min high temperature hold, a ‘baseline’ measurement of ‘100%’ transmissivity was recorded. Samples were then cooled to 25 C at a rate of 5 C min−1 and held at this temperature for a maximum observation time of 4 h.
For the Crystal16 experiments, all samples were subject to continuous stirring by magnetic stirrer at 700 RPM using a 1.3 mm Teflon stirrer bar added to each vial. The larger sample volume of the Crystalline device, in addition to enabling the comparison of induction times across the two different sample scales, also allows the qualitative exploration of the role of agitation because either magnetic stirring or overhead stirring can be used with this setup. For magnetic stirring, a 3 mm Teflon-coated magnetic stirrer bar was added to the sample. For overhead stirring, a short shaft three-blade down-flow impeller was inserted into each vial, and the vial was closed with a Crystalline cap, whose fitting was designed accommodate the impeller shaft while avoiding solvent escape by evaporation. Clearly, the two agitation methods produce quite different flow fields, and so this remains a qualitative exploration of how different degree and form of agitation can impact nucleation behavior in NaCl. The agitation speeds were 700 RPM for magnetic stirring (chosen to match the conditions and thus the flow fields in other systems in previous works [7,8]) and 1250 RPM for overhead stirring. For overhead stirring, tests were carried out to identify 1250 RPM as an adequate rate to ensure nucleated crystals were suspended in the agitated flow rather than sedimenting to the bottom of the vial, which was necessary for the measurement of induction time by transmissivity. Tests with pure water at up to 2200 RPM also showed that no cavitation was induced, which would also interfere with accurate transmissivity measurements.
To further clarify the potential role of agitation in nucleation, tests were also carried out under quiescent zero-agitation conditions at the 1 gSolvent scale. A bulk solution of known composition was made in a laboratory bottle, heated to 70 C, and agitated for 4 h using a hot plate to ensure dissolution. Individual aliquots of this solution with mass such that they each contained 1 g of solvent were then pipetted into individual 1.5 mL HPLC glass vials. These vials were held in an incubator at at 25 C and monitored using a webcam taking images at 5 min intervals. Supersaturations (S) of 1.01 and 1.02 were tested using both H2O and D2O. The incubator temperature during the isothermal hold was monitored using two type-K thermocouples in conjunction with an Omega HH309A data logger.

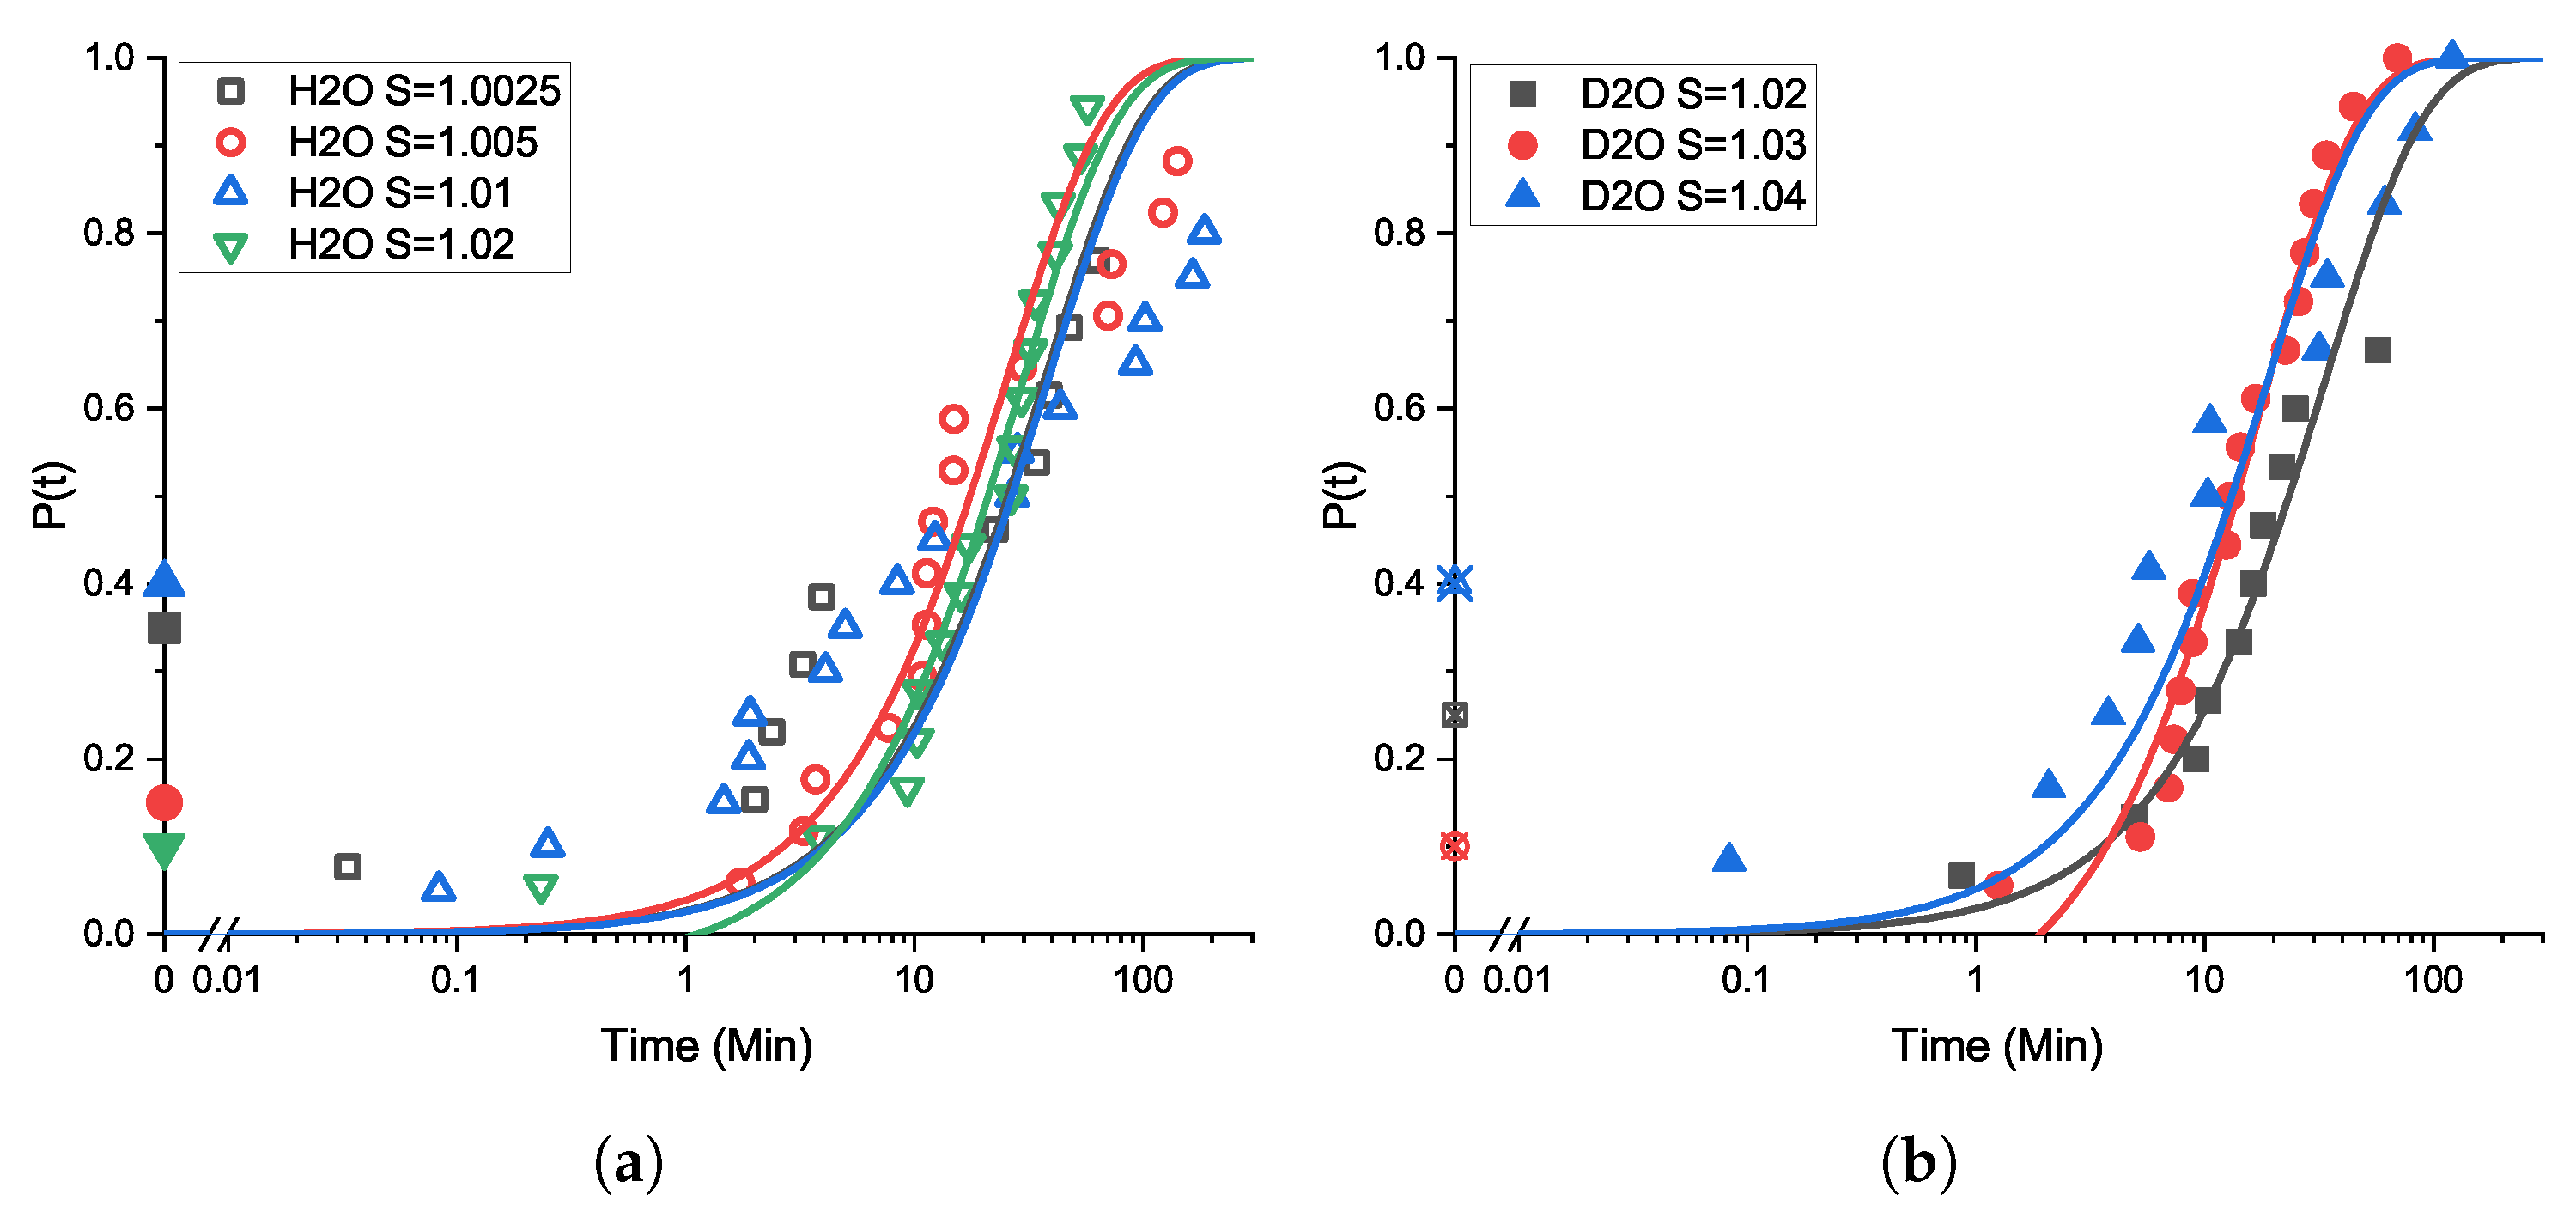
2.3. Analysis of Unseeded Induction Time Distributions: Primary Nucleation Rates

Induction time distributions are often used to estimate the primary nucleation rate ( J ) under the given conditions of sample volume, S and T e x p . A common method uses the model developed by Jiang and ter Horst [11] to fit the cumulative probability distribution ( P ( t ) ) of the induction times Equation (1):
P ( t ) = 1 e x p ( J V ( t t g ) )
where ( V ) is the volume of solution, t is time, and t g is termed the growth time, the time required for the first nucleated crystal to grow to a size required to initiate secondary nucleation and the proliferation of new crystals, which leads to the drop in transmissivity recorded as the induction time.

2.4. Seeded Crystallization

In order to characterize seeded secondary nucleation, single-seed crystals were prepared by evaporative crystallization from a saturated solution of NaCl at 20 C in H2O. The solution was initially prepared by adding NaCl powder to deionised water to give a concentration of 0.3587 gsolute/gsolvent. The mixture was heated to 25 C, held at this temperature for 30 min to ensure dissolution, and then allowed to cool down to 20 C and poured into a Petri dish placed under a fume hood. Over a period of 24–48 h, evaporation led to the formation of multiple single crystals with approximately cuboid shapes, as expected for sodium chloride (see Supplementary Figure S1 for an example microscope image of a seed). Crystals with sizes of approximately 3 mm × 3 mm × 2 mm were selected, removed from the dish, and stored for future use.
All seeded experiments were carried out at 3 gsolvent scale in the Crystalline machine, employing agitation by overhead stirring using a short shaft three-blade down-flow impeller inserted into each sample vial. Magnetic stirring was not used in seeded experiments since large attrition fragments from the mother seed crystal are often produced by collision with the magnetic stirrer bar, as shown in an example in Supplementary Figure S2; such fragments would represent the uncontrolled variation of seed conditions as well as impact measured particle size distributions used to determine crystal growth rates.
To form the required solution concentration at the experimental temperature T e x p = 25 C, the required masses of sodium chloride were added to 8 mL glass vials, into which 3 g of either water or D2O was subsequently added. Having inserted the impeller to provide agitation, vials were sealed using a standard Crystalline cap, placed into the Crystalline reactor array, and heated to a temperature of 70 C at a rate of 5 C min−1. Samples were then held at 70 C for 30 min under impeller agitation at 1250 RPM to ensure complete dissolution. Samples were then cooled to T e x p = 25 C at a rate of 5 C min−1. Once the temperature reached 25 C, agitation was interrupted, vials were briefly opened, and a single seed crystal was added to each vial. Note that immediately before their addition to the sample vial, seeds were washed via immersion into pure solvent (either water or D2O according to the solvent in the seed’s destination vial) for 10 s to remove any surface debris whose uncontrolled presence might otherwise increase the variability of secondary nucleation rates and impact the consistency of the methodology. Following the insertion of the washed seed, vials were closed and quickly returned to the Crystalline reactor. Impeller agitation was immediately restarted and continued throughout the subsequent observation period. The Crystalline device includes a separate camera focused on each sample vial, and its built-in image analysis software outputs a number of identified particles per image and a size distribution of identified particles. Thus, from images taken over time, it is possible to measure the increase in crystallite number and the change in size distribution driven by crystal growth. Images of each sample were thus recorded at 5 s intervals over a total period of 1 h. The images had a field of view of 2.86 mm by 3.81 mm.

Seeded Secondary Nucleation Rate

The seeded secondary nucleation rate, i.e., the increase in the number and concentration of crystal particles per unit time as a result of secondary nucleation triggered by the seed crystal, was measured from the count of the number of distinct particles visible in each image at each time interval provided by the built-in image analysis software of the Crystalline device. The analysis assumes that primary nucleation does not occur during the experimental time-window; otherwise, the two sources of new crystals will contribute to the total crystals observed. Hence, such seeded experiments are only carried out at supersaturations such that the probability of primary nucleation is low enough to rule it out during the measurement time window. To convert the observed particle number per image into a number concentration of particles and thus a nucleation rate in meaningful units of crystals per unit volume per unit time, the calibration of the imaging system using known concentrations of particles is required [7]. This was obtained by preparing suspensions of mono-disperse 50 µm diameter polystyrene spheres at a range of known concentrations and obtaining particle counts N from images of these samples using the Crystalline’s image analysis algorithm under the same imaging conditions as used in the experimental measurements. The particle counts can then be correlated to the known actual number concentration N ρ in each calibration sample. For the imaging conditions used in this work, we find the following relationship between N and N ρ (where N ρ is measured per mL):
N ρ = 10 + 134.33 × N + 3.98 × N 2
For a time sequence of images of a crystallizing sample, the rate of change in the observed crystal particle number concentration, obtained from the gradient of a linear fit to the particle number concentration vs. time, then provides the secondary nucleation rate. Note that only data from images with identified particle numbers within a defined band are included; this was specifically particle numbers greater than 10 and fewer than 160. The lower limit of 10, equivalent to 1750 particles/mL, was imposed to avoid measurements being influenced by noise from dust and other impurities at low particle numbers before nucleation had properly commenced. The upper limit of 160 (123,400 particles/mL) ensured that all crystals were correctly identified by the image analysis system, which was found to begin to fail at larger numbers due to the overlap of crystals in the crowded image [7].

2.5. Crystal Growth Rates

Images obtained in the Crystalline device as above were also analyzed by the built-in software to provide a particle size distribution, indicated by a histogram of the number of crystal particles imaged vs. size, using a size bin of 3 µm. Given that there is a distribution of sizes of crystallites at any given time, there is a number of ways of statistically defining a ‘typical size’. Here, we calculate from each size distribution a volume-weighted characteristic diameter D-90, which is the size such that, by volume, 90% of the identified particles are smaller than or equal to the D-90 value. As with the secondary nucleation rate analysis (Section 2.4), D-90 was calculated only for images containing more than 10 and fewer than 160 particles to account for sources of noise and the difficulties related to crowding in image analysis. An in-house MATLAB script was used to determine the D-90 values from the time sequence of size distribution data output by the Crystalline reactor, and the crystal growth rate was obtained as the gradient of a linear fit to D-90 vs. time.

3. Results and Discussion

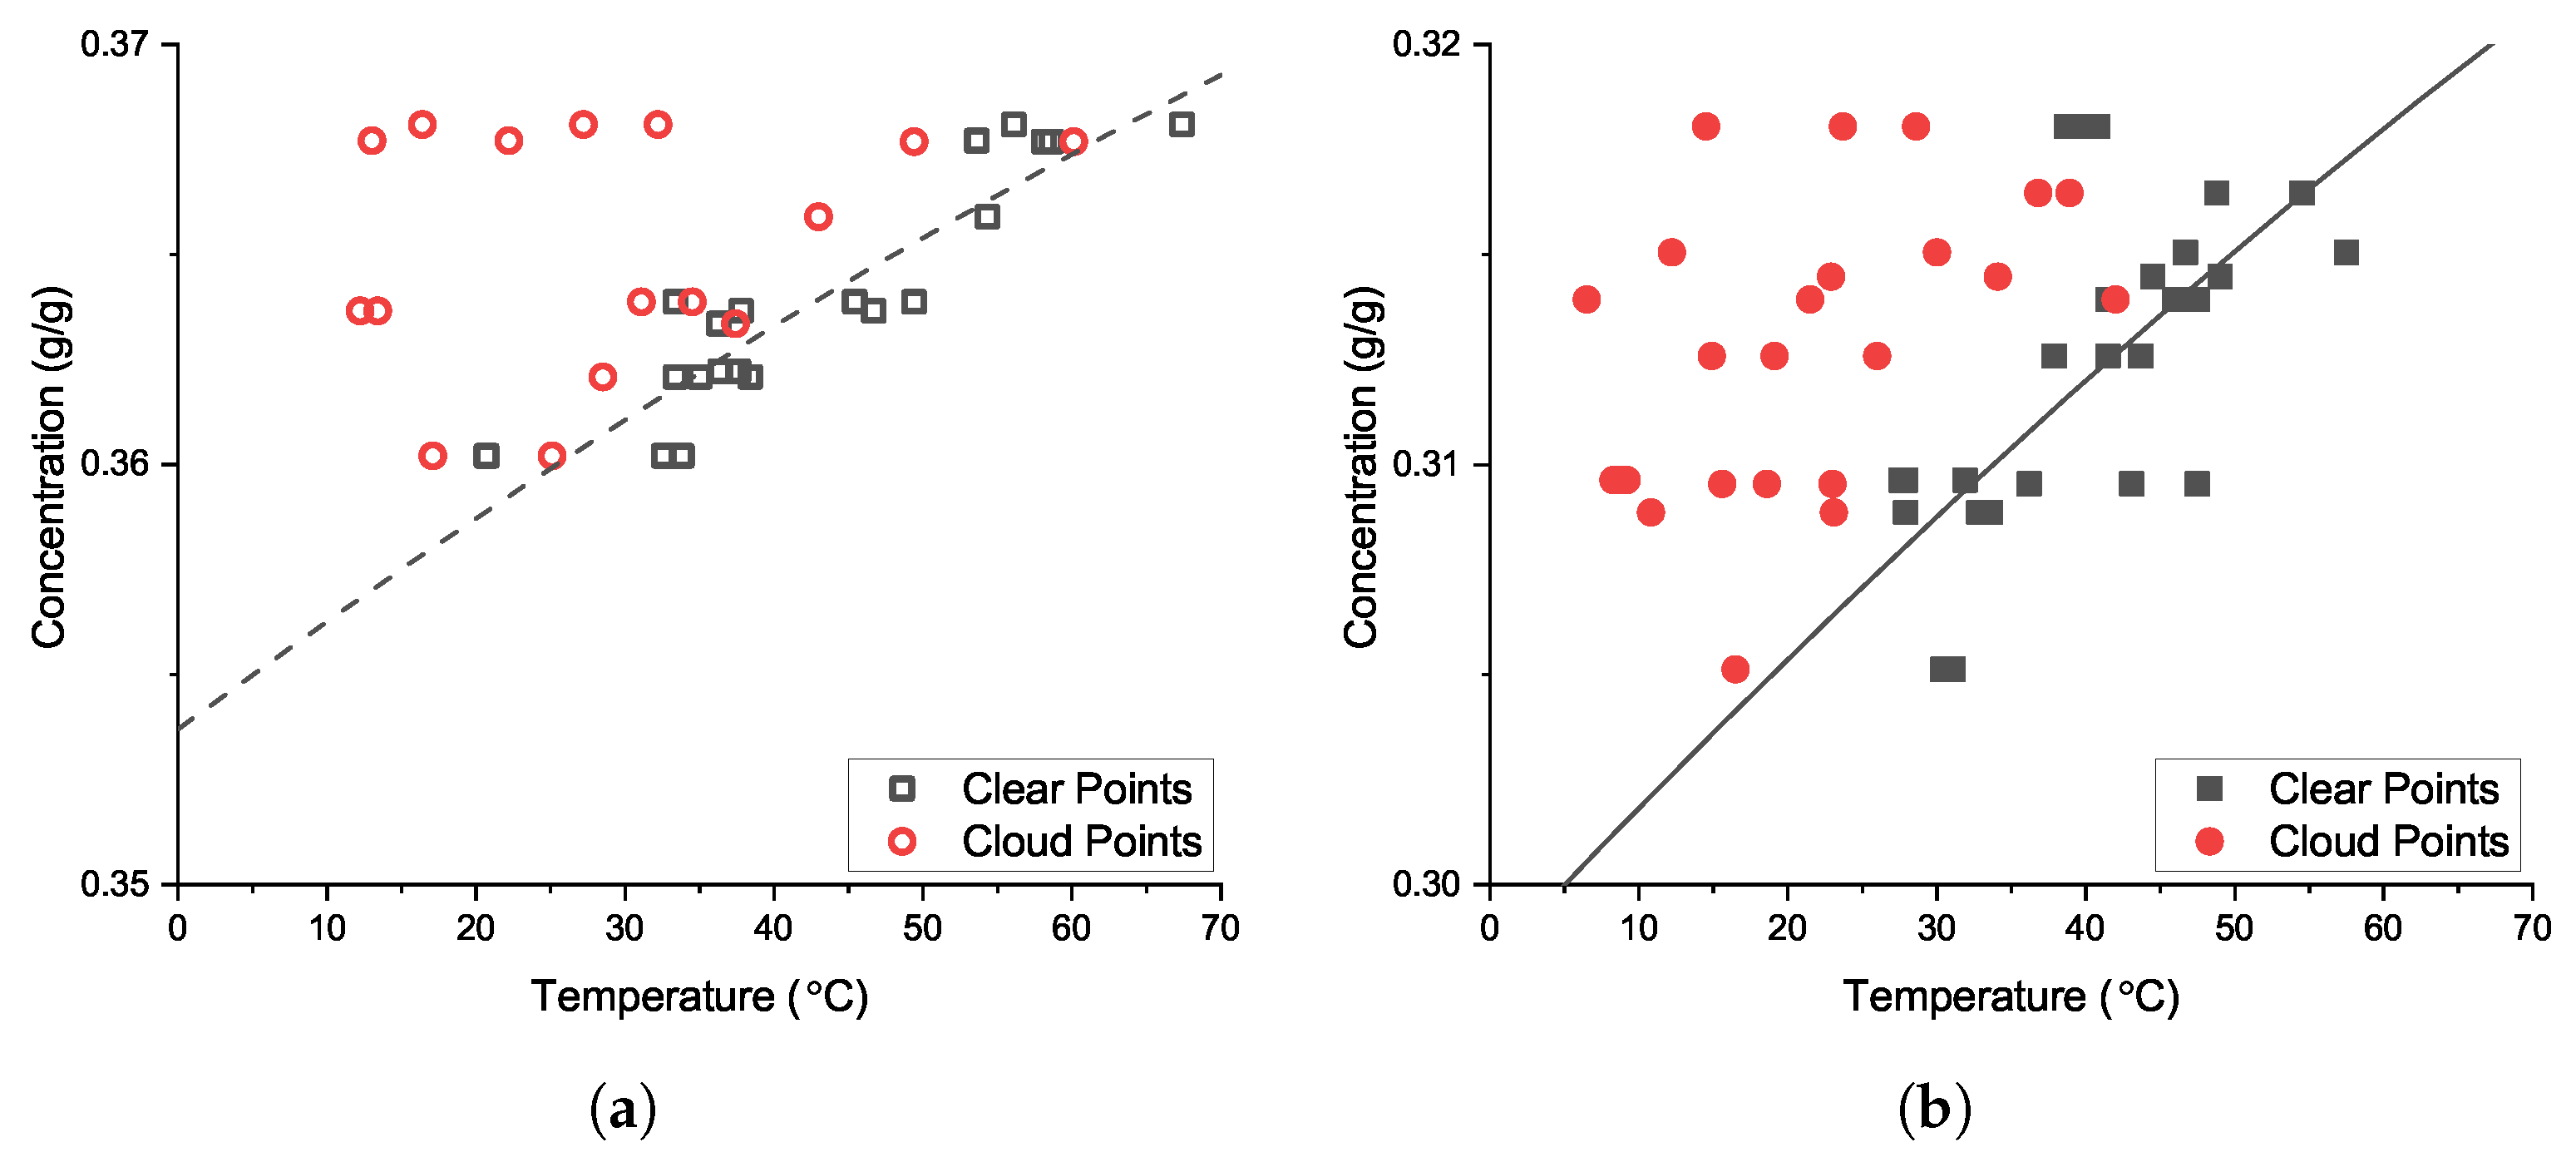
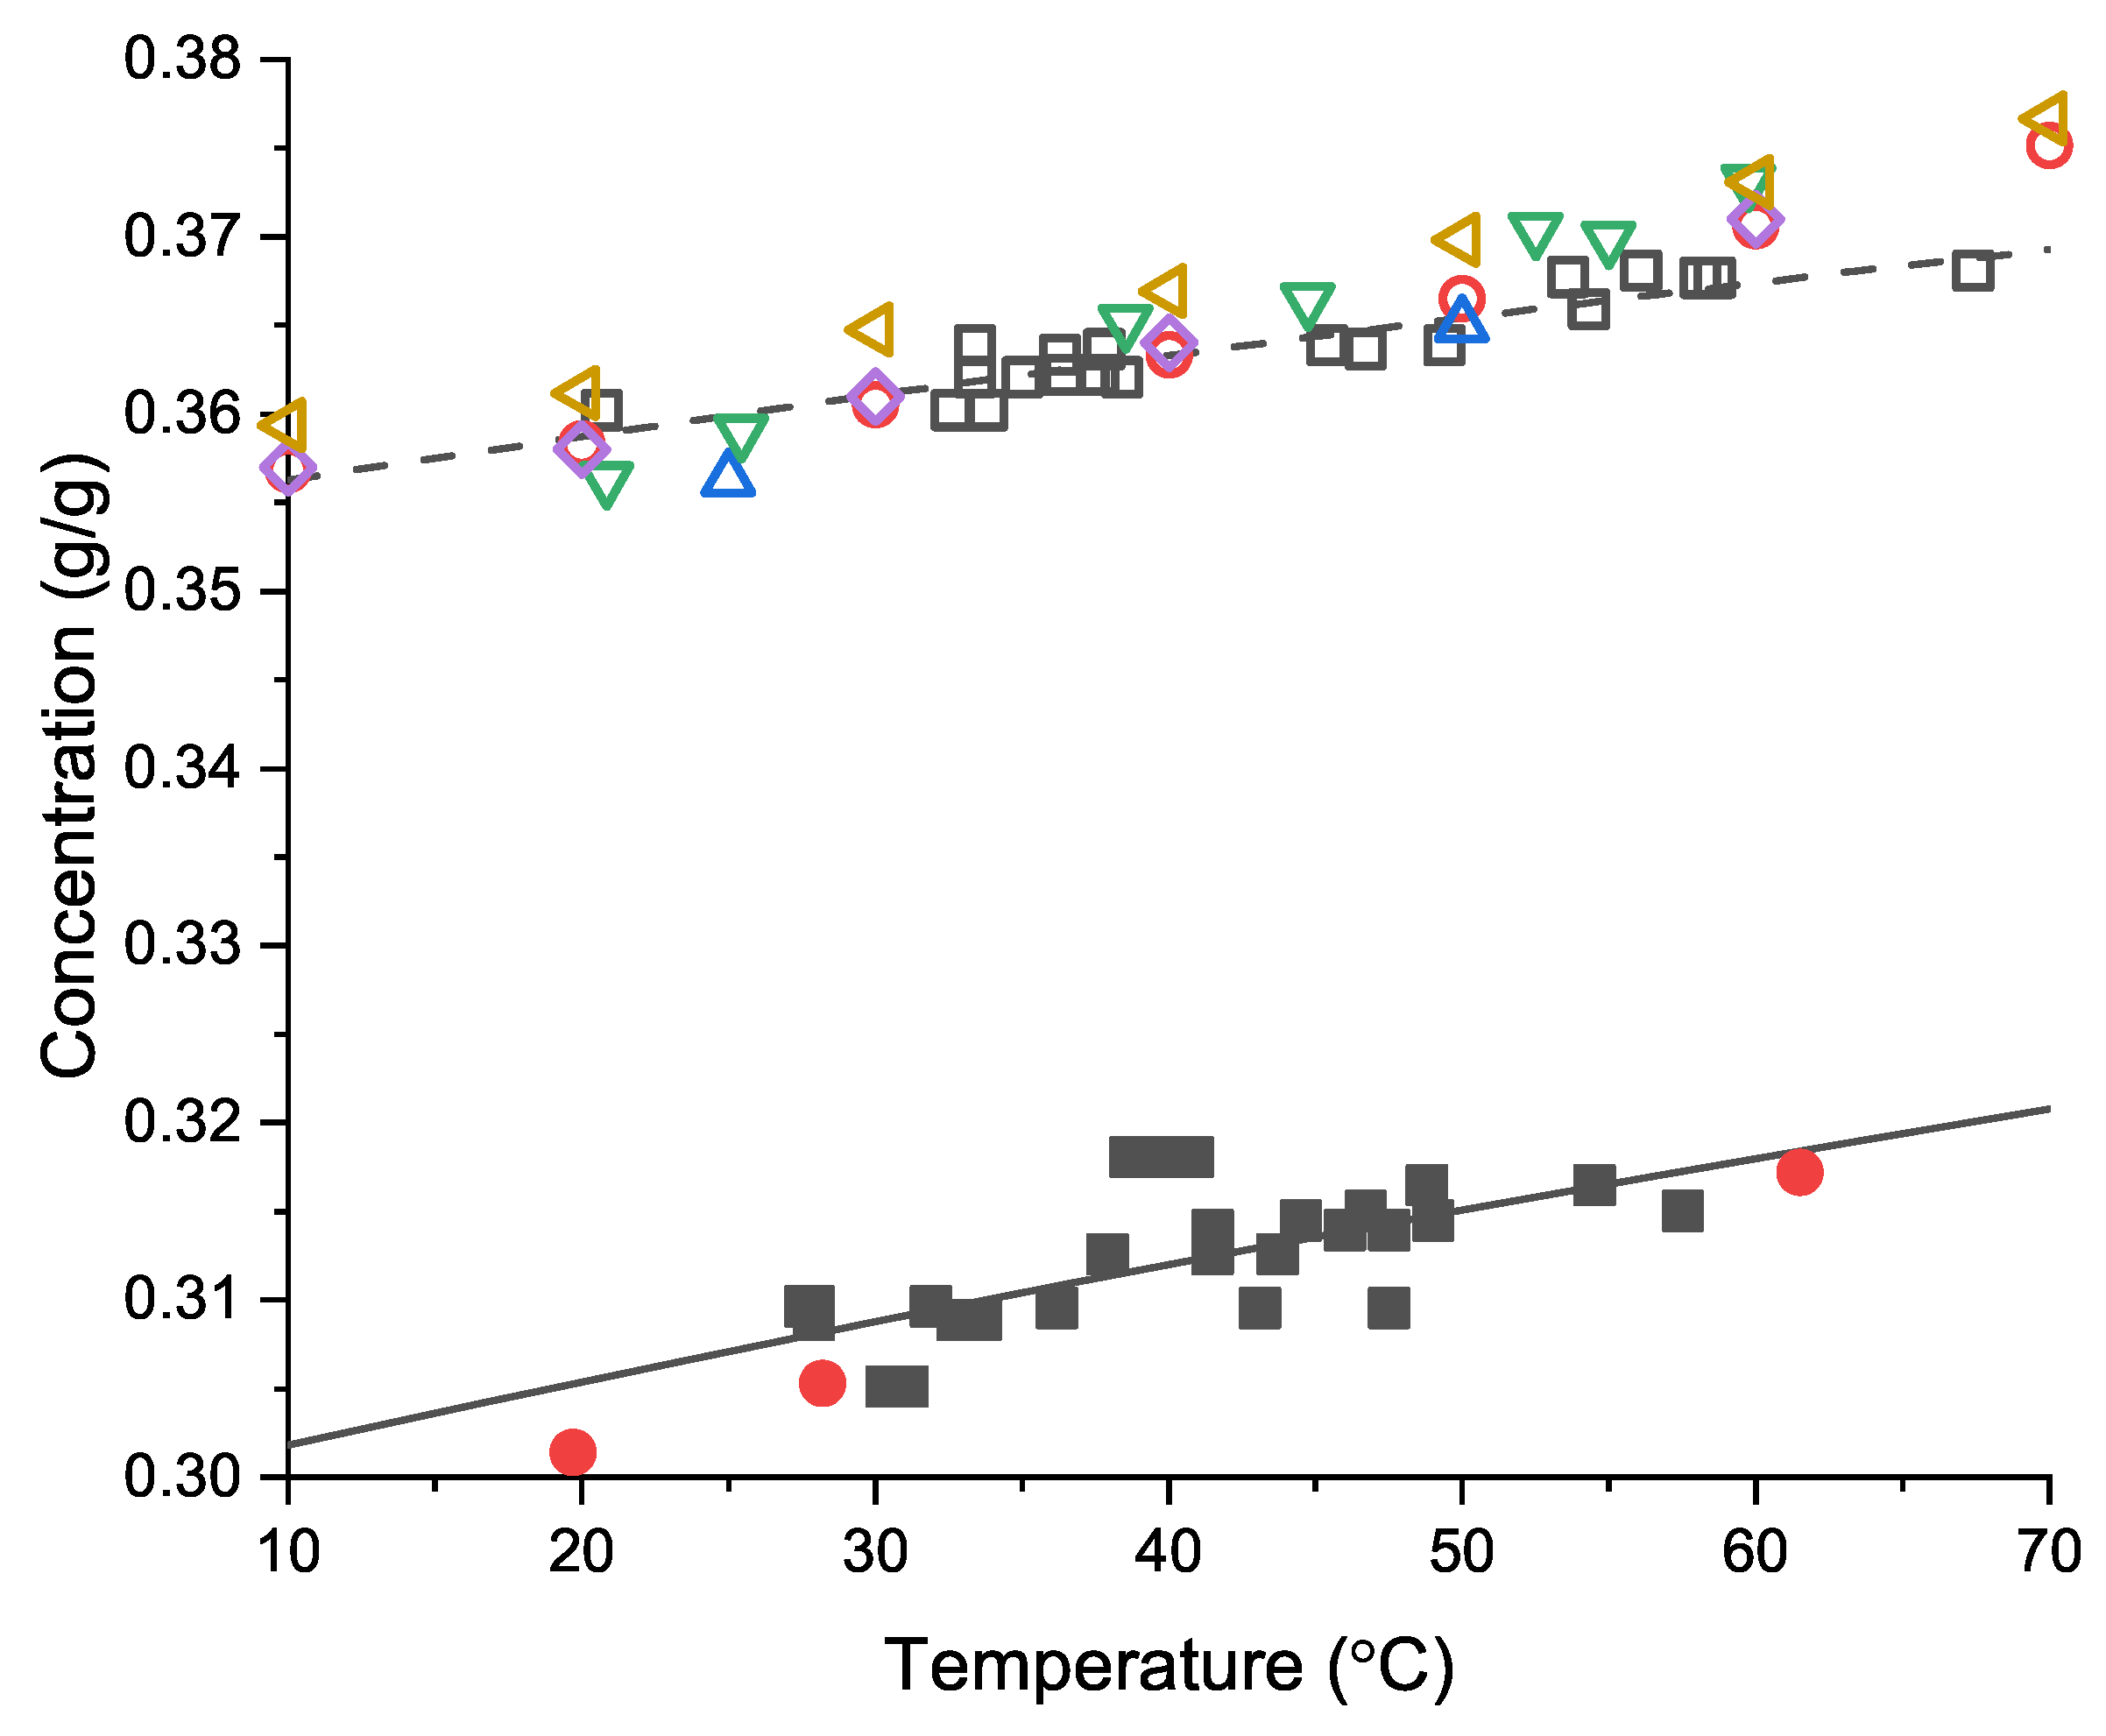
3.1. Solubility and Metastable Zone

The measured clear points and cloud points of sodium chloride in H2O and D2O are shown in Figure 1a,b. Solubility lines were obtained using Van’t Hoff fitting to the measured clear point temperatures [37]. The solubility measured here in the two isotopologue solvents is comparable with previously published data, as shown in Figure 2. In both solvents, the solubility has only a weak dependence on temperature over the temperature range examined. Comparing the two solvents (Figure 2), we can see that the solubility is reduced by approximately 15% in D2O compared to H2O, which is in agreement with the trend in other salts where a decrease in solubility is observed [29].
The metastable zone of NaCl in H2O mapped here, as indicated by the difference between clear point and cloud point temperatures at corresponding concentrations (Figure 1), is subject to considerable uncertainty due to the stochastic nature of NaCl nucleation during cooling and the limited number of samples/cycles at each concentration. Nevertheless, Yerdelen et al. [40] provided a detailed analysis of expected errors of nucleation rates estimated from limited induction time datasets, showing that meaningful estimates of primary nucleation rates can be deduced from around 10 data points. Our results are in general agreement with limited previous measurements (most previously existing data are at the higher end of the range of concentrations tested here [41,42]). To our knowledge, there are no previously published measurements of the metastable zone for NaCl in D2O, ruling out any comparison with our results.

3.2. Induction Time Distributions: Effect of Agitation

Cumulative probability distributions P ( t ) of induction times from Crystal16 samples at a 1 gsolvent scale and Crystalline samples at a 3 gsolvent scale in H2O and D2O, all agitated by a magnetic stirrer, are shown in Figure 3 and Figure 4. For each supersaturation, data were collected from a total of 20 sample vials. Here, P ( t ) is the proportion of samples in which nucleation has taken place at time t, where t = 0 is the time at which the sample reaches the experimental temperature of 25 C. (Note that at the 1 gsolvent scale, as seen in Figure 3, we are unable to compare H2O and D2O across the same full range of S because at S < 1.02 in D2O, nucleation at this scale is too slow to give any data in the experimental time window of 4 h, while at S > 1.02 in H2O, nucleation at this scale is too fast, so induction times are too short to resolve and all samples nucleate before reaching isothermal conditions; see below).
To explore the role of agitation, cumulative probability distributions of induction time with overhead stirrer agitation are shown in Figure 5. Compared to magnetic stirring, the number of vials showing nucleation within the four-hour observation window decreases substantially, and for those individual vials where nucleation does occur, observed induction times are much longer. While the agitation involved here cannot be simply described in terms of a well-defined shear rate, it is observationally clear that the magnetic stirrer method represents the most intense strain/strain rate field and results in the shortest typical induction times, which is qualitatively consistent with the dependence of nucleation on shear flow effects as studied in other systems [20,21,22,43,44].
Under magnetic stirring, induction times are generally shorter for H2O compared to D2O. For overhead stirring, there is some evidence that, in contrast, induction times are shorter in D2O, as a greater proportion of vials at S = 1.01 and S = 1.02 were nucleated by the end of the experimental time window.
Experiments were also carried out under quiescent conditions, i.e., with zero agitation. For each solvent, a total of 22 samples at the 1 gsolvent scale was observed in an incubator by webcam for 12 h under isothermal conditions at 25 C. (Note that samples in the quiescent experiments did not include magnetic stirrer bars, but we have seen no evidence across the experimental work that the presence of stirrers triggers heterogeneous nucleation at the supersaturations studied here.) At neither examined supersaturation (S = 1.01 and S = 1.02) was any nucleation of crystals observed in any sample for either solvent over the full observation duration of 12 h.

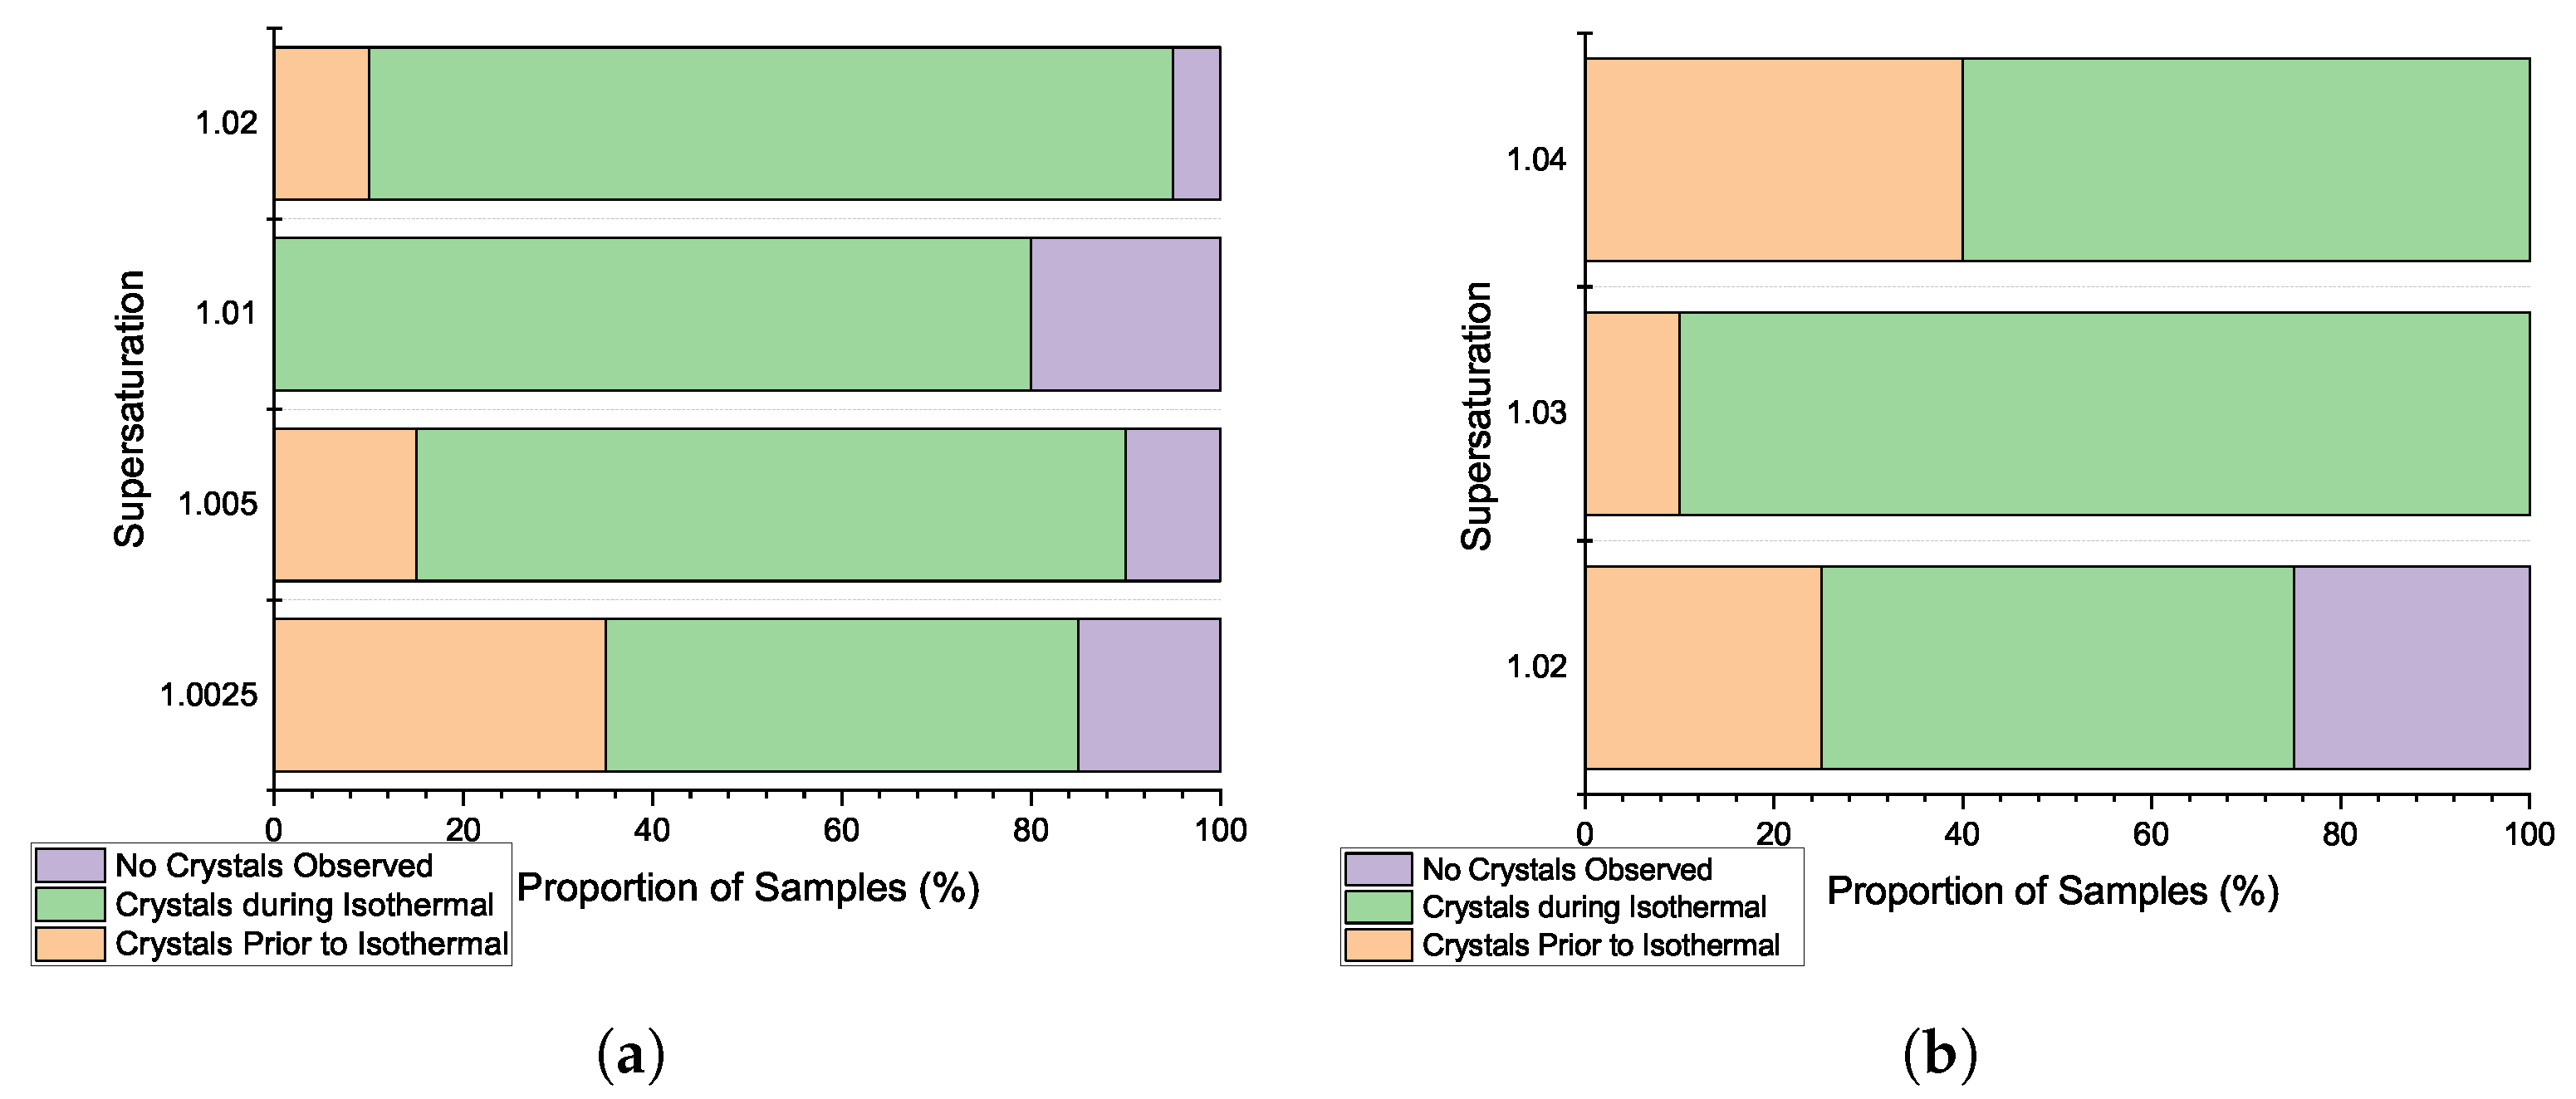
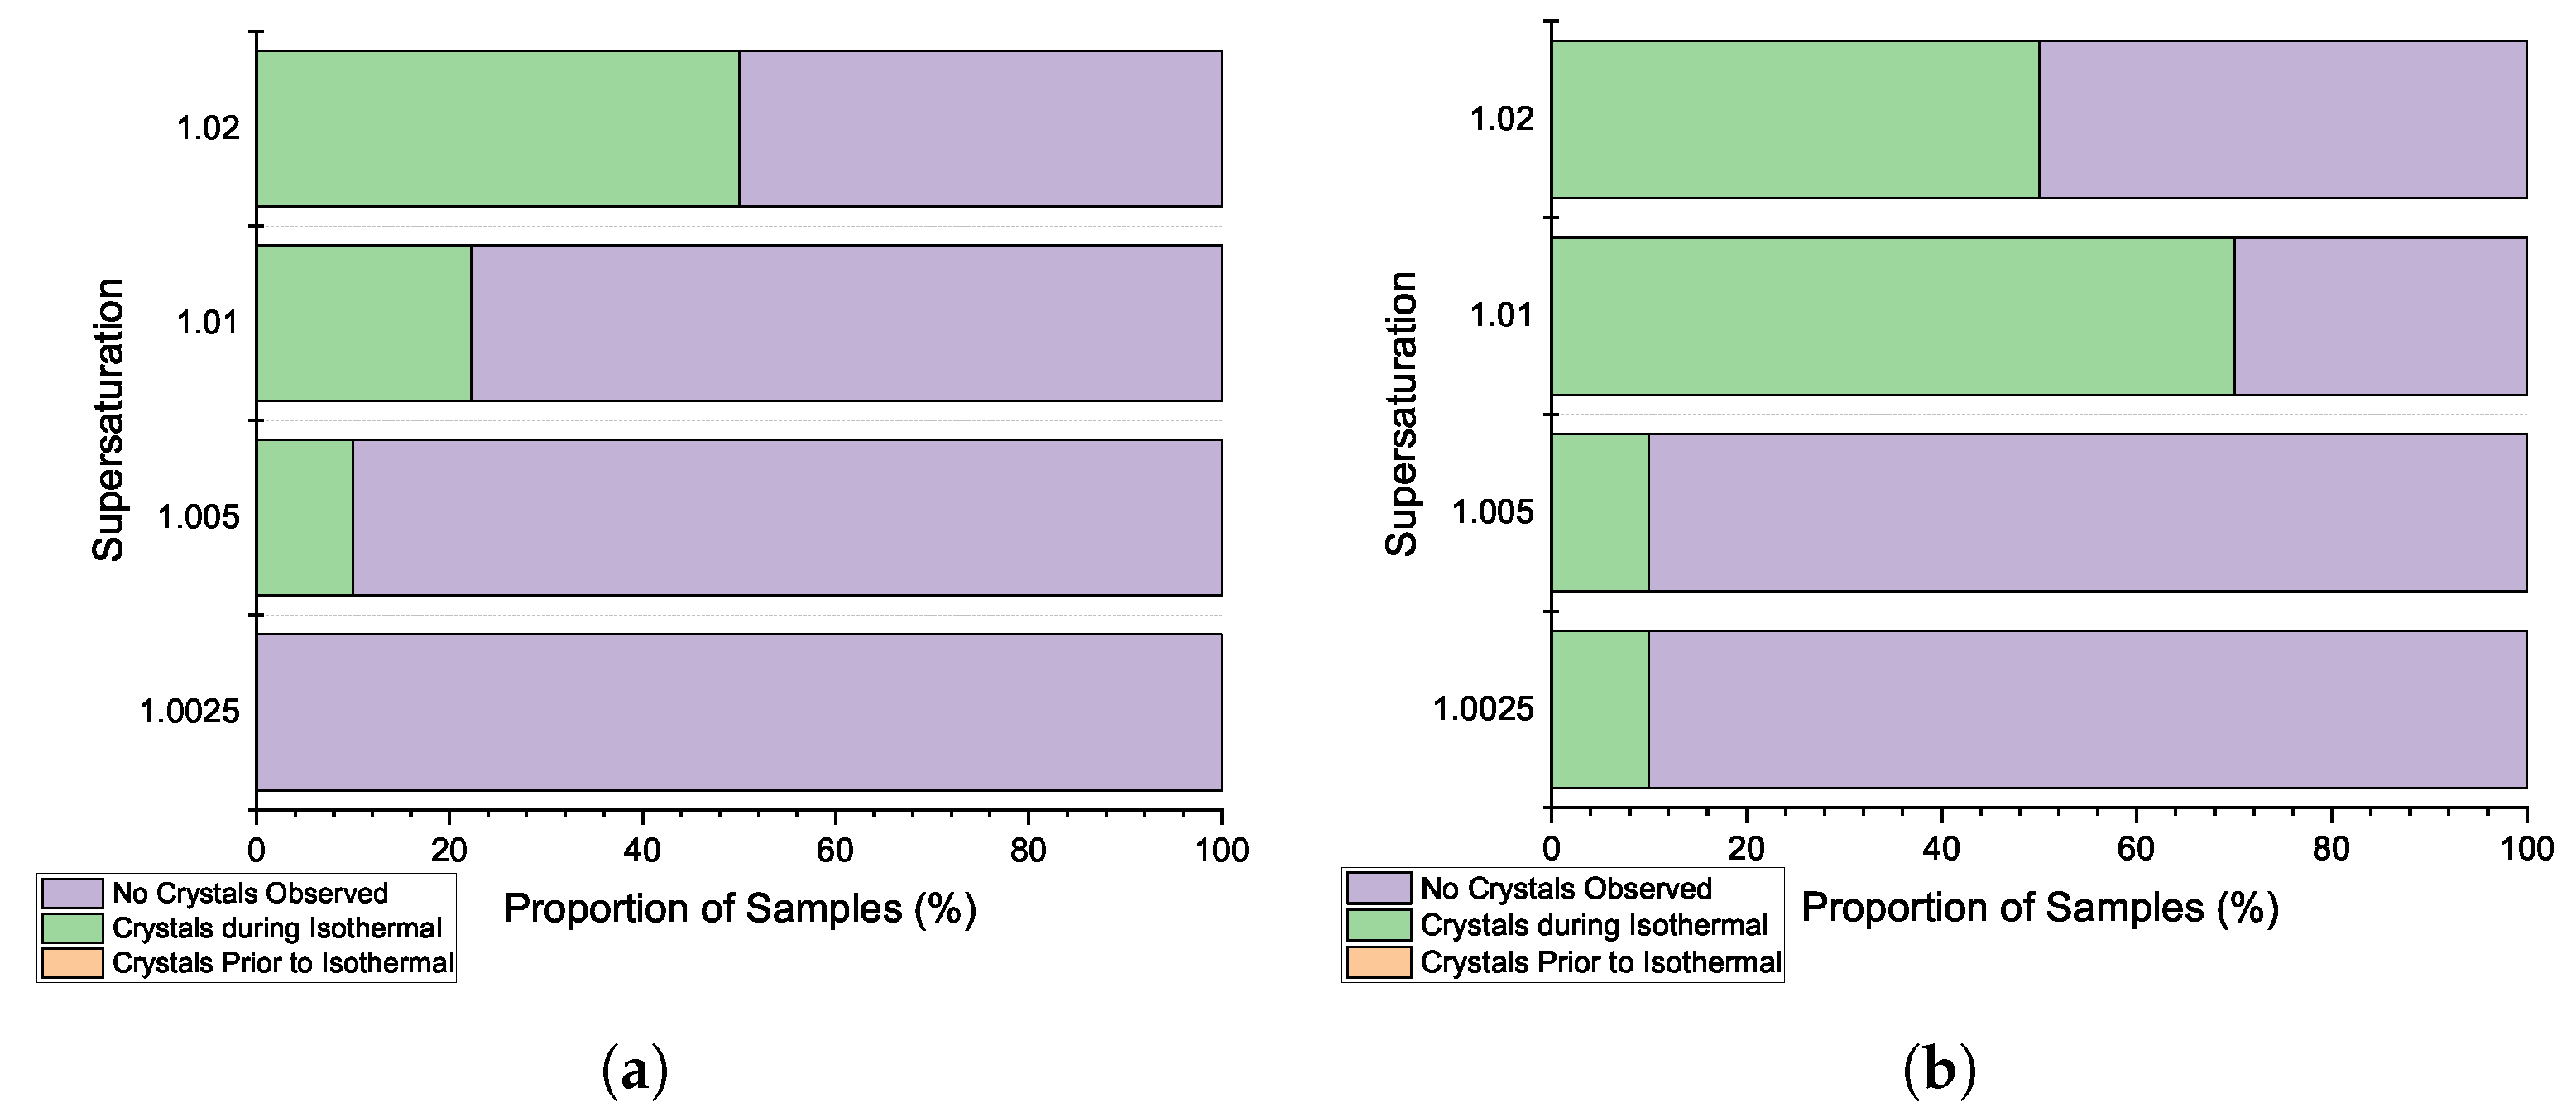
3.3. Induction Time Distributions: Pre-Isothermal Nucleation

As can be seen in Figure 3, for induction times at all supersaturations, we observe that some proportion of samples at the 1 gsolvent scale had nucleated during the temperature quench before the sample reached isothermal conditions at 25 C. The non-zero likelihood of nucleation during the temperature quench is a consequence of the weak dependence of solubility on temperature; there is potentially a substantial time t q during the temperature quench between crossing the solubility line into the saturated region and the sample reaching the experimental temperature of 25 C/the defined experimental supersaturation (Table 1). While the total time taken to quench from the dissolution temperature 70 C to the experimental temperature 25 C is the same for all samples, due to the slope of the solubility line, the proportion of this time spent above the solubility line increases with increasing sample concentration and thus increasing S. For example, given the starting and finishing temperatures and the cooling rate of 5 C min−1, we estimate from the experimental solubility curve that t q 3 min for S = 1.01 , which more than doubles to t q 7 min for S = 1.02 in H2O. Hence, samples prepared at higher solute concentrations spend a larger proportion of the temperature quench in conditions where nucleation could occur before reaching the experimental temperature. In the NaCl system, therefore, with its weak dependence of solubility on temperature, obtaining truly isothermal nucleation conditions by these methods presents significant challenges.
The proportion of pre-isothermal nucleations is lower with overhead stirring, again demonstrating the strong dependence of nucleation kinetics on agitation. The qualitative comparison of results from the two sample scales, for example at S = 1.02, demonstrates the impact of system size on the observed induction time and on pre-isothermal nucleation. For both H2O and D2O, increasing the sample volume shifts the induction time distribution to shorter times; for example, at S = 1.02 in D2O, we observe a rapid rise in P ( t ) at t 1 minute at the 3 g solvent scale (Figure 4) compared to t 10 min at the 1 g solvent scale (Figure 3). For a given nucleation rate per unit volume per unit time, increasing the total solution volume gives a greater absolute likelihood of nucleation occurring in the sample as a whole over a fixed time period. However, linked to this, the number of samples showing pre-isothermal nucleation during the temperature quench generally increases at the 3 g solvent scale, most notably for the higher supersaturations. For example, 90% of samples in H2O at S = 1.02 at the 3 g solvent scale nucleated during the quench compared to 10% at the 1 g solvent scale. The issues raised by pre-isothermal nucleation thus become more substantial as sample volume and overall nucleation probability per sample volume increases.

3.4. Primary Nucleation

As described above, nucleation and growth models are typically fitted to induction time distributions to obtain a quantitative nucleation rate. Prior to this analysis, in the light of the pre-isothermal nucleation issue described above, a simple way to initially and semi-quantitatively assess nucleation probability without dependence on any model is to compare, for the different experimental conditions, the proportions of samples in which crystals are observed before t = 0 (i.e., pre-isothermal nucleation), the proportion in which crystals are observed during the isothermal experimental time window ( t = 240 min), and the proportion which show no evidence of crystallization by the end of the experiment (Figure 6, Figure 7 and Figure 8). These plots demonstrate qualitatively how the appearance of crystals becomes generally more likely with increasing S and, at a given S, with increasing sample volume (compare, for example, Figure 6a and Figure 7a), although there is an unsurprising stochastic variation given the stochastic nature of primary nucleation. The very significant effect of increasing strength of agitation is striking (compare overhead stirring in Figure 8 with magnetic stirring in Figure 7) [20,21,22,23]. The plots also show qualitatively that crystallization behavior does not differ enormously in the two solvents for a given S, but there is some evidence of decreased nucleation probabilities in D2O: for the 1 gsolvent scale, as mentioned above, crystallization was not observed below S = 1.02 in D2O; hence, Figure 6 can compare the two solvents only at S = 1.02, while the proportion of samples showing pre-isothermal crystallization at the larger 3 gsolvent scale with magnetic stirring (Figure 7) is consistently lower in D2O (at an equivalent S).
For other systems using similar experimental methodologies [7,8], quantitative primary nucleation rates have been determined from induction time distributions P ( t ) by fitting the model introduced by Jiang and ter Horst [11]. Here, we have carried out a similar fitting where the available data allows it, but we will be careful to term the obtained fit parameters apparent nucleation rates and growth times because there are various issues with the model when applied to this system. Nevertheless, we do fit the model in order to illustrate some of these points. Fitted curves are shown with the P ( t ) data in Figure 3, Figure 4 and Figure 5. Note that given the issues regarding pre-isothermal nucleation, the samples that show crystallization prior to isothermal conditions being reached are excluded from P ( t ) . The obtained fit parameters J (apparent primary nucleation rate) and t g (apparent growth time) are listed in Table 2. Apparent primary nucleation rates are plotted vs. supersaturation S in Figure 9. If we take the outcome of the fitting procedure to P ( t ) at face value, we find that the apparent primary nucleation rate does not strongly depend on S (possibly apart from the case of D2O at a 3 gsolvent scale under magnetic stirring). This is difficult to explain and indicates that caution is required when interpreting the obtained fits and rates. There is, of course, the issue of the intrinsic stochasticity of nucleation, meaning that a relatively small number of samples will always imply statistical uncertainty [40]. However, there are, moreover, issues with how the model of Jiang and ter Horst [11] is applied to the data in this system.
Firstly, the Jiang and ter Horst model assumes that nucleation events are Poisson-distributed in time: stochastic nucleation events occur with a given defined probability independently in each sample. It is possible here that the nucleation events/induction times included in the fitted distributions are not Poisson-distributed. Because we include only data from samples not yet showing crystallization at t = 0 , these are potentially drawn from a biased distribution that is conditional on some unknown, underlying reason why this subset of samples are ‘slow’ nucleators. (Including the pre-isothermal nucleating samples in the P ( t ) is not possible since we do not then have a meaningful isothermal ‘time zero’ from which to measure induction times).
Secondly, it may be that some or all of those samples not apparently nucleated prior to t = 0 actually do include nuclei, but the nuclei are not yet observable because they are subject to slower growth than samples where pre-isothermal nucleation is seen. The measured ‘induction time’ distribution would then indicate not nucleation but the distribution of times taken for nuclei to grow large enough to lead to observable nucleation. The Jiang and ter Horst model assumes a single growth time t g that applies to all samples once nucleation has occurred, indicating the time taken for crystallization to become detectable, usually assumed to be the time taken for the nucleus to grow to a size necessary to trigger the proliferation of crystals by secondary nucleation. If growth rates/growth times vary from sample to sample, it is much less clear how we might expect such growth-limited ‘induction times’ to be distributed across samples. The development and validation of a more advanced model including both a distribution of nucleation times and a distribution of growth times would be an interesting challenge to address in future work.
As a ‘sanity check’ on the fitted nucleation rates, we might turn to previously published data for comparison. However, most previous experimental reports of primary nucleation rates for NaCl in H2O have been at much higher supersaturations than those used here [45,46,47] and unsurprisingly show rates some orders of magnitude higher than the apparent rates at our lower S. Attempts to use our methodology at higher S failed because all samples showed crystallization before reaching isothermal conditions, consistent with the significantly increased nucleation probability at higher S. Sample scale and agitation differences also make comparison difficult: the cited previous results were typically achieved using extremely small volumes and under quiescent conditions, for example, in microcapillaries or microdroplets. Such conditions make it significantly more possible to study high S because, as we have seen above, a lack of agitation slows down nucleation significantly, and since the probability of nucleation occurring per sample volume increases with sample volume, so does the use of very small volumes such as microdroplets means individual nucleation events within the sample volume become rare enough to enable examination, even though the nucleation rate per unit volume is expected to be high at higher S. Other estimates from molecular dynamics simulations [48,49,50,51] are even less straightforwardly comparable to our experiments, especially given the sensitivity to agitation conditions. These comparisons underline how obtaining consistent comparable data requires the use of comparable conditions such as typical volume and agitation, and none of the methods used previously nor our method are without their challenges in the NaCl system, despite its apparent simplicity.

3.5. Secondary Nucleation

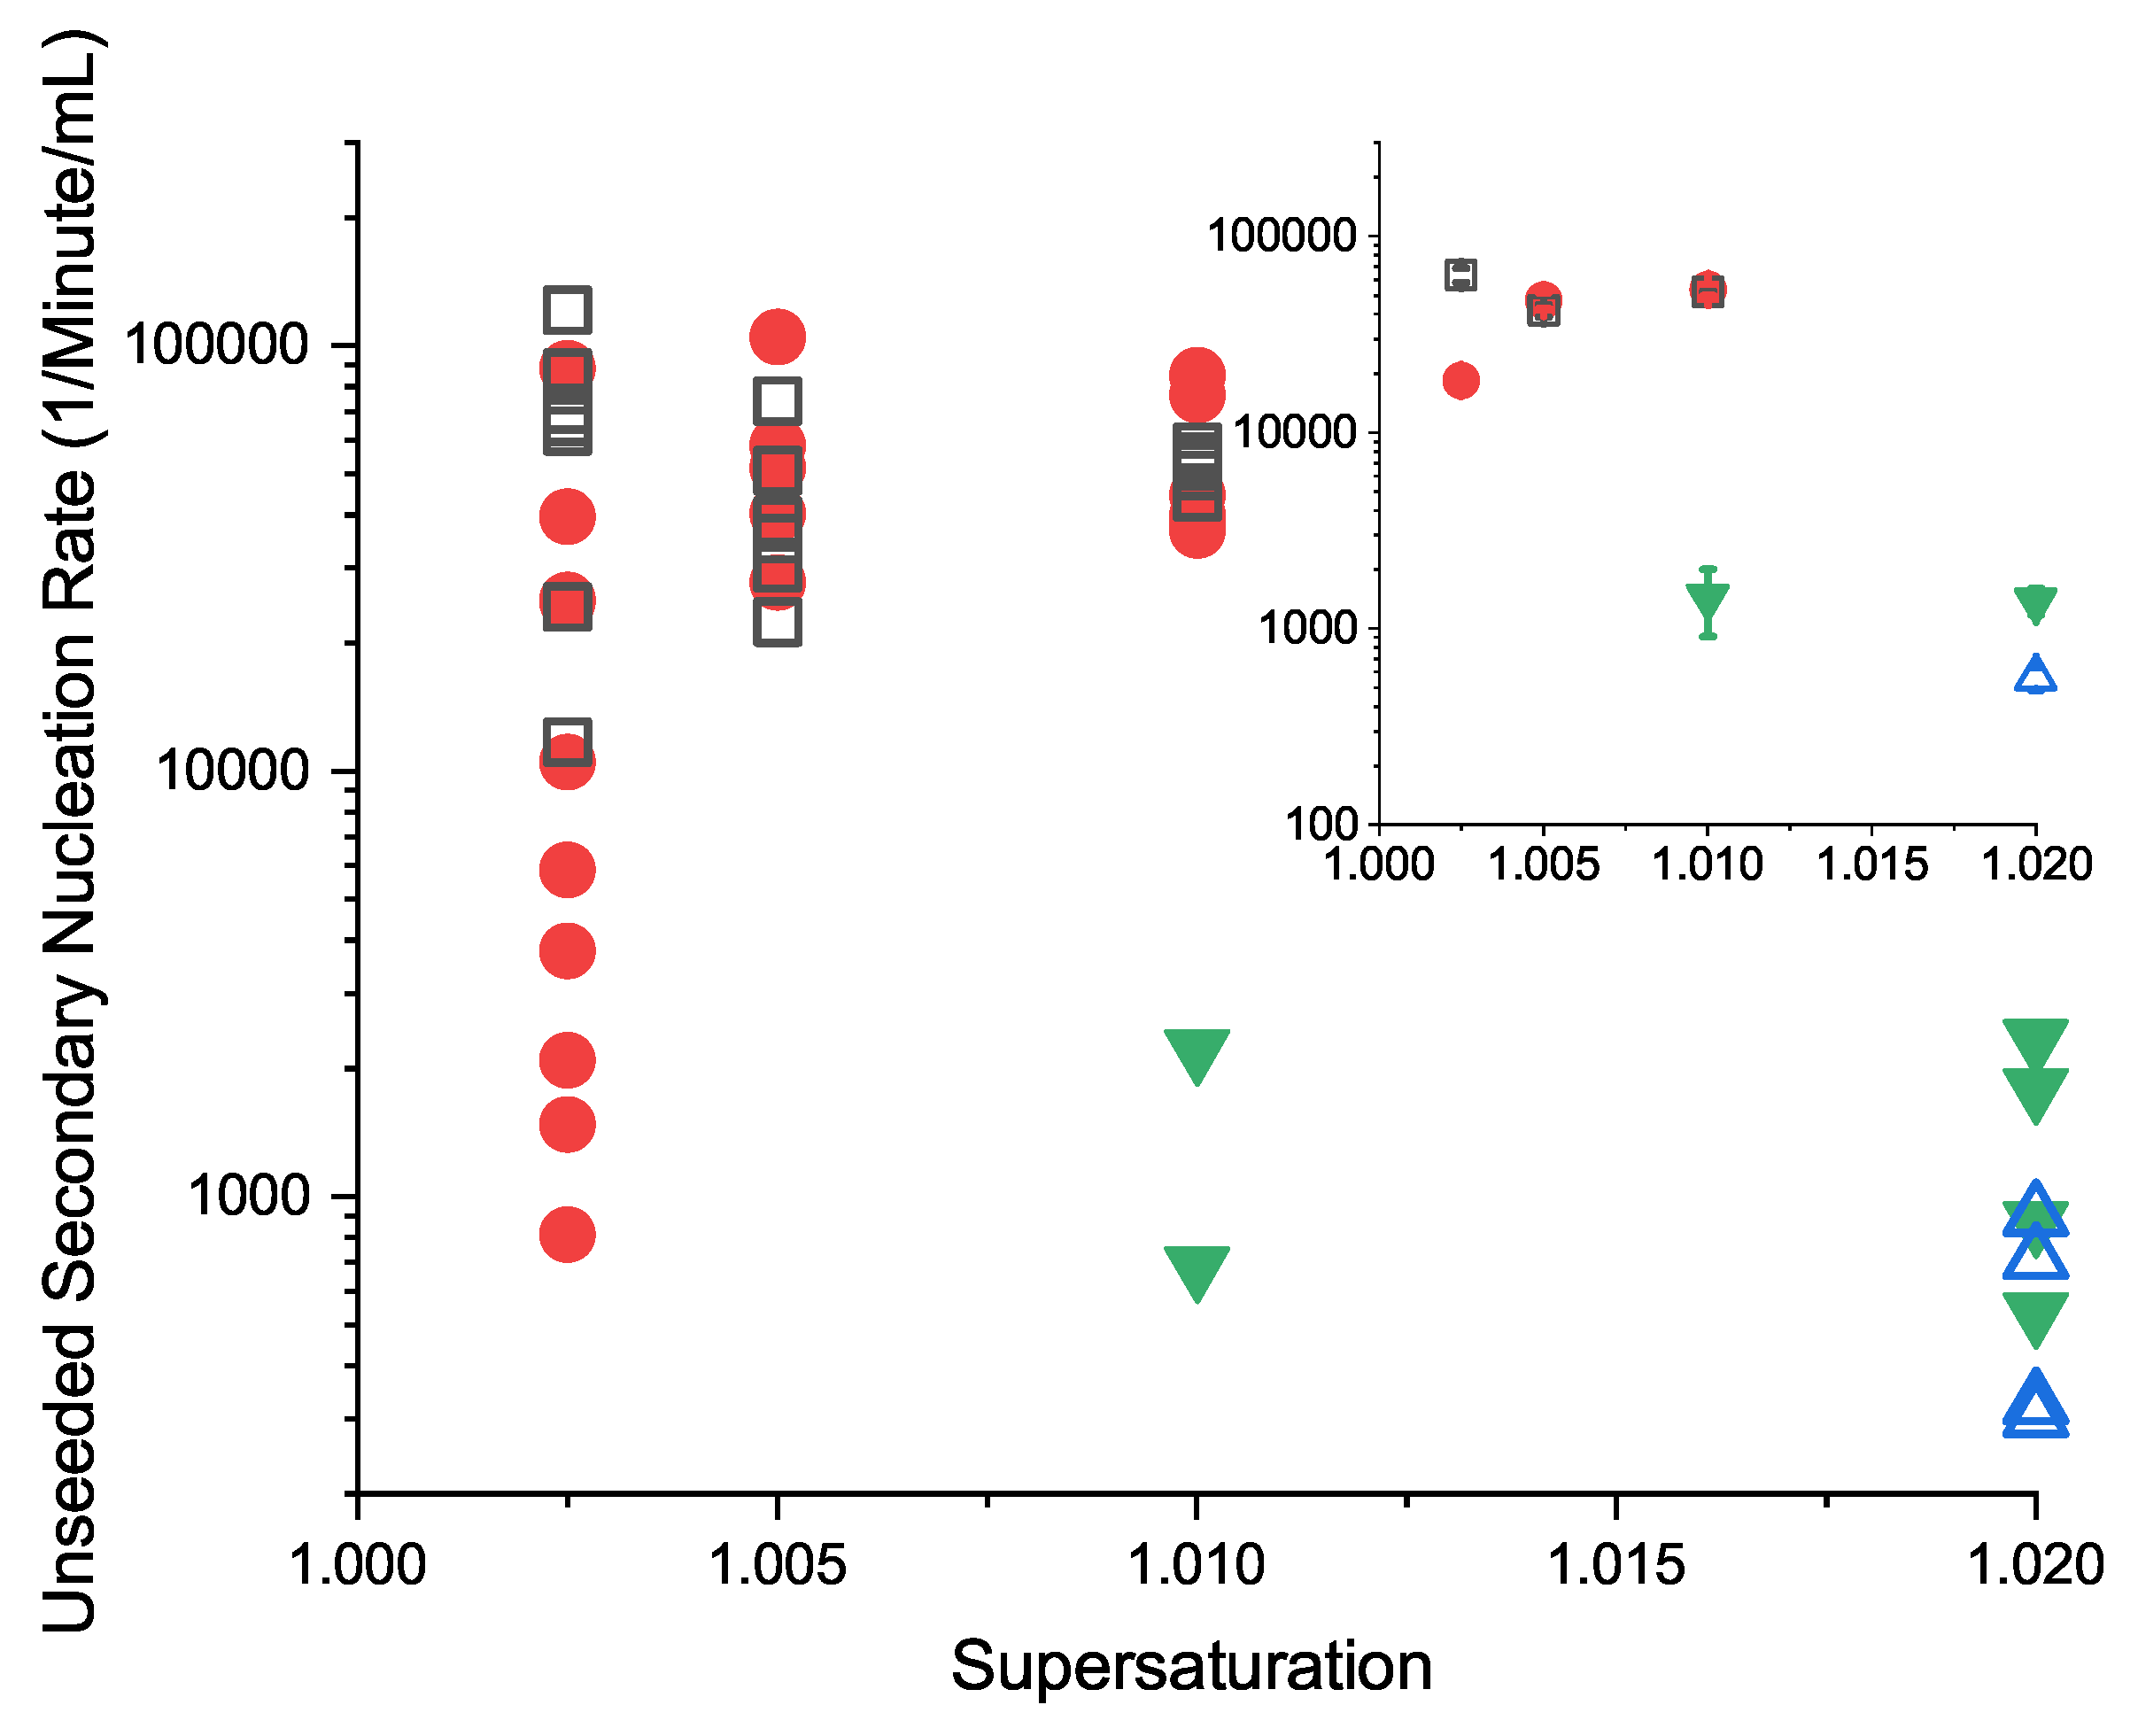
3.5.1. Unseeded Secondary Nucleation Rates

Figure 10 shows estimated unseeded secondary nucleation rates vs. S in H2O and D2O under magnetic stirrer and overhead stirrer agitation obtained from linear fits to the rate of increase in the number of crystals as observed via the Crystalline device’s built-in cameras and converted to number densities using the calibration as described above. Multiple independent experiments were carried out at each S, and each point corresponds to a single experiment. Because this secondary nucleation measure depends on crystal counting rather than fitting an induction time distribution from multiple samples, it does not suffer from the same fitting assumptions and interpretation issues as the primary nucleation estimates above. However, the unseeded secondary nucleation rate can obviously only be estimated from experiments where primary nucleation, as the initial source of secondary nuclei, takes place within the experimental duration and where the proliferation of crystals takes place within the isothermal period. Hence, under some conditions, especially with gentler overhead stirring agitation, estimates of unseeded secondary nucleation are unavailable due to a lack of primary nucleation, while additionally, the rates reported only apply to those samples where crystallization was not observed before t = 0 at the start of the isothermal period.
The type/strength of agitation has a significant effect on unseeded secondary nucleation rate, with overhead stirring generating secondary nucleation rates typically almost two orders of magnitude lower, consistent with a previous examination of NaCl [52]. (In [52], the solute was crystallized by passing hot solution through a hollow fiber cooling crystallizer, which did not straightforwardly allow the distinction between primary and secondary nucleation. However, since the rate of secondary nucleation is typically much faster than primary nucleation [18], due to the first primary nucleus giving rise to new secondary nuclei on a timescale much shorter than the rate of appearance of further primary nuclei, the experiments in [52] may be considered to involve unseeded secondary nucleation).
There is some evidence from our measurements that unseeded secondary nucleation rates are higher for NaCl in D2O compared to H2O. Nevertheless, the variability in rates at the lowest supersaturation with the magnetic stirrer (where repeat experiments in D2O generate rates that themselves span two orders of magnitude) and the very low rates in both solvents with the overhead stirrer (such that at the lowest supersaturations, no nucleation is observed in the 4 h experimental time duration) make it challenging to draw firm comparisons between solvents from these measurements.
Furthermore, for both H2O and D2O, at the highest supersaturation explored ( S = 1.02 ), when magnetic stirring is employed, a significant degree of agglomeration of crystallites is observed on inspection of individual images. Hence, secondary nucleation rates could not be reliably estimated from our image analysis. This is consistent with the increasing rate of agglomeration with increasing supersaturation reported in [53]. For other conditions in Figure 10 (lower supersaturation and under overhead stirring agitation), such agglomeration was not observed.

3.5.2. Seeded Secondary Nucleation Rates

Figure 11 shows estimates of the secondary nucleation rate in seeded samples as a function of supersaturation. As described above, in seeded experiments, solutions are fully dissolved at high temperatures and subjected to a single quench to a lower experimental temperature prior to adding the seed crystal. Once the experimental temperature is reached, a single washed seed is added to each vial, and a single experimental measurement is obtained. Additionally, Figure 11 shows results using only overhead stirring due to the potential for the added seed to be impacted and broken up by the use of magnetic stirrer bar (see Section 2.4). Indeed, the potential for such mechanical attrition effects may be especially severe here (compared to, for example, organic crystals) because of the brittle nature of ionic solids generally [54]. Using overhead stirring also allows a focus on fluid shear as the trigger of secondary nucleation, ruling out attrition [44]. Again, rates are obtained from a linear fit to the crystal count measured by the Crystalline device’s built-in cameras and image processing software, which are calibrated to obtain a number density as described above.
At a given supersaturation, the seeded secondary nucleation rate is higher in D2O compared to H2O, which is consistent with general trends from unseeded secondary nucleation rate measurements (Figure 10). As demonstrated by the fits in the inset of Figure 11, the seeded secondary nucleation rate shows evidence of increasing approximately linearly with supersaturation in both H2O and D2O. Previous authors have discussed the possibility of a so-called secondary nucleation threshold (SNT) supersaturation, below which secondary nucleation does not occur, which would be indicated by such a linear trend intercepting the horizontal (nucleation rate zero) at a supersaturation S > 1.0 [7,55]. However, detecting a small number of secondary nuclei in a small imaged section of an already small sample volume within a finite experimental time window has obvious limitations, and care must be taken before concluding that there is really some critical level below which no secondary nucleation can occur as opposed to simply a very low but non-zero rate of secondary nucleation being present. Cashmore et al. [8] argued that the observation of an apparent SNT could be due to experimental limitations as the rate of secondary nucleation becomes very small, showing that when data from glycine experiments are plotted on log scales, it becomes clear that the secondary nucleation rate is better represented by a power law relation with S 1 , the relative supersaturation. Our data here are insufficient to draw more quantitative conclusions in the NaCl system, so at this stage, we present linear fits in Figure 11 purely as a semi-quantitative way of illustrating the impact of S on the seeded secondary nucleation rate.
A comparison of the average secondary nucleation rates measured under different agitation and seeded/unseeded conditions is shown in Figure 12. Also shown for comparison are the measures from Ref. [52] (see the note above about the methodology behind this source). Other sources also report the secondary nucleation rate but typically have used very different conditions, such as evaporative crystallization [56] or a fluidized bed [57], so for clarity, we do not compare these directly to the data here. Under overhead stirring conditions, rates from seeded samples are typically larger by at most a small factor (2 to 5), but given the variation in repeat experiments, such differences should not be overinterpreted. The results from [52] are intermediate but again of a similar order of magnitude despite the rather different conditions of that work. The unseeded rates from magnetically agitated samples are the highest of all measurements by one to two orders of magnitude, indicating again the consistent importance of agitation conditions in the nucleation of NaCl, both primary and secondary.

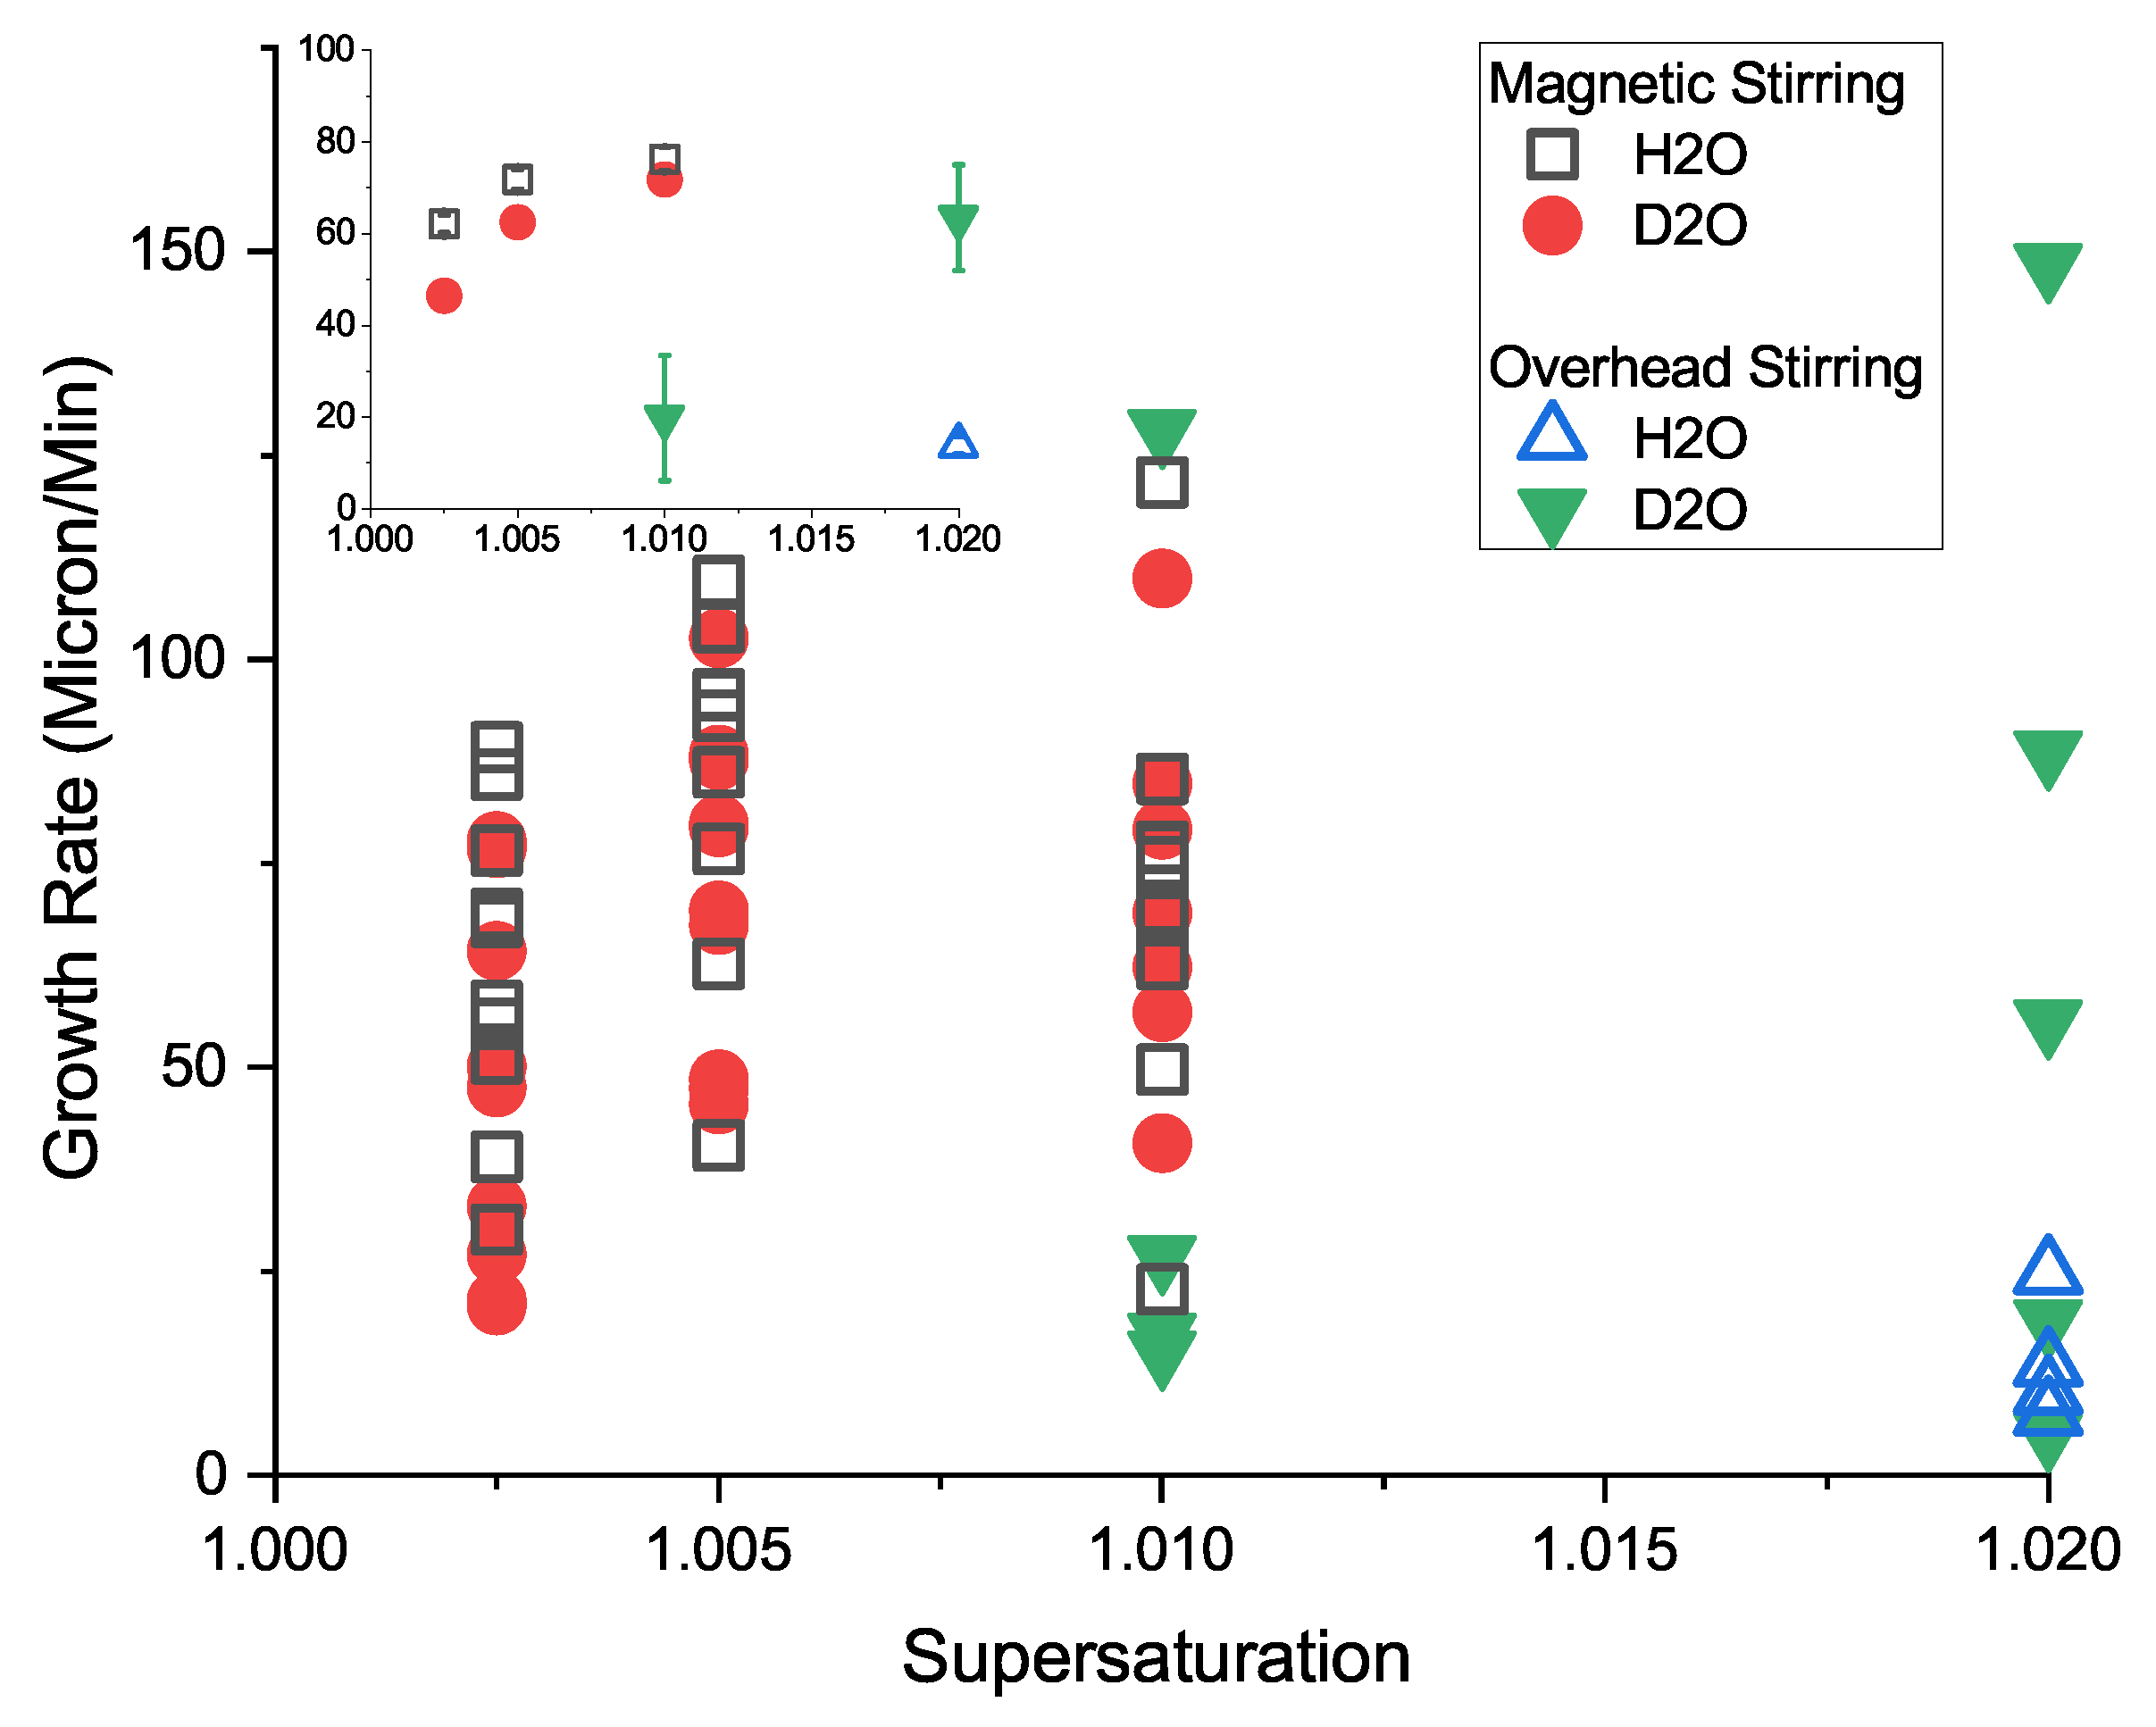
3.6. Crystal Growth Rates

Crystal growth rates were measured under both unseeded and seeded conditions in both H2O and D2O. The role of different agitation was also examined. All samples were at the 3 gsolvent scale. As described above, the growth rates were obtained by fitting a linear trend to D-90 vs. time, where D-90 is calculated from volume-weighted particle size distributions obtained from images by the Crystalline device’s built-in image analysis software.
Figure 13 shows growth rates from individual unseeded samples in H2O and D2O and corresponding average rates at each S, comparing magnetic stirrer and overhead stirrer agitation. Growth rates are clearly higher in samples subjected to the more vigorous magnetic stirrer agitation compared to overhead stirring. This is consistent with the theory of crystal growth proposed by Noyes and Whitney, where the growth rate can be influenced by the width of the diffusion layer across which the solute must diffuse to become incorporated into the crystal [58]. Increasing the speed of the fluid flow in the region of the crystal decreases the width of this diffusion layer, allowing crystals to grow at a faster rate [59]. In an examination of single NaCl crystal growth in a flow cell [60], increasing the rate of flow of supersaturated solution past the crystal was shown to increase the growth rate.
There are somewhat conflicting indications of the effect of solvent isotopologue on growth rate when comparing the two agitation methods. Using overhead stirring, at S = 1.02 (the only supersaturation where crystallization was observed with overhead stirring in H2O), the average growth rate appears higher in D2O compared to H2O. Under magnetic stirring, where higher nucleation probabilities mean a wider range of S for comparison, there is substantial spread in the data at each S. It is commonly observed that growth rates can vary significantly from crystal to crystal even in the same system and even between measurements of the same crystal face [61], and while use of the statistical size distribution-based methods here should mitigate somewhat against this intrinsic variability, it remains difficult to make a conclusive comparison between isotopologues. Agitation-dependent conditions such as shear stress would differ in solutions made from H2O and D2O due to the differences in the viscosity of the pure solvents where at 25 C, the viscosity of D2O (1.106 cP) is 25% higher than H2O (0.883 cP) [62], but without detailed tests in more controlled flow fields, it is difficult at this stage to draw any further conclusions.
Growth rates were also examined in seeded samples. Again, to avoid issues of attrition of the seed, only overhead stirring agitation was employed. Growth rates for individual samples and corresponding averages at each S are shown in Figure 14. As in unseeded samples, increasing the supersaturation leads to increased growth rate. In D2O, the magnitude of average growth rates is similar between seeded and unseeded measurements. Moreover, the seeded experiments show very similar average growth rates in the two solvents; the only notable difference between seeded and unseeded conditions is for H2O, where the growth rate is substantially lower in unseeded samples, although as mentioned above, unseeded data are only available for the highest supersaturation studied, S = 1.02 .

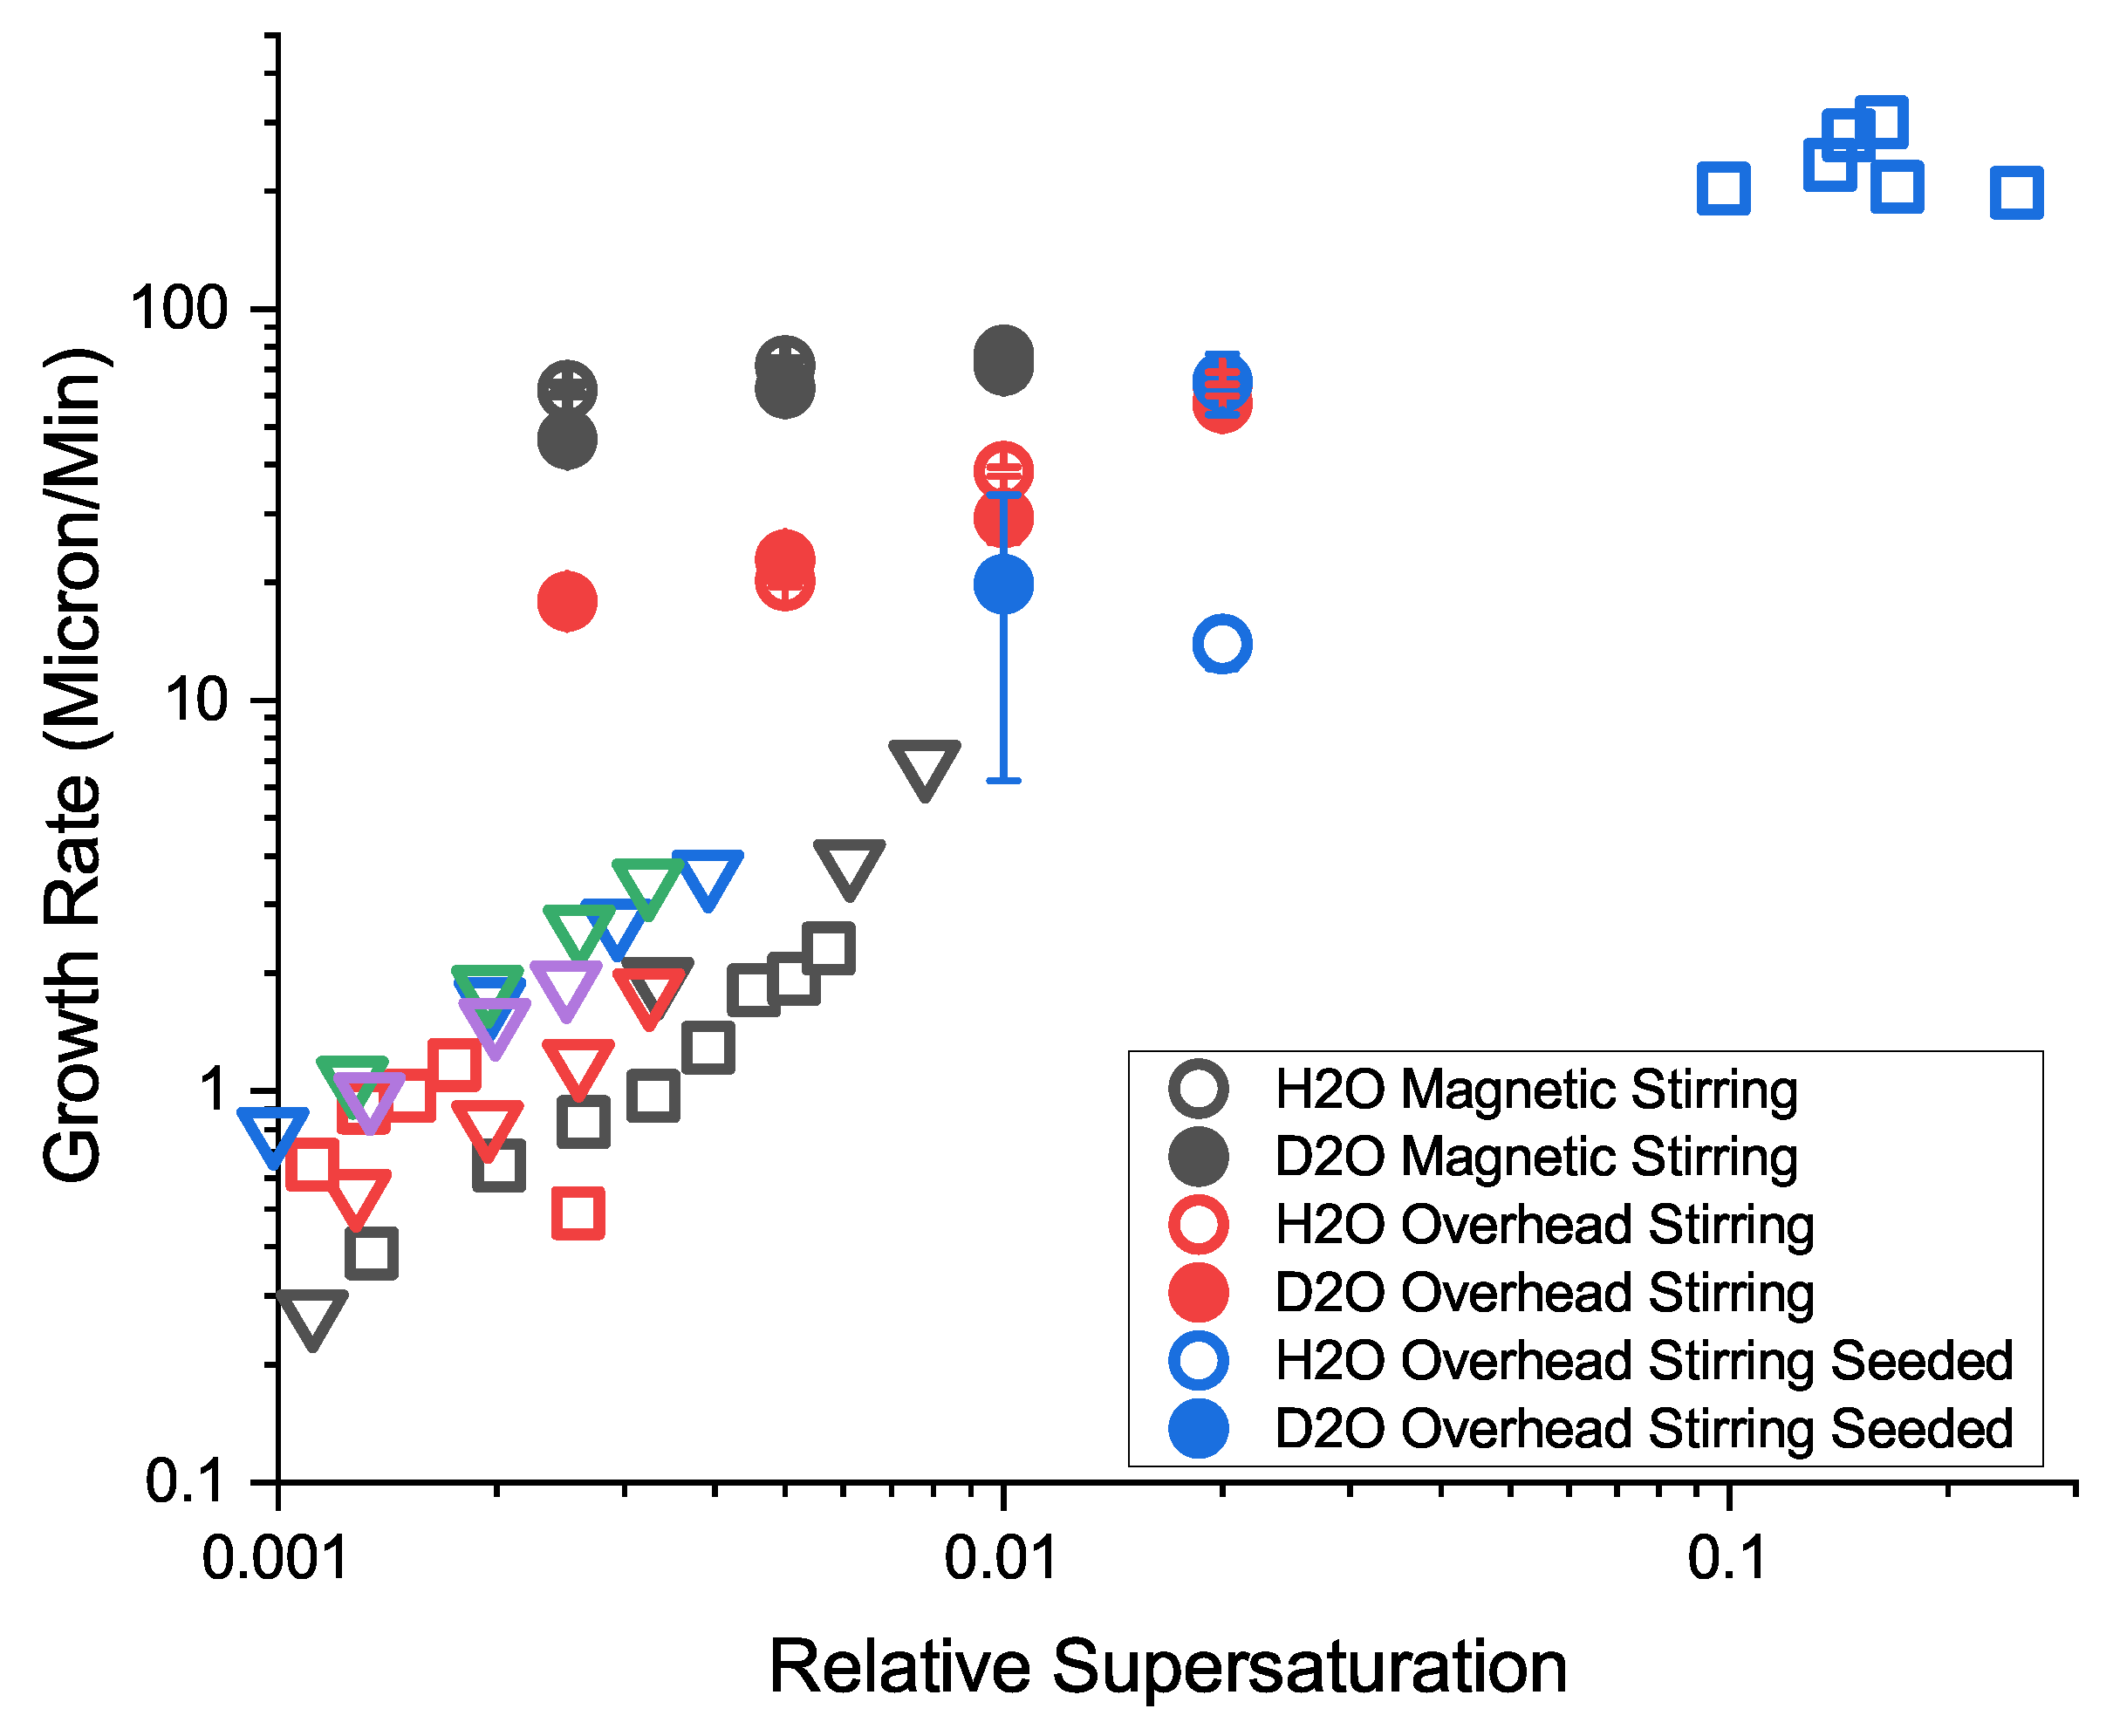
Comparison with Previous Measures of Growth Rate

The average growth rates at each supersaturation determined here using the calculated volume-weighted D-90 values from size distributions based on image analysis are compared with previously published measures using various other methods in Figure 15. In this figure, we plot the data in terms of relative supersaturation ( σ = S 1 ) to enable a clearer representation on a log scale across the full range of S found in the literature. Table 3 summarizes these results and the various published sources, including information, where available, on the growth conditions, such as the presence of quiescent samples or fluidized beds, and measurement methods, such as the observation of a single growing crystal. (Note that it was not possible to determine the methodologies used from some of the published sources.) To our knowledge, there are no previously published measurements of the growth rate in D2O.
A major factor that makes these comparisons of growth rates reported across the literature difficult to interpret is the variation seen in the methods of measurement used in different studies. Our results at supersaturations of between S 1 0.01 and 0.02 are reasonably consistent with the trends from lower and higher S in previous published work (and indeed fill a ‘gap’ in the available data in this supersaturation range), but this must be taken with the caveat of widely differing methodologies being used. Meanwhile, our measured growth rates at lower S < 1.01 are significantly higher than previous reports by an order of magnitude at the lowest S.
The discrepancy in the measured growth rate is likely to be exacerbated by the greater degree of agitation typically produced in magnetic stirring compared to the quiescent and fluidised bed conditions of previous publications, as supported by the observation that we indeed measure lower rates in gentler overhead stirring conditions, and at intermediate S, overhead stirring measurements agree reasonably with the literature. Damage to crystals particularly in magnetic stirring conditions is a possible factor linked to agitation, and damaged crystal surfaces have been observed to grow faster [68,69] which would lead to higher observed rates. While the use of overhead stirring in seeded conditions avoids such damage to the seed itself, the growing secondary crystals whose size distribution generates our growth rate estimate are still vulnerable to attrition and fragmentation as they impact the vessel and the impeller, and one would expect the consequences of this to be more severe in systems of brittle crystals such as NaCl.
How the growth rate is obtained from the size distribution can also have an impact on estimates. There are various ways to reduce a distribution of sizes to a single statistical size measure from which to estimate a characteristic growth rate. For example, our calculated growth rates would decrease were we to characterize the distribution through a lower cut-off, e.g., D-50 rather than D-90. However, a high D value is preferable in order to minimise the impact of newly nucleated crystals, which, being naturally small, will tend to impose a downward statistical bias on the apparent growth rate [70]. Conversely, D-90 tends to be more dependent on the largest crystals, which can bias the apparent rate upwards because, by definition, the largest crystals at any given time are those which are (or have been) growing the fastest and thus have reached the largest sizes. The issue of agglomeration, which as noted above was sometimes observed under magnetic stirring, would also potentially increase the apparent rate of growth, although we have no direct evidence of agglomeration occurring at lower values of S, and it is important to point out that wherever we see evidence of agglomeration from images obtained in the experiments, we exclude such data from further measures, such as growth rate. Thus, there does remain an apparent discrepancy between our measured growth rates and the previous literature at low S. Future work on establishing a more consistent method of obtaining comparable growth rates and exploring the potential biases of the different methods would be a valuable addition to characterization techniques in crystallization studies and process design.

3.7. Seed Activation Period

As mentioned previously, when estimating secondary nucleation rates from seeded samples, particle numbers N < 10 in the images obtained by the Crystalline device’s cameras are treated as noise rather than actual nucleated crystals. A typical sequence of N vs. time can be seen to fluctuate around this low noise level for a given ‘delay time’ after reaching isothermal conditions before N clearly rises and the image analysis begins to identify and count real crystals (see Supplementary Figure S3 for an example of N vs. time). Figure 16a shows measurements of this delay time in repeat experiments at a range of supersaturations in seeded samples and demonstrates the degree of variation of the delay time across samples at the same S. Each point is an independent sample with a different seed, and while every practical effort has been made to select seeds of approximately similar size and to pre-wash seeds in the same way (see above), some of this variation may be due to differing seed sizes or their different microscopic characteristics. Briuglia et al. demonstrated how different sized seeds, at equal mass loading, can lead to different nucleation kinetics [71]. Nevertheless, if we plot the average delay time at a given S (inset to Figure 16a), there is some evidence of a relatively weak reduction in delay time as S increases. The typical magnitude of the average delay time, at 1–2 min, is substantially shorter than the earliest observed crystals under unseeded conditions at the given S (a minimum of more than 6 min in H2O and more than 30 min in D2O), giving confidence that the particles appearing in the images in seeded experiments are indeed the result of seed-triggered secondary nucleation rather than primary nucleation in the bulk sample. The observed delay time can be regarded as the time required for the ‘activation’ of the seed to begin to generate observable numbers of separate secondary nuclei. If we plot the average delay time vs. the measured average growth rate at each S, we find an approximately linear relationship (Figure 16b), i.e., the delay time increases with decreasing growth rate. This suggests that a characteristic extent of growth is required before secondary nucleation is observed to occur. One interpretation of this is that nucleation is accelerated on the seed surface, but the growth rate limits the rate at which these surface nuclei become large enough to detach from the seed and can be counted in the bulk sample as secondary nuclei. Such a picture is consistent with the role of fluid shear at the seed surface causing the surface nuclei to detach once they have reached a critical size [44], although the direct observation of seed surfaces during secondary nucleation would be necessary to provide confirmation of the actual secondary nucleation mechanism.

4. Conclusions

We have explored the nucleation and growth behavior of sodium chloride crystallized from an isothermal solution, focusing particularly on two aspects: the role of solvent isotopologue and the qualitative role of agitation conditions. One aim of the reported work is to demonstrate the workflow methods of [7,8] with a simple ionic crystal system, showing that obtaining primary nucleation measures from induction time distributions for NaCl raises challenges compared to organic systems [7,8]. The NaCl system’s solubility has a weak dependence on temperature, making measuring nucleation rates under well-defined isothermal conditions problematic. The time spent quenching temperature from the fully dissolved state to the working temperature means nucleation is often observed to occur before isothermal conditions are established.
Our obtained solubility measurements are in good agreement with previous work stretching back over more than a century. The available previous measurements of the width of the metastable zone of NaCl in H2O are in general agreement with the largest values measured here. This is consistent with the fact that previously published measurements were gathered from a fluidized bed crystallizer at relatively low shear conditions; the width of the metastable zone is observed to decrease with increasing shear stress [43,57]. The growth rates we have measured, while consistent with the previous literature at intermediate supersaturation, are significantly higher than previous measurements at lower supersaturation. However, a wide range of sometimes poorly defined methodologies and conditions has been used previously to obtain growth rate measures, and further exploration of the role of methods and conditions on crystal growth would be worthwhile. The influence of agitation on rates of nucleation and growth in the NaCl system is clearly demonstrated by this work and illustrates that useful quantitative characterization of crystallization requires careful, consistent control and reporting of agitation conditions.
Solubility is unambiguously lower in D2O, as observed for other salt solutions [28]. Primary nucleation probabilities are typically somewhat greater in H2O compared to D2O (with shorter observed induction times and a greater propensity for pre-isothermal nucleation) under magnetic stirrer agitation, although this effect is less clear under overhead stirrer agitation. Regarding secondary nucleation, both seeded and unseeded, there is conversely a clear tendency toward higher rates in D2O under overhead stirring conditions, but little significant difference under magnetic stirring. A similar comparison is observed for crystal growth rates in unseeded samples, where under overhead stirring, samples in D2O demonstrate faster growth, while there is less difference under magnetic stirring (and in seeded conditions). We find typical seed ‘activation’ (or delay) time increases with decreasing average growth rate, as observed in other systems [8], indicating that the onset of secondary nucleation is controlled by crystal growth [16] and is therefore a less ‘stochastic’ phenomenon than primary nucleation, which is entirely consistent with the preference for seeded nucleation methods in industrial manufacturing processes, where prediction, consistency and control are paramount.

Supplementary Materials

The following supporting information can be downloaded at https://www.mdpi.com/article/10.3390/cryst13091388/s1, Section S1: Visual observation of crystal shapes: validation of experimental procedures. Figure S1: Microscope image of a washed seed crystal, showing the regular shape expected of NaCl crystals. Scale bar (red) is 200 microns. Figure S2: Fragment of NaCl seed crystal produced through attrition by collision with magnetic stirrer bar at 25 Cand supersaturation S = 1 in H2O. Scale bar is 500 microns. Because of their size and irregular shape and the absence of any nucleation/growth at S = 1, we may conclude that the observed crystals are fragments from the added seed. Such fragments are not observed when overhead stirrer agitation is employed. Figure S3: Example of the number of particles visible in images captured by a Crystalline camera. Example from a seeded experiment using an S = 1.01 solution in H2O agitated using an overhead propeller at 1250 RPM where time is measured from the beginning of isothermal conditions. Figure S4: Calculated number concentration of particles in suspension calculated from the number of particles imaged. Example from a seeded experiment using an S = 1.01 solution in H2O, agitated using an overhead propeller at 1250 RPM. The linear fit of points is also shown. Time is measured from the beginning of isothermal conditions. Figure S5: Calculated D-90 from binned particle distributions as determined from the images taken by the internal Crystalline reactor camera. Example from a seeded experiment using an S = 1.01 solution in H2O, agitated using an overhead propeller at 1250 RPM. Linear fit of points is also shown. Time is measured from the beginning of isothermal conditions. Figure S6: Crystals of NaCl nucleating in a ‘bona fide’ experiment in H2O at S = 1.01 and 25 C, agitated using a magnetic stirrer bar at a speed of 700 RPM and at a 3 gSolvent scale. Images are taken by in situ camera in the Crystalline device. Scale bar is 500 µm. (a) Time from the start of the experiment = 55 min 21 s; (b) time = 57 min 21 s. Figure S7: Example of experimental images where delayed dissolution led to irregular behavior and thus results were excluded. NaCl in H2O nominally with S = 1.01 at 25 C, agitated using overhead stirring, at a 3 gSolvent scale. Scale bar is 500 µm. (a) Time = 63 min 22 s from start of experiment; (b) time = 63 min 52 s.

Author Contributions

Conceptualization, J.M.F., M.D.H. and J.S.; methodology, J.M.F., M.D.H. and J.S.; software, H.J.; formal analysis, J.M.F.; investigation, J.M.F. and D.M.; data curation, J.M.F.; writing—original draft preparation, J.M.F.; writing—review and editing, J.M.F., M.D.H. and J.S.; supervision, M.D.H. and J.S.; funding acquisition, M.D.H. and J.S. All authors have read and agreed to the published version of the manuscript.

Funding

This research was funded by EPSRC grant number EP/P006965/1; EP/R513349/1.

Institutional Review Board Statement

Not applicable.

Informed Consent Statement

Not applicable.

Data Availability Statement

All data underpinning this publication are openly available from the University of Strathclyde KnowledgeBase at https://doi.org/10.15129/6bccdd95-1767-4245-88a0-6fa97fb43829, accessed on 15 June 2023.

Acknowledgments

We acknowledge support from the EPSRC and the Future Manufacturing Research Hub in Continuous Manufacturing and Advanced Crystallization (Grants ref: EP/P006965/1) for funding this work. The experimental work was carried out in the CMAC National Facility, housed within the University of Strathclyde’s Technology and Innovation Centre, and supported by the UKRPIF (UK Research Partnership Investment Fund) award from the Higher Education Funding Council for England (HEFCE) (Grant ref: HH13054).

Conflicts of Interest

The authors declare no conflict of interest. The funders had no role in the design of the study; in the collection, analyses, or interpretation of data; in the writing of the manuscript; or in the decision to publish the results.

References

  1. Schoen, H.M.; Grove, C.S.; Palermo, J.A. The early history of crystallization. J. Chem. Educ. 1956, 33, 373–375. [Google Scholar] [CrossRef]
  2. de Coppet, L.C. Study on the solubility of chlorides, bromides and iodides of potassium and sodium. Ann. Chim. Phys. 1883, 30, 411–429. [Google Scholar]
  3. Blasdale, W.C. Equilibria in solutions containing mixtures of salts. I—the system water and the sulfates and chlorides of sodium and potassium. Ind. Eng. Chem. 1918, 10, 344–347. [Google Scholar] [CrossRef]
  4. Antropoff, A. The Solubilities in the ternary Systems Sodium Chloride-Sodium Hydroxide-Water and Potassium Chloride-Potassium Hydroxide-Water. Z. Elektrochem. Angew. Phys. Chem. 1924, 30, 457–467. [Google Scholar]
  5. Eddy, R.D.; Menzies, A.W.C. The solubilities of certain inorganic compounds in ordinary water and in deuterium water. J. Phys. Chem. 1940, 44, 207–235. [Google Scholar] [CrossRef]
  6. Menzies, A.W.C. A method of Solubility Measurement. Solubilities in the System SrCl2-H2O from 20 to 200°. J. Am. Chem. Soc. 1936, 58, 934–937. [Google Scholar] [CrossRef]
  7. Briuglia, M.L.; Sefcik, J.; ter Horst, J.H. Measuring Secondary Nucleation through Single Crystal Seeding. Cryst. Growth Des. 2019, 19, 421–429. [Google Scholar] [CrossRef]
  8. Cashmore, A.; Miller, R.; Jolliffe, H.; Brown, C.J.; Lee, M.; Haw, M.D.; Sefcik, J. Rapid Assessment of Crystal Nucleation and Growth Kinetics: Comparison of Seeded and Unseeded Experiments. Cryst. Growth Des. 2023, 23, 4779–4790. [Google Scholar] [CrossRef] [PubMed]
  9. Erdemir, D.; Lee, A.Y.; Myerson, A.S. Nucleation of crystals from solution: Classical and two-step models. Accounts Chem. Res. 2009, 42, 621–629. [Google Scholar] [CrossRef]
  10. Deck, L.T.; Mazzotti, M. Conceptual Validation of Stochastic and Deterministic Methods To Estimate Crystal Nucleation Rates. Cryst. Growth Des. 2023, 23, 899–914. [Google Scholar] [CrossRef]
  11. Jiang, S.; ter Horst, J.H. Crystal nucleation rates from probability distributions of induction times. Cryst. Growth Des. 2011, 11, 256–261. [Google Scholar] [CrossRef]
  12. Lee, A.Y.; Erdemir, D.; Myerson, A.S. Crystals and Crystal Growth. In Handbook of Industrial Crystallization; Cambridge University Press: Cambridge, UK, 2019; pp. 32–75. [Google Scholar] [CrossRef]
  13. Myerson, A.S.; Erdemir, D.; Lee, A.Y. Crystal nucleation. In Handbook of Industrial Crystallization; Butterworth-Heinemann: Oxford, UK, 2019; pp. 76–114. [Google Scholar] [CrossRef]
  14. Kadam, S.S.; Kramer, H.J.M.; ter Horst, J.H. Combination of a single primary nucleation event and secondary nucleation in crystallization processes. Cryst. Growth Des. 2011, 11, 1271–1277. [Google Scholar] [CrossRef]
  15. Cui, Y.; Myerson, A.S. Experimental evaluation of contact secondary nucleation mechanisms. Cryst. Growth Des. 2014, 14, 5152–5157. [Google Scholar] [CrossRef]
  16. Xu, S.; Wang, Y.; Hou, Z.; Chuai, X. Overview of secondary nucleation: From fundamentals to application. Ind. Eng. Chem. Res. 2020, 59, 18335–18356. [Google Scholar] [CrossRef]
  17. Anwar, J.; Khan, S.; Lindfors, L. Secondary crystal nucleation: Nuclei breeding factory uncovered. Angew. Chem.-Int. Ed. 2015, 54, 14681–14684. [Google Scholar] [CrossRef] [PubMed]
  18. Hoffmann, J.; Flannigan, J.; Cashmore, A.; Briuglia, M.L.; Steendam, R.R.E.; Gerard, C.J.J.; Haw, M.D.; Sefcik, J.; ter Horst, J.H. The unexpected dominance of secondary over primary nucleation. Faraday Discuss. 2022, 235, 109–131. [Google Scholar] [CrossRef]
  19. Kulkarni, S.A.; Meekes, H.; ter Horst, J.H. Polymorphism control through a single nucleation event. Cryst. Growth Des. 2014, 14, 1493–1499. [Google Scholar] [CrossRef]
  20. Forsyth, C.; Mulheran, P.A.; Forsyth, C.; Haw, M.D.; Burns, I.S.; Sefcik, J. Influence of controlled fluid shear on nucleation rates in glycine aqueous solutions. Cryst. Growth Des. 2015, 15, 94–102. [Google Scholar] [CrossRef]
  21. McLeod, J.S.; Paterson, A.H.J.; Bronlund, J.E.; Jones, J.R. The effect of agitation on the nucleation of α-lactose monohydrate. Int. Dairy J. 2016, 61, 114–119. [Google Scholar] [CrossRef]
  22. Debuysschere, R.; Rimez, B.; Zaccone, A.; Scheid, B. Experimental and Theoretical Investigation of Nonclassical Shear-Induced Nucleation Mechanism for Small Molecule. Cryst. Growth Des. 2023, 23, 4979–4989. [Google Scholar] [CrossRef]
  23. Vesga, M.J.; McKechnie, D.; Mulheran, P.A.; Johnston, K.; Sefcik, J. Conundrum of γ glycine nucleation revisited: To stir or not to stir? Cryst. Eng. Commn. 2019, 21, 2234–2243. [Google Scholar] [CrossRef]
  24. Tai, C.Y.; McCabe, W.L.; Rousseau, R.W. Contact nucleation of various crystal types. AIChE J. 1975, 21, 351–358. [Google Scholar] [CrossRef]
  25. Wang, M.L.; Huang, H.T.; Estrin, J. Secondary nucleation of citric acid due to fluid forces in a Couette flow crystallizer. AIChE J. 1981, 27, 312–315. [Google Scholar] [CrossRef]
  26. Selwood, P.W.; Frost, A.A. Some Properties of Heavy Water. J. Am. Chem. Soc. 1933, 55, 4335–4336. [Google Scholar] [CrossRef]
  27. Vidulich, G.A.; Evans, D.F.; Kay, R.L. The dielectric constant of water and heavy water between 0 and 40 degree. J. Phys. Chem. 1967, 71, 656–662. [Google Scholar] [CrossRef]
  28. Chaplin, M. Water’s Hydrogen Bond Strength. arXiv 2007, arXiv:0706.1355. [Google Scholar]
  29. Van Hook, W.A.; Rebelo, L.P.N. Isotope Effects on Solubility. In Developments and Applications in Solubility; Letcher, T.M., Ed.; Royal Society of Chemistry: London, UK, 2007. [Google Scholar]
  30. Noonan, E.C. Solubility of Salts in Deuterium Oxide. J. Am. Chem. Soc. 1948, 70, 2915–2918. [Google Scholar] [CrossRef] [PubMed]
  31. Jelińska-Kazimierczuk, M.; Szydłowski, J. Isotope effect on the solubility of amino acids in water. J. Solut. Chem. 1996, 25, 1175–1184. [Google Scholar] [CrossRef]
  32. Rungsimanon, T.; Yuyama, K.I.; Sugiyama, T.; Masuhara, H.; Tohnai, N.; Miyata, M. Control of crystal polymorph of glycine by photon pressure of a focused continuous wave near-infrared laser beam. J. Phys. Chem. Lett. 2010, 1, 599–603. [Google Scholar] [CrossRef]
  33. Suzuki, S.; Shimanouchi, T.; Tsuboi, M. Normal vibrations of glycine and deuterated glycine molecules. Spectrochim. Acta 1963, 19, 1195–1208. [Google Scholar] [CrossRef]
  34. Technobis. Application Note 3-Solubility Measurements. Technical Report.
  35. Xinding, Y.; Jinju, M.; Ruina, F.; Qishan, Y.; Wei, L. Measurement and Correlation of the Solubility, Dissolution Enthalpy, and Entropy of R-2[4-(6-Chloro-2-benzoxazolyloxy)phenoxy]propanoic Acid in Different Pure Solvents. Russ. J. Phys. Chem. A 2019, 93, 2340–2348. [Google Scholar] [CrossRef]
  36. Mack, C.; Hoffmann, J.; Sefcik, J.; ter Horst, J.H. Phase Diagram Determination and Process Development for Continuous Antisolvent Crystallizations. Crystals 2022, 12, 1102. [Google Scholar] [CrossRef]
  37. Olalere, O.H. Phase Behaviour and Crystal Nucleation in Complex Multicomponent system. Ph.D. Thesis, University of Strathclyde, Glasgow, UK, 2019. [Google Scholar]
  38. Mullin, J.W. Crystallization, 4th ed.; Butterworth-Heinemann: Boston, MA, USA, 2001. [Google Scholar]
  39. Bharmoria, P.; Gupta, H.; Mohandas, V.P.; Ghosh, P.K.; Kumar, A. Temperature invariance of NaCl solubility in water: Inferences from salt-water cluster behavior of NaCl, KCl, and NH4Cl. J. Phys. Chem. B 2012, 116, 11712–11719. [Google Scholar] [CrossRef]
  40. Yerdelen, S.; Yang, Y.; Quon, J.; Papageorgiou, C.D.; Mitchell, C.; Houson, I.; Sefcik, J.; ter Horst, J.H.; Florence, A.J.; Brown, C.J. Machine Learning-Derived Correlations for Scale-Up and Technology Transfer of Primary Nucleation Kinetics. Cryst. Growth Des. 2023, 23, 681–693. [Google Scholar] [CrossRef] [PubMed]
  41. Chianese, A.; Di Cave, S.; Mazzarotta, B. Solubility and metastable zone width of sodium chloride in water-diethylene glycol mixtures. J. Chem. Eng. Data 1986, 31, 329–332. [Google Scholar] [CrossRef]
  42. Ginde, R.M.; Myerson, A.S. Effect of impurities on cluster growth and nucleation. J. Cryst. Growth 1993, 126, 216–222. [Google Scholar] [CrossRef]
  43. Yousuf, M.; Frawley, P.J. Experimental Evaluation of Fluid Shear Stress Impact on Secondary Nucleation in a Solution Crystallization of Paracetamol. Cryst. Growth Des. 2018, 18, 6843–6852. [Google Scholar] [CrossRef]
  44. Cashmore, A.; Boyle, C.; Haw, M.D.; Lee, M.; Sefcik, J. The effect of fluid shear on secondary nucleation in alpha-glycine. 2023; preparation. [Google Scholar]
  45. Na, H.S.; Arnold, S.; Myerson, A.S. Cluster formation in highly supersaturated solution droplets. J. Cryst. Growth 1994, 139, 104–112. [Google Scholar] [CrossRef]
  46. Gao, Y.; Yu, L.E.; Chen, S.B. Efflorescence relative humidity of mixed sodium chloride and sodium sulfate particles. J. Phys. Chem. 2007, 111, 10660–10666. [Google Scholar] [CrossRef]
  47. Desarnaud, J.; Derluyn, H.; Carmeliet, J.; Bonn, D.; Shahidzadeh, N. Metastability limit for the nucleation of NaCl crystals in confinement. J. Phys. Chem. Lett. 2014, 5, 890–895. [Google Scholar] [CrossRef]
  48. Zimmermann, N.E.R.; Vorselaars, B.; David, Q.; Peters, B. Nucleation of NaCl from Aqueous Solution: Critical Sizes, Ion-Attachment Kinetics, and Rates. J. Am. Chem. Soc. 2015, 137, 13352–13361. [Google Scholar] [CrossRef]
  49. Zimmermann, N.E.R.; Vorselaars, B.; Espinosa, J.R.; Quigley, D.; Smith, W.R.; Sanz, E.; Vega, C.; Peters, B. NaCl nucleation from brine in seeded simulations: Sources of uncertainty in rate estimates. J. Chem. Phys. 2018, 148, 222838. [Google Scholar] [CrossRef]
  50. Jiang, H.; Haji-Akbari, A.; Debenedetti, P.G.; Panagiotopoulos, A.Z. Forward flux sampling calculation of homogeneous nucleation rates from aqueous NaCl solutions. J. Chem. Phys. 2018, 148, 044505. [Google Scholar] [CrossRef]
  51. Lanaro, G.; Patey, G.N. Molecular dynamics simulation of NaCl dissolution. J. Phys. Chem. B 2015, 119, 4275–4283. [Google Scholar] [CrossRef]
  52. Luo, L.; Chang, J.; Chung, T.S. Cooling Crystallization of Sodium Chloride via Hollow Fiber Devices to Convert Waste Concentrated Brines to Useful Products. Ind. Eng. Chem. Res. 2017, 56, 10183–10192. [Google Scholar] [CrossRef]
  53. Pratola, F. Micro-Mechanics of Agglomerative Crystallization Processes. Ph.D. Thesis, University College London, London, UK, 2004. [Google Scholar]
  54. Johnston, T.L.; Stokes, R.J.; Li, C.H. The ductile-brittle transition in ionic solids. Philos. Mag. 1959, 4, 1316–1324. [Google Scholar] [CrossRef]
  55. Threlfall, T.L.; Coles, S.J. A perspective on the growth-only zone, the secondary nucleation threshold and crystal size distribution in solution crystallisation. CrystEngComm 2016, 18, 369–378. [Google Scholar] [CrossRef]
  56. Grootscholten, P.A.M.; De Leer, B.G.M.; De Jong, E.J.; Asselbergs, C.J. Factors affecting secondary nucleation rate of sodium chloride in an evaporative crystallizer. AIChE J. 1982, 28, 728–737. [Google Scholar] [CrossRef]
  57. Zheng, D.; Zou, W.; Yan, J.; Peng, C.; Fu, Y.; Li, B.; Zeng, L.; Huang, T.; Zhang, F. Coupling of Contact Nucleation Kinetics with Breakage Model for Crystallization of Sodium Chloride Crystal in Fluidized Bed Crystallizer. J. Chem. 2019, 2019, 1–11. [Google Scholar] [CrossRef]
  58. Noyes, A.A.; Whitney, W.R. The rate of solution of solid substances in their own solutions. J. Am. Chem. Soc. 1897, 19, 930–934. [Google Scholar] [CrossRef]
  59. Duroudier, J.P. Dispersions and Dissolutions of Powders. In Solid-Solid, Fluid-Solid, Fluid-Fluid Mixers; ISTE Press: London, UK, 2016. [Google Scholar]
  60. Rodriguez-Clemente, R. Crystal Growth Kinetics of Sodium Chloride from Solution. In Industrial Crystallization; Springer: Boston, MA, USA, 1976; pp. 187–199. [Google Scholar] [CrossRef]
  61. Jones, C.M. Characterizing Growth Rates and Growth Rate Dispersion of Secondary Nuclei as a Fraction of Supersaturation. Ph.D. Thesis, Iowa State University, Ames, IA, USA, 1999. [Google Scholar]
  62. Millero, F.J.; Dexter, R.; Hoff, E. Density and Viscosity of Deuterium Oxide Solutions from 5–70 °C. J. Chem. Eng. Data 1971, 16, 85–87. [Google Scholar] [CrossRef]
  63. Offermann, H.; Von Brachel, G.; Al-Sabbagh, A.; Farelo, F. Crystallization Kinetics of NaCl in Multicomponent Solutions. Cryst. Res. Technol. 1995, 30, 651–658. [Google Scholar] [CrossRef]
  64. Al-Jibbouri, S.; Ulrich, J. The growth and dissolution of sodium chloride in a fluidized bed crystallizer. J. Cryst. Growth 2002, 234, 237–246. [Google Scholar] [CrossRef]
  65. Zhang, S.B.; Yuan, J.J.; Mohameed, H.A.; Ulrich, J. The effect of different inorganic salts on the growth rate of NaCl crystallized from sea water. Cryst. Res. Technol. 1996, 31, 19–25. [Google Scholar] [CrossRef]
  66. Ulrich, J.; Mohameed, H.; Zhang, S.B.; Yuan, J.J. Effect of Additives on the Crystal Growth Rates: Case Study NaCl. Bull. Soc. Sea Water Sci. Jpn. 1997, 51, 73–77. [Google Scholar] [CrossRef]
  67. Desarnaud, J.; Derluyn, H.; Carmeliet, J.; Bonn, D.; Shahidzadeh, N. Hopper Growth of Salt Crystals. J. Phys. Chem. Lett. 2018, 9, 2961–2966. [Google Scholar] [CrossRef]
  68. Schiele, S.A.; Hupfer, R.; Luxenburger, F.; Briesen, H. Growth of Abraded Crystals Tracked in Three Dimensions. Cryst. Growth Des. 2021, 21, 6373–6384. [Google Scholar] [CrossRef]
  69. Tominaga, Y.; Maruyama, M.; Yoshimura, M.; Koizumi, H.; Tachibana, M.; Sugiyama, S.; Adachi, H.; Tsukamoto, K.; Matsumura, H.; Takano, K.; et al. Promotion of protein crystal growth by actively switching crystal growth mode via femtosecond laser ablation. Nat. Photonics 2016, 10, 723–726. [Google Scholar] [CrossRef]
  70. Brown, C.J.; McGlone, T.; Yerdelen, S.; Srirambhatla, V.; Mabbott, F.; Gurung, R.; Briuglia, M.L.; Ahmed, B.; Polyzois, H.; McGinty, J.; et al. Enabling precision manufacturing of active pharmaceutical ingredients: Workflow for seeded cooling continuous crystallisations. Mol. Syst. Des. Eng. 2018, 3, 518–549. [Google Scholar] [CrossRef]
  71. Briuglia, M.L. Primary and Secondary Crystal Nucleation of Pharmaceutics. Ph.D. Thesis, University of Strathclyde, Glasgow, UK, 2017. [Google Scholar]
Figure 1. Solubility of NaCl in H2O and D2O. (a) Solubility and metastable zone of NaCl in H2O. Black open squares: measured clear points (i.e., solubility). Black dashed line: Van’t Hoff fitting to clear points (i.e., fitted solubility curve). Red open circles: measured cloud points. (b) Solubility and metastable zone of NaCl in D2O. Black filled squares: measured clear points (i.e., solubility). Black line: Van’t Hoff fitting to clear points (i.e., fitted solubility curve). Red filled circles: measured cloud points.
Crystals 13 01388 g001
Figure 2. Comparison of solubility of NaCl in H2O and D2O. Clear points in H2O (black hollow squares) and D2O (black filled squares). Van’t Hoff fittings of clear points of H2O (black dashed line) and D2O (black solid line). Comparisons with previously published sources, including Antropff (red hollow circles) [4], Blasdale (blue hollow triangles) [3], de Coppet (green hollow inverted triangles) [2], Mullin (purple hollow diamonds) [38], Bharmoria (yellow left hollow triangles) [39], and Eddy (red filled circles) [5]. Note that where sources quote supersaturation using their own solubility data, we have converted to concentration to enable consistent comparison.
Crystals 13 01388 g002
Figure 3. Cumulative probability distribution plots of induction time measurements for NaCl in H2O and D2O at 25 C. Sample scale is 1 gsolvent, and agitation is by magnetic stirrer. Lines are fits to the Jiang and ter Horst model [11]. (a) NaCl in H2O for supersaturations of 1.0025 (black open squares), 1.005 (red open circles), 1.01 (blue open triangles), and 1.02 (green open inverted triangles). (b) NaCl in D2O for supersaturations of 1.02 (black filled squares), 1.03 (red filled circles), and 1.04 (blue filled triangles). Filled symbols (a) and crossed symbols (b) on the t = 0 axis indicate the proportion of total vials that nucleated before reaching isothermal conditions: the P ( t ) points fitted are then proportions excluding these already-nucleated vials. Hence, for example, supersaturation > 1.02 could not be tested in H2O due to the overwhelming probability of nucleation occurring during the temperature quench before reaching the working temperature (see text).
Crystals 13 01388 g003
Figure 4. Cumulative probability distribution plots of induction time measurements for NaCl in H2O and D2O at 25 C at a sample scale of 3 gsolvent and with agitation by magnetic stirrer. Lines are fits to the Jiang and ter Horst model [11]. (a) NaCl in H2O, for supersaturations of 1.0025 (black open squares), 1.005 (red open circles), 1.01 (blue open triangles), and 1.02 (green inverted open triangles). (b) NaCl in D2O for supersaturations of 1.0025 (black filled squares), 1.005 (red filled circles), 1.01 (blue filled triangles), and 1.02 (green inverted filled triangles). Crossed symbols on the t = 0 axis in both plots indicate the proportion of vials of the total that nucleated before reaching isothermal conditions; the P ( t ) points fitted are then proportions excluding these already-nucleated vials.
Crystals 13 01388 g004
Figure 5. Cumulative probability distribution plots of induction time measurements for NaCl in H2O and D2O at 25 C at a 3 gsolvent scale agitated using overhead stirring. Lines are fits to the Jiang and ter Horst model [11].(a) NaCl in H2O for supersaturations of 1.0025 (black open squares), 1.005 (red open circles), 1.01 (blue open triangles), and 1.02 (green inverted open triangles). (b) NaCl in D2O for supersaturations of 1.0025 (black filled squares), 1.005 (red filled circles), 1.01 (blue filled triangles), and 1.02 (green inverted filled triangles). Total observation time was 4 h (240 min); the point (black open square) placed at P ( t = 240 ) = 0 for S = 1.0025 in H2O indicates such a reduced nucleation rate that no samples nucleated in this time window.
Crystals 13 01388 g005
Figure 6. Proportions of samples showing crystallization prior to isothermal conditions being reached, during the isothermal experimental time window, and those not showing evidence of crystallization by the end of the time window for NaCl in (a) H2O and (b) D2O at a sample scale of 1 g solvent and with agitation by magnetic stirrer.
Crystals 13 01388 g006
Figure 7. Proportions of samples showing crystallization prior to isothermal conditions being reached, during the isothermal experimental time window, and those not showing evidence of crystallization by the end of the time window for NaCl in (a) H2O and (b) D2O at a sample scale of 3 g solvent and with agitation by magnetic stirrer.
Crystals 13 01388 g007
Figure 8. Proportions of samples showing crystallization prior to isothermal conditions being reached, during the isothermal experimental time window, and those not showing evidence of crystallization by the end of the time window for NaCl in (a) H2O and (b) D2O at a sample scale of 3 g solvent and with agitation by overhead stirrer.
Crystals 13 01388 g008
Figure 9. Apparent primary nucleation rates for NaCl in H2O (open symbols) and D2O (filled symbols). Estimates are obtained from experimental conditions as follows: at the 1 g solvent Crystal16 scale in H2O (black squares) and D2O (red circles); at the 3 g solvent Crystalline scale agitated using magnetic stirring in H2O (blue triangles) and D2O (green inverted triangles); and at the 3 g solvent Crystalline scale agitated using overhead stirring in H2O (purple diamond) and D2O (yellow stars). Error bars indicate standard error. Note that weighing errors in S (x-axis) from sample preparation are smaller than the symbol sizes.
Crystals 13 01388 g009
Figure 10. Unseeded secondary nucleation rates under two agitation conditions: magnetic stirring in H2O (black hollow squares) and D2O (red circles) and overhead stirring in H2O (blue hollow triangles) and D2O (green inverted triangles). Averages at each supersaturation are shown in the inset using the same symbols, with error bars showing the standard error of the mean.
Crystals 13 01388 g010
Figure 11. Seeded secondary nucleation rates (B). All data are from overhead stirring at 1250 RPM in H2O (blue hollow triangles) and D2O (green inverted triangles). Average rates at each supersaturation are shown in the inset in the same symbols, with error bars showing the standard error of the mean; linear fits to the averages are also indicated. The equations of linear fits of the averages are as follows: H2O: B = 221.3 × 10 3 S 221.6 × 10 3 ; D2O: B = 510.9 × 10 3 S 551.6 × 10 3 .
Crystals 13 01388 g011
Figure 12. Comparison of average secondary nucleation rates at a 3 g solvent scale. H2O and D2O are shown in hollow and closed symbols, respectively. The magnetic stirring unseeded condition is represented by black squares; the overhead stirring unseeded condition is represented by red circles, and the overhead stirring seeded condition is represented by blue triangles. Error bars show the standard error of the mean. The figure also includes measurements for H2O from the literature (Luo [52], Green Diamonds); see the text.
Crystals 13 01388 g012
Figure 13. Unseeded D-90 growth rate measured at the 3 g solvent scale comparing magnetic stirring in H2O (black open squares) and D2O (red filled circles) with overhead stirring in H2O (blue open triangles) and D2O (green inverted filled triangles). Inset shows average growth rate calculated at each supersaturation using the same symbols, with error bars showing the standard error of the mean.
Crystals 13 01388 g013
Figure 14. Seeded D-90 growth rate at a 3 gsolvent scale under overhead stirring agitation in H2O (blue hollow triangles) and D2O (green inverted triangles). Averages calculated at each supersaturation are shown in the inset using the same symbols, with error bars showing the standard error of the mean.
Crystals 13 01388 g014
Figure 15. Comparison of growth rates determined in this work from the volume-weighted D-90 of size distributions with measurements by other methods seen in the literature vs. relative supersaturation S 1 . For clarity, the key to symbols showing literature data is included separately in Table 3, where we identify the source and, when available in the literature source, the relevant experimental conditions. Error bars on our measurements show the standard error of the mean.
Crystals 13 01388 g015
Figure 16. (a) Delay time between the addition of seed to seeded samples and the onset of rapid growth of measured particle number in images at various supersaturations under overhead stirring in H2O (blue hollow triangles) and D2O (green inverted triangles). Calculated average delay time at each supersaturation is shown in the inset, with error bars showing the standard error of the mean. (b) Average growth rate vs. average delay time, under overhead stirring conditions, for H2O (blue hollow triangles) and D2O (green inverted triangles).
Crystals 13 01388 g016
Table 1. Compositions of solutions used for unseeded crystallizations.
SolventC (gSolute/gSolvent)S at 25 C
H2O0.36081.0025
0.36171.005
0.36351.01
0.36711.02
D2O0.30791.0025
0.30861.005
0.31021.01
0.31321.02
0.31631.03
0.31941.04
Table 2. Fitted apparent primary nucleation rates J and growth times t g from induction time distributions based on fitting the model developed by Jiang and ter Horst [11]. For agitation type, ‘MS’ = magnetic stirrer bar and ‘OS’ = overhead stirring. For scale, ‘C16’ = 1 g solvent scale and ‘Crystalline’ = 3 g solvent scale.
SolventScaleSAgitation TypeJ (m−3 s−1)tg (min)
H2OC161.0025MS450 ± 990 ± 2.85
H2OC161.005MS660 ± 1410 ± 2.12
H2OC161.01MS434 ± 1230 ± 2.91
H2OC161.02MS580 ± 371.12 ± 0.95
D2OC161.02MS550 ± 740 ± 1.79
D2OC161.03MS1084 ± 631.90 ± 0.51
D2OC161.04MS981 ± 2070 ± 1.40
H2OCrystalline1.0025MS358 ± 560 ± 1.27
H2OCrystalline1.005MS646 ± 1440 ± 1.07
H2OCrystalline1.01MS619 ± 1180 ± 0.78
H2OCrystalline1.02MS[-][-]
D2OCrystalline1.0025MS81 ± 62.37 ± 2.83
D2OCrystalline1.005MS375 ± 350.75 ± 0.76
D2OCrystalline1.01MS90 ± 76.13 ± 2.6
D2OCrystalline1.02MS1952 ± 2670.27 ± 0.21
H2OCrystalline1.0025OS[-][-]
H2OCrystalline1.005OS[-][-]
H2OCrystalline1.01OS[-][-]
H2OCrystalline1.02OS17 ± 50 ± 29.0
D2OCrystalline1.0025OS[-][-]
D2OCrystalline1.005OS[-][-]
D2OCrystalline1.01OS22 ± 515.1 ± 29.4
D2OCrystalline1.02OS15 ± 30 ± 30.2
Table 3. Key for symbols in Figure 15.
SymbolSourceSolventConditionsMeasurement Method
Crystals 13 01388 i001This WorkH2OUnseeded, Magnetic Stirring 700 RPMD-90 Change Rate
Crystals 13 01388 i002This WorkD2OUnseeded, Magnetic Stirring 700 RPMD-90 Change Rate
Crystals 13 01388 i003This WorkH2OUnseeded, Overhead Stirring 1250 RPMD-90 Change Rate
Crystals 13 01388 i004This WorkD2OUnseeded, Overhead Stirring 1250 RPMD-90 Change Rate
Crystals 13 01388 i005This WorkH2OSeeded, Overhead Stirring 1250 RPMD-90 Change Rate
Crystals 13 01388 i006This WorkD2OSeeded, Overhead Stirring 1250 RPMD-90 Change Rate
Crystals 13 01388 i007Offerman [63]H2OFluidized BedChange in Mass
Crystals 13 01388 i008Al-Jibbouri [64]H2OFluidized BedChange in Mass
Crystals 13 01388 i009Langer [64]H2OFluidized BedUnknown, Secondary Source
Crystals 13 01388 i010Al-Sabbagh [64]H2OFluidized BedUnknown, Secondary Source
Crystals 13 01388 i011Stepanski [64]H2OFluidized BedUnknown, Secondary Source
Crystals 13 01388 i012Zhang [65]H2OQuiescentSingle Crystal Microscope Observation,
Crystals 13 01388 i013Ulrich [66]H2OQuiescentSingle Crystal Microscope Observation,
Crystals 13 01388 i014Desarnaud [67]H2OQuiescentSingle Crystal Microscope Observation,
Disclaimer/Publisher’s Note: The statements, opinions and data contained in all publications are solely those of the individual author(s) and contributor(s) and not of MDPI and/or the editor(s). MDPI and/or the editor(s) disclaim responsibility for any injury to people or property resulting from any ideas, methods, instructions or products referred to in the content.

