Abstract
Urolithiasis is a medically significant crystallization process affecting the urinary tract. Kidney stones exhibit considerable diversity as they form in complex environments containing various molecules and pathogens. Understanding the formation and occurrence of kidney stones is essential for developing strategies to prevent or reduce the invasiveness of treatments. In this study, we investigated over 300 cases of urolithiasis in Styria, Austria. The composition of the stones was evaluated using infrared spectroscopy and scanning electron microscopy. Most stones were found to be heterogeneous, predominantly composed of calcium oxalate, followed by calcium phosphate. Other components such as struvite, uric acid, and cystine were present to a lesser extent and were more likely to form homogeneous crystals. Analyzing the occurrence of these different stone types provides valuable insights into the formation processes of kidney stones and can aid in the prevention of urolithiasis in the future.
Keywords:
urolithiasis; kidney stone; kidney calculi; calcium; oxalate; phosphate; composition; FT-IR 1. Introduction
Urolithiasis, commonly known as kidney stone disease, involves the formation of solid deposits of minerals and salts within the urinary tract. These stones can form in the kidneys, ureters, bladder, or urethra and are typically composed of calcium oxalate, calcium phosphate, struvite, uric acid, or cystine [1,2,3]. The formation of kidney stones is a complex process influenced by genetic, metabolic, and environmental factors [4,5]. Symptoms of urolithiasis may include severe pain, hematuria (blood in urine), and urinary tract infections [6]. While some stones may pass spontaneously, others require medical intervention such as lithotripsy or surgical removal [7].
The management of urolithiasis involves a combination of medical, surgical, and preventive strategies. The therapy depends on the location and composition of the stones. Initially, pain relief is crucial, with non-steroidal anti-inflammatory drugs (NSAIDs) like ibuprofen or diclofenac recommended for renal colic [8]. Opioids serve as an alternative when NSAIDs are ineffective or contraindicated [8,9]. Medical expulsive therapy (MET) using α-blockers such as tamsulosin is employed to facilitate the passage of distal ureteral stones larger than 5 mm. This approach increases expulsion rates and reduces pain episodes [9,10,11,12]. Oral chemolysis is effective for dissolving uric acid stones by alkalinizing the urine with agents like potassium citrate, targeting a pH of 7.0 to 7.2 [13]. Surgical interventions include extracorporeal shock wave lithotripsy (SWL), ureteroscopy (URS), and percutaneous nephrolithotomy (PCNL). SWL is non-invasive and uses shock waves to fragment stones, particularly in the kidney or upper ureter. URS involves the use of a ureteroscope to visualize and remove stones, with laser lithotripsy often employed for fragmentation. PCNL is used for larger stones, typically over 2 cm, involving a direct approach through the skin into the kidney [9].
Kidney stones are a prevalent condition, affecting millions of individuals worldwide. The prevalence of kidney stones varies significantly across different regions. In Europe, the prevalence ranges from approximately 5–9% [14]. In contrast, the prevalence in Middle Eastern countries is significantly higher, with estimated rates of about 21% in Iran and 19% in Saudi Arabia [15].
In recent years, the prevalence of renal stones has significantly increased in countries with a high standard of living, such as Sweden, Canada, and the USA, exceeding 10% [16,17]. For example, in the United States, the incidence of kidney stones increased significantly from 1980 to the early 2010s. While the incidence was 3.2% in 1980, it had risen to 10.1% by 2014 [18]. The causes for the rise in kidney stone prevalence are not yet fully understood. Possible contributing factors could include changes in lifestyle, diet, and climate change [14].
The likelihood of developing kidney stones is not equally distributed within the population. In the Western world, men are significantly more affected than women. The lifetime risk of kidney stones in the United States is 12% for men, compared to 6% for women [3]. Moreover, age plays an important role in the development of kidney stones. The highest prevalence, 19.7%, was observed in males older than 80 years, followed by 18.8% in males aged 60–79 years, 11.5% in males aged 40–59 years, and 5.1% in males aged 20–39 years [19].
Another important aspect of kidney stones is the associated economic costs borne by the healthcare system and society. Unlike other chronic diseases, kidney stones affect not only older patients over the age of 65 but also working individuals between the ages of 20 and 60 [20]. The annual treatment costs for kidney stone therapy in the United States were estimated to be 9 billion US dollars in 2021, adjusted for inflation [16,21]. Recent studies also suggest a potential link between nephrolithiasis and the risk of developing chronic kidney disease (CKD) [22]. Additionally, every year people die from the consequences of urolithiasis. A study from England revealed that between 1999 and 2013, approximately 130 people per year died from complications related to urolithiasis [23]. Besides the endemic nature and the medical significance of kidney stones, the high recurrence rate is also a significant issue [4].
To better understand kidney stone formation, it is essential to collect extensive data on the epidemiology and composition of kidney stones. Several papers have been published in recent years on the crystallization processes and possible pathophysiology behind kidney stones [24,25,26].
Unfortunately, there are still insufficient data on the epidemiology and composition of kidney stones in Austria. In comparison, there are large-scale composition and epidemiological studies conducted in countries such as the USA, France, and Germany [16,27,28]. Thus, any new data in this area can contribute significantly to the detailed exploration of their pathophysiology. From a better understanding of the pathophysiology and crystallization processes of kidney stones, new approaches for primary and secondary prevention may emerge in the future.
Therefore, we examined the composition of 322 randomly selected kidney stones in Styria, Austria, which were obtained using flexible ureteroscopy at the LKH University Hospital Graz. For this purpose, all measurements were conducted using Fourier transform infrared spectroscopy (FT-IR).
There are various methods to analyze the composition of kidney stones. The most commonly used methods today are polarization microscopy on grain preparations, X-ray diffraction, infrared spectroscopy, and chemical methods in the form of analysis sets [29]. As noted by the European Association of Urology (April 2024), FT-IR spectroscopy or X-ray diffraction are the methods of choice for analyzing the composition of kidney stones [30,31,32]. We consciously chose FT-IR because it is recommended by the European Association of Urology and does not have the significant disadvantages associated with X-ray diffraction. In addition to the high costs, analysis using X-ray diffraction would have taken longer (up to 30 min per probe). Moreover, non-crystalline substances would not have been detectable [29]. Furthermore, chemical analysis (wet chemistry) has become obsolete in clinical practice [33].
This study focuses on the precise composition of kidney stones in Austria, with special attention to the detailed composition of mixed stones containing calcium oxalate and calcium phosphate.
2. Materials and Methods
2.1. Materials
Kidney stone samples were collected from the Department of Urology at the University Hospital, Graz, between March 2023 and June 2024. A total of 328 samples were obtained. Due to insufficient sample quality issues, 13 samples were excluded from the analysis. Of the included kidney stone samples, 105 (33.3%) were from female patients and 210 (66.6%) were from male patients. The study was conducted in accordance with the Declaration of Helsinki and was approved by the local ethics committee (36–222 ex 23/24).
2.2. Methods
For all Fourier transform infrared spectroscopy (FT-IR) measurements, we used the Perkin Elmer Spectrum Two spectrometer in attenuated total reflection (ATR) geometry on a diamond crystal covering the typical measurement range of 450–4000 cm−1 with a resolution of 4 cm−1. All measurements are averaged over 4 scans. For the preparation of the samples, the kidney stones were grounded as obtained and placed on the ATR crystal. The samples were dried with a hair dryer (without heating source). For scanning electron microscopy (SEM), samples were mounted (without further preparation) on aluminum stubs by using carbon impregnated double-sides tabs (Micro to Nano). They were analyzed by a Hitachi FlexSEM 1000II (Hitachi, Tokyo, Japan) using the variable pressure mode (chamber pressure 50 Pa), 20 kV acceleration voltage, and detection of back-scattered electrons. For energy dispersive X-ray microanalysis, the system AZtecOne (Oxford Instruments, Abingdon, UK) was used.
Kidney stones were analyzed using a Perkin Elmer Spectrum Two FT-IR Spectrometer. The samples were broadly categorized into nine groups: oxalate stones (CaC2O4), hydroxyapatite (Ca5(PO4)3(OH)), brushite (CaHPO4·2H2O), mixed stones (calcium oxalate/calcium phosphate), struvite stones (MgNH4PO4·6H2O), magnesium ammonium phosphate), uric acid stones (C5H4N4O3), cystine stones (C6H12N2O4S2), and other mixed stones. For this analysis, characteristic peaks of the FT-IR spectra were evaluated. The spectra were processed by normalizing them to their highest peak before evaluating the integrals. Following this preliminary categorization, the detailed composition of the mixed stones has been evaluated. Additionally, the peaks of the FT-IR measurements for calcium oxalate stones and calcium phosphate stones were compared with the existing literature. Obtained data have been analyzed statistically examining the kidney stone composition with respect to gender and age. For this purpose, the Chi-square test has been used (p < 0.05).
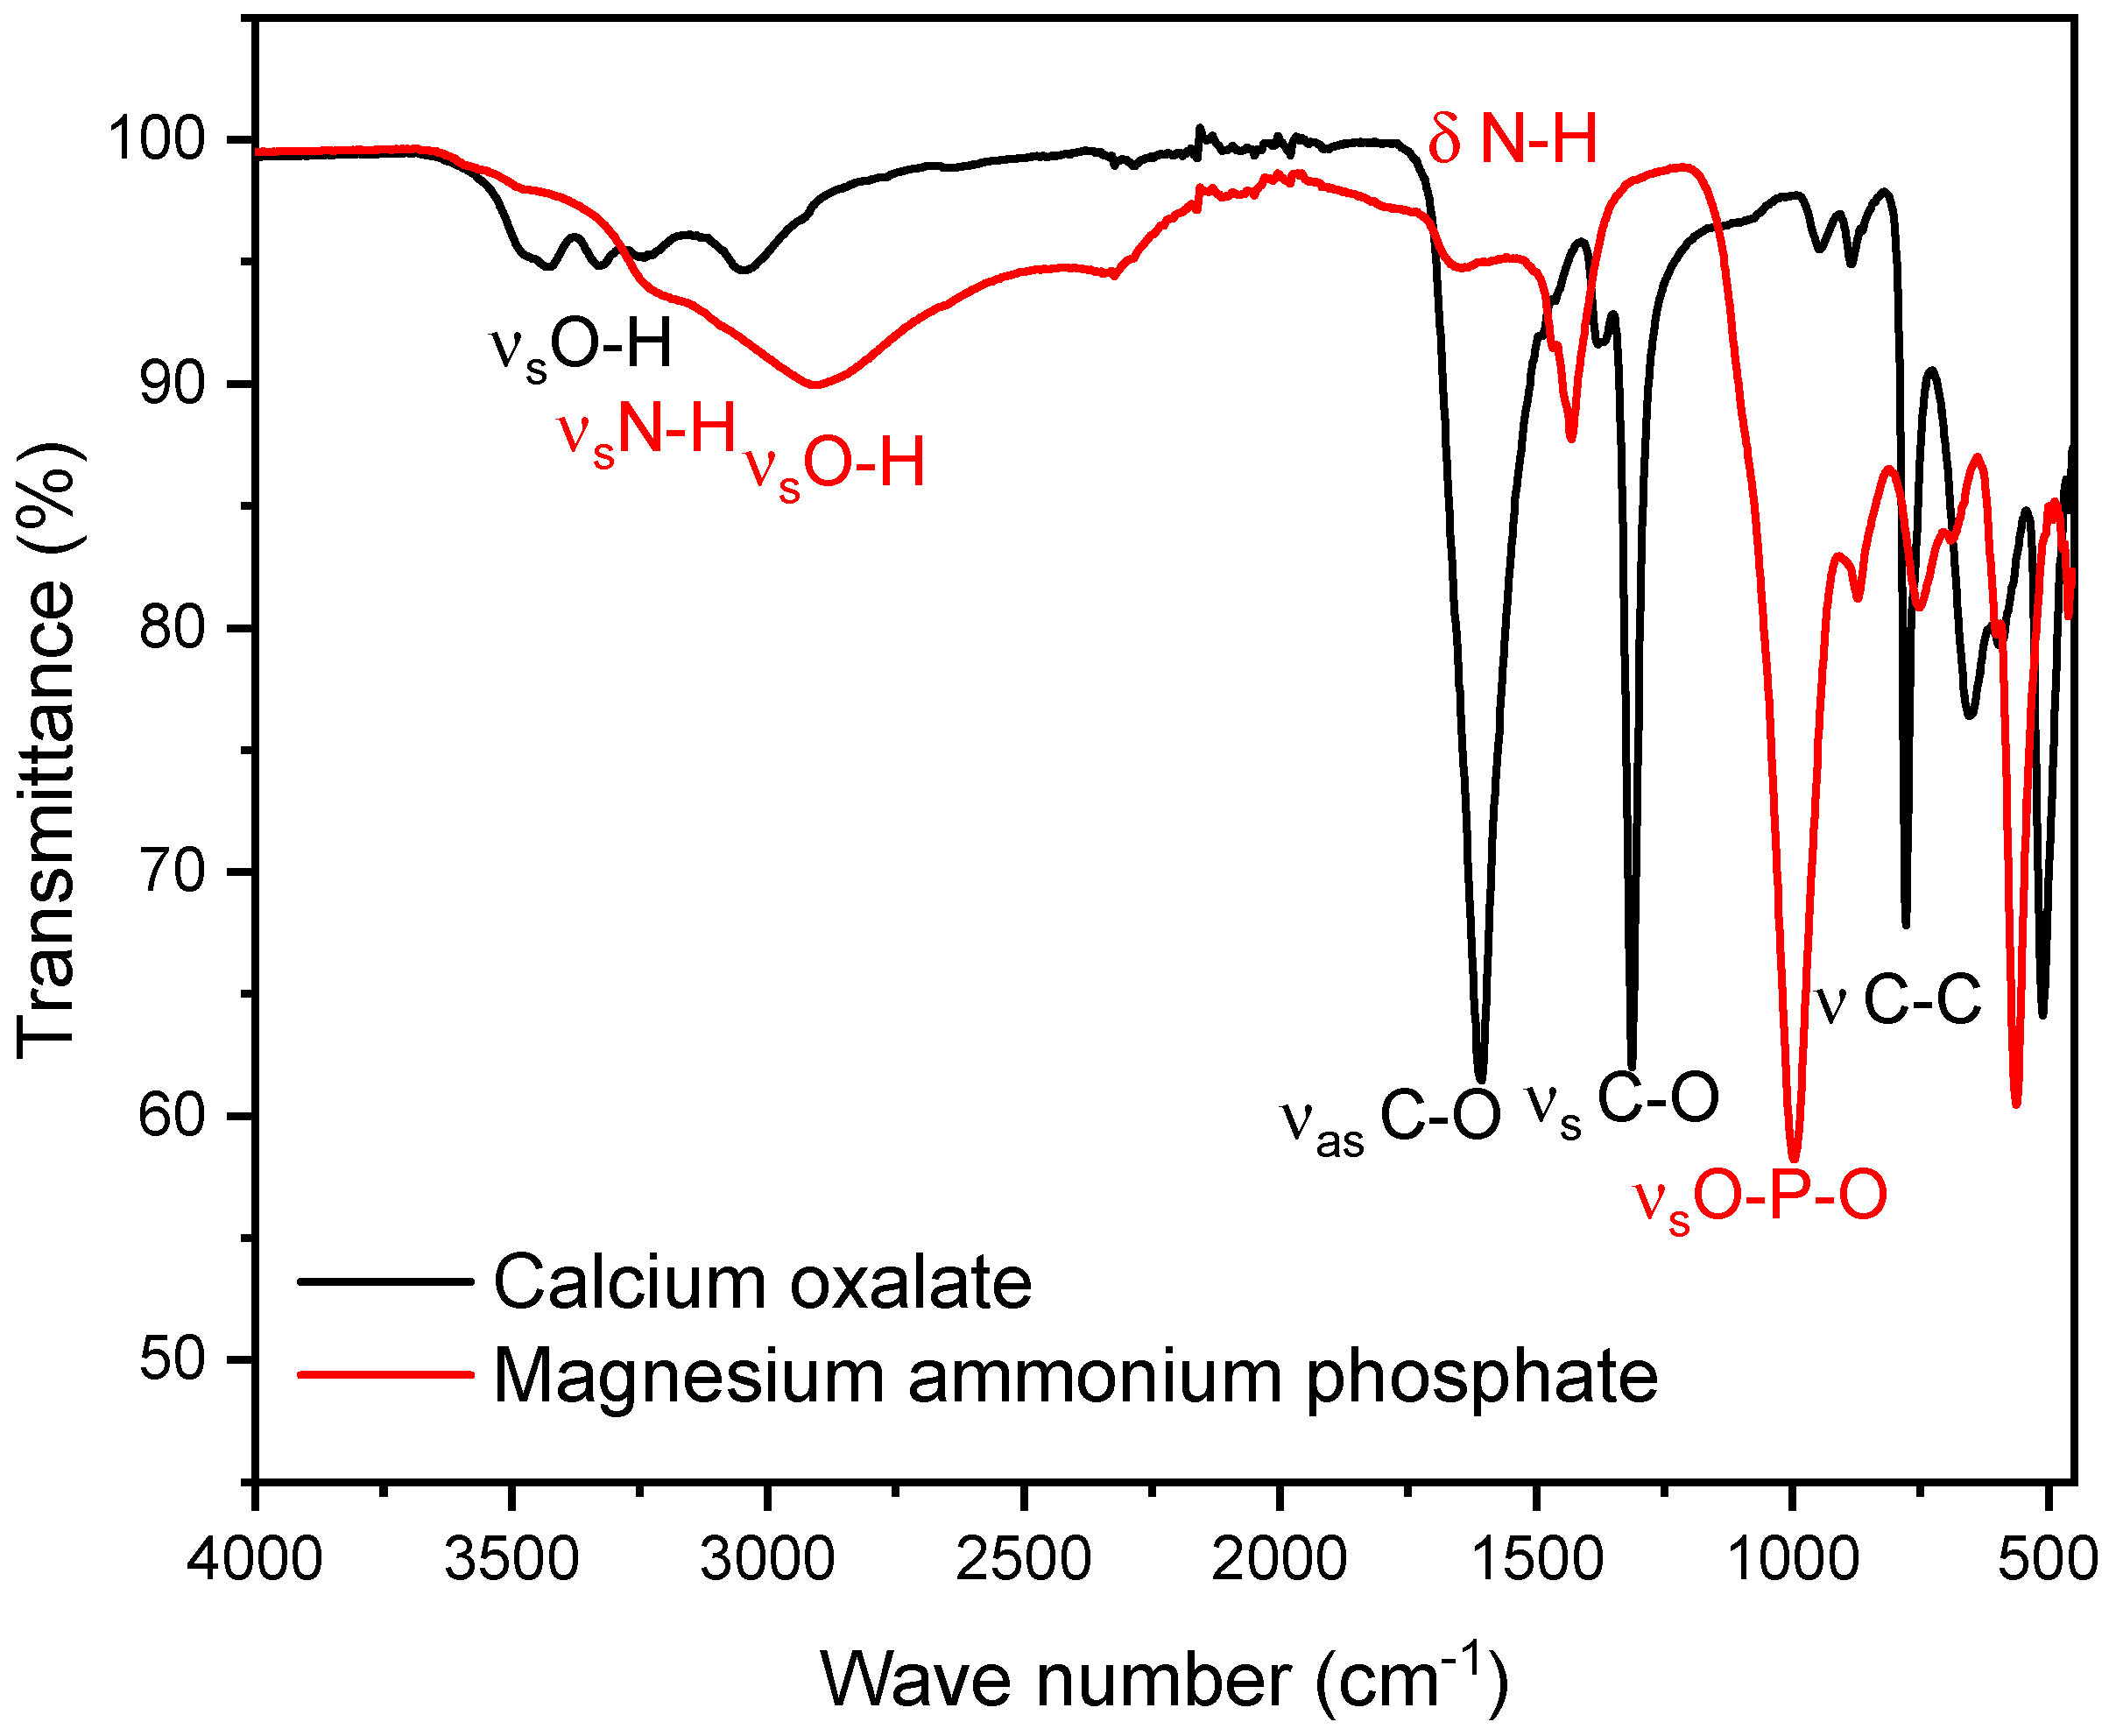
As a representative of phosphate stones, a magnesium ammonium phosphate (struvite) stone was selected. As shown below, we observed that the peaks of the P-O stretching vibrations for struvite and hydroxyapatite differ only minimally, with struvite peaks in the range of 992–1012 cm−1 and hydroxyapatite peaks in the range of 1010–1022 cm−1. For the composition of the mixed stones, pure oxalate and magnesium ammonium phosphate stones in known ratios, increasing in 10% increments, starting with 0% and ending with 100% calcium oxalate, were used. Since both calcium oxalate and magnesium ammonium phosphate stones exhibit specific infrared spectra (FT-IR) with characteristic peaks, the focus of the evaluation is on patterns at two distinct points where each stone type has isolated peaks. For calcium oxalate, the peak occurs at 1607 cm−1. For calcium phosphate stones (struvite), the relevant peaks occur at 997 cm−1, respectively. The peak at 997 cm−1 is particularly significant as it corresponds to the asymmetric stretching vibration of the P-O bond, making this method potentially effective for both hydroxyapatite and brushite [34] (Table 2). At these points, we defined specific boundaries. These boundaries were set to accurately capture the maximum peak without interference from the peaks of the other stone type (Figure 1) [35].
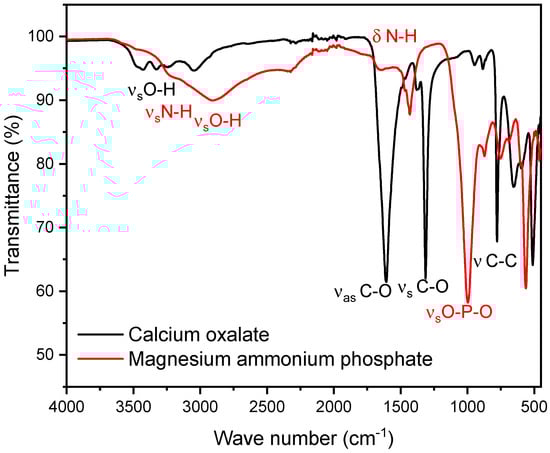
Figure 1.
The figure shows the FT-IR spectra of calcium oxalate (whewellite) (black) and struvite (red). The calcium oxalate peak selected for the mixed stone analysis is observed at 1607 cm−1, while the calcium phosphate peak is observed at 997 cm−1. These peaks do not interfere with each other, even within the boundaries used for the integral calculation.
The transmittance (%T) values were converted to absorbance. Subsequently, the integral within these boundaries has been approximated. Therefore, numerical integration using Simpson’s rule has been used. This yielded the following two integrals:
Calcium oxalate:
The integral within the boundaries of 1500 to 1700 cm−1 corresponds to the sum of all absorbance values from the IR measurement within this range:
Magnesium ammonium phosphate:
The integral within the boundaries of 915 to 1090 cm−1 corresponds to the sum of all absorbance values from the IR measurement within this range:
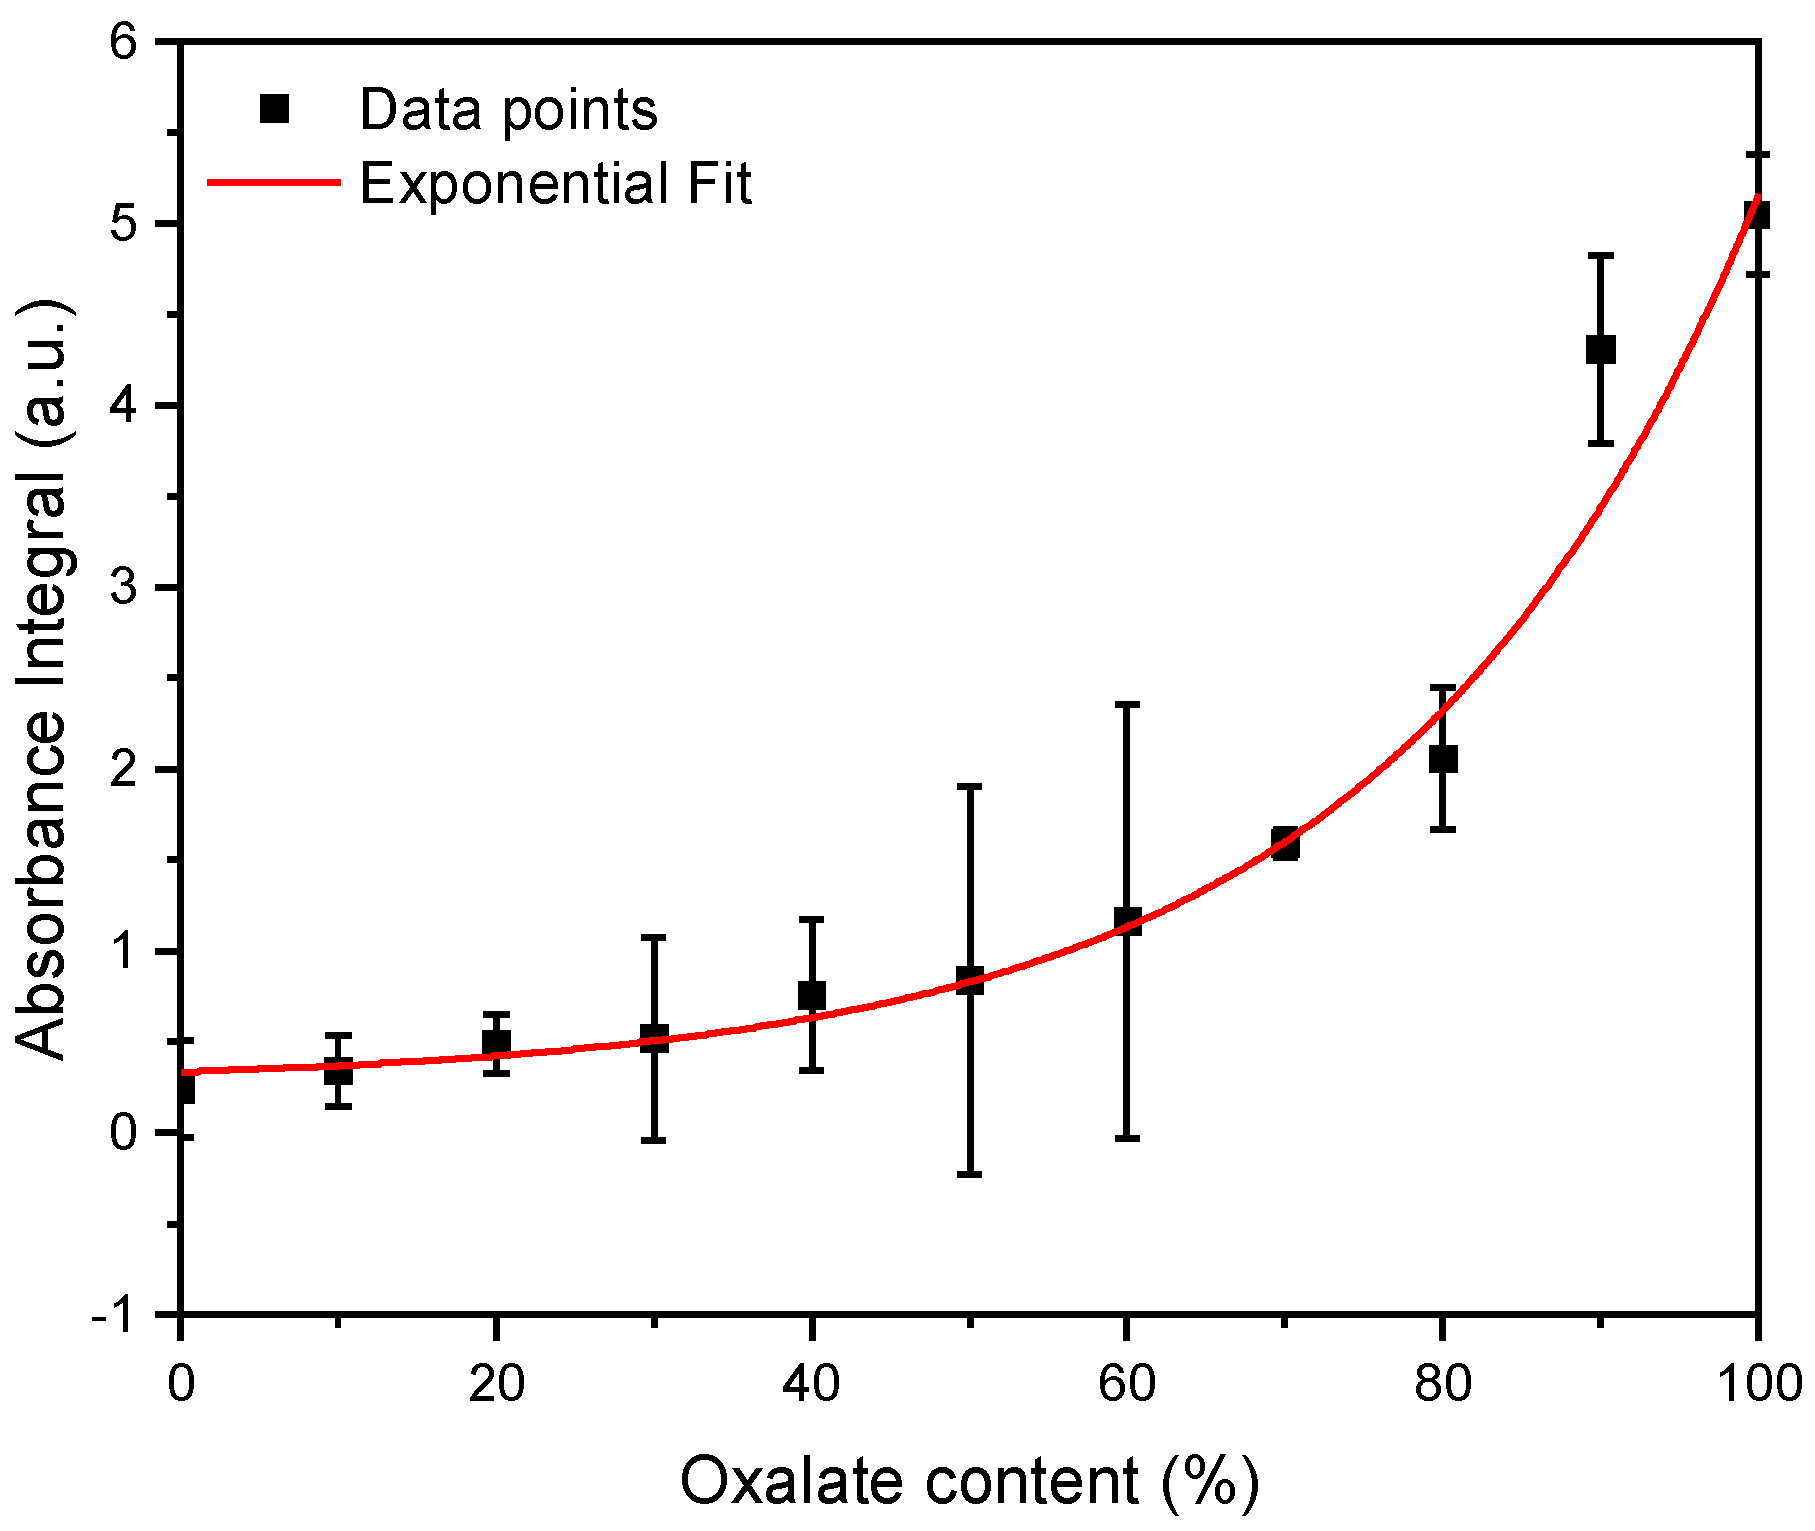
Subsequently, three independent FT-IR measurements for the calcium phosphate/oxalate mixtures with known mixing ratios were performed. Using the previously defined equations, the integrals were calculated for these measurements and the ratio of the integrals (). These measurements yielded the following curve (Figure 2).
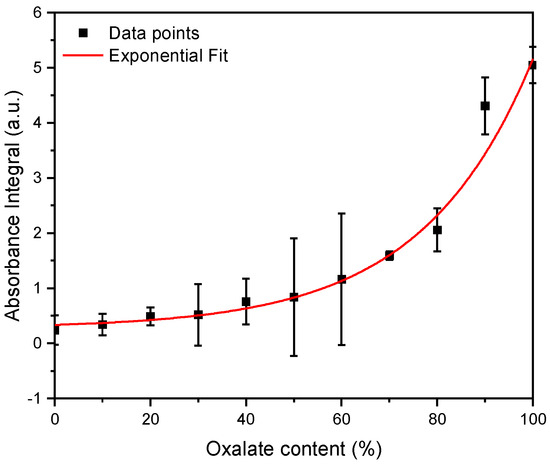
Figure 2.
FT-IR measurements were performed for magnesium ammonium phosphate (struvite) and calcium oxalate stones in known mixing ratios, ranging from 10% to 100%. The integrals within specific boundaries (calcium oxalate: 1500 to 1700 cm−1, calcium phosphate: 915 to 1090 cm−1) were calculated. The ratio of the oxalate integral to the calcium phosphate integral is reflected in these data points. n = 3.
Subsequently, the data points were fitted with an exponential function. From the resulting concentration function (Figure 2), the oxalate and calcium phosphate content in the mixed stones can be determined.
From the obtained data, the following exponential function was derived:
After establishing the exponential function, it was possible to deduce the exact oxalate content in the mixed stones from the ratio of the integrals. This was performed on 74 mixed stones.
3. Results
3.1. Overview Kidney Stones
A total of 328 kidney stones were collected for analysis. However, due to insufficient sample quality, 13 stones were excluded from the study. Consequently, 315 kidney stone samples were classified into the following eight categories: calcium oxalate, mixed stones (calcium oxalate/calcium phosphate), calcium phosphate (hydroxyapatite, brushite), uric acid, struvite (inflammation stone), cystine, and combinations containing uric acid (uric acid/oxalate; uric acid/oxalate/struvite). The distribution of these stone types is presented in Figure 3 and Table 1.
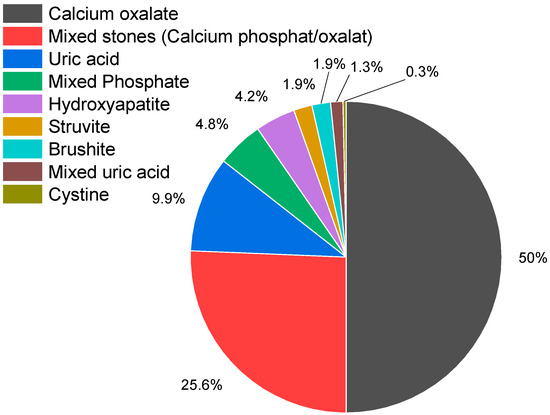
Figure 3.
Distribution of kidney stone types. Of the 315 kidney stones examined, 74.9% contained calcium oxalate (n = 236), 49.5% pure calcium oxalate (n = 156), 25.4% calcium phosphate/calcium oxalate (n = 80), calcium phosphate stones accounted for 10.8% (n = 34) (hydroxyapatite (n = 13; 13%), brushite (n = 6; 1.9%), hydroxyapatite/struvite (n = 15; 4.8%), uric acid stones for 9.8% (n = 31), struvite stones accounted for 1.9% (n = 6), and 1.3% (n = 4) were mixed stones containing uric acid. Also, one cystine stone was detected.

Table 1.
Distribution of kidney stone types by sex.
3.2. Sex Distribution
The sex distribution for each type of kidney stone was analyzed using a Chi-square test to determine statistical significance, with a threshold of p < 0.05. The total study population consisted of 315 individuals, with 105 females and 210 males (Table 1).
The statistical analysis revealed that the gender distribution for calcium phosphate stones, mixed stones, struvite stones, cystine stones, and uric acid/oxalate stones was not statistically significant. The statistical analysis indicated no significant difference in the prevalence of these stone types between males and females.
However, a statistically significant gender distribution for the male gender was observed for oxalate stones and uric acid stones. Specifically, the p-value for oxalate stones was <0.0001, and for uric acid stones, it was 0.002, both indicating a significant difference in the prevalence of these stones between genders.
3.3. Age Distribution and Age-Related Prevalence
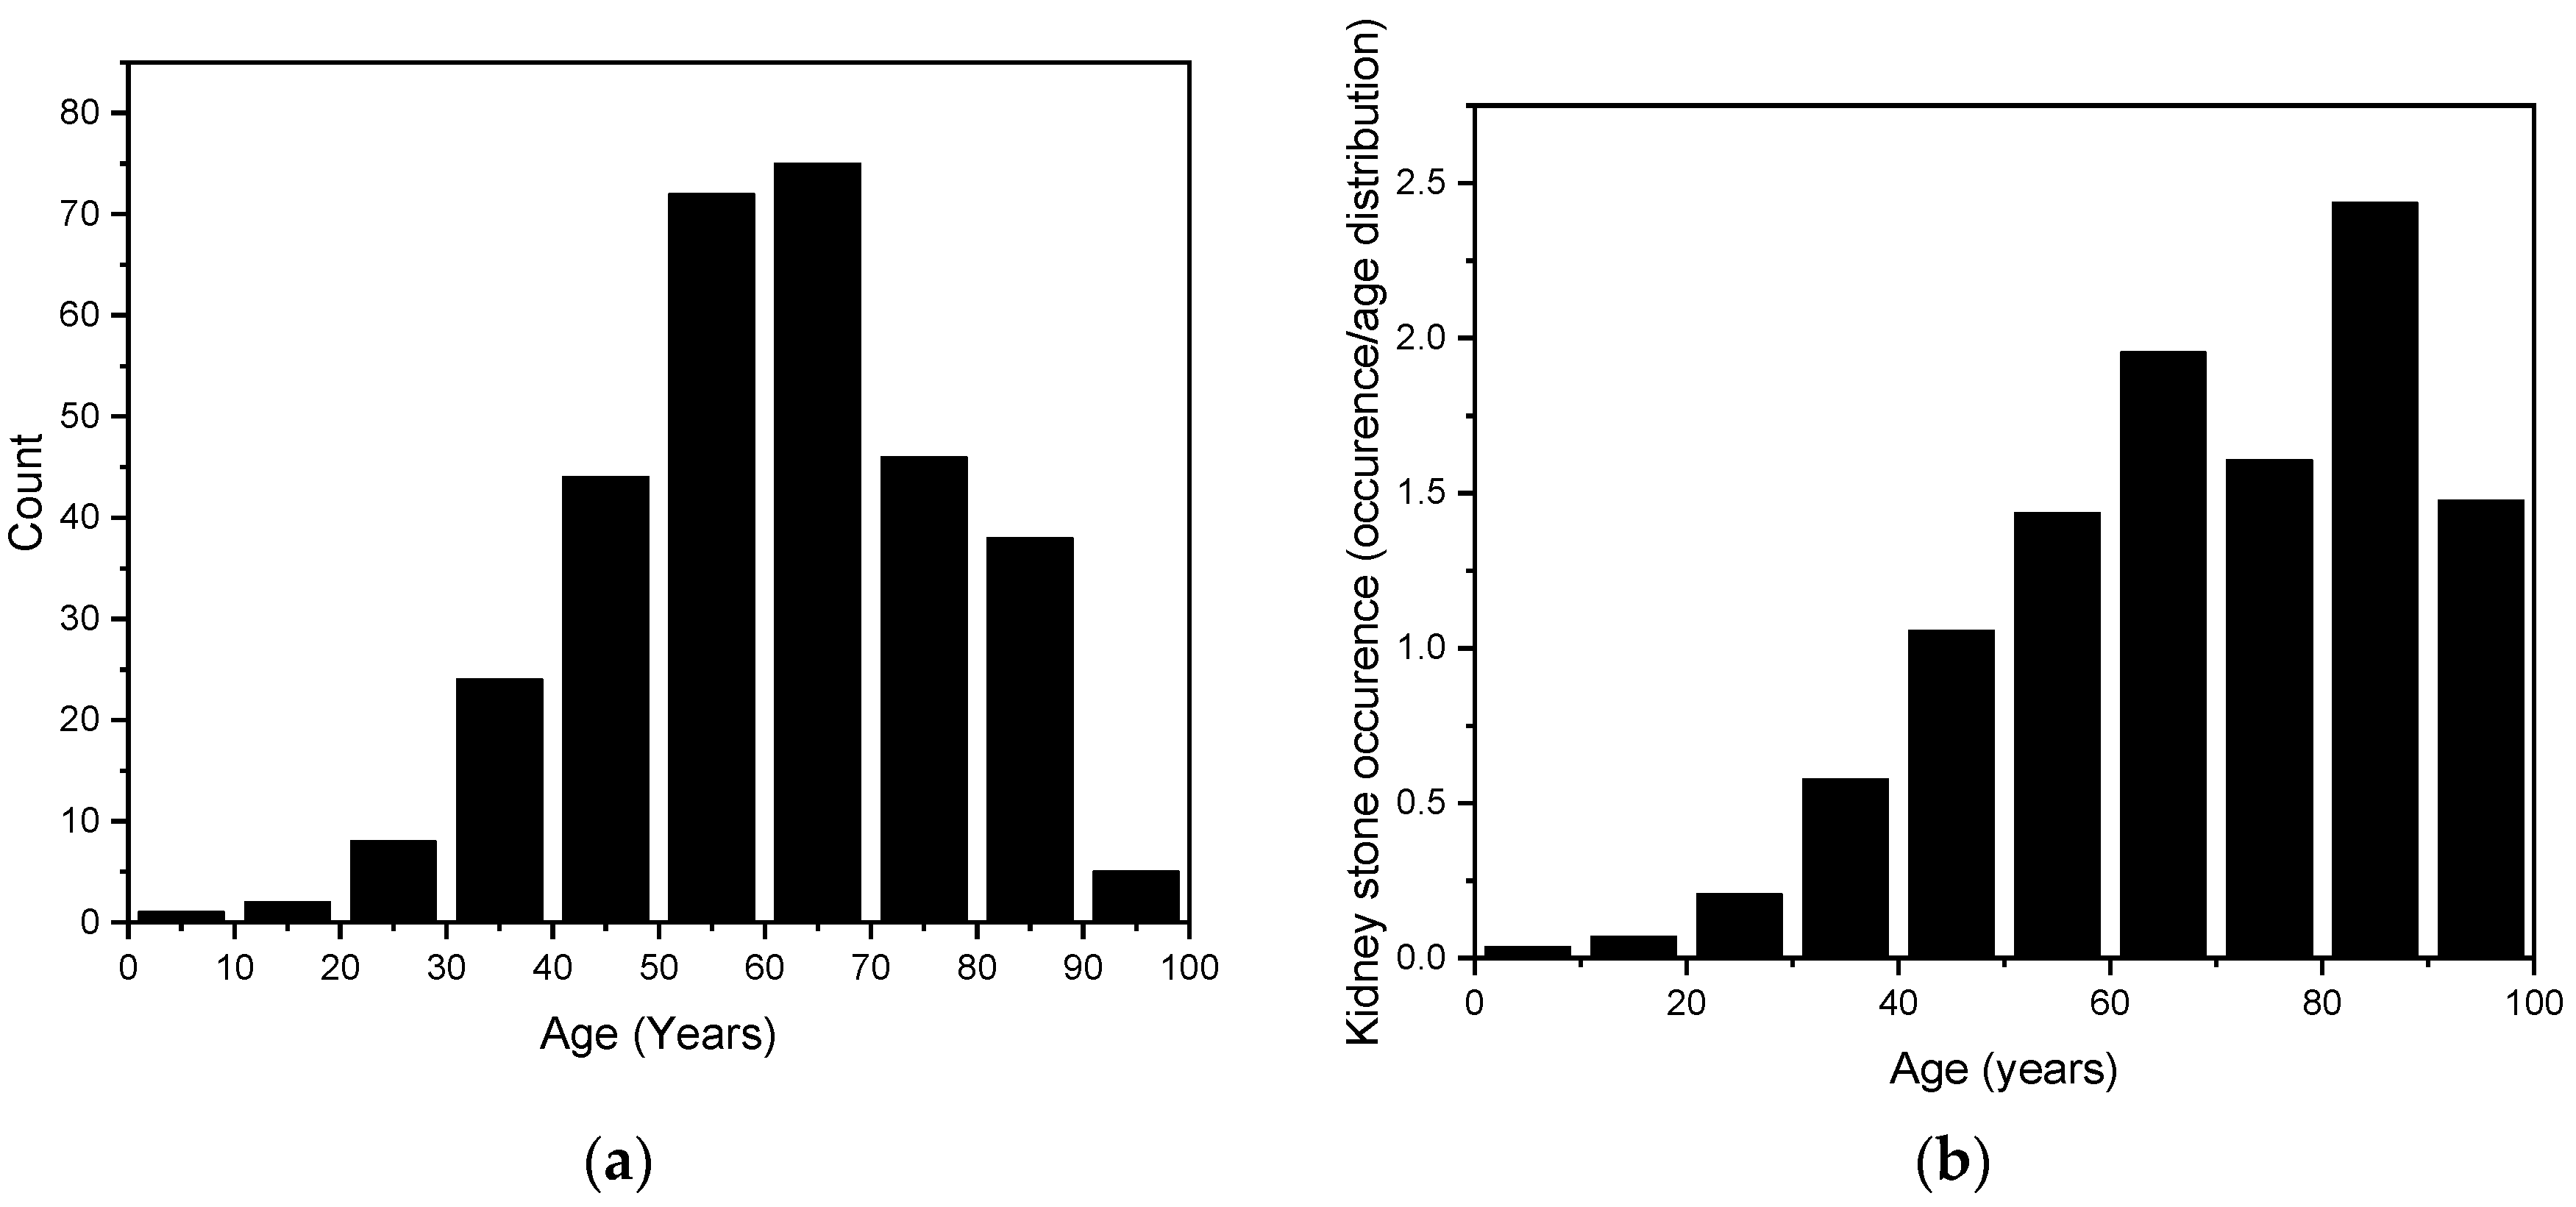
The age range of the randomly selected kidney stone patients was from 9 years to 98 years, with a mean age of 61.2 years ± 16.3 years. To better illustrate the overall distribution, this range has been divided into 10-year categories. The results are shown in Figure 4. In the assessment of the data distribution, points closely aligned with the normal distribution curve suggested a Gaussian distribution. To confirm this, a normality test was conducted using QQ-Plot analysis. Furthermore, the Kolmogorov–Smirnov test corroborated these findings with a statistic of D = 0.033535 and a p-value of 0.873, indicating no significant deviation from normality and supporting the hypothesis that the data follow a normal distribution.
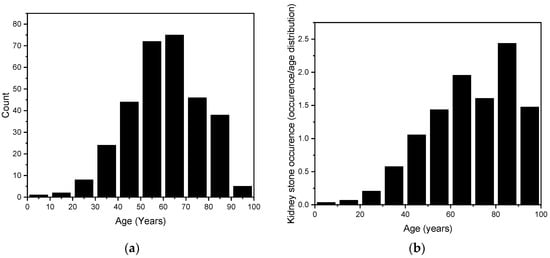
Figure 4.
(a) The age distribution of our randomly selected 315 kidney stones. (b) The stone counts are age-weighted according to the population distribution of Styria (2020) and presented as the number of stones per thousand inhabitants, to account for varying population sizes across age groups [36].
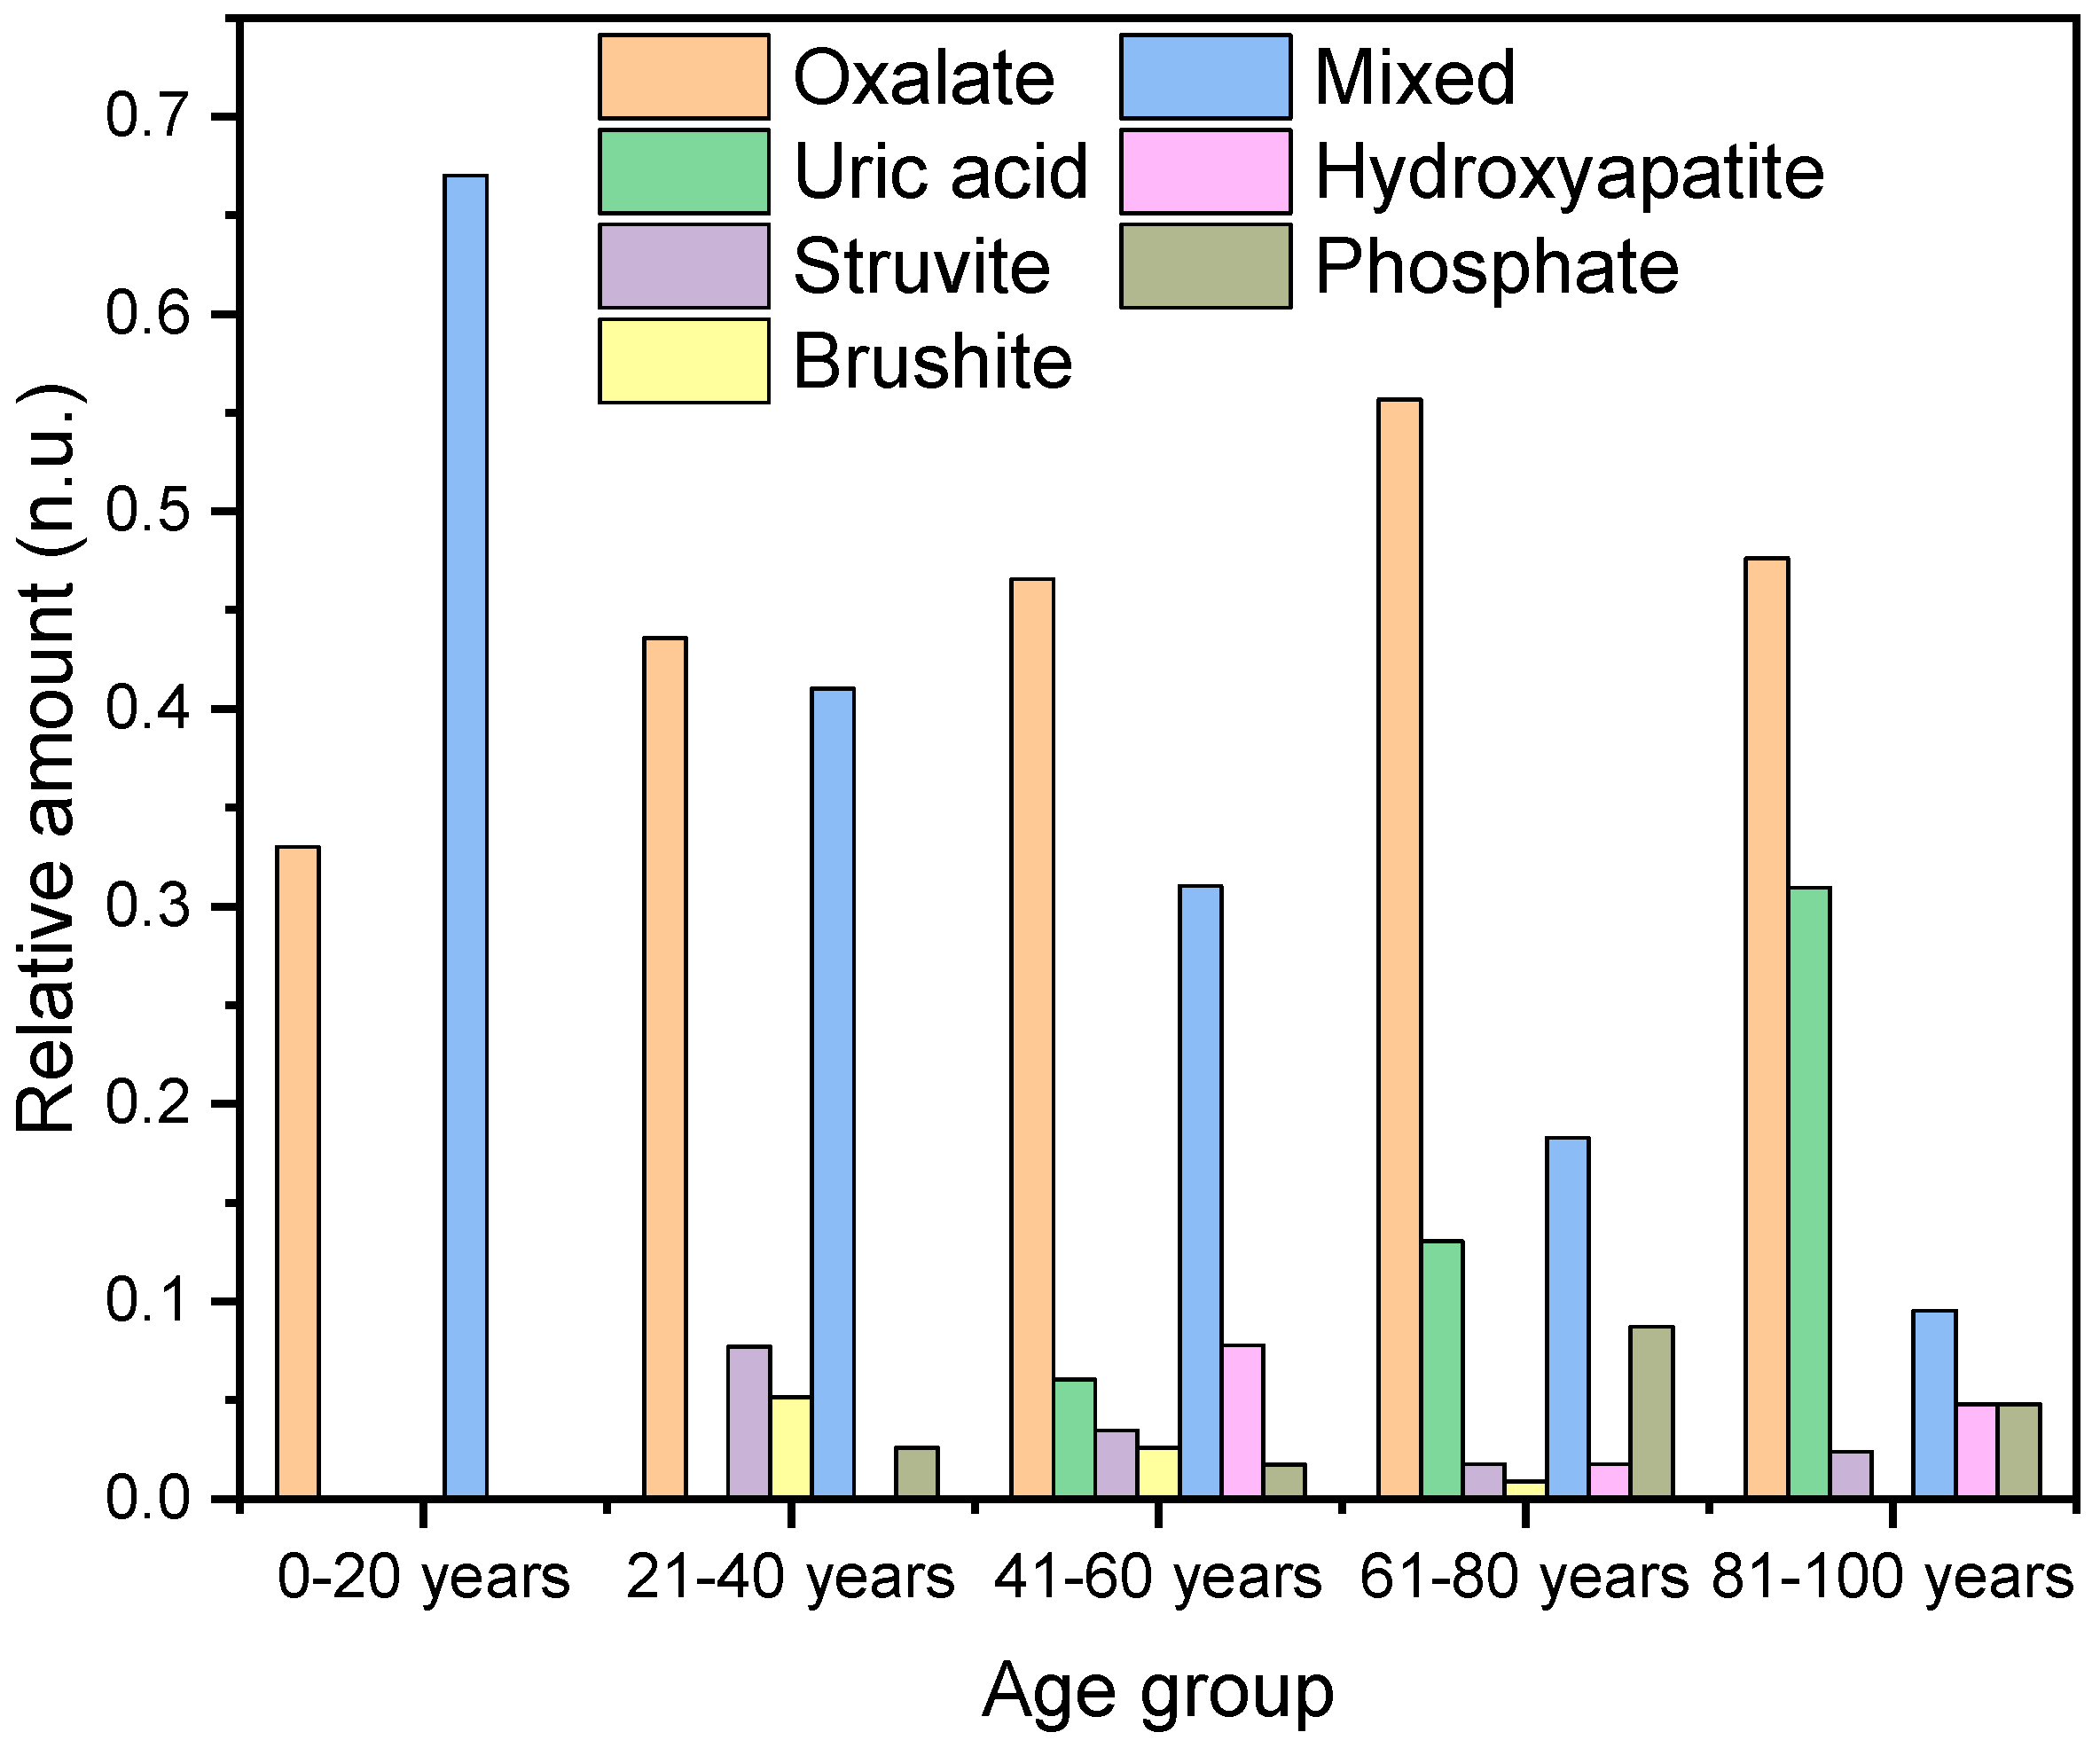
Next, we examined the prevalence probability of different types of kidney stones in relation to age. This analysis shows that different types of kidney stones are more prevalent depending on age. Therefore, the patient ages were divided into five groups: 0–20 years, 21–40 years, 41–60 years, 61–80 years, and 81–100 years.
Among patients under 20 years of age, stones with a high oxalate content were observed. This included one pure oxalate stone and two calcium oxalate/calcium phosphate mixed stones with oxalate contents of 78% and 91%, respectively (Figure 5).

Figure 5.
The graph illustrates the percentage distribution of different types of kidney stones across various age groups.
In the age category of 21 to 40 years (n = 39), oxalate-containing stones are also the most prevalent, accounting for 44% (n = 17) of the cases, followed by mixed stones at 41% (n = 16). Additionally, struvite stones are observed in 8% (n = 3) of the cases, and there is a 5% (n = 2) incidence of brushite stones and 3% incidence of hydroxyapatite/struvite (n = 1) (Figure 5).
A very similar pattern was observed in the age category of 41–60 years. Oxalate stones accounted for 47% (n = 54) of the cases, mixed stones for 31% (n = 36), hydroxyapatite for 8% (n = 9), brushite for 3% (n = 4), hydroxyapatite/struvite for 2% (n = 2), and uric acid stones for 6% (n = 7).
In the category of 61–80 years, 56% (n = 64) of the case were oxalate stones, 18% mixed stones (n = 21), 13% uric acid (n = 15), 2% hydroxyapatite (n = 2), 2% struvite (n = 2), and 1% brushite (n = 1).
In the category of 81–100 years, we found 48% calcium oxalate (n = 20), 31% uric acid (pure and mixed) (n = 13), 15% 10% mixed stones (n = 4), 5% hydroxyapatite (n = 2), 5% hydroxyapatite/struvite (n = 2), and 2% struvite (n = 1).
In the category of 0–20 years (n = 3), 33% are calcium oxalate and 66% are mixed stones. For 21–40 years (n = 39), 44% are calcium oxalate, 8% struvite, 5% brushite, 41% mixed stones, and 3% hydroxyapatite/struvite. In the category of 41–60 years (n = 116), 47% are calcium oxalate, 31% mixed stones, 8% hydroxyapatite, 6% uric acid (pure and mixed), 3% struvite, 3% brushite, 2% hydroxyapatite/struvite. For 61–80 years (n = 115), 56% are calcium oxalate, 18% mixed stones, 13% uric acid stones (pure and mixed), 2% struvite, 1% brushite, 2% hydroxyapatite, and 9% hydroxyapatite/struvite. In the category of 81–100 years (n = 42), 48% are calcium oxalate, 31% uric acid (pure and mixed), 2% struvite, 10% mixed stones, 5% hydroxyapatite, and 5% hydroxyapatite/struvite. The average age of patients with calcium oxalate stones is 61.6 ± 16.3 years (n = 156), with a slightly higher average for females, 62.3 ± 16.2 years (n = 37), compared to males, 61.4 ± 15.4 years (n = 119) (Table 2). For hydroxyapatite stones, the overall average age is 59.1 ± 14.5 years (n = 13). Among females, the mean age is 58.6 ± 13.48 years (n = 10), while for males, it is 60.7 ± 17.3 (n = 3). In comparison, the average age for brushite stones is 52.5 ± 11.1 years. The mean age among males is 55 ± 10.5 years (n = 59), and for the sole female, it is 40 years (n = 1). In addition to the previously mentioned phosphate-containing stones, there were also 15 mixed stones composed of hydroxyapatite and struvite. The average age for these stones was 65.8 ± 15.6 years (n = 15). The average age of the women was significantly higher at 74.5 ± 7.8 years (n = 6) compared to that of the men, who had an average age of 60.0 ± 16.7 years (n = 9).
Table 2.
Distribution of age by kidney stone type and sex.
Patients with mixed stones (calcium phosphate/calcium oxalate) have an average age of 52.7 ± 15.4 years (n = 79), with females averaging 48.7 ± 15.0 years (n = 36) and males 56.2 ± 14.7 years (n = 43). Uric acid stones show a higher average age of 73.3 ± 12.3 years (n = 31), with females at 71.7 ± 12.44 years (n = 7) and males at 73.7 ± 12.3 years (n = 24).
Struvite stones (magnesium ammonium phosphate) present an average age of 52.0 ± 16.0 years (n = 10), with a notable gender disparity: females average 58.2 ± 14.2 years (n = 5) while males average 58.2 ± 14.2 years (n = 5). For cystine stones, the data show an average age of 45.0 years (n = 1) for a single female patient, with no male data available.
In the case of urate/oxalate stones, the average age is 74.0 years (n = 3), with a single female patient at 86.0 years (n = 1) and two male patients averaging 68.0 years (n = 2). Lastly, the urate/oxalate/struvite stone type shows an average age of 56.0 years (n = 1), based on a single female patient. Optical images of all stones are highlighted in the SI (Figures S1, S3, S5, S7 and S9).
3.4. Calcium Oxalate Stones
A total of 156 calcium oxalate stones were analyzed, with 37 (24%) from females and 119 (76%) from males. The average age of kidney stone patients with oxalate stones was 61.6 ± 15.6 years (n = 156), with a slightly higher average for females, 62.3 ± 16.2 years (n = 37), compared to males, 61.4 ± 15.4 years (n = 119). The maximum age was 98 years, and the minimum age was 9 years. In all these measurements, peaks were observed in the range of 1604–1615 cm−1 and 1312–1319 cm−1 (Figure 6). This can be explained by the presence of characteristic vibrations which are present in oxalate ions originating from calcium oxalate crystals. The peak at 1604–1615 cm−1 corresponds to the asymmetric stretching vibration of the C=O bond, while the peak at 1312–1319 cm−1 corresponds to the symmetric stretching vibration of the C-O bond. These specific vibrations are indicative of carboxy groups and therefore the oxalate ion’s presence within the stone matrix.
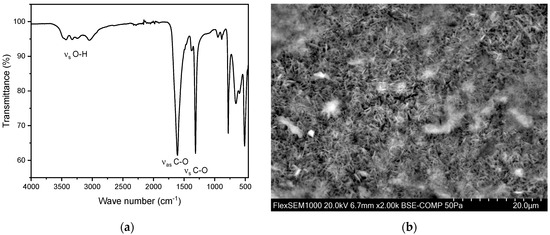
Figure 6.
(a) FT-IR spectrum of a kidney stone containing whewellite (calcium oxalate monohydrate, CaC2O4·H2O). The characteristic asymmetric OH-stretch can be observed between 3000–3550 cm−1. Two distinct peaks at 1604–1615 cm−1 and 1312–1319 cm−1 indicate carboxy groups. (b) SEM image of a whewellite stone.
Calcium oxalate stones can be differentiated into whewellite (calcium oxalate monohydrate, CaC2O4·H2O) and weddellite (calcium oxalate dihydrate, CaC2O4·2H2O). This distinction can be made using FT-IR, primarily by examining the characteristic asymmetric O-H stretch vibrations of whewellite in the range of 3000–3550 cm−1. In this study population, an account of 146 whewellite stones (93.6%) and 10 weddellite stones (6.4%) has been found. The relative frequency as well as the obtained IR spectra align with the relevant literature [27,35,37,38,39]. The SEM image (Figure 6b) indicates needle-shaped crystals for the oxalate stones analyzed [40]. Moreover, EDX indicates a composition containing the elements calcium, oxygen, and carbon (Figure S2 and Table S1).
3.5. Calcium Phosphate Stones
Calcium phosphate mainly appears in three different minerals: apatite (hydroxyapatite and carbonate apatite) and brushite [9]. In our study, we were unable to identify any instances of carbonate apatite. However, we documented 13 occurrences of hydroxyapatite and six instances of brushite. Additionally, we identified 15 mixed compositions of hydroxyapatite and brushite. A total of 13 hydroxyapatite stones were analyzed, with 10 (76.9%) stones derived from females and three (23.1%) from males. The average age of kidney stone patients with hydroxyapatite was 59.1 years, with a maximum age of 88 years and a minimum age of 43 years. The average age differs by gender with females averaging 58.6 ± 13.5 years (n = 10) and males 60.7 ± 17.3 years (n = 3).
Additionally, we observed six brushite stones. Of these, five (83.3%) were found in men and only one (16.7%) in a woman. The average age of the men was 55 ± 10.5 years, while the woman with the brushite stone was 40 years old.
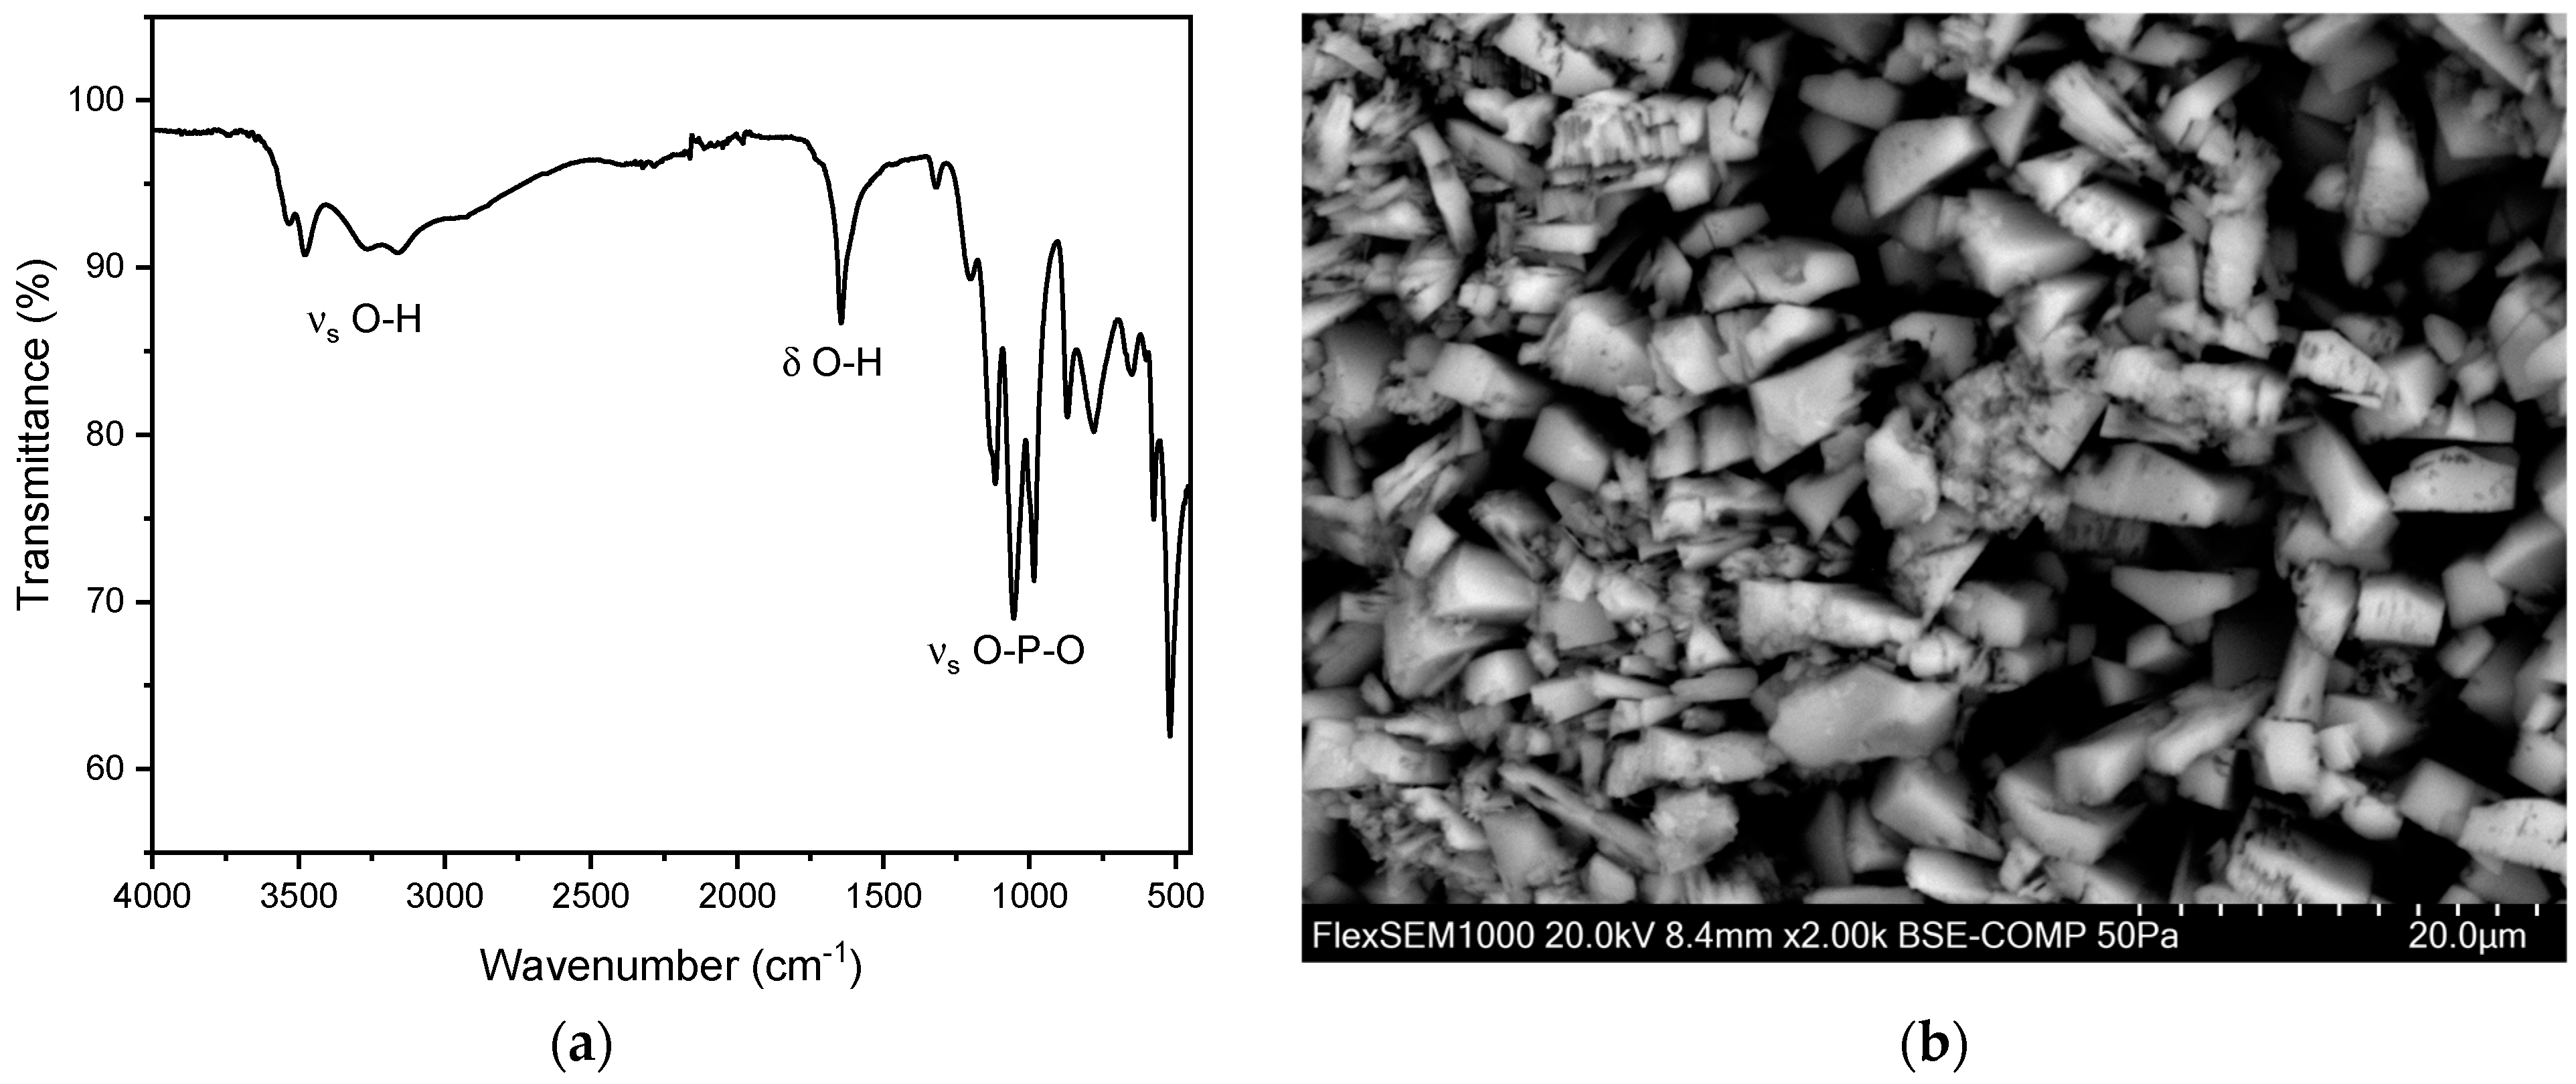
In addition to the pure kidney stones, we also observed 15 mixed stones composed of hydroxyapatite and struvite. Of these 15 mixed stones, nine (60.0%) were found in men and six (40.0%) in women. The overall average age for these mixed stones was 65.8 ± 15.6 years. The average age for men was 60.0 ± 16.7 years, and for women, it was 74.5 ± 7.8 years. Peaks were observed in the range of 1000–1100 cm−1 and 560–600 cm−1 (Figure 7) [35,37]. This can be explained by the presence of characteristic vibrations of the phosphate ions. The peak at around 1010–1020 cm−1 corresponds to the asymmetric stretching vibration of the P-O bond, while the peak at 600 cm−1 corresponds to the bending vibration of the P-O bond. These specific vibrations are indicative of the phosphate ion’s presence within the stone matrix. Additionally, the presence of hydroxyl groups (OH) was confirmed by peaks at 3000–3500 cm−1 and 1630 cm−1. The peak at 3000 cm−1 corresponds to the stretching vibration of the O-H bond, while the peak at 1630 cm−1 corresponds to the bending vibration of the O-H bond. These peaks further confirm the presence of hydroxyapatite in the calcium phosphate stones [35]. For hydroxyapatite, cauliflower-shaped crystals are visible in the SEM images (Figure 7b). The surface morphology reveals small, spherical particles, often around 5–10 µm in diameter, which are composed of amorphous material with tiny crystalline structures on their surface. These particles are tightly packed and cemented together, giving the stone a granular texture [41]. Here, the EDX indicates the elements phosphorous and oxygen (Figure S4 and Table S2).
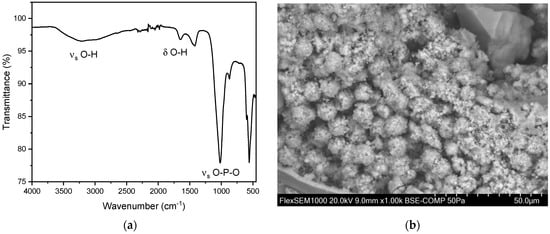
Figure 7.
(a) FT-IR spectrum of a hydroxyapatite stone. The distinct peaks can be observed at 1019 cm−1 and 559 cm−1. In our study population, we observed the two distinct peaks of hydroxyapatite stones between 1010–1022 cm−1 and 558–561cm−1. (b) SEM image of hydroxyapatite stone.
For brushite, similarly to hydroxyapatite, both peaks corresponding to O-H vibrations and to P-O vibrations can be observed. The best identifiers for brushite are the three distinct P-O stretch vibration modes ranging from 900–1100 cm−1. These sharp bands are not observed in other phosphate-based kidney stones. Similar to hydroxyapatite and struvite, the P-O bending mode can be observed at 560–600 cm−1. Moreover, the O-H stretching and O-H bending vibrations at 3500–3600 and 1650 cm−1, respectively, are shifted to higher wave numbers in comparison to hydroxy apatite. Moreover, the vibrations corresponding to O-H are much more prominent in brushite (Figure 8) than in hydroxyapatite or struvite.
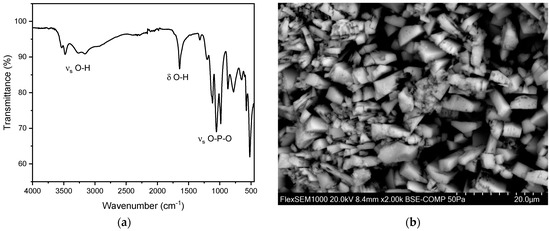
Figure 8.
(a) FT-IR spectrum of a brushite stone. (b) SEM image of a brushite stone.
Under the Scanning Electron Microscope (SEM), brushite stones exhibit a characteristic structure with plate-like crystals that are radially arranged. Rectangular-shaped crystals are also visible in the SEM images (Figure 8b). The overall structure is relatively porous, and the crystal formations lack a clear order, appearing as loose aggregates of well-developed crystals, consistent with the previous literature [41]. Here, the EDX analysis indicates the presence of phosphorus and oxygen (Figure S6 and Table S3), further confirming the composition of the brushite stones.
3.6. Struvite Stones
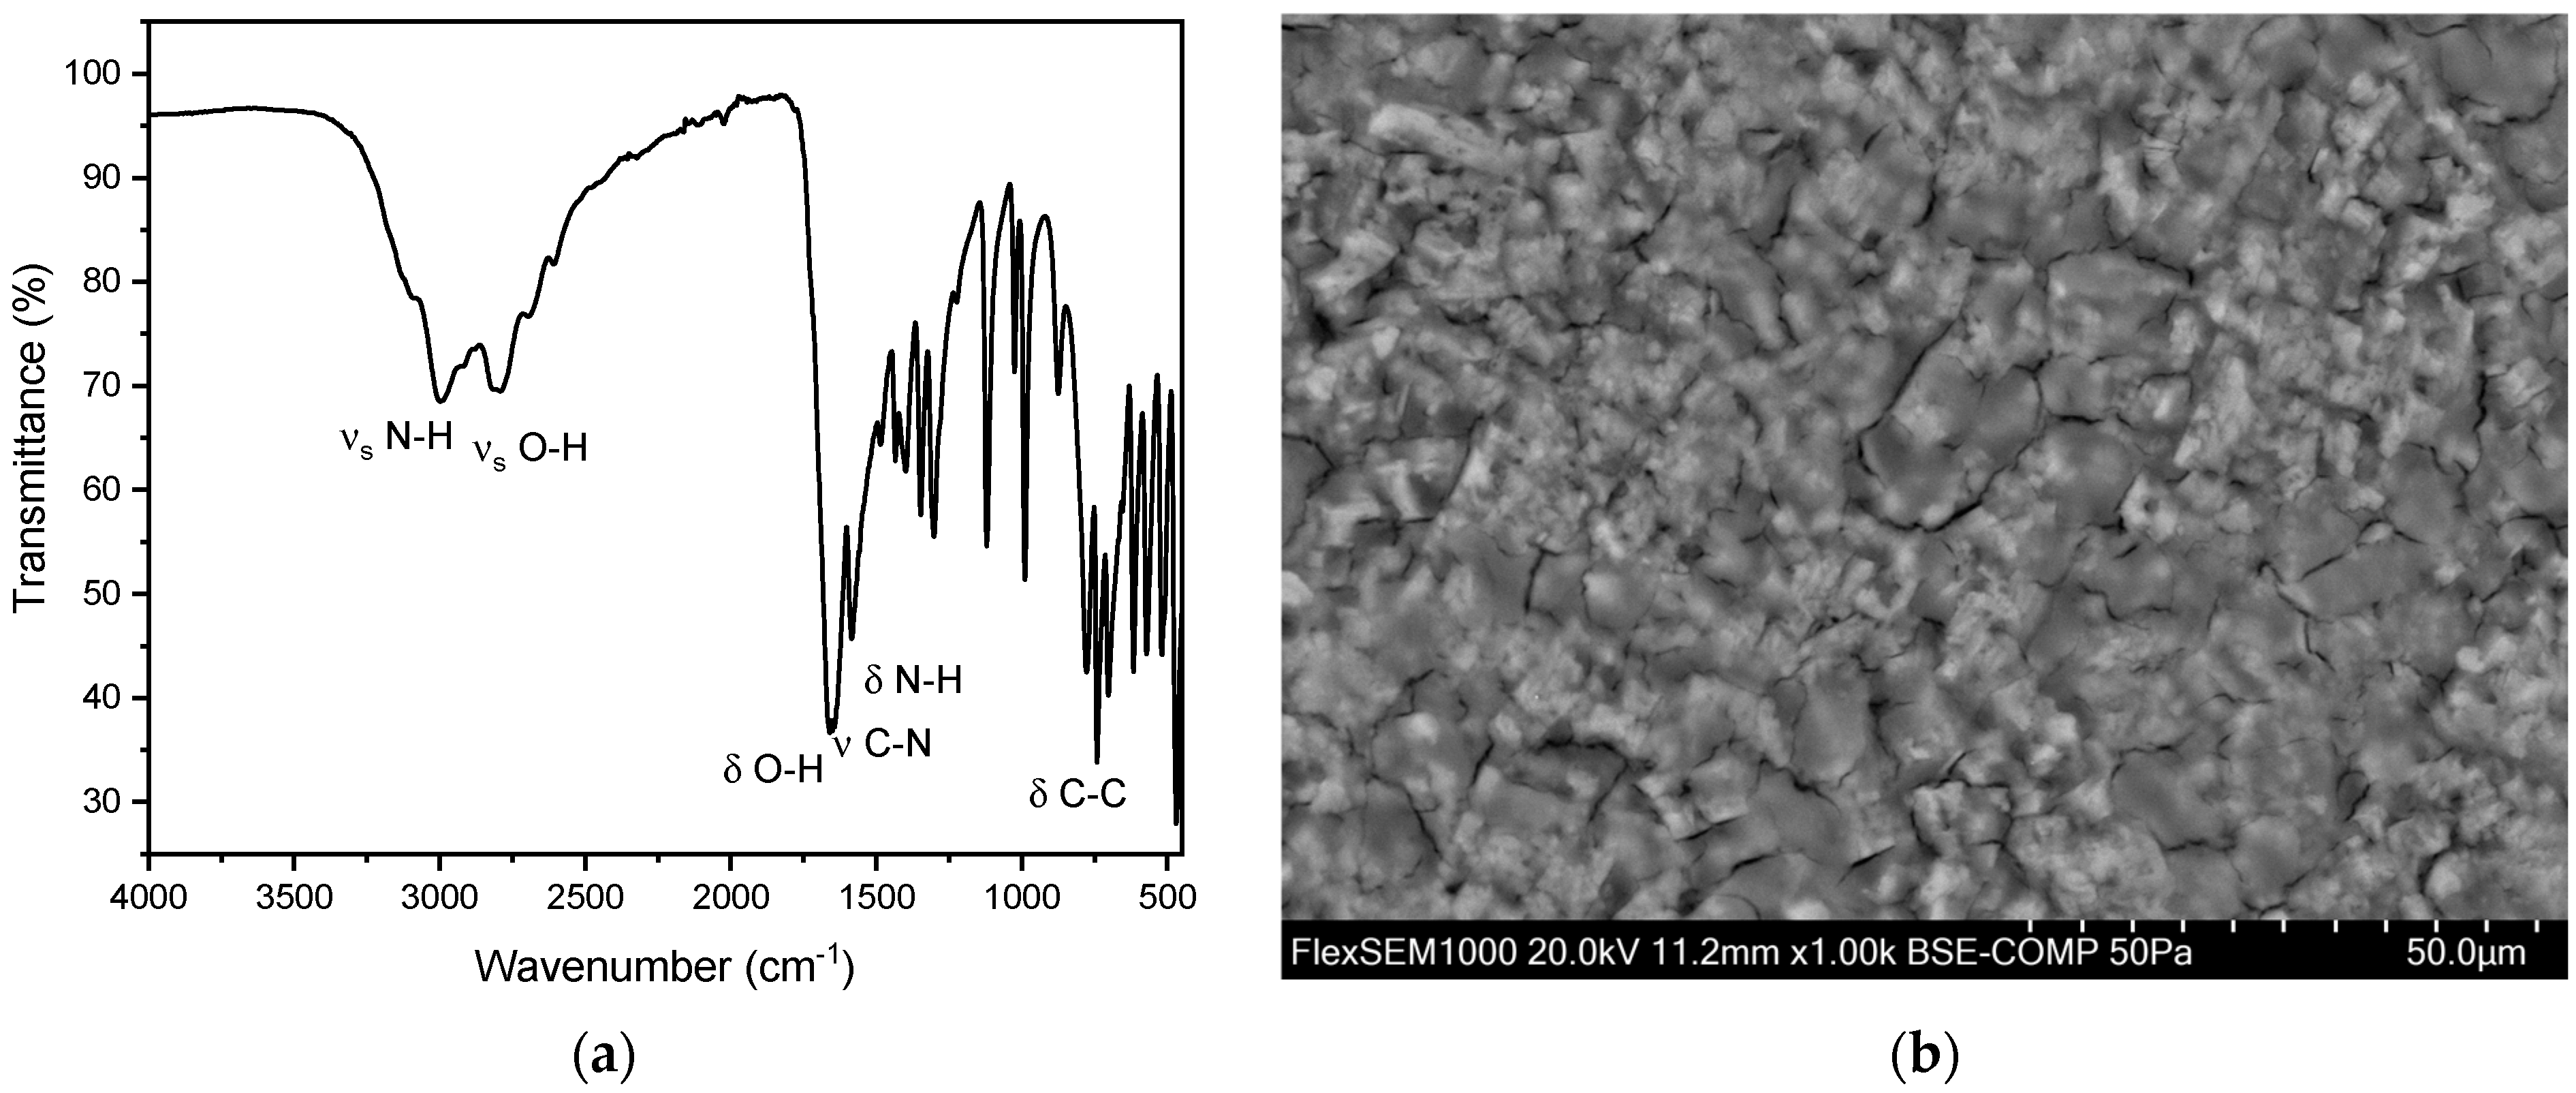
A total of 10 struvite stones were analyzed, with five (50.0%) from female patients and five (50.0%) from male patients. The average age of patients with struvite stones was 52.0 ± 16.0 years, with a maximum age of 84 years and a minimum age of 33 years. FT-IR spectroscopy identified peaks in the range of 1010 cm−1 and 570 cm−1. The peak at 1010 cm−1 corresponds to the asymmetric stretching vibration of the P-O bond, while the peak at 1570 cm−1 corresponds to the bending vibration of the N-H bond, indicative of the phosphate and ammonium ions present within the struvite matrix (Figure 9). The N-H stretching vibration at 3500 cm−1 allows to distinguish between struvite and other non-ammonia containing phosphate crystals. In all these measurements, peaks were observed in the range of 996 cm−1 and 600 cm−1 (Figure 9) [35,37]. This can be explained by the presence of characteristic vibrations of the phosphate ions. The peak at 996 cm−1 corresponds to the asymmetric stretching vibration of the P-O bond, while the peak at 600 cm−1 corresponds to the bending vibration of the P-O bond. These specific vibrations are indicative of the phosphate ion’s presence within the stone matrix. The main P-O vibrations of struvite are shifted to lower wave numbers in comparison to hydroxyapatite and brushite. Additionally, the presence of hydroxyl groups (OH) was confirmed by peaks at 3000 cm−1 and 1630 cm−1. The peak at 3000 cm−1 corresponds to the stretching vibration of the OH bond, while the peak at 1630 cm−1 corresponds to the bending vibration of the OH bond. These peaks further confirm the presence of struvite in the calcium phosphate stones [35]. Struvite stones typically exhibit a crystalline or irregular shape under SEM [41]. In our case, the surface is almost entirely covered by round structures, indicating the presence of bacteria and blood cells. However, well-developed struvite crystals up to 100 µm in size can be observed between these round structures, particularly at the lower right edge (Figure 9b). This is consistent with a struvite stone, which is also known as an infection stone, commonly associated with bacterial urinary tract infections [41]. EDX indicates a composition containing phosphorous, oxygen, and manganese with low amounts of nitrogen (Figure S8 and Table S4).
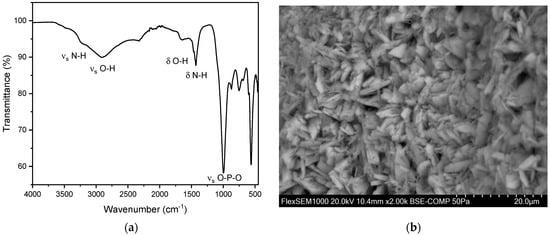
Figure 9.
(a) FT-IR spectrum of struvite stones. We observed two distinct peaks of struvite between 992–1012 cm−1 and 559–563 cm−1. (b) SEM image of a struvite stone.
3.7. Uric Acid Stones
A total of 31 uric acid stones were analyzed, with seven (22.6%) from females and 24 (77.4%) from males. The average age of kidney stone patients with uric acid stones was 73.3 years, with a maximum age of 90 years and a minimum age of 45 years. In all these measurements, peaks were observed in the range of 1650 cm−1 and 1430 cm−1. This can be explained by the presence of characteristic vibrations of the urate ions. The peak at 1650 cm−1 corresponds to the C=O stretching vibration, while the peak at 1430 cm−1 corresponds to the C-N stretching vibration. These specific vibrations are indicative of the uric acid’s presence within the stone matrix (Figure 10). The OH stretching vibrations (3100–3500 cm−1) indicate an anhydrate form of urate in this spectrum. However, partially hydrated (monohydrate/dihydrate) urate stones were observed as well. The spectra usually indicate the hydrate at around 3500 cm−1 corresponding to OH stretch (Figure 11). However, it is quite challenging to evaluate hydration due to drying of particles on the ATR crystal. The SEM image indicates a flat surface with cracks and slightly rectangular shaped crystals. In our case, this suggests a compact uric acid stone (type Ia), which is characterized by a central or surface-located core, composed of loosely connected UAA crystals, with plate-like, columnar crystals radiating outward from the core and forming concentric laminations [41]. The EDX indicates an elementary composition containing oxygen, carbon, and nitrogen (Figure S10 and Table S5).
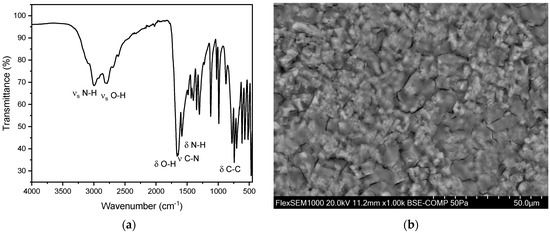
Figure 10.
(a) FT-IR spectrum of a pure uric acid stone in an anhydrous state. (b) SEM image of a urate stone.
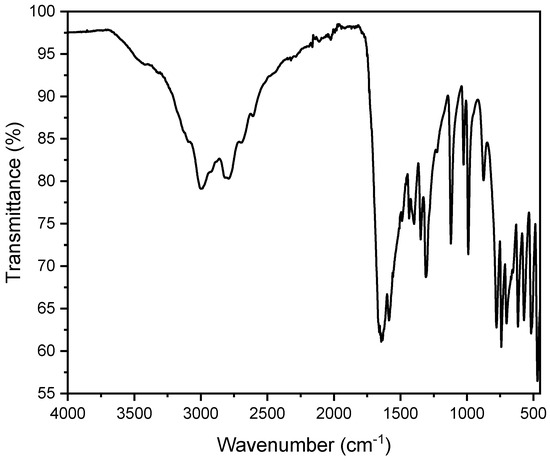
Figure 11.
FT-IR spectrum of a pure uric acid stone in a dihydrate state. One can observe additional broad bands around 3200–3500 cm−1 due to the O-H stretching vibrations of water molecules.
In the examined patient cohort, the incidence of uric acid stones significantly increased with age. While no uric acid stones were detected in patients up to 40 years old, the incidence was 4% (n = 5) in the 41–60 age group, 14% (n = 15) in the 61–80 age group, and 23% (n = 11) in patients over 81 years old. Including mixed stones containing uric acid, the incidence is even higher. The increase in prevalence with age is also reflected in the relevant literature [27].
3.8. Mixed Stones
In total, 83 out of 315 (26.3%) samples were classified as mixed stones (excluding phosphate mixed stones without oxalate). All of these mixed stones contained oxalate in varying concentrations. The largest proportion of mixed stones consisted of calcium phosphate/oxalate mixtures. Specifically, 79 (25.1%) out of the 83 mixed stones analyzed fell into this category. The main challenge in the manual analysis of FT-IR spectra is the potential overlap of the characteristic spectral patterns of the stones. To address this, it is crucial to consider all possible peaks. When comparing our collected data with the older literature, it becomes evident that some studies report a higher proportion of mixed stones [28,42,43].
3.8.1. Calcium Phosphate Oxalate Mixtures
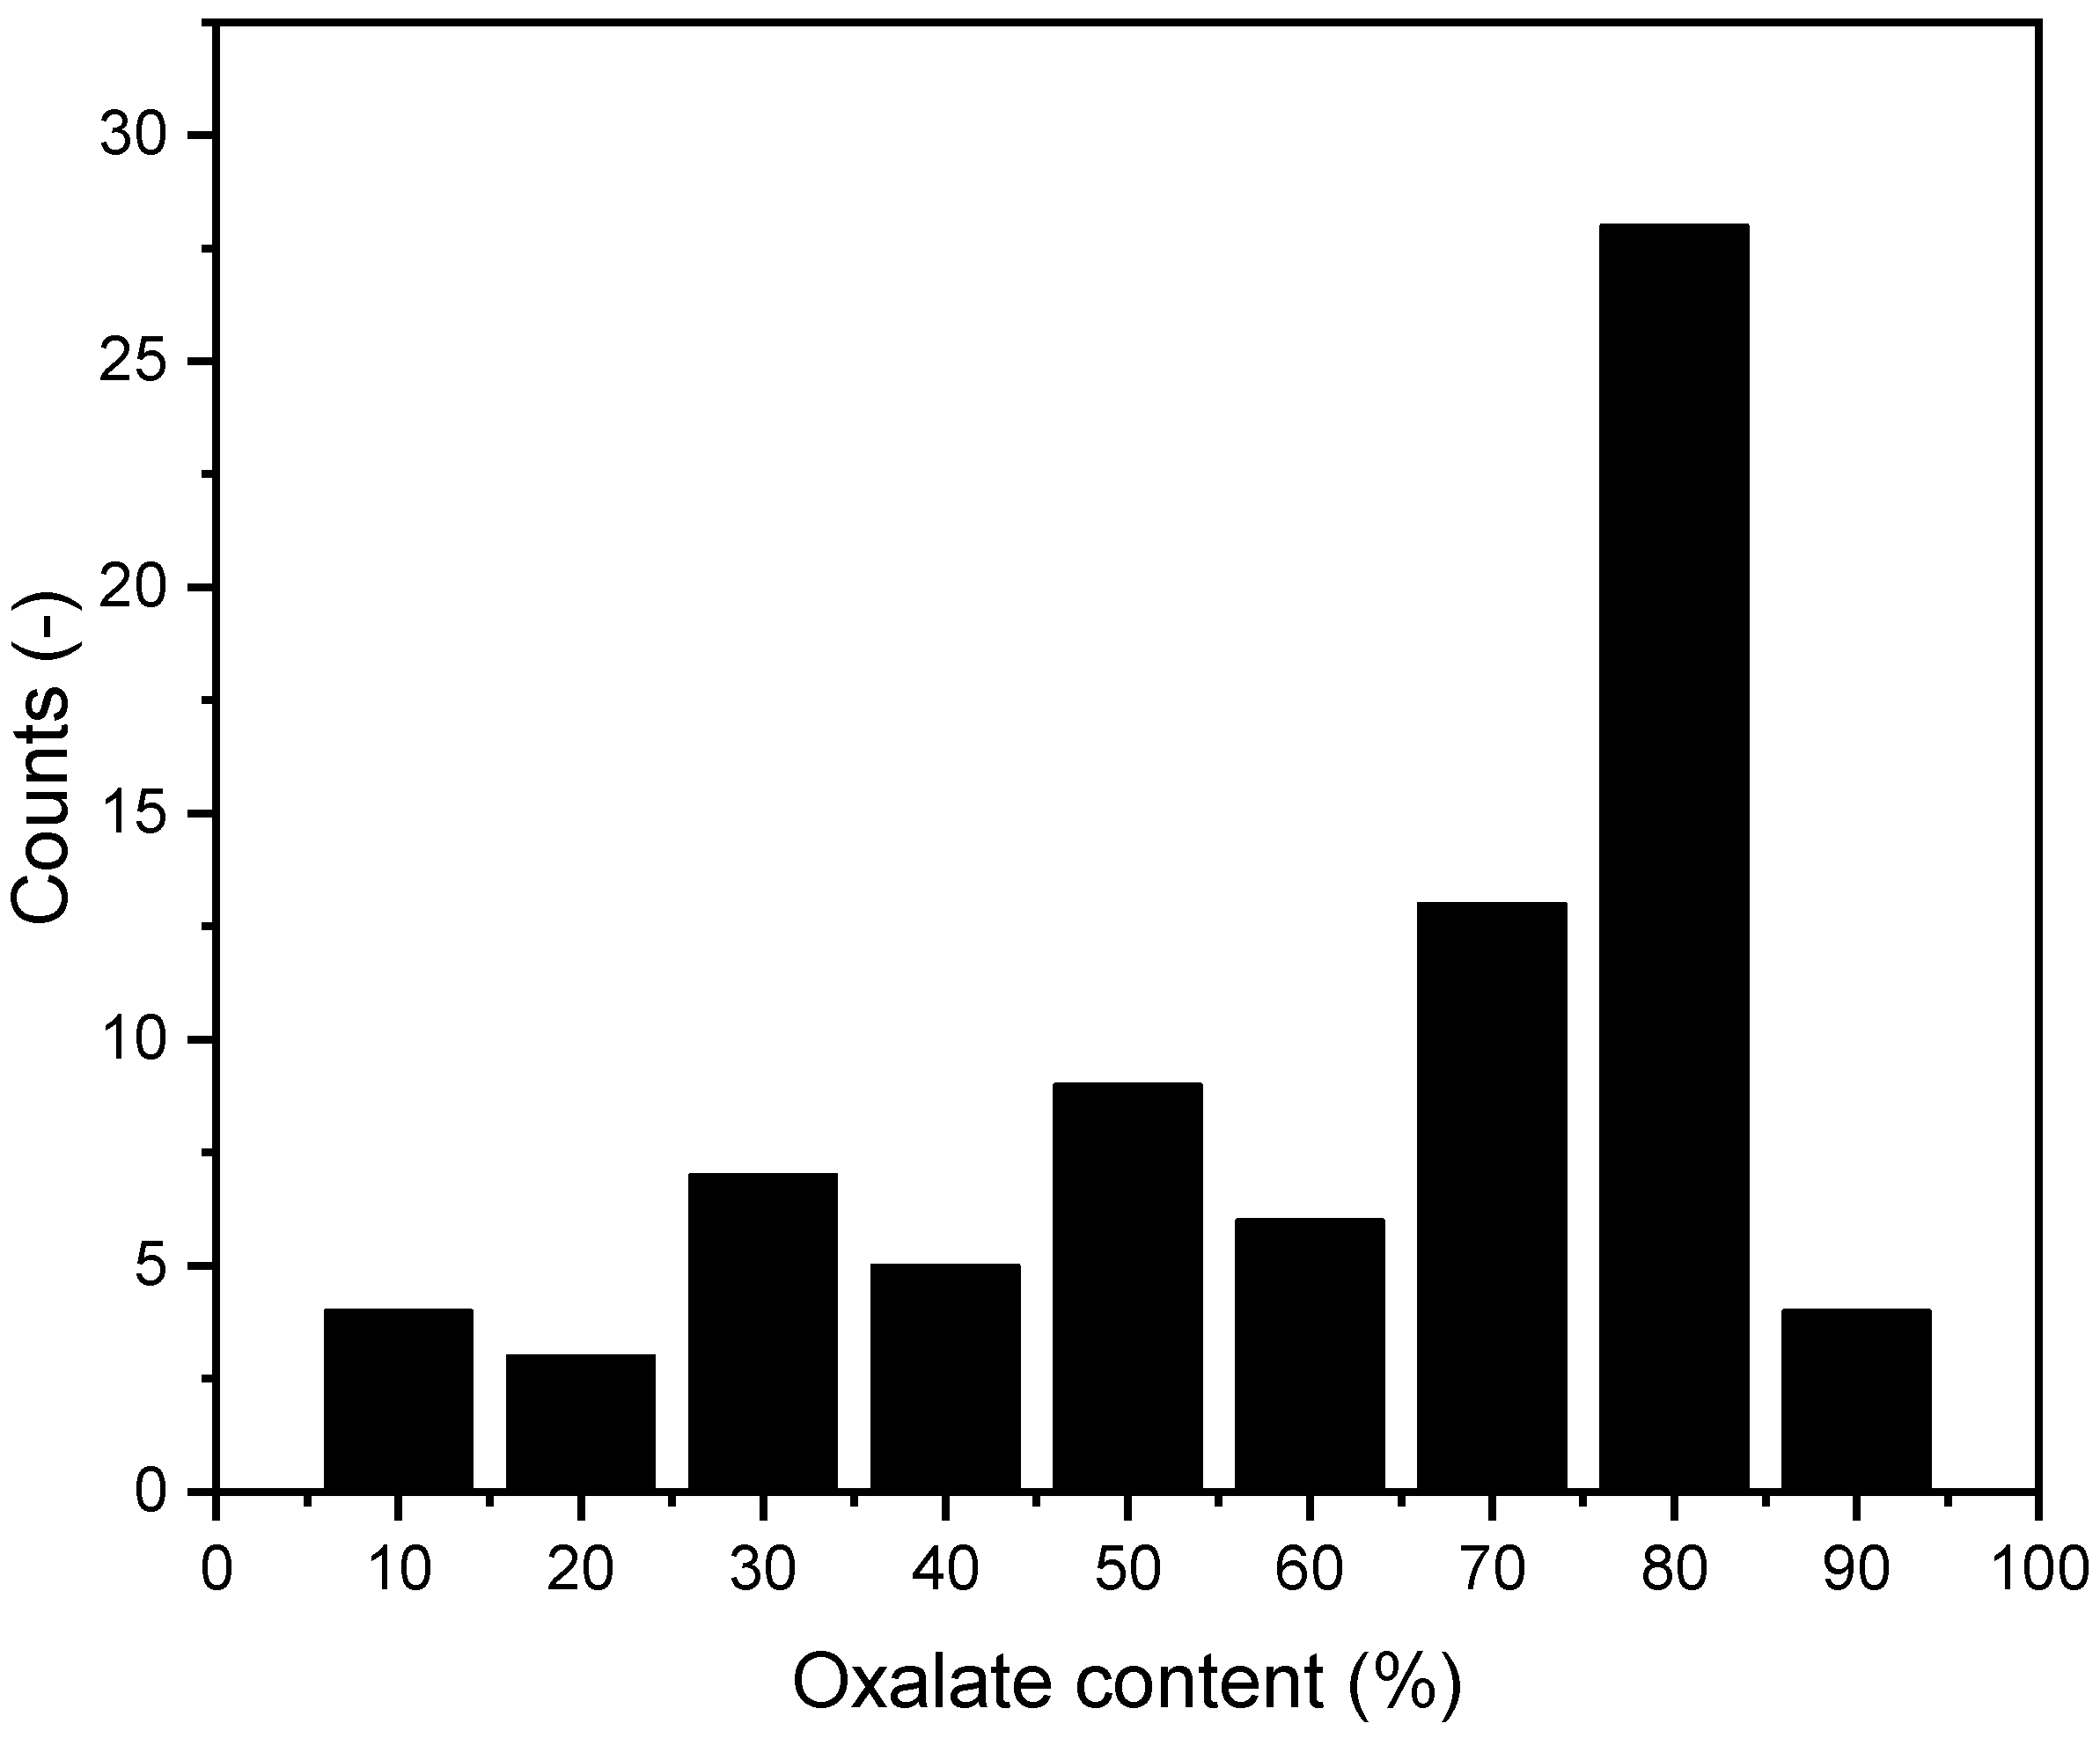
Of the 79 calcium phosphate/oxalate stones, 36 (45.6%) were from female patients and 43 (54.4%) were from male patients. Given the predominance of this type of mixed stone, we further analyzed the specific oxalate content in these stones using the method described above. The results of this analysis are presented in Figure 12.

Figure 12.
Distribution of oxalate content in mixed stones. n = 79.
We found no significant evidence that the oxalate content in mixed stones increases with age.
3.8.2. Other Mixed Stones
In addition to the previously discussed types, four more mixed stones were identified. Among these, three stones consisted of uric acid and calcium oxalate, with two originating from male patients and one from a female patient. Furthermore, one stone contained a combination of uric acid, calcium oxalate, and struvite. These findings are consistent with the previous literature, where less than 1% of all stones contain mixtures based on uric acid [27].
3.9. Cystine
A total of one cystine stone was analyzed, from a female patient. The patient’s age was 40 years. In this measurement, peaks were between the range of 1500 cm−1 and 700 cm−1. This can be explained by the presence of characteristic vibrations of the cystine molecules. The peak at 1500 cm−1 corresponds to the C-N stretching vibration, while the peak at 700 cm−1 corresponds to the C-S stretching vibration. These specific vibrations are indicative of the cystine molecule’s presence within the stone matrix.
4. Discussion
Notably, compared to relevant scientific studies, exactly one-third of the kidney stone patients were women and two-thirds were men. This finding is consistent with other studies [3,19,44,45,46]. A possible explanation for the lower prevalence in women could be the higher estradiol concentration in women. This might be due to estrogen having an anti-lithogenic effect. Estrogen inhibits bone resorption and increases calcium absorption in the distal tubule. Additionally, estrogen leads to increased citrate excretion in the urine [47,48].
This male predominance is particularly evident in pure oxalate and uric acid stones (oxalate: 76% male, uric acid: 77% male). In comparison, for stones containing calcium phosphate, the distribution is exactly 50% for women and 50% for men.
The number of uric acid stones varies significantly across all scientific papers, depending on the age and location of the populations studied. The proportion of 9.8% in this study is comparable to a study from France from 1995 (N = 10438), where the proportion was 10.08% [27]. In a newer study from 2014, the results were also comparable [49].
Moreover, we were able to demonstrate that the P-O vibrations of hydroxyapatite and struvite differ significantly. The peak of struvite is observed at 992–1012 cm−1 with a mean value of 1002 cm−1. In comparison, the peak of hydroxyapatite is observed at 1010–1022 cm−1 with a mean value of 1018 cm−1. This distinction can be very useful in differentiating between these two types of stones.
In some scientific papers, additional kidney stones or kidney stone components are also discussed. Among these are organic matrix, xanthine, 2,8-dihydroxyadenin, and proteins. Xanthine and 2,8-dihydroxyadenine are primarily associated with rare metabolic disorders [27,28,50]. In this study of 315 kidney stones, there was no evidence of the presence of these components. Minimal amounts of organic matrix in the hydroxyapatite stones could potentially be considered. This is plausible due to the necessary protein matrix, which is discussed in relation to stone formation [51].
Unlike other chronic diseases, kidney stones affect not only older patients over the age of 65 but also working individuals between the ages of 20 and 60 [28,42,43]. Data confirm that half of the 322 kidney stone patients were younger than 59 years old (Figure 3).
The proportion of weddellite stones among the calcium oxalate stones in our study population was 6.4% (n = 10). This is consistent with previously published studies. In comparison, the proportion was found to be 6.0% in a previously mentioned large-scale stone analysis from France (n = 10,438) conducted in 1995 [27].
Mixed stones primarily consist of calcium oxalate and calcium phosphate [52,53]. Additionally, mixed stones containing calcium oxalate and uric acid also exist, though, in our study, only three such cases were detected. Some of the literature suggests that the majority of kidney stones are mixed stones [27,28,42,43]. A possible reason for the reported high proportion of mixed stones in the literature is the inconsistency in the use of the term “mixed stones”. If one refers to mixtures of kidney stone subtypes, such as urate in dihydrate or anhydrous state, or mixtures of whewellite and weddellite, as mixed stones, the proportion of mixed stones appears significantly higher. The data obtained in this study contradict this claim. However, it is important to consider that the FT-IR measurements we conducted represent only a sample of the entire stone. A paper from 1997 already noted that kidney stones can consist of different components depending on the stone layer (nucleus, inner layer, peripheral layer, and surface) [35]. Mixed stones primarily consist of calcium oxalate and calcium phosphate [52,53].
5. Conclusions
Our findings confirm that the majority of all stones (74.9%) contain calcium oxalate, (49.5%) pure calcium oxalate, and (25.4)% are mixed stones. The proportion of oxalate in the mixed stones does not increase with age. The low prevalence of infection stones (struvite), as well as the tendency for uric acid stones to occur at an older age, was confirmed. However, the most common cause of kidney stones in Austria appears to be hypercalciuria.
Supplementary Materials
The following supporting information can be downloaded at: https://www.mdpi.com/article/10.3390/cryst14100854/s1, Figure S1. Optical macroscopic image of calcium oxalate stones; Figure S2. EDX of calcium oxalate stones; Figure S3. Optical macroscopic image of hydroxyapatite (calcium phosphate) stones; Figure S4. EDX of hydroxyapatite (calcium phosphate) stones; Figure S5. Optical macroscopic image of brushite stones; Figure S6. EDX of brushite (calcium phosphate) stones; Figure S7. Optical macroscopic image of struvite (magnesium ammonium phosphate) stones; Figure S8. EDX of struvite (magnesium ammonium phosphate) stones; Figure S9. Macroscopic optical image of urate stone; Figure S10. EDX of urate stones; Table S1. EDX of calcium oxalate stones; Table S2. EDX of hydroxyapatite (calcium phosphate) stones; Table S3. EDX of brushite (calcium phosphate) stones; Table S4. EDX of struvite (magnesium ammonium phosphate) stones; Table S5. EDX of urate stones.
Author Contributions
Conceptualization, D.R., S.A. and S.P.S.; methodology, C.W., V.Z., E.S. and S.P.S.; software, C.W.; validation, C.W. and S.P.S.; formal analysis, C.W. and E.S.; investigation, C.W.; resources, S.P.S.; data curation, C.W. and S.P.S.; writing—original draft preparation, C.W.; writing—review and editing, M.E. and S.P.S.; supervision, S.P.S.; project administration, S.P.S.; funding acquisition, S.P.S. All authors have read and agreed to the published version of the manuscript.
Funding
This research was funded by MEFO Graz.
Data Availability Statement
The raw data supporting the conclusions of this article will be made available by the authors on request.
Conflicts of Interest
The authors declare no conflicts of interest. The funders had no role in the design of the study; in the collection, analyses, or interpretation of data; in the writing of the manuscript; or in the decision to publish the results.
References
- Alelign, T.; Petros, B. Kidney Stone Disease: An Update on Current Concepts. Adv. Urol. 2018, 2018, 3068365. [Google Scholar] [CrossRef] [PubMed]
- Abufaraj, M.; Xu, T.; Cao, C.; Waldhoer, T.; Seitz, C.; D’andrea, D.; Siyam, A.; Tarawneh, R.; Fajkovic, H.; Schernhammer, E.; et al. Prevalence and Trends in Kidney Stone Among Adults in the USA: Analyses of National Health and Nutrition Examination Survey 2007–2018 Data. Eur. Urol. Focus 2021, 7, 1468–1475. [Google Scholar] [CrossRef] [PubMed]
- Curhan, G.C. Epidemiology of Stone Disease. Urol. Clin. N. Am. 2007, 34, 287–293. [Google Scholar] [CrossRef] [PubMed]
- Wang, K.; Ge, J.; Han, W.; Wang, D.; Zhao, Y.; Shen, Y.; Chen, J.; Chen, D.; Wu, J.; Shen, N.; et al. Risk Factors for Kidney Stone Disease Recurrence: A Comprehensive Meta-Analysis. BMC Urol. 2022, 22, 62. [Google Scholar] [CrossRef] [PubMed]
- Fang, H.; Deng, J.; Chen, Q.; Chen, D.; Diao, P.; Peng, L.; Lai, B.; Zeng, Y.; Han, Y. Univariable and Multivariable Mendelian Randomization Study Revealed the Modifiable Risk Factors of Urolithiasis. PLoS ONE 2023, 18, e0290389. [Google Scholar] [CrossRef]
- Thongprayoon, C.; Krambeck, A.E.; Rule, A.D. Determining the True Burden of Kidney Stone Disease. Nat. Rev. Nephrol. 2020, 16, 736–746. [Google Scholar] [CrossRef]
- Fontenelle, L.F.; Sarti, T.D. Kidney Stones: Treatment and Prevention. Am. Fam. Physician 2019, 99, 490–496. [Google Scholar]
- Pathan, S.A.; Mitra, B.; Straney, L.D.; Afzal, M.S.; Anjum, S.; Shukla, D.; Morley, K.; Hilli, S.A.A.; Rumaihi, K.A.; Thomas, S.H.; et al. Delivering Safe and Effective Analgesia for Management of Renal Colic in the Emergency Department: A Double-Blind, Multigroup, Randomised Controlled Trial. Lancet 2016, 387, 1999–2007. [Google Scholar] [CrossRef]
- Daudon, M.; Haymann, J.-P.; Estrade, V.; Meria, P.; Almeras, C. 2022 Recommendations of the AFU Lithiasis Committee: Epidemiology, Stone Analysis and Composition. Prog. Urol. 2023, 33, 737–765. [Google Scholar] [CrossRef]
- Pickard, R.; Starr, K.; MacLennan, G.; Lam, T.; Thomas, R.; Burr, J.; McPherson, G.; McDonald, A.; Anson, K.; N’Dow, J.; et al. Medical Expulsive Therapy in Adults with Ureteric Colic: A Multicentre, Randomised, Placebo-Controlled Trial. Lancet 2015, 386, 341–349. [Google Scholar] [CrossRef]
- Sur, R.L.; Shore, N.; L’Esperance, J.; Knudsen, B.; Gupta, M.; Olsen, S.; Shah, O. Silodosin to Facilitate Passage of Ureteral Stones: A Multi-Institutional, Randomized, Double-Blinded, Placebo-Controlled Trial. Eur. Urol. 2015, 67, 959–964. [Google Scholar] [CrossRef] [PubMed]
- Furyk, J.S.; Chu, K.; Banks, C.; Greenslade, J.; Keijzers, G.; Thom, O.; Torpie, T.; Dux, C.; Narula, R. Distal Ureteric Stones and Tamsulosin: A Double-Blind, Placebo-Controlled, Randomized, Multicenter Trial. Ann. Emerg. Med. 2016, 67, 86–95.e2. [Google Scholar] [CrossRef] [PubMed]
- Selection and Outcomes for Dissolution Therapy in Uric Acid Stones: A Systematic Review of Literature. Curr. Urol. Rep. 2023, 24, 355–363. [CrossRef] [PubMed]
- Stamatelou, K.; Goldfarb, D.S. Epidemiology of Kidney Stones. Healthcare 2023, 11, 424. [Google Scholar] [CrossRef] [PubMed]
- Moftakhar, L.; Jafari, F.; Ghoddusi Johari, M.; Rezaeianzadeh, R.; Hosseini, S.V.; Rezaianzadeh, A. Prevalence and Risk Factors of Kidney Stone Disease in Population Aged 40–70 Years Old in Kharameh Cohort Study: A Cross-Sectional Population-Based Study in Southern Iran. BMC Urol. 2022, 22, 205. [Google Scholar] [CrossRef] [PubMed]
- Monga, M.; Murphy, M.; Paranjpe, R.; Cutone, B.; Eisner, B. Prevalence of Stone Disease and Procedure Trends in the United States. Urology 2023, 176, 63–68. [Google Scholar] [CrossRef]
- Stamatelou, K.K.; Francis, M.E.; Jones, C.A.; Nyberg, L.M.; Curhan, G.C. Time Trends in Reported Prevalence of Kidney Stones in the United States: 1976–1994. Kidney Int. 2003, 63, 1817–1823. [Google Scholar] [CrossRef]
- Chen, Z.; Prosperi, M.; Bird, V.Y. Prevalence of Kidney Stones in the USA: The National Health and Nutrition Evaluation Survey. J. Clin. Urol. 2019, 12, 296–302. [Google Scholar] [CrossRef]
- Chewcharat, A.; Curhan, G. Trends in the Prevalence of Kidney Stones in the United States from 2007 to 2016. Urolithiasis 2021, 49, 27–39. [Google Scholar] [CrossRef]
- Saigal, C.S.; Joyce, G.; Timilsina, A.R.; Urologic Diseases in America Project. Direct and Indirect Costs of Nephrolithiasis in an Employed Population: Opportunity for Disease Management? Kidney Int. 2005, 68, 1808–1814. [Google Scholar] [CrossRef]
- Hyams, E.S.; Matlaga, B.R. Economic Impact of Urinary Stones. Transl. Androl. Urol. 2014, 3, 278–283. [Google Scholar] [CrossRef]
- Zhe, M.; Hang, Z. Nephrolithiasis as a Risk Factor of Chronic Kidney Disease: A Meta-Analysis of Cohort Studies with 4,770,691 Participants. Urolithiasis 2017, 45, 441–448. [Google Scholar] [CrossRef] [PubMed]
- Kum, F.; Mahmalji, W.; Hale, J.; Thomas, K.; Bultitude, M.; Glass, J. Do Stones Still Kill? An Analysis of Death from Stone Disease 1999-2013 in England and Wales. BJU Int. 2016, 118, 140–144. [Google Scholar] [CrossRef] [PubMed]
- Tamborino, F.; Cicchetti, R.; Mascitti, M.; Litterio, G.; Orsini, A.; Ferretti, S.; Basconi, M.; De Palma, A.; Ferro, M.; Marchioni, M.; et al. Pathophysiology and Main Molecular Mechanisms of Urinary Stone Formation and Recurrence. Int. J. Mol. Sci. 2024, 25, 3075. [Google Scholar] [CrossRef]
- Sofińska-Chmiel, W.; Goliszek, M.; Drewniak, M.; Nowicka, A.; Kuśmierz, M.; Adamczuk, A.; Malinowska, P.; Maciejewski, R.; Tatarczak-Michalewska, M.; Blicharska, E. Chemical Studies of Multicomponent Kidney Stones Using the Modern Advanced Research Methods. Molecules 2023, 28, 6089. [Google Scholar] [CrossRef]
- Wang, Z.; Zhang, Y.; Zhang, J.; Deng, Q.; Liang, H. Recent Advances on the Mechanisms of Kidney Stone Formation (Review). Int. J. Mol. Med. 2021, 48, 1–10. [Google Scholar] [CrossRef]
- Daudon, M.; Hennequin, C.; Lacour, B.; Le Moel, G.; Donsimoni, R.; Fellahi, S.; Paris, M.; Troupel, S. Sex- and Age-Related Composition of 10 617 Calculi Analyzed by Infrared Spectroscopy. Urol. Res. 1995, 23, 319–326. [Google Scholar] [CrossRef]
- Leusmann, D.B.; Blaschke, R.; Schmandt, W. Results of 5,035 Stone Analyses: A Contribution to Epidemiology of Urinary Stone Disease. Scand. J. Urol. Nephrol. 1990, 24, 205–210. [Google Scholar] [CrossRef]
- Schubert, G. Stone Analysis. Urol. Res. 2006, 34, 146–150. [Google Scholar] [CrossRef]
- EAU Guidelines on Urolithiasis-Uroweb. Available online: https://uroweb.org/guidelines/urolithiasis/publications-appendices (accessed on 17 June 2024).
- Abdel-Halim, R.E.; Abdel-Halim, M.R. A Review of Urinary Stone Analysis Techniques. Saudi Med. J. 2006, 27, 1462–1467. [Google Scholar]
- Hesse, A.; Kruse, R.; Geilenkeuser, W.-J.; Schmidt, M. Quality Control in Urinary Stone Analysis: Results of 44 Ring Trials (1980-2001). Clin. Chem. Lab. Med. 2005, 43, 298–303. [Google Scholar] [CrossRef] [PubMed]
- Gilad, R.; Williams, J.C.; Usman, K.D.; Holland, R.; Golan, S.; Tor, R.; Lifshitz, D. Interpreting the Results of Chemical Stone Analysis in the Era of Modern Stone Analysis Techniques. J. Nephrol. 2017, 30, 135–140. [Google Scholar] [CrossRef] [PubMed]
- Bindhu, B.; Swetha, A.S.; Veluraja, K. Studies on the Effect of Phyllanthus Emblica Extract on the Growth of Urinary Type Struvite Crystals Invitro. Clin. Phytosci. 2015, 1, 3. [Google Scholar] [CrossRef]
- Estepa, L.; Daudon, M. Contribution of Fourier Transform Infrared Spectroscopy to the Identification of Urinary Stones and Kidney Crystal Deposits. Biospectroscopy 1997, 3, 347–369. [Google Scholar] [CrossRef]
- Gesundheitsfonds Steiermark (Hg.): Gesundheitsberichterstattung Steiermark. Graz. Available online: https://gesundheitsbericht-steiermark.at/demografie/bevoelkerung/ (accessed on 23 September 2024).
- Asyana, V.; Haryanto, F.; Fitri, L.A.; Ridwan, T.; Anwary, F.; Soekersi, H. Analysis of Urinary Stone Based on a Spectrum Absorption FTIR-ATR. J. Phys. Conf. Ser. 2016, 694, 012051. [Google Scholar] [CrossRef]
- Chandrajith, R.; Weerasingha, A.; Premaratne, K.M.; Gamage, D.; Abeygunasekera, A.M.; Joachimski, M.M.; Senaratne, A. Mineralogical, Compositional and Isotope Characterization of Human Kidney Stones (Urolithiasis) in a Sri Lankan Population. Environ. Geochem. Health 2019, 41, 1881–1894. [Google Scholar] [CrossRef]
- Matsuzaki, S.; Matsushita, K.; Tanikawa, K.; Masuda, A.; Matsunaga, J. Sequential Analysis of Recurrent Calcium Calculi by Infrared Spectroscopy. Int. J. Urol. 1995, 2, 235–237. [Google Scholar] [CrossRef]
- Werner, H.; Bapat, S.; Schobesberger, M.; Segets, D.; Schwaminger, S.P. Calcium Oxalate Crystallization: Influence of pH, Energy Input, and Supersaturation Ratio on the Synthesis of Artificial Kidney Stones. ACS Omega 2021, 6, 26566–26574. [Google Scholar] [CrossRef]
- Grases, F.; Costa-Bauzá, A.; García-Ferragut, L. Biopathological Crystallization: A General View about the Mechanisms of Renal Stone Formation. Adv. Colloid Interface Sci. 1998, 74, 169–194. [Google Scholar] [CrossRef]
- Brien, G.; Schubert, G.; Bick, C. 10,000 Analyses of Urinary Calculi Using X-Ray Diffraction and Polarizing Microscopy. Eur. Urol. 1982, 8, 251–256. [Google Scholar] [CrossRef]
- Herring, L.C. Observations on the Analysis of Ten Thousand Urinary Calculi. J. Urol. 1962, 88, 545–562. [Google Scholar] [CrossRef] [PubMed]
- Daudon, M.; Traxer, O.; Lechevallier, E.; Saussine, C. Épidémiologie des lithiases urinaires. Prog. Urol. 2008, 18, 802–814. [Google Scholar] [CrossRef] [PubMed]
- Roger, C.; Abid, N.; Dubourg, L.; Auvergnon, C.; Lemoine, S.; Machon, C. Composition of Urinary Calculi: Lessons from a French Epidemiologic Retrospective Study. Prog. Urol. 2020, 30, 339–345. [Google Scholar] [CrossRef] [PubMed]
- Daudon, M.; Doré, J.-C.; Jungers, P.; Lacour, B. Changes in Stone Composition According to Age and Gender of Patients: A Multivariate Epidemiological Approach. Urol. Res. 2004, 32, 241–247. [Google Scholar] [CrossRef] [PubMed]
- Wilson, C. Estrogen and Kidney Stones. Nat. Rev. Endocrinol. 2011, 7, 3. [Google Scholar] [CrossRef]
- Zhao, Z.; Mai, Z.; Ou, L.; Duan, X.; Zeng, G. Serum Estradiol and Testosterone Levels in Kidney Stones Disease with and without Calcium Oxalate Components in Naturally Postmenopausal Women. PLoS ONE 2013, 8, e75513. [Google Scholar] [CrossRef]
- Lieske, J.C.; Rule, A.D.; Krambeck, A.E.; Williams, J.C.; Bergstralh, E.J.; Mehta, R.A.; Moyer, T.P. Stone Composition as a Function of Age and Sex. Clin. J. Am. Soc. Nephrol. CJASN 2014, 9, 2141–2146. [Google Scholar] [CrossRef]
- Runolfsdottir, H.L.; Palsson, R.; Thorsteinsdottir, U.A.; Indridason, O.S.; Agustsdottir, I.M.S.; Oddsdottir, G.S.; Thorsteinsdottir, M.; Edvardsson, V.O. Urinary 2,8-Dihydroxyadenine Excretion in Patients with Adenine Phosphoribosyltransferase Deficiency, Carriers and Healthy Control Subjects. Mol. Genet. Metab. 2019, 128, 144–150. [Google Scholar] [CrossRef]
- The Role of Randall Plaques on Kidney Stone Formation-Chung-Translational Andrology and Urology. Available online: https://tau.amegroups.org/article/view/4081/5591 (accessed on 23 July 2024).
- Singh, V.K.; Rai, P.K. Kidney Stone Analysis Techniques and the Role of Major and Trace Elements on Their Pathogenesis: A Review. Biophys. Rev. 2014, 6, 291–310. [Google Scholar] [CrossRef]
- Grant, C.; Guzman, G.; Stainback, R.P.; Amdur, R.L.; Mufarrij, P. Variation in Kidney Stone Composition Within the United States. J. Endourol. 2018, 32, 973–977. [Google Scholar] [CrossRef]


Disclaimer/Publisher’s Note: The statements, opinions and data contained in all publications are solely those of the individual author(s) and contributor(s) and not of MDPI and/or the editor(s). MDPI and/or the editor(s) disclaim responsibility for any injury to people or property resulting from any ideas, methods, instructions or products referred to in the content. |
© 2024 by the authors. Licensee MDPI, Basel, Switzerland. This article is an open access article distributed under the terms and conditions of the Creative Commons Attribution (CC BY) license (https://creativecommons.org/licenses/by/4.0/).