Abstract
Melting point depressants (MPDs) are required to lower the melting point of filler for brazing. In this study, Zr was used as the MPD, and powder filler was prepared by adjusting the Zr and Mo content referring to Thermo-Calc calculations. The prepared filler was used to braze a high-Mo Ni3Al-based single crystal superalloy, IC21, for 1200 °C/30 min. The effects of adjusting the Zr and Mo content on the microstructure and tensile properties of the joint were investigated. The increase in Zr content promotes the formation of Ni7Zr2 in the joint, leading to a decrease in the tensile strength of the joint. The increase in Mo content forms diffusion barriers between the BM and filler, resulting in an enhancement in the tensile strength of the joint. However, continued increases in Mo content leads to an increase in the P-topologically close packed phase, causing a decline in the tensile strength of the joint. When the Zr content was (11.8–12.2) wt.% and the Mo content was (7.3–7.7) wt.%, the tensile strength of the joint at 980 °C reached a maximum of 550 MPa. This study provides a potential direction for the design of brazing filler composition for high-Mo Ni3Al-based superalloys.
1. Introduction
The Ni3Al-based [1,2,3,4,5] single crystal superalloy is a newly developed high-temperature structural material utilized for turbine blades. Ni3Al-based superalloys have a γ+γ′ two-phase structure [6] similar to Ni-based superalloys [7,8,9], but with the γ′ phase serving as the matrix in the Ni3Al-based superalloys. Ni3Al-based alloys consist of γ phase and a high-volume fraction of γ′ phase for precipitation strengthening, and contain Mo, Cr, Ta, and Re elements for solid solution strengthening [10]. The IC21 alloy investigated in the present study represents a new generation of Ni3Al-based single crystal superalloys [11,12] characterized by elevated Mo concentrations. Replacing W and Re [13] with Mo in IC21 can reduce the cost and density [14] effectively.
Due to the complex configuration of aero-engine structures, welding emerges as a frequently utilized method for material joining [15,16]. Brazing represents a proficient technique for high-temperature alloy welding [17]. Vacuum brazing [18], a variant of brazing, involves heating both the filler material and the components to be joined to the welding temperature within a vacuum environment [19,20,21]. This process facilitates the melting of the filler material, which subsequently diffuses into the workpiece at the welding interface, thereby generating a dense and dependable joint. The research on Ni-based superalloy solder mainly focuses on using B and Si as melting point depressants (MPDs) to reduce the melting point of the filler [22,23,24,25,26,27,28,29,30], so that the filler can melt and fill the weld below the solid phase line of the base metal (BM) alloy. In this process, B tends to form a B compound phase in the weld area [31,32], while Si predominantly concentrates in the central region of the joint, forming a silicide phase [17]. This segregation adversely affects the homogeneity of the joint structure, thereby promoting crack initiation and propagation [33]. At the same time, B is easily diffused into the BM due to its small atomic radius and rapid diffusion rate [34]. A significant amount of B enters the BM to form B compounds, resulting in higher microhardness in the diffusion-affected zone compared to the weld area [35]. Moreover, the formed B compounds are prone to becoming initiation sites for cracks [36]. Therefore, it is recommended that alternative elements to B and Si be explored with the aim of reducing the melting point of the filler material.
Yajie Du et al. [37] used a Ti-Zr-Cu-Ni filler to prepare a Ti2AlNb/TC17 joint and found that the addition of Zr could form a eutectic phase with Ni, thereby reducing the melting point of the filler. V.F. Khorunov et al. [38] used Ni-Cr-Zr solder to braze Ni-based alloys and found that compared to Ni-Cr-B-Si system brazing alloys, Ni-Cr-Zr solder exhibits higher adhesive activity, greater ductility, and lower hardness. Moreover, it has been observed that Zr exhibits excellent corrosion resistance and has the capability to form various solid solutions with non-metals and diverse metals, thereby serving as a secondary phase strengthening agent in the joint [39,40]. Therefore, it is feasible to incorporate Zr into Ni3Al-based superalloy solder to reduce its melting point.
This study focuses on a high-Mo Ni3Al-based single-crystal superalloy, designated as IC21, where Zr is utilized as an MPD. The microstructure of the joint is adjusted by varying the concentrations of Zr and Mo. Tensile strength testing of the joints is performed at 980 °C. The fracture behavior of the joints is analyzed through observation of the joint fractures.
2. Experimental Procedures
2.1. Filler Preparation and Test
The filler composition is designed according to the IC21 composition. The phase diagrams, chemical potentials, and diffusion coefficients are calculated using the thermodynamic calculation software Thermo-Calc 2022a with the database TCNi 10. The design filler composition and alloy composition are shown in Table 1. During the filler design process, the expensive element Re was removed, while the Cr content was augmented to enhance the filler oxidation resistance. Additionally, the element Zr was introduced to lower the filler melting point. BNiZr-4 and BNiZr-5 adjusted the element Mo on the basis of BNiZr-1. The filler powder was prepared by argon atomization. The phase components of fillers were analyzed by X-ray diffraction (XRD, Bruker D8 DISCOVER, Karlsruhe, Germany). Differential scanning calorimeter (DSC, NETZSCH STA 449F5, Selb, Germany) tests were conducted on five fillers to determine their liquidus temperature, which was crucial for establishing the brazing temperature. The heating rate during the DSC tests was set at 10 K/min, and Ar gas was used to prevent oxidation during the experiment.

Table 1.
The nominal composition of fillers and the base metal IC21 (wt.%).
The heating curves of filler powders tested by DSC are shown in Figure 1. As can be seen from Figure 1, the main heat absorption peaks of fillers all end below 1160 °C. In order to ensure that the filler exhibits excellent fluidity during brazing, the brazing temperature is set at 1200 °C, approximately 40 °C above the end of the main heat absorption peak. Additionally, the brazing time is set to 30 min.
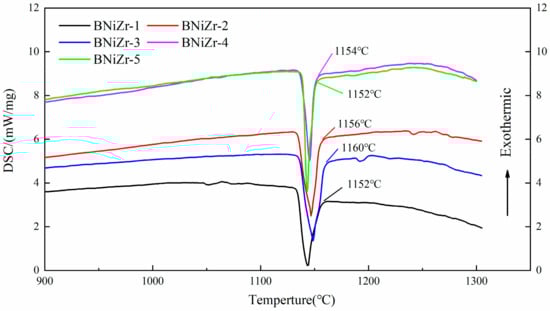
Figure 1.
The DSC curves of fillers.
2.2. Joint Preparation and Test
The IC21 alloy was cut to 12 × 6.5 × 25 (mm) using wire cut electrical discharge machining (WEDM) before brazing, and the face of 12 × 6.5 (mm) was the brazing surface (Figure 2a). After cutting, the brazing surface was polished using 600-grit sandpaper and ultrasonically cleaned in acetone for 10 min to remove the oil on the workpiece. When assembling, nickel wire was utilized to maintain the weld gap at 50 μm, followed by the use of an energy storage welding machine to position the parts to be brazed. When preparing the brazing paste, the mass ratio of filler to Canadian resin to acetone was set at 10:1:20. The modulated filler paste was applied to the weld, and the sample was put into the vacuum furnace after drying. As shown in Figure 2b, the brazing temperature was 1200 °C, with a hold time of 30 min. The vacuum level of the vacuum furnace was maintained at less than 1 × 10⁻⁴ Pa. The samples were cooled in the furnace to below 200 °C after heating.
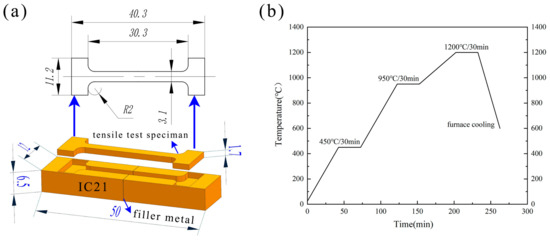
Figure 2.
The schematic diagram of (a) the tensile test specimens and (b) brazing parameters.
The joints brazed using the five different brazing fillers are designated as J1, J2, J3, J4, and J5, respectively. J represents joint, while the following number corresponds to the numerical identifier of the brazing filler used. After brazing, the samples were polished. The polished samples were then subjected to corrosion using an etching solution (HCl:CuSO4:H2O = 10 mL:2 g:20 mL). The microstructure of the joint was observed by scanning electron microscopy (SEM, ZEISS EVO 10, Oberkochen, Germany) and the composition was analyzed by energy dispersive X-ray spectroscopy (EDS, Oxford instruments X-max, Oxon, UK). Transmission electron microscopy (TEM, FEI Tecnai G2 F20, Hillsboro, OR, USA) was used to analyze the joint microstructure in bright field, and the characteristic phases were analyzed by selected-area electron diffraction (SAED) to determine the crystal structure. The mechanical property test samples were cut out using WEDM according to Figure 2a. Subsequently, the test samples were polished using 600-grit sandpaper, and the tensile tests were conducted at 980 °C, as 980 °C is a critical point for the mechanical properties of joints made from Ni-based or Ni3Al-based superalloys in high-temperature applications. The tensile tests were conducted on an electronic universal testing machine (Wance ETM305D, Shenzhen, China) with a loading speed of 0.5 mm/min. Each test was performed at least twice in the same conditions to ensure the accuracy of the test data. The fracture morphology was observed by SEM to analyze the failure behavior of the joint.
3. Results
3.1. Characterizations of the Fillers
The microstructure of the brazing filler powders after embedding and grinding is shown in Figure 3, with the filler powder particles being spherical and having a diameter smaller than 120 μm. The XRD results of the fillers are presented in Figure 4. The results indicate that the prepared filler powder contains γ′ phase, P-topologically close-packed (P-TCP) phase, and Ni7Zr2 phase. However, no diffraction peaks of the γ′ phase are found in the XRD curve of the BNiZr-3 filler powder.
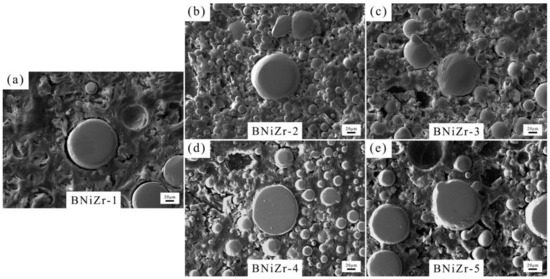
Figure 3.
SEM images of fillers. BNiZr-1 (a), BNiZr-2 (b), BNiZr-3 (c), BNiZr-4 (d), BNiZr-5 (e).
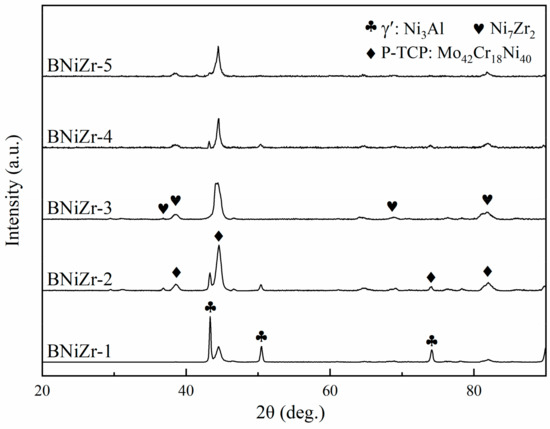
Figure 4.
XRD curves of the fillers.
3.2. Microstructure of the Joint
The typical microstructure of the brazing joint J4 is shown in Figure 5. With reference to joints prepared using B-containing filler, the joint can be divided into four areas, including an isothermal solidified zone (ISZ), diffusion affected zone (DAZ), athermally solidified zone (ASZ), and BM [24]. The ASZ is located in the middle of the joint and constitutes the eutectic structure of the joint after solidification. The ISZ is located on both sides of the ASZ and mainly consists of a single-phase region. The DAZ is located at the junction between the joint and the BM, where the compositions and phase components are influenced by the elemental interdiffusion between the joint and the BM [41].
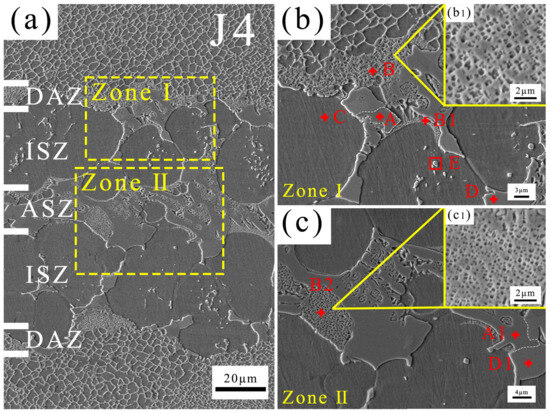
Figure 5.
Microstructure of J4 (a), Zone I (b), and Zone II (c) of (a).
The compositions of spots in Figure 5 are shown in Table 2, which also indicates the location of each spot within the joint. TEM analysis was performed on J4, and the bright-field images and SEAD results are depicted in Figure 6. Table 3 lists the chemical compositions of each spot in Figure 6 to ensure correspondence between the phases analyzed in TEM and SEM. Table 4 presents the crystal structures and lattice parameters of some phases reported in the literature. Combining SEM and TEM test results, it can be determined that the joint is composed of five phases: γ, γ′, P-TCP, NiMo, and Ni7Zr2.
Table 2.
Composition of spots in Figure 5 (at. %).
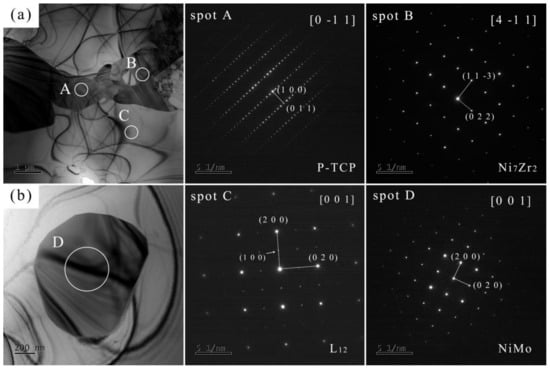
Figure 6.
TEM bright-field images (a,b) and SAED of J4.
Table 3.
Composition of spots in Figure 6 (at. %).
Table 4.
Crystal structures and lattice parameters of some typical phases. [42,43,44,45,46].
Table 5 shows the calculated and measured interplanar distances of the main phases in the joint. According to the literature, P-TCP belongs to the orthorhombic crystal system with the Pnma space group. The interplanar distances calculated from its lattice parameters are = 16.98 for the (1 0 0) plane, and = 4.20 for the (0 1 1) plane. However, the measured distances are = 17.81 and = 4.41. Combined with composition analysis, this discrepancy is possibly due to lattice expansion caused by elements such as Ta. Ni7Zr2 and γ′ may have undergone lattice expansion caused by elements such as Mo, and the change in the interplanar distance of NiMo may be caused by elements such as Cr.
Table 5.
Crystal structures and lattice parameters of some typical phases.
The microstructure of the joints brazed with five fillers are shown in Figure 7. According to the cross-sectional microstructure images in Figure 7a, numerous granular NiMo phases can be observed in the DAZ of J1 (Zr content of filler: 11.8–12.2 wt.%). γ+γ′ eutectic, P-TCP, and Ni7Zr2 are observed in the ASZ. The P-TCP phases are marked by red arrows and dashed lines, while Ni7Zr2 phases are marked by yellow arrows and dashed lines. Increasing the Zr content to 13.8–14.2 wt.% in the BNiZr-2 filler results in an increase in the Ni7Zr2 phase within J2, while reducing the number of granular NiMo phases in the DAZ. Moreover, when the Zr content in the BNiZr-3 filler increases to 15.8–16.2 wt.%, the size of the Ni7Zr2 phase in J3 significantly increases compared to J2.
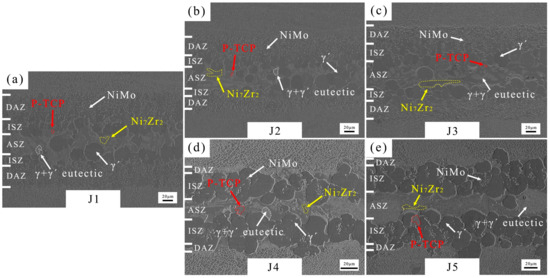
Figure 7.
Microstructures of J1 (a), J2 (b), J3 (c), J4 (d) and J5 (e).
Increasing Mo content in BNiZr-4 filler to 7.3–7.7 wt.% results in the disappearance of numerous granular NiMo phases in the DAZ, and an increase in P-TCP phases in the ASZ and DAZ of J4. With an increase in Mo content in the BNiZr-5 filler to 9.8–10.2 wt.%, the presence of P-TCP in J5 continues to increase compared to that in J4.
3.3. Mechanical Properties and Failure Behavior of Joint
The tensile tests of five kinds of samples brazed with different brazing fillers are conducted at 980 °C, and the test results are shown in Figure 8. The tensile strength of J1 is 481 MPa at 980 °C. With the increase in Zr in the filler, the tensile strength of J2 decreases to 461 MPa. When Zr in the filler continues to increase, the tensile strength of J3 decreases to 307 MPa. In comparison to J1, an increase in Mo content results in elevated tensile strength for J4, reaching 550 MPa at 980 °C. However, as the Mo content further increases, the tensile strength of J5 declines to 474 MPa. This trend indicates an initial rise followed by a subsequent decrease in joint tensile strength with increasing Mo content at 980 °C.
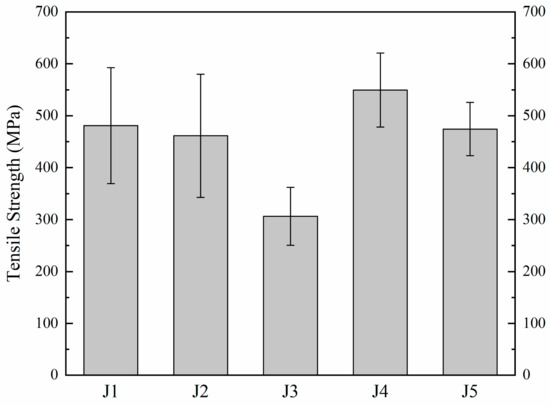
Figure 8.
980 °C tensile strength of joints.
The tensile fracture morphologies of joints at 980 °C were observed by SEM (Figure 9). The fracture site of J1 (Figure 9a) is located in the periphery of the γ′ phase. As the Zr content increases, J2 fails at the interfaces of ISZ and DAZ (Figure 9b). With further increases in Zr content, besides failure at the interfaces of ISZ and DAZ, pores are also found in the ASZ of J3 (Figure 9c). Upon increasing the Mo content, it is observed that both J4 (Figure 9d) and J5 (Figure 9e) fail at the interfaces of ISZ and DAZ, with the fracture surface of J5 being smoother.
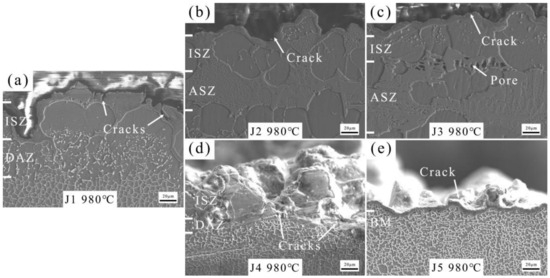
Figure 9.
The tensile fracture morphology of joints at 980 °C. (a) J1, (b) J2, (c) J3, (d) J4 and (e) J5.
4. Discussion
4.1. The Effects of Mo and Zr Content on the Fillers
Before designing the composition of the brazing filler, phase diagrams with the addition of Zr on the basis of the BM IC21 composition were calculated using the commercial software Thermo-Calc 2022a (Figure 10a). It was found that the addition of Zr effectively lowered the liquidus line of the system. When the Zr content increases to 16%, the liquidus line of the system decreases to 1145 °C. Furthermore, the mole fraction of different phases in the system at 1200 °C was calculated in Figure 10b, and the results show that the mole fraction of the liquid phase is maximized when the Zr content is about 15%. These calculation results indicate that the liquidus line can be effectively reduced by adding Zr to the BM composition, allowing the designed brazing filler to exist in a liquid form of over 95% at 1200 °C.
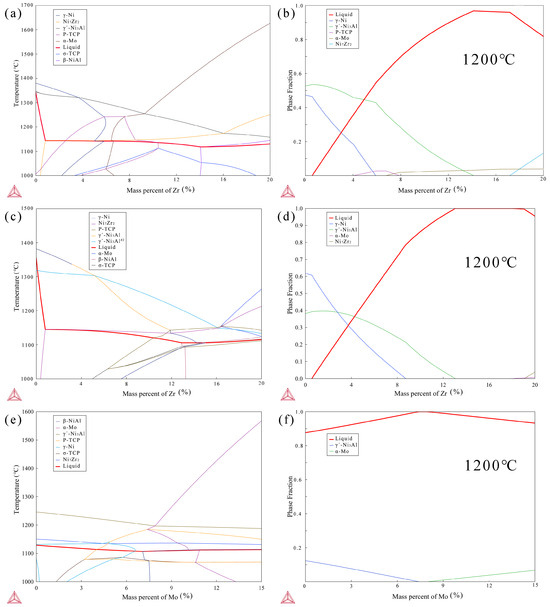
Figure 10.
Phase diagram (a) and mole fraction (b) of IC21 alloy with Zr addition at 1200 °C, phase diagram (c) and mole fraction (d) of BNiZr-1 filler with adjustment of Zr at 1200 °C, phase diagram (e) and mole fraction (f) of BNiZr-1 filler with adjustment of Mo at 1200 °C, calculated by Thermo-Calc.
The phase diagrams and phase mole fraction obtained from Thermo-Calc by adjusting the Zr content based on the composition of the BNiZr-1 filler are shown in Figure 10c,d. When the mass fraction of Zr is ~0.4%, the Ni7Zr2 phase appears in the system. With an increase in Zr content, the transformation temperature of the Ni7Zr2 phase stabilizes around 1145 °C until the Zr content reaches 16%. Throughout this process, the liquidus line of the system remains less than 1160 °C, consistent with the results of DSC testing. According to the mole fraction of the existing phase in Figure 10d, it can be observed that at 1200 °C, when the mass fraction of Zr is between 13% and 18%, the system exists entirely in the liquid phase. When the mass fraction of Zr exceeds 19%, the Ni7Zr2 phase appears in the system. Furthermore, as indicated by Figure 10c, when the Zr content ranges from 4 to 16 wt.%, the system predominantly precipitates the γ′ phase during the cooling process. However, when the Zr content reaches 16–20 wt.%, the γ′ phase no longer precipitates preferentially. This may explain the absence of γ′ diffraction peaks in the XRD curve of the BNiZr-3 filler as discussed in Section 3.1.
Figure 10e,f show the phase diagram adjustment of Mo based on the BNiZr-1 filler and the calculated phase mole fraction of the system at 1200 °C. The phase diagram indicates that despite an increase in Mo content, the liquidus line of the system remains stable at around 1140 °C, and the Ni7Zr2 phase boundary stabilizes at around 1130 °C, which is consistent with the results of DSC test. According to the calculated phase fractions, when the mass fraction of Mo in the system is ~(7–8) wt.%, the system exists entirely in the liquid phase, indicating that within this range, the filler can fully melt to fill the weld gap.
4.2. The Formation Process of the Joint
According to the analysis in Section 4.1, at the brazing temperature, the BNiZr-4 filler is completely in the liquid state. During the brazing process, there is interdiffusion of elements between the BM and the filler. As the BM, IC21 contains ~77.0 wt.% Ni, which is higher than the Ni content in the BNiZr-4 filler (~65.0 wt.%), resulting in concentration gradients between the BM and the filler. For a one-dimensional problem, Fick’s law reduces to [47]:
where is diffusion flux, presents effective diffusivity, and / denotes concentration gradient. When there are concentration ( differences in the solid, atoms will diffuse from regions of high concentration to regions of low concentration. Before brazing, the Ni concentration in the BM () is higher than the Ni concentration in the filler (. Therefore, during brazing, Ni from the BM diffuses towards the center of the joint.
Since the Al content in both the BM and the filler are the same, it is necessary to consider the influence of chemical potential on diffusion. The driving force for diffusion always causes diffusion to proceed in the direction of decreasing chemical potential until . Chemical potentials of Al in the BM () were calculated using Thermo-Calc. Chemical potentials of Ni and Mo at 1200 °C were simultaneously calculated to further determine the direction of chemical driving force (Figure 11). Additionally, the influence of Mo variation in the filler on the change in element chemical potentials () at 1200 °C was calculated for subsequent discussion. The chemical potentials of elements in the BNiZr-1, BNiZr-4, and BNiZr-5 fillers have been indicated in Figure 11. To emphasize the magnitude of element’s chemical potentials in both the BM and filler, dashed lines were used to represent the chemical potentials of elements in the BM. The data marked with dashed lines are independent of the x-axis.
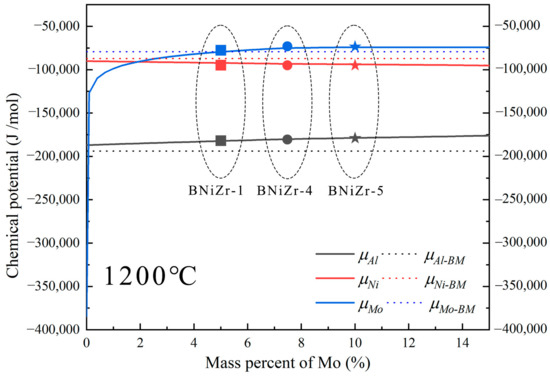
Figure 11.
The chemical potentials of elements after adjusting Mo in the BNiZr-1 filler and the chemical potentials of elements in the BM and the fillers at 1200 °C.
Based on the calculations from Figure 11, it can be inferred that at 1200 °C, Al diffuses from the filler to the BM, while Ni diffuses from the BM to the filler, forming single-phase γ′ regions known as the ISZ on both sides of the ASZ. The Ni that has not fully diffused from the BM into the joint, along with elements like Re and Mo in the BM used for solid solution strengthening of γ, form the granular NiMo phase in the DAZ. The substrate of the DAZ is the γ′ phase formed in the BM after Ni diffusion into the joint. During the cooling process after brazing, the γ′ phase precipitates and grows to form the ISZ. Spherical γ′ phases are prominently observed in Figure 12. Mo tends to partition into the γ phase, while Zr, with a significant atomic size difference from Ni, tends to segregate at the γ phase boundaries [7]. Zr reacts with Mo-containing γ phase along the γ′ grain boundaries to form significant quantities of the P-TCP phase and the Ni7Zr2 phase within the γ+γ′ eutectic. On both sides of the ISZ, enriched regions of P-TCP, Ni7Zr2, and γ+γ′ eutectic constitute the DAZ and ASZ.
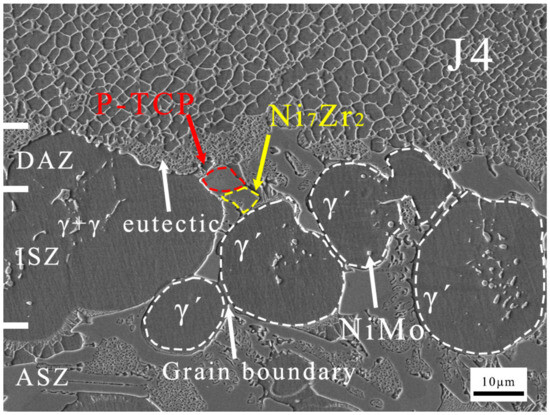
Figure 12.
Microstructure images of J4.
4.3. The Influence of Elemental Adjustments on the Joint
The phase constitutes of each area in the joint were determined in Section 3.1. Each area of the joint has been marked out in Figure 7. Figure 13 analyzes the percentage of the width of each area to the width of the joints brazed with different fillers according to Figure 7.
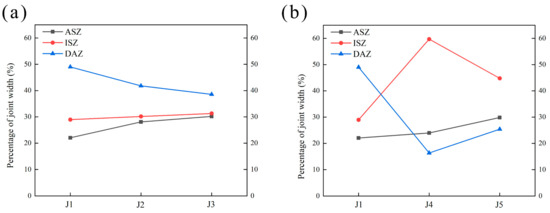
Figure 13.
The percentage of the width of each area to the width of the joints. (a) Adjusted Zr, (b) adjusted Mo.
4.3.1. ASZ
According to the analysis in Section 3.1, the ASZ is mainly composed of Ni7Zr2, TCP, and γ+γ′ eutectic. Compared to J1, J2, and J3, with the increase in Zr content, the amount of Ni-Zr phase in the joints progressively increases. According to the Ni-Zr binary phase diagram (Figure 14a), when the atomic proportion of Zr in the Ni-Zr system is (16–27.5) at. % at 1200 °C, the Ni-Zr phase all exists in the form of Ni7Zr2. EDS analysis was performed on Ni-Zr phase of five joints, and the changes in compositions of Ni-Zr phases are shown in Figure 14b. It can be seen that the changes in Ni and Mo in filler did not affect the compositions of Ni-Zr phases obtained by brazing at 1200 °C for 30 min. This result demonstrates that the Ni-Zr phases present in the five brazed joints exist primarily in the form of Ni7Zr2.
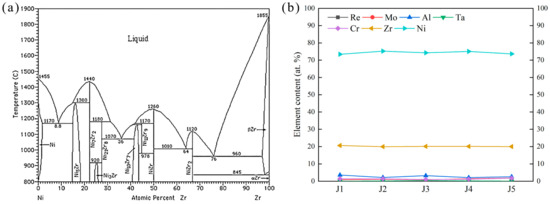
Figure 14.
(a) Ni-Zr binary phase diagram [48]. (b) Ni-Zr phase element change curve of different joints.
For J1, J2, and J3, the increase in Zr content in the joint leads to an increase in Ni7Zr2 in the ASZ, as shown in Figure 7. Consequently, the proportion of ASZ width increases with the increase in Zr content. Similarly, for J1, J4, and J5, an increase in Mo content also results in a higher presence of the P-TCP phase in the joint. Therefore, with the increase in Mo content, the proportion of ASZ width increases as well.
4.3.2. DAZ and ISZ
According to the discussion in Section 4.2, the ISZ is primarily composed of a single-phase γ′ region formed by Ni diffusing from the BM to the filler and Al diffusing from the filler to the BM. The DAZ is the region where the reaction occurs between the BM and the filler, as well as where the phases precipitate between the ISZ and the BM. In the BNiZr-1 filler, the Ni content is ~67.5 wt.%. Ni is added as a balance component during the formulation. So, as the Zr content increases, the Ni content decreases. In the BNiZr-3 filler, the Ni content has been reduced to ~63.5 wt.%. The Ni concentration gradient between the BM and the filler increases. More Ni diffuses from the BM into the weld seam, causing the Ni in the BM to more readily transform into γ′. However, with the increase in Zr content in the filler, the Zr concentration gradient between the filler and the BM also increases. Consequently, more Zr forms Ni7Zr2 at the DAZ. The presence of Ni7Zr2 and the supersaturated Zr in the DAZ impedes the diffusion of Ni from the BM into the joint. This may explain why the proportion of DAZ width decreases with the increase in Zr content.
With an increase in Mo content, the proportion of DAZ width decreases significantly. In J4 and J5, there are no large amounts of granular NiMo phase observed in the DAZ. This contrasts with the noticeable changes in the DAZ region observed in J1 and is the primary reason for the reduced DAZ width in J4 and J5. In this context, the effect of Mo addition on the chemical potentials of elements during the brazing process should be considered.
According to the results from Thermo-Calc calculations (Figure 11), it is observed that with an increase in Mo content, the chemical potential of Ni decreases, while that of Al increases in the filler. Therefore, as the Mo content increases, the driving force for diffusion of Ni from the BM to the filler, as well as Al from the filler to the BM, also increases. For J1, Section 4.2 has already explained that the NiMo phase in the DAZ is formed by the interaction of Mo and other elements with Ni, originally from the γ phase in the BM.
Figure 15 illustrates the variation in diffusion coefficients of Al and Ni in the filler liquid phase at 1200 °C with adjustments in Mo content (based on BNiZr-1 filler). It can be observed that with the increase in Mo content, both the diffusion coefficients of Al () and Ni () in the filler liquid phase at 1200 °C increase. The increase in Mo content leads to a decrease in the chemical potential of Ni in the filler, and an increase in the diffusion coefficient of Ni in the filler liquid phase, which causes the BM to be more inclined to transform into γ′. Additionally, the increase in the chemical potential of Al in the filler and the diffusion coefficient of Al in the liquid phase also contribute to the preference of the BM towards γ′ transformation, leading to the release of refractory elements such as Mo and the precipitation of TCP phases [49].
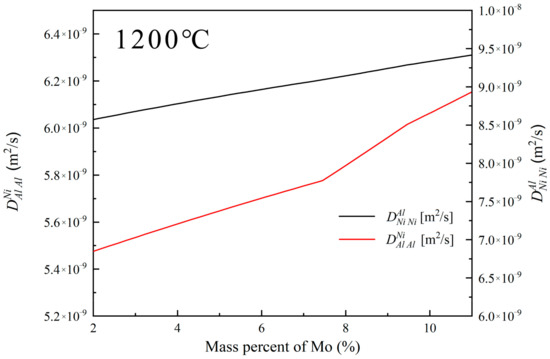
Figure 15.
The diffusion coefficients of Al and Ni in the filler liquid phase at 1200 °C when adjusting the Mo content (based on the BNiZr-1 filler).
Based on the analysis above, theoretically, an increase in Mo content should result in more γ phases in the BM transforming into γ′ phases, leaving behind a significant amount of NiMo phases in the original position of the γ phase in the BM, thus increasing the proportion of DAZ width in J4. However, in reality, when Mo is increased, the proportion of DAZ width in J4 significantly decreases. This is because a large amount of Mo in the filler is excluded from the ISZ due to its limited solubility, with one side located in the ASZ and the other side in the DAZ. The accumulation of Mo in the DAZ forms diffusion barriers [50], hindering the mutual diffusion between the BM and filler and causing a significant precipitation of P-TCP phases in the DAZ. The Ni blocked by Mo from diffusing into the filler maintains the integrity of the γ+γ′ eutectic in the BM, while the Al blocked from diffusing into the BM leads to the formation of more ISZ in the joint. Therefore, compared to J1, the proportion of ISZ width in J4 significantly increases. The increase in Mo content also increases the amount of P-TCP in the DAZ. Thus, relative to J4, the proportion of DAZ width in J5 increases.
4.4. Joint Failure Behavior
In Section 3.3, the tensile strength at 980 °C and fracture morphology of the joints were provided. According to the fracture morphology in Figure 9, it can be observed that the failure occurred exclusively at the edges of the γ′ phase. This occurs because in the joint, the P-TCP and Ni7Zr2 phases, which act as sources of cracks, primarily accumulate at the γ′ phase grain boundaries, and the cracks propagate along these γ′ phase boundaries. In this study, the P-TCP phase is mainly composed of Ni, Mo, and Cr. The precipitation of the TCP phase consumes excessive amounts of solid solution strengthening elements [51]. Microcracks readily generate near the TCP phases [52] and the hard and brittle nature of the TCP phase can easily lead to alloy cracking [53,54]. Simultaneously, the NiMo phase also acts as a source of cracks and is dispersed throughout the DAZ.
As the Zr content increases, the presence of the Ni7Zr2 phase in the joint also increases, leading to a higher number of crack initiation sites and a consequent decrease in the tensile strength of the joint. The presence of pores in the ASZ of the J3 fracture morphology further confirms the increase in crack sources within the joint. When the Mo content is increased, compared to J1, a significant transformation occurs in the joint where the dispersed NiMo phase transitions from being widely distributed to forming a continuous distribution of P-TCP phase, leading to a significant decrease in the proportion of DAZ width in J4. This suggests a reduction in crack sources in J4, thereby significantly enhancing its tensile strength compared to J1. However, as the Mo content continues to increase, the increased presence of the P-TCP phase in the joint leads to more crack sources, thus reducing the tensile strength of J5 compared to J4.
5. Conclusions
The brazing joint of the Ni3Al-based single crystal superalloy IC21 was prepared using a Zr-containing filler at a brazing temperature of 1200 °C for 30 min. The effect of adjusting the content of Zr and Mo in the filler on the microstructural evolution and 980 °C tensile properties of the joints was investigated. The following conclusions were drawn:
- (1)
- Thermo-Calc calculations and experimental results suggest that Zr can be utilized as an MPD in the preparation of the filler for brazing Ni3Al-based single crystal superalloys. This results in the formation of robust joints characterized by a combination of γ′, γ, P-TCP, Ni7Zr2, and NiMo phases. The joint can be divided into four regions: BM, ASZ, ISZ, and DAZ.
- (2)
- When adjusting the Zr and Mo contents within appropriate ranges, the filler can completely transform into a liquid state and enter the joint at 1200 °C. Increasing the Zr content in the joint leads to a higher concentration of the Ni7Zr2 phase, which results in an increase in the proportion of the ASZ width. Increasing the Mo content theoretically should increase the diffusion of Ni from the BM to the filler and Al from the filler to the BM. However, the diffusion barrier effect of Mo impedes this phenomenon, leading to a transformation of NiMo phases in the DAZ to P-TCP phases. Nonetheless, a continued increase in Mo content also leads to a higher concentration of the P-TCP phase in the joint.
- (3)
- Ni7Zr2, NiMo, and P-TCP phases are the failure locations of joints. When the Zr content is increased, the rise in the Ni7Zr2 phase within the joint leads to a reduction in the tensile strength. As the Mo content increases, there is a reduction in the NiMo phase, resulting in an increased tensile strength of J4 compared to J1. However, the continuous increase in Mo leads to an increase in the P-TCP phase in the joint, causing a decrease in the tensile strength of J5 compared to J4.
Author Contributions
Conceptualization, Y.C. and Y.L.; methodology, Y.C. and S.L.; software, L.G. and J.Z. (Jianqiang Zhang); investigation, Y.C., Y.S., F.Y. and J.Z. (Jie Zhang); data curation, Y.C. and T.J.; writing—original draft preparation, Y.C.; writing—review and editing, Y.C. and Y.L.; project administration, S.G.; funding acquisition, Y.P., Y.L. and H.Z. All authors have read and agreed to the published version of the manuscript.
Funding
This research was funded by the National Natural Science Foundation, grant No. 52371090 and No. 52401135; National Science and Technology Major Project, grant number 2019-VI-0016; National Natural Science Foundations of China, grant No. 52101117; Science Center for Gas Turbine Project, grant number P2022-B-IV-004-001.
Data Availability Statement
The original contributions presented in the study are included in the article, further inquiries can be directed to the corresponding authors.
Conflicts of Interest
Author Jianqiang Zhang was employed by the company Guiyang AECC Power Precision Casting Co., Ltd. The remaining authors declare that the research was conducted in the absence of any commercial or financial relationships that could be construed as a potential conflict of interest.
References
- Seyring, M.; Rettenmayr, M. Impact of crystallography at Ni/NiAl interfaces on the nucleation of Ni3Al. Acta Mater. 2021, 208, 116713. [Google Scholar] [CrossRef]
- Wu, J.; Liu, Y.-C.; Li, C.; Xia, X.-C.; Wu, Y.-T.; Li, H.-J.; Wang, H.-P. Microstructural Characterization and Phase Separation Sequences During Solidification of Ni3Al-Based Superalloy. Acta Metall. Sin. Engl. Lett. 2017, 30, 949–956. [Google Scholar] [CrossRef]
- Ghoneim, A.; Ojo, O.A. On the influence of boron-addition on TLP bonding time in a Ni3Al-based intermetallic. Intermetallics 2010, 18, 582–586. [Google Scholar] [CrossRef]
- Yuan, L.; Ren, J.; Xiong, J.; Zhao, W.; Shi, J.; Li, J. Transient liquid phase bonding of Ni3Al based superalloy using Mn–Ni–Cr filler. J. Mater. Res. Technol. 2021, 11, 1583–1593. [Google Scholar] [CrossRef]
- Kong, Z.; Li, S. Effects of temperature and stress on the creep behavior of a Ni3Al base single crystal alloy. Prog. Nat. Sci. 2013, 23, 205–210. [Google Scholar] [CrossRef][Green Version]
- Ferasat, K.; Swinburne, T.D.; Saidi, P.; Daymond, M.R.; Yao, Z.; Béland, L.K. Interstitialcy-based reordering kinetics of Ni3Al precipitates in irradiated Ni-based super alloys. Materialia 2021, 19, 101180. [Google Scholar] [CrossRef]
- Reed, R.C. The Superalloys Fundamentals and Applications, 1st ed; Cambridge University Press: New York, NY, USA, 2006. [Google Scholar]
- Gao, S.; Zhou, Y.; Li, C.-F.; Cui, J.; Liu, Z.-Q.; Jin, T. In situ investigation on the precipitation of topologically close-packed phase in Ni-base single crystal superalloy. J. Alloys Compd. 2014, 610, 589–593. [Google Scholar] [CrossRef]
- Bennett, R.J.; Krakow, R.; Eggeman, A.S.; Jones, C.N.; Murakami, H.; Rae, C.M.F. On the oxidation behavior of titanium within coated nickel-based superalloys. Acta Mater. 2015, 92, 278–289. [Google Scholar] [CrossRef]
- Chai, H.; Wang, L.; Lin, X.; Zhang, S.; Yang, H.; Huang, W. Microstructure and cracking behavior of Ni3Al-based IC21 alloy fabricated by selective laser melting. Mater. Charact. 2023, 196, 112592. [Google Scholar] [CrossRef]
- Li, H.; Li, F.; Li, S.; Zhang, H.; Gong, S. Influence of ageing treatments on stress rupture properties of Ni3Al-base single-crystal alloy IC21 at 850°C. Mater. Sci. Forum 2013, 747–748, 659–664. [Google Scholar] [CrossRef]
- Wei, L.; Zhang, Z.; Zhang, H.; Li, S.; Gong, S. Influence of aging heat treatment on microstructure and hardness of single crystal Ni3Al-base superalloy IC21. Procedia Eng. 2012, 27, 1081–1088. [Google Scholar] [CrossRef][Green Version]
- Zhao, H.; Li, S.; Pei, Y.; Gong, S.; Xu, H. Microstructure and mechanical properties of Ni3Al-based single crystsalalloy IC21. Jinshu Xuebao 2015, 51, 1279–1287. [Google Scholar]
- Liang, Y.; Li, S.; Ai, C.; Han, Y.; Gong, S. Effect of Mo content on microstructure and stress-rupture properties of a Ni-base single crystal superalloy. Prog. Nat. Sci. 2016, 26, 112–116. [Google Scholar] [CrossRef]
- Pouranvari, M.; Ekrami, A.; Kokabi, A.H. Solidification and solid state phenomena during TLP bonding of IN718 superalloy using Ni–Si–B ternary filler alloy. J. Alloys Compd. 2013, 563, 143–149. [Google Scholar] [CrossRef]
- Ojo, O.A.; Richards, N.L.; Charturvedi, M.C. Effect of gap size and process parameters on diffusion brazing of Inconel 738. Sci. Technol. Weld. Join. 2004, 9, 209–220. [Google Scholar] [CrossRef]
- Dong, H.; Xia, Y.; Xu, X.; Naz, G.J.; Hao, X.; Li, P.; Zhou, J.; Dong, C. Performance of GH4169 brazed joint using a new designed nickel-based filler metal via cluster-plus-glue-atom model. J. Mater. Sci. Technol. 2020, 39, 89–98. [Google Scholar] [CrossRef]
- Wang, J.; Xiong, Q.; Wang, J.; Xiong, Y.; Yang, J.; Zhang, F. Microstructure and mechanical properties of YG8/IN718 alloy joints prepared by vacuum brazing. Vacuum 2019, 169, 108942. [Google Scholar] [CrossRef]
- Shi, D.; Dong, C.; Yang, X.; Zhang, L.; Hou, J.; Liu, Y. Experimental investigations on creep rupture strength and failure mechanism of vacuum brazed joints of a DS superalloy at elevated temperature. Mater. Sci. Eng. A 2012, 545, 162–167. [Google Scholar] [CrossRef]
- Wu, N.; Li, Y.; Wang, J. Microstructure of Ni–NiCr laminated composite and Cr18–Ni8 steel joint by vacuum brazing. Vacuum 2012, 86, 2059–2063. [Google Scholar] [CrossRef]
- Li, S.; Liu, Z.; Xia, Y.; Wang, X.; He, P.; Jiu, Y.; Jia, L.; Long, W. Vacuum brazing TiAl intermetallics to GH3030 alloy with a multi-component Ti-based filler metal. J. Manuf. Process. 2021, 70, 484–493. [Google Scholar] [CrossRef]
- Amirnasiri, A.; Mirsalehi, S.E. Effect of contact time parameter on wettability and interface phenomena of B4C substrate by Ni–Cr–Si–Fe–B–C filler alloy. Ceram. Int. 2022, 48, 32777–32786. [Google Scholar] [CrossRef]
- Mukhopadhyay, P.; Ghosh, A. On bond wear, grit-alloy interfacial chemistry and joint strength of synthetic diamond brazed with Ni-Cr-B-Si-Fe and Ti activated Ag-Cu filler alloys. Int. J. Refract. Met. Hard Mater. 2018, 72, 236–243. [Google Scholar] [CrossRef]
- Doroudi, A.; Shamsipur, A.; Omidvar, H.; Vatanara, M. Effect of transient liquid phase bonding time on the microstructure, isothermal solidification completion and the mechanical properties during bonding of Inconel 625 superalloy using Cr-Si-B-Ni filler metal. J. Manuf. Process. 2019, 38, 235–243. [Google Scholar] [CrossRef]
- Alinaghian, H.; Farzadi, A.; Marashi, P.; Pouranvari, M. Wide gap brazing using Ni–B–Si and Ni–B–Si–Cr–Fe filler metals: Microstructure and high-temperature mechanical properties. J. Mater. Res. Technol. 2023, 23, 2329–2342. [Google Scholar] [CrossRef]
- Tazikeh, H.; Mirsalehi, S.E.; Shamsipur, A. Relationship of isothermal solidification completion and precipitate formation with mechanical properties of Inconel 939 joints vacuum TLP bonded by an amorphous Ni–Cr–Fe–Si–B filler alloy. J. Mater. Res. Technol. 2022, 18, 4762–4774. [Google Scholar] [CrossRef]
- Liao, P.; Zhou, G.-Y.; Zhang, K.; Ma, H.; Duan, P.; Zhang, C.-C.; Zhang, X.-C.; Tu, S.T. Phase diagram-guided composition design and property investigation of Ni-based filler metals. Mater. Sci. Eng. A 2024, 891, 145946. [Google Scholar] [CrossRef]
- Malekan, A.; Farvizi, M.; Mirsalehi, S.E.; Saito, N.; Nakashima, K. Influence of bonding time on the transient liquid phase bonding behavior of Hastelloy X using Ni-Cr-B-Si-Fe filler alloy. Mater. Sci. Eng. A 2019, 755, 37–49. [Google Scholar] [CrossRef]
- Esmaeili, H.; Mirsalehi, S.E.; Farzadi, A. Vacuum TLP bonding of Inconel 617 superalloy using Ni-Cr-Si-Fe-B filler metal: Metallurgical structure and mechanical properties. Vacuum 2018, 152, 305–311. [Google Scholar] [CrossRef]
- Zhang, Y.-C.; Yu, X.-T.; Jiang, W.; Tu, S.-T.; Zhang, X.-C. Elastic modulus and hardness characterization for microregion of Inconel 625/BNi-2 vacuum brazed joint by high temperature nanoindentation. Vacuum 2020, 181, 109582. [Google Scholar] [CrossRef]
- Amiri, D.; Sajjadi, S.A.; Bakhtiari, R.; Kamyabi-Gol, A. The role of TLP process variables in improvement of microstructure and mechanical properties in TLP joints of GTD-111/Ni-Cr-Fe-B-Si/GTD-111 system. J. Manuf. Process. 2018, 32, 644–655. [Google Scholar] [CrossRef]
- Arhami, F.; Mirsalehi, S.E.; Sadeghian, A.; Johar, M.H. The joint properties of a high-chromium Ni-based superalloy made by diffusion brazing: Microstructural evolution, corrosion resistance and mechanical behavior. J. Manuf. Process. 2019, 37, 203–211. [Google Scholar] [CrossRef]
- Pouranvari, M.; Ekrami, A.; Kokabi, A.H. Transient liquid phase bonding of wrought IN718 nickel based superalloy using standard heat treatment cycles: Microstructure and mechanical properties. Mater. Des. 2013, 50, 694–701. [Google Scholar] [CrossRef]
- Hadibeyk, S.; Beidokhti, B.; Sajjadi, S.A. Effect of bonding time and homogenization heat treatment on the microstructure and mechanical properties of the transient liquid phase bonded dissimilar GTD-111/FSX-414 TLP superalloys. J. Alloys Compd. 2018, 731, 929–935. [Google Scholar] [CrossRef]
- Li, S.; Li, J.; Shi, J.; Du, Y.; Peng, Y.; Jin, F.; Xiong, J.; Zhang, F. Microstructure and mechanical properties of the brazed region in the AlCoCrFeNi high-entropy alloy and FGH98 superalloy joint. Mater. Sci. Eng. A 2021, 804, 140714. [Google Scholar] [CrossRef]
- Yang, Z.W.; Lian, J.; Cai, X.Q.; Wang, Y.; Wang, D.P.; Liu, Y.C. Microstructure and mechanical properties of Ni3Al-based alloy joint transient liquid phase bonded using Ni/Ti interlayer. Intermetallics 2019, 109, 179–188. [Google Scholar] [CrossRef]
- Du, Y.; Zhang, J.; Li, J.; Wang, F.; Ding, Y.; Xiong, J.; Guo, W. Microstructure evolution and mechanical properties of Ti2AlNb/TC17 joints brazed with Ti–Zr–Cu–Ni filler metal. Vacuum 2023, 215, 112365. [Google Scholar] [CrossRef]
- Khorunov, V.F.; Maksimova, S.V.; Evolinskii, I.V. Brazing alloys based on the Ni–Cr–Zr system for brazing creep-resisting nickel alloys. Weld. Int. 2010, 24, 462–464. [Google Scholar] [CrossRef]
- Lu, T.; Yi, D.; Wang, H.; Tu, X.; Wang, B. Microstructure, mechanical properties, and interfacial reaction with Cu substrate of Zr-modified SAC305 solder alloy. J. Alloys Compd. 2019, 781, 633–643. [Google Scholar] [CrossRef]
- Shi, H.; Peng, H.; Chai, Y.; Li, N.; Wen, Y.; Bai, D.; Liu, Z.; Yan, J.; Zhang, R.; Li, M.; et al. Effect of Zr addition on the interfacial reaction of the SiC joint brazed by Inconel 625 powder filler. J. Eur. Ceram. Soc. 2021, 41, 6238–6247. [Google Scholar] [CrossRef]
- Binesh, B.; Jazayeri Gharehbagh, A. Transient Liquid Phase Bonding of IN738LC/MBF-15/IN738LC: Solidification Behavior and Mechanical Properties. J. Mater. Sci. Technol. 2016, 32, 1137–1151. [Google Scholar] [CrossRef]
- Rae, C.M.F.; Karunaratne, M.S.A.; Small, C.J.; Broomfield, R.W.; Jones, C.N.; Reed, R.C. Topologically Close Packed Phases in an Experimental Rhenium Containing Single Crystal Superalloy. Superalloys 2000, 767–776. [Google Scholar] [CrossRef]
- Nash, P.; Jayanth, C.S. The Ni−Zr (Nickel-Zirconium) system. Bull. Alloy Phase Diagr. 1984, 5, 144–148. [Google Scholar] [CrossRef]
- Materials Project. Materials Project for AlNi3 (mp-2593); Materials Project, 2023. [Google Scholar]
- Materials Project. Materials Project for Ni (mp-23); Materials Project, 2023. [Google Scholar]
- Shoemaker, C.B.; Shoemaker, D.P. The crystal structure of the δ phase Mo–Ni. Acta Crystallogr. 1963, 16, 997–1009. [Google Scholar] [CrossRef]
- Hashim, F.A.; Mostafa, R.R.; Hussien, A.G.; Mirjalili, S.; Sallam, K.M. Fick’s Law Algorithm: A physical law-based algorithm for numerical optimization. Knowl. Based Syst. 2023, 260, 110146. [Google Scholar] [CrossRef]
- Manukyan, K.; Amirkhanyan, N.; Aydinyan, S.; Danghyan, V.; Grigoryan, R.; Sarkisyan, N.; Gasparyan, G.; Aroutiounian, R.; Kharatyan, S. Novel NiZr-based porous biomaterials: Synthesis and in vitro testing. Chem. Eng. J. 2010, 162, 406–414. [Google Scholar] [CrossRef]
- Wu, Y.; Wei, L.; He, W.; Guo, H. On the interdiffusion and precipitation of topologically close-packed phases in (Ni,Pt)Al coating/superalloy system: Effects of Pt and Ni contents in coating. Vacuum 2021, 193, 110527. [Google Scholar] [CrossRef]
- Han, D.; Liu, D.; Niu, Y.; Qi, Z.; Pan, Y.; Xu, H.; Zheng, X.; Chen, G. Interface stability of NiCrAlY coating without and with a Cr or Mo diffusion barrier on Ti-42Al-5Mn alloy. Corros. Sci. 2021, 188, 109538. [Google Scholar] [CrossRef]
- Liu, Y.; Zhou, H.; Wu, M.; Duan, H.; Ru, Y.; Pei, Y.; Li, S.; Gong, S.; Zhang, H. Coating-related deterioration mechanism of creep performance at a thermal exposed single crystal Ni-base superalloy. Mater. Charact. 2022, 187, 111839. [Google Scholar] [CrossRef]
- Zhang, Z.; Yue, Z. TCP phases growth and crack initiation and propagation in nickel-based single crystal superalloys containing Re. J. Alloys Compd. 2018, 746, 84–92. [Google Scholar] [CrossRef]
- Wang, X.-Y.; Wang, J.-J.; Zhang, C.-J.; Tong, W.-W.; Jiang, B.; Lu, G.-X.; Wen, Z.-X.; Feng, T. Creep prediction model for nickel-based single-crystal superalloys considering precipitation of TCP phase. Rare Met. 2021, 40, 2892–2904. [Google Scholar] [CrossRef]
- Liu, Y.; Ru, Y.; Zhang, H.; Pei, Y.; Li, S.; Gong, S. Coating-assisted deterioration mechanism of creep resistance at a nickel-based single-crystal superalloy. Surf. Coat. Technol. 2021, 406, 126668. [Google Scholar] [CrossRef]


Disclaimer/Publisher’s Note: The statements, opinions and data contained in all publications are solely those of the individual author(s) and contributor(s) and not of MDPI and/or the editor(s). MDPI and/or the editor(s) disclaim responsibility for any injury to people or property resulting from any ideas, methods, instructions or products referred to in the content. |
© 2024 by the authors. Licensee MDPI, Basel, Switzerland. This article is an open access article distributed under the terms and conditions of the Creative Commons Attribution (CC BY) license (https://creativecommons.org/licenses/by/4.0/).