Article

Computational Fluid Dynamic Analysis of a High-Pressure Spatial Chemical Vapor Deposition (HPS-CVD) Reactor for Flow Stability

Department of Materials Science and Engineering, Center for Photonics and Nanoelectronics, Lehigh University, Bethlehem, PA 18015, USA
*
Author to whom correspondence should be addressed.
Crystals 2024, 14(2), 105; https://doi.org/10.3390/cryst14020105
Submission received: 24 December 2023 / Revised: 15 January 2024 / Accepted: 17 January 2024 / Published: 23 January 2024

Abstract

:
High indium-content group-III nitrides are of interest to further expand upon our ability to produce highly efficient optical emitters at longer visible/IR wavelengths or to broaden bandgap engineering opportunities in the group-III nitride material system. Current synthesis approaches are limited in their capabilities, in part due to the low decomposition temperature of indium nitride. A new high-pressure spatial chemical vapor deposition (HPS-CVD) has been proposed which can operate at pressures up to 100 atmospheres, thereby significantly raising the growth temperature of indium nitride more than 100 kelvins and permitting the investigation of the impact of pressure on precursor stability and reactivity. This study systematically analyzes an HPS-CVD reactor design using computational fluid dynamic modeling in order to understand favorable operating conditions for growth of group III nitrides. Specifically, the relationship between inlet gas type (nitrogen, hydrogen, or ammonia), inlet gas velocity, gas flow rate, and rotational speed of the wafer carrier is evaluated for conditions under which a smooth and dominant vortex-free flow are obtained over the wafer. Heater power was varied to maintain a wafer temperature of 1250–1300 K. Favorable operating conditions were identified that were simultaneously met for all three gas types, providing a stable operating window for a wide range of gas chemistries for growth; at one atmosphere, a disk rotational speed of 50 rpm and a flow rate of 12 slm for all gas types is desired.

1. Introduction

Metal-organic chemical vapor deposition (MOCVD) is a common process in the semiconductor industry, often used to make electronic and opto-electronic devices (i.e., light-emitting diodes (LED) or high-power, high-frequency emitters) [1,2,3]. The group III nitrides form a material system in which one can tailor a direct bandgap continuously over a large span ranging from 0.7 eV (for indium nitride, InN) through 3.4 eV (for gallium nitride, GaN) to 6.2 eV (for aluminum nitride, AlN). This offers opportunities to form efficient optical emitters in the infrared (IR) through visible into the ultraviolet (UV) regime [4,5]. Additionally, the larger bandgap for GaN and ultra-wide bandgap group III nitrides containing higher aluminum-content offer the opportunity to explore high-efficiency, high-power electronic devices [6,7]. Key to enabling these devices is having access to materials in a high-quality thin-film form of tailored alloy compositions, which are needed to form these devices—a capability that was enabled by the initial development of a two-flow MOCVD reactor by S. Nakamura et al. [8].
Similar to the large span of the electronic bandgap of the group III nitrides is the bond strength of the metal–nitrogen bond. A consequence of it is a significant disparity in the desired growth temperature of the three different binary nitrides (AlN, InN, GaN). InN is the weakest of the three, exhibiting a relatively low decomposition temperature of ~560 °C at 1 atm of nitrogen, necessitating lower growth temperatures (below 800 °C), while AlN is the strongest, exhibiting a decomposition temperature of ~2400 °C, and hence, also requiring higher growth temperatures of more than 1200 °C [9].
An important and key strategy that is currently deployed for increasing the indium (In) concentration in group III-nitride films is to reduce the growth temperature. This increases the probability of In incorporation, yet also increases the probability of defect formations due to the reduced mobility of the adatoms on the surface. This strategy has led to successful demonstrations of higher quality films up to ~25% In in In1−xGaxN [10,11] or AlxIn1−xN films lattice-matched to GaN with an In about 17% [12,13].
In order to push towards higher In-content films to, for example, further increase the wavelengths down from green into the red and IR, to reduce defects which emerge as a result from lower growth temperatures, and to broaden the window of achievable AlxIn1−xN films at high quality, strategies need to be developed which can reduce the disparity in the growth temperature of the different nitrides. The strategy upon which the new high-pressure MOCVD system is based is the thermodynamic consequence of the increased stability of the nitride, which occurs upon any increases in nitrogen pressure [9]. This pressure-based approach is seen as complementary to other approaches, such as ab initio molecular dynamics (AIMD), being investigated to modify and understand changes to precursor chemistry in order to facilitate the growth of these materials at lower temperatures [14,15,16,17].
Growth of In-containing nitrides at elevated temperatures will result in improved crystal quality and reduced defect concentrations, due to the higher adatom mobility on the surface. Higher pressures will reduce evaporation of In from the surface which leads to higher In-content films and potentially reduced point defect concentrations. For optical emitters, this has the consequence of yielding higher internal efficiency devices with reduced non-radiative recombination and longer wavelength devices. Additionally, growth of InN at higher temperatures could lead to higher crystal growth quality and provide an MOCVD-based tool to explore the use of InN for high frequency devices, possibly entering the THz range [18].
A review of the literature for super-atmospheric (beyond ~2–3 atm) MOCVD designs yields a horizontal MOCVD reactor, reported to be mechanically capable of withstanding pressure up to 120 atm [19,20,21,22]. Operation at higher pressures, though, highlighted unavoidable fluid dynamics limitations; in particular, the onset of turbulence due to higher gas densities and increased precursor molecule–molecule and molecule–wall interactions prior to reaching the wafer, practically limiting the operating pressure window to less than ~15 atm. Due to these limitations, gas flow rates had to be reduced, and demonstrated growth rates were ~200 nm/hour yielding low-quality films [23].
A new high-pressure MOCVD design, which is based on a vertical MOCVD design and minimizes the interaction of the precursors prior to reaching the wafer via spatial separation of them until just before they reach the boundary layer, was proposed by Yousefian et al. [24] and was referred to as a high-pressure spatial CVD system (HPS-CVD). The initial computational study provided a proof-of-concept of the viability of the tool for operation at higher pressures, while suggesting that similar growth rates could be achieved by traditional MOCVD reactors operating at 1 atm system. The current study seeks to further expand upon our understanding of the operation of this tool with a systematic computational fluid dynamic analysis, interrogating the relationship between the rotational speed of the wafer carrier disk and the inlet gas velocity, while considering full radiation heat transfer inside the numerical domain and three gases: nitrogen, hydrogen, and ammonia.
It is worth highlighting that scientists and engineers have employed computational fluid dynamics (CFD) as a predictive tool to numerically simulate flow and thermal maps in a wide range of systems. This approach allows for a faster and enhanced comprehension of the physics involved in the application. Several researchers have extensively explored numerical analyses of models for CVD reactors, specifically focusing on various objectives such as reactor geometry or the impact of gas flow rates [25,26,27,28,29,30,31,32,33,34,35,36,37,38,39,40,41,42,43,44]. For instance, Chaung et al. [45] conducted a comprehensive 3D full-scale numerical simulation using COMSOL for GaAs film growth in a commercial horizontal MOCVD reactor. In their study, they incorporated temperature-dependent properties and implemented a comprehensive heat transfer scheme. Through sensitivity analysis, the authors demonstrated that total flow, susceptor temperature, and operating pressure have significant impacts on both film growth rate and uniformity index. Similarly, the authors employed computational fluid dynamics (CFD) to initiate a MOCVD reactor study from its inception and subsequently analyze the obtained results.

2. Scope of Work

The current work provides a systematic and detailed study on the flow patterns of nitrogen, hydrogen, and ammonia in an optimized and updated design of the previously demonstrated proof-of-concept HPS-CVD design in [24], leading to improved flow performance for three different types of gases at the operating pressure of one atmosphere. Of particular focus for this study is the identification of suitable operating conditions (inlet gas speed and volumetric flow rate), the rotational speed of wafer carrier (disk), and the power requirement for wafer temperatures of 1250–1300 K, for which smooth flow exists inside the chambers and exhaust.

3. Governing Equations

The governing equations used in this study are the non-transient compressible Navier–Stokes equations, which consider the temperature dependent properties. Detailed information about the compressible continuity, momentum equations, and the energy equation can be found in [46,47].

4. Numerical Method

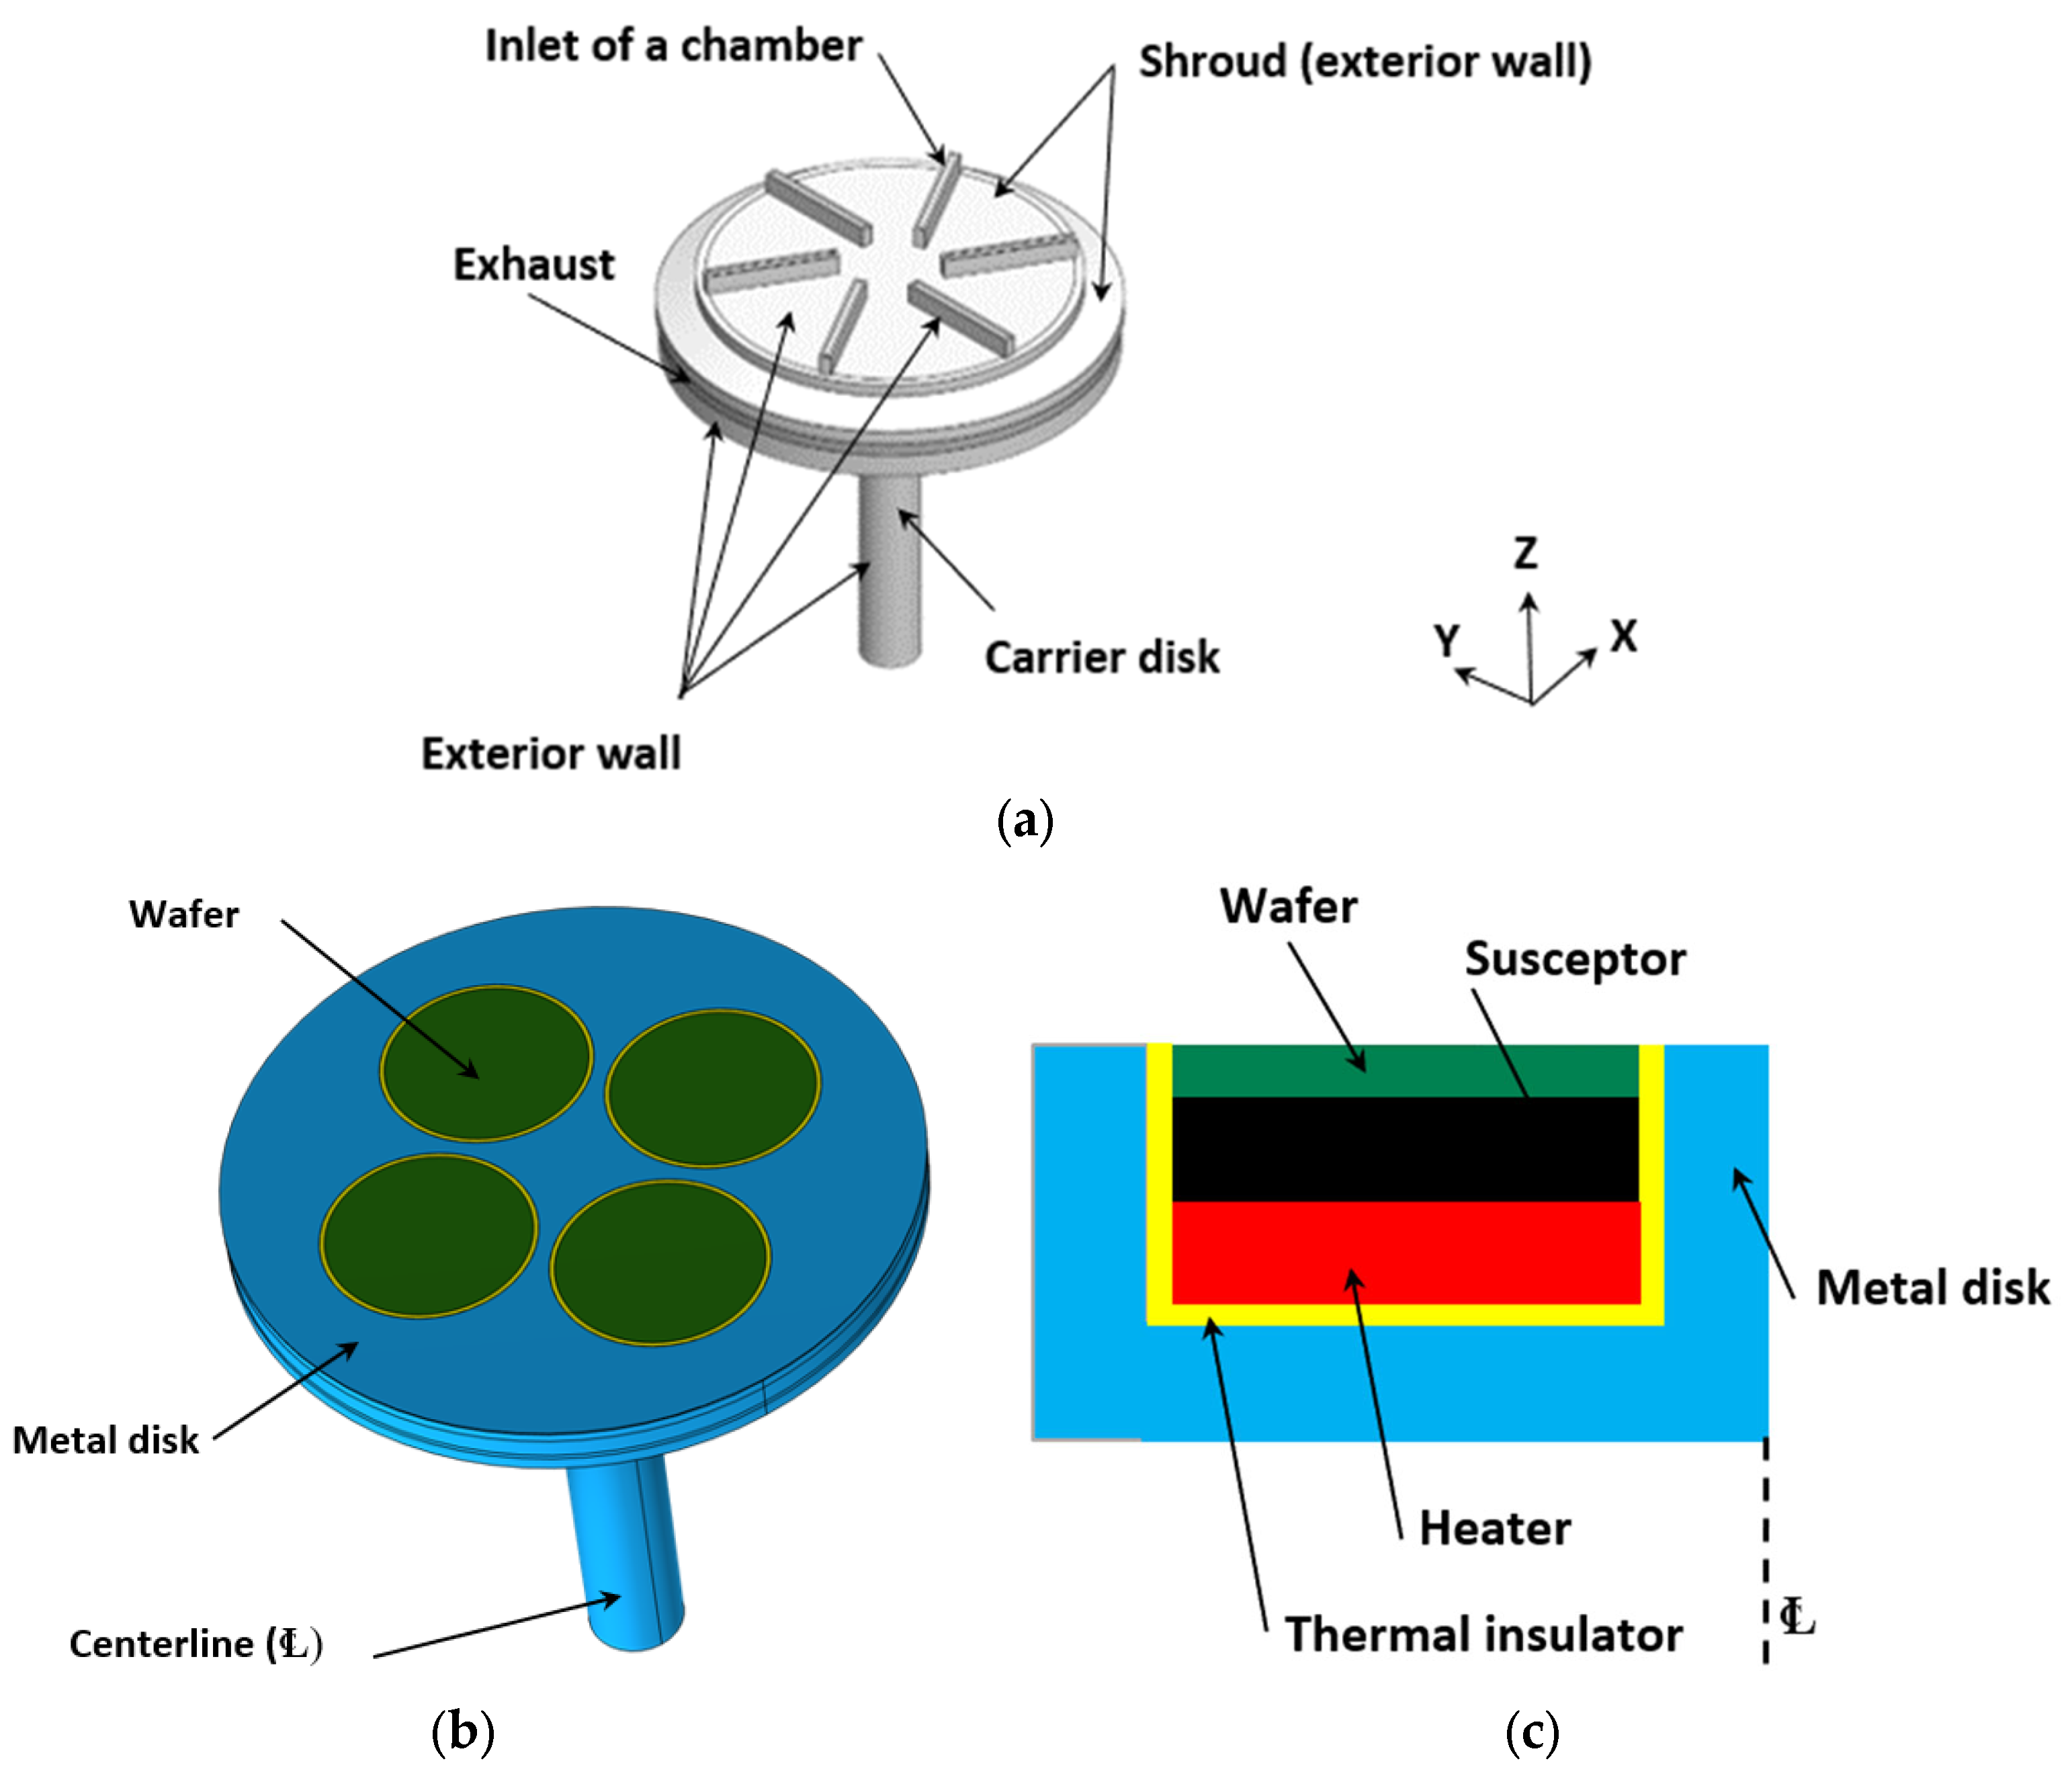
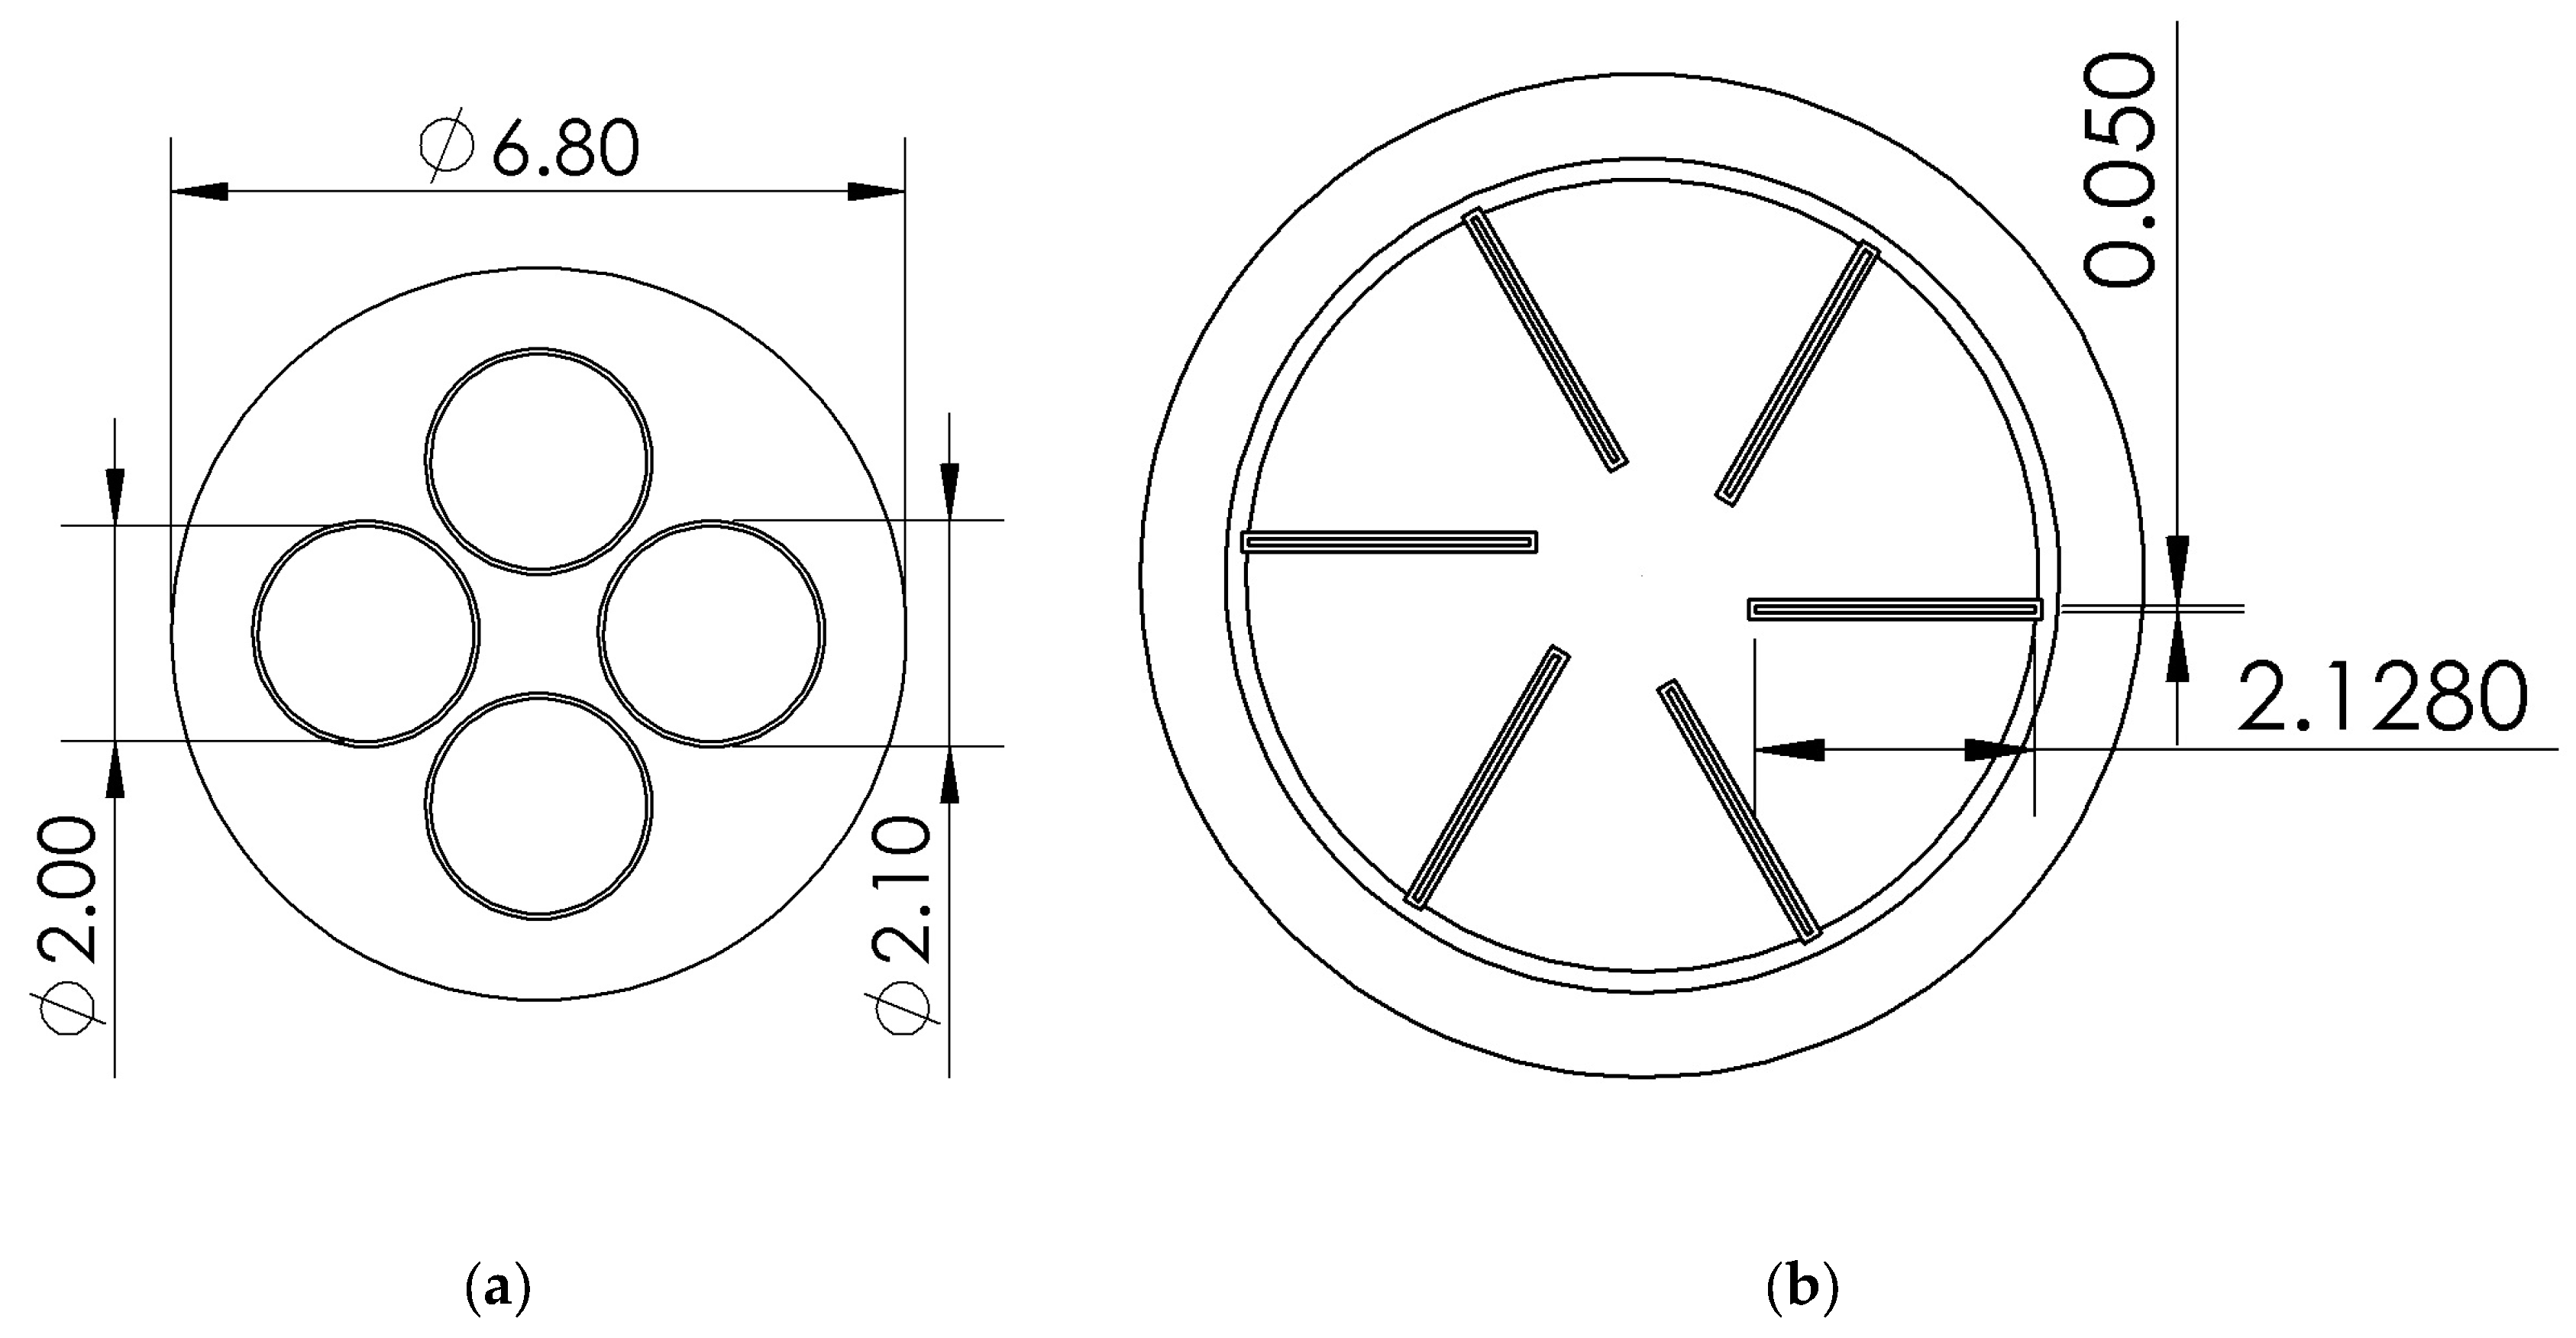
4.1. Geometry and Corresponding Numerical Domain

A vertical CVD reactor with a rotating wafer carrier disk is considered in this study, while the conceptual underpinnings of this reactor can be found in [24]. The three-dimensional geometry of the reactor is shown in Figure 1a. The full reactor consists of a shroud to guide the gas flow from above, and it defines the volume of six different gas chambers and a wafer carrier disk situated below it and centered with respect to it.
The rotating wafer carrier disk includes four 2-inch wafers, four heaters, four insulated zones, four susceptors (between the heaters and wafers), a disk, and a shaft (see Figure 1b,c). The disk rotates in a clockwise direction when viewed top down.
The six individual gas source chambers (precursor zones) in the shroud are defined by radial-oriented, slightly curved separating barriers and are of identical design defining volumes. There is a gap filled with fluid between the bottom of the barrier and the rotating carrier disk. This is the mixing/boundary layer through which the gases diffuse prior to reacting and depositing on the wafer. The current gap (vertical distance between the top of disk and the lower part of the barrier) in this design was set to 0.12 inch. This gap size was established through system optimization, ranging from 0.06 inches to 0.18 inches, in order to achieve an optimal flow pattern while considering fixed boundary conditions. The thickness value of the wafer, susceptor, heater, and thermal insulation in Figure 1c is 0.013-inch, 0.1-inch, 0.2-inch, and 0.05-inch, respectively, while additional dimensions of the system are provided in Figure 2a,b. The shroud is made of molybdenum with a thickness of 4 mm.
For modeling, numerical domains included both the solid and fluid parts. The fluid domain was bounded by the shroud, wetted, and exposed surfaces of the carrier disk. The solid domains were defined by common, connected materials, leading the carrier disk to contain multiple solids in contact with each other. The properties of all solid domains are summarized in Table 1.
The working fluid enters into a chamber, of which there are six, via a dedicated inlet, then passes through each respective chamber and leaves the domain through the outer perimeter to the outlet/exhaust. The working fluid (nitrogen, hydrogen, or ammonia) was set to be Newtonian, compressible, and with temperature-dependent properties. Properties were taken from the internal COMSOL material library and [48] for ammonia. For the purpose of this study, all six gas chambers were filled with the same pure gas type per study.
The numerical domain was discretized to form a grid of around 2.7 million elements. The grid was refined near the walls to accurately resolve the boundary layers. The general view of mesh within the numerical domain and in the vicinity of walls is illustrated in Figure 3.

4.2. Physics

All simulations of this study considered three forms of heat transfer: heat conduction, heat convection, and heat radiation. Heat transfer through radiation is particularly significant in systems operating at high temperatures and was therefore included to ensure more accurate results. Heat conduction is the primary mode of heat transfer in solids, while convective heat transfer plays a crucial role when a fluid domain comes into contact with hot surfaces.
In the case of MOCVD reactors, where the Reynolds number criterion is not well-established and the reactor geometry features irregular corners, turbulent flow can be anticipated considering different gas inlet velocity and rotational speed. Consequently, a turbulent flow model in COMSOL Multiphysics [39] was implemented to accurately simulate the flow patterns within the reactor. It is important to note that a turbulent model has the capability to handle laminar flows, provided that the minimum required mesh density is met. This would further eliminate the need for using a laminar model.
The k-ω low-Re turbulence model is one of the most commonly used models to analyze turbulent flow conditions. It is categorized under the Reynolds-averaged Navier–Stokes (RANS) family of turbulence models, where all the effects of turbulence are “modeled” and not solved. There are two types of k-ω turbulence model: standard and shear stress transport (SST). One advantage of the standard k-ω model is its superior performance for complex boundary layer flows under adverse pressure gradients. The SST formulation switches to a k-ϵ behavior (another type of RANS turbulent model) in the free-stream, which avoids the k-ω problem of being sensitive to the inlet free-stream turbulence properties.
In this study, two turbulent models, namely k-ω and k-ω SST, were employed to analyze and compare the results of one numerical domain; no significant difference was observed between these two models. Considering this comparison and the computational cost associated with the k-ω SST model being higher than that of the k-ω model, the authors chose to utilize the k-ω model for all simulations of this study. The “frozen rotor” approach was implemented in COMSOL to reflect the rotational impact of the carrier disk on the flow and thermal maps. Also, no meaningful changes were found with respect to the flow patterns inside the domain between the transient and steady-state frozen rotor simulations. As the transient simulation takes much longer, the authors considered the non-transient simulation.

4.3. Boundary and Initial Conditions

Non-transient calculations of fluid flow and thermal studies inside a reactor with a rotating disk are presented in this work. The initial conditions are such that the numerical domain presented in Figure 1a was initialized with a uniform temperature of 600 K while the working fluid was considered at rest. The initial temperature value does not change the final, non-transient thermal maps within the reactor, yet it can reduce the simulation time. The exterior chamber walls in Figure 1a are allowed to experience radiation and convection heat transfer. The inner walls of the chambers also exchange heat via radiation. The working fluid and the wafers are considered transparent to the radiative heat transfer. No slip condition was considered for all chamber walls. The carrier disk walls (including external surface of wafers, thermal insulating areas, and the disk section) were automatically considered moving walls (considering the assigned rotational speed in the frozen rotor approach). Other operating conditions that were used in all simulations of this study are summarized in Table 2.

4.4. Numerical Set Up

As illustrated in Figure 3, a non-uniform and non-structured mesh was employed. The governing equations, along with the boundary and initial conditions, were numerically solved using COMSOL Multiphysics. This commercial program employs a finite element method to discretize the governing equations. The P1 + P1 and linear discretization methods were employed to discretize the momentum equation and energy equation, respectively. A direct solver in a multi-steps study was used as it provided strong numerical robustness at the expense of higher memory usage. The relative tolerance of 5 × 10⁻³ was considered in all steps of the solver.

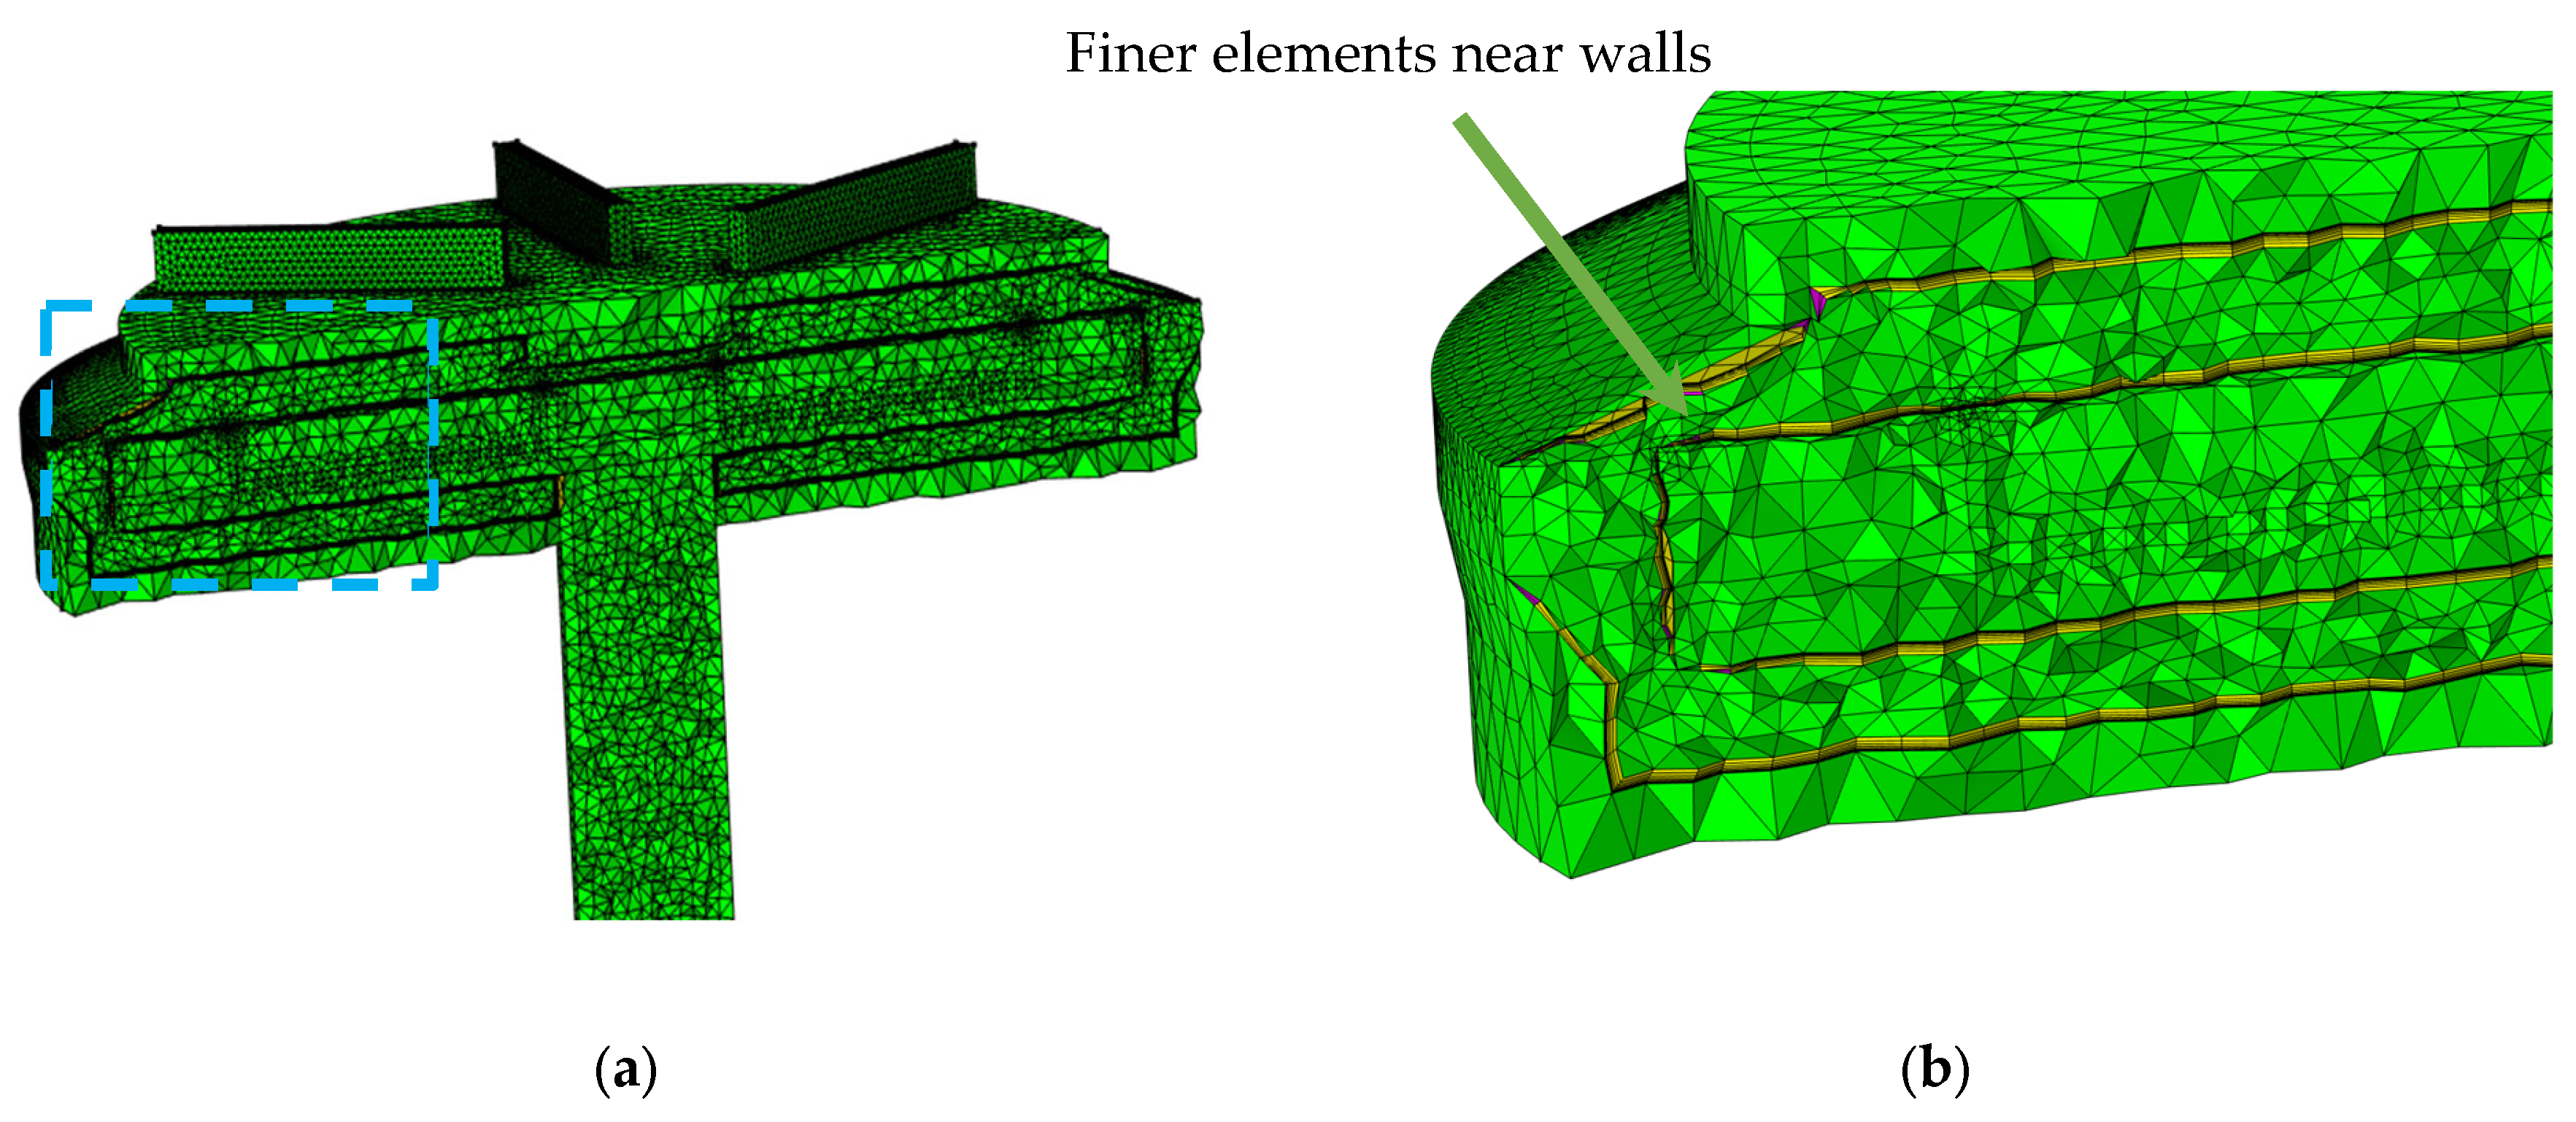
4.5. Mesh Convergence Study

A mesh convergence study was performed for three different grids: 1.3, 2.7, and 4.1 million elements. The temperature of wafers and fluid inside the reactor were monitored in all these three grids. The error percentage between grids 2 and 3 was less than 5% in all locations and was considered sufficiently accurate for the purpose of this study.
Typical simulation times for one configuration ranged from 4 to 10 h on 32 cores of the Intel Xeon processor, depending on the grid density of the calculations. Based on the mesh convergence study, the 2.7 million grid size was selected to balance simulation time with accuracy and was set as the default grid, on which all simulations conducted were based. All types of elements (tetrahedron, quad, pyramid, prism, triangle, hex) were used in this grid. A detailed summary of the characteristics of the 2.7 element grid is provided in Table 3.

5. Results and Discussion

This section discusses and analyzes the numerically determined flow patterns within the system (Figure 1). The top view of the reactor (parallel to the XY plane in Figure 1a) will be presented to demonstrate the flow patterns present in the system for a combination of specific initial conditions (as defined by values for inlet gas velocity, disk rotational speed, volumetric flow rate (via changes to gas inlet cross section), and type of gas). The streamlines inside the chambers were assessed both qualitatively and quantitatively.
Based on the results, a range of operating conditions are proposed (for N2, H2, and NH3 at 1 atm) that deliver smooth flow patterns inside the reactor while simultaneously requiring the lowest flow rate value.
Several studies were conducted to understand the effect of a particular change in initial conditions over the aforementioned parameters and quantities inside the numerical domain and are reported on in the individual Section 5.1, Section 5.2 and Section 5.3. The studies encompass an understanding of the effect of inlet velocity, rotational speed, and inlet area (flow rate) on the aforementioned parameters.

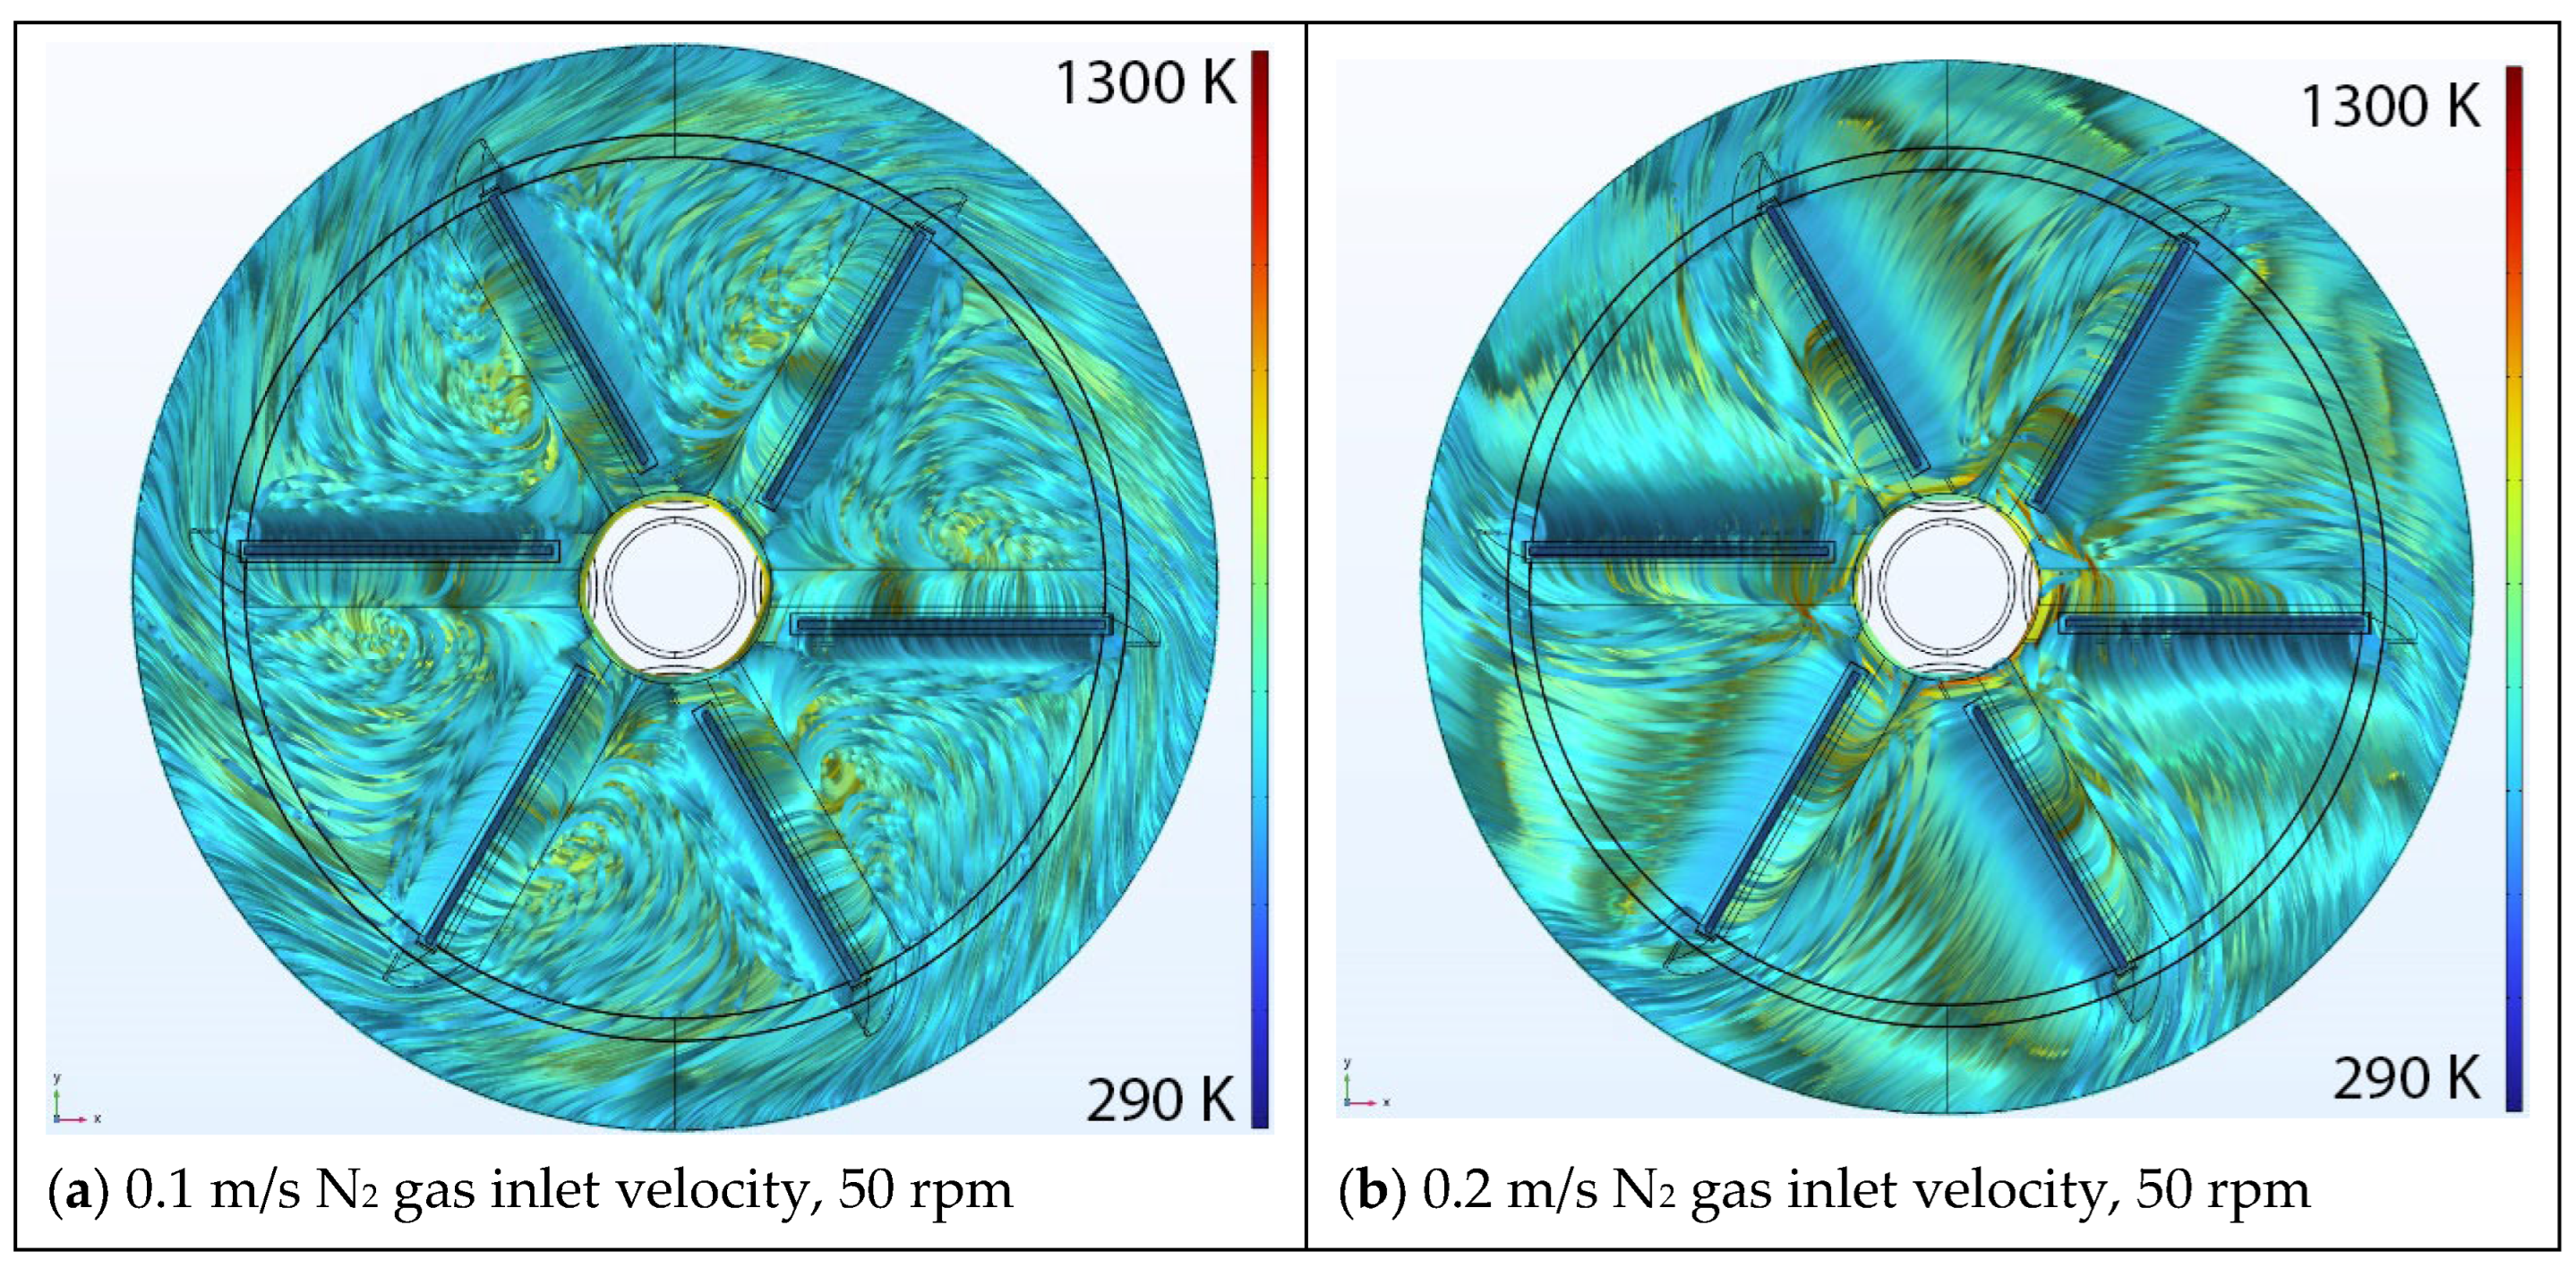
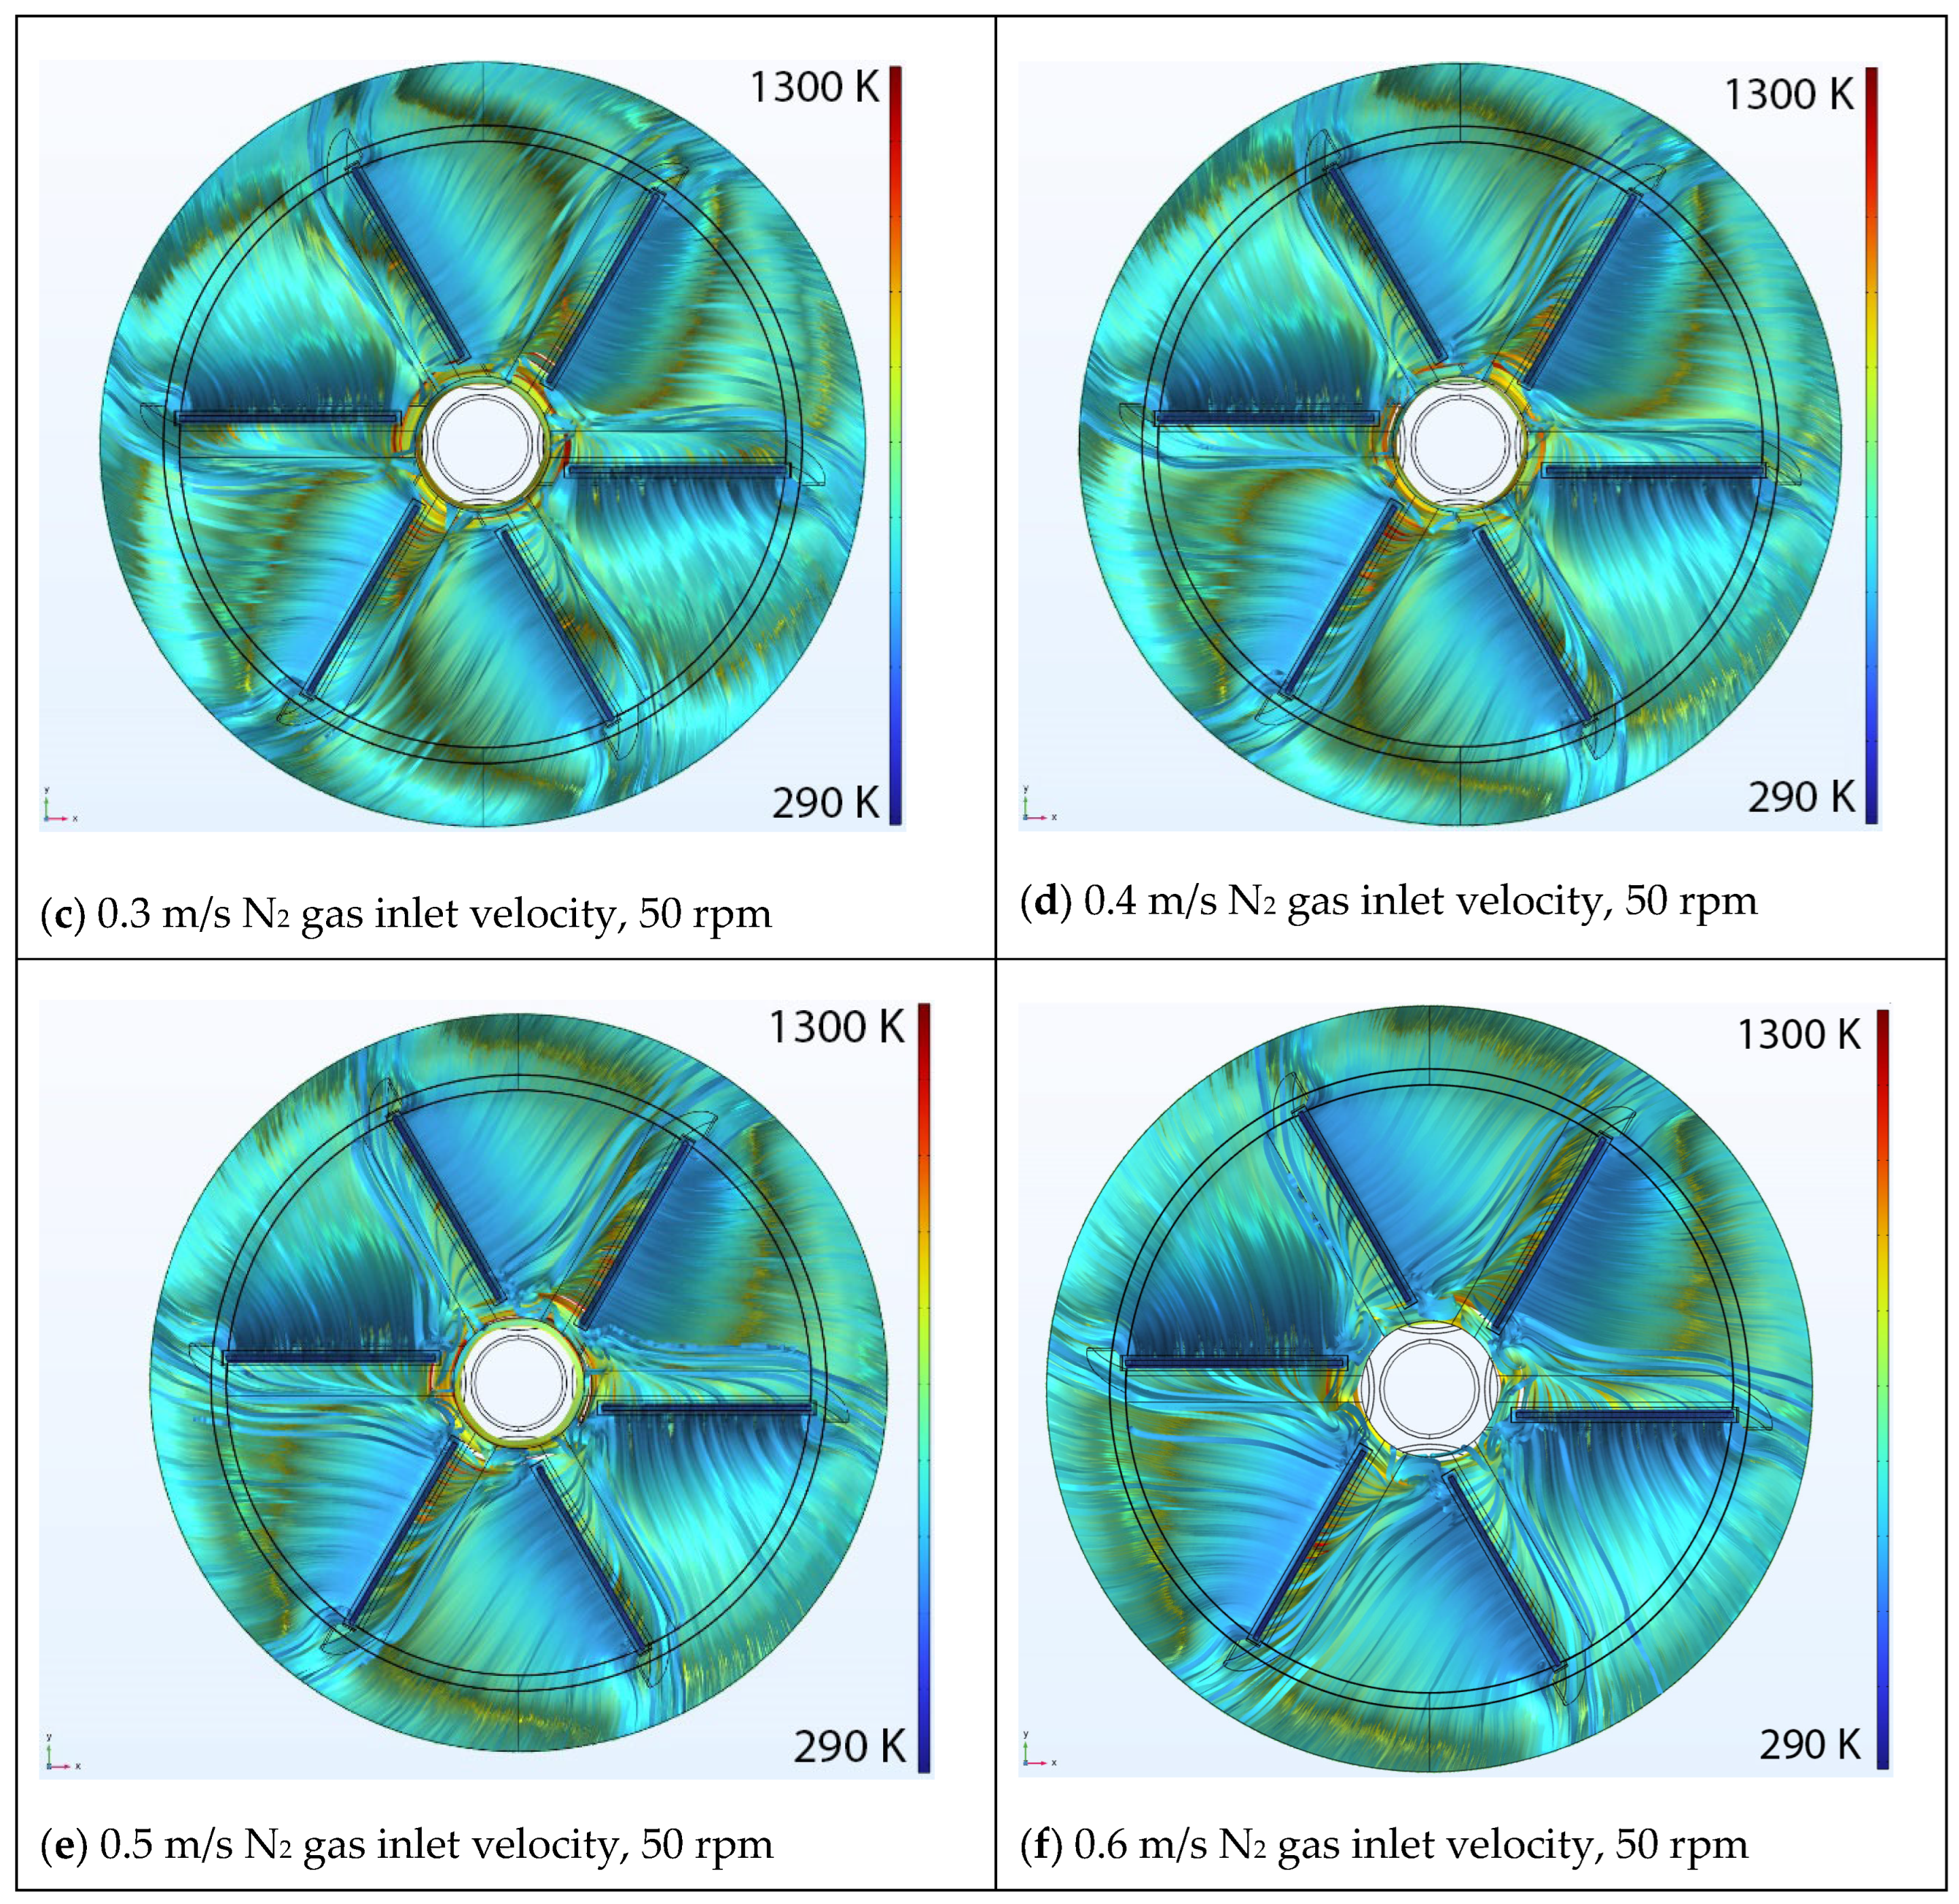
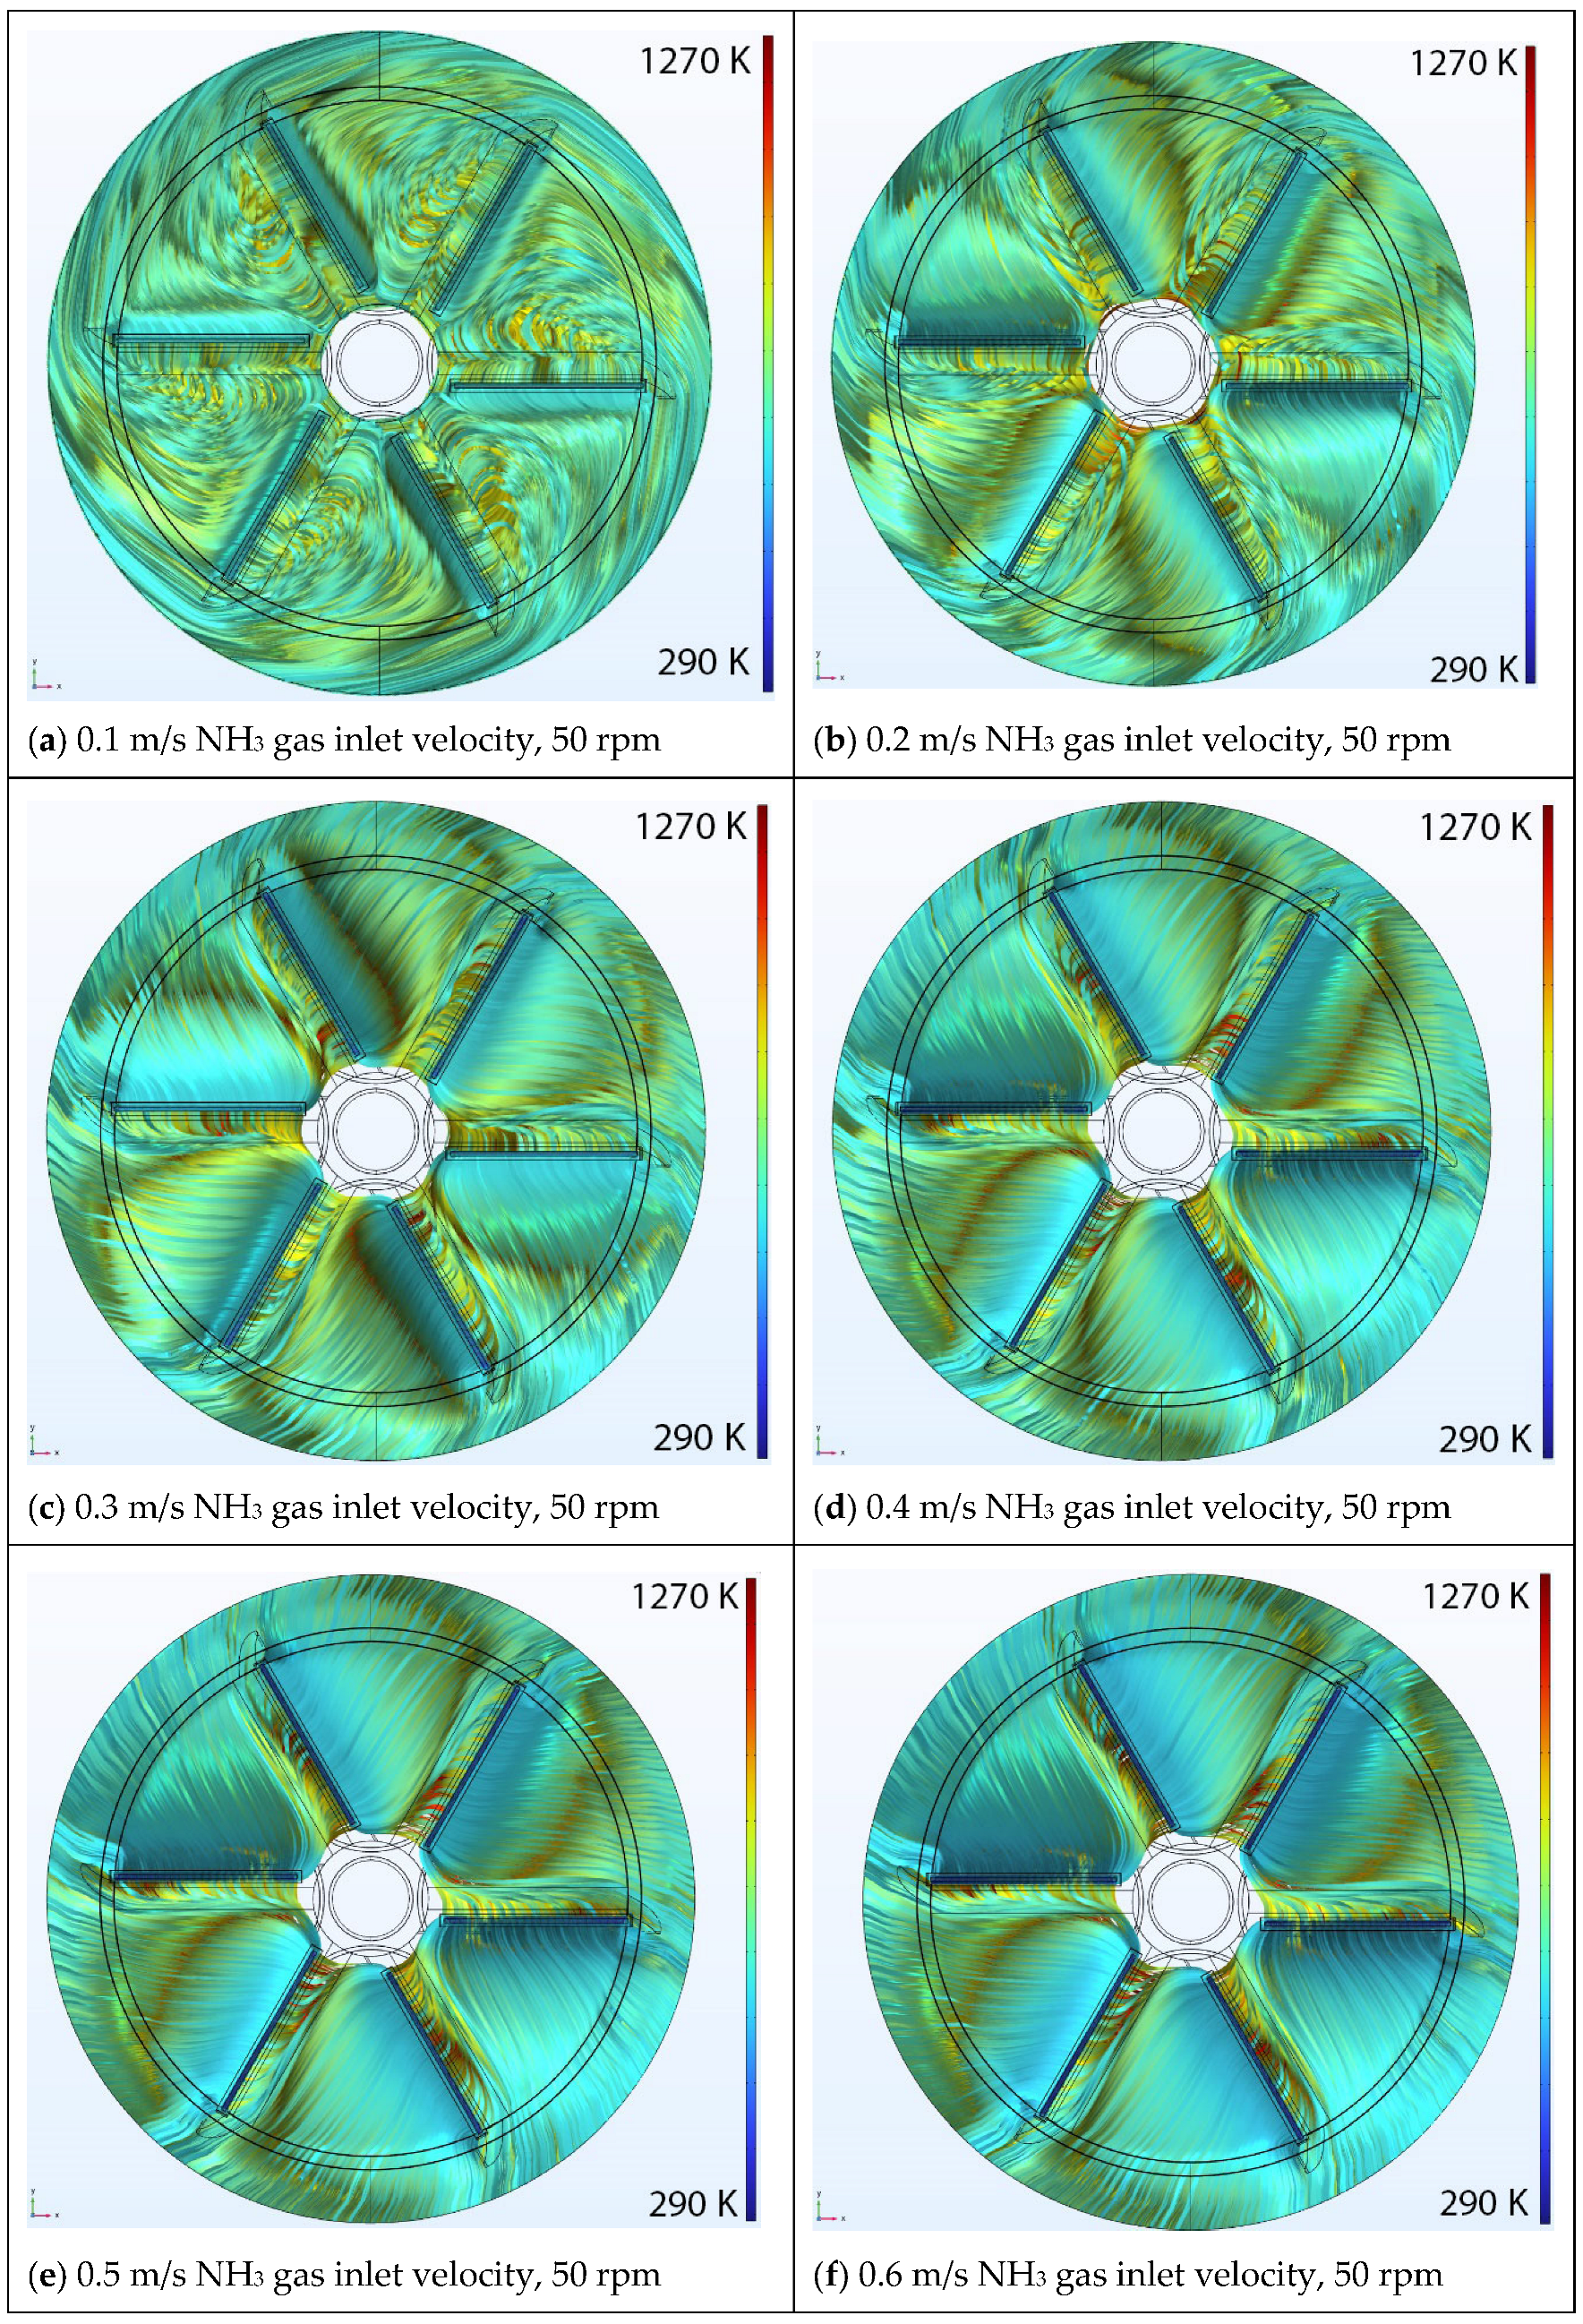
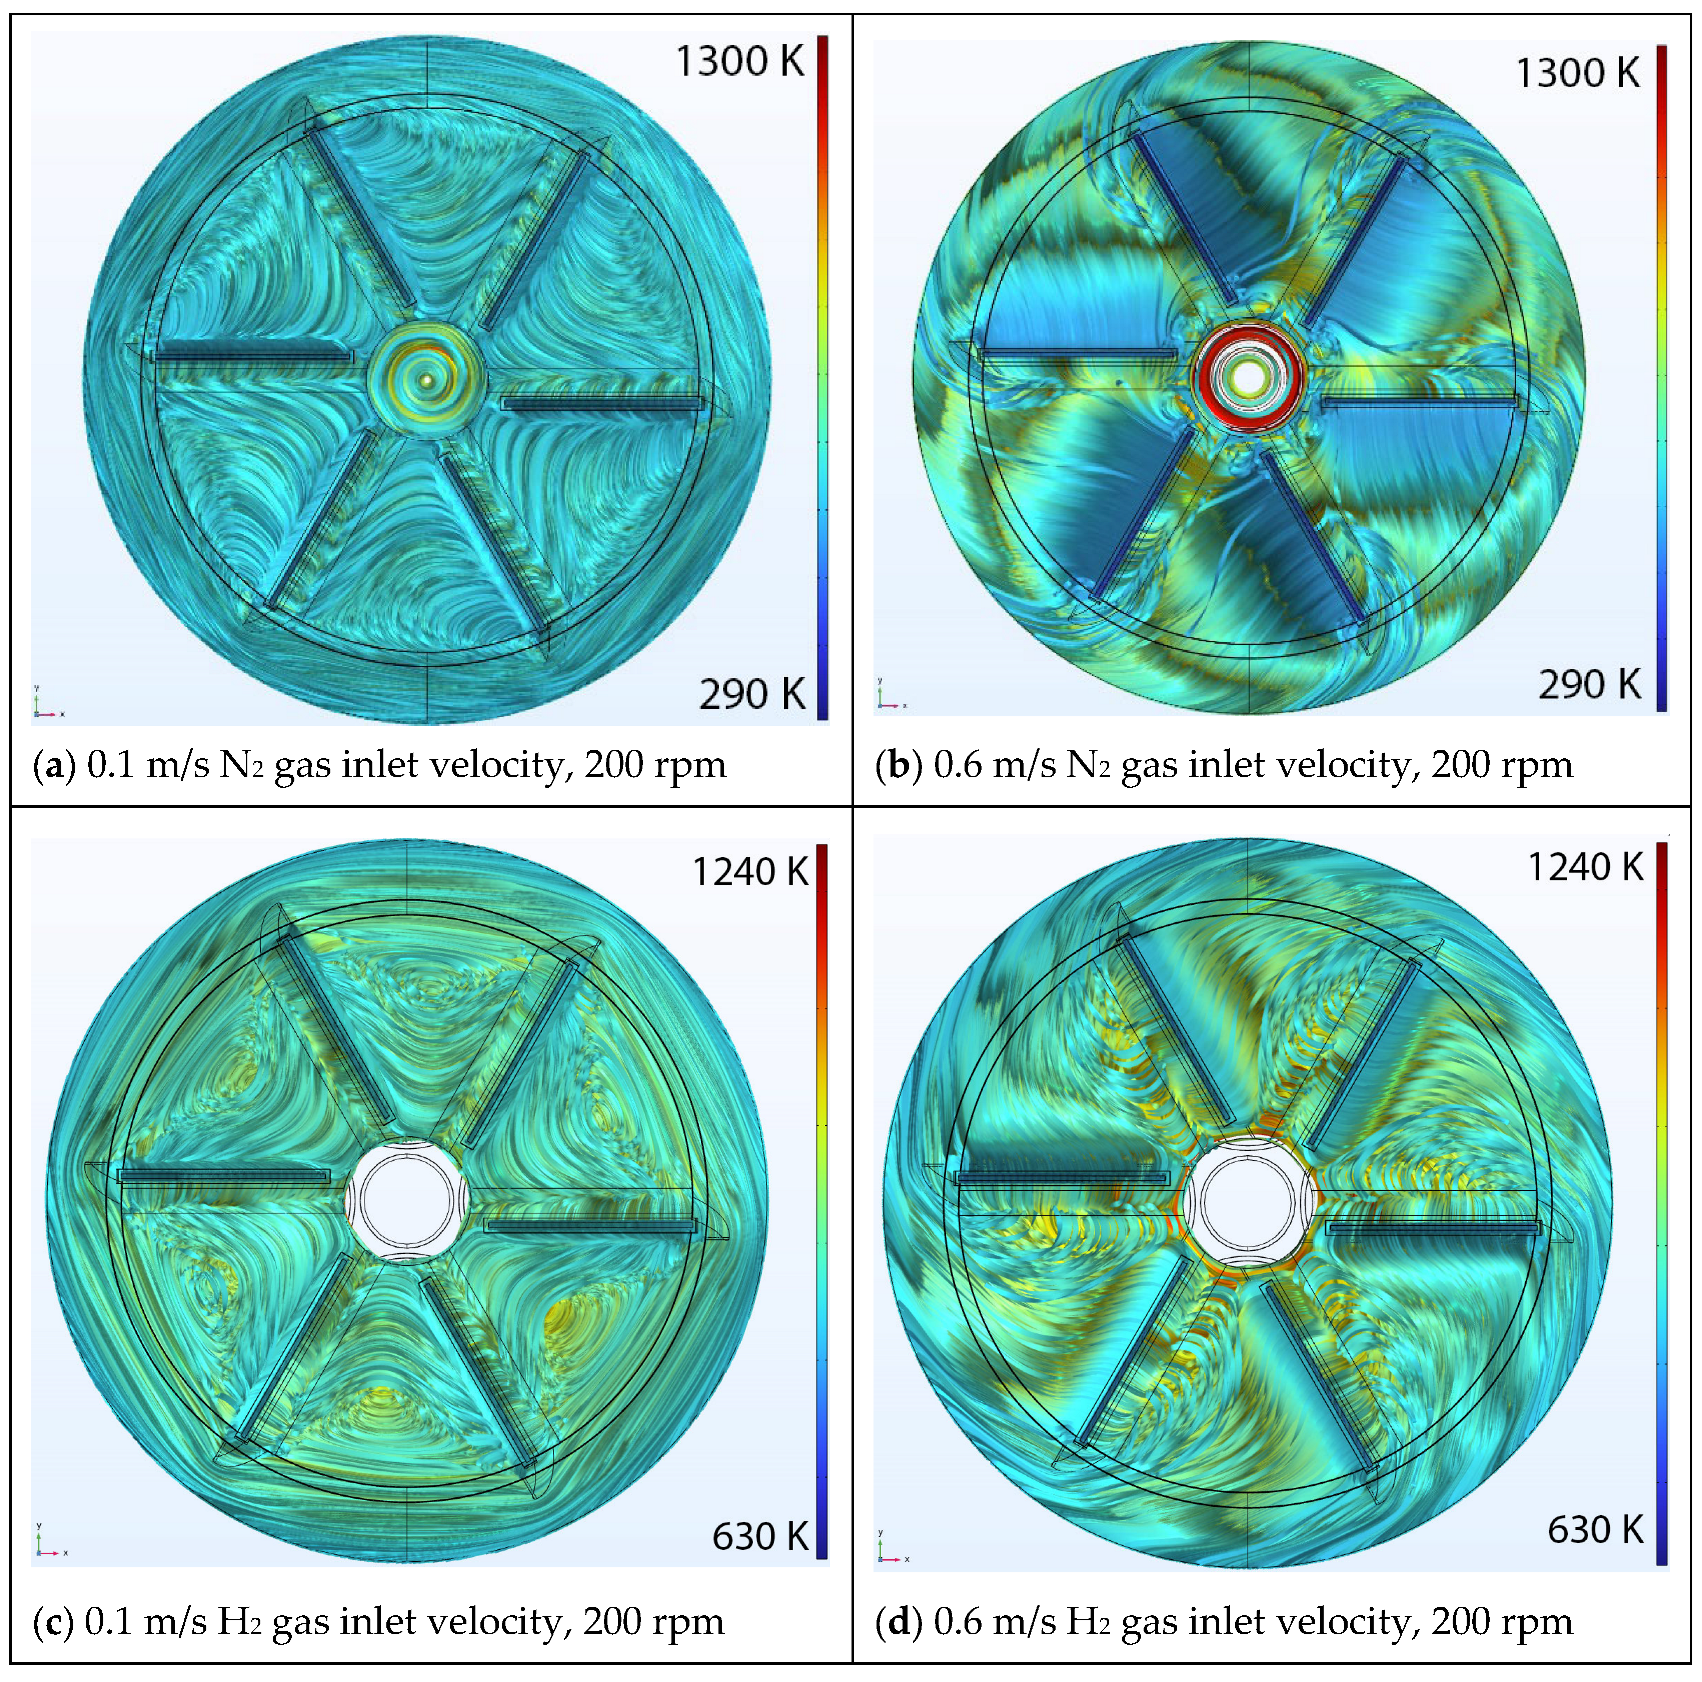
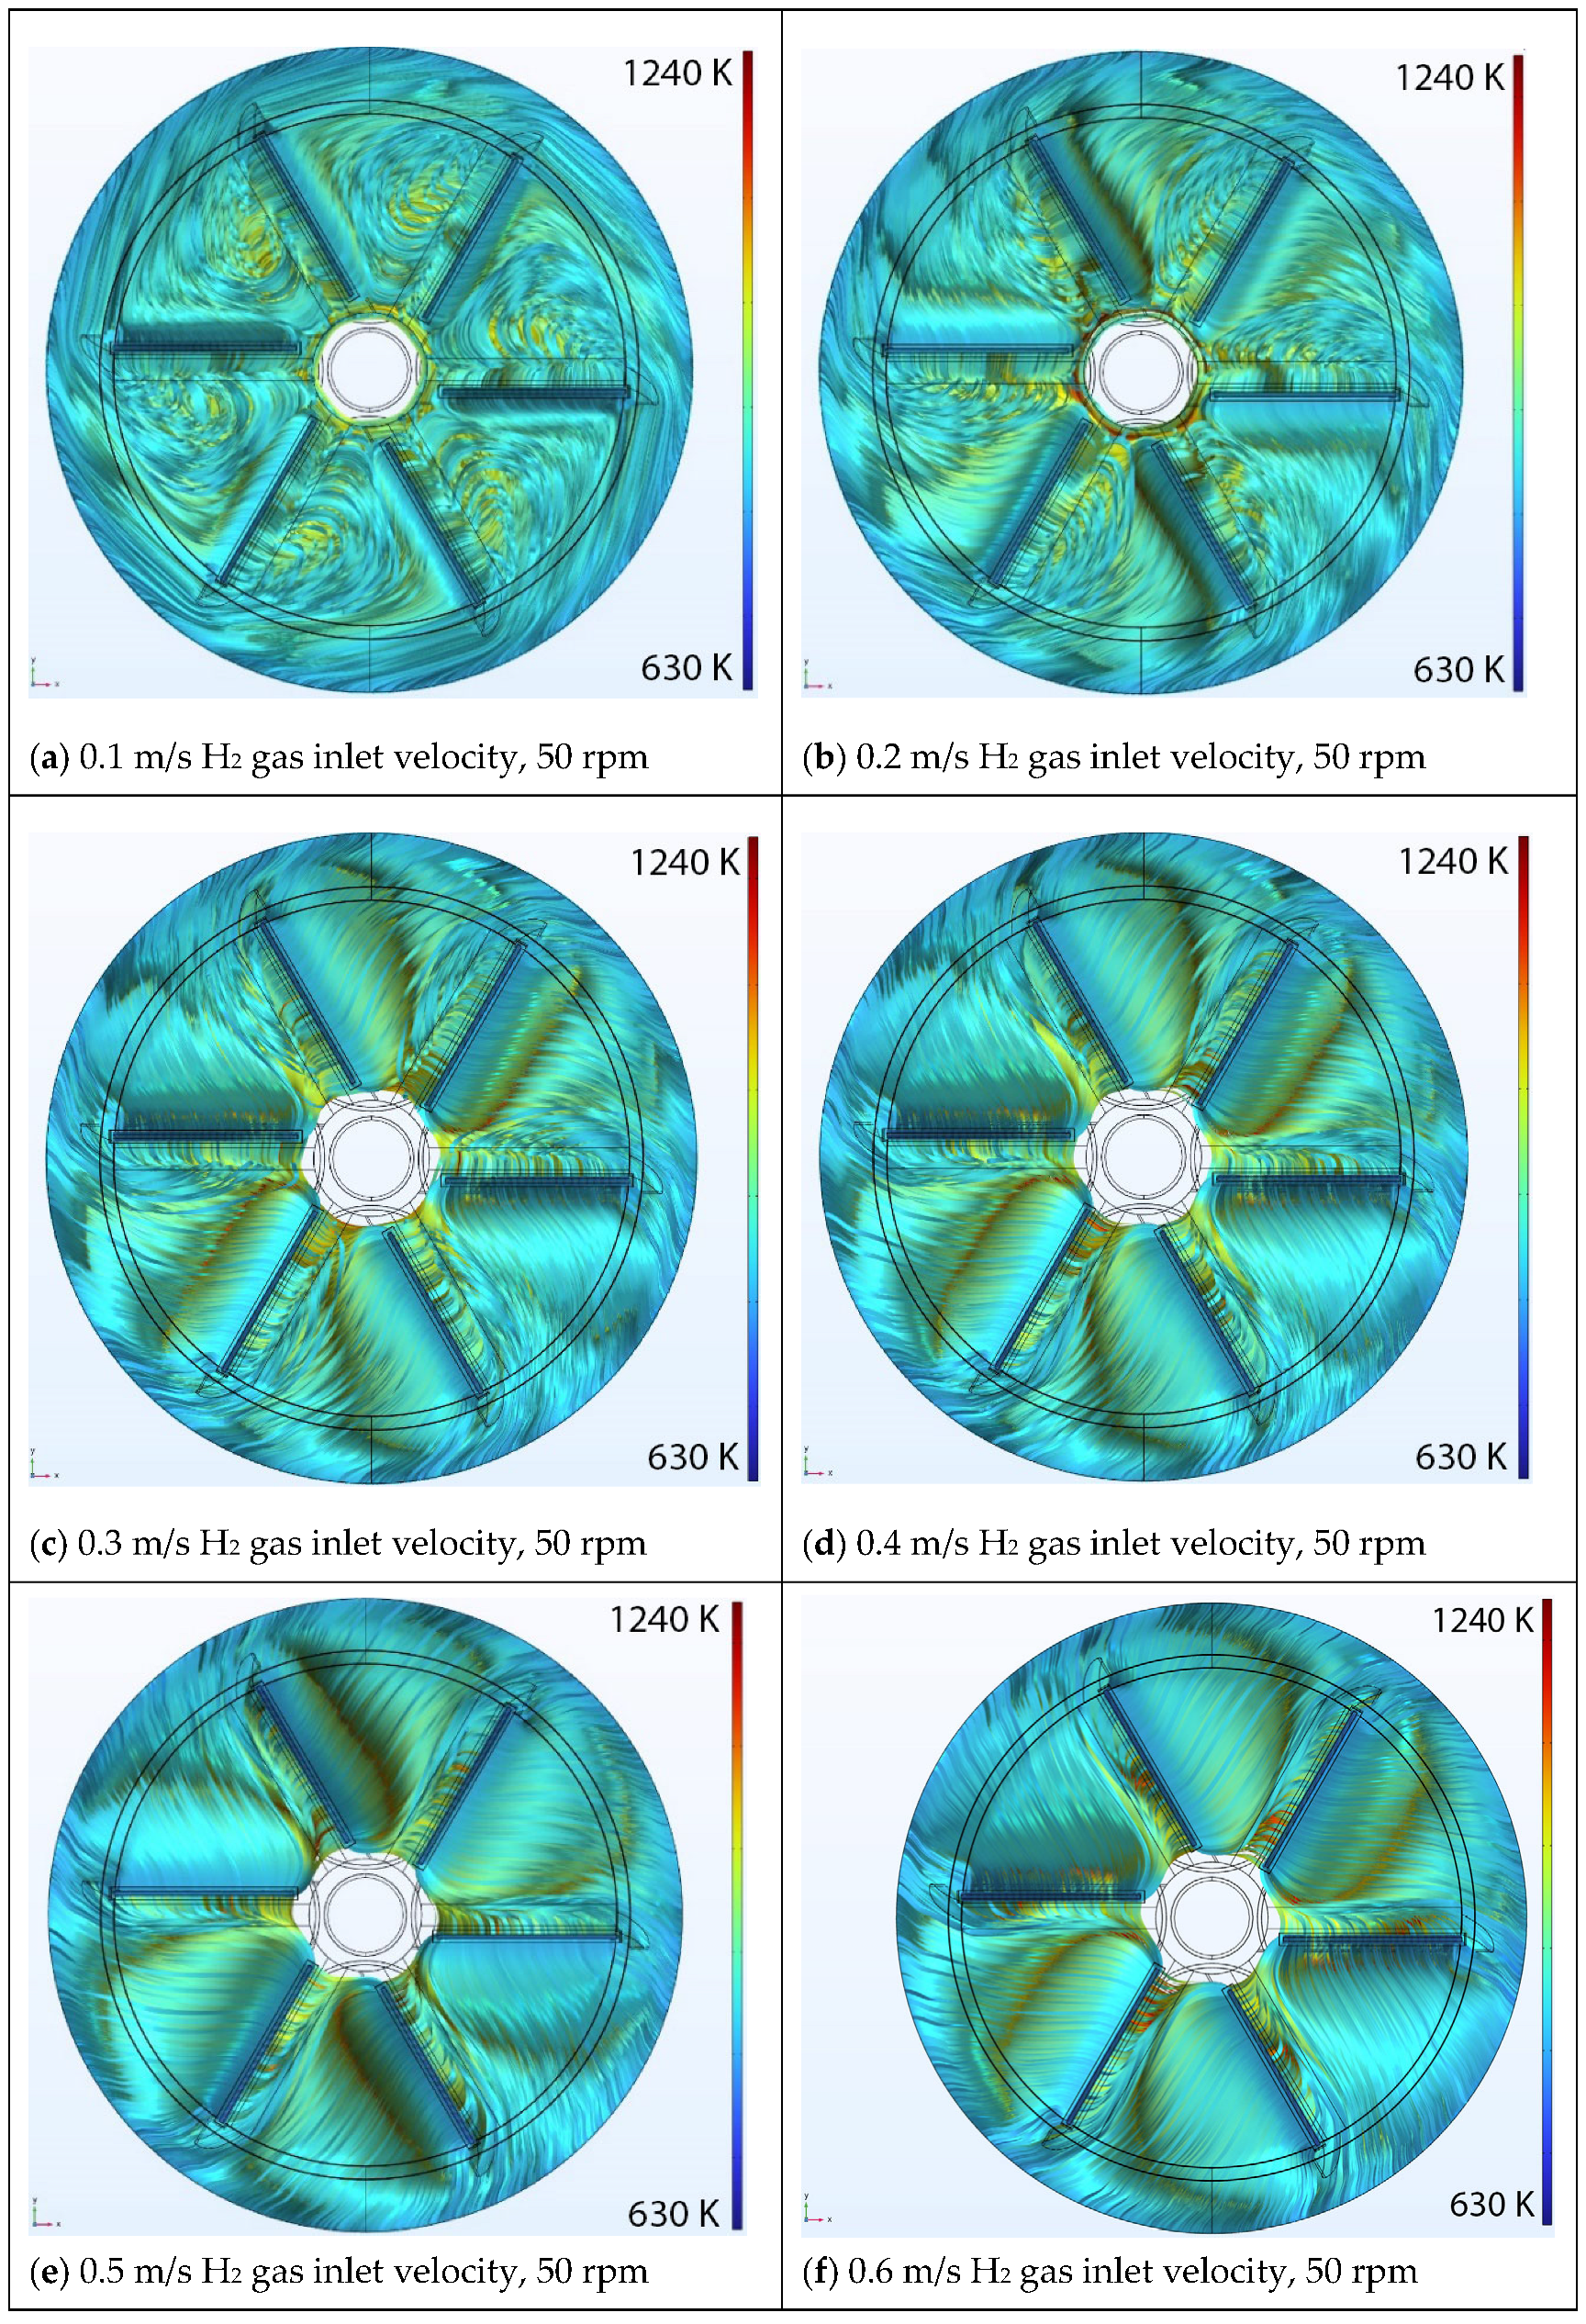
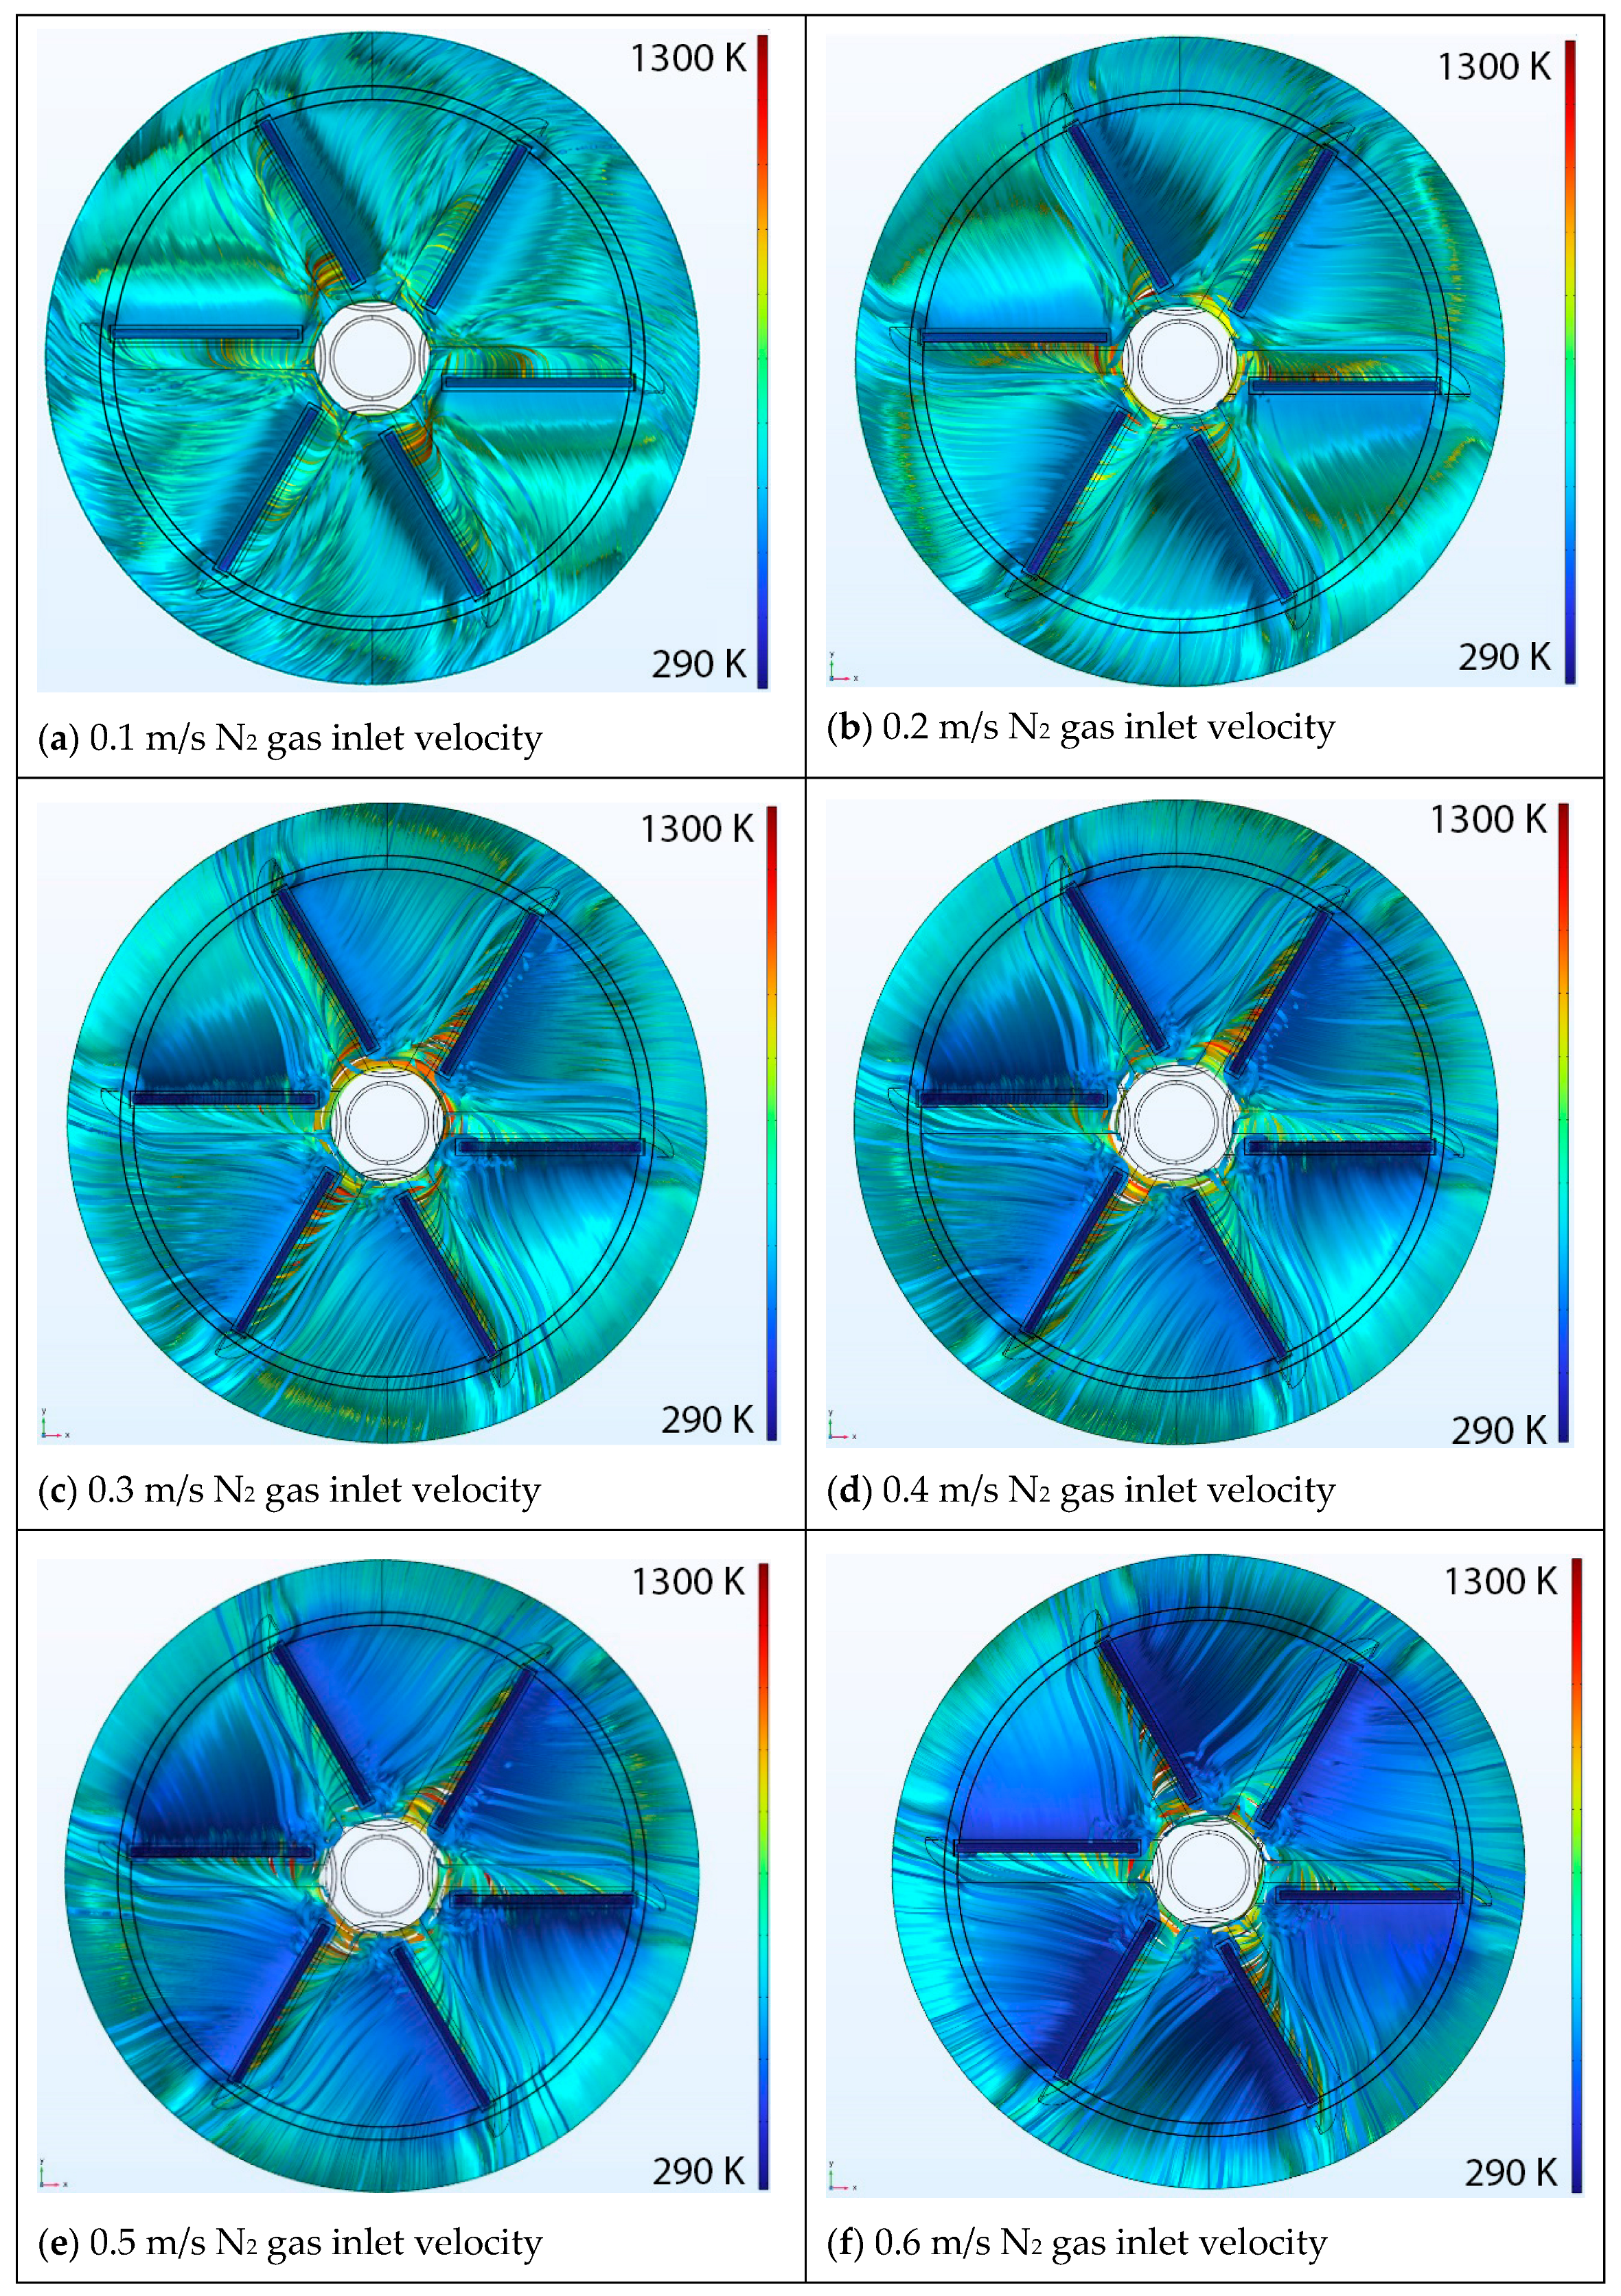
5.1. Effect of Inlet Velocity

Velocity Streamlines

This section presents the impact of inlet velocity alteration on the selected parameters inside the numerical domain. Figure 4, Figure 5 and Figure 6 present the flow streamlines within the chambers using the top view of the reactor for three gases: N2, H2, and NH3. In fluid mechanics, streamlines are a family of curves that are tangent to the velocity vector field of the flow. They show the direction where a massless fluid element can travel at any point in time. As illustrated in Figure 1a, there are six inlets through which gas of the same type (N2, H2, or NH3) enters, circulates within the chambers, and leaves through the exhaust area. The operating conditions (geometrical, material properties, initial, and boundary) were stated in Section 4.1 and Section 4.3 and are similar in all smulations of this article unless stated differently.
Figure 4 shows the circulation of nitrogen (N2) inside the numerical domain for a fixed value of 50 rpm (rotational speed of the carrier disk) and six inlet velocity values; 0.1, 0.2, 0.3, 0.4, 0.5, or 0.6 m/s. Note that the velocity streamlines are temperature color-coded in this figure and the red–blue spectrum in the legend bar corresponds to higher and lower temperatures, respectively. The authors considered 10,000 streamlines for the entire system to better reflect the physics of the problem, as fluid is a continuous medium and additional streamline could mimic the flow patterns with a higher accuracy level. Although one could consider a lower number of streamlines (for example 1000 streamlines), some details of the flow patterns could be missed. The selection of 10,000 streamlines was based on several internal studies (considering 500, 100, 2500, 5000, 10,000, or 50,000 streamlines), resulting in the conclusion that 10,000 streamlines adequately capture the existence of instabilities in the flow pattern, and a higher number of streamlines did not visualize any new information.
As can be seen in Figure 4, as the inlet velocity increases, the flow patterns get smoother within the domain. In fact, the vortex formation weakened due to a balancing of the inlet flow velocity to the rotational speed of the carrier disk. This suggests there is a relationship between the rotational speed of the disk and inlet velocity, required to optimize the source gas distribution over the wafer. Minimization, if not outright elimination, of vortices is considered important to minimize the undesired transport of materials from within the boundary layer into the pure source zone of the precursor provided from a particular chamber.
Minor local disturbances in the center of plots in Figure 4 can be seen which are only visualized with the use of 10,000 streamlines and are eliminated with the use of fewer streamlines. Furthermore, they only appear for nitrogen gas and not for hydrogen or ammonia. As these are small and local flow patterns that did not significantly alter the flow patterns over the majority of the wafers’ areas, the authors proceeded with the current reactor design, noting that further optimization of the core region of the system may be warranted to further minimize this minor source of flow disturbance.
Figure 5 and Figure 6 present similar information as Figure 4 except for hydrogen and ammonia, respectively. The default number of 10,000 velocity streamlines and temperature color-coding is used to show the flow patterns inside the chambers. The chaotic flow movements of gas inside the domain weakened as the inlet velocity increased from 0.1 to 0.6 m/s, ultimately achieving a smooth flow pattern.
An examination of velocity streamlines reveals that, with a fixed rotational speed of the carrier disk, an increase in the gas inlet velocity results in smoother flow patterns throughout the domain. This observation holds true for all three gases. Furthermore, it can be inferred that the transition to vortex-free patterns with an increase in the gas inlet velocity occurs more rapidly for the heavier gas. In other words, nitrogen tends to exhibit a smoother flow at a lower inlet velocity, followed by ammonia and hydrogen.
Due to different gas properties, different power inputs need to be applied in order to ensure that, for a specific combination of inlet velocity and rotational speed of the disk, the simulation would result in the targeted wafer temperatures of 1250–1300 K.

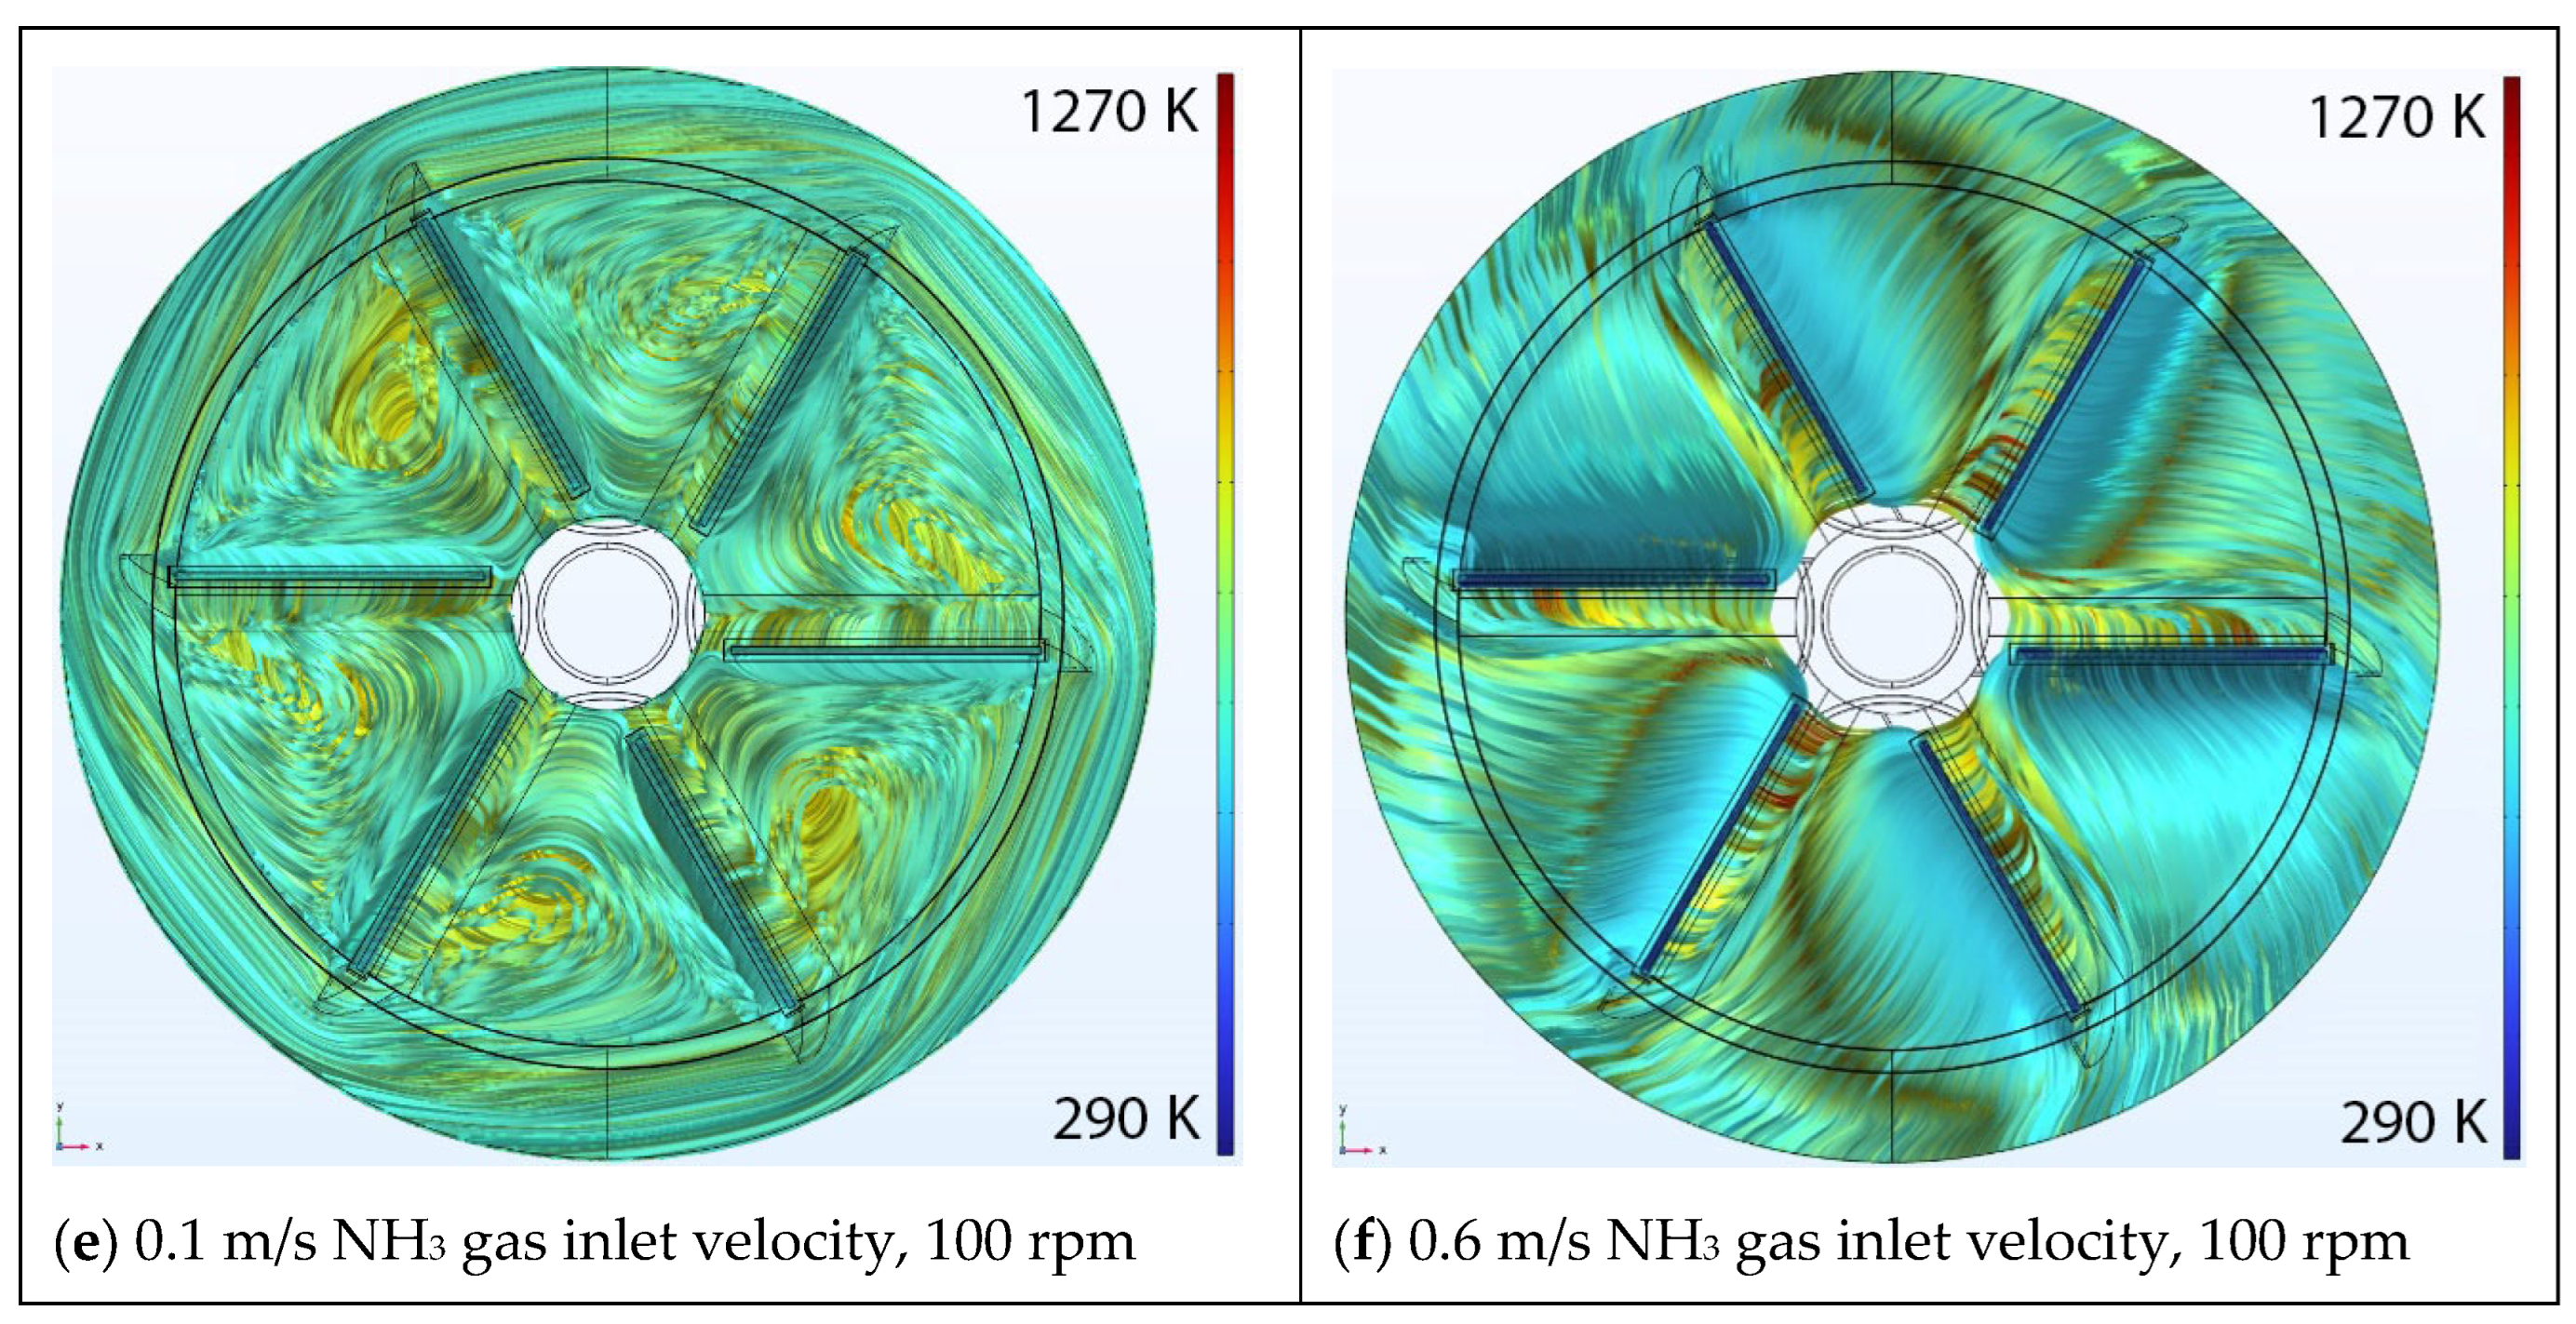
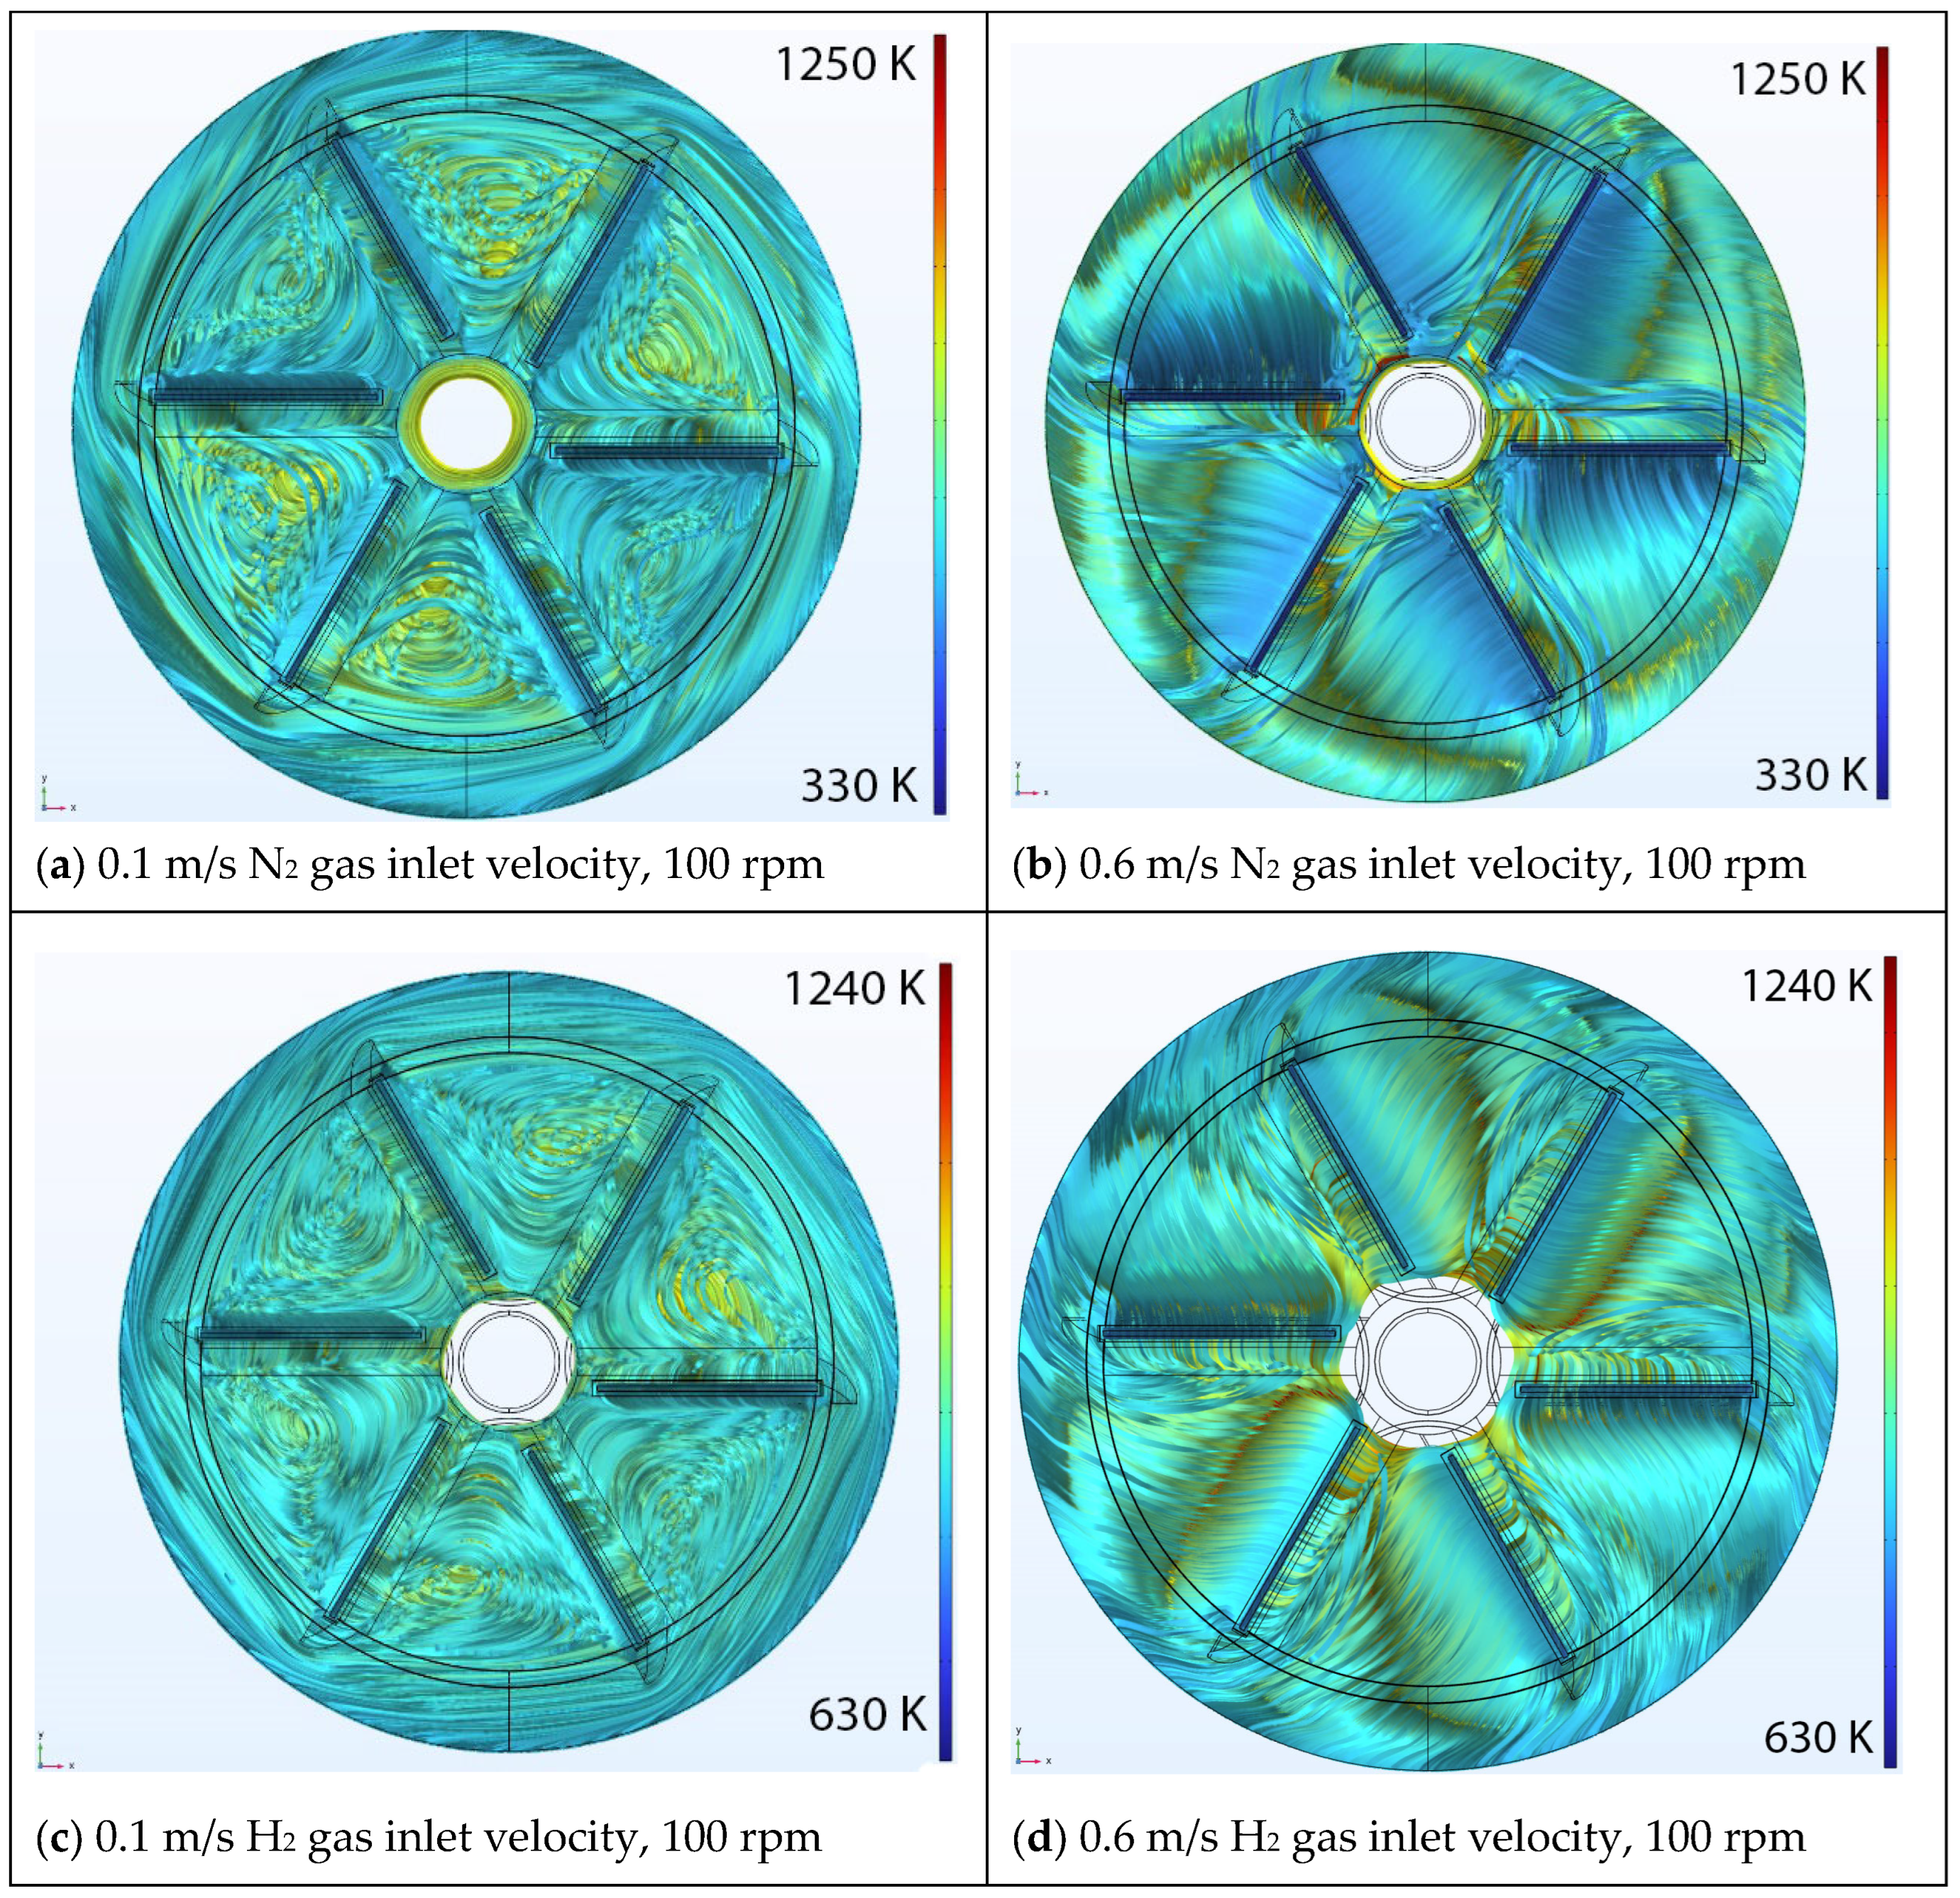
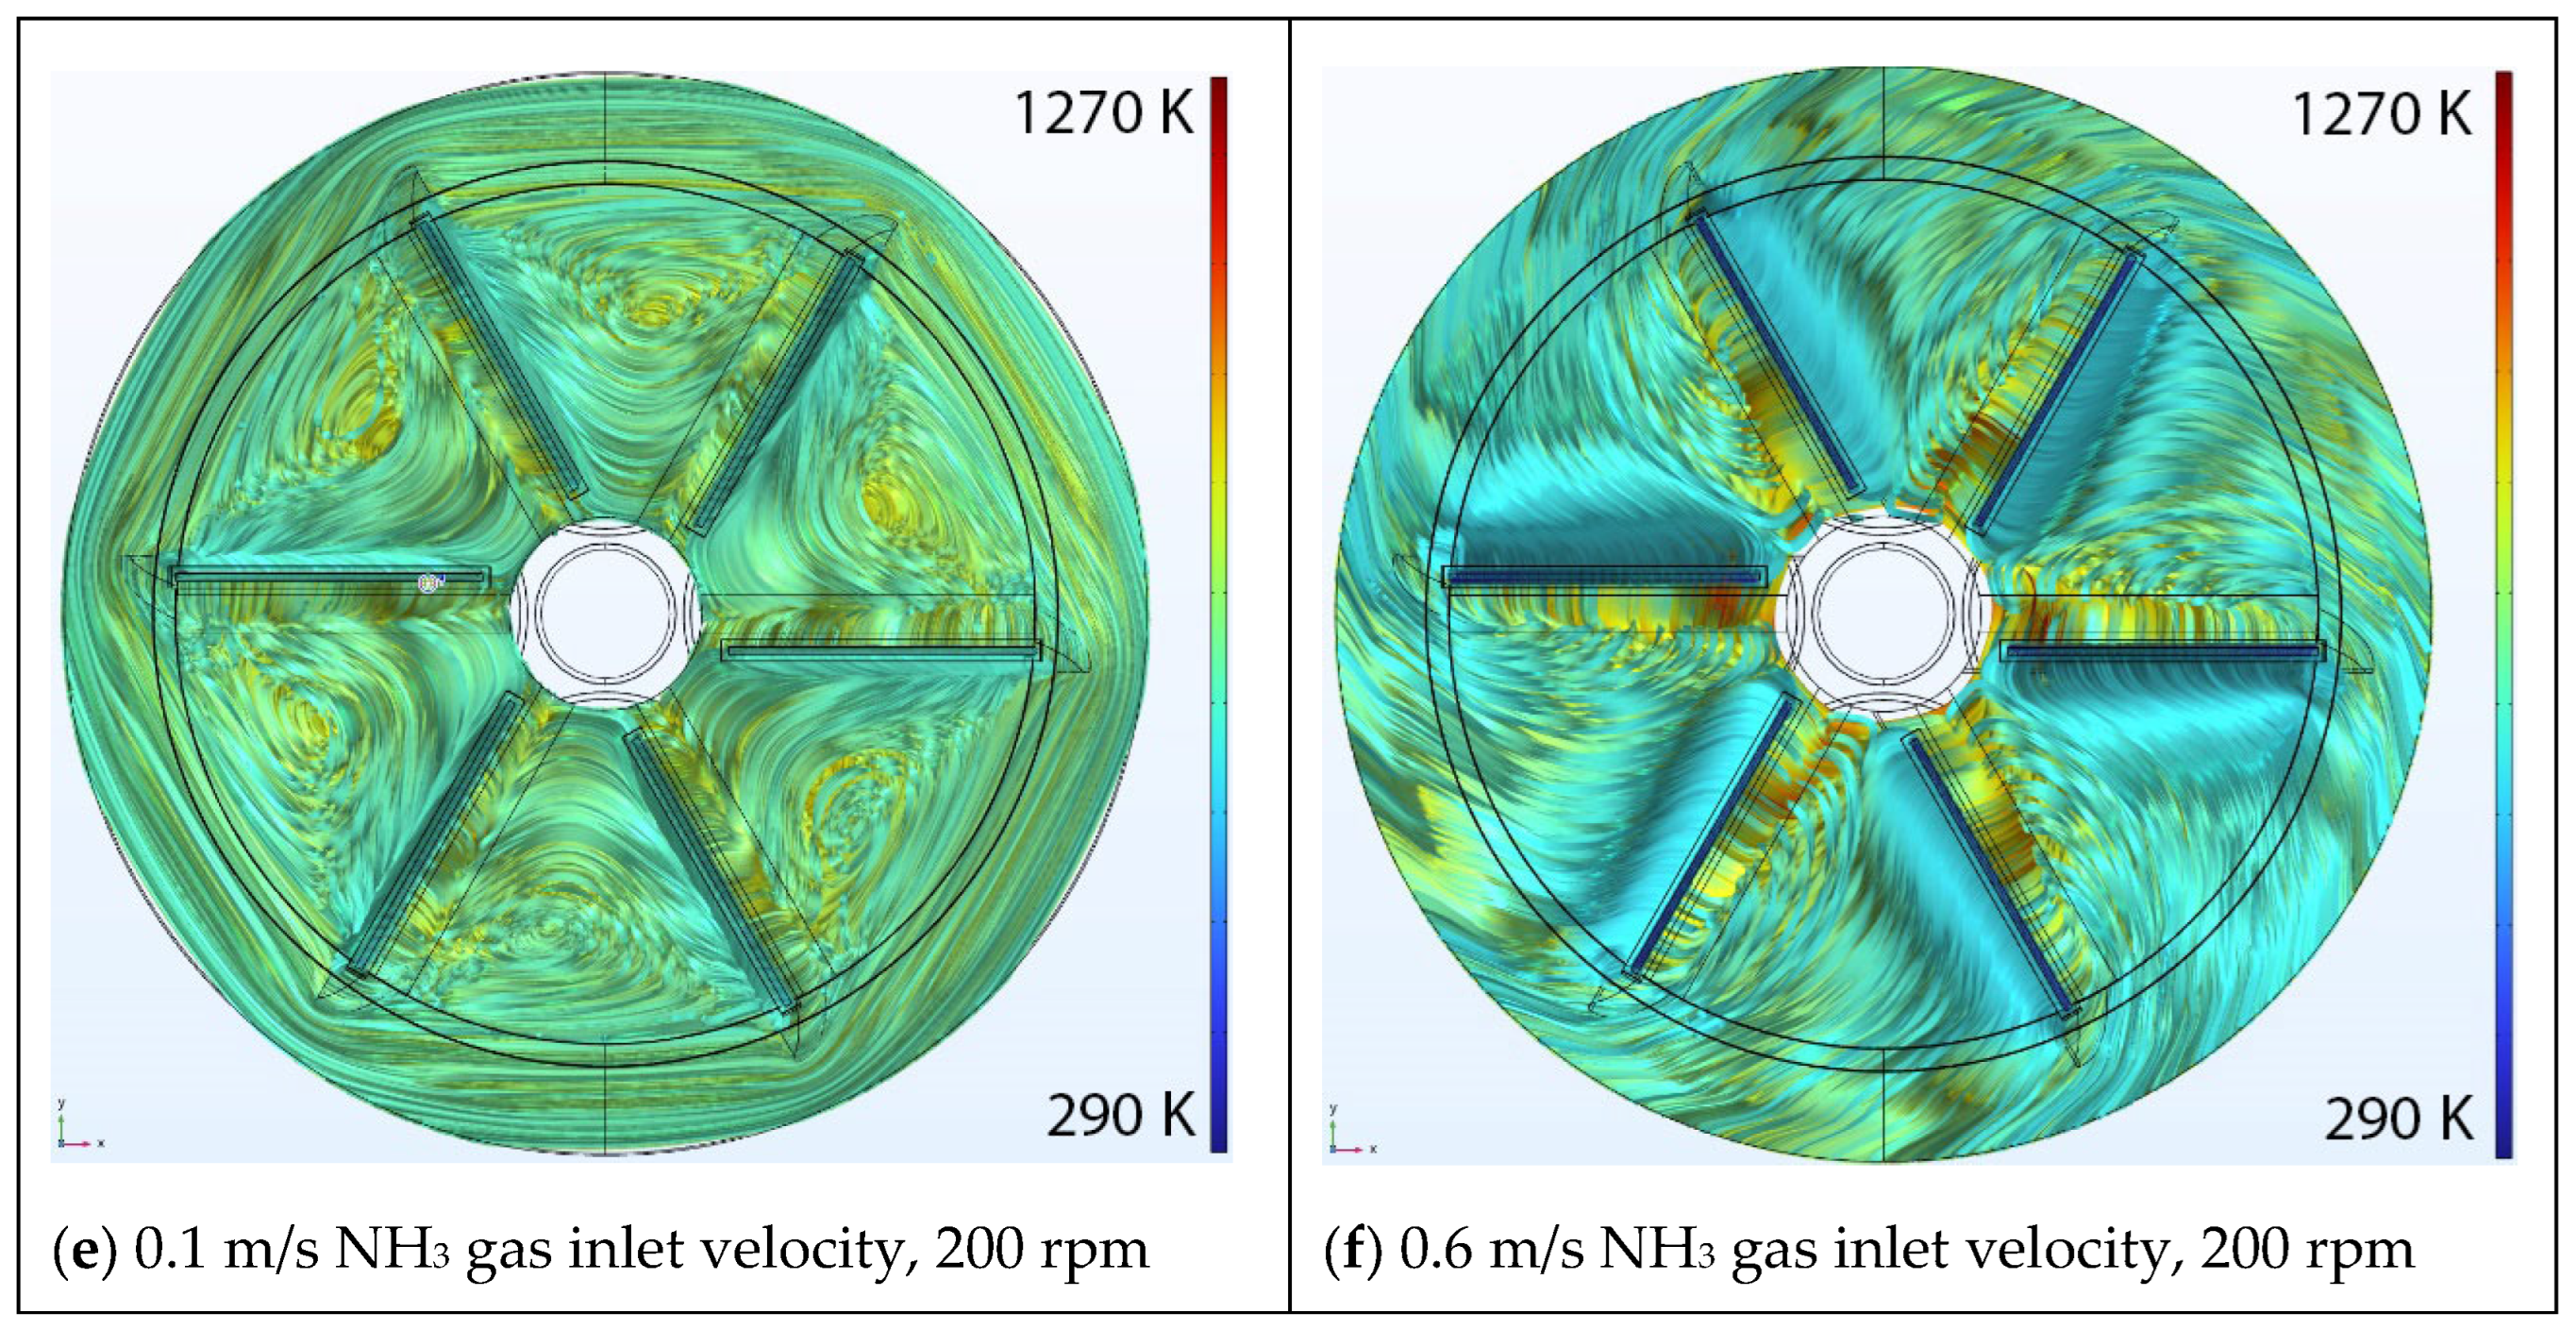
5.2. Effect of Rotational Speed

In Section 5.1, the effect of increasing the inlet velocity for a fixed carrier disk rotational speed (in rpm), operating pressure, inlet area, and constant boundary conditions was discussed. This section performs a similar discussion yet analyzes the effect of higher rotational speeds (100 rpm and 200 rpm). To simplify the presentation of the data, only two inlet velocity magnitudes are presented: 0.1 and 0.6 m/s.
Figure 7 and Figure 8 present the flow patterns inside the reactor, using 10,000 temperature color-coded streamlines, for the three different gases for two different inlet velocity inputs (0.1 m/s and 0.6 m/s) at a disk rotation speed of 100 rpm and 200 rpm, respectively. The majority of the chaotic movements on top of the wafers disappeared by increasing the inlet velocity magnitude for all N2, H2, NH3 simulations. The existence of minor, local disturbances in the center of the disk are similarly observed with a similar minor contribution to the flow pattern.
A careful examination of the streamline plots for N2, H2, and NH3 at higher rotational speeds indicates that the maximum rotational speed (200 rpm) is not suitable for all three gases when operating at a pressure of 1 atm. This suggests that there exists a threshold for the maximum rotational speed of the carrier disk, beyond which smooth flow patterns cannot be expected within the current range of gas inlet velocities. Additionally, it is evident that the rotational speed of 100 rpm can be utilized in the system for nitrogen and ammonia, but not for hydrogen.
The primary motivation for performing these simulations was to gain an understanding of the suitable operating conditions of this tool for the successful growth of thin films. A key criterion to achieving this goal is presumed to be the existence of a vortex-free and turbulent-free gas region above the wafers. Given the strong connection observed between gas inlet velocity and rotation speed of the disk, it is valuable to define a criterion for the establishment of a favorable operating window, as well as a less favorable one.
For the purpose of this study, a conservative pass/fail criterion was established for each of the gases and the associated inlet gas velocity and disk rotation speed. Passing was assigned to any flow pattern in which no more than one streamline was found out of 10,000 streamlines to form a vortex or deviate from the general streamline pattern of the general gas flow. Failing was assigned to finding two or more streamlines falling outside of the expected smooth flow pattern. As an example of a ‘bad’ streamline, a streamline might show swirling, twisted, or totally diverted direction inside the numerical domain. This criterion is considered to be rather conservative when only 0.01% of the fluid flow is not exhibiting smooth flow behavior.
Table 4 presents the resulting pass/fail criteria outcomes for the different conditions and all three gases. To provide a more practical measure for gas flow rate, the gas inlet velocities were also converted to flow rates (in standard liters per minute, slm) by multiplying the inlet velocity into the inlet area for each gas. In these simulations, each inlet area was 0.1064 in2, leading to a total inlet area of 0.6384 in2.
It can be seen from Table 4 that hydrogen did not receive a passing criterion for any inlet velocity for rotational speeds of 100 rpm or greater. No gas received a passing criterion for any inlet velocity for a rotational speed of 200 rpm. Based on observed trends, with regard to the fact that higher inlet velocities appear to stabilize flows in higher rotational system configurations, it is possible that very high inlet velocities to the system could lead to stable flow conditions at 200 rpm; however, this would also lead to higher flow rates of gas.
Nitrogen was the most accommodating gas, yielding suitable flow conditions for inlet velocities at 0.4 m/s for 50 rpm and for any combination of 0.5 and 0.6 m/s inlet velocity with the simulated rotational speed. This is advantageous as nitrogen is an inexpensive gas that can be used as a carrier gas for metal organic precursors for the growth of group III nitride films.
Ammonia behaved similarly to hydrogen, though did have a slightly more forgiving tolerance to the inlet velocity and disk rotational speed matching criteria. Ammonia, like hydrogen, favors lower disk rotating speeds.
While simulation results are based on the condition that the type of gas inserted into the system is identical in all six chambers, the communal operating window for all three gases of 50 rpm and an inlet velocity between 0.5 and 0.6 m/s (a total gas flow of 12 to 15 slm in the system) suggest any gas mixture or combination of gases may be used in each of the chambers, leading to suitable growth conditions through the system. This is advantageous as this suggests that a suitable growth window exists for this system for the growth of group III nitrides at 1 atm system pressure and with an anticipated total gas flow around 12–15 slm—a range which is comparable to existing 1 atm MOCVD systems.

5.3. Effect of Inlet Area

The presented results in Section 5.1 and Section 5.2 were based on a fixed gas inlet opening area for each chamber of 0.1064 in2 for a total gas inlet area of 0.6384 in2 (see also Figure 2b). It is interesting to consider the effect of gas flow rate independently of the gas velocity in order to see if the velocity matching criteria at the interface of the rotating disk is critical, or rather if the amount of mass being transferred through the system is equally important. As such, two different opening areas, 0.2128 in2 (0.1-inch width opening) and 0.1064 in2 (0.05-inch width opening), were investigated and the flow patterns in the chambers were analyzed. Numerical results were conducted and presented below for N2 at 1 atm and a disk rotation of 50 rpm. The numerical results presented in Figure 4, Figure 5, Figure 6, Figure 7 and Figure 8 provide numerical modeling for the narrower inlet area of the chamber (0.1064 in2).
Figure 9 shows the flow patterns inside the reactor within the chambers using 10,000 streamlines for the wider (0.1-inch wide opening) inlet area and corresponding to inlet velocities ranging from 0.1 m/s to 0.6 m/s at 50 rpm. The streamlines are color coded for temperature.
Examination of the streamlines presented in Figure 9 indicates that, with the larger opening area, nitrogen meets the passing criteria mentioned in Section 5.2 for Vinlet = 0.4 m/s and larger values at 50 rpm. This finding agrees with the results obtained for nitrogen at 50 rpm using the smaller inlet area, as summarized in Table 4. Based on this result, it would appear that inlet velocity is a more important criterion to determine suitable flow conditions, and there may be optimization opportunities to further reduce gas flow rates via a reduction in inlet area from 0.05 inch to smaller values.

6. Summary

Three-dimensional numerical simulations of a vertical atmospheric HPS-CVD reactor were conducted using a k-ω turbulent model with the commercial CFD program, COMSOL Multiphysics. The effects of inlet gas flow rate, rotational speed of the carrier disk, and inlet flow area were investigated considering three different working fluids: N2, H2, and NH3. Velocity streamlines on the X–Y plane were used to analyze the results for suitable flow conditions and system performance. Given the parametric approach to this study, the results informed us of suitable operating condition windows for the use of the system and allowed us to understand the sensitivity of the investigated parameters on the stability of the gas flow patterns in the chambers.
Analysis of 10,000 streamlines in the entire system showed that, for smooth gas flow to exist inside the reactor, the rotational speed of the carrier disk had to be matched with suitable inlet flow velocities, which had to be larger than a minimum threshold. Each gas type exhibited a different pattern between gas inlet velocity and rotational speed. Nitrogen gas showed prominent results for gas inlet velocities at 0.5 m/s and 0.6 m/s for two disk rotations (50, 100 rpm). Hydrogen was the most challenging gas as it only displayed suitable conditions at a rotational speed of 50 rpm and inlet velocities of 0.5 m/s or 0.6 m/s. Ammonia exhibited a behavior that fell in between that of nitrogen and hydrogen.
A combination of inlet velocity and disk rotational speed that was simultaneously met for all three gas types was identified and corresponded to an inlet speed of 0.5 m/s or 0.6 m/s with a rotational speed of 50 rpm. For reduced mass flow, the lower inlet speed is suggested to be optimal with a total system flow rate of 12 slm—a value comparable to current, horizontal, one-atmosphere MOCVD systems.
The effect of doubling the inlet flow area, thereby doubling the flow rate, was investigated and found to have minimal impact on the flow pattern. Based on this observation, it is suggested that flow rates in the system could potentially be modified for a fixed inlet velocity, as it appears the inlet velocity is of greater significance when determining suitable flow performance.

Author Contributions

Conceptualization, H.E. and S.P.; methodology, H.E. and S.P.; software, H.E.; validation, H.E.; formal analysis, H.E. and S.P.; investigation, H.E.; resources, S.P.; data curation, H.E.; writing—original draft preparation, H.E.; writing—review and editing, H.E. and S.P.; visualization, H.E.; software, H.E.; supervision, S.P.; project administration, S.P.; funding acquisition, S.P. All authors have read and agreed to the published version of the manuscript.

Funding

The authors received support from the National Science Foundation under Grant No. 1726395, Lehigh University New Faculty Startup Funds, and Industrial Support.

Data Availability Statement

The original contributions presented in the study are included in the article; further inquiries can be directed to the corresponding authors.

Acknowledgments

Portions of this research were conducted on Lehigh University’s Research Computing infrastructure partially supported by NSF Award 2019035.

Conflicts of Interest

The authors declare no conflicts of interest.

References

  1. Scholz, F. MOVPE of Group-III Heterostructures for Optoelectronic Applications. Cryst. Res. Technol. 2020, 55, 1900027. [Google Scholar] [CrossRef]
  2. Wang, C.A. Perspectives on the Development of Metalorganic Vapor Phase Epitaxy for III-V Optoelectronic Devices. IEEE J. Quantum Electron. 2022, 58, 5000111. [Google Scholar] [CrossRef]
  3. Wang, C.A. Early history of MOVPE reactor development. J. Cryst. Growth 2019, 506, 190–200. [Google Scholar] [CrossRef]
  4. Pimputkar, S.; Speck, J.S.; DenBaars, S.P.; Nakamura, S. Prospects for LED lighting. Nat. Photonics 2009, 3, 180–182. [Google Scholar] [CrossRef]
  5. Amano, H.; Collazo, R.; De Santi, C.; Einfeldt, S.; Funato, M.; Glaab, J.; Hagedorn, S.; Hirano, A.; Hirayama, H.; Ishii, R.; et al. The 2020 UV emitter roadmap. J. Phys. D Appl. Phys. 2020, 53, 503001. [Google Scholar] [CrossRef]
  6. Flack, T.J.; Pushpakaran, B.N.; Bayne, S.B. GaN Technology for Power Electronic Applications: A Review. J. Electron. Mater. 2016, 45, 2673–2682. [Google Scholar] [CrossRef]
  7. Nakamura, S. Nobel Lecture: Background story of the invention of efficient blue InGaN light emitting diodes. Rev. Mod. Phys. 2015, 87, 1139–1151. [Google Scholar] [CrossRef]
  8. Nakamura, S.; Harada, Y.; Seno, M. Novel metalorganic chemical vapor deposition system for GaN growth. Appl. Phys. Lett. 1991, 58, 2021–2023. [Google Scholar] [CrossRef]
  9. MacChesney, J.B.; Bridenbaugh, P.M.; O’Connor, P.B. Thermal stability of indium nitride at elevated temperatures and nitrogen pressures. Mater. Res. Bull. 1970, 5, 783–791. [Google Scholar] [CrossRef]
  10. Lymperakis, L.; Schulz, T.; Freysoldt, C.; Anikeeva, M.; Chen, Z.; Zheng, X.; Shen, B.; Chèze, C.; Siekacz, M.; Wang, X.Q.; et al. Elastically frustrated rehybridization: Origin of chemical order and compositional limits in InGaN quantum wells. Phys. Rev. Mater. 2018, 2, 11601. [Google Scholar] [CrossRef]
  11. Ivanov, S.V.; Shubina, T.V.; Komissarova, T.A.; Jmerik, V.N. Metastable nature of InN and In-rich InGaN alloys. J. Cryst. Growth 2014, 403, 83–89. [Google Scholar] [CrossRef]
  12. Borovac, D.; Sun, W.; Peart, M.R.; Song, R.; Wierer, J.J.; Tansu, N. Low background doping in AlInN grown on GaN via metalorganic vapor phase epitaxy. J. Cryst. Growth 2020, 548, 125847. [Google Scholar] [CrossRef]
  13. Miyoshi, M.; Yamanaka, M.; Egawa, T.; Takeuchi, T. Microstructure variation in thick AlInN films grown on c-plane GaN on sapphire by metalorganic chemical vapor deposition. J. Cryst. Growth 2019, 506, 40–44. [Google Scholar] [CrossRef]
  14. Sangiovanni, D.G.; Gueorguiev, G.K.; Kakanakova-Georgieva, A. Ab initio molecular dynamics of atomic-scale surface reactions: Insights into metal organic chemical vapor deposition of AlN on graphene. Phys. Chem. Chem. Phys. 2018, 20, 17751–17761. [Google Scholar] [CrossRef] [PubMed]
  15. Sangiovanni, D.G.; Faccio, R.; Gueorguiev, G.K.; Kakanakova-Georgieva, A. Discovering atomistic pathways for supply of metal atoms from methyl-based precursors to graphene surface. Phys. Chem. Chem. Phys. 2022, 25, 829–837. [Google Scholar] [CrossRef] [PubMed]
  16. Freitas, R.R.Q.; Gueorguiev, G.K.; De Brito Mota, F.; De Castilho, C.M.C.; Stafström, S.; Kakanakova-Georgieva, A. Reactivity of adducts relevant to the deposition of hexagonal BN from first-principles calculations. Chem. Phys. Lett. 2013, 583, 119–124. [Google Scholar] [CrossRef]
  17. Stringfellow, G.B. Fundamental aspects of organometallic vapor phase epitaxy. Mater. Sci. Eng. 2001, 87, 97–116. [Google Scholar] [CrossRef]
  18. Kuzmík, J.; Adikimenakis, A.; Ťapajna, M.; Gregušová, D.; Haščík, Š.; Dobročka, E.; Tsagaraki, K.; Stoklas, R.; Georgakilas, A. InN: Breaking the limits of solid-state electronics. AIP Adv. 2021, 11, 125325. [Google Scholar] [CrossRef]
  19. Dietz, N. Real-time optical characterization of thin film growth. Mater. Sci. Eng. B 2001, 87, 1–22. [Google Scholar] [CrossRef]
  20. Dietz, N.; Alevli, M.; Kang, H.; Strassburg, M.; Woods, V.; Ferguson, I.T.; Moore, C.E.; Cardelino, B.H. The growth of InN and related alloys by high-pressure CVD. In Operational Characteristics and Crystal Growth of Nonlinear Optical Materials II; SPIE: Bellingham, WA, USA, 2005; p. 5912. [Google Scholar]
  21. Dietz, N. High Pressure Chemical Vapor Deposition Apparatuses, Methods, and Compositions Produced Therewith; EP2464760A4; ACM Press: New York, NY, USA, 2013. [Google Scholar]
  22. Alevli, M.; Durkaya, G.; Weerasekara, A.; Perera, A.G.U.; Dietz, N.; Fenwick, W.; Woods, V.; Ferguson, I. Characterization of InN layers grown by high-pressure chemical vapor deposition. Appl. Phys. Lett. 2006, 89, 1023–1026. [Google Scholar] [CrossRef]
  23. Senevirathna, M.K.I.; Gamage, S.; Atalay, R.; Acharya, A.R.; Perera, A.G.U.; Dietz, N.; Buegler, M.; Hoffmann, A.; Su, L.; Meltonc, A.; et al. Effect of reactor pressure on the electrical and structural properties of InN epilayers grown by high-pressure chemical vapor deposition. J. Vac. Sci. Technol. A Vac. Surf. Film. 2012, 30, 31511. [Google Scholar] [CrossRef]
  24. Yousefian, P.; Pimputkar, S. Computational fluid dynamics modeling of a new high-pressure chemical vapor deposition reactor design. J. Cryst. Growth 2021, 566, 126155. [Google Scholar] [CrossRef]
  25. Papavasileiou, P.; Koronaki, E.D.; Pozzetti, G.; Kathrein, M.; Czettl, C.; Boudouvis, A.G.; Mountziaris, T.J.; Bordas, S.P.A. An efficient chemistry-enhanced CFD model for the investigation of the rate-limiting mechanisms in industrial Chemical Vapor Deposition reactors. Chem. Eng. Res. Design 2022, 186, 314–325. [Google Scholar] [CrossRef]
  26. Theodoropoulos, C.; Mountziaris, T.J.; Moffat, H.K.; Han, J. Design of gas inlets for the growth of gallium nitride by metalorganic vapor phase epitaxy. J. Cryst. Growth 2000, 217, 65–81. [Google Scholar] [CrossRef]
  27. Barua, H.; Povitsky, A. Numerical model of carbon chemical vapor deposition at internal surfaces. Vacuum 2020, 175, 109234. [Google Scholar] [CrossRef]
  28. Psarellis, G.M.; Aviziotis, I.G.; Duguet, T.; Vahlas, C.; Koronaki, E.D.; Boudouvis, A.G. Investigation of reaction mechanisms in the chemical vapor deposition of al from DMEAA. Chem. Eng. Sci. 2018, 177, 464–470. [Google Scholar] [CrossRef]
  29. Zou, S.; Xiao, J.; Wu, V.; Chen, X.D. Analyzing industrial CVD reactors using a porous media approach. Chem. Eng. J. 2021, 415, 129038. [Google Scholar] [CrossRef]
  30. Cheimarios, N.; Kavousanakis, M.; Kokkoris, G.; Boudouvis, A.G. Beware of symmetry breaking and periodic flow regimes in axisymmetric CVD reactor setups. Comput. Chem. Eng. 2019, 124, 124–132. [Google Scholar] [CrossRef]
  31. Wu, Y.; Wu, R.; Zhou, X.; Wang, H.; Hu, Y.; Nie, D.; Bao, D. Numerical Modelling on the Effect of Temperature on MOCVD Growth of ZnO Using Diethylzinc and Tertiarybutanol. Coatings 2022, 12, 1991. [Google Scholar] [CrossRef]
  32. Huang, Z.; Qie, S.; Quan, X.; Guo, K.; Liu, C. Numerical simulation of multiple polysilicon CVD reactors connected in series using CFD method. Can. J. Chem. Eng. 2015, 93, 1721–1729. [Google Scholar] [CrossRef]
  33. Ni, H.; Lu, S.; Chen, C. Modeling and simulation of silicon epitaxial growth in Siemens CVD reactor. J. Cryst. Growth 2014, 404, 89–99. [Google Scholar] [CrossRef]
  34. Gakis, G.P.; Koronaki, E.D.; Boudouvis, A.G. Numerical investigation of multiple stationary and time-periodic flow regimes in vertical rotating disc CVD reactors. J. Cryst. Growth 2015, 432, 152–159. [Google Scholar] [CrossRef]
  35. Raj, E.; Lisik, Z.; Niedzielski, P.; Ruta, L.; Turczynski, M.; Wang, X.; Waag, A. Modelling of MOCVD reactor: New 3D approach. J. Phys. Conf. Ser. 2014, 494, 12019. [Google Scholar] [CrossRef]
  36. Lin, C.H.; Cheng, W.T.; Lee, J.H. Effect of embedding a porous medium on the deposition rate in a vertical rotating MOCVD reactor based on CFD modeling. Int. Commun. Heat. Mass. Transfer. 2009, 36, 680–685. [Google Scholar] [CrossRef]
  37. Sytniewski, Ł.J.; Lapkin, A.A.; Stepanov, S.; Wang, W.N. CFD optimisation of up-flow vertical HVPE reactor for GaN growth. J. Cryst. Growth 2008, 310, 3358–3365. [Google Scholar] [CrossRef]
  38. Tabatabaei, S. Evaluation of Fluid Dynamic Effect on Thin Film Growth in a Horizontal Type Meso-Scale Chemical Vapor Deposition Reactor Using Computational Fluid Dynamics; University of Alabama: Tuscaloosa, AL, USA, 2013. [Google Scholar]
  39. Kempisty, P.; Łucznik, B.; Pastuszka, B.; Grzegory, I.; Boćkowski, M.; Krukowski, S.; Porowski, S. CFD and reaction computational analysis of the growth of GaN by HVPE method. J. Cryst. Growth 2006, 296, 31–42. [Google Scholar] [CrossRef]
  40. Bao, Q.; Zhu, T.; Zhou, N.; Guo, S.; Luo, J.; Zhao, C. Effect of hydrogen carrier gas on AlN and AlGaN growth in AMEC Prismo D-Blue® MOCVD platform. J. Cryst. Growth 2015, 419, 52–56. [Google Scholar] [CrossRef]
  41. He, Y.; Wang, J.; Luo, T.; Pei, Y. Analysis and optimization of MOCVD flow ratio based on machine learning and PSO algorithm. J. Cryst. Growth 2022, 590. [Google Scholar] [CrossRef]
  42. Li, Z.; Li, H.; Zhang, J.; Li, J.; Jiang, H.; Fu, X.; Han, Y.; Xia, Y.; Huang, Y.; Yin, J.; et al. A susceptor with partial-torus groove in vertical MOCVD reactor by induction heating. Int. J. Heat Mass Transf. 2014, 75, 410–413. [Google Scholar] [CrossRef]
  43. Shinde, V.M.; Deivendran, B.; Kumar, H.; Eswara Prasad, N. Investigation of transport processes in a commercial hot wall CVD reactor with multi-substrates for high-quality pyrocarbon deposition. Surf. Coat. Technol. 2021, 425. [Google Scholar] [CrossRef]
  44. Gkinis, P.A.; Aviziotis, I.G.; Koronaki, E.D.; Gakis, G.P.; Boudouvis, A.G. The effects of flow multiplicity on GaN deposition in a rotating disk CVD reactor. J. Cryst. Growth 2017, 458, 140–148. [Google Scholar] [CrossRef]
  45. Chuang, Y.C.; Chen, C.T. Mathematical modeling and optimal design of an MOCVD reactor for GaAs film growth. J. Taiwan Inst. Chem. Eng. 2014, 45, 254–267. [Google Scholar] [CrossRef]
  46. Comsol. The CFD Module User’s Guide. 2022. Available online: www.comsol.com (accessed on 1 December 2023).
  47. Comsol. The Heat Transfer Module User’s Guide. 2022. Available online: www.comsol.com (accessed on 1 December 2023).
  48. Monogenidou, S.A.; Assael, M.J.; Huber, M.L. Reference Correlation for the Viscosity of Ammonia from the Triple Point to 725 K and up to 50 MPa. J. Phys. Chem. Ref. Data 2018, 47, 23102. [Google Scholar] [CrossRef] [PubMed]
Figure 1. Three-dimensional geometry view of the (a) Exposed surfaces of HPS-CVD reactor, (b) wafer carrier disk assembly including four 2-inch wafers resting inside heater pockets on a 6.8-inch disc, (c) half cross-section of the heater pockets in the wafer carrier disk showing a wafer (green), a susceptor (black), a heater (red), thermal insulation (yellow), and the metal disk (blue).
Crystals 14 00105 g001
Figure 2. Dimensions in inches for (a) wafer carrier disk, and (b) the gas inlet area.
Crystals 14 00105 g002
Figure 3. Mesh (a) cut plane in the middle of the reactor, (b) exaggerated view of the mesh corresponds to the dashed-line box in (a).
Crystals 14 00105 g003
Figure 4. Top view of 10,000 temperature color-coded velocity streamlines within the chambers considering N2 at 1 atm, a disk rotation of 50 rpm and gas inlet velocities of (a) 0.1 m/s, (b) 0.2 m/s, (c) 0.3 m/s, (d) 0.4 m/s, (e) 0.5 m/s, and (f) 0.6 m/s. Gas temperature is color coded identically in each panel, ranging from 290 K (blue) to 1300 K (red).
Crystals 14 00105 g004aCrystals 14 00105 g004b
Figure 5. Top view of 10,000 temperature color-coded velocity streamlines within the chambers considering H2 at 1 atm, a disk rotation of 50 rpm and gas inlet velocities of (a) 0.1 m/s, (b) 0.2 m/s, (c) 0.3 m/s, (d) 0.4 m/s, (e) 0.5 m/s, and (f) 0.6 m/s. Gas temperature is color coded identically in each panel, ranging from 630 K (blue) to 1240 K (red).
Crystals 14 00105 g005
Figure 6. Top view of 10,000 temperature color-coded velocity streamlines within the chambers considering NH3 at 1 atm, a disk rotation of 50 rpm and gas inlet velocities of (a) 0.1 m/s, (b) 0.2 m/s, (c) 0.3 m/s, (d) 0.4 m/s, (e) 0.5 m/s, and (f) 0.6 m/s. Gas temperature is color coded identically in each panel, ranging from 290 K (blue) to 1270 K (red).
Crystals 14 00105 g006
Figure 7. Top view of 10,000 temperature color-coded velocity streamlines within the chambers at 1 atm, a disk rotation of 100 rpm and gas type and inlet velocities of (a) N2, 0.1 m/s (b) N2, 0.6 m/s (c) H2, 0.1 m/s (d) H2, 0.6 m/s (e) NH3, 0.1 m/s, and (f) NH3, 0.6 m/s, respectively.
Crystals 14 00105 g007aCrystals 14 00105 g007b
Figure 8. Top view of 10,000 temperature color-coded velocity streamlines within the chambers at 1 atm, a disk rotation of 200 rpm and gas type and inlet velocities of (a) N2, 0.1 m/s (b) N2, 0.6 m/s (c) H2, 0.1 m/s (d) H2, 0.6 m/s, (e) NH3, 0.1 m/s, and (f) NH3, 0.6 m/s, respectively.
Crystals 14 00105 g008aCrystals 14 00105 g008b
Figure 9. Top view of 10,000 temperature color-coded velocity streamlines within the chambers for the wider inlet area considering N2 at 1 atm, a disk rotation of 50 rpm and inlet velocities of (a) 0.1 m/s, (b) 0.2 m/s, (c) 0.3 m/s, (d) 0.4 m/s, (e) 0.5 m/s, and (f) 0.6 m/s.
Crystals 14 00105 g009
Table 1. Physical properties of the solid domains used in the simulations.
Solid DomainMaterialThermal Conductivity (W/m·K)Density (kg/m3)Heat Capacity at Constant Pressure (J/kg·K)Emissivity
Thermal insulatorBoron nitride1919077700.9
SusceptorGraphite35022657070.85
HeaterGraphite3502265707-
DiskStainless Steel16.280005000.5
WaferSapphire46.0639081171-
Side wallsMolybdenum13810,2002500.1
Table 2. Defaults values that are used for all simulations unless stated differently.
ParameterValue (s)
Rotational speed (rpm)50, 100, 200
Operating pressure (atm)1
Heat transfer coefficient (W/m2·K)50
Inlet velocity/chamber (m/s)0.1–0.6
Inlet gas temperature (K)298.15
Input power/wafer (watt)Varied
Surrounding temperature (K)298.15
Area per inlet (in2)0.1064
Molybdenum emissivity0.1
Table 3. Characteristics of the grid used with 2.7 million elements.
MetricMin ValueAverage
Skewness0.0030.67
Growth rate0.00.62
Maximum angle0.050.77
Volume versus length2.2 × 10−40.51
Table 4. Pass/fail operating conditions for N2, H2, and NH3 at 1 atm, with a disk rotational speed of 50, 100, or 200 rpm and several inlet velocity magnitudes ranging from 0.1 to 0.6 m/s. Cross marks represent failing conditions, while check marks represent passing conditions based on the defined criteria of no more than one ‘bad’ streamlines out of 10,000 streamlines. Passing criteria for all three gases under identical conditions are highlighted in grey.
Gas:N2H2NH3
Inlet Velocity (m/s)Total Flow Rate (slm)Disk Rotational Speed (rpm)
501002005010020050100200
0.12.5
0.25
0.37.5
0.410
0.512
0.615
Disclaimer/Publisher’s Note: The statements, opinions and data contained in all publications are solely those of the individual author(s) and contributor(s) and not of MDPI and/or the editor(s). MDPI and/or the editor(s) disclaim responsibility for any injury to people or property resulting from any ideas, methods, instructions or products referred to in the content.

