Article

Changes in Functional Groups and Crystal Structure of Coal Tar Pitch with Respect to Carbonization Temperature

School of Materials Science and Engineering, Kumoh National Institute of Technology, 61, Daehak-ro, Gumi 39177, Republic of Korea
*
Author to whom correspondence should be addressed.
Crystals 2024, 14(2), 122; https://doi.org/10.3390/cryst14020122
Submission received: 8 January 2024 / Revised: 23 January 2024 / Accepted: 24 January 2024 / Published: 26 January 2024

Abstract

:
In this study, changes in the microstructure of coal-tar pitch (CTP) during successive processes, including pyrolysis, polycondensation, and crystallization, were examined in connection with the resulting variations in structure factors, as measured by X-ray diffraction (XRD) analysis, and functional groups, as confirmed by Fourier transform infrared (FTIR) spectroscopy. To this end, four zones were defined based on variations in crystallinity, which were indicated by d002 and Lc. Each zone was further characterized by interpreting crystallinity development in relation to changes in functional groups and specimen height. At around 400 °C, polycondensation occurred as the C-Har and C-Hal peaks decreased in intensity. These peak reductions coincided with the formation of mesophase spheres, resulting in enhanced crystallinity. Subsequently, at around 500 °C, the peak intensity of C-H and COOH decreased, which was attributed to the release of large amounts of gases. This led to sharp volume changes and a temporary reduction in crystallinity. All these results suggest that changes in the functional groups of CTP at lower temperatures (600 °C or less) during the carbonization process are closely associated with variations in its crystallinity. The major findings of the present study provide valuable insights for designing highly effective processes in the manufacturing of synthetic graphite blocks using CTP as a binder material, including by selecting appropriate temperature ranges to minimize volume expansion and crystallinity degradation and determining the lowest possible carbonization temperature to ensure adequate binder strength.

1. Introduction

CTP is a residue substance generated when distilling or heat-treating coal tar [1]. Specifically, CTP is composed of various types of aromatic hydrocarbons and heterocycles [2,3]. Thanks to this structural characteristic, its molecular weight can be tailored as needed, enabling it to serve as a binder or an impregnating agent [4]. When subjected to the pyrolysis process, it can transform into graphitizing carbon [5,6,7]. Consequently, CTP has found extensive use in various applications such as serving as a raw material for graphite electrodes in electric furnaces or as an anode material for lithium-ion batteries [8].
In general, higher carbonization temperatures result in increased crystallinity of CTP. Specifically, at low temperatures, basic structure units (BSUs) remain randomly oriented and thus exist in the form of aromatic planar molecules. With increasing temperature, BSUs start to stack, leading to a preferential increase in Lc. As the temperature increases further, the columns get closer together as heteroatoms are increasingly removed. High temperatures exceeding 1500 °C result in an increase in La [9]. Therefore, it is crucial to comprehend the variations in carbon structure at different carbonization temperatures and assess their effect on crystallinity.
During the lower temperature stages of carbonization, pyrolysis, dehydrogenation, polymerization, and condensation take place. In the temperature range of 250–300 °C, low-molecular-weight substances undergo pyrolysis, while in the range between 350 and 500 °C, the pitch softens to a molten state, ultimately transforming into a graphite structure. During the same time frame, aromatic compounds are decomposed, resulting in the release of volatile molecules (CO2, CH4, and CO) [10].
Zhang et al. previously analyzed the structure of CTPs using FTIR spectroscopy [11,12,13,14,15,16,17,18]. However, limited research has been dedicated to examining changes in functional groups resulting from structural variations at each stage of carbonization. Previous studies on structural evaluation at a few carbonization temperatures primarily focused on the reduction in methyl and methylene groups, attributed to demethylation, as characterized by the reduced intensities of peaks at 2915 and 1441 cm−1, respectively. However, these studies did not provide clear insights into the evaluation of other peaks, such as C-H aromatic, C=O, C=C, and COOH. Furthermore, there has been limited research dedicated to assessing changes in crystallinity caused by various gaseous reactions resulting from structural development, including demethylation.
This study closely observed changes in the hydrogen- and oxygen-containing functional groups on the surface of CTP, which was fabricated by processing raw materials at specific heat treatment temperatures, using FTIR spectroscopy. Based on these results, changes in the structure of CTPs as a function of carbonization temperature were assessed, with a particular focus on variations in carbonization yield, microstructure, and the results of an XRD structural factor analysis.

2. Experimental Procedure

2.1. Raw Materials and TG-DTG

The binder CTP (Rain Carbon Inc., Stamford, CT, USA) was pulverized into a powder with a particle size of 125 μm or less. The main properties of this powdered CTP used in the present study are summarized in Table 1.
A TG-DTG analysis was performed to evaluate changes in the weight of CTP specimens within each temperature stage of carbonization. The analysis was performed using Auto-TGA (Q500, TA Instruments, New Castle, DE, USA) in an inert atmosphere while increasing the temperature to 900 °C, with a heating rate of 1 °C/min. In the meantime, the temperature ranges in which the maximum weight changes occurred were determined and carbonization yields were also estimated.

2.2. Carbonization

The CTP specimens were subjected to carbonization in a tube furnace, each with a specific carbonization temperature ranging from 300 to 1400 °C with 100 °C intervals. Each specimen was placed in the tube furnace and heated at a rate of 2 °C/min in an inert atmosphere up to the target carbonization temperature and then maintained for one hour to obtain CTP carbonized bodies. Each specimen was named CTP-T (where T stands for temperature) according to the carbonization temperature applied. The initial weight of each CTP specimen was 15.00 g and the specimens were also weighed after carbonization. The weight difference before and after carbonization was used to estimate carbonization yields.
Subsequently, the volumetric change of each specimen resulting from gas release at different carbonization temperatures was evaluated by measuring the specimen’s height at five points along its length using vernier calipers. These measurement points were positioned at approximately 2 mm intervals, both to the left and right of the center. The measurements at these five points were then averaged for each specimen.

2.3. X-ray Diffraction

The structural factors of the CTP specimens carbonized at different temperatures were analyzed using an XRD (D-MAX/2500-PC, Rigaku, Tokyo, Japan). The wavelength of the Cu-Kα1 target used in the XRD analysis was 1.5406 Å and the scanning range was 5–60°, while the scanning was 1°/min.
After removing the background, a (002) peak near 26° was deconvoluted using a Gaussian fitting method into two bands corresponding to less-developed crystalline carbon (LDCC) and more-developed crystalline carbon (MDCC). Afterward, the structure factors of each band were obtained [19]. Additionally, the background of a (10l) peak near 43° was also removed. The 2-theta and full width at half-maximum (FWHM) values of each band and peak were determined and these data were employed to estimate interplanar spacing (d002) using the Bragg equation. Crystallite sizes (Lc and La) were also calculated using the Scherrer equation [19].

2.4. Fourier Transform Infrared Spectroscopy

The FTIR spectra were measured in the ATR mode and recorded using a spectrometer (INVENIO X, Hyperion 2000, Brucker, Billerica, MA, USA). The carbonized CTP powder specimens were placed on a diamond crystal for measurement. The spectrum measurement range was set to 4000–500 cm−1. Changes in the peak intensity of the measured spectra were used to infer the evolution of the pitch structure. After baseline correction of the absorbance peaks, changes in peak intensity were analyzed and these results confirmed an increase or decrease in the number of specific functional groups at each temperature. Table 2 summarizes the major functional groups found in the carbon materials.

2.5. Optical Microscopy

The effect of mesophase formation on crystallinity in temperatures below 500 °C was analyzed using optical microscopy. Specifically, the raw pitch and the pitch specimens heat-treated at 300 °C, 400 °C, and 500 °C were mounted and polished. After coarse and fine polishing, the microstructure of each specimen was observed at 1000× magnification using an optical microscope (OM, Nikon ECLIPS, LV150, Tokyo, Japan).

2.6. Raman Spectroscopy

Raman spectroscopy was performed using a micro-Raman spectrometer (Raman, System 100, Renishaw, Wotton-under-Edge, England) in the temperature range from 300 to 500 °C. This temperature range was selected because an increase in crystallinity had been observed in the XRD analysis results. The aim was to confirm that this increased crystallinity was a result of mesophase sphere formation. The analysis was conducted using an Ar-ion laser with a wavelength of 514 nm and at a magnification of 1000×. The peak intensity ratio of the D-band at 1360 cm−1 to the G-band at 1580 cm−1 (ID/IG) was estimated, and based on this result, variations in crystallinity were analyzed. In CTP-300 and CTP-400, mesophase regions were measured at 1000× magnification.

3. Results and Discussion

3.1. Carbonization Yield Measured Using TGA and a Tube Furnace

A TG-DTG analysis was performed on the CTP specimens and the results are presented in Figure 1a. In the TG curves, two sharp weight changes were observed. Within a region denoted as Stage 1 (110–500 °C), a weight change of 57.9% occurred, followed by a subsequent weight change of 18.1% in Stage 2 (500–900 °C).
The weight change observed in Stage 1 can be attributed to the following two causes. The first factor is the distillation of low-molecular-weight substances, which typically occurs below 300 °C. Subsequently, as the temperature increases to the range of 300–500 °C, not only the remaining low-molecular-weight substances continue to distill, but polymerization also occurs. This gaseous release, characterized by the emission of CO2 (mainly around 400 °C) and CH4 (mainly around 500 °C), eventually resulted in significant weight changes [21,22]. The weight changes observed in Stage 2 can be attributed to the release of CO at 700–1200 °C and H2 at 600–1500 °C [23,24]. The weight change was less significant in Stage 2 because part of the oxygen- and hydrogen-containing functional groups was already released during Stage 1.
Each CTP specimen was carbonized at different temperatures using a tube furnace and the corresponding carbonization yields were calculated, as shown in Figure 1b. When carbonized in a tube furnace, the CTP specimens underwent a sharp decrease in carbonization yield during Stage 1, with the yield dropping to 49.9% at 500 °C. In Stage 2, however, almost no weight change was observed, with the carbonization yield sitting at around 47.4% at 1400 °C. In Stage 2, the weight change was smaller in the tube furnace measurements than in the TGA results, likely due to the difference in the surface area of the CTP specimens used in the two methods. In the TGA measurements, a few milligrams of powder were carbonized; thus, the resulting carbonized bodies were pulverized into particles with a size of 1 mm or less before weight measurement. Conversely, in a tube furnace, unpulverized specimens in the form of pellets with a size of 3 mm or more were carbonized as they are. This suggests that in TGA measurements, the amount of powder used is smaller and the specific surface area is larger. This facilitates the release of gases, ultimately resulting in a greater weight reduction.
Figure 2 shows images of the CTP bodies carbonized at different temperatures. CTP-300 exhibited a glossy and smooth surface. The surface of CTP-400 was also glossy to some extent but bumpier compared to CTP-300. Both CTP-300 and CTP-400 were considered to have undergone a liquid–crystal stage, which can possibly contribute to increased crystallinity resulting from the formation of mesophase spheres.
CTP-500 exhibited a sharp volume expansion. Its surface no longer appeared glossy and its internal structure became porous. CTP-500 was too fragile to be handled by hand. CTP-600 and those carbonized at higher temperatures were stronger than CTP-500. This is attributable to the bonding of aromatic cyclic compounds, resulting in polymerization and, thus, increased strength. This mechanism will be explained in more detail below, with the XRD and FTIR analysis results.
The above results provide valuable insights into the manufacturing of synthetic graphite blocks. It is considered an appropriate approach to carbonize CTP at temperatures over 600 °C when using it as a binder for graphite blocks to ensure that the resulting blocks have sufficient strength.

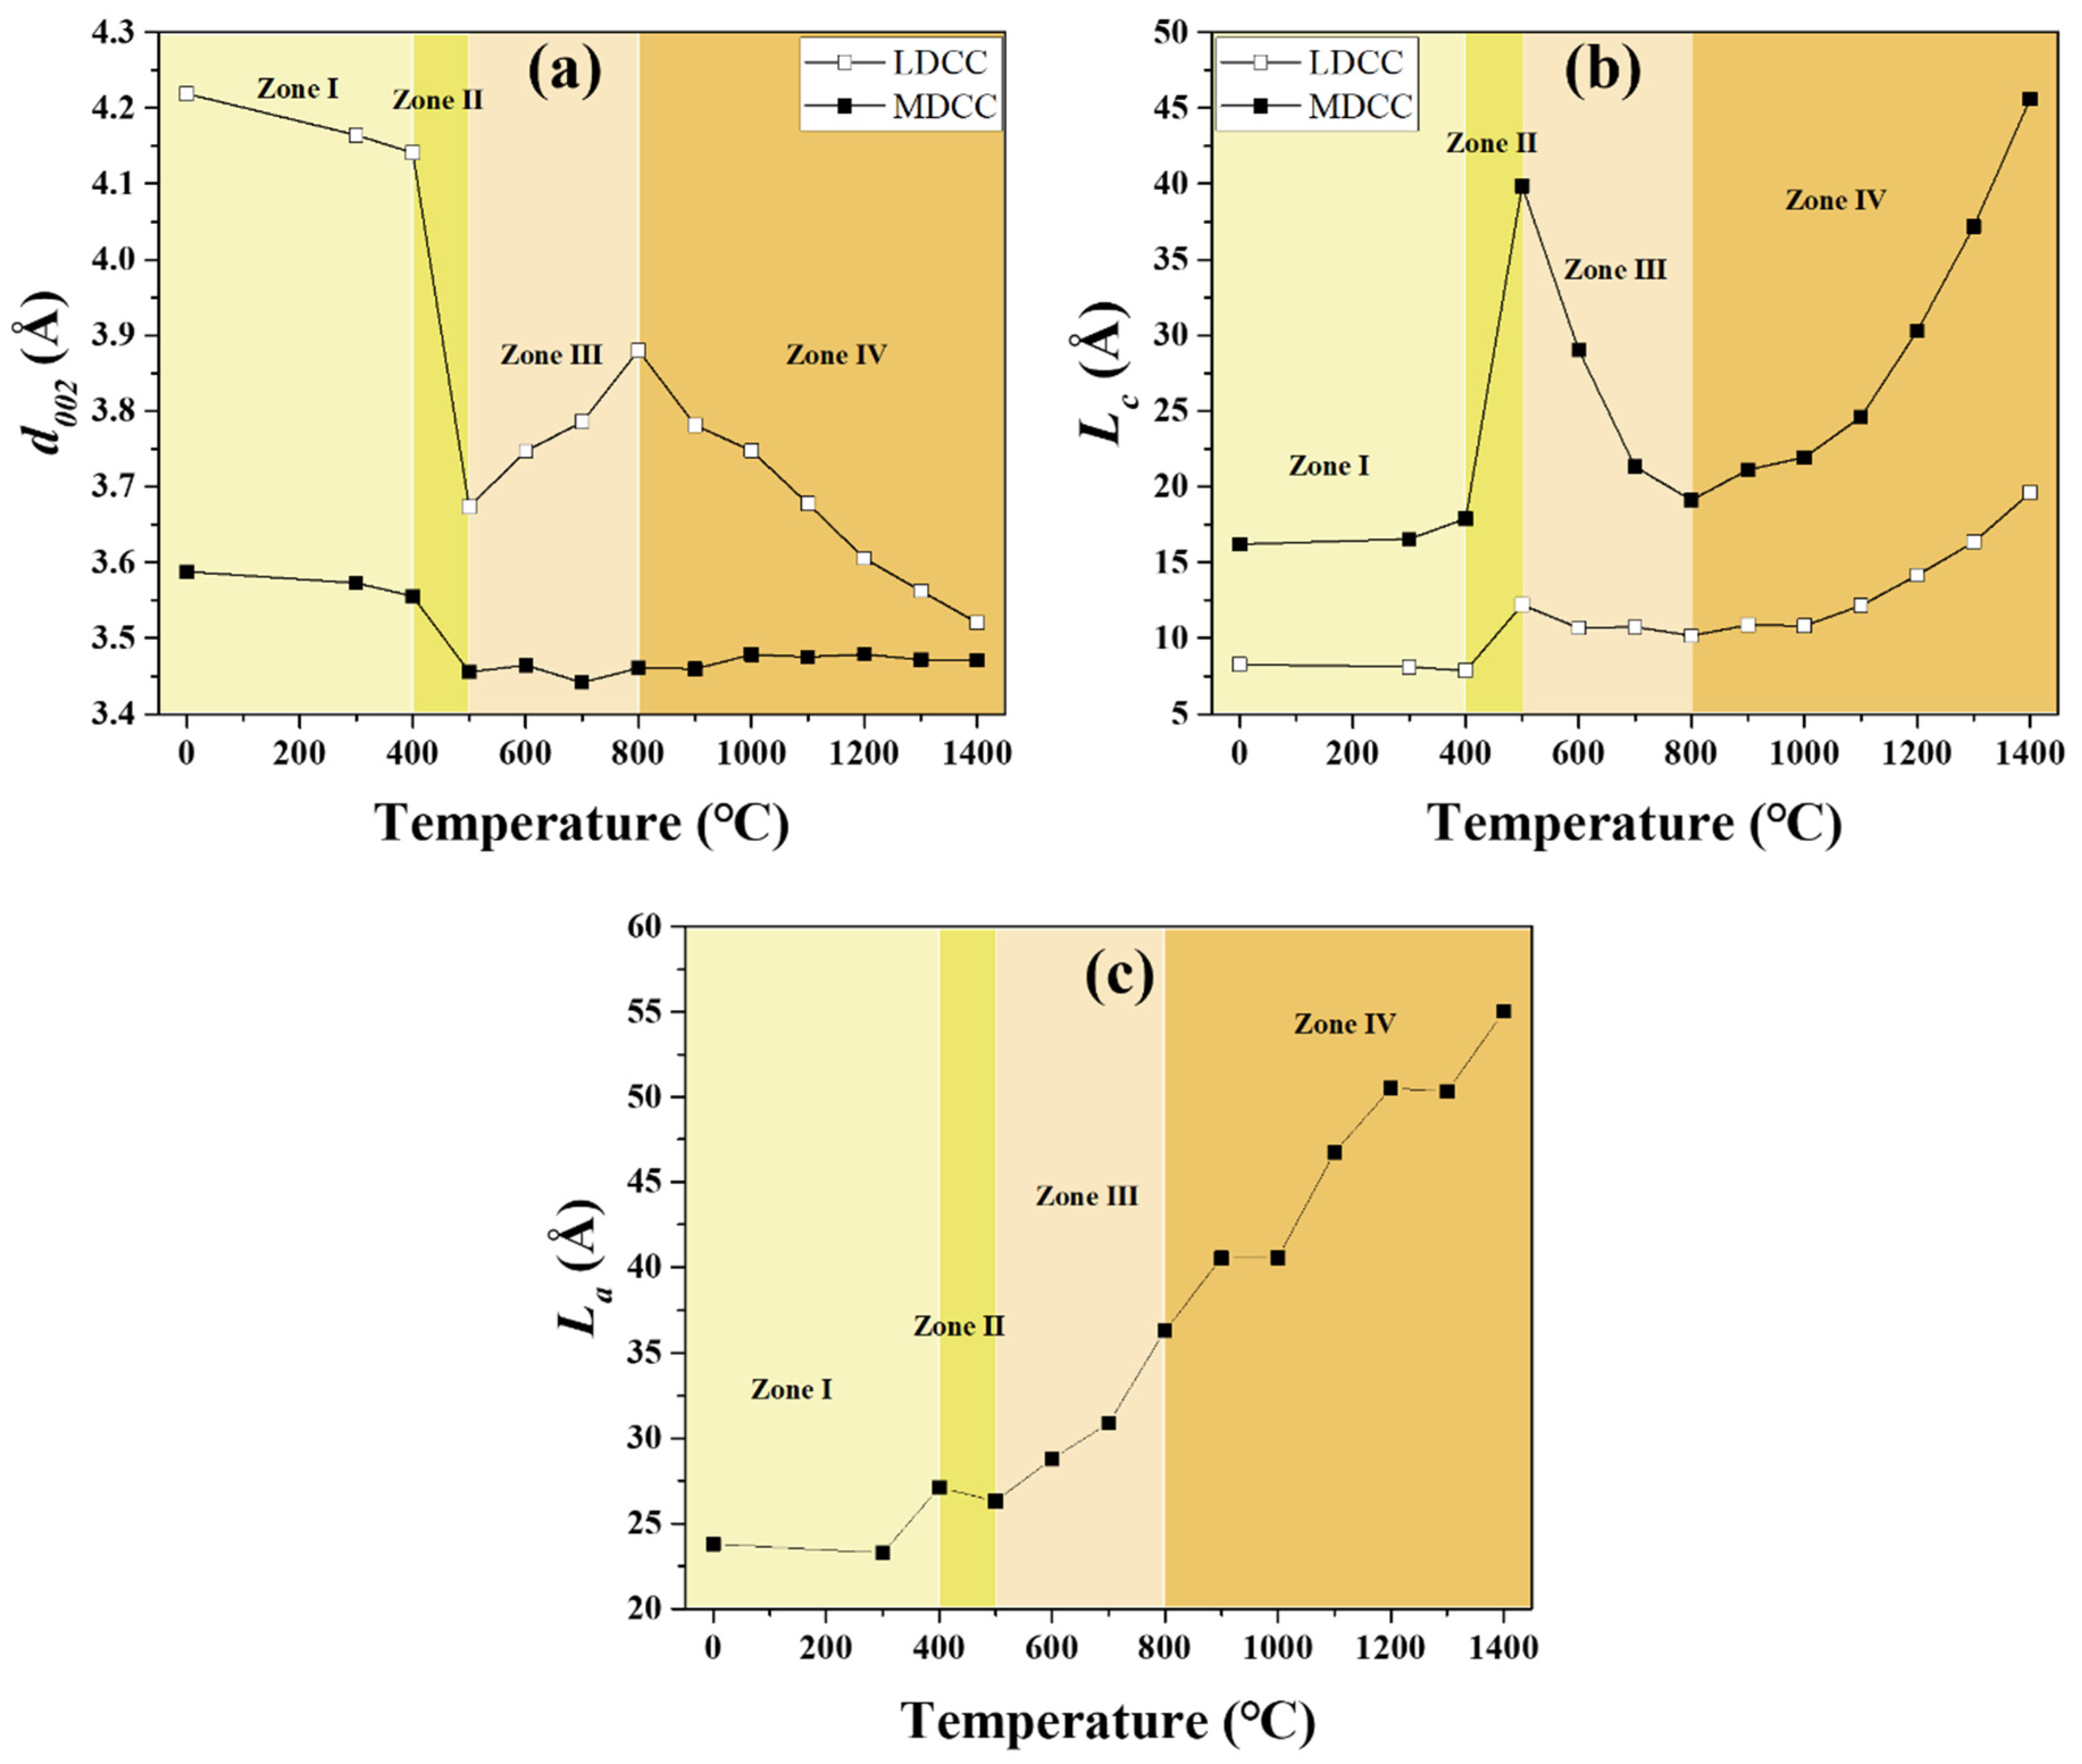
3.2. Crystallinity of CTP as a Function of Temperature

Figure 3 shows changes in the XRD structure factors of the CTP specimens with respect to the carbonization temperature. Previously, in Figure 1, the weight change of CTP was plotted as a function of the carbonization temperature, and this curve was divided into Stage 1 and Stage 2 according to the pattern observed. This categorization was made by dividing the entire temperature range into four specific zones depending on the values of d002 and Lc obtained from the XRD analysis results. Here, Zones I and II belong to Stage 1 and Zones III and IV correspond to Stage 2.
Zone I (up to 400 °C) is a domain in which crystallinity remains almost unchanged. BSUs exist in the form of aromatic planar molecules and the distillation of low-molecular-weight substances mainly occurs [7].
Zone II (400–500 °C) is a domain in which crystallinity improves, with d002 sharply decreasing while Lc abruptly increases. Notably, within the MDCC region, Lc increased by 2.2 times, from 17.90 Å to 39.87 Å. H. Honda et al. allowed mesophase spheres to be formed during the heat treatment of pitch in a temperature range of 390–430 °C for different durations and performed an XRD analysis to examine changes in their structure factors with respect to the heat-treatment temperature and duration. The researchers reported that as the duration lengthened, d002 decreased and Lc increased, attributing this development to the formation of a mesophase structure [25]. Consequently, the enhanced crystallinity in Zone II can be interpreted as being temporarily achieved, resulting from mesophase structure formation.
Aromatic planar molecules start to stack via π-π interactions, leading to nuclei formation. These nuclei, in turn, undergo polycondensation, facilitating the formation of a well-ordered mesophase structure. Considering this, H. Marsh et al. explained that the mesophase exhibited a structure in which smectic (more-ordered) and nematic (less-ordered) domains coexisted [26]. This interpretation is considered to coincide with the approach proposed in this study, describing that the (002) diffraction peak is deconvoluted into two domains corresponding to MDCC and LDCC for interpretation. In Zone II, d002 decreased more significantly in the LDCC region than in the MDCC region. Meanwhile, an increase in Lc was greater in the MDCC region than in the LDCC region. This phenomenon can be attributed to the fact that within the liquid–crystal stage, higher temperatures lead to the formation of more crystalline structures. Within this stage, La remained almost unchanged.
Zone III (500–800 °C) is a domain in which crystallinity starts to decrease again, with d002 sharply increasing while Lc abruptly decreases. This phenomenon is associated with the sharp decrease in carbonization yield at 500 °C, as shown in Figure 1, and the simultaneous abrupt increase in the height of carbonized bodies, resulting in increased internal porosity, as demonstrated in Figure 2. The sudden release of gases such as CO2 and CH4 at temperatures over 500 °C is considered to increase randomness in the crystalline orientation, ultimately resulting in reduced crystallinity.
However, in this study, La continued to increase within this region. This inconsistency is likely caused by the coalescence of polyaromatic hydrocarbons (PAHs) during the removal of the oxygen- or hydrogen-containing functional groups on their surface, leading to a slight expansion in the a-axis direction.
Zone IV (800–1400 °C) is a domain in which crystallinity continues to increase. Oberlin [9] observed changes in the microstructure of pitch with respect to the heat-treatment temperature using both a polarizing microscope and TEM. The study found that with increasing heat-treatment temperature, BSUs stacked on top of each other, forming separate columns, thus increasing Lc. They also emphasized that the removal of heteroatoms, including hydrogen, resulted in a sharp increase in Lc. Considering this, Zone IV is deemed a domain in which the release of the remaining hydrogen gas within CTP leads to a continuous increase in both Lc and La.

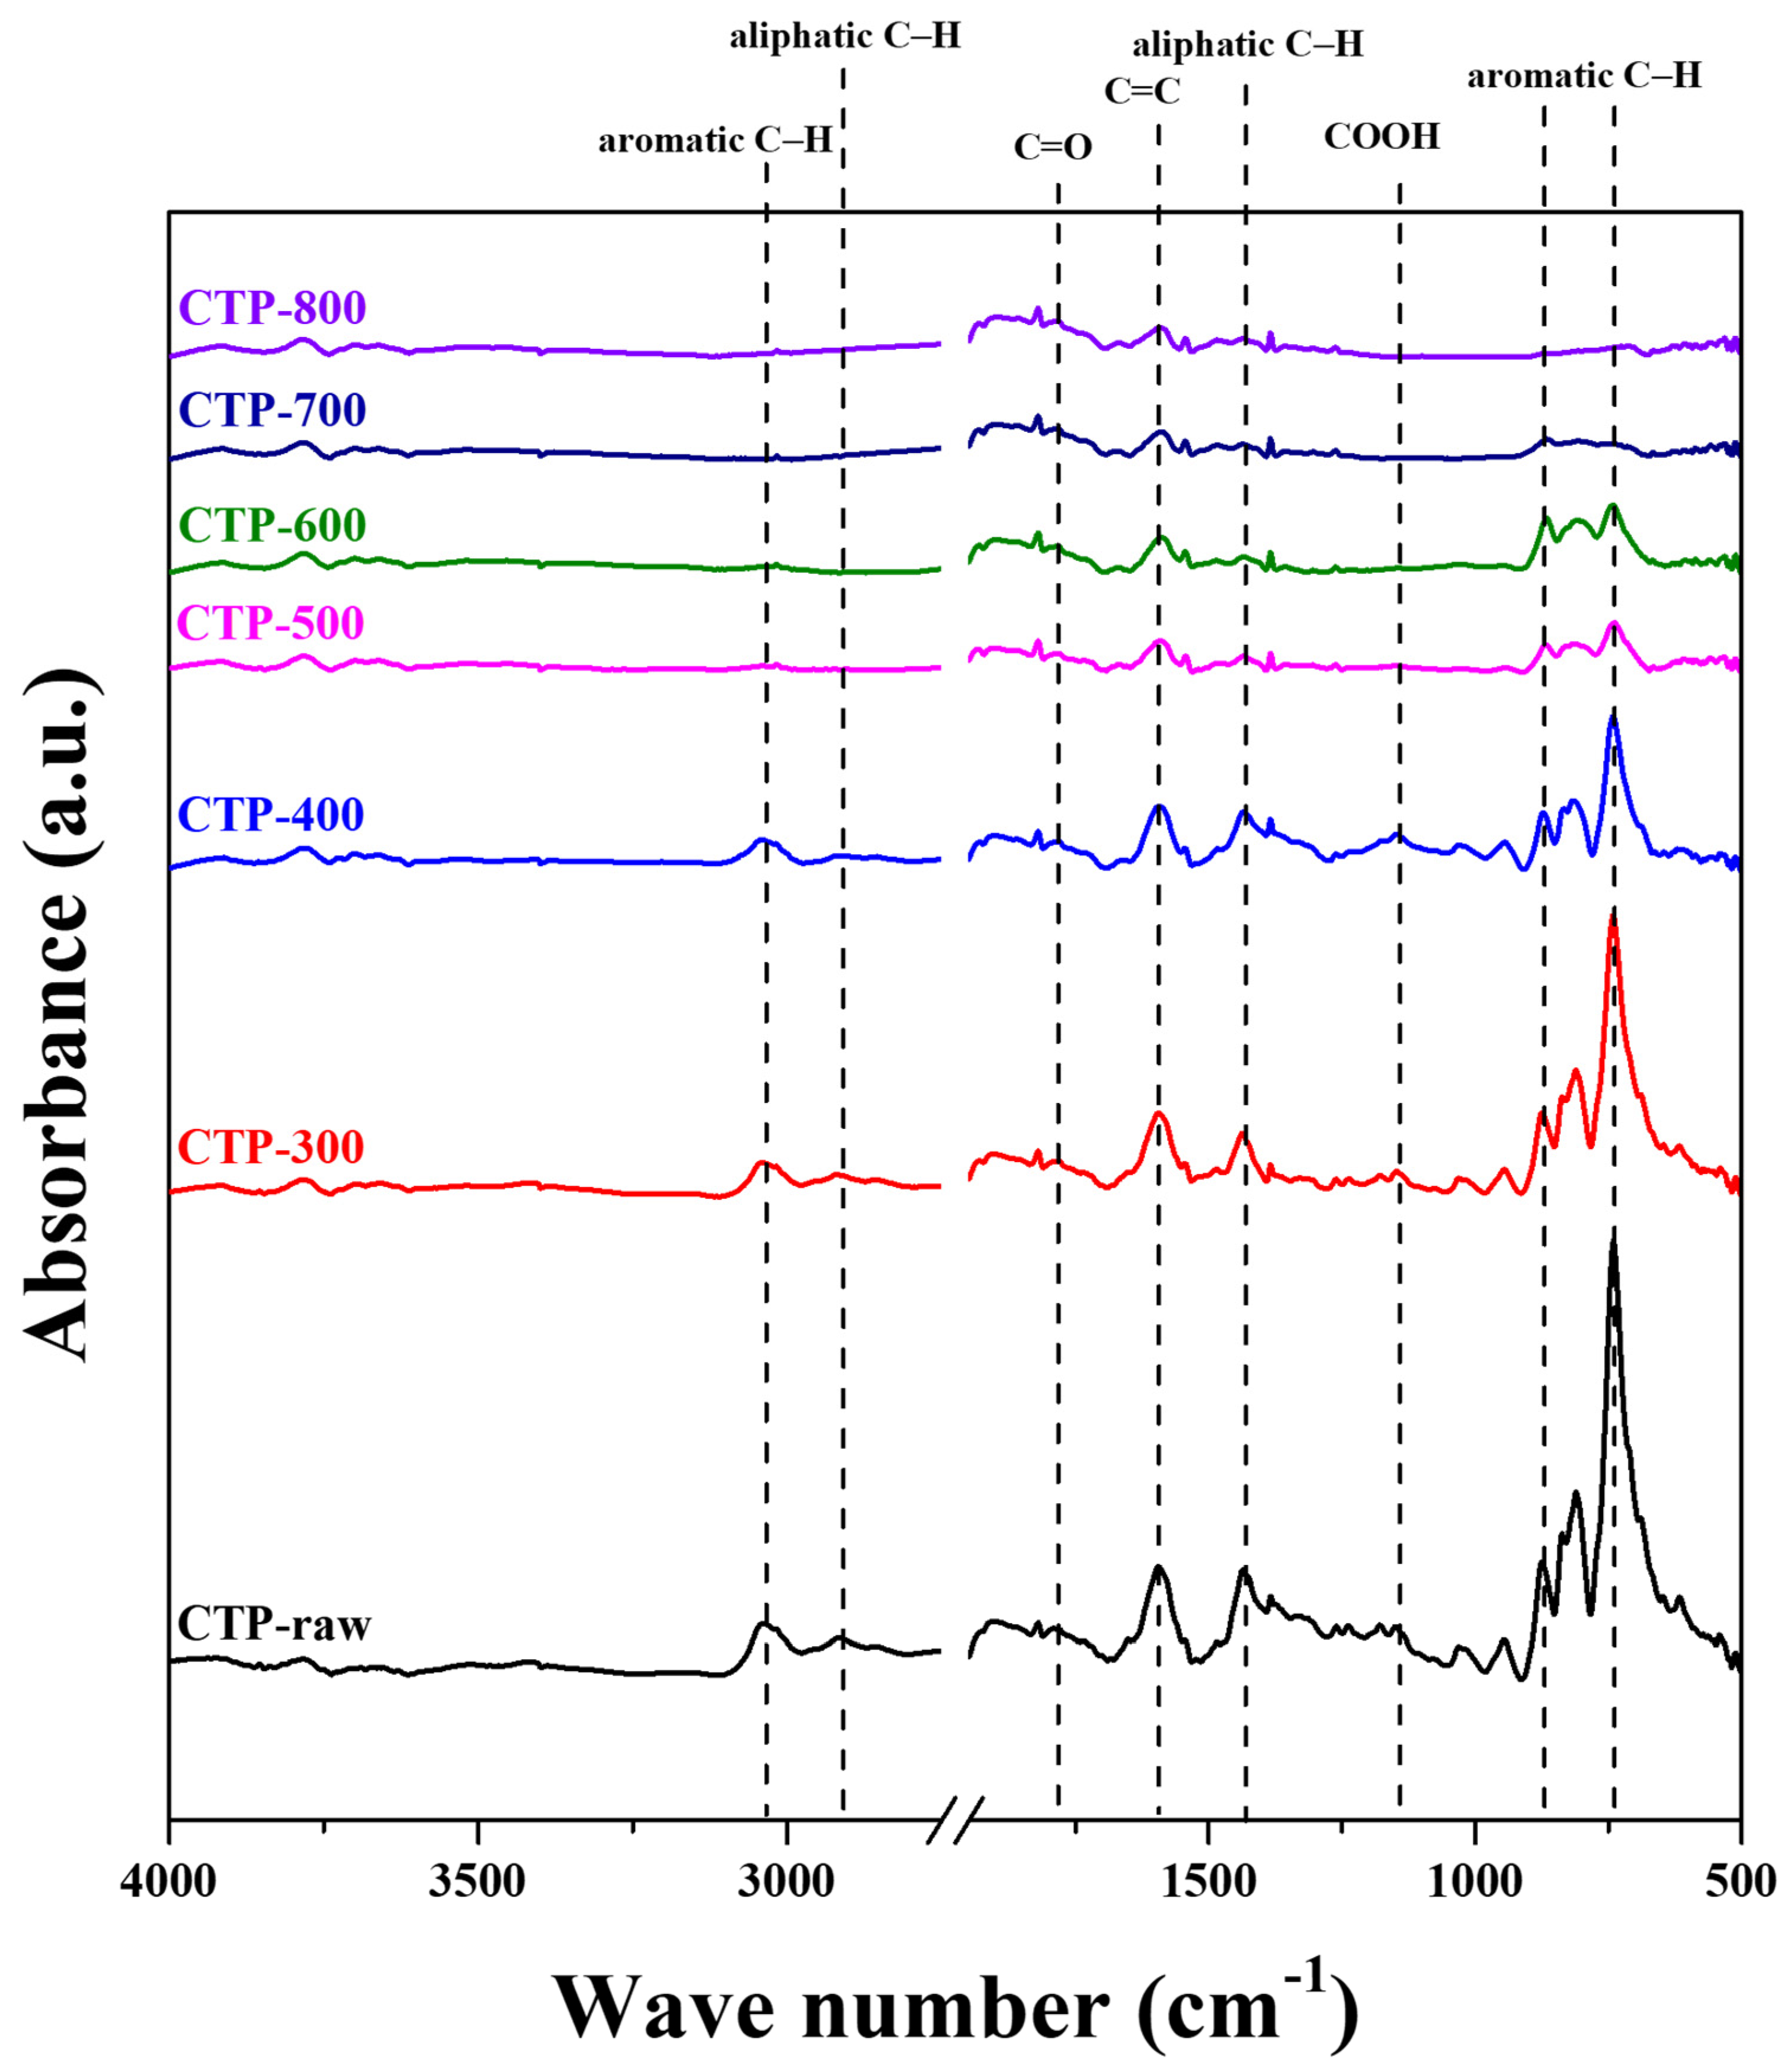
3.3. Variations in Functional Groups of CTP with Respect to Carbonization Temperature

Figure 4 shows the FTIR spectra of the CTP specimens with respect to the carbonization temperature. Changes in the intensity of absorbance peaks are summarized in Table 3. These variations in the intensity of peaks corresponding to the major functional groups observed in the FTIR analysis results can be interpreted in connection with the categorization proposed in the XRD analysis results (Zones I–IV) as follows.
In Zone 1 (up to 400 °C), as the carbonization temperature increased to 300 °C (CTP-300) and further to 400 °C (CTP-400), the peak intensity of all functional groups, including C-Har, C-Hal, C=O, and C=C, decreased; however, none of the peaks completely disappeared. Within this domain, crystallinity remained almost unchanged.
In Zone II (400–500 °C), these functional groups were modified due to the stacking of aromatic molecules and CO2 gas release. The C-Har peak at 3041 cm−1 and the C-Hal peak at 2918 cm−1 completely disappeared as the carbonization temperature increased from 400 °C to 500 °C. The disappearance of both peaks is attributed to the bonding of polycyclic aromatic hydrocarbons (PAHs) during the pyrolysis process, increasing the size of the crystallite [13], combined with the stacking of aromatic planar molecules. This process coincided with the formation of mesophase spheres, leading to a temporary increase in crystallinity. The intensity of the COOH peak at 1149 cm−1 also decreased. The peak almost disappeared when the carbonization temperature was 500 °C. This phenomenon can be attributed to the release of CO2 gas occurring around 400 °C.
In Zone III (500–800 °C), there were variations in the functional groups, which were associated with the expansion along the height direction resulting from gas release, as well as reduced crystallinity. The intensity of the C-Hal peak at 1430 cm−1 sharply decreased at 500 °C and remained almost unchanged up to a temperature of 800 °C. According to M. Dumont et al. [22], light alkanes, especially methane, are mainly formed at temperatures over 450 °C. The researchers confirmed that methane was formed at 450–750 °C and its formation was the most pronounced in the temperature range of 500–520 °C. Considering this, both the disappearance of the C-Hal peak at 2918 cm−1 and the reduction in intensity of the C-Hal peak at 1430 cm−1 observed at 500 °C were attributed to the release of the methyl group. In addition, the COOH peak completely disappeared at 600 °C due to the release of CO2 and CO gases. The major gas release occurred within this zone, and this was partly responsible for the reduced crystallinity.
In Zone IV (800 °C or higher), nearly all peaks corresponding to relevant functional groups disappeared at 800 °C; thus, only the FTIR spectra up to 800 °C were represented in Figure 5. In this zone, variations in functional groups resulting from the removal of the remaining hydrogen, known to contribute to an increase in crystallite size, were observed. The C-Har peaks below 865 cm−1 disappeared completely at 800 °C. The hydrogen, initially trapped between graphite crystal planes, was gradually released until the temperature reached 800 °C, where its release was completed. The removal of the remaining hydrogen-containing functional groups was considered to facilitate crystallization in Zone IV, as previously indicated by the XRD results (Figure 3).
The above XRD and FTIR analysis results confirm the relationship between the changes in functional groups and microstructural development observed in Zone I through Zone IV.
Meanwhile, the carbonized CTP specimens varied in height with the heat-treatment temperature. This variation was attributed to the concurrent processes of polycondensation and the release of gases (CO2, CH4, CO, and H2) during the removal of functional groups. Figure 5 shows the height change rates of the carbonized CTP specimens as a function of the heat-treatment temperature. The same categorization of the four zones as applied in the FTIR results was employed to interpret these height variations.
In Zone I, the height changes were insignificant, with a slight decrease rather than an increase. In this zone, the distillation of low-molecular-weight substances, along with the formation of mesophase spheres, occurred, resulting in no height changes. In Zone II, the largest height change was observed, with an increase of about 650% between 400 °C and 500 °C. As discussed in the XRD and FTIR results, the formation and growth of mesophase spheres coincided with the abrupt release of gases in this zone, leading to a sharp increase in height. This suggests that, especially when used as a binder material, pitch should be heated as slowly as possible while passing through this zone to prevent sharp volume changes. In Zone III, the height change rate peaked at 775% at 600 °C and then decreased until the temperature reached 800 °C. In Zone IV, a slight increase in height was observed, with this trend continuing up to a temperature of 1400 °C. Despite the release of the remaining oxygen- and hydrogen-containing gases in Zone III and Zone IV, the pitch height variations were limited.

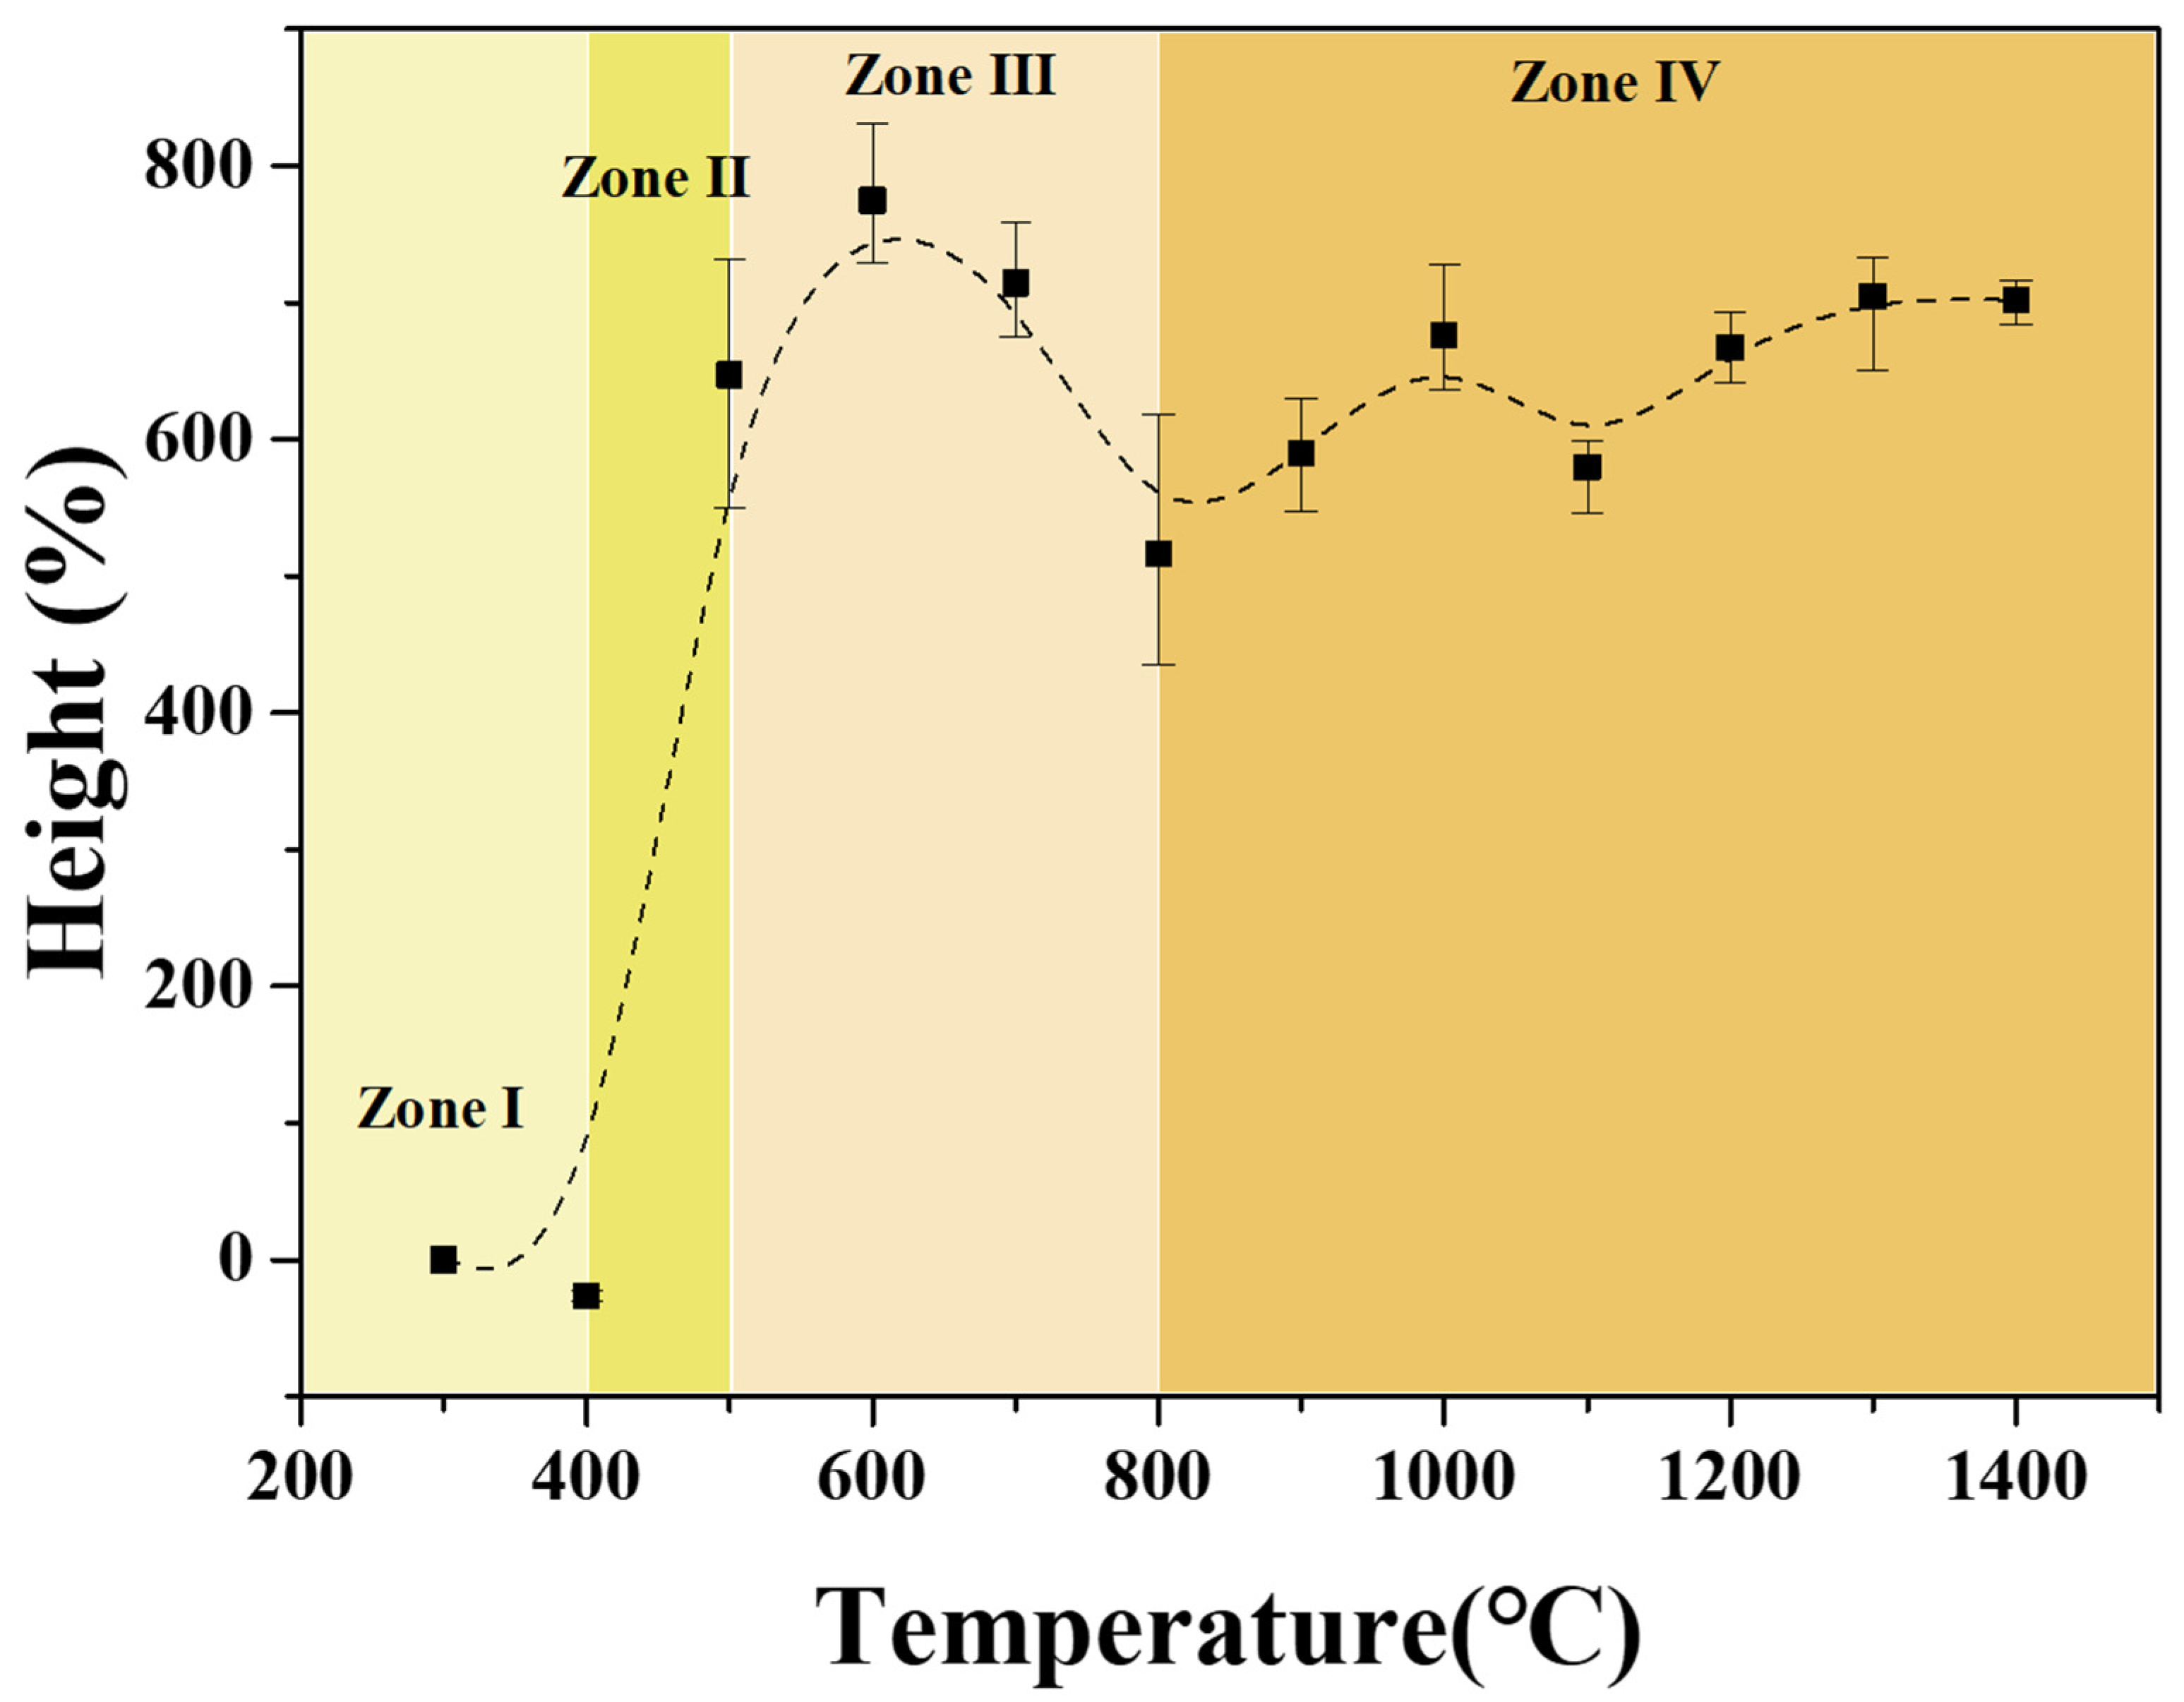
3.4. Microstructure of CTP

Figure 6 shows the microstructure of the CTP specimens, heat-treated at different temperatures, observed by an optical microscope. In CTP-300, mesophase spheres with a diameter of about 3 μm were observed. In CTP-400, however, mesophase spheres were elongated into ellipsoids with a diameter of about 7 μm. Pitch mesophase is known to undergo a cycle involving formation, growth, and coalescence, and this process is significantly affected by major parameters such as temperature, time, and pressure. A previous study confirmed that mesophase spheres with a diameter of 3 μm began to form when the pitch was heat-treated at 400 °C for one hour. However, it took at least three hours of heat treatment for these spheres to be consistently observed throughout the matrix. Given that in this study, the heat-treatment duration was fixed at one hour for each condition, it is likely that insufficient time was allowed for mesophase spheres to fully form and grow. Consequently, the mesophase spheres were localized rather than being consistently observed through the entire matrix.
CTP-500 exhibited a mosaic microstructure as the liquid–crystal stage ceased beyond 500 °C. This microstructural analysis confirmed the formation and growth of mesophase spheres at 300–500 °C, providing a further explanation for the enhancement of crystallinity observed in the same temperature range, as suggested in the XRD results above.

3.5. Crystallinity of Mesophase Using Raman Spectroscopy

Raman spectroscopy was used to confirm the increase in crystallinity due to mesophase formation in the pitch. Figure 7 presents the results of the Raman spectroscopy analysis in Zone I and Zone II (Raw, CTP-300, CTP-400, and CTP-500). In Figure 7a, the raw CTP showed a weak D-band and a very broad asymmetric G-band. In CTP-300, the D-band was gradually observed and the G-band was symmetrical. The very broad asymmetry of the G-band is due to the amorphous carbon [27] and it is believed that the symmetry of the G-band increases as mesophase spheres are created and grow from CTP-300.
In Zone I (–400 °C), the ID/IG value remained nearly unchanged. However, a sharp decrease was observed in Zone II (400–500 °C). This pattern corresponds with the findings in the XRD results. The ID/IG reduction was particularly pronounced in CTP-400, aligning with the significant formation of mesophase at that specific temperature.

4. Conclusions

In this study, CTP, used as a binder material for synthetic graphite blocks, underwent carbonization at different temperatures ranging from 300 to 1400 °C. The resulting changes in their functional groups were observed and their effect on microstructural development was examined. The major findings of this study are as follows.
Up to a temperature of 500 °C, sharp weight losses were observed, along with a height change of 650%. In nearly all functional groups, a sharp peak intensity reduction was observed up to 500 °C, which was attributed to both the pyrolysis and polymerization processes. The formation of mesophase spheres led to enhanced crystallinity.
At temperatures of 500 °C or above, a temporary reduction in crystallinity was observed, which coincided with the release of CH4, CO2, and CO gases. This sharp gas release was considered to affect the crystal structure of the resulting carbon materials.
The major findings of this study are expected to provide valuable insights for designing highly efficient processes in the manufacturing of synthetic graphite blocks while utilizing CTP as a binder material. Specifically, it is critical to minimize any potential volume expansion or crystallinity degradation during the release of gases from CTP. This can be achieved by reducing the heating rate to the lowest possible level as it approaches 500 °C. Selecting a final carbonization temperature of 600 °C or higher ensures adequate binder strength, ultimately enhancing the strength of the resulting carbonized products. Subsequent graphitization processes will then lead to the production of graphitized products with the best quality.

Author Contributions

Methodology, S.-H.L.; Investigation, S.-H.L.; Data curation, S.-H.L.; Conceptualization, S.-H.L.; Formal analysis, S.-H.L.; Writing—original draft, S.-H.L.; Writing—review and editing, J.-S.R.; Supervision, J.-S.R.; Project administration, J.-S.R.; Funding acquisition, J.-S.R. All authors have read and agreed to the published version of the manuscript.

Funding

This research was supported by the Kumoh National Institute of Technology (2021).

Data Availability Statement

The original contributions presented in the study are included in the article; further inquiries can be directed to the corresponding author.

Conflicts of Interest

The authors declare no conflicts of interest.

References

  1. Edwards, I.A.S.; Marsh, H.; Menendez, R. Introduction to Carbon Science; Butterworths-Heinemann: Oxford, UK, 2009; p. 12. [Google Scholar]
  2. Kim, J.H. Control of the properties of a binder pitch to enhance the density and strength of graphite blocks. Carbon Lett. 2023, 33, 1757–1766. [Google Scholar] [CrossRef]
  3. Kim, J.H.; Choi, Y.J.; Im, J.S.; Jo, A.; Lee, K.B.; Bai, B.C. Study of activation mechanism for dual model pore structured carbon based on effects of molecular weight of petroleum pitch. J. Ind. Eng. Chem. 2020, 88, 251–259. [Google Scholar] [CrossRef]
  4. Kremer, H.A. Recent developments in electrode pitch and coal tar technology. Chem. Ind. 1983, 18, 702–703. [Google Scholar]
  5. Brooks, J.D.; Taylor, G.H. The formation of graphitizing carbons from the liquid phase. Carbon 1965, 3, 185–186. [Google Scholar] [CrossRef]
  6. Marković, V. Use of coal tar pitch in carboncarbon composites. Fuel 1987, 66, 1512–1515. [Google Scholar] [CrossRef]
  7. Mochida, I.; Korai, Y.; Ku, C.H.; Watanabe, F.; Sakai, Y. Chemistry of synthesis, structure, preparation and application of aromatic-derived mesophase pitch. Carbon 2000, 38, 305–328. [Google Scholar] [CrossRef]
  8. Lim, C.; Ko, Y.; Kwak, C.H.; Kim, S.; Lee, Y.S. Mesophase pitch production aided by the thermal decomposition of polyvinylidene fluoride. Carbon Lett. 2022, 32, 1329–1335. [Google Scholar] [CrossRef]
  9. Oberlin, A. Carbonization and graphitization. Carbon 1984, 22, 521–541. [Google Scholar] [CrossRef]
  10. Yang, J.Y.; Park, S.H.; Park, S.J.; Seo, M.K. Preparation and characteristic of Carbon/Carbon composites with Coa-tar and petroleum binder pitches. Appl. Chem. Eng. 2015, 26, 406–412. [Google Scholar] [CrossRef]
  11. Zhang, W.; Li, T.; Lu, M.; Hou, C. A comparative study of the characteristics and carbonization behaviors of three modified coal tar pitches. New Carbon Mater. 2013, 28, 140–144. [Google Scholar] [CrossRef]
  12. Guillén, M.D.; Iglesias, M.J.; Domínguez, A.; Blanco, C.G. Fourier transform infrared study of coal tar pitches. Fuel 1995, 74, 1595–1598. [Google Scholar] [CrossRef]
  13. Lin, Q.; Su, W.; Xie, Y. Effect of rosin to coal-tar pitch on carbonization behavior and optical texture of resultant semi-cokes. J. Anal. Appl. Pyrolysis 2009, 86, 8–13. [Google Scholar] [CrossRef]
  14. Prauchner, M.J.; Pasa, V.M.D.; Molhallem, N.D.S.; Otani, C.; Otani, S.; Pardini, L.C. Structural evolution of Eucalyptus tar pitch-based carbons during carbonization. Biomass Bioenergy 2005, 28, 53–61. [Google Scholar] [CrossRef]
  15. Liu, S.; Xue, J.; Liu, X.; Chen, H.; Li, X. Pitch derived graphene oxides: Characterization and effect on pyrolysis and carbonization of coal tar pitch. J. Anal. Appl. Pyrolysis 2020, 145, 104746. [Google Scholar] [CrossRef]
  16. Mongem, J.A.; Amorós, D.C.; Solano, A.L. Characterisation of coal tar pitches by thermal analysis, infrared spectroscopy and solvent fractionation. Fuel 2001, 80, 41–48. [Google Scholar]
  17. Guillen, M.D.; Iglesias, M.J.; Dominguez, A.; Blanco, C.G. Semiquantitative FTIR analysis of coal tar pitch and its extracts and residues in several organic solvents. Energy Fuels 1992, 6, 518–525. [Google Scholar] [CrossRef]
  18. Li, Q.; Han, D.; Qiao, H.; Shi, W.; Zhang, Y.; Cao, Z. Structural evolution of the thermal conversion products of modified coal tar pitch. Carbon Lett. 2023, 33, 261–271. [Google Scholar] [CrossRef]
  19. Lee, S.H.; Kang, D.S.; Lee, S.M.; Roh, J.S. X-ray diffraction analysis of the effect of ball milling time on crystallinity of milled polyacrylonitrile-based carbon fiber. Carbon Lett. 2018, 26, 11–17. [Google Scholar]
  20. Fuente, E.; Menéndez, J.A.; Díez, M.A.; Suárez, D.; Montes-Morán, M.A. Infrared spectroscopy of carbon materials: A quantum chemical study of model compounds. J. Phys. Chem. B 2003, 107, 6350–6359. [Google Scholar] [CrossRef]
  21. Pérez, M.; Granda, M.; Santamaría, R.; Morgan, T.; Menéndez, R. A thermoanalytical study of the co-pyrolysis of coal-tar pitch and petroleum pitch. Fuel 2004, 83, 1257–1265. [Google Scholar] [CrossRef]
  22. Dumont, M.; Dourges, M.A.; Bourrat, X.; Pailler, R.; Naslain, R.; Babot, O.; Birot, M.; Pillot, J.P. Carbonization behaviour of modified synthetic mesophase pitches. Carbon 2005, 43, 2277–2284. [Google Scholar] [CrossRef]
  23. Wakabayashi, K.; Yoshii, T.; Nishihara, H. Quantitative study on catalysis of unpaired electrons in carbon edge sites. Carbon 2023, 210, 118069. [Google Scholar] [CrossRef]
  24. Ishii, T.; Kashihara, S.; Hoshikawa, Y.; Ozaki, J.; Kannari, N.; Takai, K.; Enoki, T.; Kyotani, T. A quantitative analysis of carbon edge sites and an estimation of graphene sheet size in high-temperature treated, non-porous carbons. Carbon 2014, 80, 135–145. [Google Scholar] [CrossRef]
  25. Honda, H.; Kimura, H.; Sanada, Y.; Sugawara, S.; Furuta, T. Optical mesophase texture and X-ray diffraction pattern of the early-stage carbonization of pitches. Carbon 1970, 8, 181–182. [Google Scholar] [CrossRef]
  26. Marsh, H.; Martínez-Escandell, M.; Rodríguez-Reinoso, F. Semicokes from pitch pyrolysis: Mechanisms and kinetics. Carbon 1999, 37, 363–390. [Google Scholar] [CrossRef]
  27. Cottinet, D.; Couderc, P.; Saint Romain, J.L. Raman microprobe study of heat-treated pitches. Carbon 1988, 26, 339–344. [Google Scholar] [CrossRef]
Figure 1. (a) Weight changes measured by TG-DTG analysis and (b) carbonization yield measured in tube furnaces.
Crystals 14 00122 g001
Figure 2. Unaided visual inspection of CTP bodies carbonized at different temperatures.
Crystals 14 00122 g002
Figure 3. XRD parameters of CTP (a) d002, (b) Lc, and (c) La.
Crystals 14 00122 g003
Figure 4. FTIR spectra of CTP with respect to the carbonization temperature.
Crystals 14 00122 g004
Figure 5. Height change rates of CTP as a function of heat-treatment temperature.
Crystals 14 00122 g005
Figure 6. Microstructure of CTP specimens heat-treated at different temperatures: (a) raw, (b) 300 °C, (c) 400 °C, and (d) 500 °C with a scale bar of 10 µm.
Crystals 14 00122 g006
Figure 7. Raman spectroscopy of CTP (a) Raman spectra, (b) ID/IG of CTP as a function of carbonization temperature.
Crystals 14 00122 g007
Table 1. Main characteristics of CTP used in this study.
Softening point (°C)115.3
Toluene insoluble, TI (%)34.0
Quinoline insoluble, QI (%)12.1
Coking value (%)53.2
Ash (%)0.6
Table 2. Types of functional groups [16,17,20].
Wavenumber (cm−1)Functional Group
3000–3100Aromatic C-H bond stretching
2800–2980Aliphatic C-H bond stretching
1780C=O stretching
1600Aromatic C=C stretching
1440Aliphatic C-H bond bending
1135-COOH
700–900Aromatic C-H out of plane bending
Table 3. Analysis of FTIR spectra.
Temp.
(°C)
Absorbance Peak Intensity
C-Har
(3041 cm−1)
C-Hal
(2918 cm−1)
C=O
(1790 cm−1)
C=C
(1590 cm−1)
C-Hal
(1435 cm−1)
COOH
(1149 cm−1)
C-Har
(741 cm−1)
Raw0.0340.0240.0310.0730.0710.0320.296
3000.0220.0130.0220.0550.0410.0150.191
4000.0190.0080.0180.0420.0380.0220.104
500N.D.N.D.0.0120.0210.0110.0040.033
600N.D.N.D.0.0180.0240.011N.D.0.046
700N.D.N.D.0.0200.0190.010N.D.0.010
800N.D.N.D.0.0240.0190.012N.D.N.D.
Disclaimer/Publisher’s Note: The statements, opinions and data contained in all publications are solely those of the individual author(s) and contributor(s) and not of MDPI and/or the editor(s). MDPI and/or the editor(s) disclaim responsibility for any injury to people or property resulting from any ideas, methods, instructions or products referred to in the content.

