
Lattice Parameter Evolution during the β-to-α and β-to-ω Transformations of Iron- and Aluminum-Modified Ti-11Cr(at.%)

 ,
,
Abstract
:1. Introduction
2. Materials and Methods
3. Results
3.1. Microstructural Evolution Evaluated by In Situ High-Temperature XRD (HTXRD)
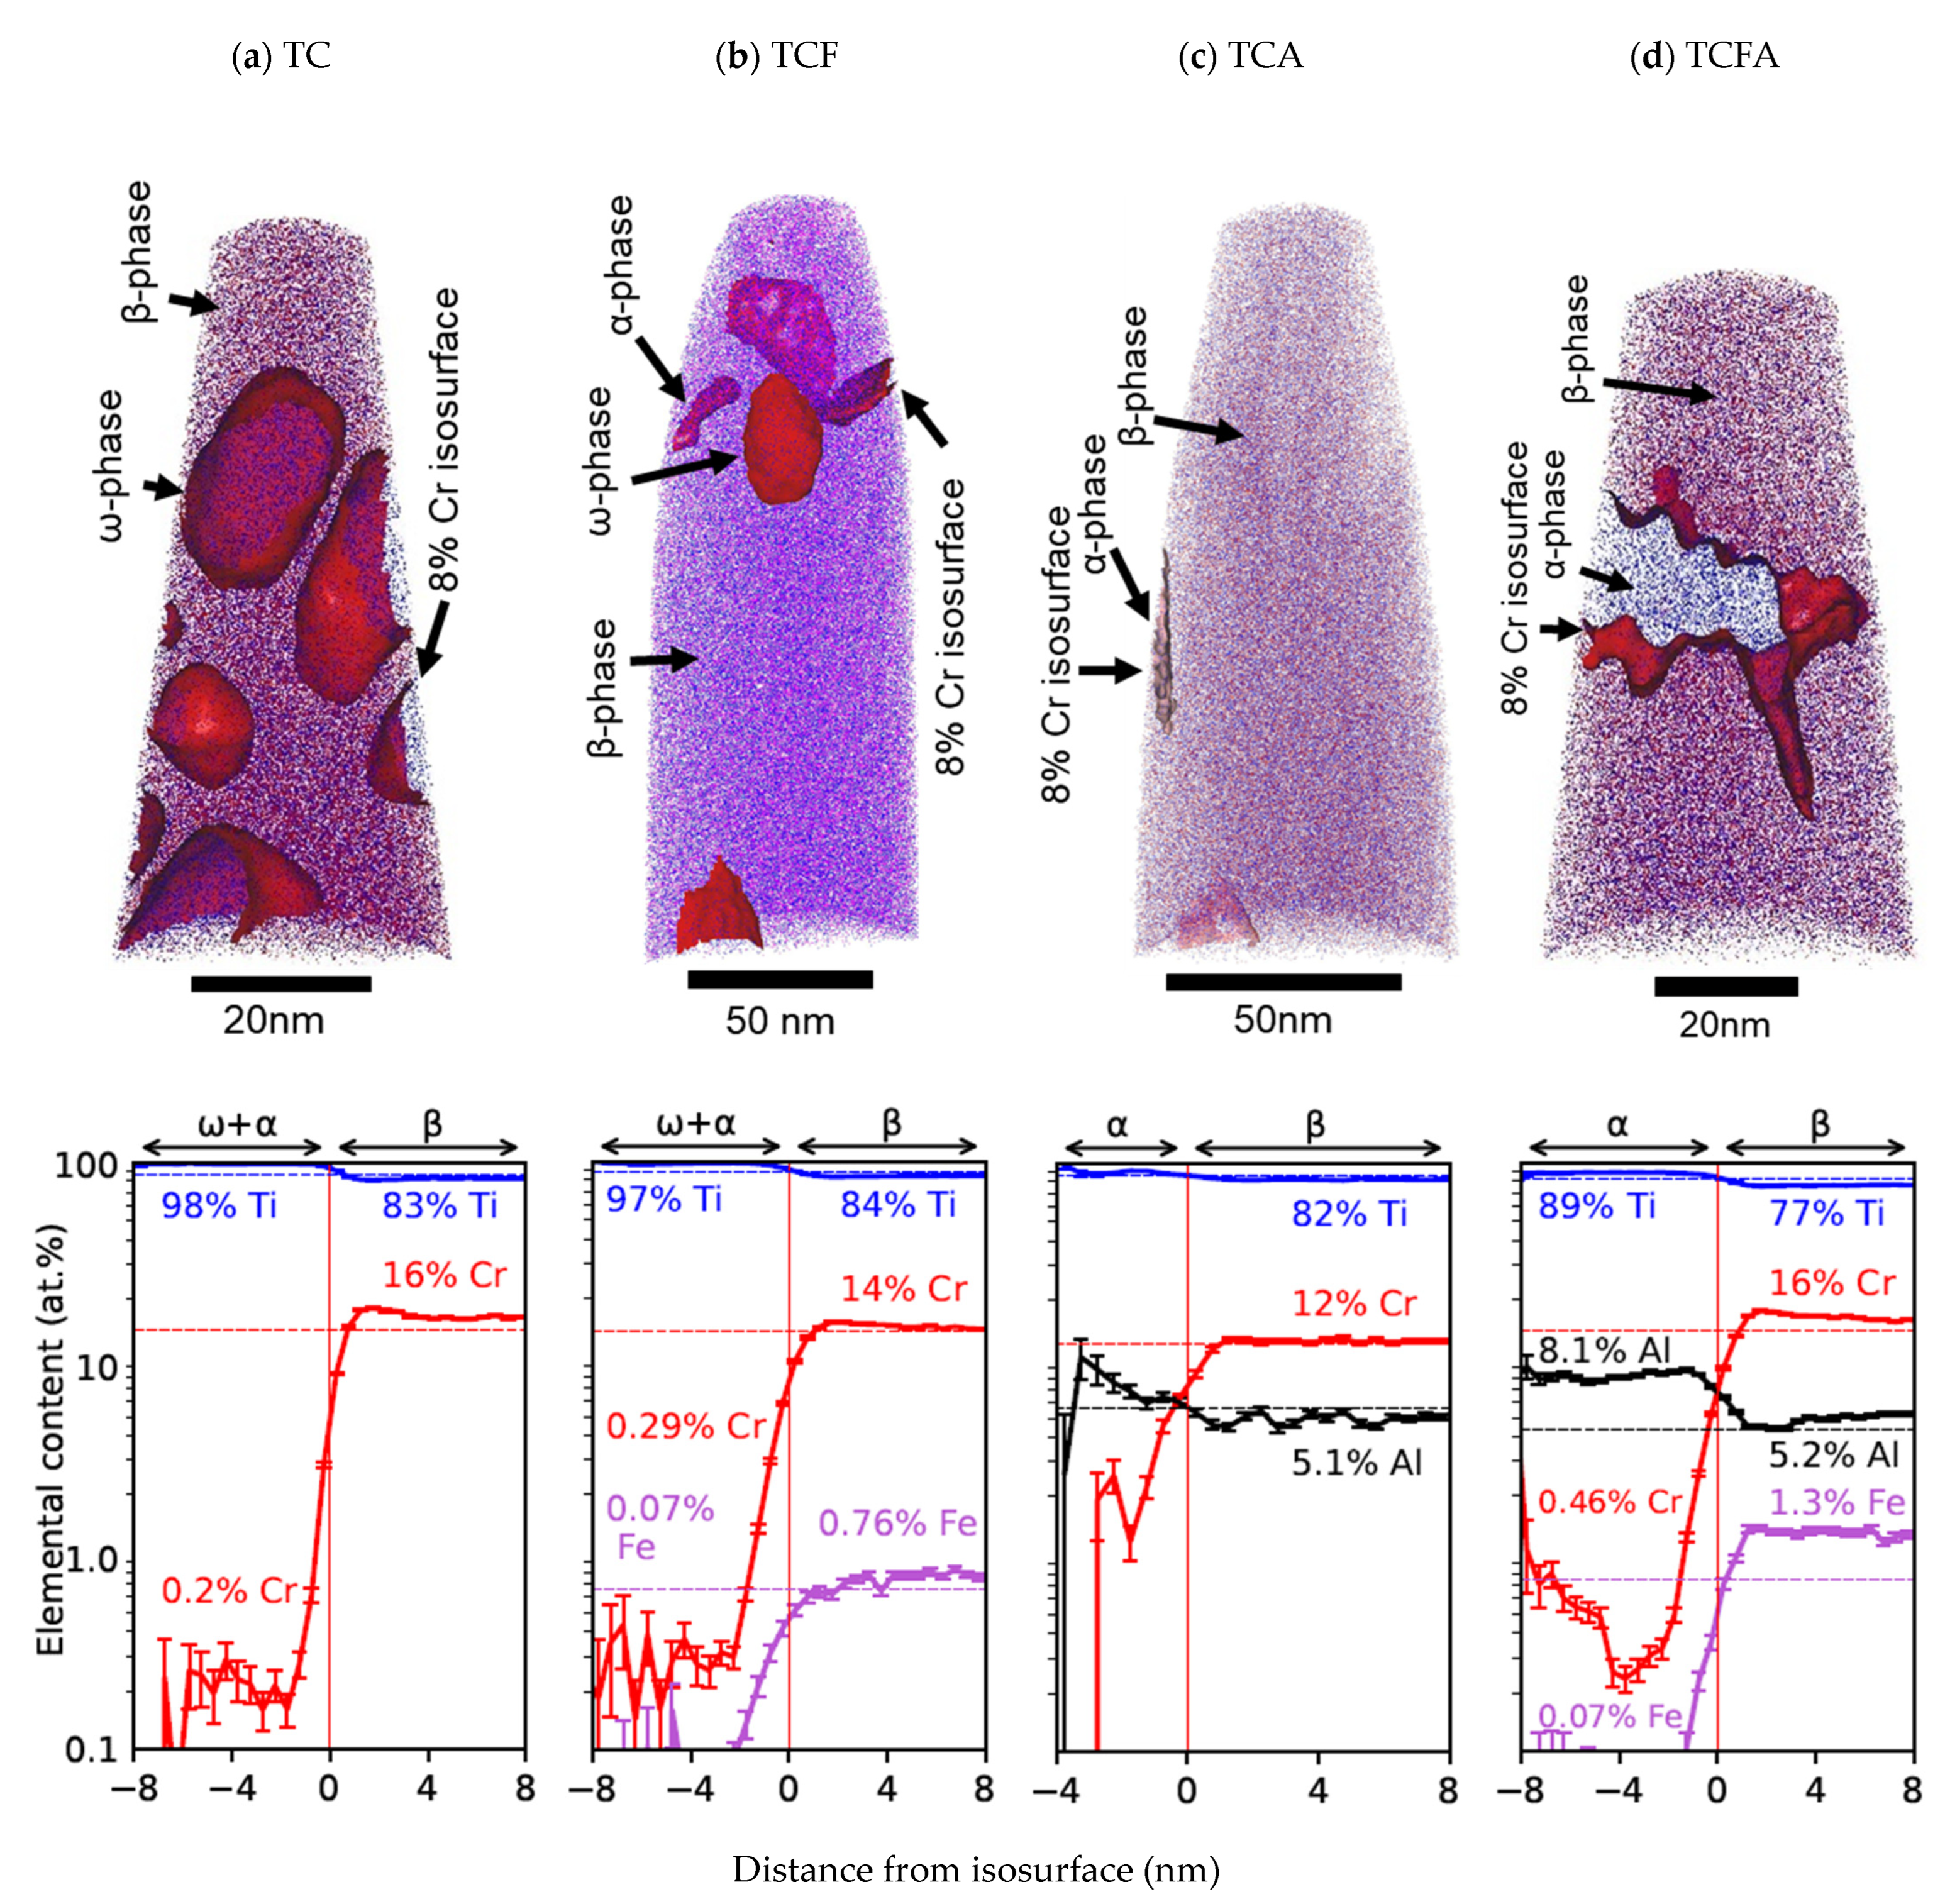
3.2. Phase Composition Evolution Evaluated by Atom Probe Tomography
4. Discussion
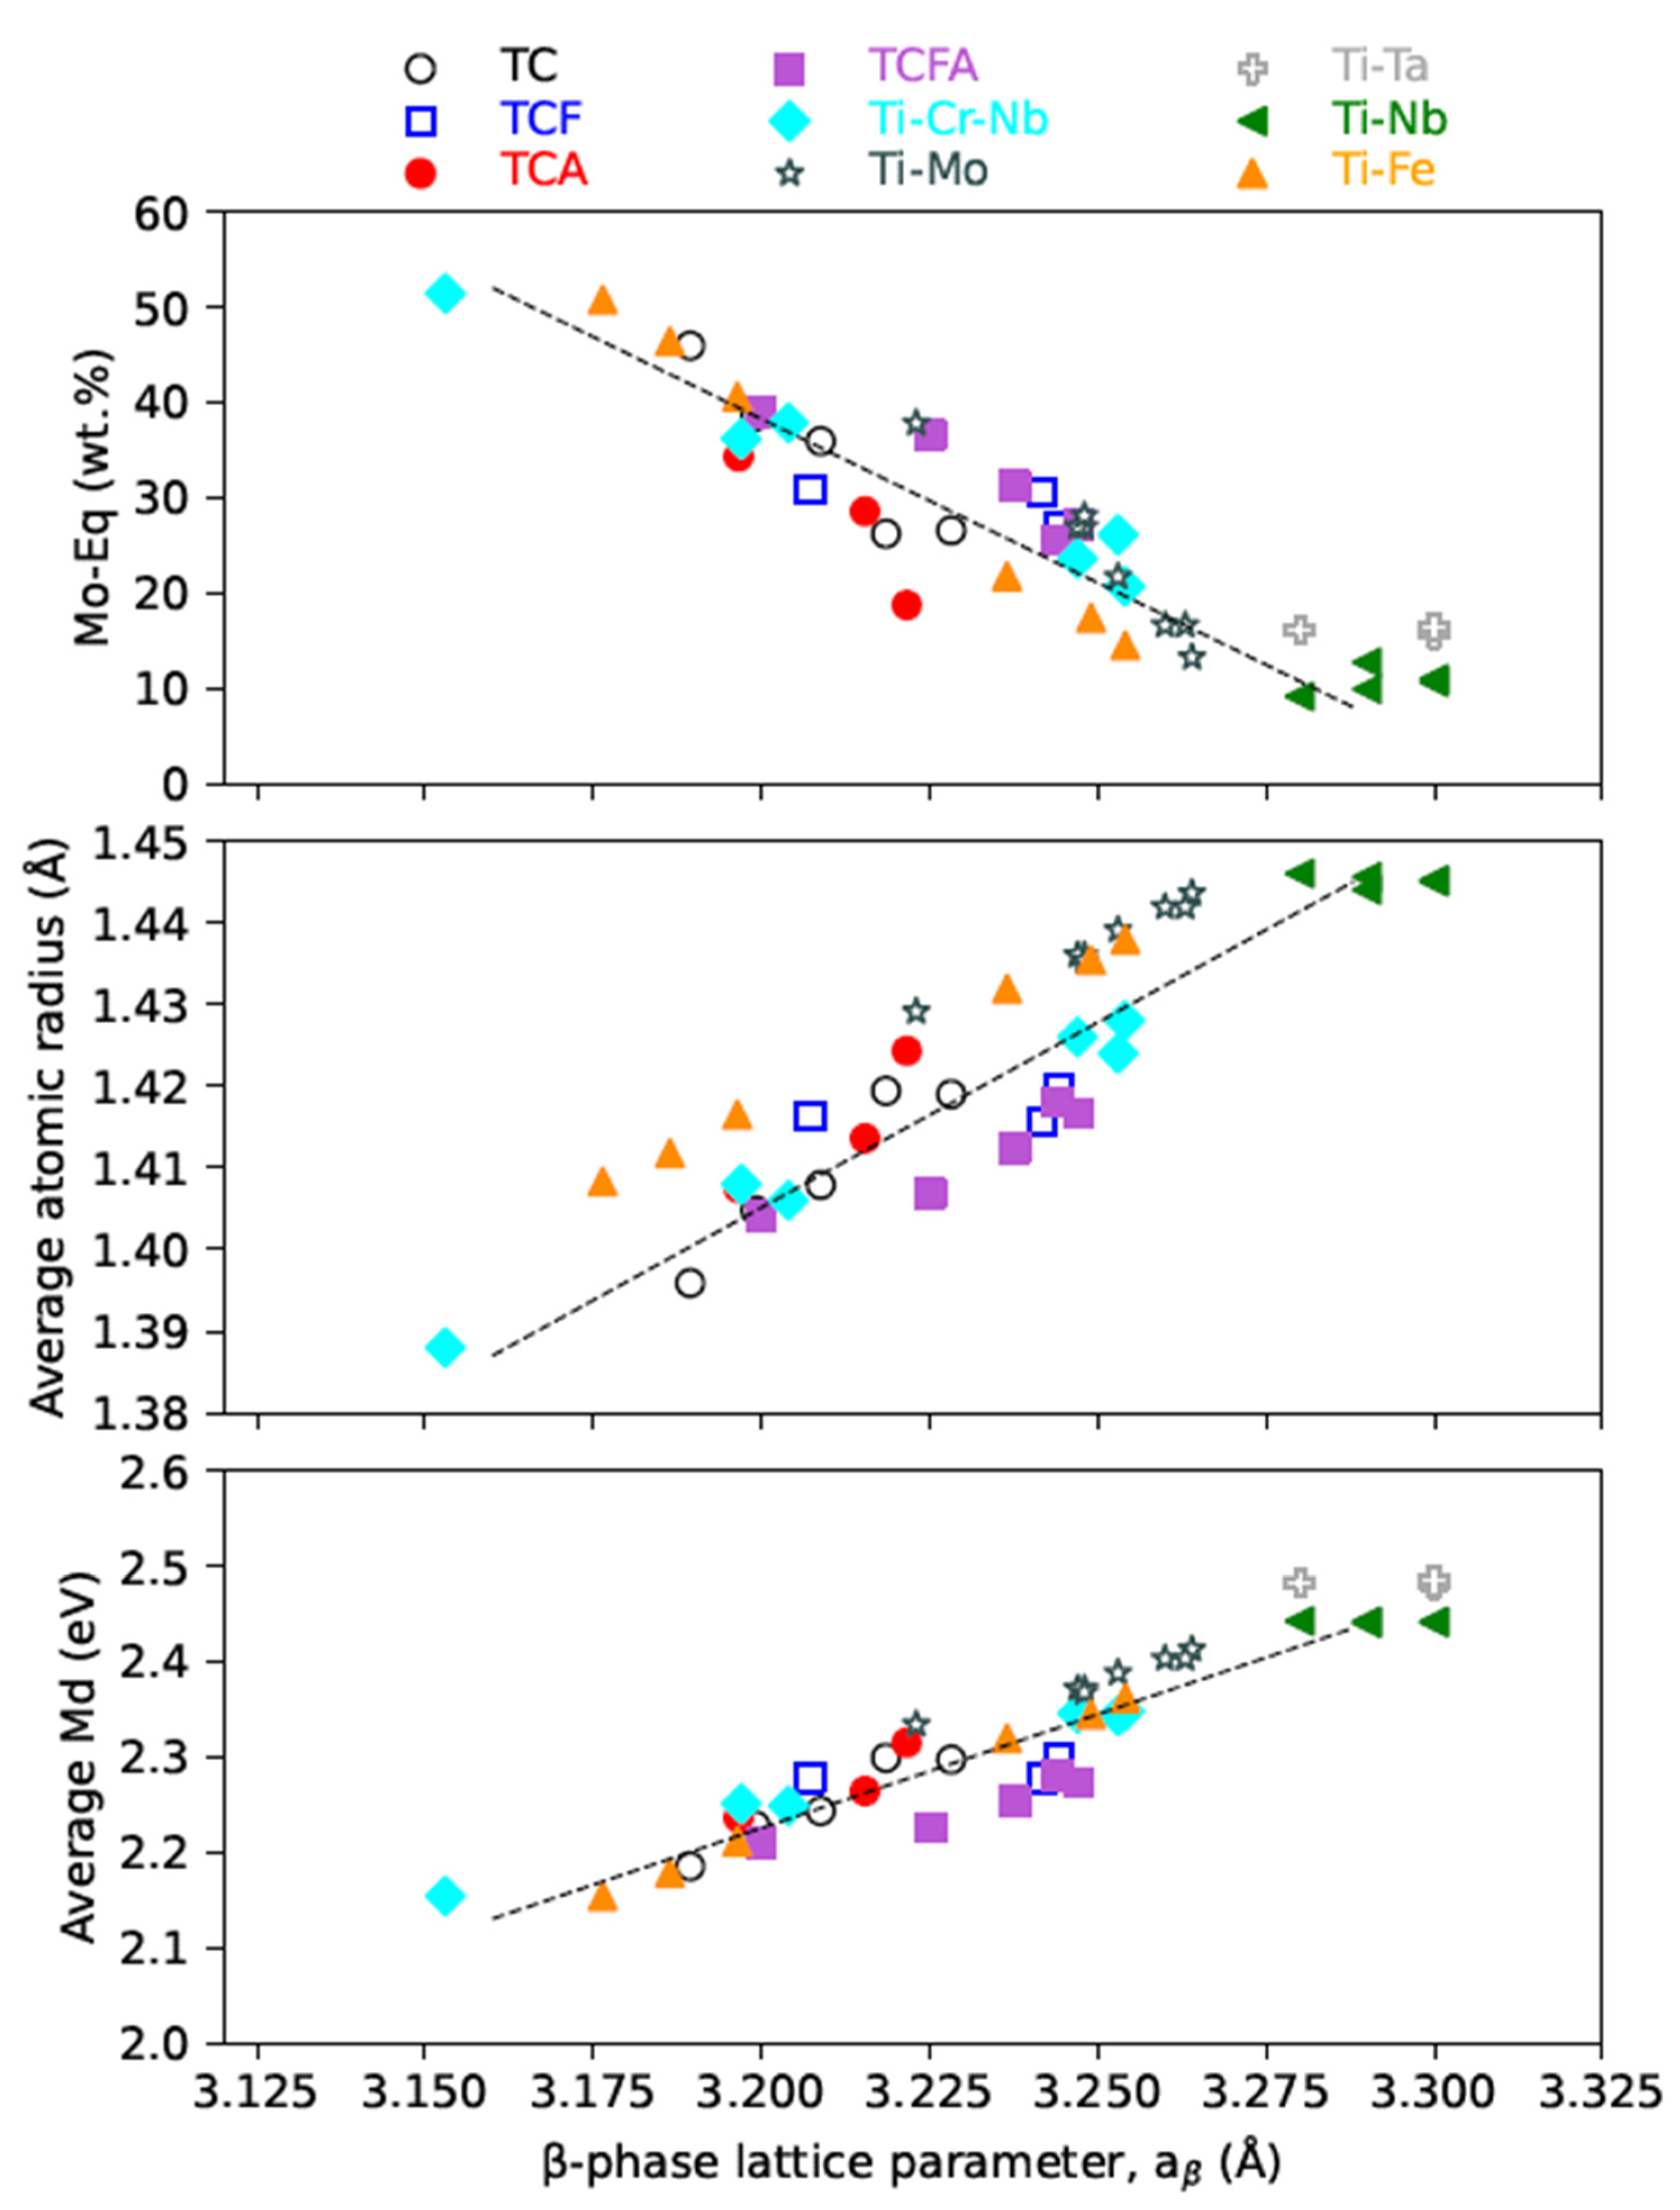
4.1. The β Phase
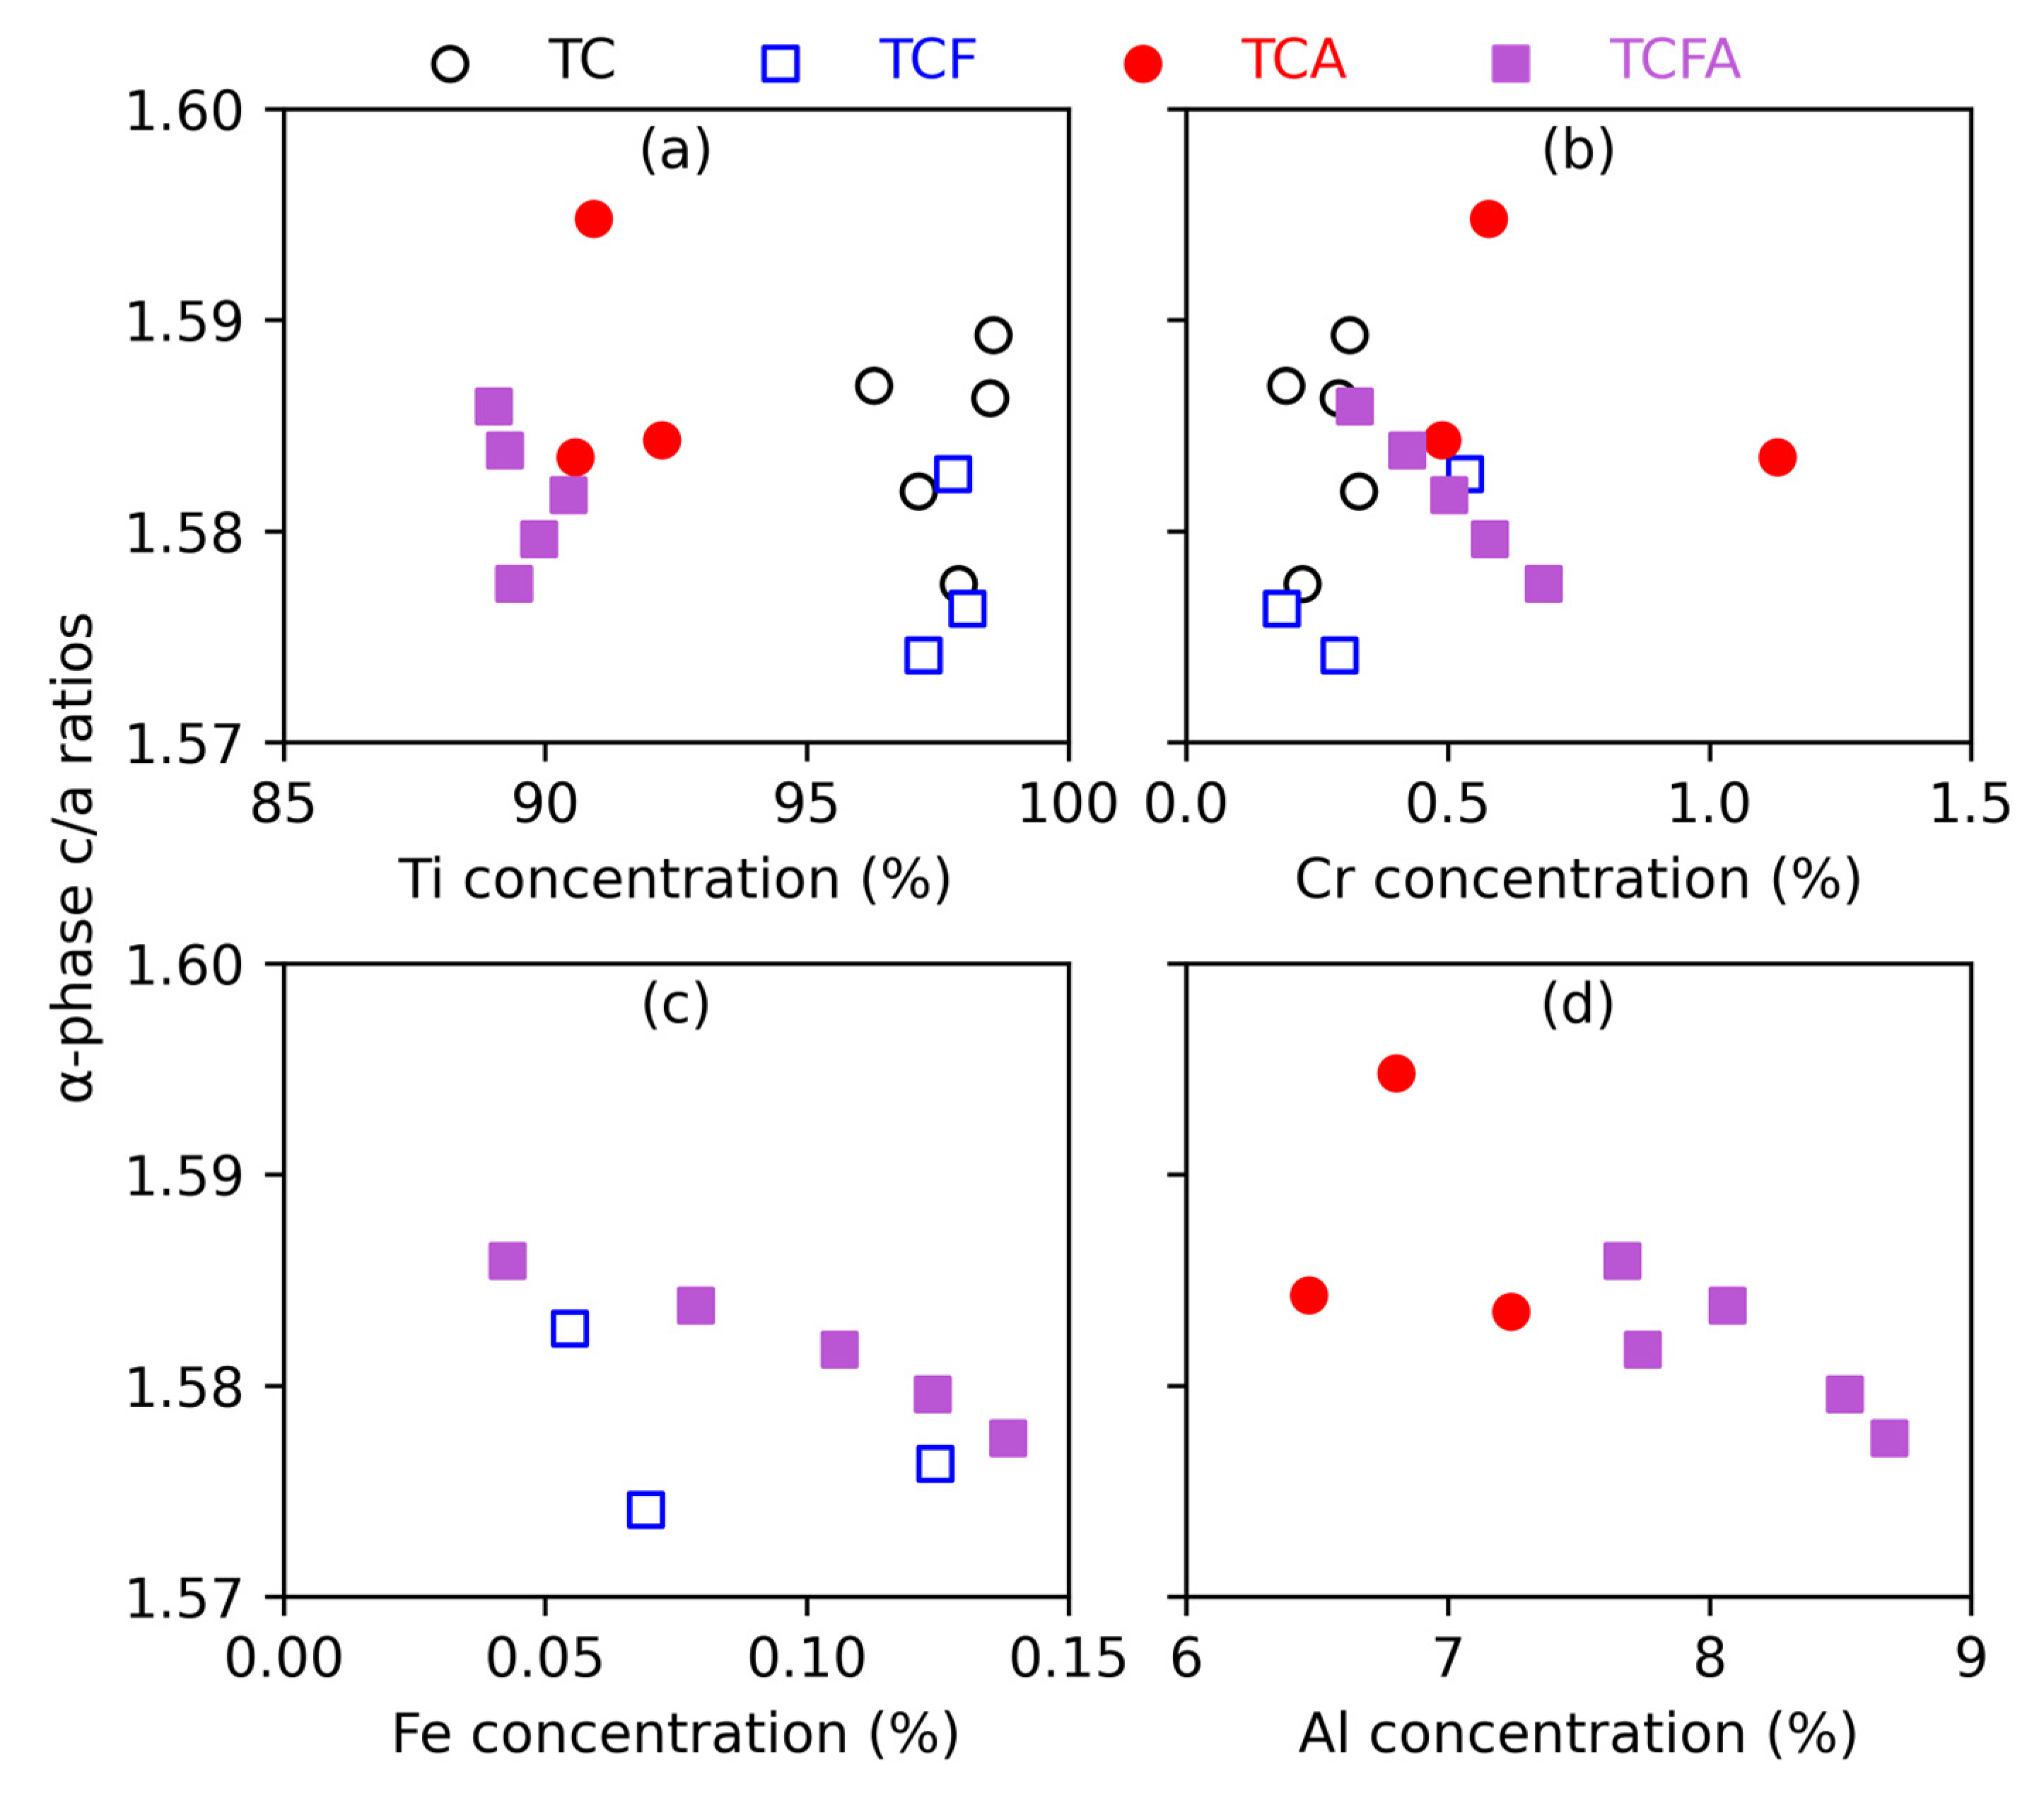
4.2. The α Phase
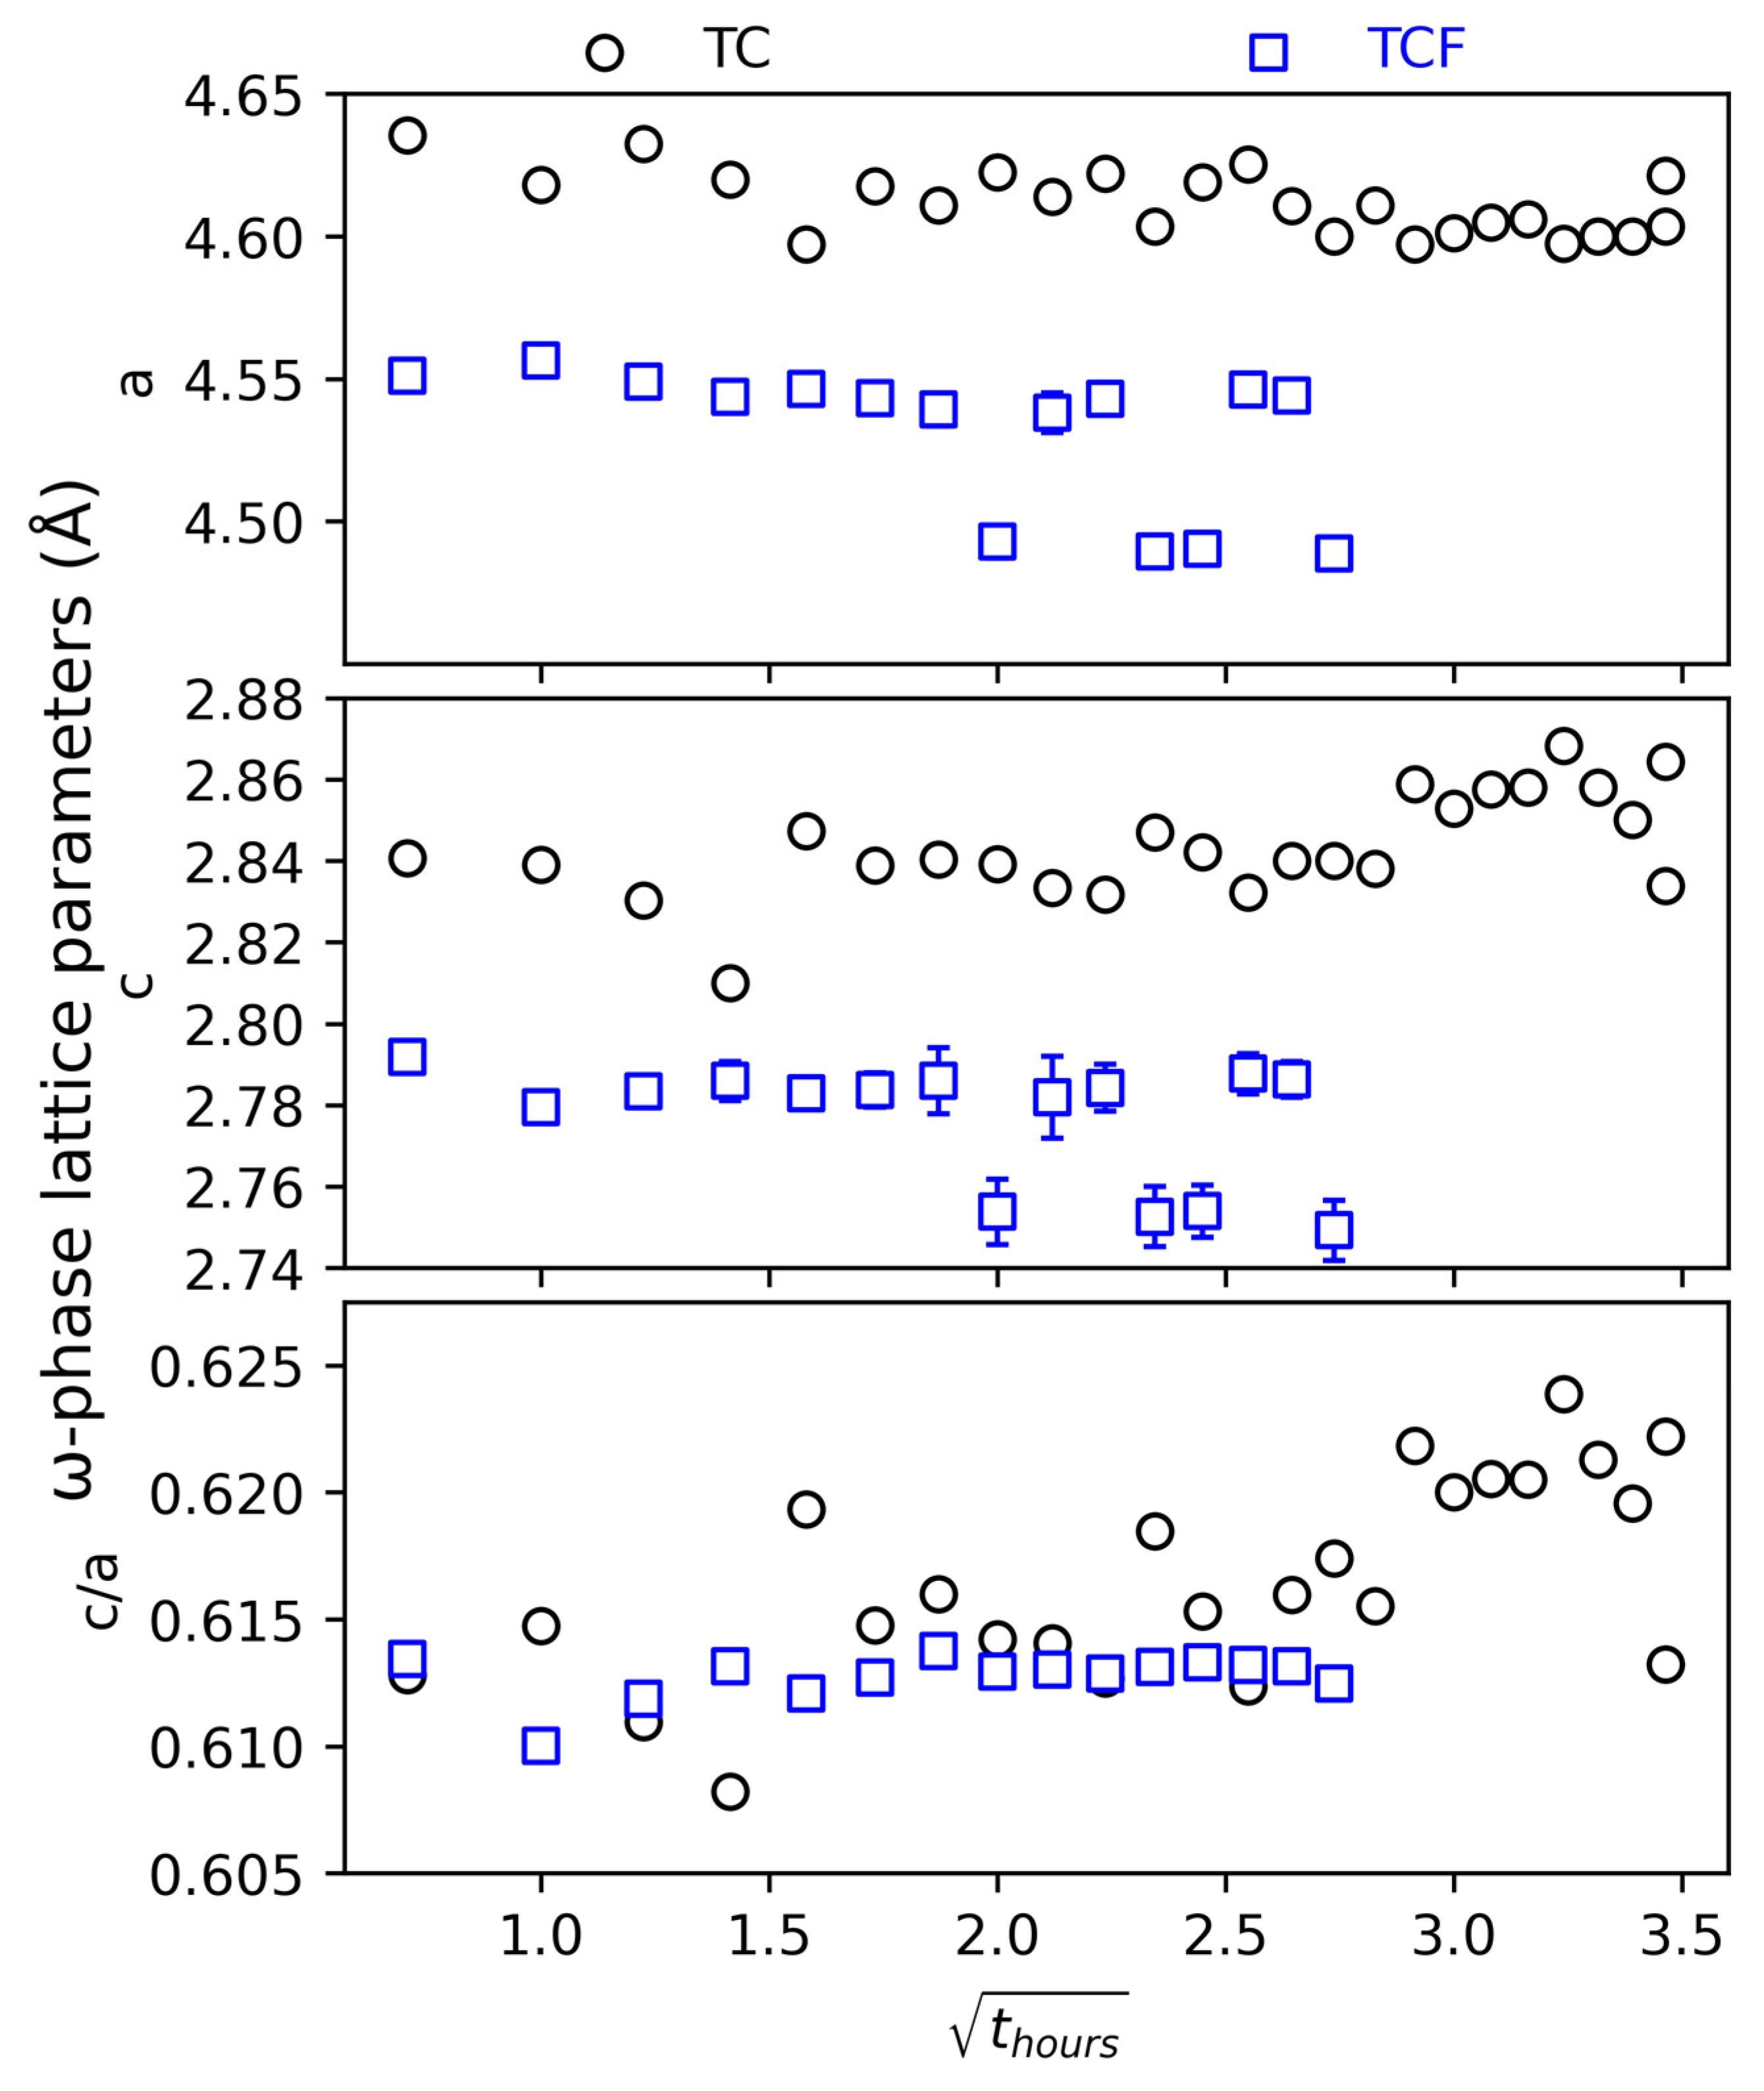
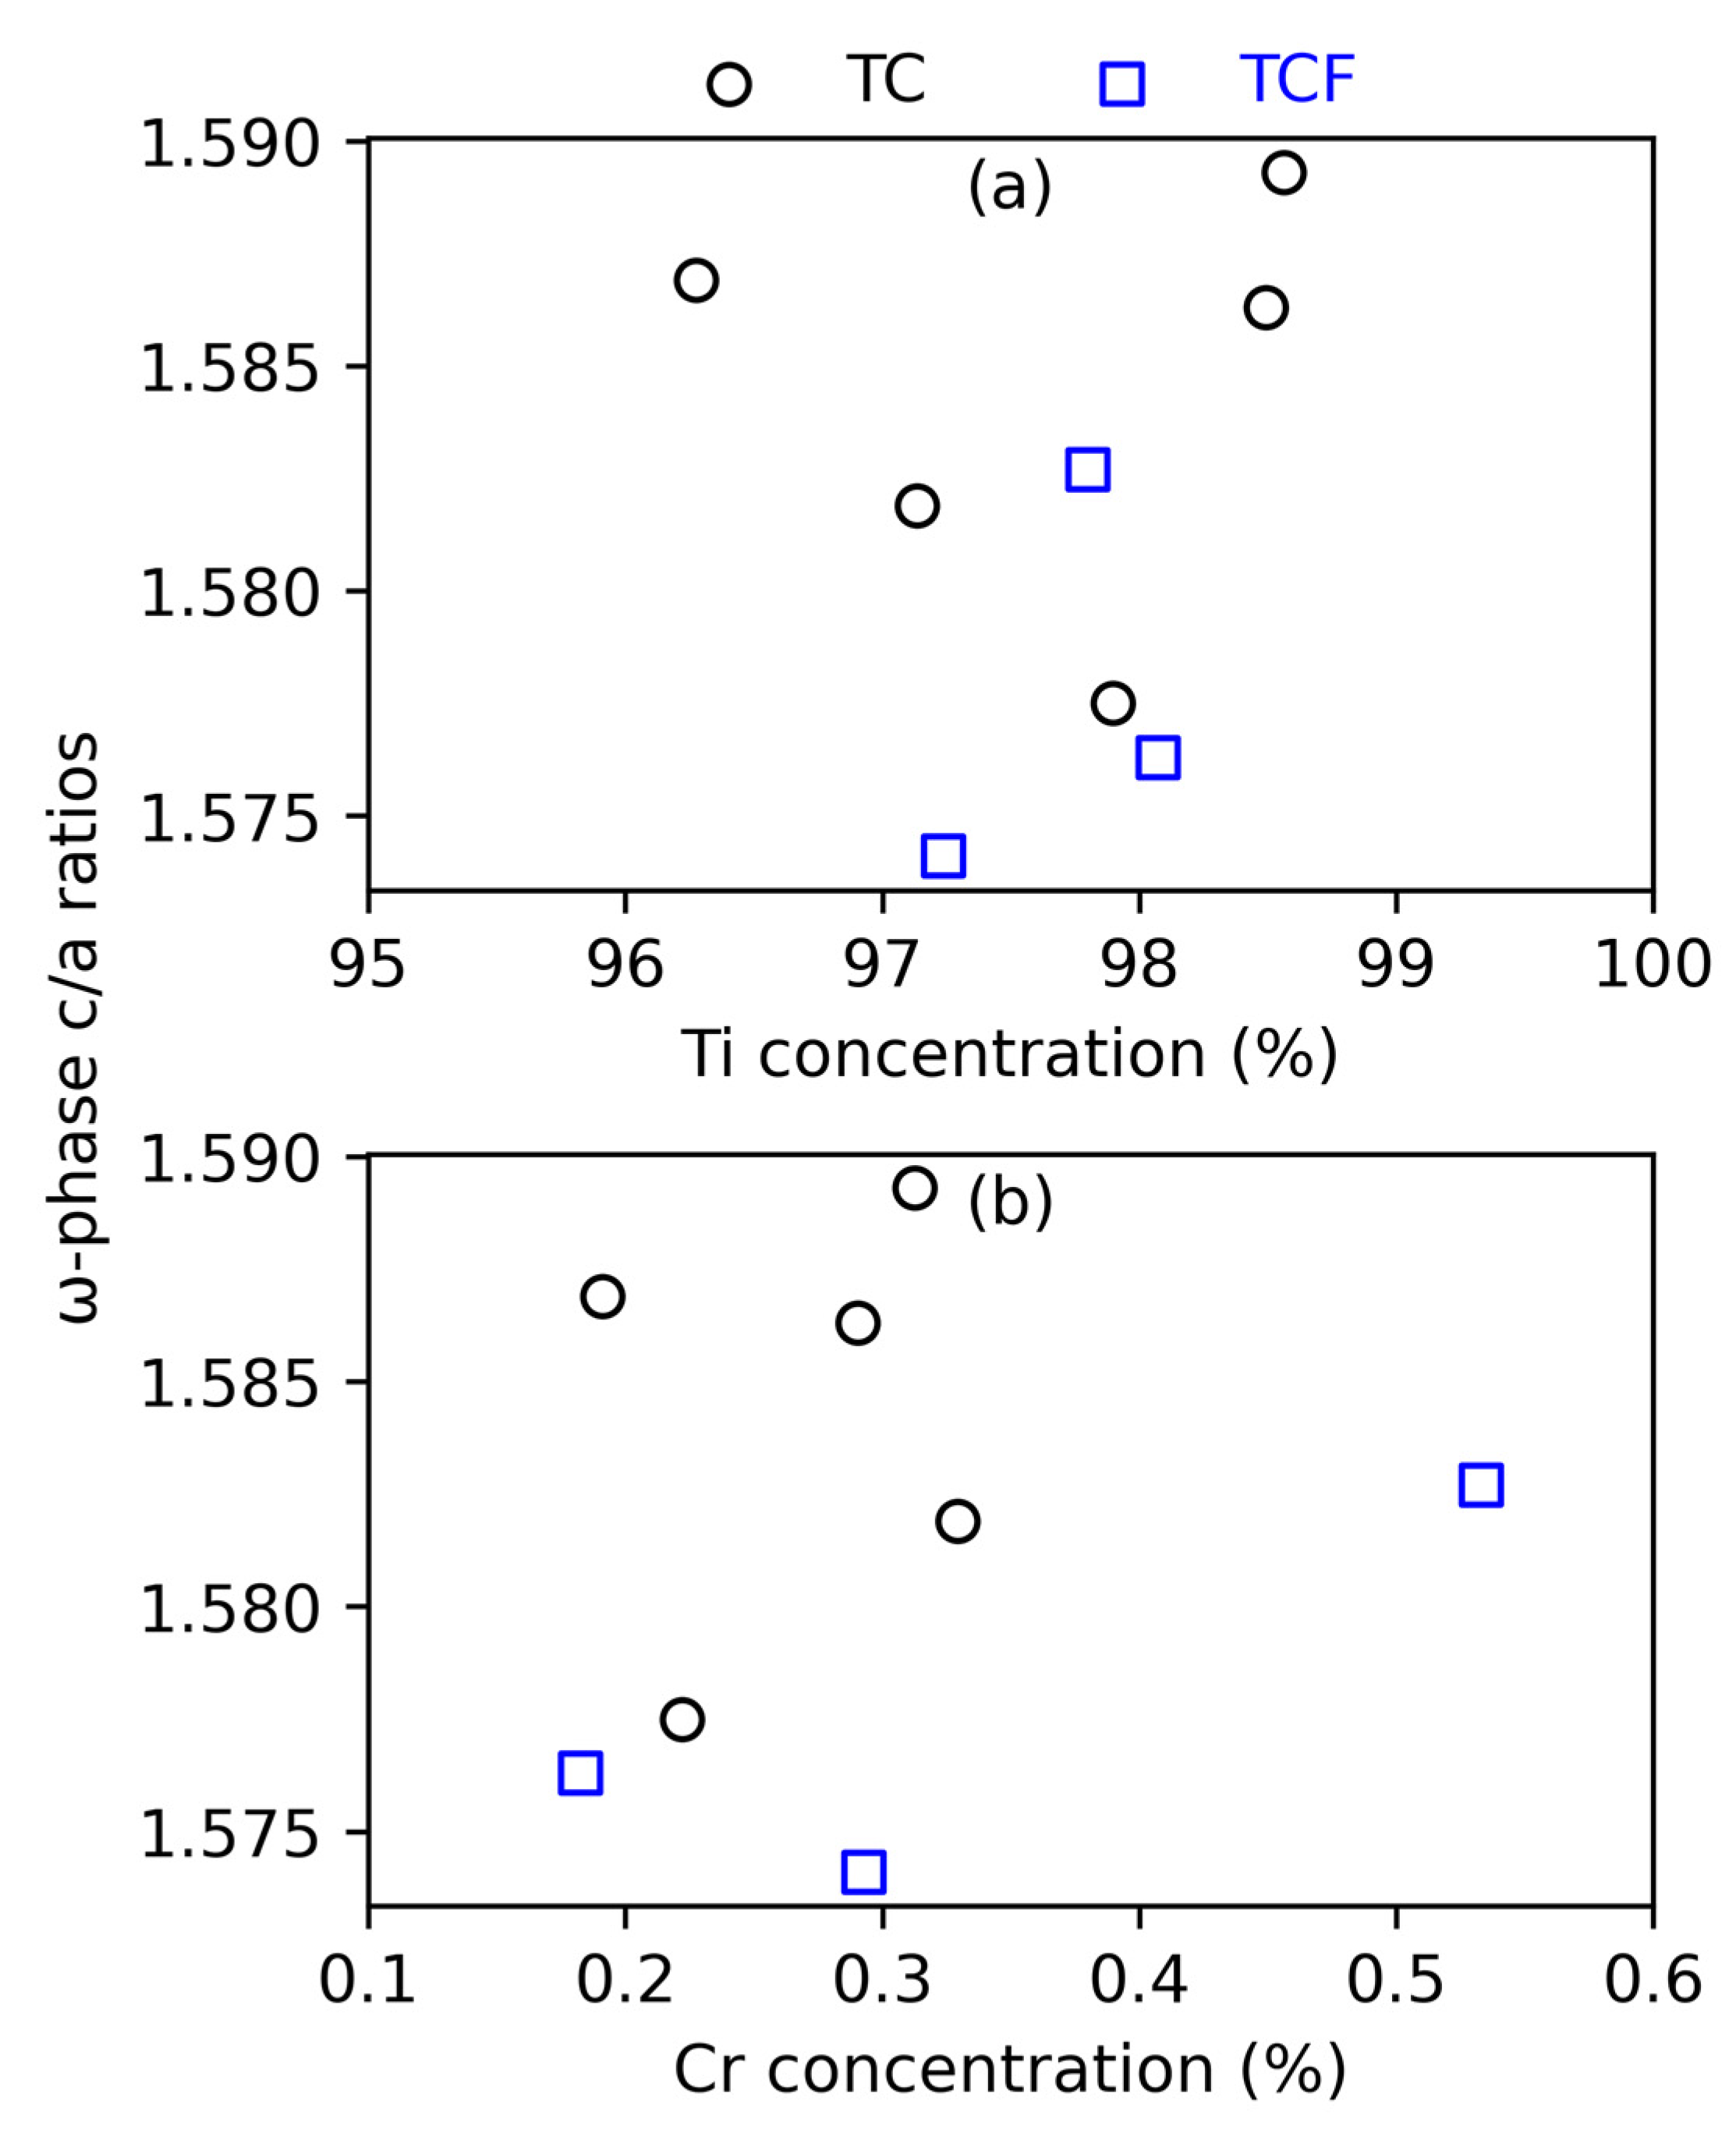
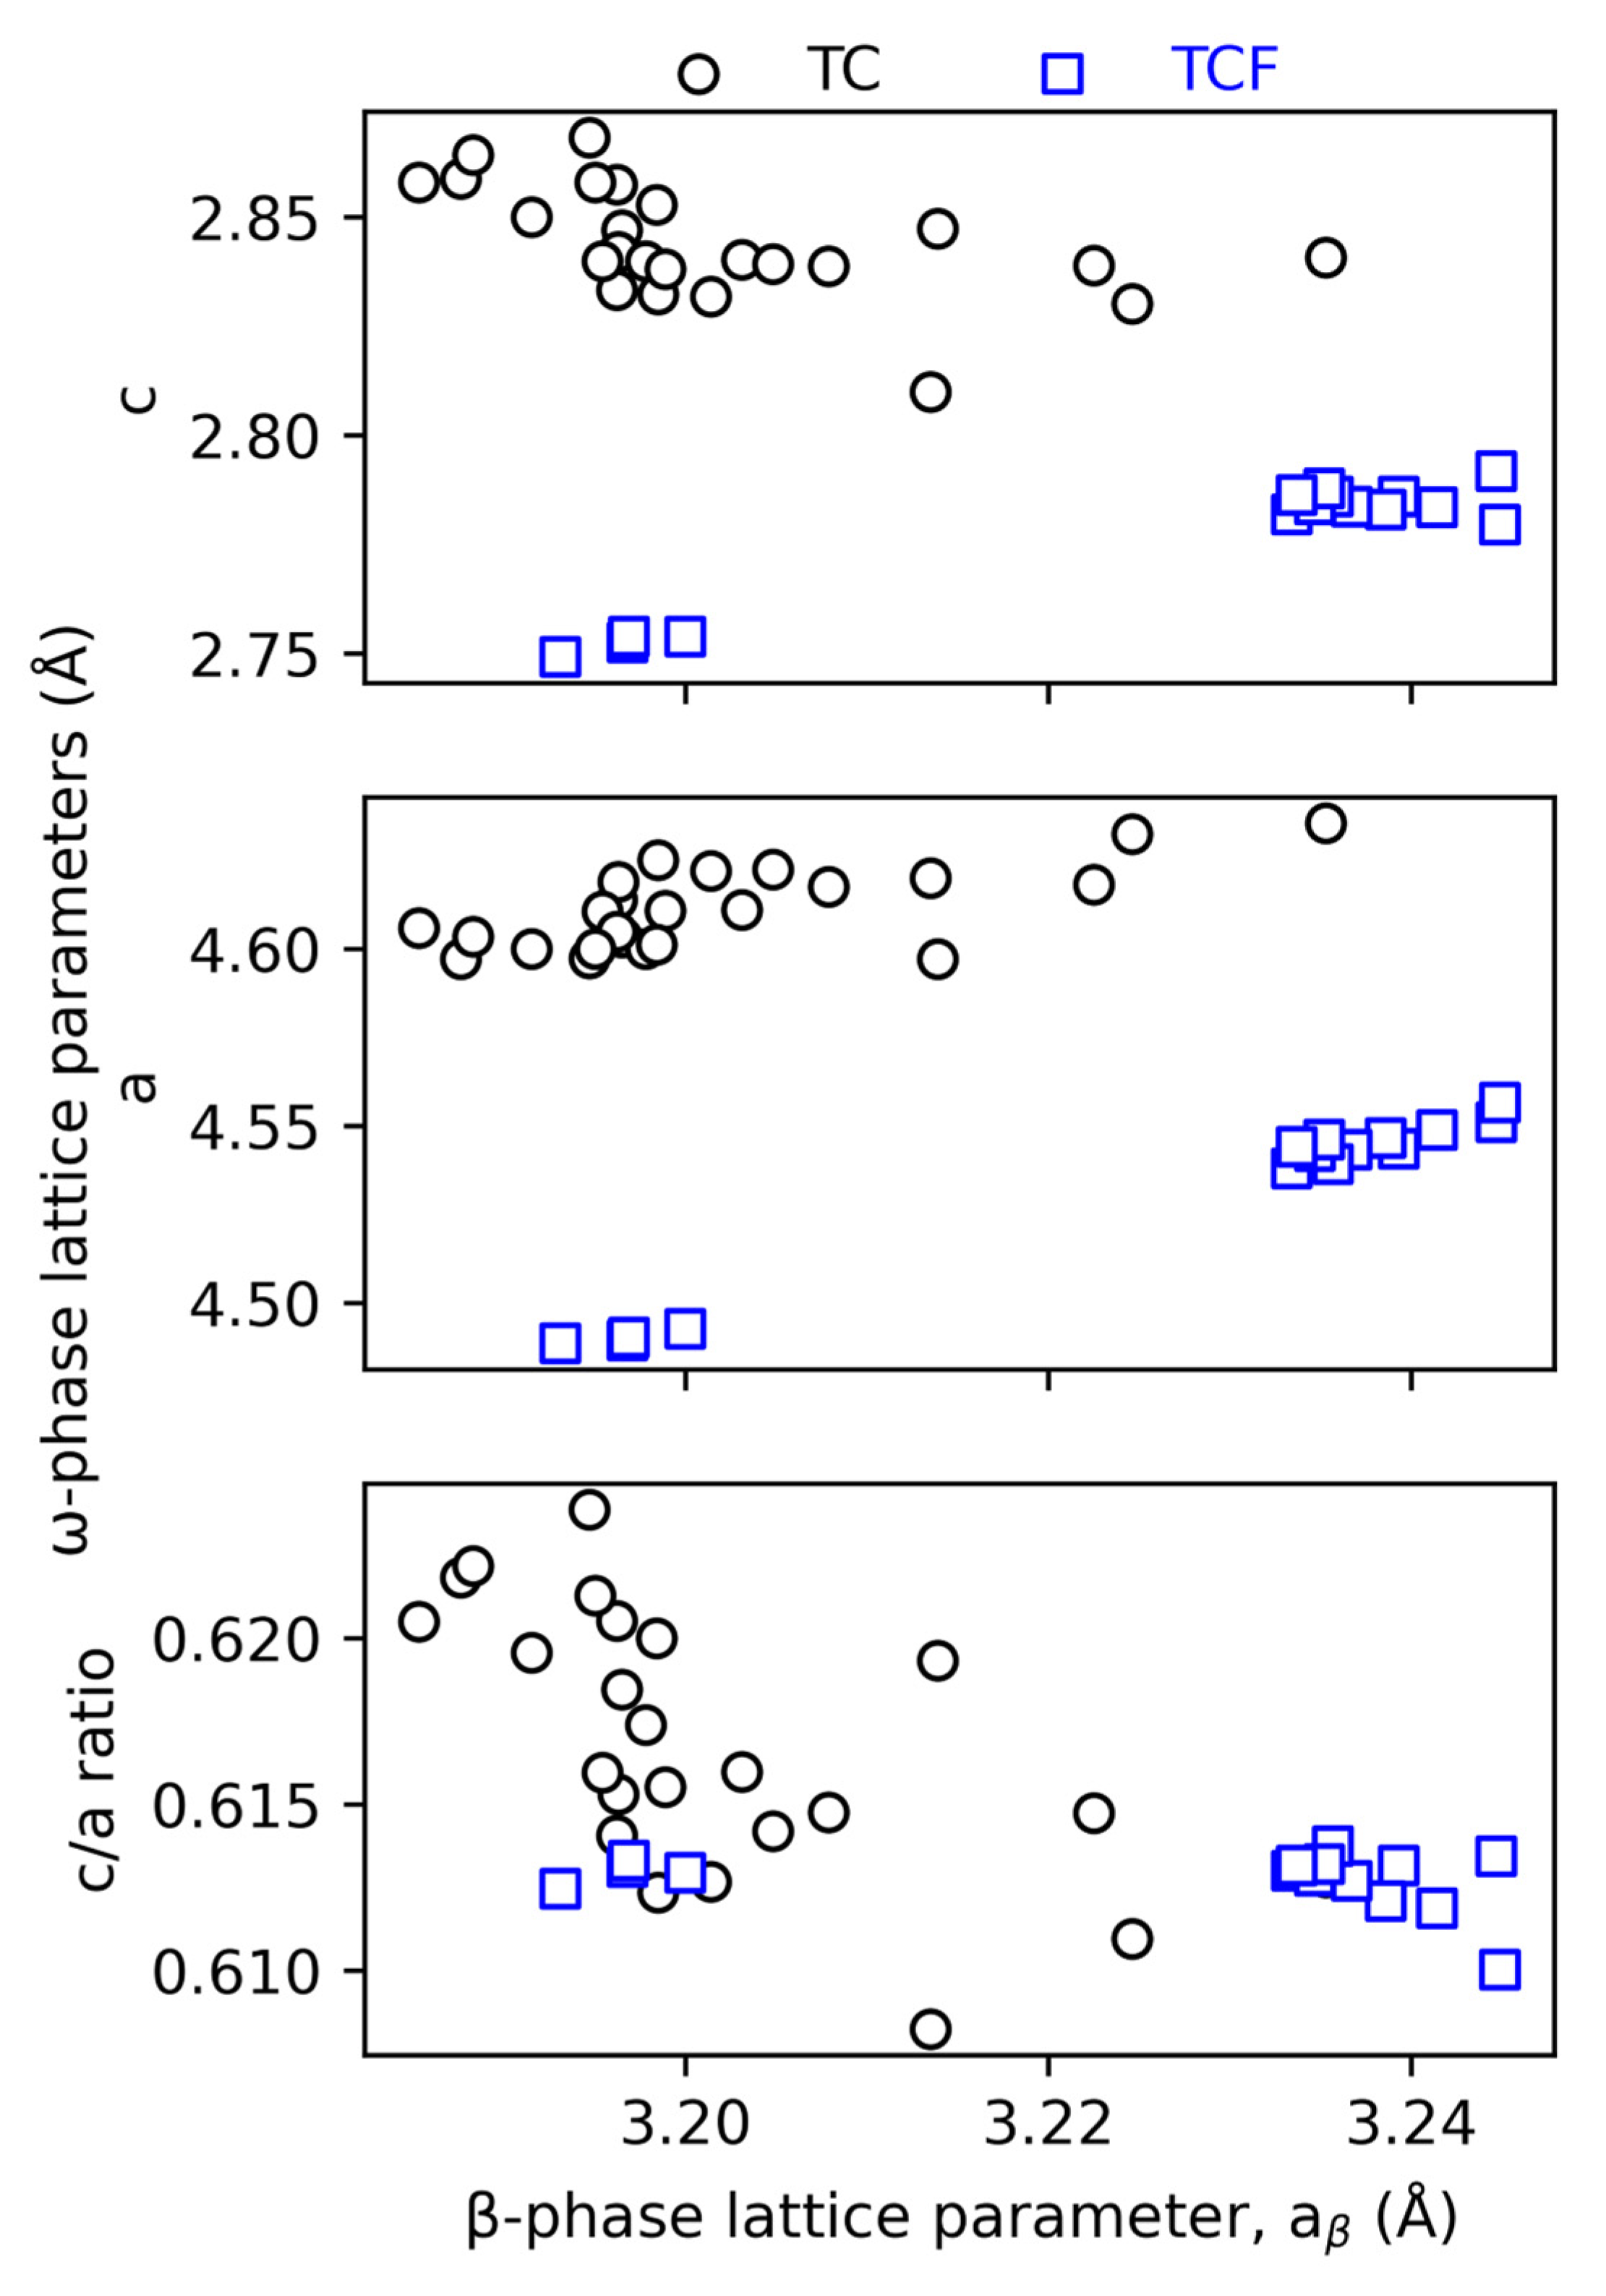
4.3. The ω Phase
5. Summary and Conclusions
Author Contributions
Funding
Data Availability Statement
Acknowledgments
Conflicts of Interest
References
- Cotton, J.D.; Briggs, R.D.; Boyer, R.R.; Tamirisakandala, S.; Russo, P.; Shchetnikov, N.; Fanning, J.C. State of the Art in Beta Titanium Alloys for Airframe Applications. JOM 2015, 67, 1281–1303. [Google Scholar] [CrossRef]
- Faller, K.; Froes, F.H. The Use of Titanium in Family Automobiles: Current Trends. JOM 2001, 53, 27–28. [Google Scholar] [CrossRef]
- Bania, P.J. Beta Titanium Alloys and Their Role in the Titanium Industry. JOM 1994, 46, 16–19. [Google Scholar] [CrossRef]
- Slokar, L.; Matković, T.; Matković, P. Alloy Design and Property Evaluation of New Ti–Cr–Nb Alloys. Mater. Des. 2012, 33, 26–30. [Google Scholar] [CrossRef]
- Levinger, B.W. Lattice Parameter of Beta Titanium at Room Temperature. JOM 1953, 5, 195. [Google Scholar] [CrossRef]
- Hake, R.R.; Leslie, D.H.; Berlincourt, T.G. Electrical Resistivity, Hall Effect and Superconductivity of Some b.c.c. Titanium-Molybdenum Alloys. J. Phys. Chem. Solids 1961, 20, 177–186. [Google Scholar] [CrossRef]
- Kim, H.Y.; Miyazaki, S. Chapter 1—Martensitic Transformation Characteristics. In Ni-Free Ti-Based Shape Memory Alloys; Kim, H.Y., Miyazaki, S., Eds.; Butterworth-Heinemann: Waltham, MA, USA, 2018; pp. 1–52. ISBN 978-0-12-809401-3. [Google Scholar]
- Kim, H.Y.; Ikehara, Y.; Kim, J.I.; Hosoda, H.; Miyazaki, S. Martensitic Transformation, Shape Memory Effect and Superelasticity of Ti–Nb Binary Alloys. Acta Mater. 2006, 54, 2419–2429. [Google Scholar] [CrossRef]
- Coakley, J.; Radecka, A.; Dye, D.; Bagot, P.A.J.; Stone, H.J.; Seidman, D.N.; Isheim, D. Isothermal Omega Formation and Evolution in the Beta-Ti Alloy Ti-5Al-5Mo-5V-3Cr. Philos. Mag. Lett. 2016, 96, 416–424. [Google Scholar] [CrossRef]
- Devaraj, A.; Joshi, V.V.; Srivastava, A.; Manandhar, S.; Moxson, V.; Duz, V.A.; Lavender, C. A Low-Cost Hierarchical Nanostructured Beta-Titanium Alloy with High Strength. Nat. Commun. 2016, 7, 11176. [Google Scholar] [CrossRef] [PubMed]
- Paiotti Marcondes Guimarães, R.; Callegari, B.; Warchomicka, F.; Aristizabal, K.; Soldera, F.; Mücklich, F.; Cavalcanti Pinto, H. In Situ Analysis of the Phase Transformation Kinetics in the β-Water-Quenched Ti-5Al-5Mo-5V-3Cr-1Zr Alloy during Ageing after Fast Heating. Quantum Beam Sci. 2020, 4, 12. [Google Scholar] [CrossRef]
- Szkliniarz, W.; Smołka, G. Analysis of Volume Effects of Phase Transformation in Titanium Alloys. J. Mater. Process. Technol. 1995, 53, 413–422. [Google Scholar] [CrossRef]
- Barriobero-Vila, P.; Requena, G.; Buslaps, T.; Alfeld, M.; Boesenberg, U. Role of Element Partitioning on the α–β Phase Transformation Kinetics of a Bi-Modal Ti–6Al–6V–2Sn Alloy during Continuous Heating. J. Alloys Compd. 2015, 626, 330–339. [Google Scholar] [CrossRef]
- de Fontaine, D.; Paton, N.E.; Williams, J.C. The Omega Phase Transformation in Titanium Alloys as an Example of Displacement Controlled Reactions. Acta Metall. 1971, 19, 1153–1162. [Google Scholar] [CrossRef]
- Li, M.; Min, X. Origin of ω-Phase Formation in Metastable β-Type Ti-Mo Alloys: Cluster Structure and Stacking Fault. Sci. Rep. 2020, 10, 8664. [Google Scholar] [CrossRef]
- Enzinger, R.J.; Luckabauer, M.; Okamoto, N.L.; Ichitsubo, T.; Sprengel, W.; Würschum, R. Influence of Oxygen on the Kinetics of Omega and Alpha Phase Formation in Beta Ti–V. Metall. Mater. Trans. A 2023, 54, 473–486. [Google Scholar] [CrossRef]
- Brumbauer, F.; Okamoto, N.L.; Ichitsubo, T.; Sprengel, W.; Luckabauer, M. Minor Additions of Sn Suppress the Omega Phase Formation in Beta Titanium Alloys. Acta Mater. 2024, 262, 119466. [Google Scholar] [CrossRef]
- Mukherjee, R.; Abinandanan, T.A.; Gururajan, M.P. Phase Field Study of Precipitate Growth: Effect of Misfit Strain and Interface Curvature. Acta Mater. 2009, 57, 3947–3954. [Google Scholar] [CrossRef]
- Grant, B.M.B.; Knoche, E.; Preuss, M.; da Fonseca, J.Q.; Daymond, M.R. The Effect of Lattice Misfit on Deformation Mechanisms at High Temperature. Adv. Mater. Res. 2011, 278, 144–149. [Google Scholar] [CrossRef]
- Chen, P.; Wang, F.; Li, B. Misfit Strain Induced Phase Transformation at a Basal/Prismatic Twin Boundary in Deformation of Magnesium. Comput. Mater. Sci. 2019, 164, 186–194. [Google Scholar] [CrossRef]
- Yilbas, B.S. Laser Duplex Treatment of Surfaces for Improved Properties. In Comprehensive Materials Processing; Elsevier: Amsterdam, The Netherlands, 2014; p. 286. ISBN 978-0-08-096533-8. [Google Scholar]
- Prevey, P.S. X-ray Diffraction Residual Stress Techniques. In Metals Handbook; American Society for Metals: Metals Park, OH, USA, 1986; pp. 380–392. [Google Scholar]
- Zheng, Y.; Williams, R.E.A.; Wang, D.; Shi, R.; Nag, S.; Kami, P.; Sosa, J.M.; Banerjee, R.; Wang, Y.; Fraser, H.L. Role of ω Phase in the Formation of Extremely Refined Intragranular α Precipitates in Metastable β-Titanium Alloys. Acta Mater. 2016, 103, 850–858. [Google Scholar] [CrossRef]
- Zheng, Y.; Williams, R.E.A.; Sosa, J.M.; Wang, Y.; Banerjee, R.; Fraser, H.L. The Role of the ω Phase on the Non-Classical Precipitation of the α Phase in Metastable β-Titanium Alloys. Scr. Mater. 2016, 111, 81–84. [Google Scholar] [CrossRef]
- Duerig, T.W.; Terlinde, G.T.; Williams, J.C. Phase Transformations and Tensile Properties of Ti-10V-2Fe-3AI. Metall. Trans. A 1980, 11, 1987–1998. [Google Scholar] [CrossRef]
- Shi, R.; Zheng, Y.; Banerjee, R.; Fraser, H.L.; Wang, Y. ω-Assisted α Nucleation in a Metastable β Titanium Alloy. Scr. Mater. 2019, 171, 62–66. [Google Scholar] [CrossRef]
- Li, T.; Kent, D.; Sha, G.; Liu, H.; Fries, S.G.; Ceguerra, A.V.; Dargusch, M.S.; Cairney, J.M. Nucleation Driving Force for ω-Assisted Formation of α and Associated ω Morphology in β-Ti Alloys. Scr. Mater. 2018, 155, 149–154. [Google Scholar] [CrossRef]
- Sadeghpour, S.; Abbasi, S.M.; Morakabati, M.; Bruschi, S. Correlation between Alpha Phase Morphology and Tensile Properties of a New Beta Titanium Alloy. Mater. Des. 2017, 121, 24–35. [Google Scholar] [CrossRef]
- Azimzadeh, S.; Rack, H.J. Phase Transformations in Ti-6.8Mo-4.5Fe-1.5Al. Metall. Mat. Trans. A 1998, 29, 2455–2467. [Google Scholar] [CrossRef]
- Hsu, H.-C.; Wu, S.-C.; Hsu, S.-K.; Li, C.-T.; Ho, W.-F. Effects of Chromium Addition on Structure and Mechanical Properties of Ti–5Mo Alloy. Mater. Des. (1980–2015) 2015, 65, 700–706. [Google Scholar] [CrossRef]
- Ho, W.-F.; Pan, C.-H.; Wu, S.-C.; Hsu, H.-C. Mechanical Properties and Deformation Behavior of Ti–5Cr–xFe Alloys. J. Alloys Compd. 2009, 472, 546–550. [Google Scholar] [CrossRef]
- Silcock, J.M. An X-Ray Examination of the ω Phase in TiV, TiMo and TiCr Alloys. Acta Metall. 1958, 6, 481–493. [Google Scholar] [CrossRef]
- Chandrasekaran, V.; Taggart, R.; Polonis, D.H. An Electron Microscopy Study of the Aged Omega Phase in Ti-Cr Alloys. Metallography 1978, 11, 183–198. [Google Scholar] [CrossRef]
- Murray, J.L. Phase Diagrams of Binary Titanium Alloys; Monograph Series on Alloy Phase Diagrams; ASM International: Metals Park, OH, USA, 1987; ISBN 0-87170-248-7. [Google Scholar]
- Ballor, J.; Ikeda, M.; Kautz, E.J.; Boehlert, C.J.; Devaraj, A. Composition-Dependent Microstructure-Property Relationships of Fe and Al Modified Ti-12Cr (Wt.%). JOM 2019, 71, 2321–2330. [Google Scholar] [CrossRef]
- Gammon, L.M.; Briggs, R.D.; Packard, J.M.; Batson, K.W.; Boyer, R.; Domby, C.W. Metallography and Microstructures of Titanium and Its Alloys. In Metallography and Microstructures; Vander Voort, G.F., Ed.; ASM International: Metals Park, OH, USA, 2004; pp. 899–917. ISBN 978-1-62708-177-1. [Google Scholar]
- Devaraj, A.; Perea, D.E.; Liu, J.; Gordon, L.M.; Prosa, T.Y.J.; Parikh, P.; Diercks, D.R.; Meher, S.; Kolli, R.P.; Meng, Y.S.; et al. Three-Dimensional Nanoscale Characterisation of Materials by Atom Probe Tomography. Int. Mater. Rev. 2018, 63, 68–101. [Google Scholar] [CrossRef]
- Rigaku. Integrated X-Ray Powder Diffraction Software PDXL. Rigaku J. 2010, 26, 23–27. [Google Scholar]
- Taylor, J.L.; Duwez, P. A Partial Titanium-Chromium Phase Diagram and the Crystal Structure of TiCr. Trans. Am. Soc. Met. 1952, 44, 495. [Google Scholar]
- Pawar, R.R.; Deshpande, V.T. The anisotropy of the thermal expansion of α-titanium. Acta Crystallogr. Sec. A Cryst. Phys. Diffr. Theor. Gen. Crystallogr. 1968, 24, 316–317. [Google Scholar] [CrossRef]
- Chebotareva, Y.S.; Nuzhdina, S.G. Observation of ω-Titanium in a Composite Hard Facing Alloy Based on Fine-Grain Diamonds. Phys. Met. Metall. 1973, 36, 200–202. [Google Scholar]
- Ballor, J.; Shawon, A.A.; Zevalkink, A.; Sunaoshi, T.; Misture, S.; Boehlert, C.J. The Effects of Fe and Al on the Phase Transformations and Mechanical Behavior of β-Ti Alloy Ti-11at.%Cr. Mater. Sci. Eng. A 2023, 886, 145677. [Google Scholar] [CrossRef]
- Lütjering, G.; Williams, J.C. Titanium, 2nd ed.; Springer: Berlin/Heidelberg, Germany, 2007; ISBN 978-3-540-71397-5. [Google Scholar]
- Jaffee, R.I. The Physical Metallurgy of Titanium Alloys. Prog. Met. Phys. 1958, 7, 65–163. [Google Scholar] [CrossRef]
- Hickman, B.S. The Formation of Omega Phase in Titanium and Zirconium Alloys: A Review. J. Mater. Sci. 1969, 4, 554–563. [Google Scholar] [CrossRef]
- Silcock, J.M.; Davies, M.H.; Hardy, H.K. Structure of the ω-Precipitate in Titanium–16 per Cent Vanadium Alloy. Nature 1955, 175, 731. [Google Scholar] [CrossRef]
- Aurelio, G.; Fernández Guillermet, A. Interatomic Distances of the Hexagonal Omega Structure in Ti-V Alloys: Neutron Diffraction Study and Analysis of Bonding Related Regularities. Scr. Mater. 2000, 43, 665–669. [Google Scholar] [CrossRef]
- Bönisch, M.; Panigrahi, A.; Stoica, M.; Calin, M.; Ahrens, E.; Zehetbauer, M.; Skrotzki, W.; Eckert, J. Giant Thermal Expansion and α-Precipitation Pathways in Ti-Alloys. Nat. Commun. 2017, 8, 1429. [Google Scholar] [CrossRef] [PubMed]
- Hatt, B.A.; Roberts, J.A. The W-Phase in Zirconium Base Alloys. Acta Metall. 1960, 8, 575–584. [Google Scholar] [CrossRef]
- Devaraj, A.; Williams, R.E.A.; Nag, S.; Srinivasan, R.; Fraser, H.L.; Banerjee, R. Three-Dimensional Morphology and Composition of Omega Precipitates in a Binary Titanium–Molybdenum Alloy. Scr. Mater. 2009, 61, 701–704. [Google Scholar] [CrossRef]
- Porter, D.A.; Easterling, K.E. Phase Transformations in Metals and Alloys, 2nd ed.; CRC Press, Taylor and Francis Group: Boca Raton, FL, USA, 1992; ISBN 0-7487-5741-4. [Google Scholar]
- William, D.C., Jr. Materials Science and Engineering An Introduction, 5th ed.; John Wiley & Sons, Inc.: New York, NY, USA, 2000; ISBN 0-471-32013-7. [Google Scholar]
- Morinaga, M.; Murata, Y.; Yukawa, H. Molecular Orbital Approach to Alloy Design. In Applied Computational Materials Modeling; Springer: Berlin/Heidelberg, Germany, 2007; pp. 255–306. ISBN 978-0-387-23117-4. [Google Scholar]
- Zheng, Y.; Williams, R.E.A.; Viswanathan, G.B.; Clark, W.A.T.; Fraser, H.L. Determination of the Structure of α-β Interfaces in Metastable β-Ti Alloys. Acta Mater. 2018, 150, 25–39. [Google Scholar] [CrossRef]
- Nag, S.; Banerjee, R.; Fraser, H.L. Intra-Granular Alpha Precipitation in Ti–Nb–Zr–Ta Biomedical Alloys. J. Mater. Sci. 2009, 44, 808–815. [Google Scholar] [CrossRef]


| Phase | a (Å) | b (Å) | c (Å) | Structure | Space Group | Atomic Positions (x,y,z) | Reference |
|---|---|---|---|---|---|---|---|
| β | 3.21 | - | - | Cubic | Imm(229) | (0,0,0) (1/2,1/2,1/2) | [39] |
| α | 2.9508 | - | 4.6855 | Hexagonal close-packed | P63/mmc(194) | (0,0,0) (1/3,2/3,1/2) | [40] |
| ω | 4.6 | - | 2.82 | Hexagonal | P6/mmm(191) | (0,0,0) (1/3,2/3,1/2) (2/3,1/3,1/2) | [41] |
Disclaimer/Publisher’s Note: The statements, opinions and data contained in all publications are solely those of the individual author(s) and contributor(s) and not of MDPI and/or the editor(s). MDPI and/or the editor(s) disclaim responsibility for any injury to people or property resulting from any ideas, methods, instructions or products referred to in the content. |
© 2024 by the authors. Licensee MDPI, Basel, Switzerland. This article is an open access article distributed under the terms and conditions of the Creative Commons Attribution (CC BY) license (https://creativecommons.org/licenses/by/4.0/).
Share and Cite
Ballor, J.; Poplawsky, J.D.; Devaraj, A.; Misture, S.; Boehlert, C.J. Lattice Parameter Evolution during the β-to-α and β-to-ω Transformations of Iron- and Aluminum-Modified Ti-11Cr(at.%). Crystals 2024, 14, 145. https://doi.org/10.3390/cryst14020145
Ballor J, Poplawsky JD, Devaraj A, Misture S, Boehlert CJ. Lattice Parameter Evolution during the β-to-α and β-to-ω Transformations of Iron- and Aluminum-Modified Ti-11Cr(at.%). Crystals. 2024; 14(2):145. https://doi.org/10.3390/cryst14020145
Chicago/Turabian StyleBallor, JoAnn, Jonathan D. Poplawsky, Arun Devaraj, Scott Misture, and Carl J. Boehlert. 2024. "Lattice Parameter Evolution during the β-to-α and β-to-ω Transformations of Iron- and Aluminum-Modified Ti-11Cr(at.%)" Crystals 14, no. 2: 145. https://doi.org/10.3390/cryst14020145
APA StyleBallor, J., Poplawsky, J. D., Devaraj, A., Misture, S., & Boehlert, C. J. (2024). Lattice Parameter Evolution during the β-to-α and β-to-ω Transformations of Iron- and Aluminum-Modified Ti-11Cr(at.%). Crystals, 14(2), 145. https://doi.org/10.3390/cryst14020145