Abstract
This study employs a simple and cost-effective technique to enhance the photoelectrochemical (PEC) water-splitting performance of melamine cyanaurate microrods (M), SnO2 nanostructures (S), and melamine cyanaurate microrods decorated with SnO2 quantum dots (MS) by optimizing NaOH and Na2SO3 electrolytes. Notably, the MS electrode demonstrates a remarkable improvement in PEC efficiency in Na2SO3 solution associated with NaOH solution. Specifically, the induced currents of the MS anode in the Na2SO3 electrolyte are approximately 6.28 mAcm−2 more than those observed in the NaOH electrolyte solution. It is revealed that anions effectively consume the holes, leading to improved separation of the generated charge pairs. This effective charge separation mechanism significantly contributes to the enhanced PEC performance observed in Na2SO3 electrolytes. The findings of this study suggest a capable approach for improving the PEC activity of the materials through the careful optimization of the supported electrolytes.
1. Introduction
Over the past few decades, photoelectrochemical water splitting (PWS) has been extensively studied due to increasing concern for energy and environmental issues [1]. Photocatalyst and photoelectrochemical (PEC) cells are the main categories in water-splitting systems. Various nanostructures based on semiconductor oxides, including ZnO, SnO2, TiO2, V2O5, WO3, and Fe2O3, have been employed to enhance the PWS activity because of their structural simplicity, flexibility, relatively narrow band gaps, higher charge transport property, and good stability [2,3,4,5,6]. Among these oxides, SnO2 nanostructures have several industrial applications owing to their high surface area, strong stability, and broad bandgap. Moreover, owing to these superior properties, SnO2 nanostructures have been widely used in a variety of technological applications, such as batteries, photocatalysis, perovskite solar cells, sensing, and energy conversion [7,8,9,10,11]. Moreover, the catalytic activity of SnO2 nanostructures is limited owing to the underlying recombination rate. Hence, to improve its PWS property, SnO2 needs to be doped with metal ions or combined and decorated with other catalysts. Based on the earlier literature that SnO2 quantum dots decorated with V2O5 and ZnO lead to enhance PCE efficiency [12,13], they have been extensively utilized as catalysts [7,8,9,10,11] Also, many studies have reported that the efficiency of PWS can be improved by combining various semiconductor nanomaterials, which help separate the band structures to facilitate the absorption of light, induce the collection of photogenerated electrons and holes on the surface, and enhance oxidation [14]. Melamine cyanurate, also known as melamine–cyanuric acid complex, is a crystalline complex formed from a 1:1 mixture of melamine and cyanuric acid. It has effective nitrogen-based polymers used to prepare material with different morphologies without any hard templates, which directly leads to boosted photocatalytic activity in diverse application scenarios [15].
To this end, SnO2 QDs have been used to decorate melamine cyanurate nanostructures because of their outstanding electrical and optical properties. Only a few studies thus far have reported composite or heterostructured catalysts of SnO2-based catalysts, such as TiO2/SnO2 [16], Fe2O3/SnO2 [17], and ZnO/SnO2 [18,19]. To the best of our knowledge, no reports have been published on melamine cyanurate microrods decorated with SnO2 quantum dots (QD), especially in the context of PWS.
In this work, melamine cyanurate microrods decorated with SnO2 quantum dot (QD) nanostructure were successfully prepared by a facile method. The experimental results show that melamine cyanurate microrods, SnO2 QDs, and melamine cyanurate microrods decorated with SnO2 quantum dot (QD) nanostructures exist mainly in a crystalline state in the sample. The melamine cyanurate microrods decorated with SnO2 quantum dots (QD) exhibit higher PEC activity than pure SnO2 QDs and pure melamine cyanurate microrods.
2. Experimental and Characterization
2.1. Synthesis of Melamine Cyanaurate Microrods
Initially, 0.5 g of melamine powder was mixed into 30 mL of deionized water, and continuously stirred at 95 °C for 20 min, resulting in the observation of a transparent solution. Subsequently, this liquid was poured into a 50 mL hydrothermal reactor and subjected to 24 h of heating in an oven set at 180 °C. After cooling, the final product was extracted, cleaned through cycles of washing with water and ethanol (repeated 3 or 4 times), and eventually dehydrated in an oven at 80 °C for a period of 14 h.
2.2. Synthesis of Tin(IV) Oxide Nanostructures
SnCl4·5H2O of 2.5 g was transferred into 130 mL of water and continuously stirred for 10 min. Subsequently, 5.3 mL of hydrazine was added slowly into the above liquid and continuously stirred for 40 min. Then, the temperature of the solution was raised to 115 °C and sustained for 19 h without stirring. After this duration, the liquid was permitted to cool and underwent extraction and purification through centrifugation, then washed 5 to 7 times with water and ethanol. The resulting product was dehydrated at 90 °C for 16 h.
2.3. Synthesis of Melamine Cyanaurate Microrods Decorated with SnO2 Structures
To create moored nanostructures, 0.5 g of melamine cyanaurate microrods and 0.5 g of SnO2 nanostructure powders were separately added to 50 mL of water and probe sonicated for 35 min. The dispersed liquid comprising the SnO2 structures was then slowly added drop by drop to the melamine solution and sonicated for an additional 1 h. The resultant mixture of melamine cyanaurate microrods anchored with SnO2 nanostructures was extracted and subjected to a cleaning process using water and ethanol through 2 to 4 rounds of centrifugation. The final product was dried at 80 °C for 18 h.
2.4. Preparation of Electrodes
The electrodes were prepared by initially taking 1 mg of each developed nanostructure separately to 3 mL of ethylene glycol and sonicated for a duration of 15 to 20 min. These extremely dispersed liquids were then drop-casted onto thoroughly cleaned conductive glass substrates, each having an area of 1 square centimeter, at a temperature of 130 °C. Subsequently, the coated substrates were placed into an oven and maintained at 130 °C for 48 h. Ultimately, the dried electrodes resulting from this process were employed for electrochemical studies conducted under illumination.
2.5. Characterization Techniques
The investigation of the structure and morphology of the synthesized nanostructures involved multiple analytical methods. X-ray diffraction (XRD) study was performed with a PANalytical X’pert PRO system from Eindhoven, The Netherlands. Electron microscopy (SEM) was performed using a Hitachi S-4800 instrument from Tokyo, Japan, while high-resolution transmission electron microscopy (HR-TEM) was carried out using a G2 F30 S-Twin instrument from the Hillsboro, OR, USA. Fourier transform infrared spectroscopy (FTIR) was performed with a Perkin Elmer Spectrum 100 instrument from the Waltham, MA, USA, and Raman spectroscopy analysis was performed using an XploRA Plus instrument equipped with a 532 nm laser from Osaka, Japan. These diverse techniques collectively provided comprehensive visions of the characteristics and properties of the nanostructures.
2.6. Photoelectrochemical Studies
The investigation encompassed kinetics, Tafel studies, and the assessment of electrochemical activities. Sweep voltammetry was conducted across different cycles, while amperometry was performed at different voltages. These analyses were carried out in various electrolytes under both dark/light conditions. A three-electrode setup, connected to a BioLogic potentiostat (SP-200, Seyssinet-Pariset, France), was utilized for these studies. Specifically, Pt served as the counter electrode, Ag/AgCl functioned as the reference electrode, and the fabricated electrodes were employed as the working electrodes. For illuminating the synthesized electrodes during the experiments, an ABET Technologies, Inc. Model 10500 light source from Milford, CT, USA was positioned at a distance of 6 cm from the setup. This setup was maintained to ensure a consistent power density of 100 mW cm−2 on the top of the electrodes throughout the experiments.
3. Results and Discussion
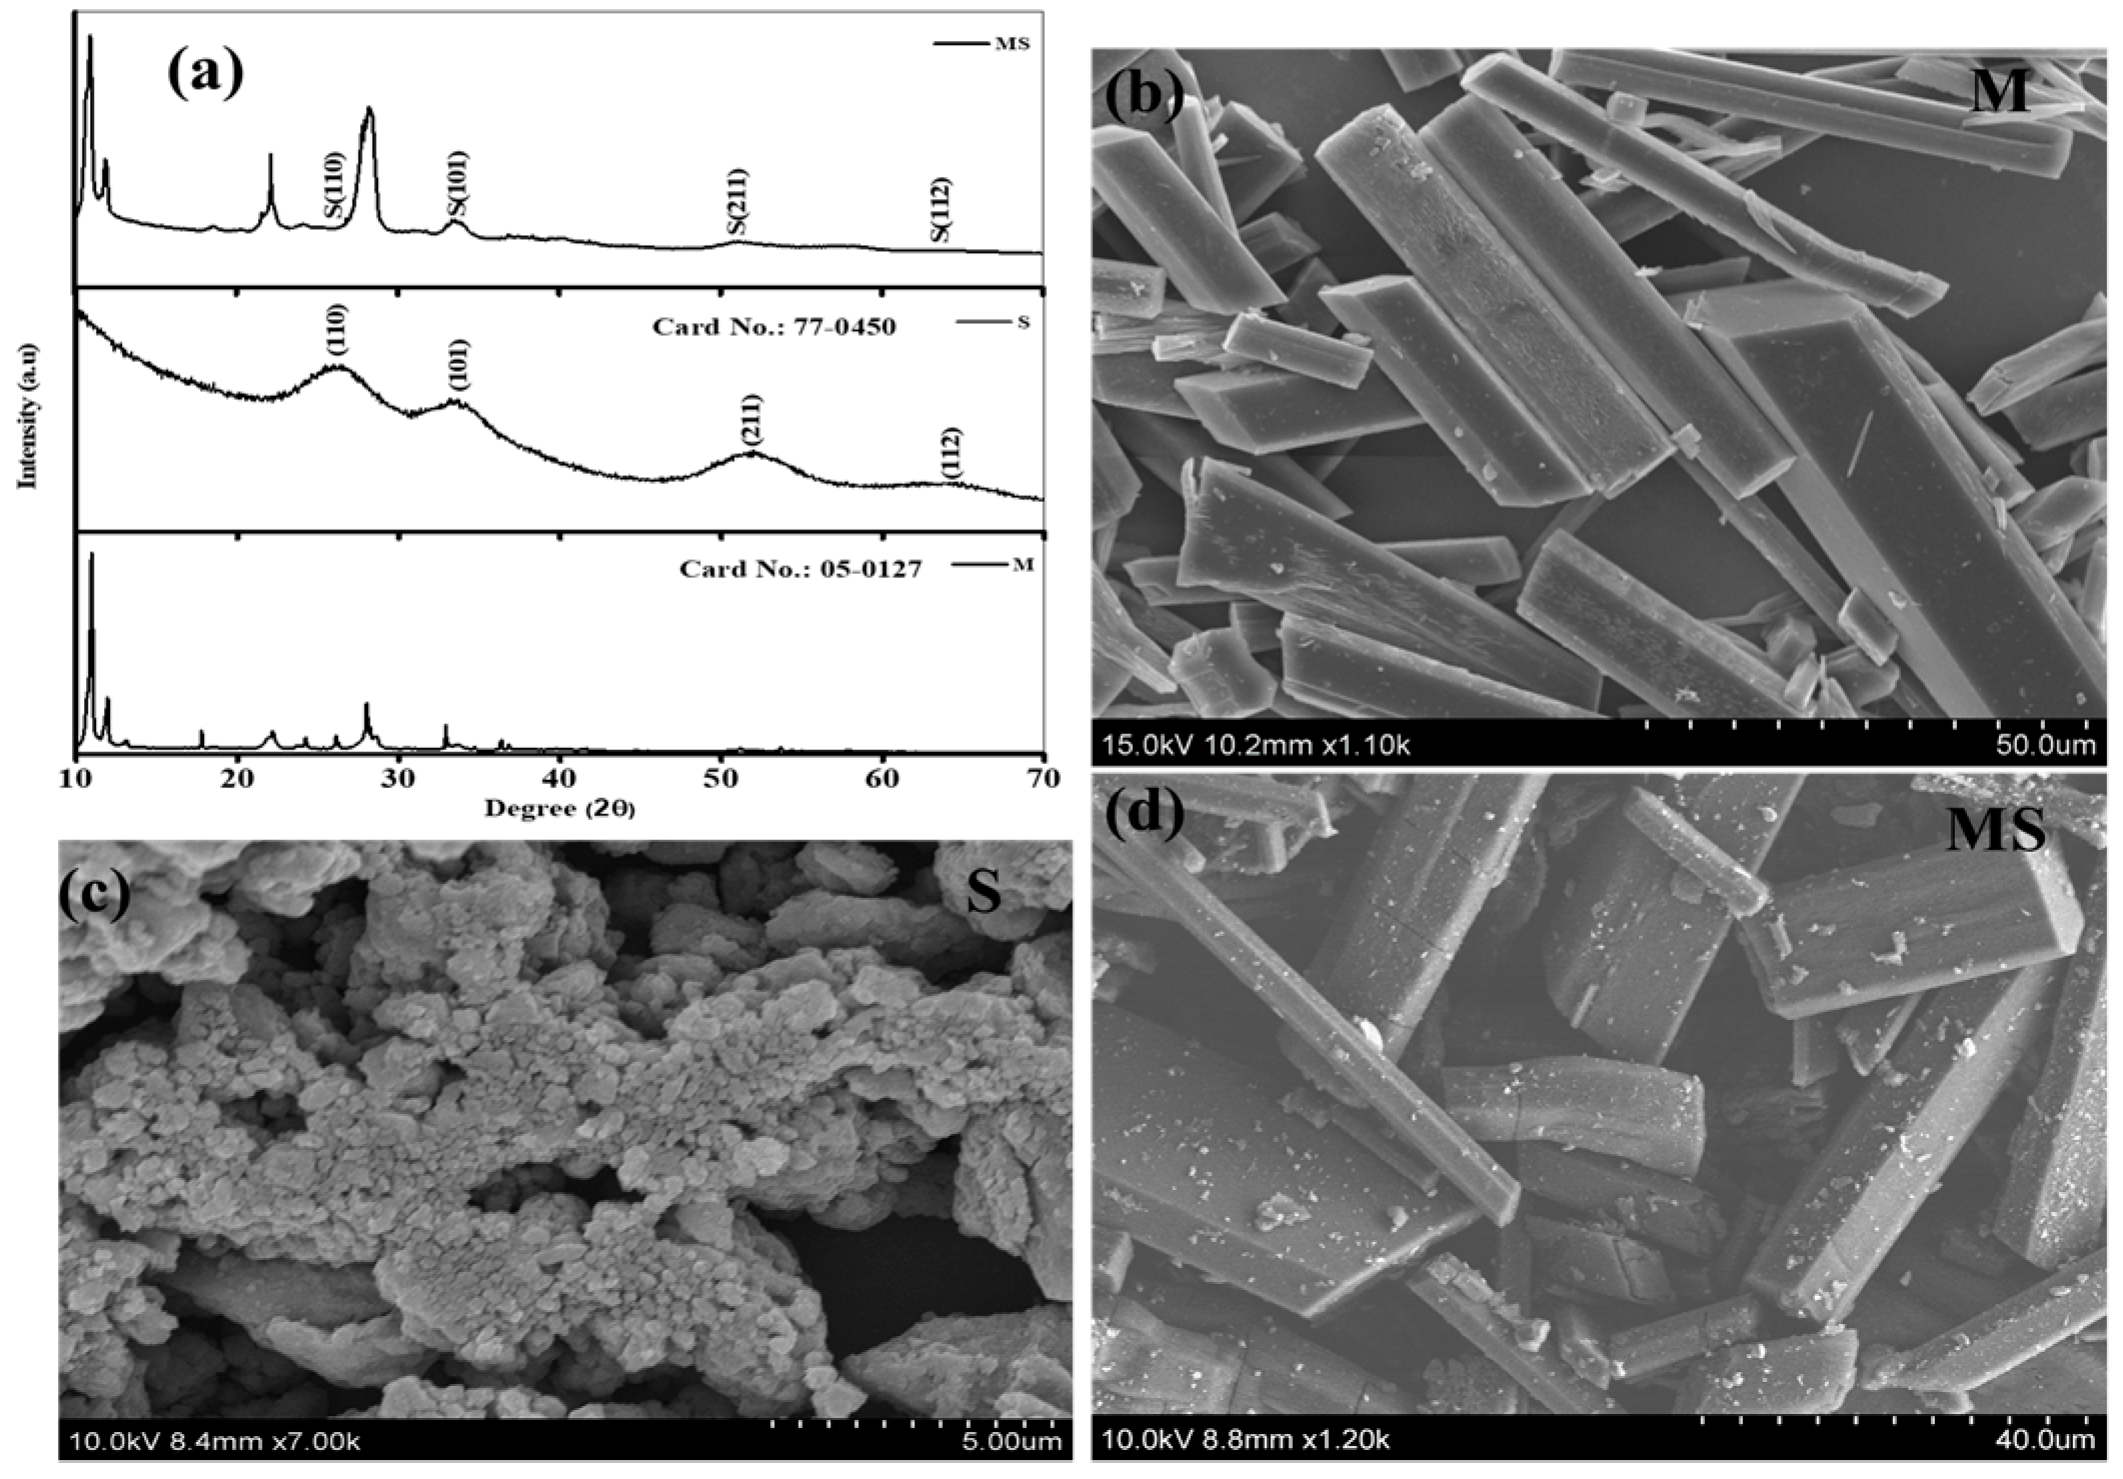
The crystallographic structures of the prepared melamine cyanurate, SnO2 quantum dots, and melamine cyanaurate microrods decorated with SnO2 structures were examined using X-ray diffraction (XRD) analysis, as shown in Figure 1a. XRD pattern of melamine cyanurate in Figure 1a shows the appearance of major characteristic peaks in the diffraction spectra confirming that the samples were of superior crystalline nature and the peaks were well matched with standard (JCPDS file no. 05-0127) [20]. The crystalline structure of SnO2 QDs confirms a tetragonal rutile crystal structure (JCPDS card no. 77-0450). The corresponding characteristic peaks were observed at 25.95° (110), 34.43° (101), 52.19° (211), and 68.37° (112) [21]. Additionally, the combination of the melamine cyanaurate microrods anchored with SnO2 quantum dots exhibited that all the XRD peak intensities of SnO2 slightly decreased and major peak intensities of melamine cyanaurate increased due to the SnO2 QD size. Moreover, SnO2 QDs can improve not only the stability of melamine cyanaurate but also enhance the crystal quality. Additionally, it was observed that melamine cyanaurate did not change the crystal structure of SnO2 QDs in the composition. X-rays initially exposed the maximum on the surface of SnO2 QDs compared to melamine cyanaurate due to the melamine cyanaurate characteristic peak showing higher intensities in the composition sample.

Figure 1.
(a) Phase analysis of melamine cyanaurate microrods (M), SnO2 nanostructures (S), and melamine cyanaurate microrods adorned with SnO2 quantum dots (MS). Morphology images of samples of (b) melamine cyanaurate microrods (M), (c) SnO2 nanostructures (S), and (d) melamine cyanaurate microrods adorned with SnO2 quantum dots (MS).
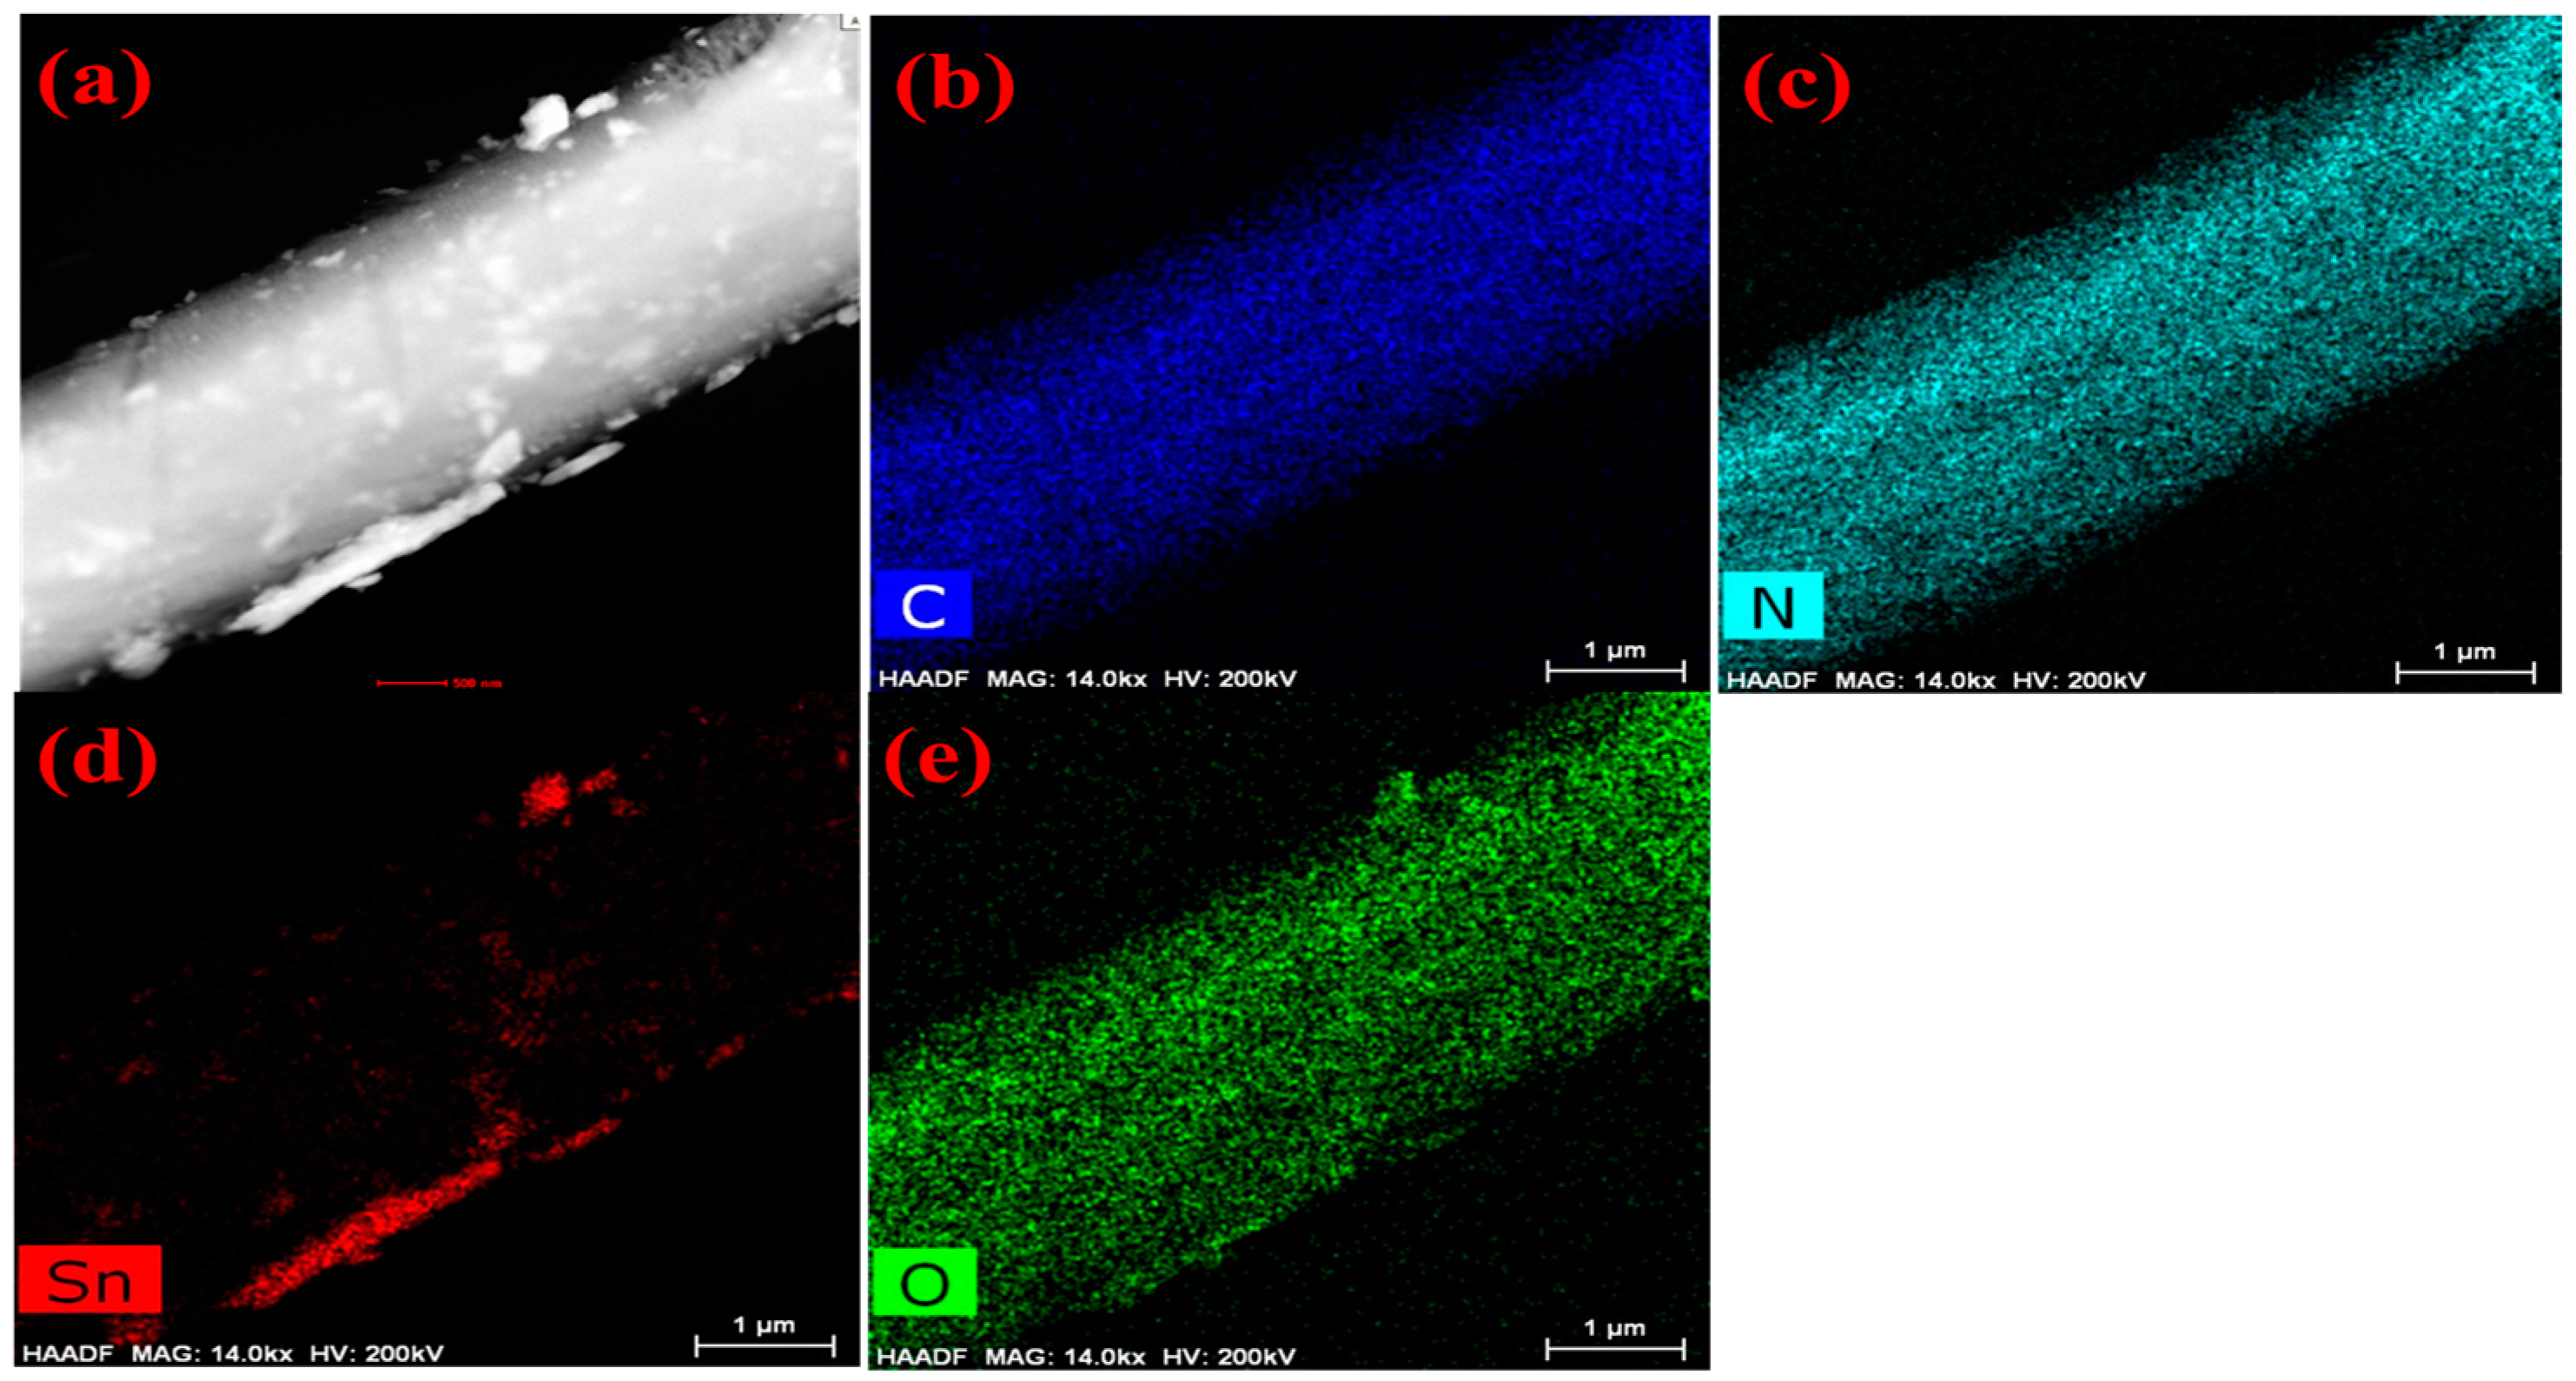
The morphologies of as-prepared melamine cyanaurate microrods, SnO2 QD, and melamine cyanaurate microrods decorated with SnO2 QD are presented in Figure 1b–d. From Figure 1b, melamine cyanaurate microrods exhibited aggregated hexagonal microrods. For these microrods, the side facets were smooth and dense. Figure 1c shows agglomerated particles of SnO2 with an irregular shape, which may be due to the reaction condition and the absence of the capping agent. SnO2 particles were well distributed on the surface of the melamine cyanaurate hexagonal nanostructure due to the rapid nucleation, as shown in Figure 1d. The EDAX mapping shows (Figure 2) the presence of the elements in the prepared melamine cyanaurate microrods decorated with SnO2 QDs. The mapping indicates the existence of only core elements such as C, N, Sn, and O. Here, the existence of carbon and nitrogen is due to the formation of melamine cyanaurate (C6H9N9O3 (C3H6N6·C3H3N3O3)) and the lack of impurities in the sample indicates the quality of the prepared samples.
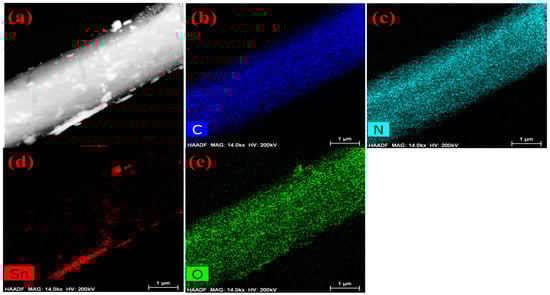
Figure 2.
EDAX mapping images of melamine cyanaurate microrods adorned with SnO2 quantum dots (MS): (a) melamine cyanaurate microrods decorated with SnO2 QD morphology image, (b) carbon mapping image, (c) nitrogen mapping image, (d) tin mapping image and (e) oxygen mapping image.
Raman analysis was used to confirm the phase purity of synthesized nanostructures, as shown in Figure S1a. The Raman spectra of melamine cyanaurate microrods, SnO2 QDs, and melamine cyanaurate microrods decorated with SnO2 QDs were noticed in the range of 200 to 2000 cm−1. The spectrum of Raman for pure melamine cyanaurate displays major peaks detectable at 525, 552, 702, 991, and 1727 cm−1, respectively. These peaks could be credited to the melamine cyanaurate, which indicates that the sample had a perfect crystalline nature. The Raman peaks of the SnO2 QDs are found at 578 cm−1, which is related to the size influence and the Matossi force constant model [22]. Also, the Raman outcomes of the melamine cyanaurate microrods anchored with SnO2 QDs show that peaks at 525, 552, 702, 991, and 1727 cm−1 for melamine cyanaurate and 578 cm−1 appeared in the spectrum. The intensity of both samples was reduced due to the size of the quantum dots.
FTIR spectra of samples of melamine cyanaurate microrods, SnO2 QDs, and melamine cyanaurate microrods decorated with SnO2 QDs are shown in Figure S1b, exhibiting a characteristic group of peaks from 500 to 4000 cm−1. Based on crystallographic data, melamine products often form hydrogen bonds of the types N–H⋯N and N–H⋯O. Particularly, the melamine cyanurate complex is a two-dimensional network of hydrogen bonds between the two structures. The pure melamine cyanaurate microrods show a broad band peak occurring at 3462 cm−1, corresponding to the NH2 symmetric stretching vibrations [23]. The carbonyl group C=O stretching vibration at 1846 cm−1 is due to cyanate anion [24]. The medium bands at 1028 cm−1 [25], 1090 cm−1, and 945 cm−1 initiate from ring breathing vibration. The peaks at 813 cm−1 and 771 cm−1 are credited to ring-sextant out-of-plane bending vibration [26], the peak at 595 cm−1 is due to ring bending [27], and the peak at 629 cm−1 is due to the side chain in plane C–N bending vibration [28]. The observed bands at 564 and 663 cm−1 are related to the strong antisymmetric Sn–O–Sn and terminal Sn–O modes of vibration in SnO2 [29]. The characteristic Sn–O–Sn bond is recognized at 640 cm−1 [30]. The signals noticed in the range of 1720–1250 cm−1 may be vibrations of the –OH, CO, and CH modes of the organic molecules, existing in the C. The noticed band at about 3400 cm−1 resembles the hydroxyl group (−OH) stretching vibration [31]. Furthermore, the samples of melamine cyanaurate microrods decorated with SnO2 QDs display a mixture of melamine cyanaurate microrods and SnO2 bands. The stated results indicate that the structures are fine-quality crystals and approve the demonstration of SnO2 in the crystalline structure, which is in a virtuous pact with the XRD studies. In addition, the broadening peak at 3414 cm−1 with defined intensity was noticed, and suspected to be due to the stretching of the hydroxyl group [32]. The frequency shift may be credited to the influence of the stress and strain that occurred throughout the coordination bonding of the nanostructure of SnO2 with melamine cyanaurate. Thus, the FTIR examination established the coordination bonding interaction as the mode of bonding among the melamine cyanaurate nanostructure and SnO2, as stated in Raman analysis.
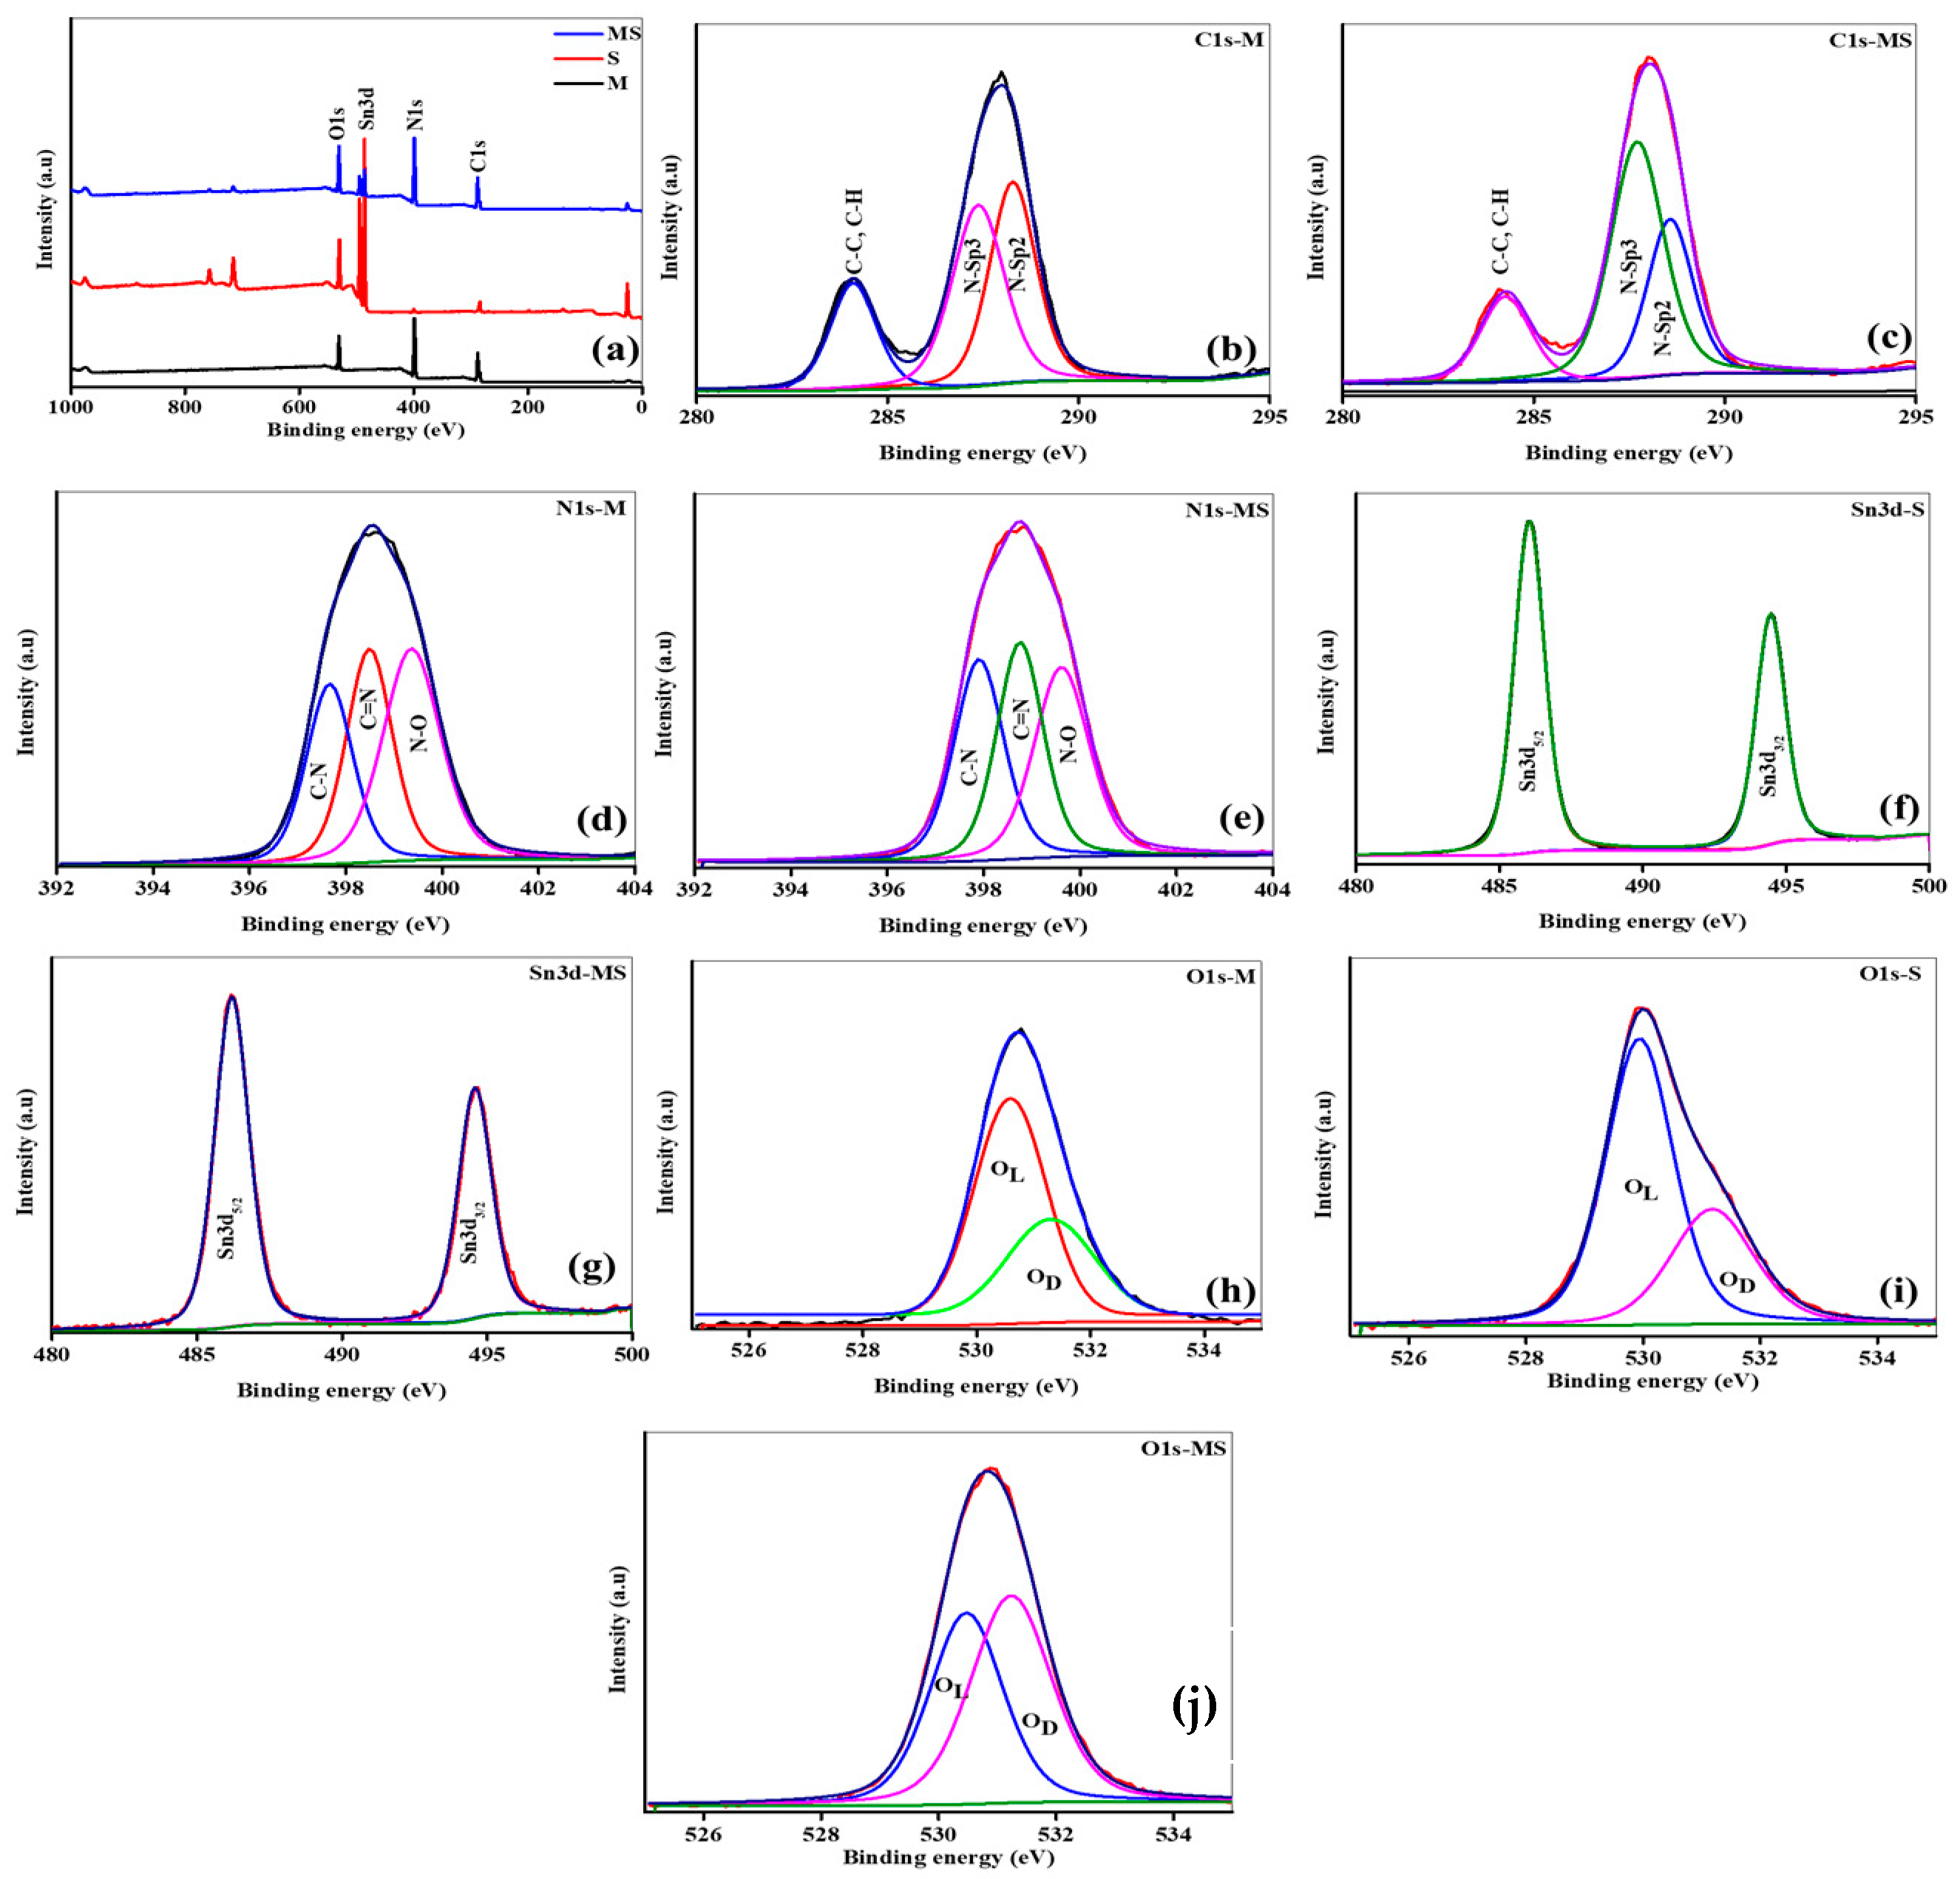
XPS is a technique for investigating the chemical composition and oxidation states of the pure melamine cyanurate, SnO2 QDs, and the nanostructure of melamine cyanurate microrods decorated with SnO2 QDs. The survey spectra indicate the attendance of core elements observed at 285 eV, 400 eV, 495.1 eV, and 510 eV link to C, N, Sn, and O, respectively, as shown in Figure 3a. To examine the peak shift, curve fitting was achieved with the aid of the Gaussian–Lorentzian method. Prior to the peaks fitting, a Shirley baseline correction was done. Figure 3b shows the high-resolution C1s spectra of the melamine cyanurate sample peak at 284 eV are related to C-C and C-H bonds. The second spectrum can be deconvoluted into two various peaks positioned at 285.6 eV and 287.3 eV related to various nitrogen bonding states in carbon, i.e., the N-sp2 C and N-sp3 C, respectively [33]. Similarly, there is no shift in the peak location but slight changes in the intensity of C-C and C-H bonds and nitrogen bonding state in carbon in the MS sample may be due to the incorporation of tin atoms, as shown in Figure 3c. High-resolution N1s spectra of melamine cyanurate sample can be deconvoluted into three major peaks located at 397 eV, 398 eV, and 399 eV, corresponding to C-N, C=N, and N-O bonds, as seen in Figure 3d. Similarly, there is a slightly difference observed in the intensity of bonds as presented in Figure 3e. The results in Figure 3f,g show that Sn is a 4+ oxidation state, confirmed due to the two main peaks occurring at the energies of 486.7 and 495.1 eV, consistent with Sn3d5/2 and Sn3d3/2, respectively. The energy difference of Sn major peaks is 8.4 eV. There are no changes observed in the results of the (M and MS) samples. The deconvolution of the O1s spectra in all (M, S, and MS) samples reveals that the peak at an energy of 529.75 eV appeared due to the lattice oxygen, and the adsorbed oxygen (Oab) peak appeared at 531.4 eV in the samples, indicating the quality of the material, as shown in Figure 3h–j.
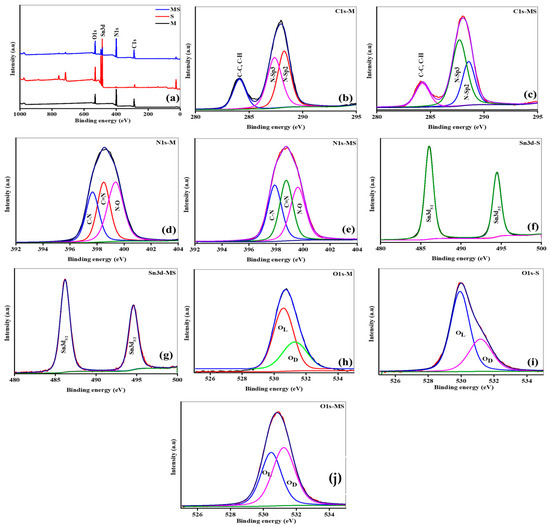
Figure 3.
(a) XPS survey of samples of melamine cyanaurate microrods (M), SnO2 nanostructures (S), and melamine cyanaurate microrods adorned with SnO2 quantum dots (MS); (b,c) core XPS C1s spectra; (d,e) core XPS N1s spectra; (f,g) core XPS Sn3d spectra; and (h–j) core XPS O1s spectra.
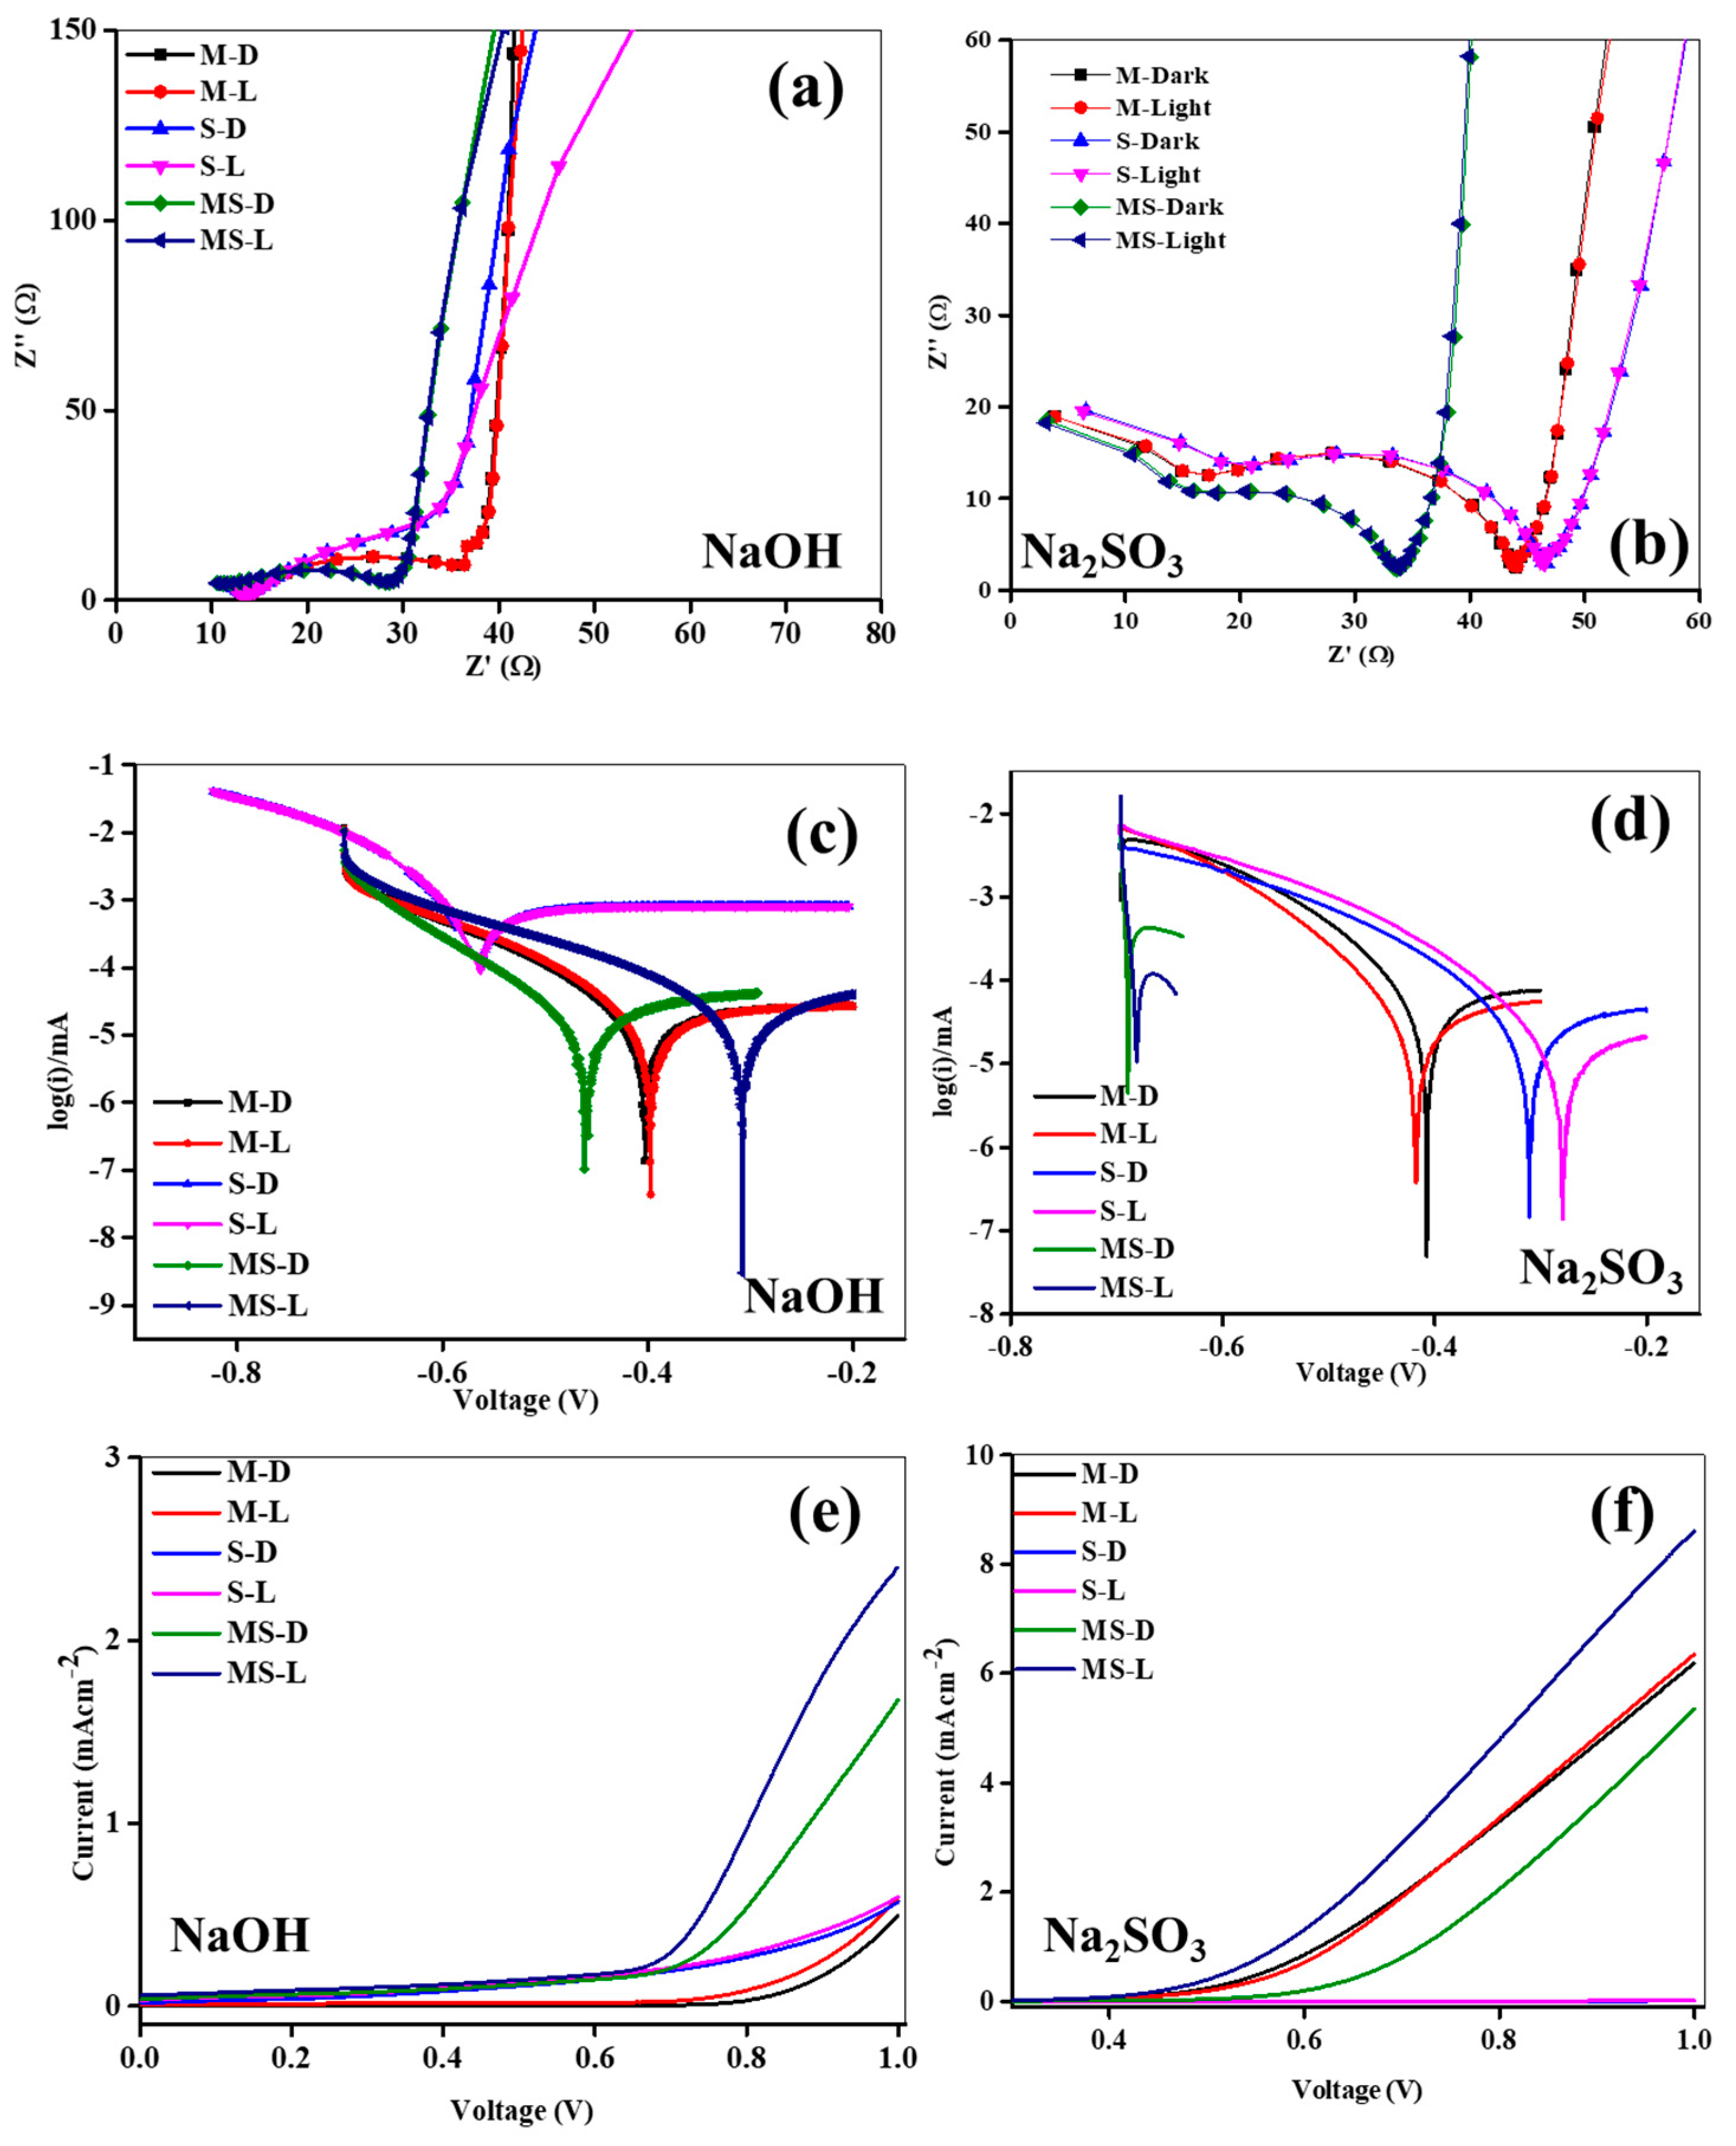
The impedance spectroscopy (EIS) was employed to discover the structure kinetics in 0.1 M NaOH and Na2SO3 liquids in both ON and OFF states, with the resulting insights holding considerable importance for photoelectrochemical (PEC) activity. The EIS outlines of all meticulously developed anodes are illustrated in Figure 4a,b, and the Nyquist plots of the structures manifest consistent tendencies in response to electrolytes and ON/OFF modes. The observed presence of arches and an inclined line at superior and minor frequencies, respectively, signify resistive and capacitive behaviors at the junction edge, attributed to interactions between the selected supportive liquids and the developed electrodes. In the plots, the larger semicircle at upper frequencies is indicative of anode kinetics, while the inclined line at minor frequencies points to energetic diffusion. Noteworthy is the larger arc diameter under dark conditions compared to light conditions for the electrodes in both electrolytes, indicating a favorable response to irradiation. This suggests heightened induced kinetics and a reduced resistance under the illuminated mode, affirming the occurrence of charge movement at the interface during illumination. Remarkably, the MS anode exhibits an inferior semicircle radius in both electrolytes compared to the M and S structures under the illuminated state. To gain deeper insights into the charge passage dynamics of the electrodes, all detailed plots were fitted with an elemental model (Figure S2), and the consistent variables are detailed in Table 1. The fitted circuit offers intricate information on charge transportation, deceiving, and passage at the interface junction. Variables such as R1, R2, R3, C1, and C3 in Figure S2 denote supportive electrolyte resistance, trail resistance, movement resistance, intact capacitance, and layered capacitance, respectively. The R1 values for all structures range between 1.36 Ω and 13.74 Ω in both liquid electrolytes under OFF/ON modes. However, in the 0.1 M NaOH liquid, the R1 of all electrodes is marginally more than that in the 0.1 M Na2SO3 under the dark/light mode, demonstrating an inferior resistance at the junction conducive to improved charge movement likened to the NaOH liquid. Particularly, the MS anode in the illuminated mode in the 0.1 M Na2SO3 electrolyte exhibits the lowest R1 of 1.36 Ω. Moreover, the ion-conducting path resistance (R2) of the anode structure in the NaOH electrolyte surpasses that in the Na2SO3 electrolyte in the ON/OFF modes. The MS photoelectrode in the 0.1 M Na2SO3 electrolyte demonstrates the lowest R2 value of 30.28 Ω under irradiation. Moreover, the reduced parameters of both R1 and R2 in the 0.1 M Na2SO3 electrolyte signify a structure that experiences a decrease in pair recombination rate owing to the upgraded voyage path at the junction compared to the 0.1 M NaOH electrolyte. The transfer resistances across all structures fall within the range of 6.92 kΩ to 0.92 kΩ. Notably, the R3 values in the Na2SO3 are inferior to those in the NaOH in the ON/OFF modes. The MS photoelectrode exhibits the lowermost transfer resistance of 929.71 Ω under light irradiation, suggesting its potential for photoelectrochemical (PEC) activity likened to other anodes. Consequently, the MS anode displays superior PEC activity in the irradiation mode, in conjunction with other anodes [34]. Significant deviations in capacitances are observed in the ON/OFF modes in both electrolytes. The C1 and C3 values of the anodes in the Na2SO3 electrolyte are inferior to those in the NaOH electrolyte, with all electrodes varying between 258.84 nF to 2.48 nF for C1 and 14.36 mF to 7.72 mF for C3. Characteristically, a double layer forms at the anode–electrolyte interface, isolating the energetic anode from the electrolyte with a short-term dielectric layer that exhibits capacitive performance. This leads to the generous accretion of electron–hole in the double layer. Moreover, the MS anode displays a more slanted slope at lesser frequencies, representing noticeably boosted ion migration kinetics. This suggests that the amalgamation of M and S upsurges the more energetic sites, thereby improving mass diffusion and oxygen kinetics. Furthermore, the Bode plots of all anodes in OFF/ON modes in both NaOH and Na2SO3 are illustrated in Figure S3a,c, and they are consigned to a mono time zone. The anodes in both electrolytes reveal comparable tendencies in both modes. For all electrodes, the deviance of |Z| with the given frequencies is established as a conformist line at lesser and middle frequencies. The OH− diffusion resistance in the electrolyte is attributed to the superior path between the counter and junction interface [35]. Additionally, the Bode phase plots of all anodes in the OFF/ON modes of both liquids are presented in Figure S3b,d. In both electrolytes, all developed structures show the same tendencies in the ON/OFF modes, illustrating electron transport and charge loss.
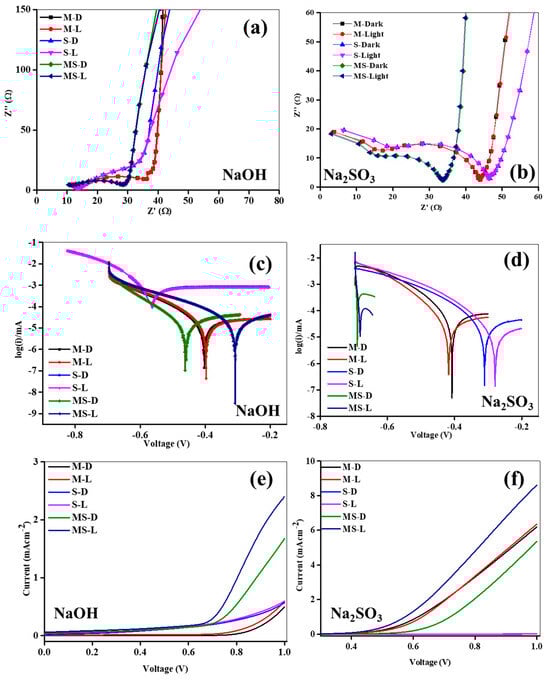
Figure 4.
(a,b) Impedance analysis of sample electrodes of melamine cyanaurate microrods (M), SnO2 nanostructures (S), and melamine cyanaurate microrods adorned with SnO2 quantum dots (MS) under dark and light conditions in 0.1 M NaOH and Na2SO3 electrolytes; (c,d) Tafel analysis of sample electrodes of melamine cyanaurate microrods (M), SnO2 nanostructures (S), and melamine cyanaurate microrods adorned with SnO2 quantum dots (MS) under dark and light conditions in 0.1 M NaOH and Na2SO3 electrolytes, and (e,f) linear voltammetry of sample electrodes of melamine cyanaurate microrods (M), SnO2 nanostructures (S), and melamine cyanaurate microrods adorned with SnO2 quantum dots (MS) under dark and light conditions in 0.1 M NaOH and Na2SO3 electrolytes.

Table 1.
Nyquist-fitted values of the electrodes under ON/OFF states in 0.1 M NaOH and Na2SO3 electrolytes.
A Tafel analysis was carried out on the M, S, and MS photoelectrodes to elucidate the H2 evolution mechanism in different electrolytes in the ON/OFF modes. The logged Tafel plots for the M, S, and MS are depicted in Figure 4c,d. During ON mode, a discernible shift in voltage towards the anode was seen for all anodes in both solutions related to the dark mode. This observation means that the developed anodes create an increased number of charges, significantly contributing to the enhancement of PEC activity. Notably, a more pronounced positive shift was noted in the Na2SO3 electrolyte compared to the NaOH electrolyte. Additionally, the logged Tafel plots of the developed samples under both OFF and ON conditions in both solutions were fitted to get the Tafel slopes, with the restrictive diffusion (Jid) and exchange (Jed) photocurrent density presented in Table 2. Normally, an inferior Tafel slope signifies that the developed structures necessitate lower voltages for charge generation. Jid and Jed serve as an indicator of the diffusion coefficient and current transfer rate of the anodes, respectively [36]. However, interpretation of the Tafel plots requires caution, as the Tafel slope deviates intricately, contingent upon numerous limitations, including response paths, preparation, energetic sites, and material types [37]. The Tafel slopes acquired for the developed anodes in the Na2SO3 electrolyte are inferior to those in the NaOH electrolyte in the ON/OFF modes. Moreover, these slopes exhibit inferior values in the illuminated state compared to the dark mode for all samples in the solutions. In either electrolyte, the Tafel slopes of the MS photoelectrode are smaller compared to the M and S electrodes. The MS electrode demonstrates the least Tafel slope of 47.8 mVdec−1 under the ON condition in the Na2SO3 electrolyte, signifying efficient charge generation and rapid charge kinetics [38]. The different Tafel behavior of S, M, and MS samples in NaOH and Na2SO3 may be due to variations of kinetics and migration of induced charges at the interfaces. Also, the electrode’s compatibility with the electrolytes under test conditions is related to the resistance values of the prepared electrodes. The Jid and Jed values of the samples were assessed in dark/light modes in both solutions, as presented in Table 2. The Jid and Jed in the Na2SO3 are inferior to that in the NaOH in both states. Mostly, in either electrolyte, the Jid and Jed values in OFF mode are higher related to the ON conditions. Furthermore, the Jid and Jed values of the MS sample are inferior to those of the M and S in the OFF/ON modes in both solutions. The MS electrode exhibits the lowest Jid and Jed of −4.17 and −3.30 mAcm−2, respectively, in the ON mode in the Na2SO3, representing an upper transmission rate and a superior diffusion coefficient. Consequently, MS may demonstrate improved PEC activity in the illumination mode.
Table 2.
Tafel-fitted analysis values of the electrodes under ON/OFF states in 0.1 M NaOH and Na2SO3 electrolytes.
To assess the generation of charge carriers through illuminated mode at the junction interface, voltammetry (LV) analysis proves to be a suitable method for estimating the electrochemical (EC) activity. LV analyses were conducted on all synthesized M, S, and MS samples in 0.1 M Na2SO3 and NaOH solutions in the OFF/ON modes, and the corresponding data is presented in Figure 4e,f. Each synthesized electrode demonstrated an escalating photocurrent generation in response to the given voltages, with the recorded induced currents for the samples referenced contrary to the reference electrode. With the presence of NaOH electrolyte, the M, S, and MS photoelectrodes exhibited zero currents until applied potentials of approximately ~0.72, ~0.78, and ~0.58 V (vs. Ag/AgCl), respectively, and subsequently displayed steadily growing currents. Also, in the presence of Na2SO3 electrolyte, the M, S, and MS photoelectrodes displayed nil currents up to given voltages of ~0.45, ~0.89, and ~0.38 V (vs. Ag/AgCl), respectively, followed by a gradual increase in currents. Notably, the onset voltage in the Na2SO3 electrolyte was significantly inferior to that in the NaOH electrolyte, indicating that the given voltages were essentially insufficient to create currents in the Na2SO3 electrolyte. Moreover, the MS in the Na2SO3 in the illuminated mode exhibited a considerably lower onset voltage linked to the other samples, suggesting a difference in surface states and a reduction in recombination rate due to interfacial interactions amid the M and S. At given sweep voltages, the overall currents produced by all anodes in the Na2SO3 electrolyte surpassed those in the NaOH under OFF/ON modes. The currents in the Na2SO3 were approximately ~6.28 mAcm−2 more than those in the NaOH, potentially attributed to condensed parameters of R1, R2, and R3. Regardless of the electrolyte, the currents developed in the ON mode exceeded those under the OFF condition. The MS electrode, particularly in Na2SO3 under the ON state, exhibited a maximum photocurrent of 8.68 mAcm−2, possibly due to superior light utilization activity, an increased more of energetic sites from joint constructions, and inferior resistance and capacitance parameters. Consequently, the MS demonstrated enriched PEC in the light mode.
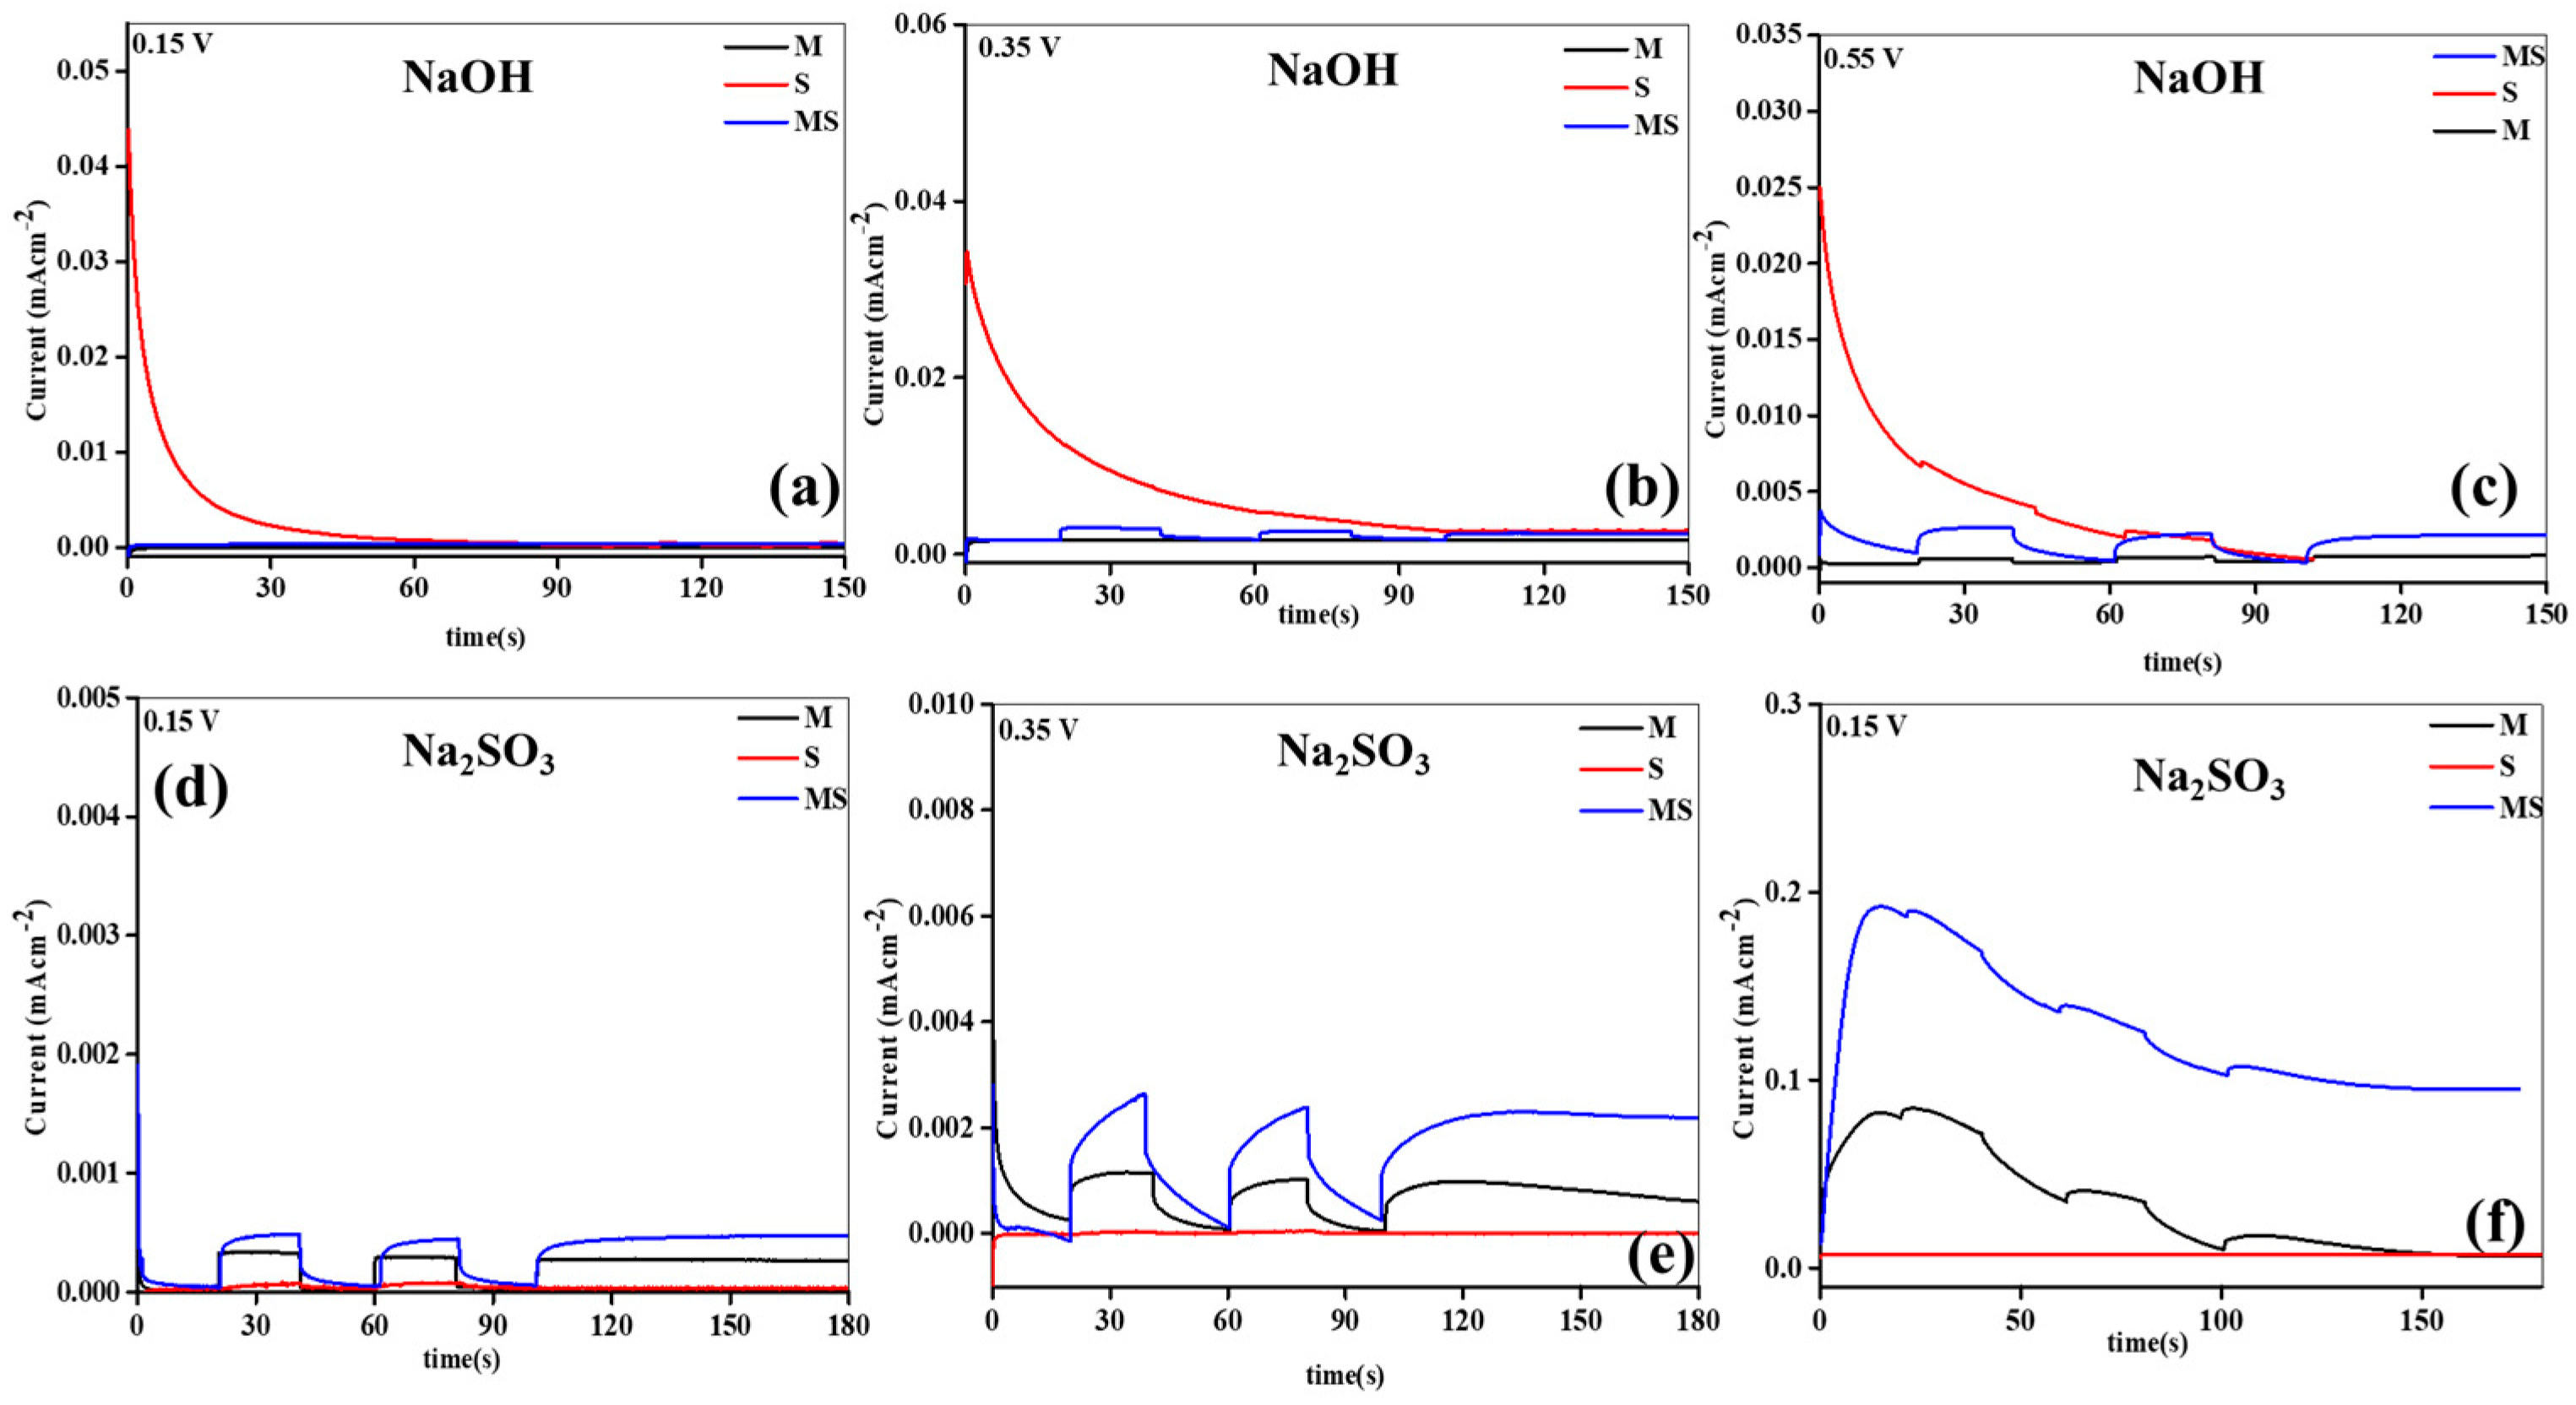
Furthermore, an examination of the effects of given potential, swapping dynamics, and solidity of the developed electrodes was conducted through amperometry in different electrolytes. The outcomes are illustrated in Figure 5a–f. The photoelectrodes displayed discernible variations in photocurrent generation in both electrolytes at altered given voltages. Notably, the Na2SO3 electrolyte revealed higher maximum photocurrents compared to the NaOH, attributed to enhanced interfacial interaction. The order of created currents at different applied potentials in both electrolytes was as follows: 0.15 V < 0.35 V < 0.55 V. Across all voltages, MS consistently demonstrated the highest photocurrent, surpassing the other anodes. In particular, at 0.35 V in the Na2SO3 electrolyte, the utmost induced current of 3 mAcm−2 was detected, outperforming other samples under varied states. The swapping and steady performances of the samples were more pronounced in the Na2SO3 than in the NaOH electrolyte. In the NaOH, no switching was observed at lower applied potentials, while at 0.35 V, switching occurred across all synthesized electrodes. Conversely, in the Na2SO3 electrolyte, clear switching activity was evident at lower applied potentials owing to upgraded interfaces. MS demonstrated distinct swapping and steady performances, coupled with the uppermost currents related to M and S. The superior performance of MS might be attributed to its enhanced capture capacity, higher electrode properties, Tafel slopes, established junction interface, ion-conduction paths, and inferior resistance parameters and recombination rates.
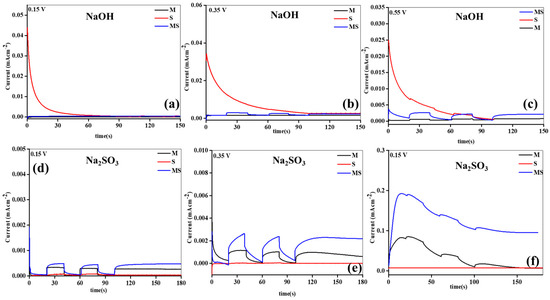
Figure 5.
Amperometry analysis of sample electrodes of (a–f) melamine cyanaurate microrods (M), SnO2 nanostructures (S), and melamine cyanaurate microrods adorned with SnO2 quantum dots (MS) under dark and light conditions in 0.1 M NaOH and Na2SO3 electrolytes at various applied potentials.
4. Conclusions
In this study, we successfully synthesized pristine melamine cyanaurate microrods (M), SnO2 nanostructures (S), and melamine cyanaurate microrods adorned with SnO2 quantum dots (MS) using a straightforward methodology. The tailored surface modifications of the photoelectrodes yielded a substantial impact on photoelectrochemical (PEC) activity. The pinnacle of this influence was observed when MS revealed an outstanding current of 8.68 mAcm−2 under illuminated conditions in a 0.1 M Na2SO3 liquid electrolyte. This achievement can be attributed to the amalgamation of factors, including the heightened light absorption capability, diminished transfer resistance, and favorable Tafel slopes inherent in MS. Furthermore, we systematically investigated the impact of the electrolyte on the developed anodes in the ON/OFF modes. Remarkably, all fabricated anodes demonstrated superior currents in 0.1 M Na2SO3 compared to the NaOH counterpart. This phenomenon is likely attributable to the preservation of robust interfacial integrity at the junction interface. Consequently, the MS configuration emerges as highly adept for utilization as photoelectrodes in the context of hydrogen generation through photoelectrochemical (PEC) water splitting.
Supplementary Materials
The following supporting information can be downloaded at: https://www.mdpi.com/article/10.3390/cryst14040302/s1, Figure S1: (a) Raman analysis of melamine cyanaurate microrods (M), SnO2 nanostructures (S), and melamine cyanaurate microrods adorned with SnO2 quantum dots (MS) samples, and (b) FTIR analysis of melamine cyanaurate microrods (M), SnO2 nanostructures (S), and melamine cyanaurate microrods adorned with SnO2 quantum dots (MS) samples; Figure S2: Equivalent circuit of Nyquist analysis, Figure S3: (a,b) Bode analysis of melamine cyanaurate microrods (M), SnO2 nanostructures (S), and melamine cyanaurate microrods adorned with SnO2 quantum dots (MS) samples electrodes under dark and light conditions in 0.1 M NaOH, and Na2SO3 electrolytes; and (c,d) Phase analysis of of melamine cyanaurate microrods (M), SnO2 nanostructures (S), and melamine cyanaurate microrods adorned with SnO2 quantum dots (MS) samples electrodes under dark and light conditions in 0.1 M NaOH, and Na2SO3 electrolytes.
Author Contributions
I.N.R.: conception, experimental design, carrying out measurements and manuscript composition, writing—original draft, B.A.: experimental design, carrying out measurements, M.D.: formal analysis, writing—original draft, validation, J.S.: writing—review and editing, funding acquisition, C.B.: writing—review and editing, project administration. All authors have read and agreed to the published version of the manuscript.
Funding
This work was funded by the National Research Foundation (NRF) of Korea, which is funded by the Korean government (No. RS-2023-00280665).
Data Availability Statement
Data are contained within the article and Supplementary Materials.
Acknowledgments
This work was supported by the National Research Foundation (NRF) of Korea which is funded by the Korean government (No. RS-2023-00280665).
Conflicts of Interest
The authors declare no conflicts of interest.
References
- Hoffmann, M.R.; Martin, S.T.; Choi, W.; Bahnemann, D.W. Environmental Applications of Semiconductor Photocatalysis. Chem. Rev. 1995, 95, 69–96. [Google Scholar] [CrossRef]
- Sakthivel, S.; Neppolian, B.; Shankar, M.V.; Arabindoo, B.; Palanichamy, M.; Murugesan, V. Solar photocatalytic degradation of Azo dye: Comparison of photocatalytic efficiency of ZnO and TiO2. Sol. Energy Mater. Sol. Cells 2003, 77, 65–82. [Google Scholar] [CrossRef]
- Vinodgopal, K.; Kamat, P.V. Enhanced rates of photocatalytic degradation of an Azo dye using SnO2/TiO2 coupled semiconductor thin films. Environ. Sci. Technol. 1995, 29, 841–845. [Google Scholar] [CrossRef] [PubMed]
- Li, L.; Chu, Y.; Liu, Y.; Dong, L. Template-free synthesis and photocatalytic properties of novel, Fe2O3 hollow spheres. J. Phys. Chem. C 2007, 111, 2123–2127. [Google Scholar] [CrossRef]
- Chen, D.; Ye, J. Hierarchical WO3 hollow shells: Dendrite, sphere, dumbbell, and their photocatalytic properties. Adv. Funct. Mater. 2008, 18, 1922–1928. [Google Scholar] [CrossRef]
- Arifin, K.; Yunus, R.M.; Minggu, L.J.; Kassim, M.B. Improvement of TiO2 nanotubes for photoelectrochemical water splitting: Review. Int. J. Hydrogen Energy 2020, 46, 4998–5024. [Google Scholar] [CrossRef]
- Wang, Y.L.; Fan, L.Q.; Sun, S.J.; Chen, J.J.; Wu, Z.X.; Zhu, T.T.; Huang, Y.F.; Wu, J.H. Ti3C2Tx MXene supported SnO2 quantum dots with oxygen vacancies as anode for Li-ion capacitors. Chem. Eng. J. 2022, 428, 131993. [Google Scholar] [CrossRef]
- Das, J.; Dhar, S.S. Synthesis of SnO2 quantum dots mediated by Camellia sinensis shoots for degradation of thiamethoxam. Toxicol. Environ. Chem. 2020, 102, 186–196. [Google Scholar] [CrossRef]
- Zhou, J.T.; Lyu, M.; Zhu, J.; Li, G.N.; Li, Y.T.; Jin, S.Z.; Song, J.L.; Niu, H.H.; Xu, J.Z.; Zhou, R. SnO2 Quantum Dot-Modified Mesoporous TiO2 Electron Transport Layer for Efficient and Stable Perovskite Solar Cells. ACS Appl. Energy Mater. 2022, 5, 3052–3063. [Google Scholar] [CrossRef]
- Jin, W.; Wang, H.; Liu, Y.L.; Yang, S.; Zhou, J.; Chen, W. SnO2 Quantum Dots-Functionalized MoO3 Nanobelts for High-Selectivity Ethylene Sensing. ACS Appl. Nano Mater. 2022, 5, 10485–10494. [Google Scholar] [CrossRef]
- Wu, Z.D.; Jing, H.Y.; Zhao, Y.; Lu, K.R.; Liu, B.Y.; Yu, J.; Xia, X.F.; Lei, W.; Hao, Q.L. Grain boundary and interface interaction Co-regulation promotes SnO2 quantum dots for efficient CO2 reduction. Chem. Eng. J. 2023, 451, 138477. [Google Scholar] [CrossRef]
- Reddy, I.N.; Manjunath, V.; Shim, J. SnO2 QDs-decorated V2O5 nanobelts for photoelectrochemical water splitting under visible light. Ceram. Int. 2021, 47, 21127–21139. [Google Scholar] [CrossRef]
- Zou, Y.; Xie, Y.; Yu, S.; Chen, L.; Cui, W.; Dong, F.; Zhou, Y. SnO2 quantum dots anchored on g-C3N4 for enhanced visible-light photocatalytic removal of NO and toxic NO2 inhibition. Appl. Surf. Sci. 2019, 496, 143630. [Google Scholar] [CrossRef]
- Zhu, A.; Zhao, Q.; Li, X.; Shi, Y. BiFeO3/TiO2 nanotube arrays composite electrode: Construction, characterization, and enhanced photoelectrochemical properties. ACS Appl. Mater. Interfaces 2014, 6, 671–679. [Google Scholar] [CrossRef] [PubMed]
- Li, Y.; Zhang, D.; Fan, J.; Xiang, Q. Highly crystalline carbon nitride hollow spheres with enhanced photocatalytic performance. Chin. J. Catal. 2021, 42, 627–636. [Google Scholar] [CrossRef]
- Huang, M.; Yu, J.; Li, B.; Deng, C.; Wang, L.; Wu, W.; Dong, L.; Zhang, F.; Fan, M. Intergrowth and coexistence effects of TiO2-SnO2 nanocomposite with excellent photocatalytic activity. J. Alloys Compd. 2015, 629, 55–61. [Google Scholar] [CrossRef]
- Niu, M.; Huang, F.; Cui, L.; Huang, P.; Yu, Y.; Wang, Y. Hydrothermal synthesis, structural characteristics, and enhanced photocatalysis of SnO2/α-Fe2O3 semiconductor nanoheterostructures. ACS Nano 2010, 4, 681–688. [Google Scholar] [CrossRef]
- Wen, Z.; Wang, G.; Lu, W.; Wang, Q.; Zhang, Q.; Li, J. Enhanced photocatalytic properties of mesoporous SnO2 induced by low concentration ZnO doping. Cryst. Growth Des. 2007, 7, 1722–1725. [Google Scholar] [CrossRef]
- Zhang, Z.Y.; Shao, C.L.; Li, X.H.; Zhang, L.; Xue, H.M.; Wang, C.H.; Liu, Y.C. Electrospun nanofibers of ZnO-SnO2 heterojunction with high phtocatalytic activity. J. Phys. Chem. C 2010, 114, 7920–7925. [Google Scholar] [CrossRef]
- Jiang, F.; Li, R.; Cai, J.; Xu, W.; Cao, A.; Chen, D.; Zhang, X.; Wang, C.; Shu, C. Ultrasmall Pd/Au bimetallic nanocrystals embedded in hydrogen-bonded supramolecular structures: Facile synthesis and catalytic activities in the reduction of 4-nitrophenol. J. Mater. Chem. A 2015, 3, 19433–19438. [Google Scholar] [CrossRef]
- Biju, C.S.; Raja, D.H.; Padiyan, D.P. Fabrication of α-Fe2O3 hexagonal disc/SnO2 nanoparticle semiconductor nanoheterostructures and its properties. Chem. Phys. Lett. 2015, 619, 1–6. [Google Scholar] [CrossRef]
- Cheng, H.; Shapter, J.G.; Li, Y.; Gao, G. Recent progress of advanced anode materials of lithium-ion batteries. J. Energy Chem. 2021, 57, 451–468. [Google Scholar] [CrossRef]
- Herbstein, F.H. Purported “melamine cyanuric acid trihydrochloride” C3H6N6·C3H3N3O3·3HCl is actually “diprotonated-melamine cyanuric acid dichloride dihydrate” (C3H8N6)2+·C3H3N3O3·2Cl−·2H2O. J. Chem. Crystallogr. 2003, 33, 527–529. [Google Scholar] [CrossRef]
- Seifer, G.R. Cyanuric acid and cyanurates. Russ. J. Coord. Chem. 2002, 28, 301–324. [Google Scholar] [CrossRef]
- Jones, W.J.; Orville-Thomas, W.J. The infra-red spectrum and structure of dicyandiamide. Trans. Faraday Soc. 1959, 55, 193–202. [Google Scholar] [CrossRef]
- Larkin, P.J.; Makowski, M.P.; Colthup, N.B.; Flood, L.A. Vibrational analysis of some important group frequencies of melamine derivatives containing methoxymethyl, and carbamate substituents: Mechanical coupling of substituent vibrations with triazine ring modes. Vib. Spectrosc. 1998, 17, 53–72. [Google Scholar] [CrossRef]
- Debrus, S.; Marchewka, M.K.; Drozd, M.; Ratajczak, H. Vibrational, calorimetric and nonlinear optical studies of melaminium-bis(trichloroacetate) monohydrate molecularionic crystal. Opt. Mater. 2007, 29, 1058–1062. [Google Scholar] [CrossRef]
- García-López, E.; Marci, G.; Serpone, N.; Hidaka, H. Photoassisted oxidation of the recalcitrant cyanuric acid substrate in aqueous ZnO suspensions. J. Phys. Chem. C 2007, 111, 18025–18032. [Google Scholar] [CrossRef]
- Saatlu, A.M.; Procek, M.; Mattsson, C.; Thungstrom, G.; Torndahl, T.; Li, B.; Su, J.; Xiong, W.; Radamson, H.H. Nanometer-thick ZnO/SnO2 heterostructures grown on alumina for H2S sensing. ACS Appl. Nano Mater. 2022, 5, 6954–6963. [Google Scholar] [CrossRef]
- Zulfqar, S.; Iqbal, Z.; Lü, J. Zn–Cu-codoped SnO2 nanoparticles: Structural, optical, and ferromagnetic behaviors. Chin. Phys. B 2017, 26, 126104. [Google Scholar] [CrossRef]
- Bhattacharjee, A.; Ahmaruzzaman, M. A green and novel approach for the synthesis of SnO2 nanoparticles and its exploitation as a catalyst in the degradation of methylene blue under solar radiation. Mater. Lett. 2015, 145, 74. [Google Scholar] [CrossRef]
- Garg, D.; Shmila, T.; Mark, G.; Mondal, S.; Battula, V.R.; Volokh, M.L.; Shalom, M. The Design of Supramolecular Assemblies with Metal Saltas Precursors Enables the Growth of Stable PolymericCarbon Nitride Photoanodes. Adv. Sustain. Syst. 2023, 2300447. [Google Scholar] [CrossRef]
- Mao, Y.; Duan, H.; Xu, B.; Zhang, L.; Hu, Y.; Zhao, C.; Wang, Z.; Chen, L.; Yang, Y. Lithium storage in nitrogen-rich mesoporous carbon materials. Energy Environ. Sci. 2012, 5, 7950–7955. [Google Scholar] [CrossRef]
- El ouardi, M.; El Idrissi, A.; Arab, M.; Zbair, M.; Haspel, H.; Saadi, M.; Ahsaine, H.A. Review of photoelectrochemical water splitting: From quantitative approaches to effect of sacrificial agents, oxygen vacancies, thermal and magnetic field on (photo)electrolysis. Int. J. Hydrogen Energy 2024, 51, 1044–1067. [Google Scholar] [CrossRef]
- Lopes, T.; Andrade, L.; Ribeiro, H.A.; Mendes, A. Characterization of photoelectrochemical cells for water splitting by electrochemical impedance spectroscopy. Int. J. Hydrogen Energy 2010, 35, 11601–11608. [Google Scholar] [CrossRef]
- Reddy, I.N.; Sreedhar, A.; Reddy, C.V.; Shim, J.; Cho, M.; Yoo, K.; Kim, D.; Gwag, J.S. High performance hierarchical SiCN nanowires for efficient photocatalytic -photoelectrocatalytic and supercapacitor applications. Appl. Catal. B Environ. 2018, 237, 876–887. [Google Scholar] [CrossRef]
- Liao, L.; Zhu, J.; Bian, X.; Zhu, L.; Scanlon, M.D.; Girault, H.H.; Liu, B. MoS2 Formed on Mesoporous Graphene as a Highly Active Catalyst for Hydrogen Evolution. Adv. Funct. Mater. 2013, 23, 5326–5333. [Google Scholar] [CrossRef]
- Suen, N.; Hung, S.; Quan, Q.; Zhang, N.; Xu, Y.; Chen, H.M. Electrocatalysis for the oxygen evolution reaction: Recent development and future perspectives. Chem. Soc. Rev. 2017, 46, 337–365. [Google Scholar] [CrossRef] [PubMed]
Disclaimer/Publisher’s Note: The statements, opinions and data contained in all publications are solely those of the individual author(s) and contributor(s) and not of MDPI and/or the editor(s). MDPI and/or the editor(s) disclaim responsibility for any injury to people or property resulting from any ideas, methods, instructions or products referred to in the content. |
© 2024 by the authors. Licensee MDPI, Basel, Switzerland. This article is an open access article distributed under the terms and conditions of the Creative Commons Attribution (CC BY) license (https://creativecommons.org/licenses/by/4.0/).