Article

Near-Infrared Spectroscopic Study of Biotite–Phlogopite (Mg# = 30~99): OH-Stretching Modes and Mg# Content Prediction Equation

1
School of Gemology, China University of Geosciences, Beijing 100083, China
2
National Mineral Rock and Fossil Specimens Resource Center, China University of Geosciences, Beijing 100083, China
3
Sciences Institute, China University of Geosciences, Beijing 100083, China
*
Author to whom correspondence should be addressed.
Crystals 2024, 14(4), 336; https://doi.org/10.3390/cryst14040336
Submission received: 6 March 2024 / Revised: 28 March 2024 / Accepted: 29 March 2024 / Published: 31 March 2024
(This article belongs to the Section Mineralogical Crystallography and Biomineralization)

Abstract

:
Biotite–phlogopite minerals are a complete Mg–Fe isomorphism series of phyllosilicates. A Fourier transform infrared spectroscopy (FTIR) and electron microprobe analysis (EMPA) were conducted on end-member phlogopite, Mg–biotite, and annite samples. In the mid-infrared region, absorption peaks were observed at 460, 1000, 3680, and 3710 cm−1 in the biotite group. Samples with higher Mg content exhibited stronger peaks assigned to OH vibrations and a weak absorption peak at 810 cm−1. In the near-infrared region, combination peaks were observed near 4200, 4300, and 4450 cm−1, with wavenumbers showing a linear inverse relationship with the Mg# [=100 × Mg/(Mg + FeT)] value. For annite, combination peaks occurred at 4173, 4292, and 4439 cm−1, decreasing by 10–15 cm−1 compared to end-member phlogopite. Judging the fundamental peaks of the combination band contributes to identifying suitable near-infrared characteristic peaks for quantitative research. The 4300 cm−1 absorption peak in biotite–phlogopite was assigned to OH-bending and -stretching vibrations, making it suitable for mineral identification and Mg# estimations across all biotite groups. The 4450 cm−1 characteristic peak, assigned to Al–O-stretching vibrations and OH-stretching vibrations, is suitable for accurately predicting Mg# values in high AlVI samples. The first overtones of biotite–phlogopite appeared at 7250 cm−1, with an average factor of 1.955 between the fundamental and corresponding overtones. This study aims to refine the patterns of OH-stretching vibrations and characteristic peak shifts in the near-infrared spectral region of phyllosilicate minerals, providing data references for planetary spectroscopy and ore deposit studies.

1. Introduction

Biotite–phlogopite (biotite group) are common trioctahedral phyllosilicates characterized by the formula K{(Mg, Fe)3[AlSi3O10](OH)2}. Mg is the third most abundant lithophile element on Earth, with the vast majority (>99%) of Mg residing in the mantle. The Mg# content and chemical composition of biotite–phlogopite is used to represent the physicochemical conditions of magmatic–hydrothermal systems, providing valuable indications for discerning magma genesis, tracing magma crystallization differentiation trends, and characterizing mantle metasomatism [1,2,3,4,5,6,7]. For phlogopite, lower Mg# and higher TiO2 content in phlogopite veins indicate an origin from evolved basaltic melts [8]. Phlogopite in kimberlitic rocks follows a trend of decreasing Mg# and increasing Ti, indicating magma ascent evolution and different crystallization stages [9]. For biotite, the minimal variation in Mg# content among biotite samples from the same mining area indicates that the region experienced a limited influence from late alteration or metamorphism processes (Foster, 1960) [10]. Depending on the oxygen fugacity during cooling, biotite crystallizing from magma may exhibit either a more iron-rich or magnesium-rich trend. These trends are associated with changes in the Mg# content during anhydrous phases and the amount of magnetite present [11]. The I-S-A-type granite classification is commonly employed to identify potential sources and tectonic backgrounds for granite magmatic activity [12,13]. A-type granite and I-type granite are characterized by richness in Fe and Mg, respectively [14]. Near-infrared spectroscopy (NIR), occasionally also known as shortwave infrared (SWIR), is widely used in satellite remote sensing and planetary science. Hydrous mineralogy, including phyllosilicates and hydrated salts, has been identified on Mars [15,16,17]. Conducting a comprehensive study of hydration mineralogy involving phlogopite, researchers investigated the distribution, composition, age, and geomorphic settings of hydrous minerals on Mars. This research offers an enhanced global perspective on the early aqueous environments on Mars and their evolution over time [18]. When employing NIR spectroscopy for the analysis of clay minerals present on the Martian surface, a substantial number of Fe/Mg-rich trioctahedral phyllosilicates currently present significant challenges in identification [19]. Based on the NIR spectroscopic diagnosis of the crystallographic and mineralogical characteristics of phyllosilicates, it is significant to trace their formation origins and surrounding environments [20].
NIR is a high-energy vibrational spectroscopy with a wavelength range from 800 to 2500 nm (12,500 to 4000 cm−1) [21]. The absorption peaks within this spectral range are formed by the combination and fundamental overtone bands [22,23,24]. NIR spectra primarily detect functional groups containing hydrogen, such as C–H bonds, N–H bonds, and O–H bonds [25,26]. High-spectral-resolution remote sensing techniques are susceptible to vibrational frequency coupling interference from water vapor, particularly in the range of OH-stretching (3000–4000 cm−1) vibrations in mid-infrared (MIR) spectra [27]. The OH vibrations of biotite–phlogopite in the NIR range are primarily observed at 4200, 4300, and 4450 cm−1. Vedder et al. (1964) [28] observed two intense double peaks, with one represented as ν(OH) + (496 and 595), while Clark et al. (1990) [24] reported that the combination peaks consist of OH-bending and -stretching vibrations. Due to incomplete studies on the peak assignments of phyllosilicates, scholars are unclear regarding the specific assignment of the fundamental absorption peaks participating in the combination bands. Lypaczewski and Rivard (2018) [29] used reflectance spectroscopy to preliminarily derive equations relating NIR spectra to Mg# content for biotite and chlorite rock samples. The first OH-stretching overtone bands for biotite–phlogopite appear in the 7000–8000 cm−1 region. Post and Crawford (2014) [30] reported a linear relationship constant between the fundamental and overtone bands for clay minerals, and the literature indicates a factor value of approximately 1.95 for kaolinite and dickite [31]. This study aims to address aspects related to biotite–phlogopite in the NIR region: (a) the composition and variation patterns of combination bands related to OH-stretching vibrations (variables: Mg#, AlVI); (b) the linear relationship constant between the first overtone bands and fundamental bands as well as the verification of peak assignments.

2. Materials and Methods

2.1. Materials

A total of 15 representative rock samples were selected, all of which were natural minerals (Table 1). Samples GC10, JAG13, JAG17, JAD04, JAG18, G18, and JAI-1 were from the southern part of Jia-Yi Village, Ji’an County, Tonghua City, Jilin Province, China. Samples LFC5 and LFC6 are from the Wengquangou Boron ore in Fengcheng City, Dandong City, Liaoning Province, China. Phlogopite samples are well-formed and fully developed parts of a vein of phlogopite. Fresh phyllosilicate minerals were separated from these samples. Biotite samples (NB98, XL07) were selected from granite rocks, and the mineral particles have not been altered. High-frequency Dielectric Mineral separators and a Belt Type Mineral Electromagnetic separator were used to remove impurities from the surrounding rocks. Biotite samples were selected under a binocular microscope. All samples were crushed to the appropriate granularity.
Phyllosilicate minerals generally exhibit isomorphic substitution, and impurity cations may affect spectroscopic studies. EMPA data indicate that impurity ions in biotite–phlogopite samples are mostly <0.1 (a.p.f.u). Infrared spectroscopy and XRD experiments confirmed that the selected sample powders had no obvious impurity components. All samples could be used for subsequent experimental studies.

2.2. Methods

X-ray powder diffraction experiments were conducted at the Institute of Earth Sciences, China University of Geosciences, Beijing (CUGB). The instrument model is a Smart lab produced by Rigaku Company in Japan. The experimental condition was a Cu target operating at 40 kV and 200 mA. The measurements were conducted in a stepping scanning mode with a scanning speed of 4°/min and a step length of 0.02° within the range of 3–90°. X-ray powder diffraction data of the samples were processed and analyzed using MDI Jade 6.5 software. Before analysis, the acquired data on diffraction line relative intensity (I) and crystal spacing (d) were compared with standard data from the International Centre for Diffraction Data (ICDD) PDF cards. Baseline correction and standardization procedures were properly completed prior to data processing.
Fourier transform infrared spectroscopy (FTIR) was used with the Bruker Tensor II spectrometer at the National Mineral Rock and Fossil Specimens Resource Center (NIMRF), China University of Geosciences, Beijing (CUGB). The spectra were collected in transmission mode in a KBr tablet under conditions of 25 °C and 40% humidity. The MIR spectrum scanning range was 400–4000 cm−1 with a resolution of 4 cm−1, and the biotite–phlogopite to KBr ratio was 1:150.
For FTIR in the near-infrared spectrum, the scanning range was 4000~8000 cm−1, with a resolution of 8 cm−1. Clay samples are often composed of aggregates of small particles with sizes roughly comparable to the wavelength of near-infrared light. If the particle size is larger than or close to the infrared wavelength, the infrared light will be affected by multiple scattering within the particles, leading to interference effects that reduce the signal intensity [33,34]. The shape of the samples also has an impact on the spectral signal [34]. It was challenging to uniformly grind samples to sizes smaller than the near-infrared wavelength (above 6000 mesh), particularly considering the relatively low number of OH groups in the biotite–phlogopite minerals. Therefore, the sample-to-KBr ratio was increased to 1:15 to enhance the spectral signal. Each spectrum was averaged from 64 scans to improve the signal-to-noise ratio, and baseline correction and normalization were performed.
The peak spacing in the infrared spectra is relatively small. Overlapping peaks may occur at the positions of vs. (very strong) and sh. (shoulder) peaks. This leads to the emergence of a strong central branch, often flanked by partially resolved branches on either side [35]. In the first step of data processing, Fourier self-deconvolution was used to identify the positions and quantities of peaks [36]. To minimize errors, the results are compared with the second derivative of the peaks. Infrared spectroscopy second derivative analysis is a well-established method in literature [37]. The second step involves using Peakfit v4.12 software. Peak widths were constrained to values approximately equal to those known for similar mica compositions [38]. We consistently apply the Gaussian–Lorentz area function, a function suitable for spectroscopic research. Drawing from literature suggesting that crystals and non-aqueous fluids exhibit symmetrical peak shapes, precise fitting can be achieved using Gaussian–Lorentzian functions [39]. The Gaussian Deconvolution Method is employed for fitting, R2 > 0.99.
Raman microprobe spectra data were collected at the Gem Lab, School of Gemology, China University of Geosciences in Beijing (CUGB) using a Horiba LabRAM HR-Evolution laser Raman spectrometer. The experimental conditions involved a laser wavelength of 532 nm, a grating of 600 (500 nm), a spectral range of 100–4000 cm−1, a resolution of 1 cm−1, a scanning time of 10 s, and an accumulation of 5 times. The measurements were conducted on polished probe thin sections cleaned with alcohol before each measurement.
Major elements in apatite were analyzed using a JEOL JXA-8230 electron probe microanalyzer at the Key Laboratory of Metallogeny and Mineral Assessment, Chinese Academy of Geological Sciences (CAGS), Beijing, China. Before the experimental test, a spray device was used to cover the surface of the sample with a carbon layer of 20 nm thickness as evenly as possible to enhance the electrical conductivity of the sample. The parameter settings were a 15 kV accelerating voltage and a beam current of 20 nA. With a beam diameter of 5 μm, online data correction was performed using a modified ZAF (atomic number, absorption, and fluorescence) correction procedure.

3. Results

3.1. X-ray Diffraction Analysis

The X-ray diffraction (XRD) test data for 11 samples and the PDF data for biotite–phlogopite from the ICDD database were arranged in order based on Mg# (Figure 1). All characteristic diffraction peaks of the samples correspond to the standard PDF data for phlogopite (Phlogopite1M-PDF#10-0495 or Annite-PDF#73-0250). The strong peaks are observed at d (0 0 1) = 8.695~8.805° (10.132~10.043 Å) and d (0 0 3) = 26.402~26.608° (3.373~3.348 Å), while the weak peak is observed at d(−1 3 1) = 34.000~34.240 (2.634~2.616 Å). The (0 6 0) reflection of all selected samples is 1.535~1.543 Å, indicating that all the samples are trioctahedral mica [40]. Therefore, it can be concluded that the samples consist of a single phase, and all samples are trioctahedral 1M biotite–phlogopite.

3.2. Mineral Element Analysis

Trioctahedral micas have widespread element substitutions. Chemical composition variations generally occur in M-site cations in the octahedral layer. Two main types of substitutions are observed: (1) octahedral layer substitutions (Mg⇌Fe); (2) Tschermak substitution (AlIV, AlVI ⇌ Si, (Mg2+,Fe2+) [41,42]. EMPA analysis reveals minimal impurity elements (Ca, Cr, Ni, Na, Zn approximately equal to 0) in all biotite–phlogopite samples (Table 2). Previous studies suggest that low CaO content in biotite indicates minimal impact from post-magmatic metamorphism [11,43].
Based on the classification diagram of micas minerals [10], the EMPA data (Table 2) is plotted within the ternary coordinate system (Figure 2). Establishing a continuous sample series ranging from phlogopite to annite, with Mg–biotite in between, featuring AlVI varying from 0 to 0.24. According to the literature on peak assignments, the shift in absorption peaks is influenced by elemental content. The notable correlation between the shift of characteristic peaks and elemental content is evident, with variables such as Mg# and AlVI (octahedral coordination Al) standing out as particularly significant. To determine accurate elemental content, extreme values are first removed, and then the average values of each point for the samples are calculated for linear regression analysis.

3.3. Characteristics of MIR Spectra

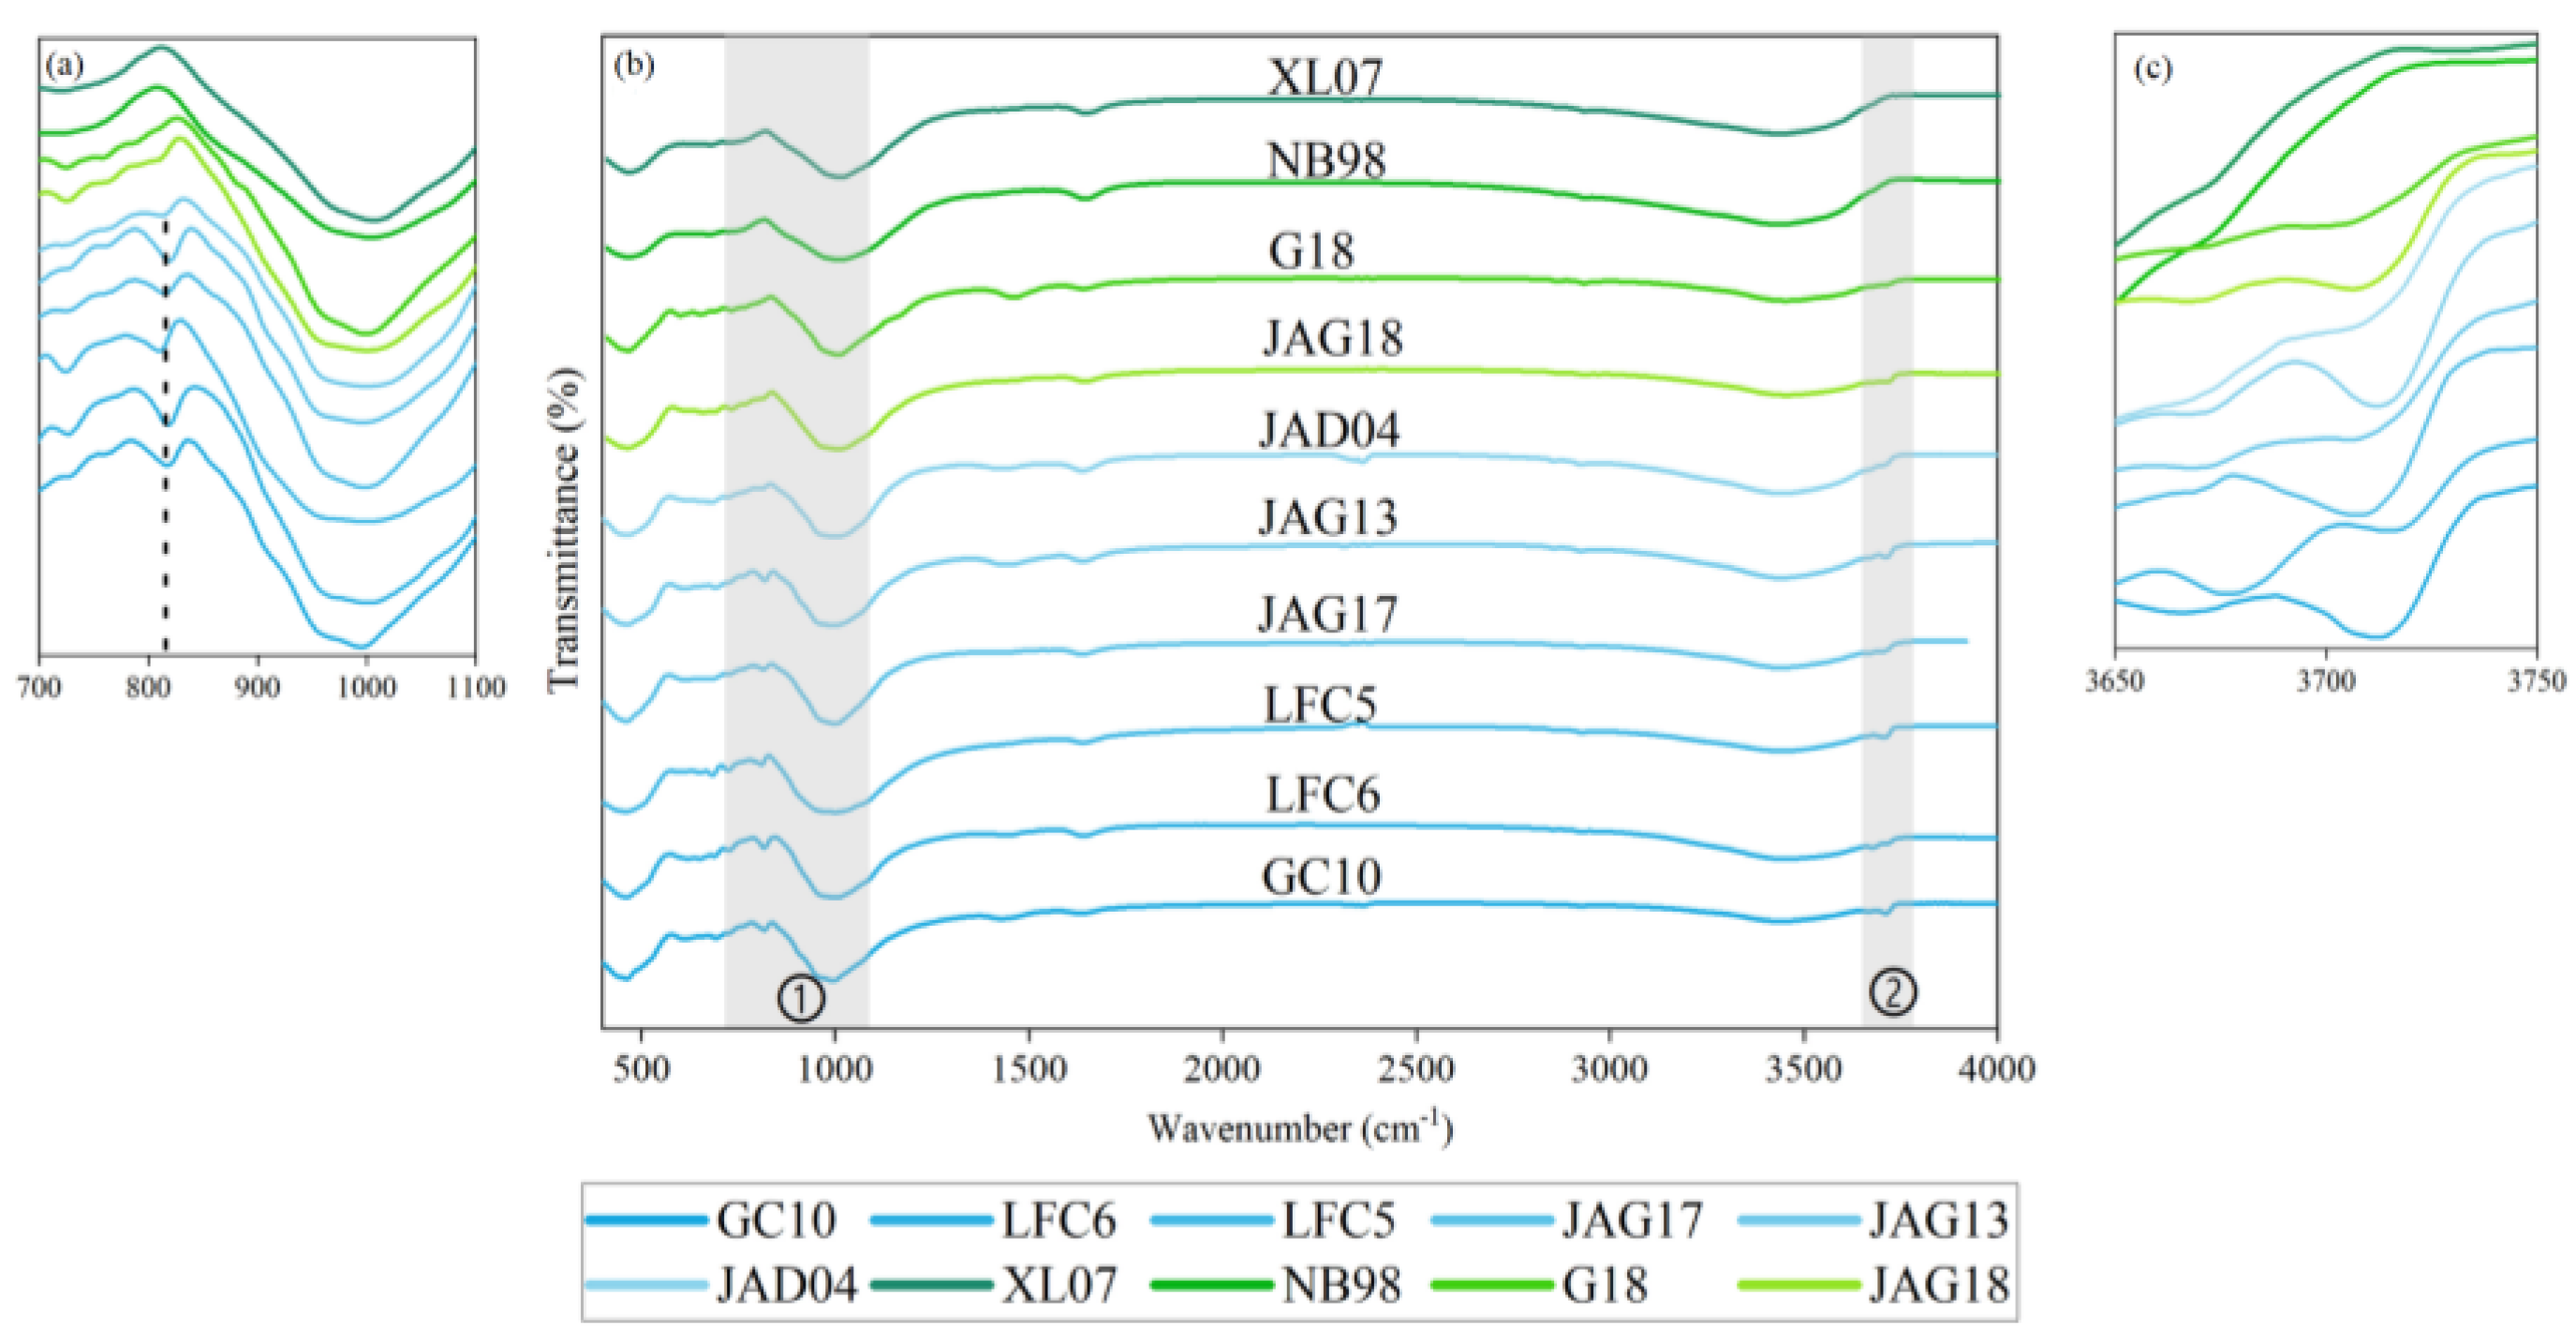
Phlogopite-biotite exhibits three characteristic absorption regions in the mid-infrared spectra (Figure 3b): 400–600 cm−1, 800–1100 cm−1 (Figure 3a), and 3600–3750 cm−1 (Figure 3c). The peaks in all samples approximate the standard mid-infrared spectra, and the characteristic peaks in the spectra can be correctly assigned without additional peaks caused by other phases.
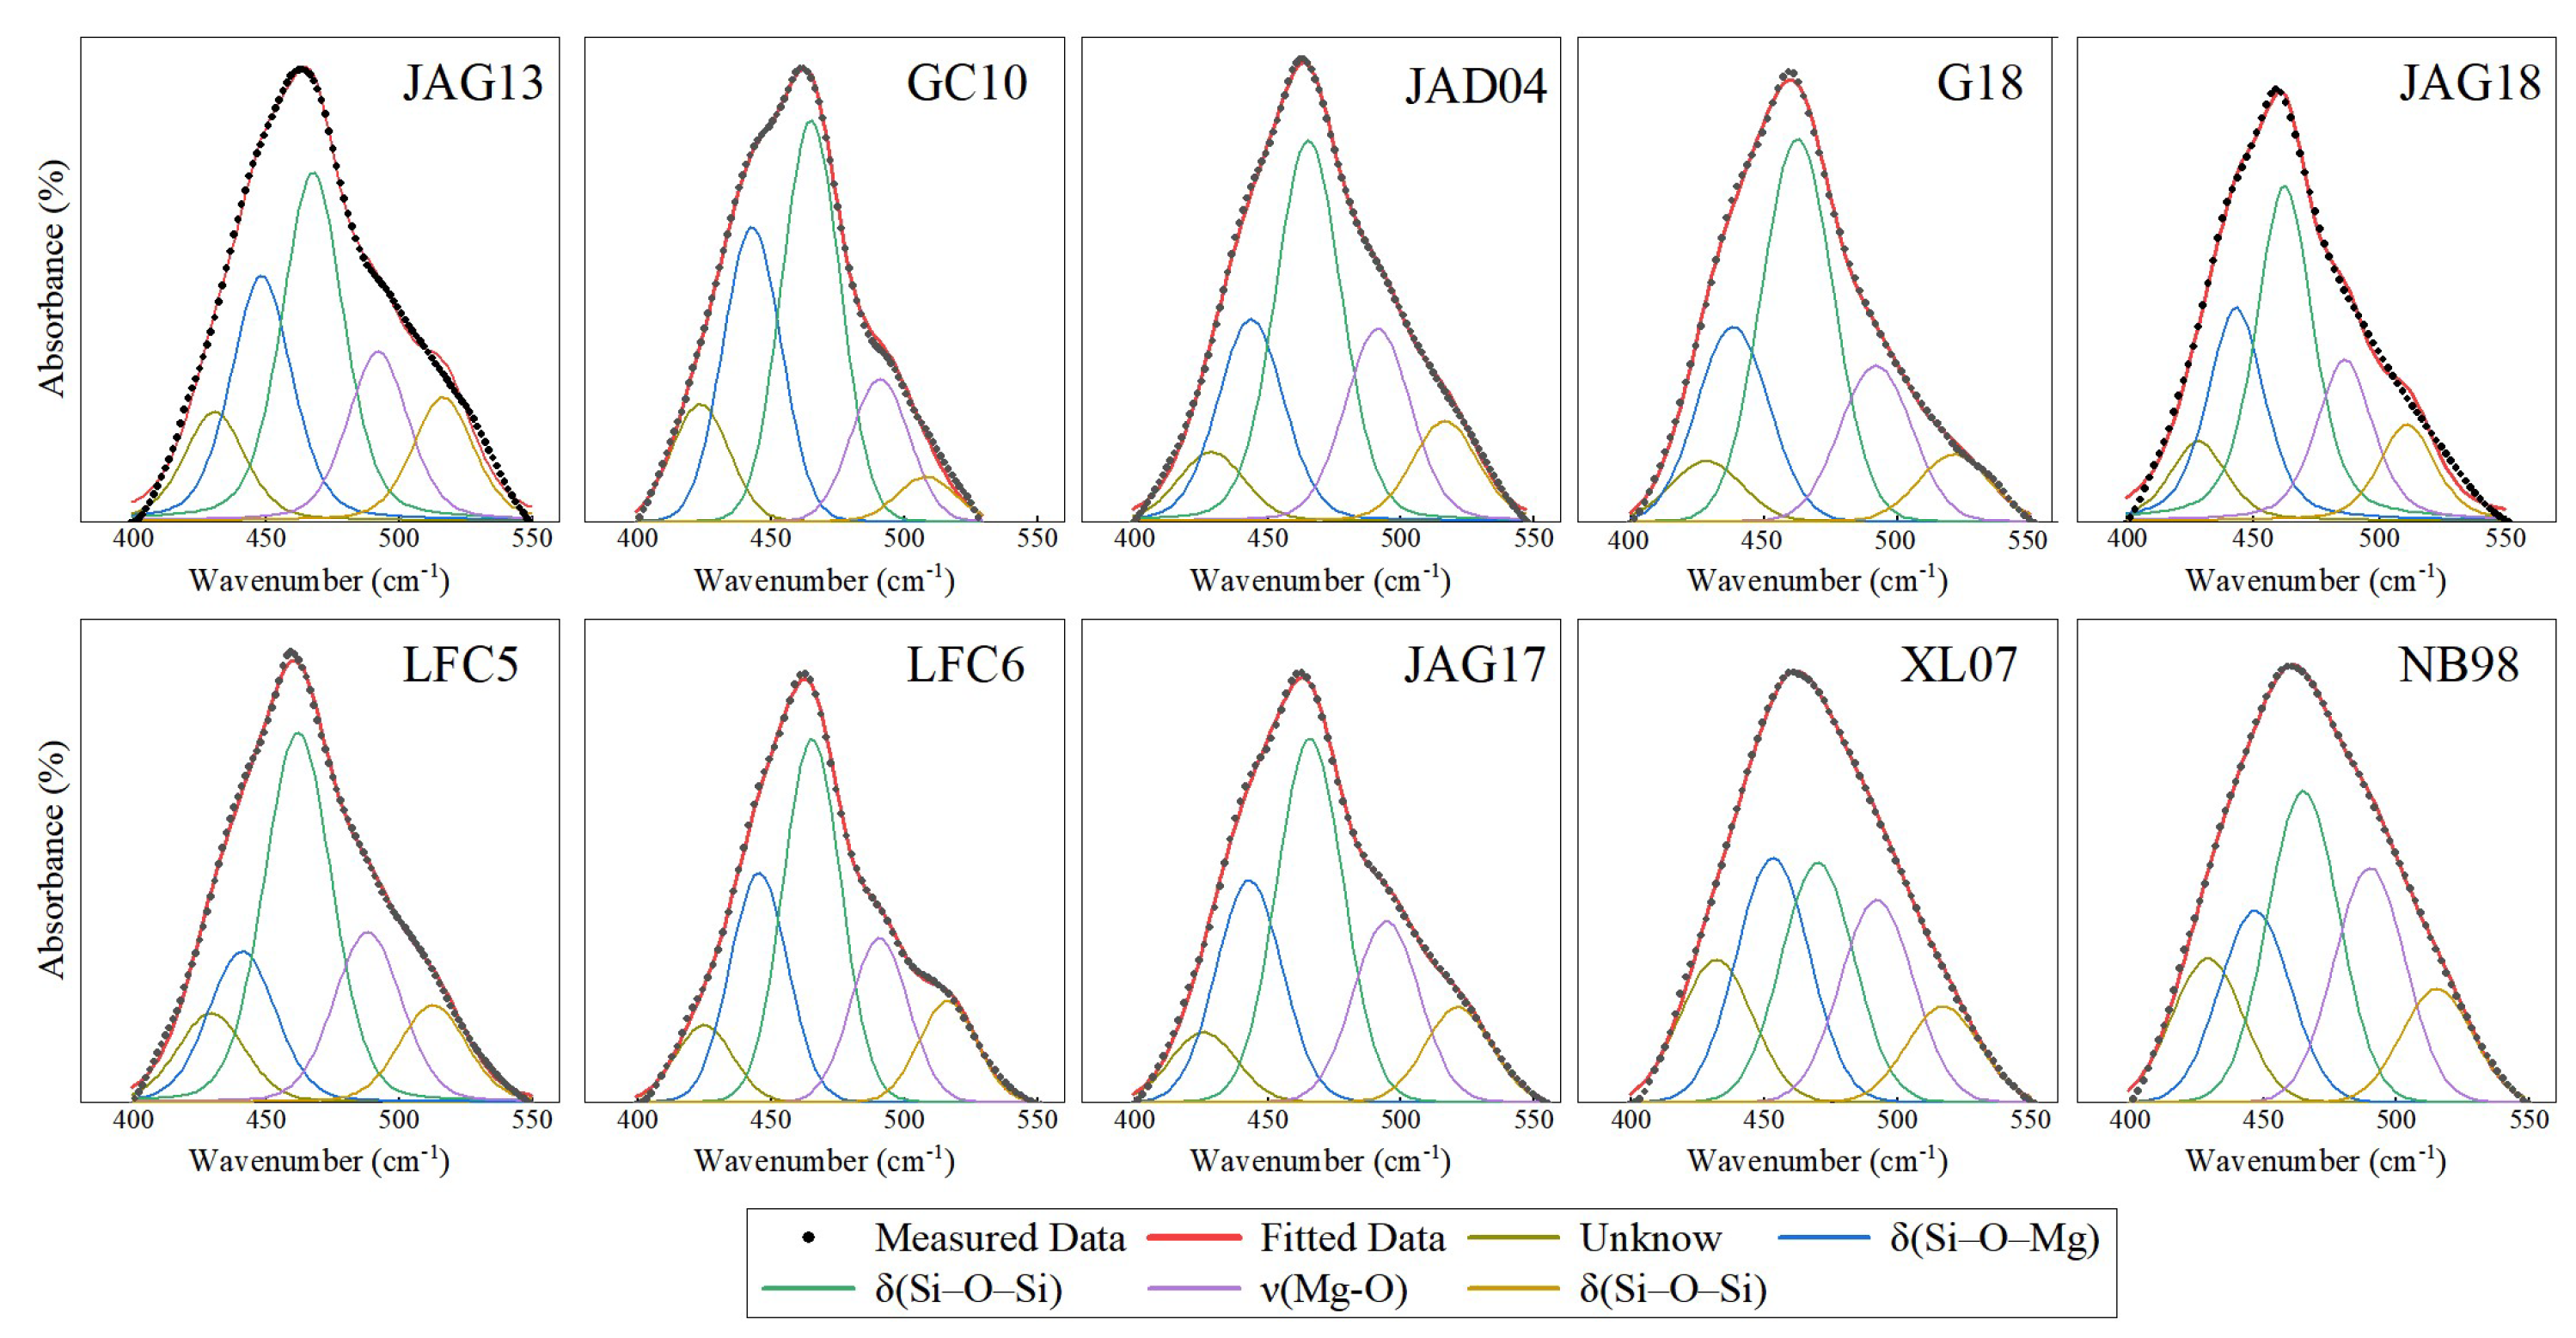
A broad absorption peak in the wavenumber range of 400–600 cm−1 indicates complex coupled vibrations that are difficult to distinguish individually (Figure 4 and Table 3). Peaks fitting in this region are performed to identify hidden overlapping peaks. Combining theoretical calculations with literature data, peaks at 440, 490, and 520 cm−1 are assigned to δ(Si–O–Mg), ν(Mg–O), and δ(Si–O–Si), respectively [28,44,45,46]. Both phlogopite and biotite exhibit a high-intensity characteristic peak near 1000 cm−1, assigned to Si–O–Si-stretching vibrations [28,47,48]. Robert (1981) concluded that the wavenumber decreases as the bulk Al content increases [49].
The peaks at 3600–3750 cm−1 in biotite–phlogopite are caused by OH-stretching vibrations (Figure 5 and Table 4). Phlogopite exhibits two distinct characteristic peaks (around 3710 and 3660 cm−1), while the peak near 3660 cm−1 is weaker in Mg–biotite. Scordari et al. (2006) reported that phlogopite is composed of several overlapping (at least five) components, and the peak related to the MgMgMgOH configuration is likely to be the most intense [50]. Studies on the infrared spectra of synthesized annite have shown the presence of up to seven peaks in the OH-stretching region [38]. These peaks represent OH groups adjacent to three Fe2+ (N-bands: OH groups associated with three divalent octahedral cations), OH groups coordinated by Fe2+, Al3+, and Fe3+ (I-bands), and configurations with a single octahedral vacancy (V-bands). In our research, in the range of 3600–3750 cm−1, the annite sample exhibits a broad peak. After fitting the Spectra, additional vibration modes can be identified.

3.4. OH-Stretching Vibration Characteristics of Raman Spectra

Raman spectroscopy and infrared spectroscopy technologies complement each other. Minerals samples are excited by high-energy radiation; electron vibrations and rotational level transitions occur, leading to changes in the dipole moment of molecules. This results in normal vibrations with infrared activity. In this process, some molecules that do not have infrared activity but undergo a change in molecular polarizability will experience Raman scattering and exhibit Raman activity. Previous studies have extensively investigated the assignment of Raman peaks for biotite and phlogopite [55,56,57,58].
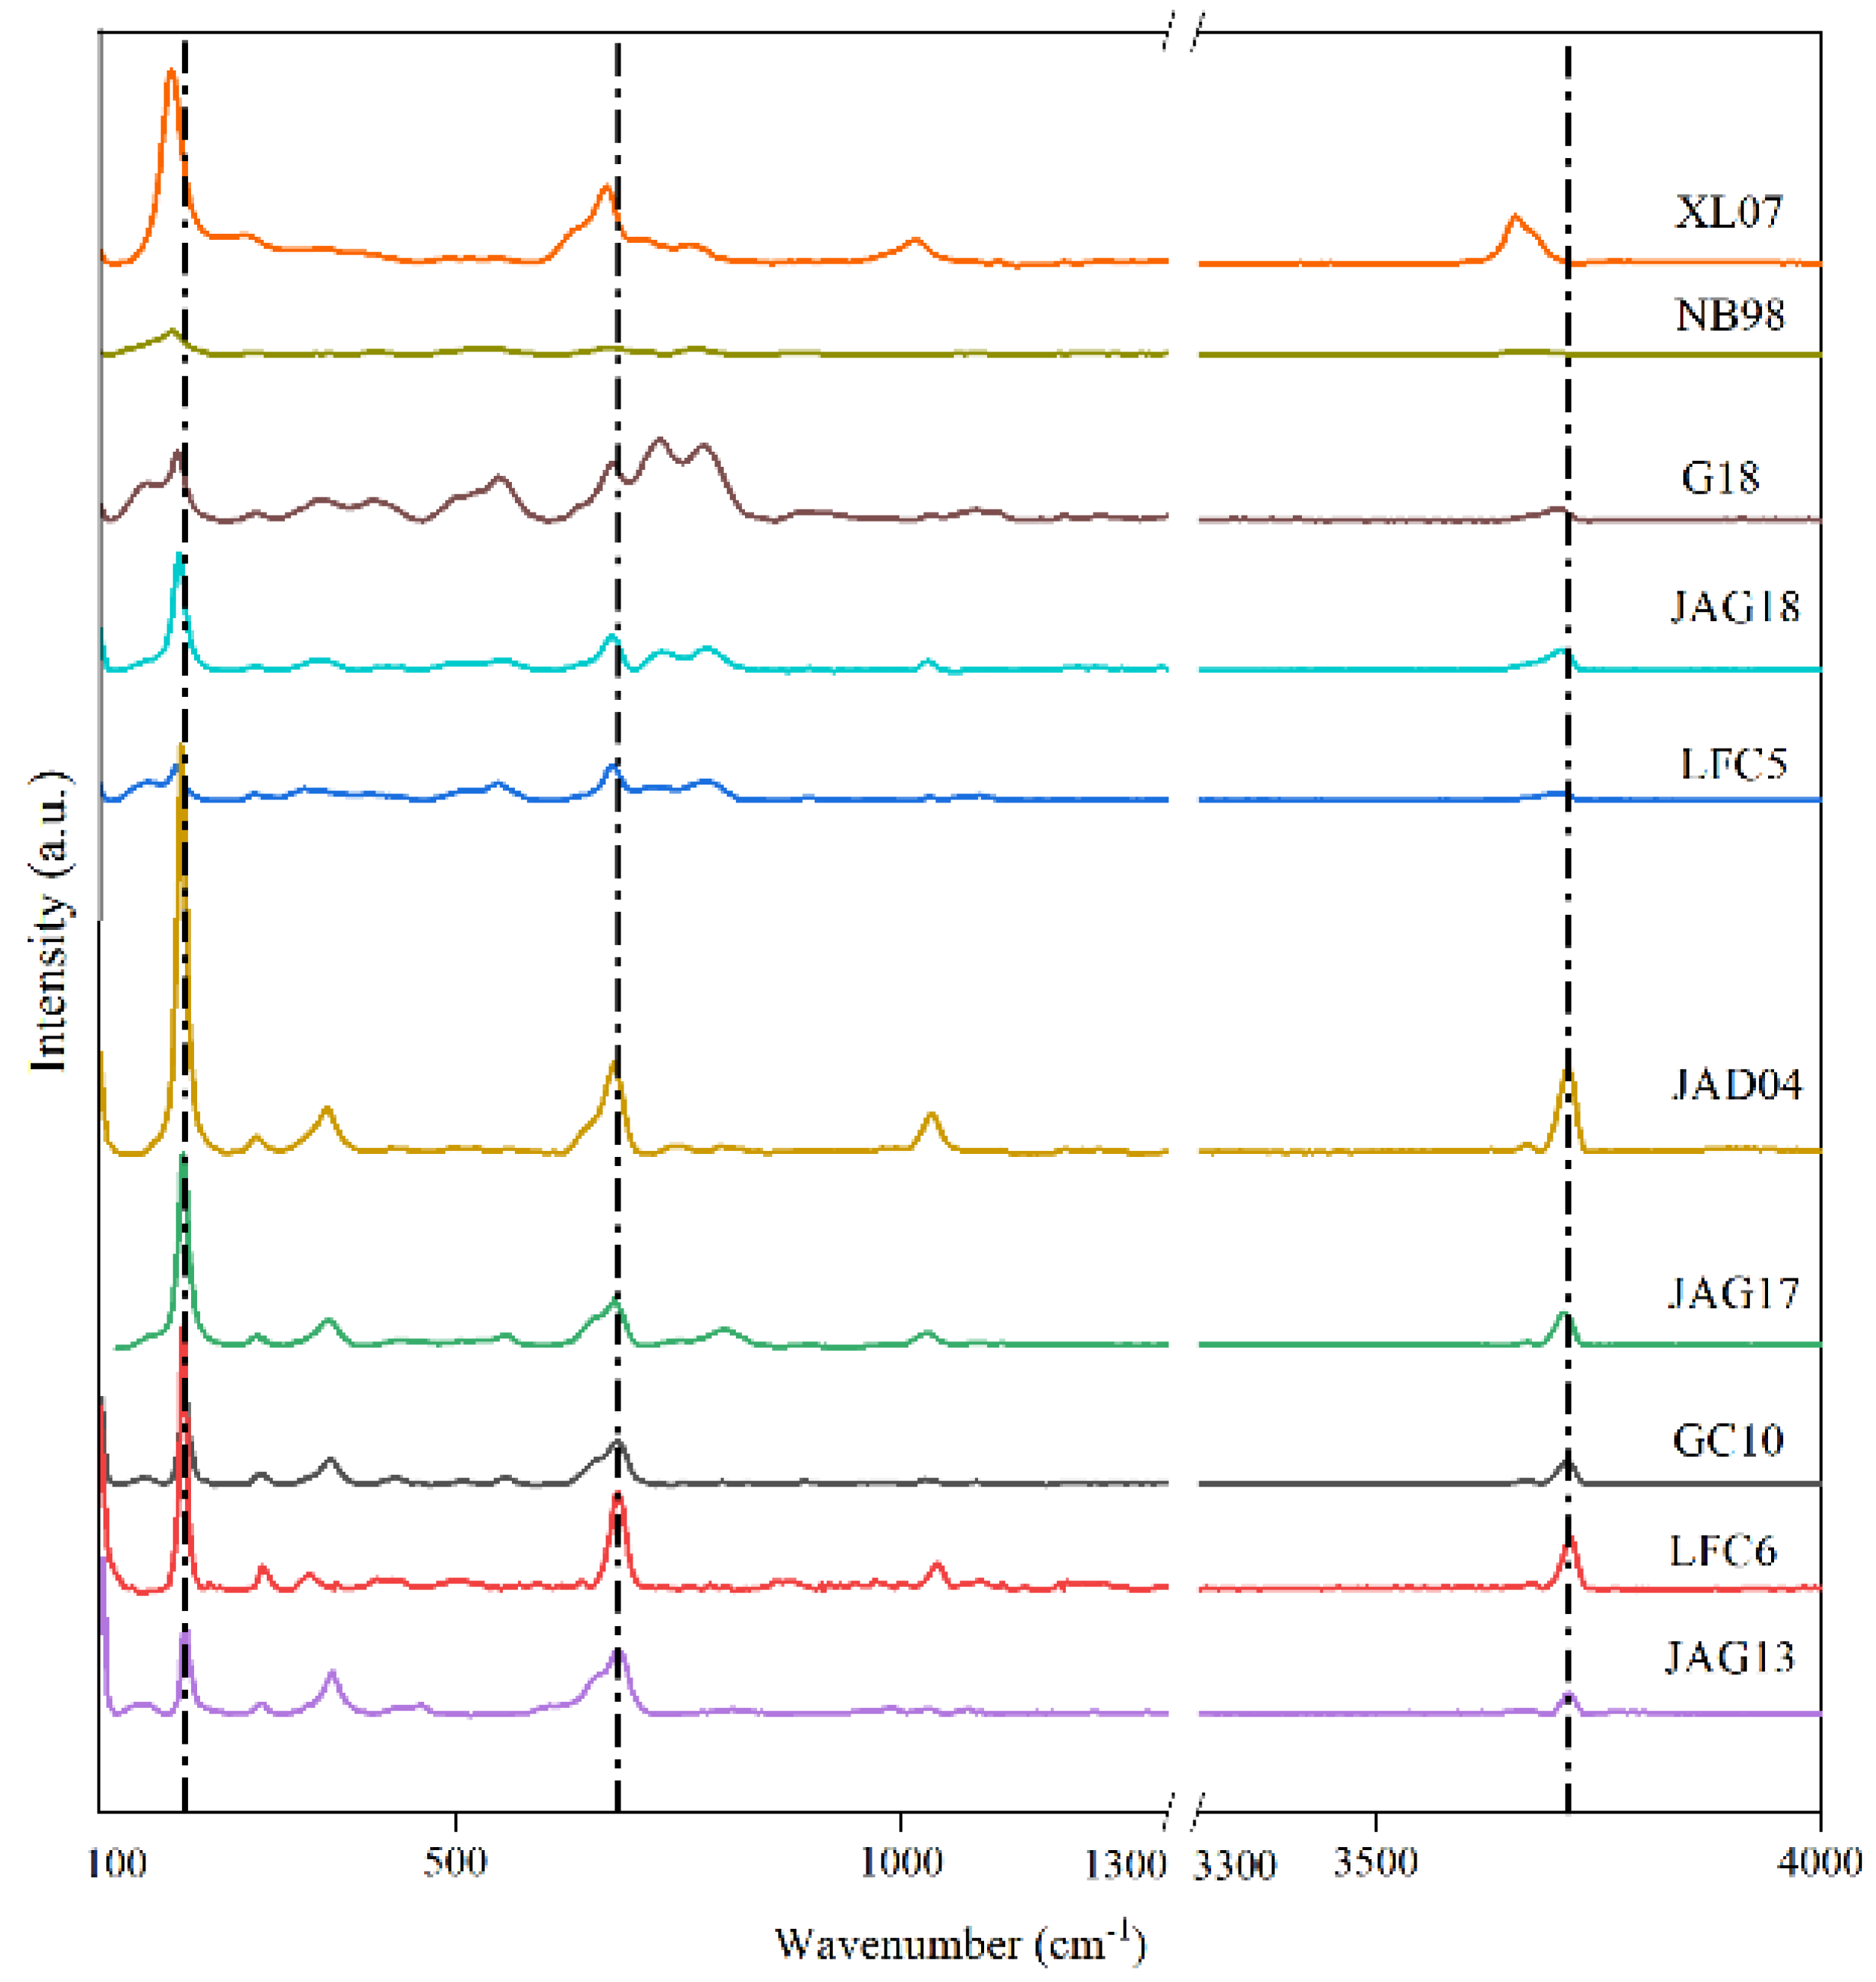
The characteristic peaks exhibit a trend of leftward shift (decreasing wavenumber) as Mg# content decreases (Figure 6), consistent with the observations in the infrared spectral. The peaks at 190 cm−1, 680 cm−1 and 3700 cm−1 show leftward shifts of 10 cm−1, 10 cm−1 and 20 cm−1, respectively. Raman peaks generated by OH-stretching vibrations exhibit overlapping features, necessitating the analysis of peak components and fitting to identify hidden peaks. Although hidden peaks do not belong to characteristic peaks in the near-infrared spectrum, they contribute to the combination and overtone bands. The Raman spectra in the 3600–4000 cm−1 region are assigned to the M–OH-stretching vibration (Figure 7 and Table 5). The occurrence of oxy-mechanisms, along with a minor substitution of F for OH, leads to a low peak intensity in this area [58].

3.5. Characteristics of NIR Spectra

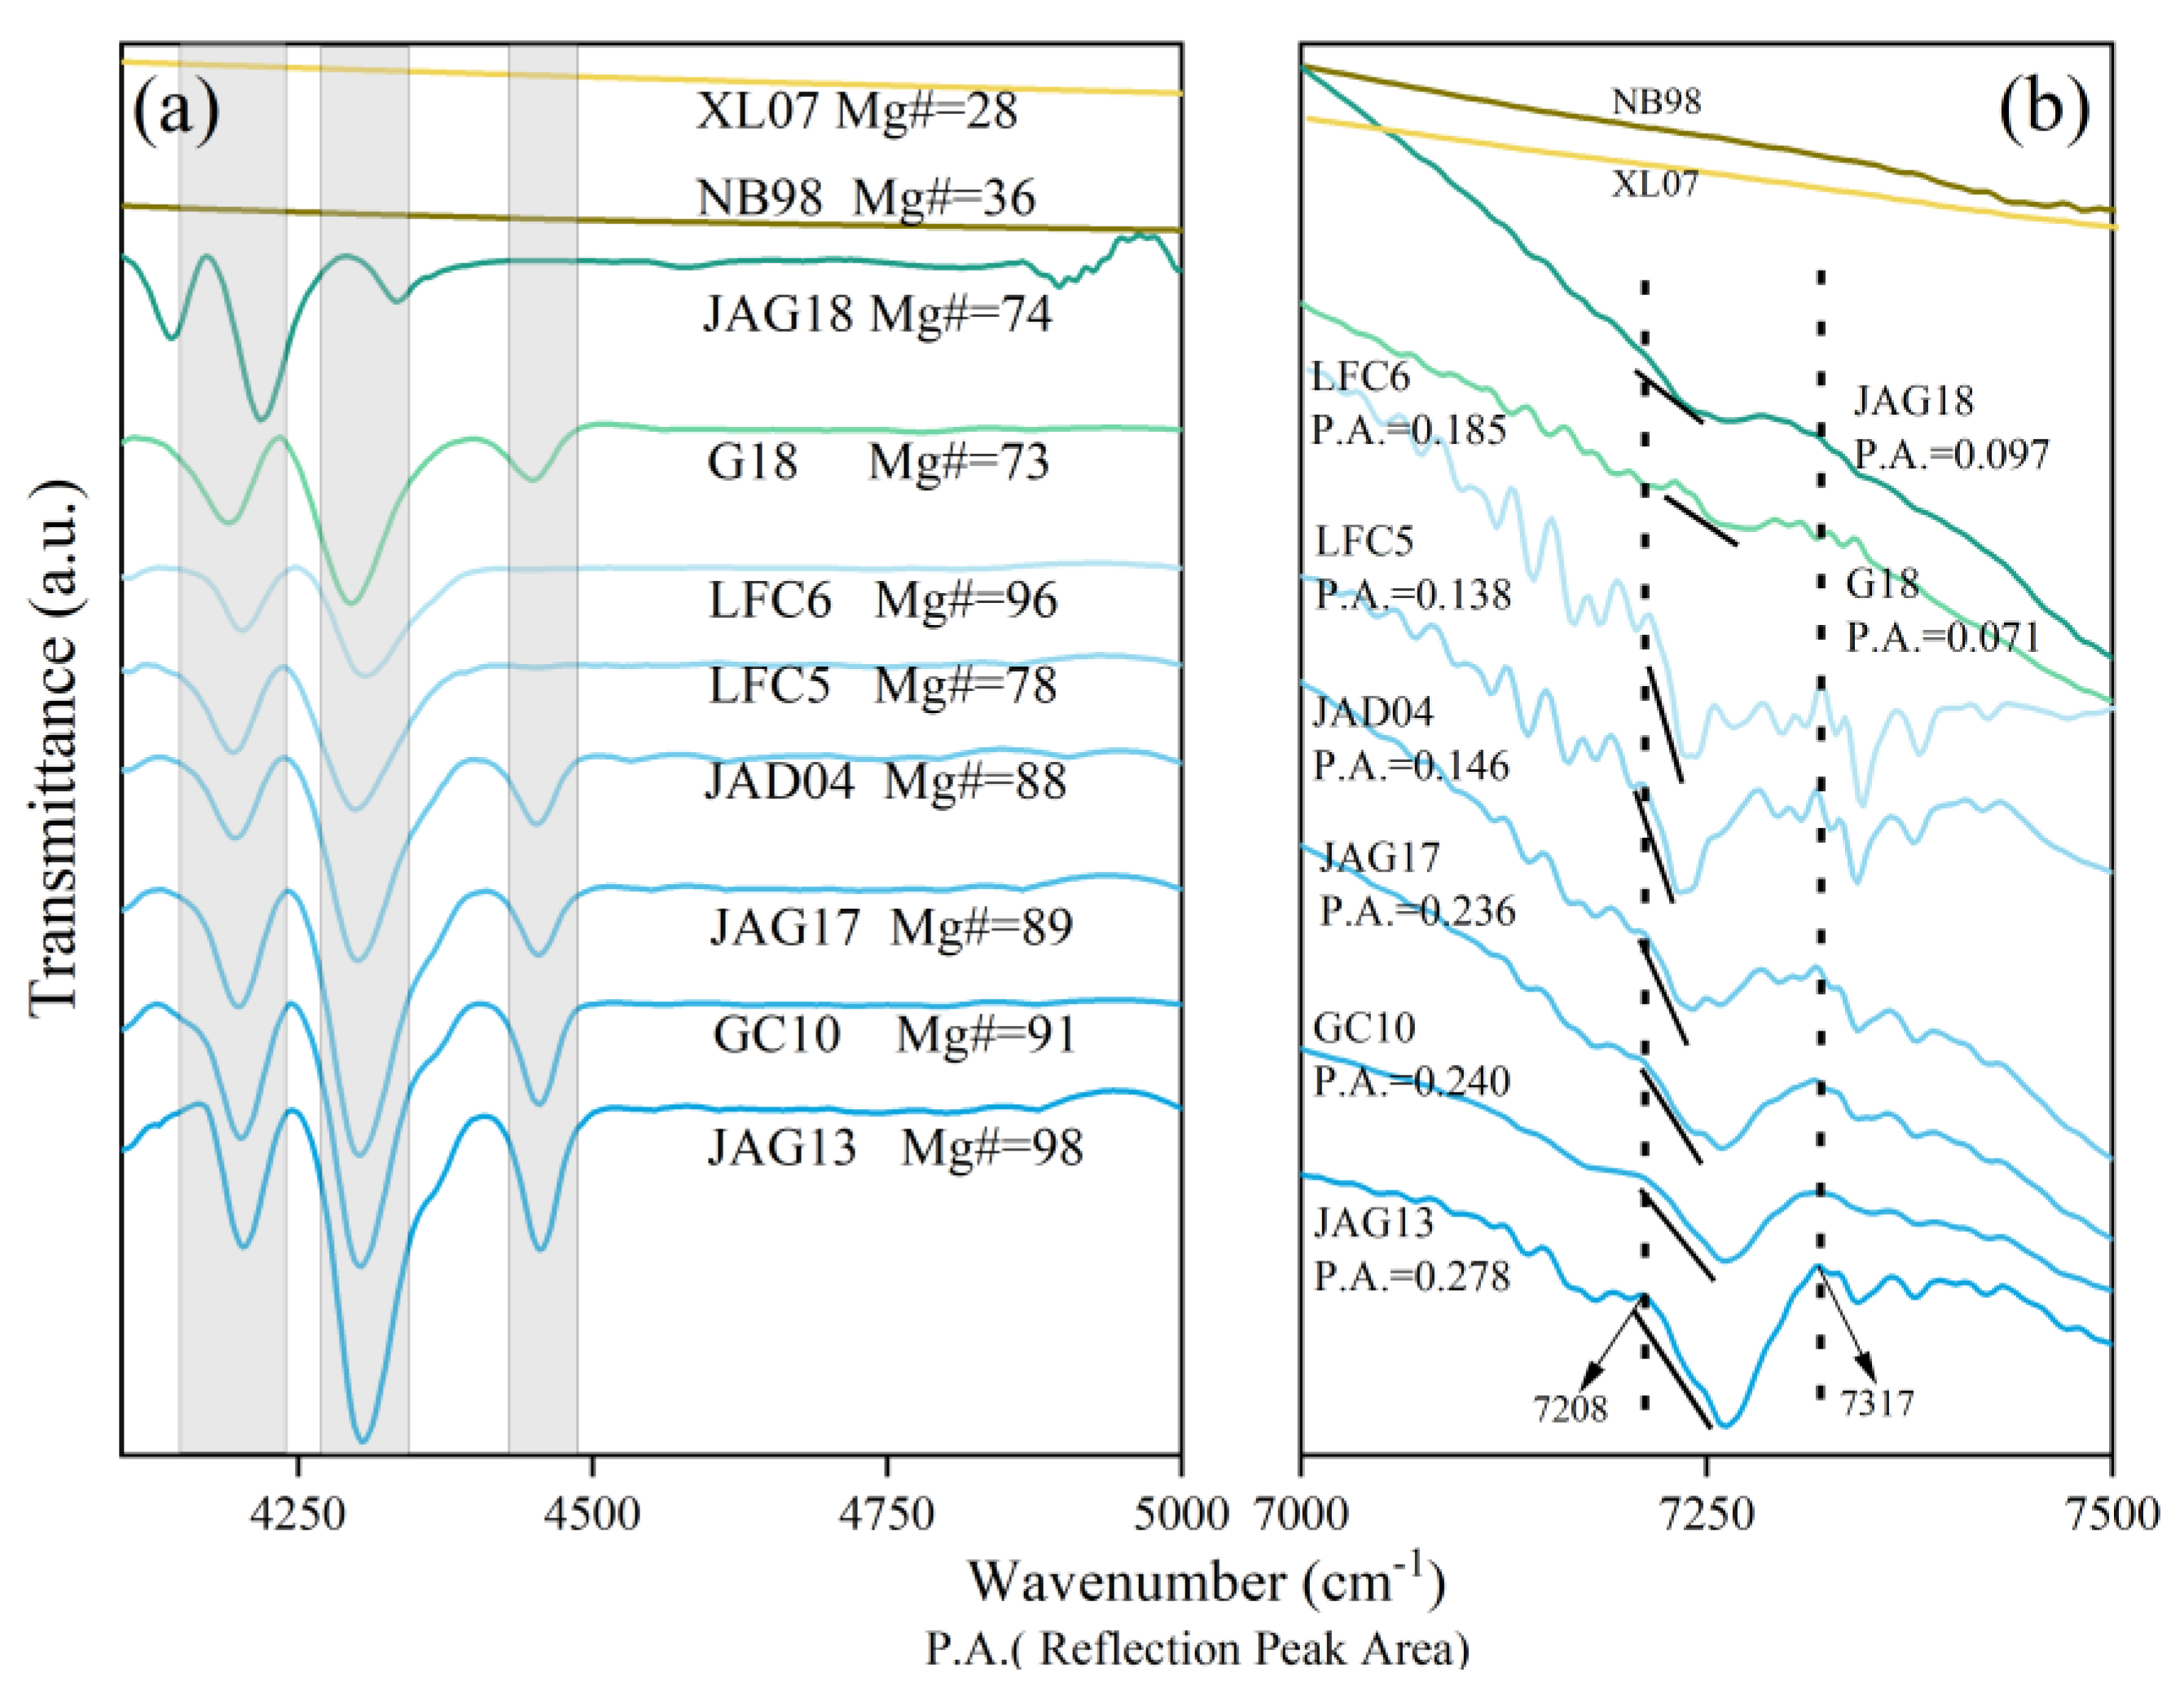
NIR spectra feature regions are 4000–5000 cm−1 and 7000–8000 cm−1, belonging to the combination band region and the first overtone band region, respectively. The band between 5000–7000 cm−1 is influenced by environmental factors such as H2O and CO2. The combination peaks of surface water at 5261 cm−1 and 5208 cm−1 are associated with the system described by Langer and OW (1974) [60] concerning tightly bound and loosely bound surface water. The peaks at 5261 cm−1 and 5208 cm−1 result from combining the fundamental OH bands and the OH libration bands [30]. According to the anharmonic mode hypothesis, vibrations cease to be independent and can interact with each other. According to the total vibrational energy (Eᵥ) formula, it is known that for each increase in harmonic order, the absorption intensity decreases by approximately an order of magnitude, and the overtone is expected to be 10 to 1000 times weaker than the fundamental bands. O–H, C–H, N–H, and S–H bonds exhibit significant anharmonicity and high bond energy, leading to fundamental vibrational transitions typically occurring in the 3000–4000 nm region. Consequently, this suggests that overtones and combinations of these fundamental vibrations may appear in the energy range associated with NIR photons [61]. Energy levels below the first overtone are less likely to be recorded as valid data in this testing instrument. The NIR spectra of Fe-rich biotite samples (XL07 and NB98) do not show obvious absorption peaks (Figure 8). Clark et al. (1990) reported that the ν(OH) overtone, expected near 7143 cm−1, is not easy to detect in biotite due to the band being suppressed by strong iron absorptions [24]. Attempts to increase the sample proportion and other methods (changing instruments, varying testing methods, consulting other databases) did not significantly improve this result.
In the range of 4100–4500 cm−1, both phlogopite and biotite exhibit three distinct characteristic peaks, while the absorption peaks of annite cannot be discerned by means of the shape of the spectra (using the second derivative method of infrared spectroscopy to determine the peak positions). As the Mg# content increases, the characteristic peaks of both Mg–biotite and phlogopite shift to the left at 4300 cm−1. The absorption peaks around 4200 cm−1 and 4300 cm−1 show a positive correlation between peak intensity and Mg#.
In the range of 7000–8000 cm−1, phyllosilicates exhibit dense but low-intensity absorption peaks. Cheng et al. (2017) demonstrated that the emergence of the peak at 7143 cm−1 in the absence of the peak at 5363 cm−1 (H–O–H bend plus OH stretch) suggests the presence of OH groups distinct from those found in water within the minerals. The lack of an absorption peak near 5363 cm−1 indicates the absence of water [62]. Therefore, it can be assumed that H2O does not influence the absorption peak in the 7000 cm−1 range of the samples. Phlogopite exhibits a broad and steep composite absorption peak curve between 7200 cm−1 and 7320 cm−1 (Table 6), named the “V-shaped trench”.
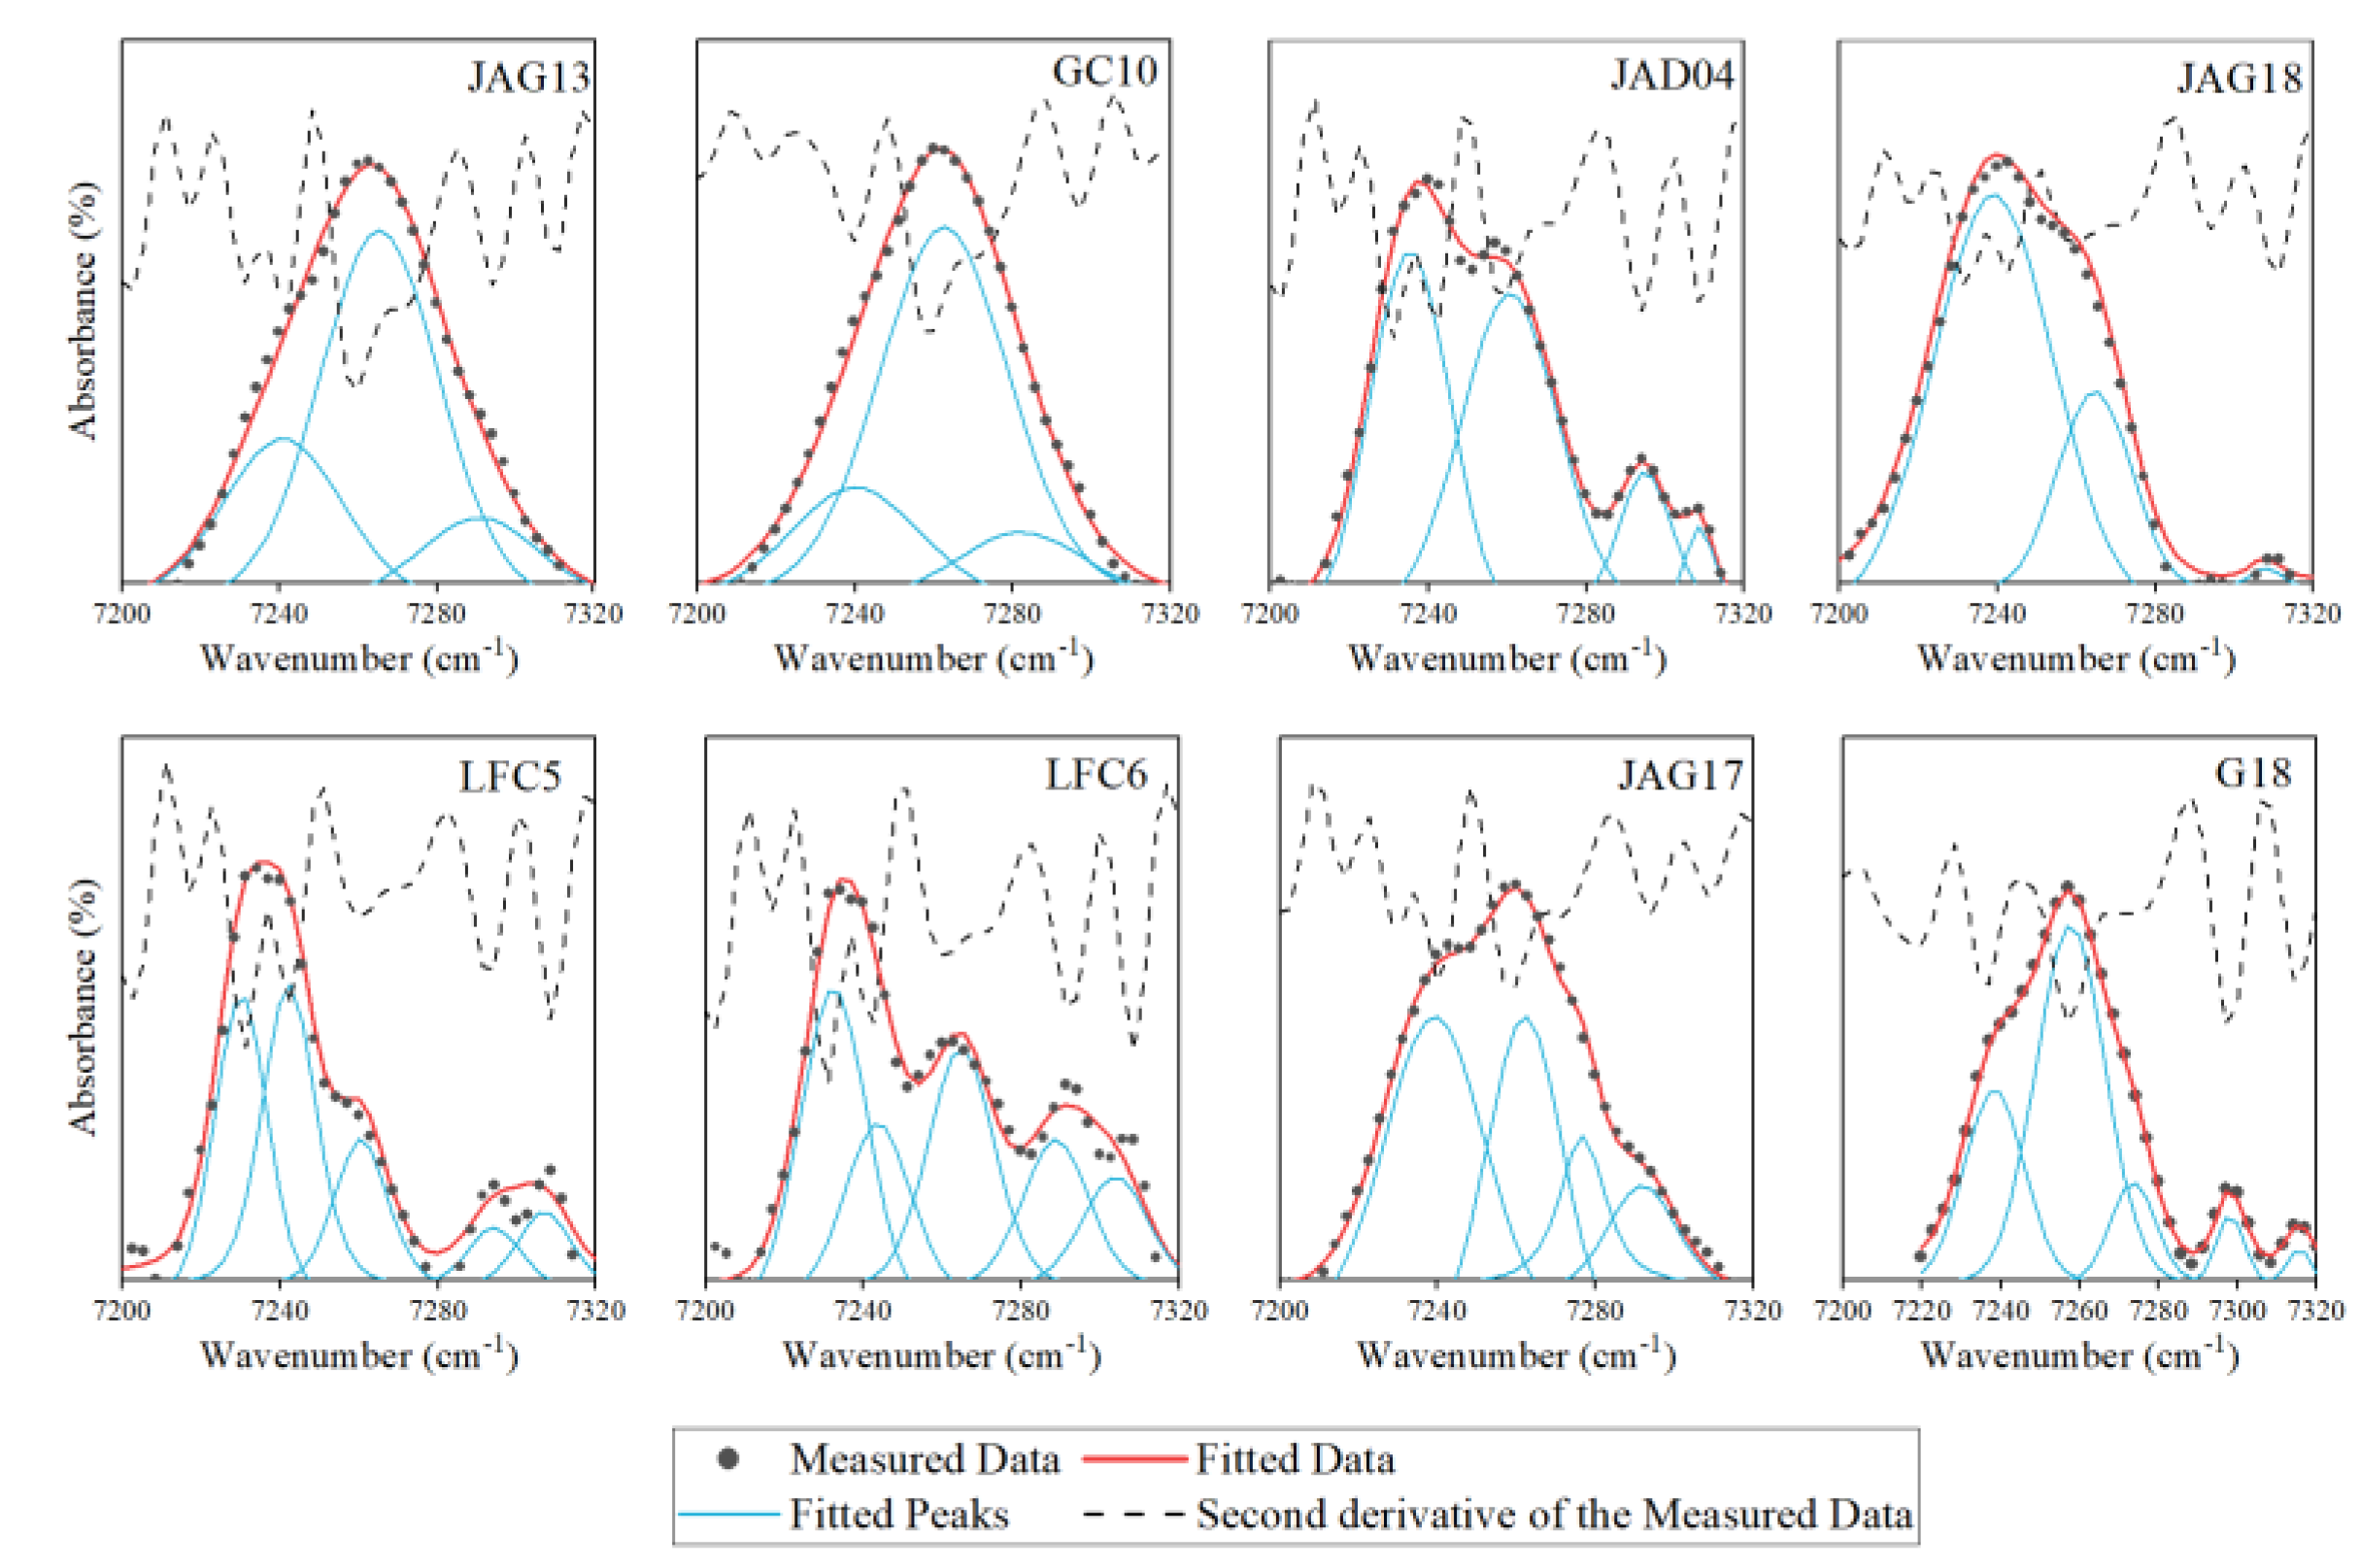
The broad absorption peaks of the first overtones for the samples underwent peak splitting processing, coupled with the second derivative of the spectral curve, to derive a more precise set of hidden peak information for biotite–phlogopite (Figure 9 and Table 6). As the Mg# gradually decreases, the samples show a reduction in the reflection peak area (P.A.). All tested samples exhibit a dominant absorption peak at 7259–7265 cm−1 (Figure 8b). Sample LFC5 and Sample LFC6 (F = 0.304, 0.545 a.p.f.u.) have dual absorption peaks at 7240 and 7233 cm−1. Samples JAG17, JAD04, JAG18, and G18 have a single absorption peak at 7244 cm−1. At around 7250 cm−1, the reflection peak area of high Mg# phlogopite (JAG13) after correction is 0.278, while the peak areas for Mg–biotite (G18, JAG18) after correction are 0.071 and 0.097, respectively. The reflection peak area decreased with the increase in Fe content, and Mg–biotite P.A. is the weakest. It is feasible to distinguish between phlogopite and biotite based on the reflection peak area of characteristic peaks at 7200–7320 cm−1. Based on previous studies of the ν(OH) absorption peak intensity [28,48,57], under the condition of constant sample quantity, it is inferred that the difference in the molar OH absorption coefficient arises due to varying elemental ratios in phlogopite.

4. Discussion

4.1. Assignment of OH Combination Vibration in NIR Spectra

In the biotite–phlogopite series, the combination peaks were exhibited at 4200, 4300, and 4450 cm−1. Post and Noble (1993) reported that the combination band of Black Jack beidellite in the NIR spectral was composed of δ(OH) and ν(OH), while the combination band in Crown Point beidellite consisted of the Al–O band and ν(OH) [63]. This study speculates that there are other chemical bond stretching vibrations and OH-stretching vibrations together to form the combination peaks.
The shoulder characteristic peak at 490 cm−1 is assigned to ν(Mg–O) [45,64], and accurate peak positions can be obtained through peak fitting. Jenkins (1989) observed in synthetic phlogopite that the peak at 495 cm−1 is strongly influenced by the Mg content [45]. According to Vedder’s (1964) classification of OH-stretching bands [28], the characteristic peak at 3715 cm−1 is assigned to the N-band, and it is assigned to ν(MgMgMgOH). Around 4200–4300 cm−1, two strong absorption peaks are assigned to Mg–OH-stretching [24,65]. The peak at 4450 cm−1 is assigned to ν(Al(Mg, Fe)OH) [66,67].
The three combination peaks correspond to three different OH-stretching vibration modes in biotite and phlogopite:
(1) The peak near 4200 cm−1 is considered to result from the addition of the two fundamental peaks at 490 cm−1 and 3715 cm−1, representing ν(Mg–O) + ν(MgMgMgOH);
(2) The peak near 4300 cm−1 is assigned to the superposition of two fundamental peaks at 600 cm−1 and 3690 cm−1, representing δ(OH) + ν(MgMgMgOH);
(3) The peak near 4450 cm−1 is composed of 760 cm−1 + 3690 cm−1 peaks, where 760 cm−1 is assigned to ν(AlIV–O), and 3690 cm−1 is assigned to ν(MgMgMgOH).
The predicted and experimental values of the combination peaks for each sample are represented using an error chart (Figure 10), with absolute error values (|δ|) all <15 cm−1. Considering the literature, it is deemed reasonable to infer that the fundamental peaks are related to the combination peaks.

4.2. Assignment of OH First Overtone Vibration in NIR Spectra

The absorption peaks in the range of 7000–8000 cm−1 are generated from the fundamental OH-stretching vibration mode ν(OH) in the region of 3600–3750 cm−1, resulting in the first overtones (2ν). The strongest absorption peak occurs at 7260 cm−1 (Figure 9). The overtone peak near 7110 cm−1 is generated by vibrational modes with Raman activity only. In the biotite–phlogopite series, three fundamental peak models can lead to the first overtone bands:
(1) ν(M–OH) fundamental bands (M: octahedrally coordinated metal ions);
(2) the average of adjacent ν(M–OH) fundamental bands;
(3) only the Raman-active ν(M–OH) fundamental bands.
Bishop et al. (2008) reported that the charge density or polarizing power of the octahedral cations dictates the extent to which these cations draw charge away from the OH bond. The order of decrease is Al3⁺ > Fe3⁺ > Fe2⁺ > Mg2⁺ [66,68], indicating influencing factors for the generation of (1) mode overtone bands.
The first overtone bands maintain a constant factor with the OH-stretching fundamental bands ν(OH), and our study calculates the factor as 1.955 (±0.001) (Table 7). The first overtone peaks are slightly lower than twice the value of ν(OH) due to the anharmonic and asymmetric character of OH-stretching bands [30,69,70].

4.3. The Relationship between Composition and Characteristic Peaks in NIR Spectra

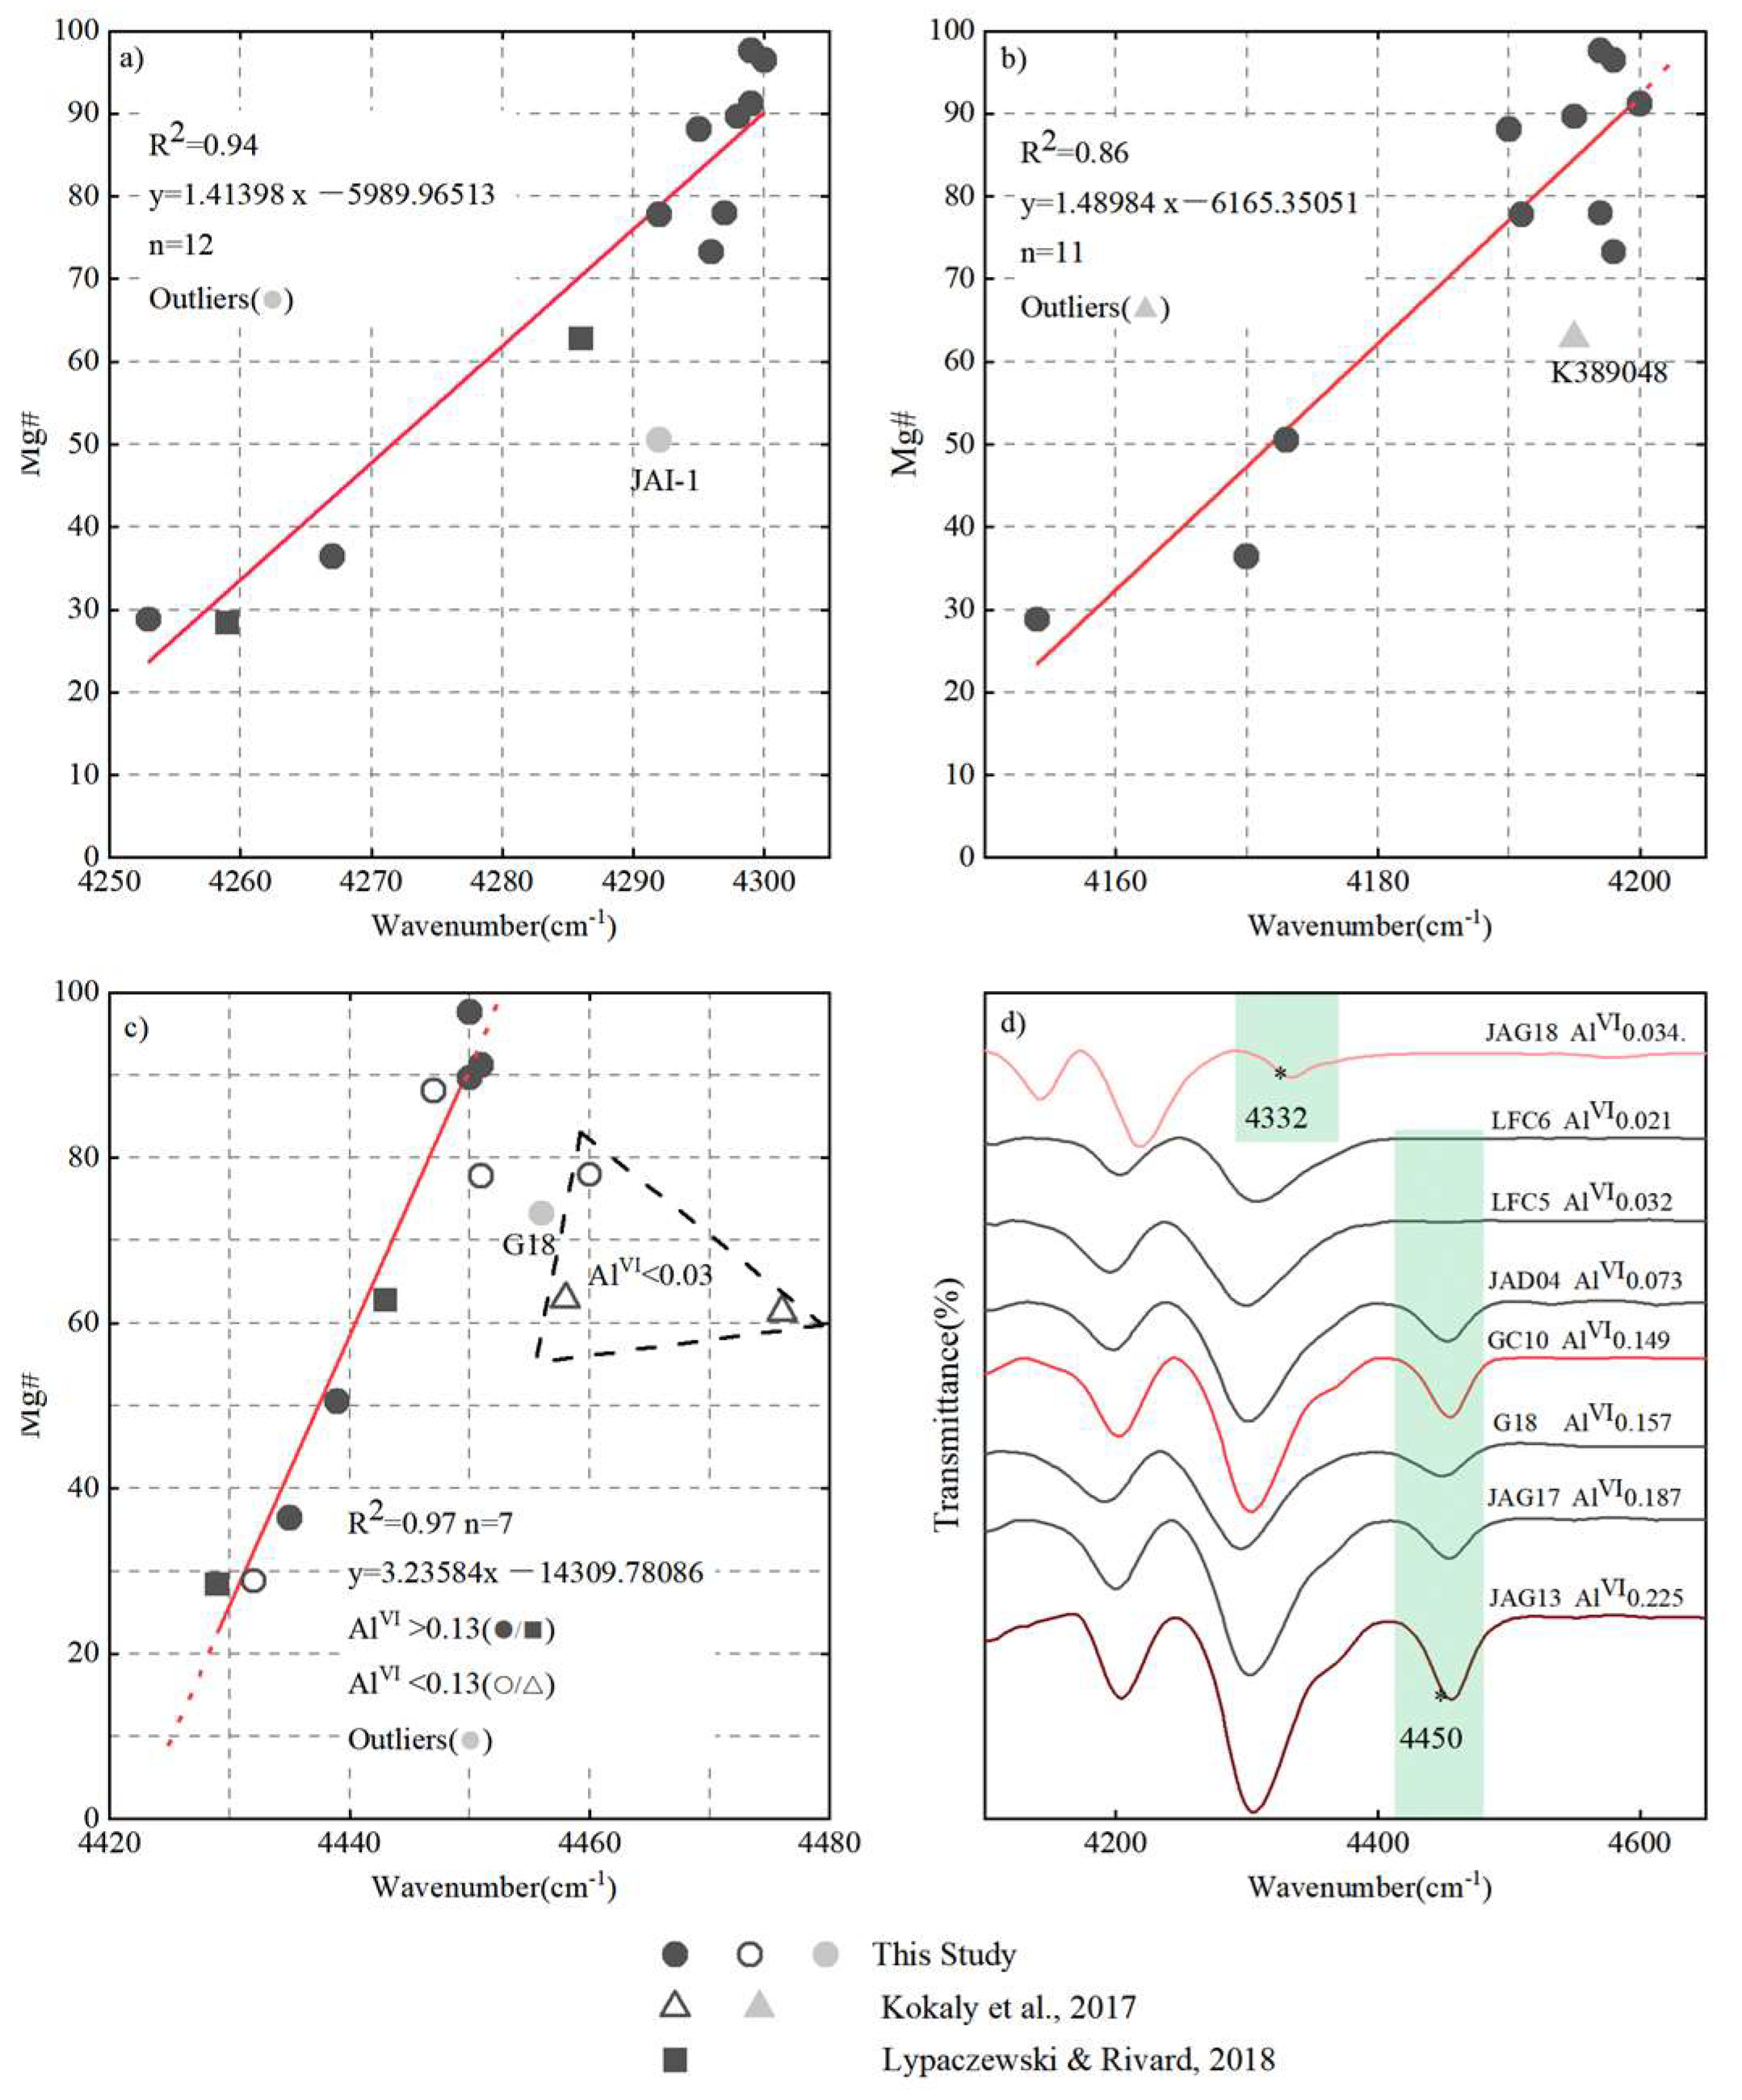
Mg# relationships with characteristic absorption peaks are reported in Figure 11a,b; the relationship between Mg# and AlVI with absorption peaks is analyzed in Figure 3c, and the relationship between AlVI and the peak’s intensity is reported in Figure 11d. The effective sample size for each regression analysis plot is greater than 10 (only Figure 11c has seven samples), with excluded points represented by gray dots and sample names labeled. The absorption peak near 4300 cm−1 shows an excellent linear relationship with the Mg# content (R2 > 0.94), with sample JAI-1 (Mg# = 50, AlVI = 0.131) as an outlier, showing no apparent connection with the AlVI content (Figure 11a). The prediction equation predicts the relationship between the characteristic peaks of the biotite group and elemental content. Phlogopite behaves more fittingly to the line in this linear equation. In Figure 3b, the peak near 4200 cm−1 exhibits a significant linear relationship with the Mg# content, and sample K389048(Mg# = 67, AlVI = 0.265) is an outlier, establishing a linear regression relationship (R2 = 0.86). The absorption peak near 4450 cm−1 fits with the Mg# content only when AlVI > 0.13 (black dots in the graph in Figure 11c), with a strong linear relationship (R2 = 0.97). The Al(Fe and Mg)–OH peak (near 4450 cm−1) is not present when Al fills only the tetrahedral sites in the unit cell [63]. A part of the testing samples with AlVI< 0.13 deviates from the linear relationship with the Mg# content. Therefore, the 4450 cm−1 characteristic absorption peak provides an excellent predictive fit for the Mg# content in biotite–phlogopite, with high octahedral coordination of Al, providing a means to estimate the Mg/Fe ratio in minerals using high-precision infrared spectroscopy.
The peak intensity at 4450 cm−1 positively correlates with the AlVI content. The three red infrared spectra, varying in shade, exhibit different degrees of AlVI content (Figure 11d), indicating a change in peak intensity. Samples LFC5 and LFC6, with fluorine contents of 0.304 and 0.545 a.p.f.u., respectively, did not observe an absorption peak near 4450 cm−1. Sergent and Robert’s (1997) study on synthetic F-rich phlogopite revealed that as F replaces OH, Si–O bond and possibly Al–O bond lengths may shorten. The study suggested that F was more likely to replace the N-band OH [47]. F substitution for OH in phlogopite strengthens hydrogen bonding (O–H···F), thereby reducing the OH wavenumber [71]. The substitution of F for OH impacts the interlayer spacing and influences the chemical bonding state of the silicate tetrahedra. However, there is still no comprehensive explanation for its effect on the wavenumber and intensity of absorption peaks in NIR spectra.

4.4. Correlations between Crystal Chemical Changes and Mg# Content in Biotite–Phlogopite

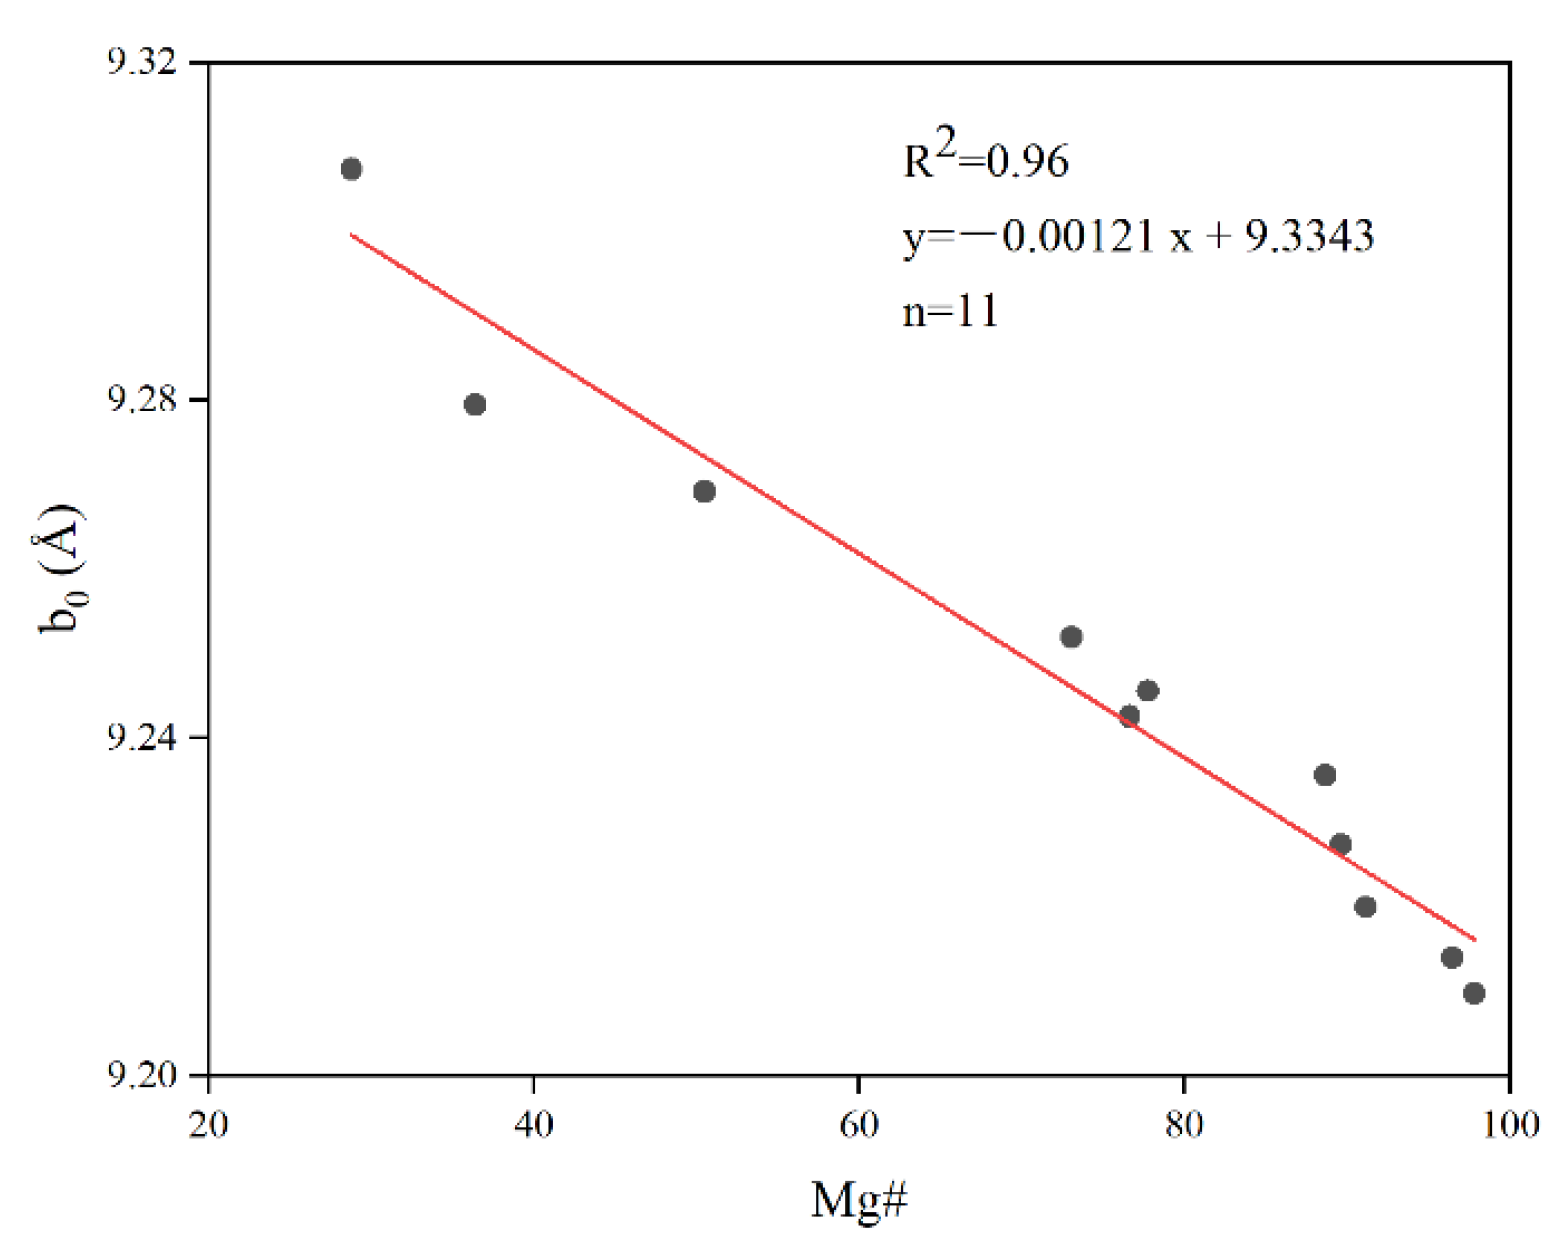
After crystal cell parameter calculations, the unit cell volume (V) of measured phlogopite samples ranges from 490 to 497 Å3, while annite and Mg–biotite unit cell volumes range from 493 to 503 Å3, which is consistent with the values calculated in previous literature [72,73,74]. Isomorphic substitution in the octahedral layer exists, altering the b0 length of the biotite–phlogopite lattice, with the increase in b0 being proportional to the ion diameter. End-member phlogopite and biotite are considered to be primarily constrained by Mg and Fe ions in octahedral coordination, with the Mg# value serving as a good indicator of this condition. This study establishes a well-defined linear relationship between Mg# values and the lattice b0 length (Figure 12). The growth of the b0 in biotite–phlogopite minerals depends on the substitution of Mg and Fe ions in octahedral coordination, indicating that the crystal properties perpendicular to the layer stacking direction in mica minerals may be related to octahedral cation substitutions.

5. Conclusions

In the MIR region, biotite and phlogopite exhibited two broad characteristic absorption bands at 460 cm−1 and 1000 cm−1. The band at 460 cm−1 was inferred to have five peaks overlapping by peak fitting. The peak fitting results indicate that the overlapping peaks located around 490 cm−1 are assigned to the (Mg–O) stretching vibration, forming a combination peak at 4200 cm−1 along with the OH-stretching vibration. The absorption peak at 810 cm−1 was assigned to the AlIV–O-stretching vibration and is only present in phlogopite. The fundamental OH-stretching peaks appear at 3710 cm−1 and 3670 cm−1. Due to the isomorphic substitution of octahedral cations, there is no consensus on the number of hidden peaks in this region. The OH-stretching peaks participating in the combination peaks are considered N-bands, assigned to (MgMgMgOH) stretching vibrations.
In the NIR spectral, the combination peaks are mainly observed at 4200 cm−1, 4300 cm−1, and 4450 cm−1. The broad absorption band of the first overtone appeared in the range of 7200–7320 cm−1, and the fundamental is assigned to OH-stretching vibrations. The first overtone of OH-stretching vibrations exhibited a constant ratio (Factor) with the fundamental, and we calculated the factor to be 1.955 for both phlogopite and biotite. There were three modes related to OH-stretching vibrations in the fundamental, indicating that non-infrared-active hidden peaks also contributed to the formation of near-infrared spectral overtone peaks.
Changes in Mg# content altered the crystal and chemical environment of the biotite group. The relationship between Mg# and the b0 parameter of the crystal cell from phlogopite (Mg~) to annite (Fe~) increased almost linearly by 0.1 Å. For biotite–phlogopite with lower Al in octahedral coordination, the absorption peak near 4300 cm−1 can be used to estimate the Mg# content. The 4300 cm−1 peak, resulting from Mg–OH-bending and -stretching, effectively predicts the Mg# content in biotite–phlogopite due to its straightforward OH vibration mode. The absorption peak at 4450 cm−1 was composed of AlIV–O-stretching vibrations and OH-stretching vibrations. An augmentation in AlVI within F-free phlogopite led to an elevation in the intensity of the absorption peak at 4450 cm−1. However, in F-rich phlogopite, the replacement of OH by F rendered the observation of the absorption peak challenging. The combination peak around 4450 cm−1 in both biotite and phlogopite was considered the most suitable for characterizing Mg# content displacement, applicable only to high AlVI values (>0.13). The combination peak at this position may also be applicable for predicting elemental content in other high-Al mica minerals or phyllosilicate structures with similar compositions.

Supplementary Materials

The following supporting information can be downloaded at: https://www.mdpi.com/article/10.3390/cryst14040336/s1, Table S1: Major element compositions of biotite and phlogopite.

Author Contributions

Conceptualization, M.H.; data curation, Z.Y. and S.W.; formal analysis, Z.Y., S.W., M.Y. and B.P.; funding acquisition, M.H.; investigation, M.Y. and B.P.; methodology, Z.Y. and M.Y.; resources, M.H.; writing—original draft preparation, Z.Y.; writing—review and editing, Z.Y., S.W., M.Y. and B.P. All authors have read and agreed to the published version of the manuscript.

Funding

National Mineral Rock and Fossil Specimens Resource Center.

Data Availability Statement

Data are contained within the article and Supplementary Materials.

Acknowledgments

We would like to thank the reviewers for their constructive comments to help improve the quality of the article. We thank the National Mineral Rock and Fossil Specimens Resource Center for its support. We thank Xiaohui Zhao for patient and meaningful discussions and suggestions.

Conflicts of Interest

The authors declare no conflicts of interest.

References

  1. Beane, R.E. Biotite stability in the porphyry copper environment. Econ. Geol. 1974, 69, 241–256. [Google Scholar] [CrossRef]
  2. Jacobs, D.C.; Parry, W.T. A comparison of the geochemistry of biotite from some basin and range stocks. Econ. Geol. 1976, 71, 1029–1035. [Google Scholar] [CrossRef]
  3. Chivas, A.R. Geochemical evidence for magmatic fluids in porphyry copper mineralization: Part I. Mafic silicates from the Koloula igneous complex. Contrib. Mineral. Petrol. 1982, 78, 389–403. [Google Scholar] [CrossRef]
  4. Selby, D.; Nesbitt, B.E. Chemical composition of biotite from the Casino porphyry Cu–Au–Mo mineralization, Yukon, Canada: Evaluation of magmatic and hydrothermal fluid chemistry. Chem. Geol. 2000, 171, 77–93. [Google Scholar] [CrossRef]
  5. Ayati, F.; Yavuz, F.; Noghreyan, M.; Haroni, H.A.; Yavuz, R. Chemical characteristics and composition of hydrothermal biotite from the Dalli porphyry copper prospect, Arak, central province of Iran. Mineral. Petrol. 2008, 94, 107–122. [Google Scholar] [CrossRef]
  6. Afshooni, S.; Mirnejad, H.; Esmaeily, D.; Haroni, H.A. Mineral chemistry of hydrothermal biotite from the Kahang porphyry copper deposit (NE Isfahan), Central Province of Iran. Ore Geol. Rev. 2013, 54, 214–232. [Google Scholar] [CrossRef]
  7. Parsapoor, A.; Khalili, M.; Tepley, F.; Maghami, M. Mineral chemistry and isotopic composition of magmatic, re-equilibrated and hydrothermal biotites from Darreh-Zar porphyry copper deposit, Kerman (Southeast of Iran). Ore Geol. Rev. 2015, 66, 200–218. [Google Scholar] [CrossRef]
  8. Ionov, D.A.; Griffin, W.L.; O’Reilly, S.Y. Volatile-bearing minerals and lithophile trace elements in the upper mantle. Chem. Geol. 1997, 141, 153–184. [Google Scholar] [CrossRef]
  9. Tappert, R.; Foden, J.; Heaman, L.; Tappert, M.C.; Zurevinski, S.E.; Wills, K. The petrology of kimberlites from South Australia: Linking olivine macrocrystic and micaceous kimberlites. J. Volcanol. Geotherm. Res. 2019, 373, 68–96. [Google Scholar] [CrossRef]
  10. Foster, M.D. Interpretation of the Composition of Trioctahedral Micas; 2330-7102; United States Government Printing Office: Washington, DC, USA, 1960. [Google Scholar]
  11. David, R.W.; Hans, P.E. Stability of biotite: Experiment, theory, and application. Am. Mineral. J. Earth Planet. Mater. 1965, 50, 1228–1272. [Google Scholar]
  12. Clemens, J. Granitic magmas with I-type affinities, from mainly metasedimentary sources: The Harcourt batholith of southeastern Australia. Contrib. Mineral. Petrol. 2018, 173, 93. [Google Scholar] [CrossRef]
  13. Clemens, J.; Stevens, G.; Farina, F. The enigmatic sources of I-type granites: The peritectic connexion. Lithos 2011, 126, 174–181. [Google Scholar] [CrossRef]
  14. Uchida, E.; Endo, S.; Makino, M. Relationship Between Solidification Depth of Granitic Rocks and Formation of Hydrothermal Ore Deposits. Resour. Geol. 2007, 57, 47–56. [Google Scholar] [CrossRef]
  15. Poulet, F.; Bibring, J.-P.; Mustard, J.; Gendrin, A.; Mangold, N.; Langevin, Y.; Arvidson, R.; Gondet, B.; Gomez, C. Phyllosilicates on Mars and implications for early Martian climate. Nature 2005, 438, 623–627. [Google Scholar] [CrossRef] [PubMed]
  16. Gendrin, A.; Mangold, N.; Bibring, J.-P.; Langevin, Y.; Gondet, B.; Poulet, F.; Bonello, G.; Quantin, C.; Mustard, J.; Arvidson, R. Sulfates in Martian layered terrains: The OMEGA/Mars Express view. Science 2005, 307, 1587–1591. [Google Scholar] [CrossRef] [PubMed]
  17. Milliken, R.E.; Swayze, G.A.; Arvidson, R.E.; Bishop, J.L.; Clark, R.N.; Ehlmann, B.L.; Green, R.O.; Grotzinger, J.P.; Morris, R.; Murchie, S.L. Opaline silica in young deposits on Mars. Geology 2008, 36, 847–850. [Google Scholar] [CrossRef]
  18. Carter, J.; Poulet, F.; Bibring, J.P.; Mangold, N.; Murchie, S. Hydrous minerals on Mars as seen by the CRISM and OMEGA imaging spectrometers: Updated global view. J. Geophys. Res. Planets 2013, 118, 831–858. [Google Scholar] [CrossRef]
  19. Cuadros, J.; Mavris, C.; Michalski, J.R. Possible widespread occurrence of vermiculite on Mars. Appl. Clay Sci. 2022, 228, 106643. [Google Scholar] [CrossRef]
  20. Ehlmann, B.L.; Mustard, J.F.; Swayze, G.A.; Clark, R.N.; Bishop, J.L.; Poulet, F.; Des Marais, D.J.; Roach, L.H.; Milliken, R.E.; Wray, J.J. Identification of hydrated silicate minerals on Mars using MRO-CRISM: Geologic context near Nili Fossae and implications for aqueous alteration. J. Geophys. Res. Planets 2009, 114, E00D08. [Google Scholar] [CrossRef]
  21. Siesler, H.W.; Kawata, S.; Heise, H.M.; Ozaki, Y. Near-Infrared Spectroscopy: Principles, Instruments, Applications; John Wiley & Sons: Hoboken, NJ, USA, 2008. [Google Scholar]
  22. Holze, R. Fundamentals and applications of near infrared spectroscopy in spectroelectrochemistry. J. Solid State Electrochem. 2004, 8, 982–997. [Google Scholar] [CrossRef]
  23. Williams, P.; Norris, K. Near-Infrared Technology in the Agricultural and Food Industries; American Association of Cereal Chemists, Inc.: St. Paul, MN, USA, 1987. [Google Scholar]
  24. Clark, R.N.; King, T.V.; Klejwa, M.; Swayze, G.A.; Vergo, N. High spectral resolution reflectance spectroscopy of minerals. J. Geophys. Res. Solid Earth 1990, 95, 12653–12680. [Google Scholar] [CrossRef]
  25. Ozaki, Y.; Huck, C.W.; Ishigaki, M.; Ishikawa, D.; Ikehata, A.; Shinzawa, H. Near-infrared spectroscopy in biological molecules and tissues. In Encyclopedia of Biophysics; Roberts, G., Watts, A., European Biophysical Societies, Eds.; Springer: Berlin/Heidelberg, Germany, 2018. [Google Scholar]
  26. Clark, R.N.; Rencz, A.N. Spectroscopy of rocks and minerals, and principles of spectroscopy. Man. Remote Sens. 1999, 3, 3–58. [Google Scholar]
  27. Duke, E.F. Near infrared spectra of muscovite, Tschermak substitution, and metamorphic reaction progress: Implications for remote sensing. Geology 1994, 22, 621–624. [Google Scholar] [CrossRef]
  28. Vedder, W. Correlations between infrared spectrum and chemical composition of mica. Am. Mineral. J. Earth Planet. Mater. 1964, 49, 736–768. [Google Scholar]
  29. Lypaczewski, P.; Rivard, B. Estimating the Mg# and AlVI content of biotite and chlorite from shortwave infrared reflectance spectroscopy: Predictive equations and recommendations for their use. Int. J. Appl. Earth Obs. Geoinf. 2018, 68, 116–126. [Google Scholar]
  30. Post, J.; Crawford, S. Uses of near-infared spectra for the identification of clay minerals. Appl. Clay Sci. 2014, 95, 383–387. [Google Scholar] [CrossRef]
  31. Wu, S.; He, M.; Yang, M.; Peng, B. Near-Infrared Spectroscopic Study of OH Stretching Modes in Kaolinite and Dickite. Crystals 2022, 12, 907. [Google Scholar] [CrossRef]
  32. Kokaly, R.; Clark, R.; Swayze, G.; Livo, K.; Hoefen, T.; Pearson, N.; Wise, R.; Benzel, W.; Lowers, H.; Driscoll, R. USGS Spectral Library Version 7 Data: US Geological Survey Data Release; United States Geological Survey (USGS): Reston, VA, USA, 2017; 61p. [Google Scholar]
  33. Petit, S.; Madejova, J.; Decarreau, A.; Martin, F. Characterization of octahedral substitutions in kaolinites using near infrared spectroscopy. Clays Clay Miner. 1999, 47, 103–108. [Google Scholar] [CrossRef]
  34. Balan, E.; Saitta, A.M.; Mauri, F.; Calas, G. First-principles modeling of the infrared spectrum of kaolinite. Am. Mineral. 2001, 86, 1321–1330. [Google Scholar] [CrossRef]
  35. Kaye, W. Near-infrared spectroscopy: I. Spectral identification and analytical applications. Spectrochim. Acta 1954, 6, 257–287. [Google Scholar] [CrossRef]
  36. Aldega, L.; Cuadros, J.; Laurora, A.; Rossi, A. Weathering of phlogopite to beidellite in a karstic environment. Am. J. Sci. 2009, 309, 689–710. [Google Scholar] [CrossRef]
  37. Rieppo, L.; Saarakkala, S.; Närhi, T.; Helminen, H.; Jurvelin, J.; Rieppo, J. Application of second derivative spectroscopy for increasing molecular specificity of fourier transform infrared spectroscopic imaging of articular cartilage. Osteoarthr. Cartil. 2012, 20, 451–459. [Google Scholar] [CrossRef] [PubMed]
  38. Redhammer, G.n.J.; Beran, A.; Schneider, J.; Amthauer, G.; Lottermoser, W. Spectroscopic and structural properties of synthetic micas on the annite-siderophyllite binary: Synthesis, crystal structure refinement, Mössbauer, and infrared spectroscopy. Am. Mineral. 2000, 85, 449–465. [Google Scholar] [CrossRef]
  39. Yuan, X.; Mayanovic, R.A. An empirical study on Raman peak fitting and its application to Raman quantitative research. Appl. Spectrosc. 2017, 71, 2325–2338. [Google Scholar] [CrossRef]
  40. Bailey, S. Structures of layer silicates. In Crystal Structures of Clay Minerals and their X-ray Identification; European Mineralogical Union: Strasbourg, France, 1980. [Google Scholar]
  41. Bailey, S.W. Re-evaluation of ordering and local charge-balance in Ia chlorite. Can. Mineral. 1986, 24, 649–654. [Google Scholar]
  42. Fleet, M.E.; Deer, W.A.; Howie, R.A.; Zussman, J. Rock-Forming Minerals: Micas; Geological Society: London, UK, 2003. [Google Scholar]
  43. Nachit, H.; Ibhi, A.; Ohoud, M.B. Discrimination between primary magmatic biotites, reequilibrated biotites and neoformed biotites. Comptes Rendus Geosci. 2005, 337, 1415–1420. [Google Scholar] [CrossRef]
  44. Stubičan, V.; Roy, R. Isomorphous substitution and infra-red spectra of the layer lattice silicates. Am. Mineral. J. Earth Planet. Mater. 1961, 46, 32–51. [Google Scholar]
  45. Jenkins, D.M. Empirical study of the infrared lattice vibrations (1100–350 cm−1) of phlogopite. Phys. Chem. Miner. 1989, 16, 408–414. [Google Scholar] [CrossRef]
  46. Farmer, V.t.; Russell, J. The infra-red spectra of layer silicates. Spectrochim. Acta 1964, 20, 1149–1173. [Google Scholar] [CrossRef]
  47. Sergent, A.P.J.; Robert, J.L. Intersite OH-F distribution in an Al-rich synthetic phlogopite. Eur. J. Miner. 1997, 9, 501–508. [Google Scholar]
  48. Sijakova-Ivanova, T.; Robeva-Čukovska, L. Mineralogical characteristics of phlogopite from Dupen kamen, Republic of Macedonia. IOSR J. Appl. Geol. Geophys. (IOSR-JAGG) 2016, 4, 72–76. [Google Scholar] [CrossRef]
  49. Robert, J.-L. Etudes Cristallochimiques sur les Micas et les Amphiboles: Applications Petrographiques et Geochimiques. Ph.D. Thesis, Université Paris-Sud, Paris, France, 1981. [Google Scholar]
  50. Scordari, F.; Ventruti, G.; Sabato, A.; Bellatreccia, F.; Della Ventura, G.; Pedrazzi, G. Ti-rich phlogopite from Mt. Vulture (Potenza, Italy) investigated by a multianalytical approach: Substitutional mechanisms and orientation of the OH dipoles. Eur. J. Mineral. 2006, 18, 379–391. [Google Scholar] [CrossRef]
  51. Sun, J.; Yang, Y.; Ingrin, J.; Wang, Z.; Xia, Q. Impact of fluorine on the thermal stability of phlogopite. Am. Mineral. 2022, 107, 815–825. [Google Scholar] [CrossRef]
  52. Farmer, V.; Russell, J.; McHardy, W.; Newman, A.; Ahlrichs, J.; Rimsaite, J. Evidence for loss of protons and octahedral iron from oxidized biotites and vermiculites. Mineral. Mag. 1971, 38, 121–137. [Google Scholar] [CrossRef]
  53. Farmer, V.C. The Infrared Spectra of Minerals. Mineral. Soc. Monogr. 1974, 4, 331–363. [Google Scholar]
  54. Della Ventura, G.; Mottana, A.; Parodi, G.C.; Griffin, W.L. FTIR spectroscopy in the OH-stretching region of monoclinic epidotes from Praborna (St. Marcel, Aosta valley, Italy). Eur. J. Mineral. 1996, 8, 655–665. [Google Scholar] [CrossRef]
  55. Wang, A.; Freeman, J.J.; Jolliff, B.L. Understanding the Raman spectral features of phyllosilicates. J. Raman Spectrosc. 2015, 46, 829–845. [Google Scholar] [CrossRef]
  56. McKeown, D.A.; Bell, M.I.; Etz, E.S. Raman spectra and vibrational analysis of the trioctahedral mica phlogopite. Am. Mineral. 1999, 84, 970–976. [Google Scholar] [CrossRef]
  57. Šontevska, V.; Jovanovski, G.; Makreski, P.; Raškovska, A.; Šoptrajanov, B. Minerals from Macedonia. XXI. Vibrational spectroscopy as identificational tool for some phyllosilicate minerals. Acta Chim. Slov. 2008, 55, 757–766. [Google Scholar]
  58. Ventruti, G.; Caggianelli, A.; Festa, V.; Langone, A. Crystal chemistry of barian titanian phlogopite from a lamprophyre of the Gargano Promontory (Apulia, Southern Italy). Minerals 2020, 10, 766. [Google Scholar] [CrossRef]
  59. Tlili, A.; Smith, D.C.; Beny, J.-M.; Boyer, H. A Raman microprobe study of natural micas. Mineral. Mag. 1989, 53, 165–179. [Google Scholar] [CrossRef]
  60. Langer, K.; Flörke, O.W. Near infrared absorption spectra (4000–9000 cm−1) of opals and the vole of” water” in these SIO2·nH2O minerals. Fortschr. Miner. 1974, 52, 17–51. [Google Scholar]
  61. Pasquini, C. Near infrared spectroscopy: Fundamentals, practical aspects and analytical applications. J. Braz. Chem. Soc. 2003, 14, 198–219. [Google Scholar] [CrossRef]
  62. Cheng, H.; Hao, R.; Zhou, Y.; Frost, R.L. Visible and near-infrared spectroscopic comparison of five phyllosilicate mineral samples. Spectrochim. Acta Part A Mol. Biomol. Spectrosc. 2017, 180, 19–22. [Google Scholar] [CrossRef] [PubMed]
  63. Post, J.L.; Noble, P.N. The near-infrared combination band frequencies of dioctahedral smectites, micas, and illites. Clays Clay Miner. 1993, 41, 639–644. [Google Scholar] [CrossRef]
  64. Beran, A. Infrared Spectroscopy of Micas. Rev. Mineral. Geochem. 2002, 46, 351–369. [Google Scholar] [CrossRef]
  65. Hunt, G.R. Spectral signatures of particulate minerals in the visible and near infrared. Geophysics 1977, 42, 501–513. [Google Scholar] [CrossRef]
  66. Bishop, J.; Lane, M.; Dyar, M.; Brown, A. Reflectance and emission spectroscopy study of four groups of phyllosilicates: Smectites, kaolinite-serpentines, chlorites and micas. Clay Miner. 2008, 43, 35–54. [Google Scholar] [CrossRef]
  67. Besson, G.; Drits, V. Refined relationships between chemical composition of dioctahedral fine-grained micaceous minerals and their infrared spectra within the OH stretching region. Part II: The main factors affecting OH vibrations and quantitative analysis. Clays Clay Miner. 1997, 45, 170–183. [Google Scholar] [CrossRef]
  68. Bishop, J.; Murad, E.; Dyar, M. The influence of octahedral and tetrahedral cation substitution on the structure of smectites and serpentines as observed through infrared spectroscopy. Clay Miner. 2002, 37, 617–628. [Google Scholar] [CrossRef]
  69. Harris, D.C.; Bertolucci, M.D. Symmetry and Spectroscopy: An Introduction to Vibrational and Electronic Spectroscopy; Courier Corporation: North Chelmsford, MA, USA, 1989. [Google Scholar]
  70. Valášková, M.; Madejová, J.; Inayat, A.; Matějová, L.; Ritz, M.; Martaus, A.; Leštinský, P. Vermiculites from Brazil and Palabora: Structural changes upon heat treatment and influence on the depolymerization of polystyrene. Appl. Clay Sci. 2020, 192, 105639. [Google Scholar] [CrossRef]
  71. Libowitzky, E. Correlation of OH Stretching Frequencies and OH O Hydrogen Bond Lengths in Minerals; Springer: Berlin/Heidelberg, Germany, 1999. [Google Scholar]
  72. Brigatti, M.F.; Poppi, L. Crystal chemistry of Ba-rich trioctahedral micas-1M. Eur. J. Mineral. 1993, 5, 857–871. [Google Scholar] [CrossRef]
  73. Brigatti, M.F.; Medici, L.; Poppi, L.; Vaccaro, C. Crystal chemistry of trioctahedral micas-1 M from the Alto Paranaíba Igneous Province, southeastern Brazil. Can. Mineral. 2001, 39, 1333–1345. [Google Scholar] [CrossRef]
  74. Laurora, A.; Brigatti, M.F.; Mottana, A.; Malferrari, D.; Caprilli, E. Crystal chemistry of trioctahedral micas in alkaline and subalkaline volcanic rocks: A case study from Mt. Sassetto (Tolfa district, Latium, central Italy). Am. Mineral. 2007, 92, 468–480. [Google Scholar] [CrossRef]
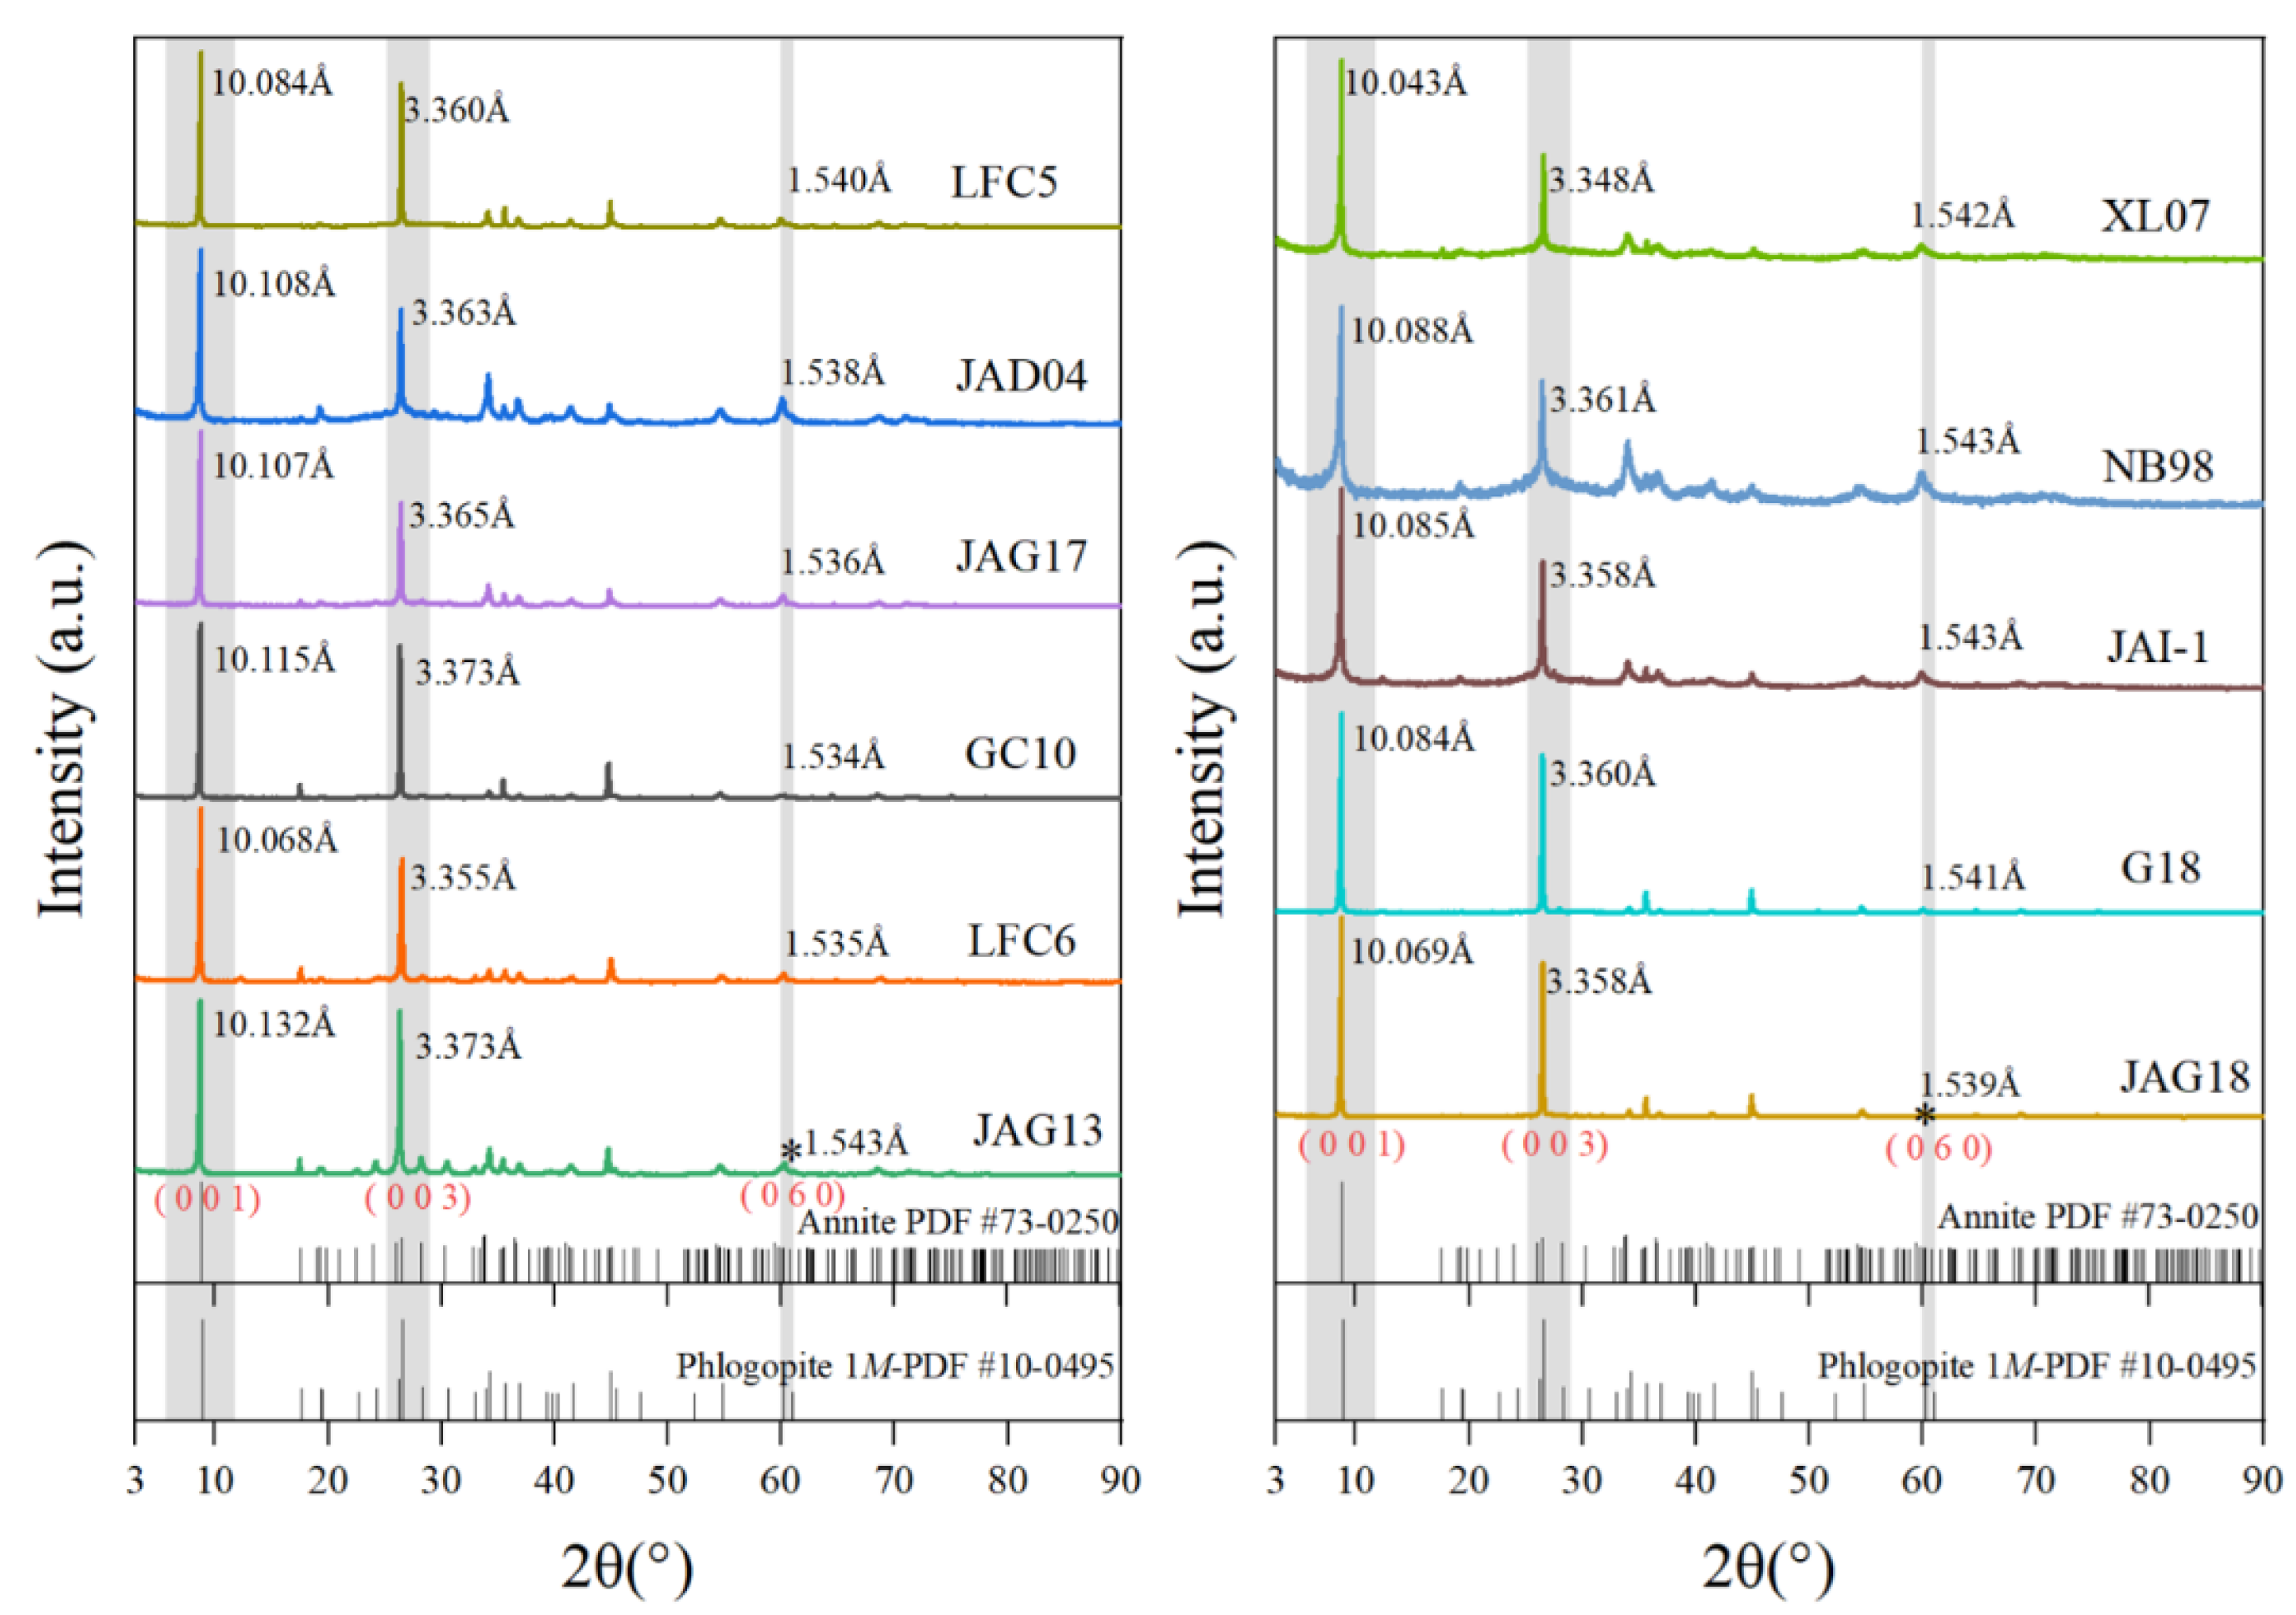
Figure 1. X-ray powder crystal diffraction data of biotite–phlogopite samples.
Crystals 14 00336 g001
Figure 2. Mg–(AlVI+Fe3++Ti)–(Fe2++Mn) ternary classification diagram of biotite–phlogopite (after Foster, 1960). JAG18 mineral, positioned between phlogopite and Mg–biotite, is classified as Mg–biotite based on comprehensive information.
Crystals 14 00336 g002
Figure 3. MIR spectra of the biotite and phlogopite. (a) 700~1100 cm−1; (b) 400~4000 cm−1; (c) 3650~3750 cm−1. Spectra ① in (b) (enlarged view: Figure 3a) show that phlogopite have an absorption peak around 810 cm−1, assigned to the stretching vibration of AlIV−O in [AlO4] tetrahedra. However, this feature is not observed in Mg−biotite and annite. Spectra ② in (b) (enlarged view: (c)) show that annite samples exhibit a weak absorption peak at 3660 cm−1 in the MIR reign.
Crystals 14 00336 g003
Figure 4. MIR spectral 400−650 cm−1 analysis of OH-stretching region.
Crystals 14 00336 g004
Figure 5. MIR spectral 3650−3750 cm−1 analysis of OH−stretching region.
Crystals 14 00336 g005
Figure 6. Raman spectra of the biotite and phlogopite samples. From XL07 to JAG13, arranged in increasing order of Mg# content (Mg# = 28~98), the black lines indicate the shift of characteristic peaks.
Crystals 14 00336 g006
Figure 7. Analysis of Raman spectra in OH−stretching vibration.
Crystals 14 00336 g007
Figure 8. NIR spectra of the biotite and phlogopite samples. (a) OH combination bands in the range of 4000−5000 cm−1; (b) OH−stretching overtone bands in the range of 7000−8000 cm−1.
Crystals 14 00336 g008
Figure 9. The first overtone results from OH−stretching vibrations in NIR spectra.
Crystals 14 00336 g009
Figure 10. The fundamental peaks assignment of NIR spectra combination peaks (4200−4450 cm−1) and experimental peak positions error. Unit is cm−1. The data points represent the experimental measurement combination peak positions, with error bars in the positive direction indicating the relative values of errors. The predicted measurement combination peak positions are the sum of fundamental peaks, and the error (δ) is calculated as the predicted value minus the experimental measurement value.
Crystals 14 00336 g010
Figure 11. Correlations between biotite–phlogopite composition and NIR spectral data. (a) 4300 cm−1 characteristic absorption peaks; (b) 4200 cm−1 characteristic absorption peaks; (c) 4450 cm−1 characteristic absorption peaks; (d) 4450 cm−1 characteristic absorption peaks intensity [29,32].
Crystals 14 00336 g011
Figure 12. Correlations between Mg# values and the growth of the lattice b0 in biotite–phlogopite. The XRD overlay plot for the 11 samples (Figure 1) has been illustrated in the text.
Crystals 14 00336 g012
Table 1. Sample Information Description.
SampleMineralColorImpurities (a.p.f.u) *
LFC5PhlogopiteGolden yellowCr, Mn, Ni, Ca, Zn = 0,Na, Ti < 0.07
LFC6PhlogopiteGolden yellowCr, Mn, Ni, Ca, Zn, Ti = 0, Na < 0.08
GC10PhlogopiteGolden yellowCr, Mn, Ni, Ca, Zn = 0, Na, Ti < 0.05
JAG13PhlogopiteGolden yellowCr, Mn, Ni, Ca, Zn = 0,Na, Ti < 0.04
JAG17PhlogopiteBrownish yellowCr, Mn, Ni, Ca, Zn = 0, Na, Ti < 0.09
JAD04CCPhlogopiteBrownish yellowCr, Mn, Ni, Ca, Zn = 0,Na, Ti < 0.16
JAG18Mg–BiotiteBrownish yellowCr, Mn, Ni, Ca, Zn, Na < 0.02, Ti < 0.18
G18Mg–BiotiteBrownish yellowCr, Mn, Ni, Ca, Zn, Na < 0.01, Ti < 0.13
JAI-1Mg–BiotiteSepiaCr, Mn, Ni, Ca, Zn, Na < 0.02, Ti < 0.12
WS660 [32] Mg–BiotiteSepiaCr, Mn, Ni, Ca, Zn, Na < 0.01, Ti < 0.16
HS28.3B [32] Mg–BiotiteSepiaCr, Ni, Ca, Zn = 0, Mn, Na, Ti < 0.13
K389048 [29]Mg–BiotiteSepiaCr, Mn, Ni, Ca, Zn, Na < 0.02, Ti < 0.1
XL07AnniteSepiaCr, Mn, Ni, Ca, Zn, Na < 0.04, Ti < 0.23
NB98AnniteSepiaCr, Mn, Ni, Ca, Zn, Na < 0.01, Ti < 0.13
Bt-8 [29]AnniteSepiaCr, Mn, Ni, Ca, Zn = 0,Na, Ti < 0.12
* EMPA experiments data obtained.
Table 2. Composition of biotite–phlogopite (a.p.f.u. for 11 O) determined from EMPA.
SampleXL07NB98G18JAG18JAI-1LFC5LFC6JAG13JAD04GC10JAG17
Mineral
(Point)
An
(2)
An
(3)
Bt
(2)
Bt
(3)
Bt
(1)
Phl
(1)
Phl
(3)
Phl
(2)
Phl
(3)
Phl
(1)
Phl
(2)
Si2.752 2.768 2.958 2.905 2.760 3.000 3.097 2.904 2.930 2.870 2.842
Al1.326 1.365 1.200 1.129 1.370 1.030 0.930 1.321 1.143 1.280 1.346
Ti0.226 0.168 0.124 0.187 0.120 0.050 0.003 0.020 0.159 0.050 0.079
Cr0.000 0.003 0.002 0.001 0.000 0.000 0.000 0.000 0.000 0.000 0.002
Fe3+0.191 0.165 0.124 0.099 0.170 0.080 0.028 0.014 0.063 0.050 0.054
Fe2+1.535 1.408 0.548 0.508 1.130 0.550 0.101 0.045 0.231 0.200 0.218
Mn0.046 0.018 0.004 0.006 0.020 0.000 0.000 0.000 0.002 0.000 0.001
Ni0.000 0.001 0.002 0.001 0.000 0.000 0.001 0.000 0.001 0.000 0.001
Mg0.698 0.902 1.822 1.990 1.330 2.180 2.791 2.622 2.310 2.500 2.346
Ca0.000 0.001 0.001 0.002 0.010 0.000 0.000 0.001 0.000 0.000 0.001
Na0.013 0.013 0.014 0.020 0.010 0.070 0.075 0.040 0.049 0.040 0.078
K0.966 0.976 0.933 0.900 0.810 0.940 0.864 0.928 0.883 0.930 0.899
Zn0.003 0.003 0.002 0.003 0.010 0.000 0.001 0.000 0.003 0.000 0.005
F0.349 0.030 0.079 0.085 0.304 0.545 0.160 0.066 0.066 0.062
Cl0.017 0.010 0.029 0.028 0.034 0.005 0.005 0.018 0.009 0.016
Total8.119 7.832 7.838 7.864 7.740 8.238 8.439 8.058 7.858 7.995 7.947
Mg#28.789 36.435 73.065 76.624 50.500 77.770 96.467 97.819 88.693 91.170 89.629
AlIV1.249 1.232 1.043 1.095 1.240 1.000 0.903 1.096 1.070 1.130 1.159
AlVI0.077 0.133 0.157 0.034 0.130 0.030 0.027 0.225 0.073 0.150 0.187
Phl, Phlogopite; Bt, Biotite; An, Annite. The EMPA cannot differentiate between Fe2+ and Fe3+. The raw data assume all iron as FeO, and the values for Fe2+ and Fe3+ are calculated accordingly. For EMPA in oxide form, see Table S1: Major element compositions of biotite and phlogopite.
Table 3. Biotite−phlogopite MIR spectra peak fitting results and peak assignments: wavenumber range from 400−600 cm−1.
FTIR Peak Positions in 400~600 cm−1 Region
Minerals NameMinerals NameAssignment
[28,44,45,46]
[44][45]Active
AnniteMg–BiotitePhlogopite
XL07NB98G18JAG18JAD04JAG17JAG13GC10LFC5LFC6
432429428428429426430423429425410IF,R
453447438443444443448443441445δ(Si–O–Mg)450IF
470465462462465466467465462465δ(Si–O–Si)470460IF
492490492486491494492491488491ν(Mg–O)500495IF
517515521511517521516508513516δ(Si–O–Si)520IF
592610608602604592611OH Libration610592IF
Table 4. Biotite–phlogopite MIR spectra peak fitting results and peak assignments: wavenumber range from 3600–3750 cm−1.
FTIR Peak Positions in 3600~3750 cm−1 Region
Minerals NameAssignmentMinerals NameAssignment
[51,52,53]
[54][50]Active
AnniteMg–Biotite Phlogopite
XL07NB98G18JAG18 JAD04JAG17JAG13GC10LFC5LFC6
3629362736273626ν(AlAl□OH)365936493655364836543655ν(MgMgFeOH)36293641IF,R
3652364836523645An: [38]
ν(Fe2+Fe2+Al3+OH)
Mg–Bt: ν(MgMgFeOH)
3669366236693671ν(MgMgFeOH)36533663IF,R
3665366936663669An: [38]
ν(FeFeFeOH)
Mg–Bt:
ν(MgMgFeOH)
368136753671366836843679ν(MgMgFeOH)IF,R
3675367636733686ν(Mg2FeOH)
3696369836983703ν(MgMgMgOH)36943692ν(MgMgMgOH)IF,R
3710371337063715ν(MgMgMgOH)370036953691369137033707ν(MgMgMgOH)36683685IF,R
3717ν(MgMgMgOH)371437143714371237143719ν(MgMgMgOH)37033706IF,R
ν, Stretching vibration; δ, Sending vibration.
Table 5. Biotite–phlogopite Raman peaks and corresponding assignments: wavenumber range from 3600–3750 cm−1.
Raman Peak Positions in 3600~3750 cm−1 Region
Minerals Name[58] [59]AssignmentActive
AnniteMg–BiotitePhlogopite
XL07NB98G18JAG18JAD04JAG17JAG13GC10LFC5LFC6
3627363336303625 *3637 *363036393632OH
Stretching
IF,R
3644364036453644364836483641R
36583657365136543655IF,R
36633663366136633666IF,R
3673367136773676367436733675367336783676IF,R
368636893689368036873682R
369936993700 IF,R
37143707370837163712371637143707371936983709IF,R
3714IF,R
3741R
3754374037363751R
37493745R
* The absorption peak is not represented in Figure 7.
Table 6. The OH related bands and their assignments near 7000–7500 cm−1.
AssignmentG18JAG18JAD04JAG17JAG13GC10LFC5LFC6
The first fundamental
overtone of ν(OH)
71537142714171417140713671397140
716371677164716571647165
71767182718271837181717671807181
7206720372037205
72337233
725372417241724472407240
72777265725872607261726272617259
7301729572927294
73187309730873067308
7329732773267327
7342734373437343735273427342
7378737973797379738173777378
7420742474257422742474187420
Table 7. Factor of the first overtones within 7000−7300 cm−1 in NIR spectra.
SampleMeasured
Peaks (cm−1)
Fundamental
Peaks (cm−1)
FactorSampleMeasured
Peaks (cm−1)
Fundamental
Peaks (cm−1)
Factor
LFC5 Average:1.955G18 Average:1.955
1725937141.9551725837171.953
2724037031.9552723737061.953
3723336941.9583722236981.953
4720536841.9564719536731.959
5718136691.9575717636661.958
67165(3669 + 3654)/21.95767153(3666 + 3652)/21.955
7714036541.9547713036521.952
871183648 *1.95187107 2nd
LFC6 Average:1.955JAG18 Average:1.956
1726137191.9521726337151.955
2724037071.9532724137031.955
3723336921.9593
4720336791.95847219 2nd36861.958
5718036711.9565718236691.958
67164(3671 + 3655)/21.95667163(3669 + 3645)/21.959
7713936551.9537714236451.959
871173648 *1.95187119 2nd3640 *1.956
JAG13 Average:1.954JAD04 Average:1.956
1726137141.9551725837141.954
27242 2nd2724137001.957
33
4720336911.9524720636811.958
5718136711.9565718236691.957
67165(3671 + 3655)/21.95667167(3669 + 3659)/21.956
7714036551.9537714136591.952
871193645 *1.95387119
GC10 Average:1.954JAG17 Average:1.956
1726237121.9561726037141.955
272402724036951.959
33
47208 2nd36911.9534
5717636681.956571792nd36751.953
67160 2nd(3668 + 3648)/21.9576716436621.956
7713636481.9567714136491.957
87090 2nd3644 *1.946871162nd
* Non-infrared-active, only observed in Raman spectra; 2nd Wavenumber obtained by the 2nd derivative.
Disclaimer/Publisher’s Note: The statements, opinions and data contained in all publications are solely those of the individual author(s) and contributor(s) and not of MDPI and/or the editor(s). MDPI and/or the editor(s) disclaim responsibility for any injury to people or property resulting from any ideas, methods, instructions or products referred to in the content.