Abstract
In the conditions of an energy crisis, an important issue is the increase in energy efficiency and productivity of welding and hardfacing processes. The article substantiates the perspective of using exothermic additives introduced into core filler for flux-cored wire arc welding processes as a relatively cheap additional heat source, reducing energy consumption when melting filler materials, and increasing the deposition rate. The mixture design (MD) was selected as the design method to optimize the average values of current and voltage, as well as arc stability parameters depending on core filler composition. This article studies the influence of the introduction of exothermic addition (EA), as well as the ratios CuO/C and CuO/Al on arc stability for the FCAW S process. Parameters characterizing arc stability were determined using an oscillograph, and from the obtained oscillograms, an analysis was conducted on arc voltage and welding current signals during flux-cored arc welding. It was determined that various methods can be used to evaluate arc stability, which can be divided into two groups: graphical (current and voltage cyclograms, box plots with frequency histograms, ellipse parameters plotted on current, and voltage cyclograms) and statistical (standard variation and coefficients of variation for welding current and arc voltage). In this paper, a comprehensive evaluation of arc stability depending on the composition of the cored wire filler was carried out. It was determined that the most stable current parameters were observed for the flux-cored wire electrode with an average exothermic addition content at the level of EA = 26.5–28.58 wt.% and a high carbon content (low values of CuO/C = 3.75). Conversely, the lowest values of arc stability (CV(U) and Std(U)) were observed during hardfacing with a flux-cored wire electrode with a high CuO/Al ratio ≥ 4.5 and a content of exothermic addition in the core filler below the average EA < 29 wt.%. Mathematical models of mean values, standard deviation, coefficient of variation for welding current, and arc voltage were developed. The results indicated that the response surface prediction models had good accuracy and prediction ability. The developed mathematical models showed that the ratio of oxidizing agent to reducing agent in the composition of exothermic addition (CuO/Al) had the greatest influence on the welding current and arc voltage characteristics under investigation. The percentage of exothermic mixture in the core filler (EA) only affected the average welding current (Iaw) and the average arc voltage (Uaw). The graphite content expressed through the CuO/C ratio had a significant impact on welding current parameters as well as the coefficient of variation of arc voltage (CV(U)). Two welding parameters were selected for optimization: the mean welding current (Iaw) and the standard deviation of arc voltage (Std(U)). The best arc stability when using exothermic addition CuO-Al in the core filler was observed at CuO/Al = 3.6–3.9, CuO/C = 3.5–4.26, and at an average EA content of 29–38 wt.%. The significant influence of the CuO/Al and CuO/C ratios on arc voltage parameters can also be explained by their impact on the elemental composition of the welding arc (copper, cupric oxide (CuO), and Al2O3). The more complete this reaction, the higher the amount of easily vaporized copper (Cu) in the arc plasma, enhancing arc stability. The influence of core filler composition on the microstructure of deposited metal of the Fe-Cr-Cu-Ti alloy system was investigated.
1. Introduction
The role and significance of materials for the advanced economies of the world remain substantial. Materials form the basis of many sectors of the economy, among which construction [1,2], automobile manufacturing [3,4,5,6,7], and mechanical engineering [8,9,10,11] hold particular importance. Among materials, welding materials hold special significance. Chemical–thermal methods [12,13,14], functional coatings [15,16,17], electrospark deposition (ESD) [18,19,20,21,22], thermal spraying [23], and laser hardfacing [24] are some methods utilized. However, the most widespread application is found in the welding process [25]. Based on type, this application is classified into stick electrodes, solid wires, flux-cored wires, and submerged arc welding (SAW) wires with fluxes [26]. The flux-cored arc welding process is increasingly used in many industries, including construction, automobile production, agriculture, mining, etc. [27,28,29,30,31]. The growing demand for flux-cored wires is justified by the advantages of welding methods.
Flux-cored wires are widely used for hardfacing and the restoration of worn surfaces [32,33,34,35,36]. The hardfacing process consists forming a hardening layer of the deposited metal on surfaces subject to intense abrasive wear [37,38], impact abrasion [39,40,41,42], and other types of wear [43,44,45,46]. For the flux-cored arc welding process of filler materials, melting is mainly carried out by arc welding [47,48]. Additionally, an important aspect is the study of the mechanical properties of the deposited metal [49,50,51,52]. The final microstructure and mechanical properties depend on the cooling conditions of the deposited metal [53,54] and heat input. These determines the wear resistance of the deposited metal to various types of wear [55,56,57,58,59]. An unstable arc would deteriorate weld appearances and increase the amount of imperfections [60]. In this case, the flux-cored wire arc welding process has a specific character [61,62,63]. Melting is carried out due to the wandering of the arc spot around the perimeter of the metal sheath [64,65]. In most cases, the surfacing process using a flux-cored wire electrode is characterized by the short-circuiting, globular, or drop mode of metal transfer, due to the use of low welding currents. This reduces hardfacing productivity, but ensures a low dilution of variation. In this case, it is of great interest to improve the energy efficiency of the welding process and the quality of the deposited metal. One of the most promising ways to improve the energy efficiency of the welding and hardfacing processes is the introduction of exothermic addition to the core filler [26,66]. Additional heat is generated at the electrode tip or in the welding arc by an exothermic reaction. Many scientists have investigated the introduction of exothermic addition in filler materials [67,68,69,70,71,72,73]. These additives bring about changes in the thermodynamics and physics of the processes occurring both during the filler material heating stage and during the material transfer and arc burning stage, in the context of significant and purposeful changes in entropy, enthalpy, and internal energy [74,75]. Their studies show the positive effect of the introduction of exothermic addition on the uniformity of melting, productivity, and efficiency of hardfacing, arc stability, etc.
In self-shielded flux-cored wire arc welding with exothermic addition, the welding current is determined not only by the wire feed speed (WFS) but also by the exothermic addition used and its amount (EA) in the core filler [26,61], as well as the contact tip to work distance (CTWD) and set arc welding (Uset) [61,76]. The first parameter is determined by the characteristics of the power supply. The influence of the last two parameters can be explained by the cost of the supplied power for heating the flux-cored wire electrode (Joule heat heating), i.e., the preheating of the filler materials. This preheating enables the electrode to burn off faster and increases the deposition rate [77]. It has been concluded that the welding consumables, welding parameters, and equipment have a key role to play in the stability of the welding process [78,79,80,81].
Research by Allen et al. [67] demonstrated the effectiveness of introducing exothermic additions from the Fe2O3-Al system compared to the Fe2O3-Mg system. These observations indicated that the magnesium exothermic additions react ahead of the welding arc, delocalizing the exothermic source and its heating ability. Park et al. [65] conducted studies on the influence of introducing exothermic additions to the core filler, including simple exothermic systems Fe2O3-Al and Fe2O3-Mg, as well as a combined reducer Fe2O3-(50%Mg/50%Al). The results showed greater efficiency with the combined reducer Fe2O3-(50%Mg/50%Al). It is noteworthy that exothermic additions with Fe2O3-Al and Fe2O3-(50%Mg/50%Al) showed the lowest dilution values. The research also examined weld bead morphology and melting efficiency. FCAW with exothermic addition Fe2O3-Al exhibited the lowest dilution when the content of exothermic addition was <30 wt.% of the core filler. However, when the content of exothermic addition was ≥30 wt.% of the core filler, FCAW with exothermic addition Fe2O3-Mg showed the lowest dilution. However, most of the research on flux-cored wires with exothermic additions to the core filler pertains to the welding process. Meanwhile, the area of filler materials for hardfacing processes is insufficiently studied due to the demands placed on deposited alloys, particularly regarding their high degree of alloying. As a result, the composition of the core filler is limited, which is especially crucial for self-shielded flux-cored wire electrodes (FCAW SS) due to the mandatory presence of gas and slag-forming components [82]. In such cases, it is advisable to consider alternative exothermic addition systems [61]. For hardfacing, alloys from the Fe-C-B-Cr-Cg-Cu system [26,27,83] are of particular interest, especially when additionally alloyed with a significant amount of copper. The high degree of copper alloying improves the microstructure of the deposited metal, enhances its mechanical properties and resistance to abrasive wear [26], and significantly increases corrosion resistance [27]. Trembach et al. [64] first proposed the use of exothermic addition CuO-Al for hardfacing processes. Their research results demonstrated a high degree of alloying in the deposited metal due to the recovery of copper from CuO in the exothermic addition. Trembach et al. [61] optimized hardfacing conditions with the introduction of exothermic addition CuO-Al into the core filler.
Trembach et al. [79] investigated the influence of introducing exothermic addition CuO-Al to the core filler, the ratio of graphite to EA oxidizer (CuO/C), and the ratio of oxidizer to aluminum powder in the composition of the EA (CuO/Al) on core filler density and the fill factor. Experimental values are provided in Table 1. Mathematical models of these indicators and their response surfaces were constructed (Figure 1). Subsequently, Trembach et al. [84] studied the impact of these variables on melting characteristics such as the melt-off rate (MOR), deposited rate (DR), spattering factor (SF), and deposition efficiency (De). Experimental values are presented in Table 1. Response surface plots of the melting characteristics’ deposited rate (DR) and spattering factor (SF) are shown in Figure 2. The next stage of the work involved investigating the element transition factor, the copper recovery factor η(Cu) [64], and the overall transition element factor η(SS) [85]. The obtained data are shown in Table 1 and Figure 3. The results of these studies showed that the ratio of components CuO/Al in the exothermic mixture and the ratio of graphite to oxidizing agent of the exothermic mixture (CuO/C) had the greatest effect. The research findings also indicated that increasing the amount of EA above 35% leads to intense combustion of filler components.

Table 1.
Values of some characteristics of experimental self-shielded, flux-cored wire electrodes.
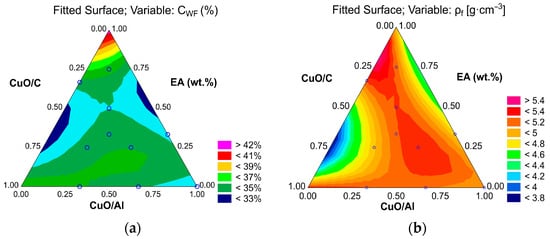
Figure 1.
Contour surface graphs for (a) filler rate CWF and (b) core filler density (ρf) [79].
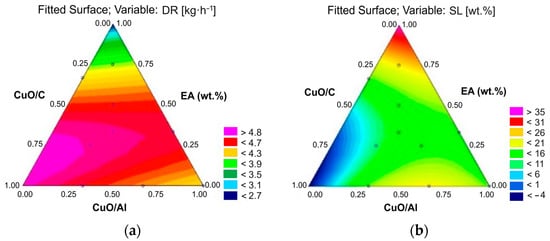
Figure 2.
Contour surface graphs for (a) deposited rate (DR) and (b) spattering factor (SF) [84].
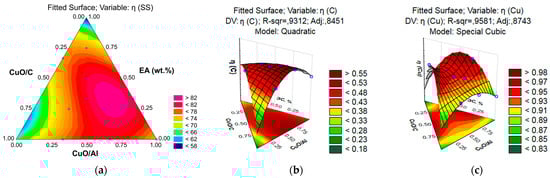
Figure 3.
Contour surface graphs for (a) the overall transition element factor η(SS) [85], and 3D graphs for (b) the transition recovery factor η(C) [64] and (c) the copper recovery factor η(Cu) [64].
The mathematical dependencies of the received response surfaces are as follows [64,79,84,85]:
However, the above-mentioned papers devote little attention to the issue of arc stability and its impact on weld bead morphology.
The purpose of this article is to study the influence of exothermic addition (CuO–Al) to core filler and core filler composition on the stability of the hardfacing process, to develop mathematical relationships for predicting current and voltage parameters, and to optimize core filler composition.
2. Materials and Methods
2.1. Design Experiment
Mixture design is known to be widely used to optimize composition. The main stages are the selection of a response variable (dependent variable) and a design experiment, as shown in Table 2 [82]. As variables, the following were chosen: x1—the ratio of oxidizing agent and reducing agent of the exothermic mixture (CuO/Al); x2—the ratio of exothermic mixture oxidizing agent to graphite content (CuO/C) with a lower level of 3 and an upper level of 6; and x3—content of the exothermic mixture (EA, wt.%) in the core filler with a lower level of 20 wt.% and an upper level of 46 wt.%. When conducting an experiment on the optimization of processes and searching for mathematical models to predict indicators or parameters of optimization, the following block diagram, shown in general form in Figure 4, is used.
Table 2.
Three-factor experiment design simplex trellis planning [64,79,84,85].
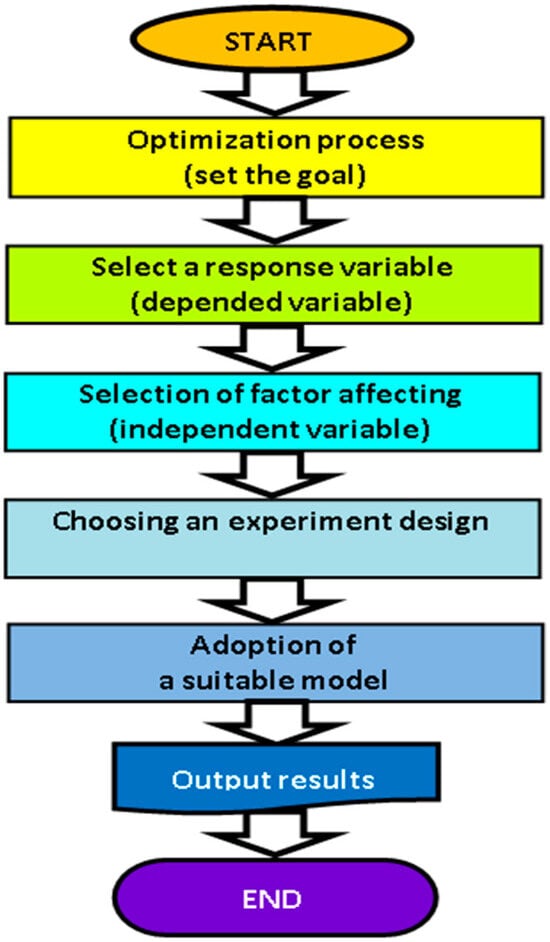
Figure 4.
An overall block diagram elaborating the algorithm for conducting a design plan.
The full cubic model is represented in Equation (8):
where y—the predicted response variable; i and j are the number of ingredients in the mixture; K—components given by the equation; βi—expected response at the top; βij—coefficients indicate the amount of quadratic curvature along the edge of the simplex region consisting of binary mixtures of xi and xj; and δij—account for ternary blending among three separate components in the interior of the design. βijk—the coefficient of the regression coefficient of the product terms of two or three variables. xi, xj, and xk represent three different design variables.
For modeling in this study, all possible regressions were used in combination with the stepwise regression method. The reason for using the two mentioned methods is to evaluate the suitability and appropriateness of the final model, using methods such as a residual analysis, a lack of fit test, and an evaluation of the effect of outliers.
2.2. Materials
The filler material was a TiO2–CaF2–CaO–SiO2 slag system self-shielded, flux-cored wire with a diameter of 4 mm. The core filler composition of the experimental FCAW-SS are shown in Table 3.
Table 3.
Composition of core filler FCAW-SS, wt.%.
The base metal was S 235 J2G2 EN 10025–2 (St3ps), and its dimensions were 200 mm × 100 mm × 15 mm. The welding process was carried out using a polarity-reversed welding power source with a rigid external characteristic. The following modes were used for hardfacing: wire feed speed WFS = 111 m/h; set arc voltage Us = 28 V; travel speed TS = 0.3 m/min; and contact tip to work distance CTWD = 40 mm. Hardfacing was carried out with reverse polarity by a self-powered welding head ABC automatic machine from a power source with a rigid external characteristic (Figure 5).
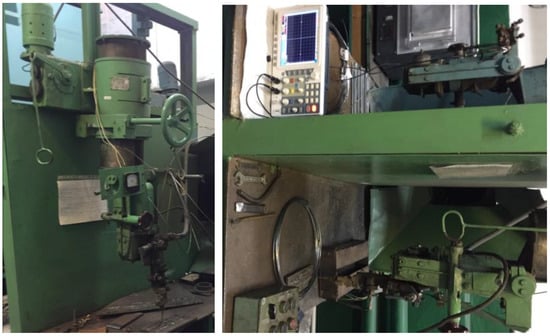
Figure 5.
Experimental setup for hardfacing.
2.3. Investigation Parameters
Every researcher studying the stability process understands the process in a different way and applies different indicators of arc stability [77,86]. The arc stability indexes were the average voltage (Iaw) and current and their standard deviations (Std(I) and Std(U)), the voltage and current square mean, the current coefficient of variation (CV(I)), and the voltage coefficient of variation (CV(U)) [87]. The current and voltage were measured using a welding waveform monitoring system (oscilloscope OWON SDS6062E) installed to the ABC welding machine.
The coefficient of variation (CV) is a statistical measure of the dispersion of data points in a data series around the mean [88]. The coefficient of variation represents the ratio of the standard deviation to the mean [89]. When comparing data sets, the coefficient of variation is utilized. The CV is a useful statistical measure for comparing the degree of variation of one data series with another, even if the averages differ sharply from each other [89].
where —the sample mean; n—the sample size.
2.4. Welding Heat Indicate
Heat input (Qin) is the quantity of energy introduced from the arc per unit length of weld. The heat input was calculated by the means equation [11,90].
Qin—heat input, (kJ/mm); Ua—arc voltage, V; I—arc current, A; TS—travel speed, mm/min; H—coefficient of efficiency of the process; ηFCAW = 0.8 [90].
2.5. Investigation of Composition, Phase Composition, and Microstructure of Deposited Metal
The average chemical composition of the alloys was determined by the atomic absorption spectroscopy method using a Spectrolab LA VFC01A device. The alloys were examined by a Neophot light optical microscope. Quantitative metallography was carried out with an Epiquant structural analyzer. An X-ray diffraction analysis was conducted to identify the existing phases in the produced samples on a DRON-UM-1 X-ray diffractometer with a CuKα source. The phase transformations were investigated by means of a differential thermal analysis (DTA).
3. Results
3.1. Dynamic Characteristics
Figure 6 shows the dynamic characteristics of the welding voltage and current, which are shown with instantaneous values of current and voltage over a randomly chosen period of 0.5 s. The arc voltage and welding current fluctuate significantly, reflecting the poor stability of the hardfacing process.
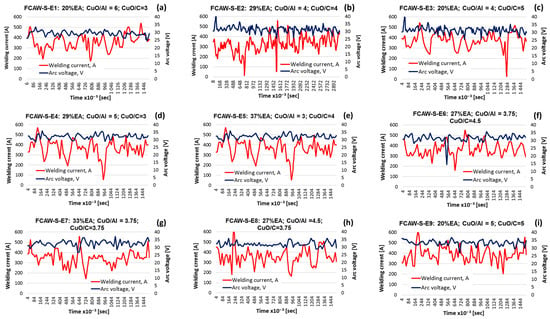
Figure 6.
Dynamic characteristics of voltage and current with varying composition of core filler: (a) FCAW-SS-E1; (b) FCAW-SS-E2; (c) FCAW-SS-E3; (d) FCAW-SS-E4; (e) FCAW-SS-E5; (f) FCAW-SS-E6; (g) FCAW-SS-E7; (h) FCAW-SS-E8; and (i) FCAW-SS-E9.
The average values of the average welding current (Iaw), as well as the corresponding values of the standard deviation of the welding current (Std(I)) and the coefficient of variation of the welding current (CV(I)), are shown in Table 4.
Table 4.
Welding current parameters during hardfacing with experimental flux-cored wires with different core filler compositions.
The average arc voltage (Uaw), the standard deviation of the arc voltage (Std(U)), and the arc voltage coefficient of variation (CV(U)) are shown in Table 5.
Table 5.
Arc voltage parameters during hardfacing with experimental flux-cored wires with different core filler compositions.
Observations and analyses of the change in the welding electrical signal indicated that the waveform of the arc voltage waveform had significant fluctuation even with the same welding parameters, which in turn influenced the process of arc burning in flux-cored arc welding.
An analysis of the average arc voltage values showed (Figure 7) that the minimum value was observed when hardfacing a flux-cored wire electrode with index FCAW-SS-E1, whereas the maximum value was observed when hardfacing with FCAW-SS-E9. These flux-cored wire electrodes had low exothermic additive content. At the same time, FCAW-SS-E1 was characterized by a high CuO/Al = 6 ratio (excess oxidant in exothermic addition) and a high CuO/C = 3 ratio (high proportion of carbon-containing component in the filler introduced as graphite).

Figure 7.
The effect of the composition of core filler on the average welding current and average arc voltage.
The lowest values of the average welding current could be observed for flux-cored wire with index FCAW-SS-E2 (Figure 7). A slightly higher value was observed for flux-cored wire with index FCAW-SS-E7. These filler materials were characterized by the average content of exothermic addition in the core filler (at EA = 28.5–33 wt.%) and the CuO/Al and CuO/C ratios (3.75–4). Whereas the highest values of average welding current were observed for flux-cored wire with index FCAW-SS-E9 and FCAW-SS-E3 (Figure 7). These filler materials were characterized by a low content of exothermic addition in the core filler (EA = 20 wt.%). It could be concluded that the amount of heat generated from the exothermic reaction was insufficient. Whereas for the parameter average arc voltage, the lowest values were observed for FCAW-SS-E2 and the highest for FCAW-SS-E9.
Filler materials were characterized by exothermic addition at a low level (EA = 20 wt.%), but the first flux-cored wire electrode was characterized by an excess of carbon containing material (low CuO/C = 3 ratio) and an excess of oxidants (high CuO/Al = 6 ratio). Whereas FCAW-SS-E9 was characterized by an average CuO/C = 4 ratio and a stoichiometric ratio of oxidizing agent and reducing agent of exothermic mixture CuO/Al = 5.
3.2. Arc Stability Analysis
The arc stability is accessed qualitatively using the probability distribution and current and voltage cyclograms, while the coefficients of variation of voltage and current can quantificationally evaluate arc stability [91]. Figure 8 shows the dependence of the coefficients of variation of arc voltage and welding current on different arc voltages. It is known that the smaller the coefficient of variation, the more stable the welding process and vice versa [91,92].

Figure 8.
The effect of the composition of core filler on (a,b) the coefficient of variation and the standard variation of the arc voltage and welding current, respectively.
Analyzing the results shown in Figure 8a, it can be concluded that the lowest values of coefficients of variation of the welding current were observed for the flux-cored wire electrodes with indexes FCAW-SS-6 and FCAW-SS-9. The CV(I) values were 16.7% and 16.8%, respectively (Figure 8a). Somewhat higher values of coefficients of variation of the welding current were observed in flux-cored wire electrodes with indexes FCAW-SS-E1, FCAW-SS-E7, and FCAW-SS-E3 with corresponding values in an ascending order of 18.2%, 18.5%, and 18.9% (Figure 8a). Whereas the highest values corresponded to filler materials with indexes FCAW-SS-E2 → FCAW-SS-E4. FCAW-SS-E5 → FCAW-SS-E8 in descending order of values of coefficients of variation of the welding current, respectively: 23.3% → 21.7% → 21%. It should be noted that the highest values corresponded to flux-cored wire electrodes with an average content of exothermic additive at the level EA = 26.5–28.58 wt.% (x3 = 0.25–0.33) and a high carbon content (low values of CuO/C = 33.75). Similarly, observations could be made regarding the standard variation of the welding current at the FCAW-SS location.
As for the arrangement (Figure 8a,b) of experimental self-shielded, flux-cored wire electrodes for coefficients of variation of the arc voltage CV(U) and the standard variation of arc voltage Std(U), the character of influence of the variable was different. The lowest values of the CV(U) in the order of their value (Figure 8a) increasing had FCAW-SS with indices FCAW-SS-E4, FCAW-SS-E5, FCAW-SS-E8, FCAW-SS-E9, and FCAW-SS-E1. They corresponded to the following values of coefficients of variation of arc voltage: 4.3% → 4.4% → 4.5% → 4.7%. Whereas the highest values of the CV(U) corresponded to flux-cored wire electrodes with indexes FCAW-SS-E6. FCAW-SS-E2, and FCAW-SS-E3, with corresponding values of 6.8%, 5.7%, and 5.7%. The matrix plan analysis showed that the lowest values of CV(U) and Std(U) were characterized by hardfacing processes with a high CuO/Al ratio ≥ 4.5 (x2 ≥ 0.5) and a content of exothermic mixture in the core filler (EA) below the average EA < 29 wt.% (x3 < 0.33). Whereas high values of coefficients of variation of the arc voltage and the standard variation of arc voltage were characterized by a hardfacing process carried out by self-shielded, flux-cored wire electrodes with a low ratio of oxidizing agent to reducing agent in the composition of the exothermic mixture CuO/Al = 3.75–4 (x2 = 0.25–0.33) and a low content of exothermic mixture in the core filler EA < 29 wt.% (x3 < 0.33).
Box plots (Figure 9a and Figure 10a) were constructed to compare each process, and frequency histograms for each process were separately generated (Figure 9b–j and Figure 10b–j) to better understand the distribution of welding current and arc voltage data. Box plots work best when a comparison in distributions needs to be performed between groups. For each flux-cored wire electrode, a box plot was made showing the difference between the minimum and maximum values with a dotted line. The colored box (rectangle) describes the values of the 25 and 75% quantiles, and the line inside the box shows the average value. Lines extend from each box to capture the range of the remaining data, with dots placed past the line edges to indicate outliers. This allowed us to compare the stability results of the current and arc voltage by medians through the box and whisker markings’ positions. Displacement of the median from the middle indicated the asymmetry of the data. Vice versa, the closer the median was to the middle of the rectangle, the more symmetrical the data. The obtained box plots for the welding current are shown in Figure 9.
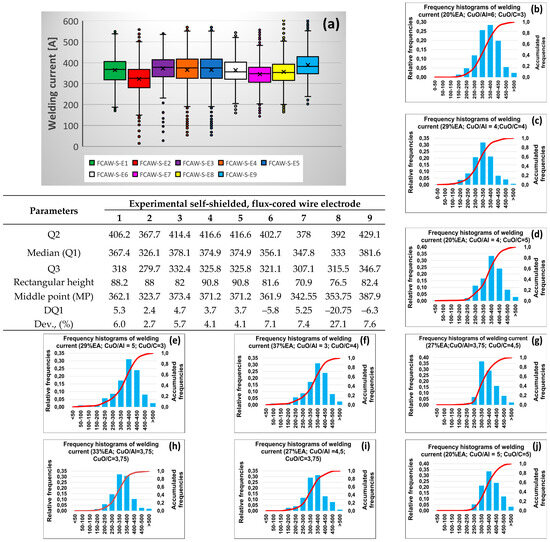
Figure 9.
Box plots for the medians, quartiles, and scatter of the (a) welding current depending on the composition of the core filler of flux-cored wire electrodes and histograms (b–j) of the welding current distribution for all FCAW-S, where DQ1 = Q1–MP—difference of the median (Q1) from the midpoint (MP).
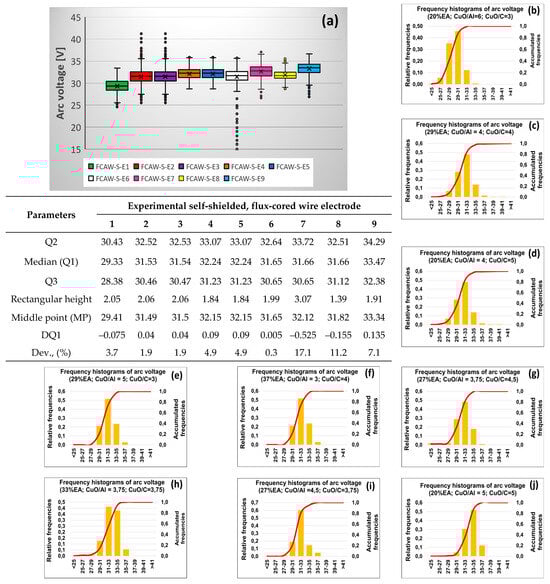
Figure 10.
Box plots for the medians, quartiles, and scatter of the (a) arc voltage depending on the composition of the core filler of flux-cored wire electrodes and histograms (b–j) of the arc voltage distribution for all FCAW-SS, where DQ1 = Q1–MP—difference of the median (Q1) from the midpoint (MP).
The analysis of data for the welding current showed that the best symmetry was in the welding current values for processes hardfaced with flux-cored wire electrodes with indices FCAW-SS-E2 and FCAW-SS-E7 (Figure 9a). The analysis of frequency histograms (Figure 9c) and (Figure 9h) confirmed the uniformity of distribution of welding current values for these filler materials. The diagrams had an almost symmetrical appearance. Whereas a clear asymmetry of the welding current data was shown by processes using FCAW-SS labeled FCAW-SS-E9, less than FCAW-SS-E1 (Figure 9a) which was shown by their frequency histograms (Figure 9b,j). At the same time, their data shift towards higher values was noticeable. This was confirmed by the values of the average welding current for the hardfacing process. The analysis of filler compositions showed that symmetric frequency histograms corresponded to filler materials with an average content of exothermic addition (EA = 29–33 wt.%) to the core filler and average CuO/Al = 3.75–4 and CuO/C = 3.75–4 ratios. Whereas asymmetric frequency histograms corresponded to flux-cored wire electrodes with high values of the CuO/Al ratio ≥ 5 and exothermic additive content at the lower level EA = 20 wt.%.
Figure 10 shows the summary box plots and frequency histograms for arc voltage. The character of distribution of the arc voltage values was somewhat different from the welding current. According to Figure 10a, the smallest size of the quantile rectangle (colored field) was observed for FCAW-SS with indices FCAW-SS-E4 and FCAW-SS-E5, whereas the largest size was observed for the hardfacing process using FCAW-SS-E7. It is noteworthy that the most symmetrical arrangement of the median was observed for the hardfacing process performed by FCAW-SS-E6, FCAW-SS-E2, and FCAW-SS-E3. Whereas an asymmetric location of the median in the quantile rectangle was observed with FCAW-SS-E7 and FCAW-SS-E8, which was confirmed by the corresponding frequency histograms shown in Figure 10h,j.
The analysis of the core filler composition showed that the first group (with symmetrical median arrangement) differed from the second group in the CuO/C ratio.
Based on the above data, it can be stated that more stable values of the arc voltage were observed for flux-cored wire electrodes in which the ratio of the exothermic mixture oxidizing agent to graphite content was CuO/C = 4–5.
3.3. Current and Voltage Cyclograms
To describe the nature of the arc burning, its stability, as well as identifying characteristic zones during arc burning (AEA—arc extinction area; SCA—short-circuiting area; ABA—arc burning area), the use of current and voltage cyclograms has become widespread [86,91,93]. Current and voltage cyclograms show welding voltage as a function of the welding current. The cyclograms shown are also scatter density plots that show the number of dots in an area. The greater their number, the lighter the dots, gradually moving from purple for areas with the lowest density of dots to yellow with the maximum density of dots. Figure 11 displays current and voltage cyclograms for the conducted hardfacing processes.

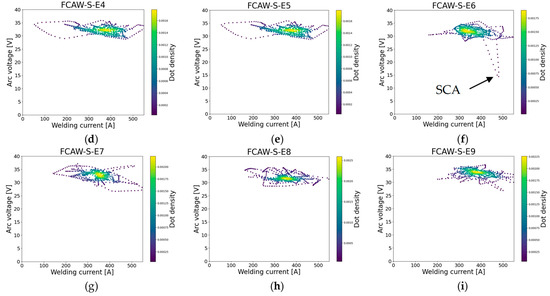
Figure 11.
Current and voltage cyclograms (scatter density plot) with varying compositions of core filler: (a) FCAW-SS-E1; (b) FCAW-SS-E2; (c) FCAW-SS-E3; (d) FCAW-SS-E4; (e) FCAW-SS-E5; (f) FCAW-SS-E6; (g) FCAW-SS-E7; (h) FCAW-SS-E8; and (i) FCAW-SS-E9, where AEA—arc extinetion area; SCA—short-circuiting area.
The analysis of the obtained current and voltage cyclograms showed that the hardfacing process for the flux-cored wire with indexes FCAW-SS-E2 and FCAW-SS-E3 had an arc extinction area (AEA) (see Figure 11b,c). In the cyclogram (Figure 11f) for the flux-cored wire electrode with index FCAW-SS-E6, a short-circuiting SCA was observed. The analysis of the core filler compositions of FCAW—SS showed that the first ones (in which arc extinction was observed) were characterized by close to average values of CuO/Al = 4 and CuO/C = 4–5 ratios. Whereas the hardfacing process in which short-circuiting of the arc was observed was carried out with filler materials in which CuO/Al = 3.75 and CuO/C = 4.5, i.e., with an excess of aluminum in the core filler and a lack of graphite.
3.4. Prediction of Mathematic Model of Welding Current and Arc Voltage Characteristics
For practical application, the use of mathematical models to predict the required dependent parameters of the hardfacing/welding process is of great importance. A mathematical model has been developed using the ANOVA technique and Response Surface Methodology (RSM). Results were used in the production of linear, quadratic special cubic and fully cubic regression models where the analysis of residue graphs and errors were generated to verify the quality of the models. The final choice of the mathematical model was made based on the values of the sum squared (SS) and the adjusted mean (MS). The higher their values, the more reliably the mathematical model describes the parameter under study [94]. Table 6 presents the regression coefficients for each response.
Table 6.
An analysis of variance for the applied models.
The statistical characteristics of the obtained mathematical models indicate their reliability and adequacy. To assess the adequacy of the developed mathematical models, Fisher’s criterion (F) was used. The significance of the obtained data was determined using Student’s criterion (p). The developed mathematical models are considered adequate if the actual value of the Fisher’s criterion exceeds the threshold table value Fact > 3 [64]. Therefore, the data obtained from the developed mathematical model is considered significant in the case that Student’s criterion is p > 0.05. The analysis of variance for the applied models showed (Table 6) that the developed models meet the above requirements, except for the mathematical model for the CV(I). All regression models (12)–(17) as mathematical functions have multivariate functions with bounded indexes in any direction [95] and bounded indexes in joint variables [96], and their indexes equal the corresponding maximum degree. The regression model of the fill coefficient has the following form:
The evaluation of the accuracy of the prediction models and their values, predicted by these models, compared to the actual values is shown in Figure 12. These graphs represent an approximately linear trend. This indicates that the residuals follow a normal distribution and there is no significant correlation between them. The proximity of the data points to the y = x line also indicates that there is minimal divergence. This allows you to make accurate predictions based on new and unknown data. The strong relationship between the predicted and actual values of the model indicates that it accurately captures the patterns and relationships in the data [79,97].
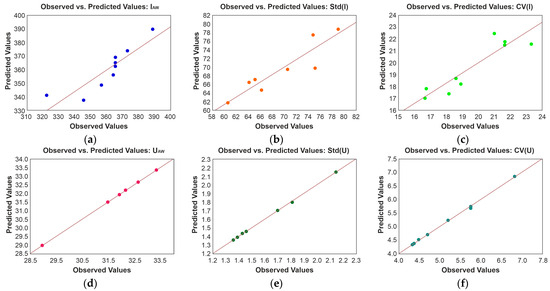
Figure 12.
Diagram of predicted values versus actual values for (a) mean welding current, (b) coefficients of variation, (c) standard variation of welding current, (d) mean arcvoltage, (e) coefficients of variation, and (f) standard variation of arc voltage.
The graphs show that the developed models for the parameters characterizing the arc voltage (Uaw, Std(U), and the CV(U)) have good prediction capabilities. This is indicated by the location of the points predicted by the developed model, which are practically located on a sloping straight line near the actual values. In this case, the model works well, and the errors are random. Whereas the location of the predicted points determined by using the developed mathematical models for the welding current parameters (Iaw, Std(I), and CV(I)) are located away from the inclined straight red line. This indicates the scatter of predicted values and the limitations of the developed models.
Pareto diagrams were constructed (Figure 13) to better identify the influence of each variable in the resulting mathematical model.
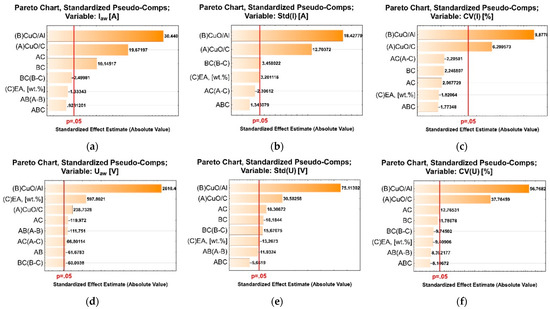
Figure 13.
Pareto diagrams of effect of core filler composition on (a) mean welding current, (b) coefficients of variation, (c) standard variation of welding current, (d) meanarc voltage, (e) standard variation, and (f) coefficients of variation of arc voltage.
The red line defines the threshold value, exceeding which indicates the importance of the effect for the optimization parameter. The analysis of the obtained Pareto diagrams (Figure 13) for the welding current indicators showed that the ratio of oxidizing agent to reducing agent in the composition of exothermic mixture (CuO/Al) and the ratio of graphite to oxidizing agent of exothermic mixture (CuO/C) had the greatest influence for all indicators (Iaw. Std(I) and CV(I)). Whereas the percentage of exothermic mixture in the core filler (EA), which is CuO + Al, had a significant influence only on the average welding current (Iaw). Whereas the CuO/Al and CuO/C ratios had a significant influence on the process stability characterized by the indicators of standard deviation of the welding current (Std(I)) and the coefficient of variation of the welding current (CV(I)). The analysis of the Pareto diagram for the arc voltage parameters showed a similar influence of the studied variables. It should be noted that the influence of such variables as the ratio of oxidizing agent to reducing agent in the composition of exothermic mixture (CuO/Al) is more pronounced and significant. A significant influence on the parameter coefficient of variation of arc voltage (CV(U)) was from the ratio of graphite to oxidizing agent of exothermic mixture (CuO/C). Considering the influence of the studied equation effects on the average arc voltage (Uaw), the high influence of the effect of the percentage of exothermic mixture (EA) and the low influence of the effect of the ratio CuO/C can be noted.
To visualize the relationships between the three variables and the output responses, and to determine the optimal values of the response parameters, contour graphs and 3D response surfaces are utilized. Figure 14 shows the 2D and 3D response representations of the optimized factors that lead to the efficiency of the average welding current (Iaw), the standard deviation of the welding current (Std(I)), and the coefficient of variation of the welding current (CV(I)).
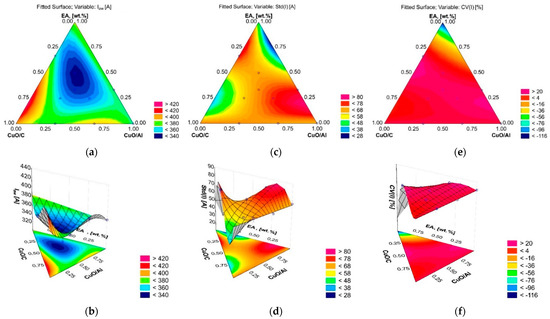
Figure 14.
Response surface plot (3D) and contour plot (2D) showing the effects of variables on mean welding current (a) 2D and (b) 3D; standard variation of welding current (c) 2D and (d) 3D; and coefficients of variation of welding current (e) 2D and (f) 3D.
A response surface plot (3D) and a contour plot (2D) were also constructed for indicators characterizing the arc voltage, shown as follows: average arc voltage Uaw, the standard deviation of arc voltage Std(U), and the coefficient of variation of arc voltage CV(U) (Figure 15).

Figure 15.
Response surface plot (3D) and contour plot (2D) showing the effects of variables on mean arc voltage (a) 2D and (b) 3D; standard variation of arc voltage (c) 2D and (d) 3D; and coefficients of variation of arc voltage (e) 2D and (f) 3D.
Once the stationary point has been identified using a contour plot, it is important to characterize the response surface near the point to determine if it is a maximum, minimum, or saddle point. This information is useful for further optimizing the process and achieving the desired output response. For optimizing the core filler composition, the methodology described in [64] was utilized. This methodology enables the optimization of a research problem when there are many initial parameters to optimize. This technique allows us to determine the optimal values of the variables by overlaying the optimal areas of different initial parameters on one graph. Then, the intersection of these optimal areas is determined. If there is no intersection, then it is necessary to expand the threshold value for one of the selected dependent parameters to achieve this intersection. In our case, two welding parameters were selected for optimization: the mean welding current Iaw and the standard deviation of arc voltage Std(U).
The first parameter was chosen because it can best characterize the probability of an exothermic reaction occurring before the arc, increasing the electrical resistance in the electrode extension area and improving the melting uniformity of the flux-cored wire electrode (the lag of melting of the core filler from the melting of the metal sheath [64]). The lower the observed mean welding current value, the greater the heat generated in the core filler from the exothermic reaction. The parameter of the standard deviation of arc voltages chosen to optimize the composition of the core filler because it can most informatively characterize the stability of the flux-cored arc welding process [86,87,98]. Based on experience and in accordance with the above methodology, the following threshold values were selected for optimization: Iaw ≤ 350 A and Std(U) ≤ 2 V.
Based on the obtained surfaces results (Figure 16), it can be seen that the optimum area with a maximum value observed is as follows: x1 = 0.17–0.42 (CuO/C = 3.5–4.26), x2 = 0.18–0.31 (CuO/Al = 3.6–3.9), x3 = 0.35–0.7 (EA = 29–38 wt.%).
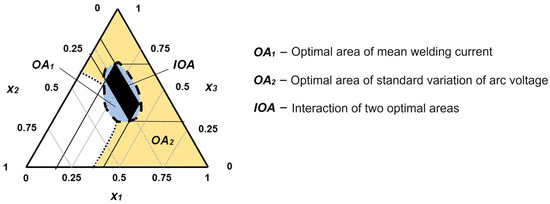
Figure 16.
Interpretation diagram of optimal value areas.
3.5. Prediction of Mathematic Model of Heat Input
To better understand the cooling conditions, heat input indicators were calculated for each experiment (Table 7). The values were calculated according to Equation (11).
Table 7.
Heat input (Qin) during hardfacing with experimental flux-cored wires with different core filler compositions.
A mathematical model was constructed (Equation (18)). The mathematical model exhibits good accuracy (Rsqr = 0.7345), adequacy (Fisher’s criterion Fact = 3.766 > 3), and significance (Student’s criterion p = 0.03740 > 0.05). The equation of the obtained regression model for heat input is provided in Equation (18):
An analysis of the obtained mathematical model (18) showed that the linear terms of the equation (x1, x2, x3) and their pairwise interactions increase the overall Qin. A comparison of experimental values and predicted values showed good convergence, confirming the accuracy of the developed mathematical model for the heat input parameter.
Figure 17 presents a Pareto Chart, observed and predicted values, as well as a response surface and contour plot. An analysis of the Pareto diagram (Figure 17a) revealed that the two linear factors exert the greatest influence on Qin, namely the oxidizer-to-reducer ratio (CuO/Al) and the amount of introduced exothermic addition (CuO/C) in the core filler. Experimental values and values predicted using the developed mathematical model (Equation (18)) showed good convergence, as evidenced by the proximity of points to the inclined line (Figure 17b). The 3D surface response plot (Figure 17c) and 2D contour plot (Figure 17d) of the obtained mathematical model demonstrate the complex interaction of components in the powder wire blend.
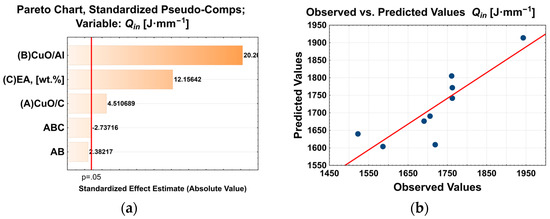

Figure 17.
(a) Pareto chart, (b) plot of observed and predicted values, (c) response surface, and (d) contour surface graphs for heat input Qin.
3.6. Microstructure Study
For structural investigations, two samples were selected based on the parameters with the highest and lowest values of the standard variation of the arc voltage Std(U), which best assesses arc stability. These parameters (Table 5) correspond to samples of deposited metal applied by self-shielded, flux-cored wire electrodes indicated as FCAW-SS-E5 and FCAW-SS-E6. In this case, FCAW-SS-E5 contained EA = 37.42 wt%, while FCAW-SS-E6 contained EA = 26.5 wt%.
The chemical composition and mechanical properties were measured for the selected weld beads. Cross-sections of the weld beads, which were hardfaced by FCAW-SS-E5 and FCAW-SS-E6, are shown in Figure 18. Chemical composition of simple selected deposited metal is shown in Table 8.
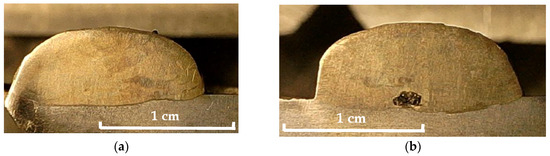
Figure 18.
Macrographic images of weld bead hardfacing using (a) FCAW-SS-E5; (b) FCAW-SS-E6.
Table 8.
Chemical composition of simple selected deposited metal.
For a better understanding of the influence of the core filler composition, we decided to conduct a study and compare our experimental results with thermodynamic calculations performed using the JMatPro® API v7.0 software for the phase composition of the deposited metal [99,100]. Phase diagrams (Figure 5) and the phase composition of the deposited metal were constructed for the selected samples depending on the welding cycle and according to the obtained characteristics of the welding modes.
Figure 19a shows that the deposited metal produced using FCAW-SS-E5 exhibited an expansion of the austenitic zone and a decrease in temperature during the onset and completion of martensitic transformation compared to the sample produced using FCAW-SS-E6 (Figure 19b). The latter can be explained by differences in chemical composition, due to a higher content of carbon and copper in the FCAW-SS-E5 deposited sample. Such differences would lead to a change in the phase composition of the matrix, resulting in a decrease in the proportion of the ferritic phase in the deposited metal and an increase in the pearlitic phase (Figure 20). Structural-phase investigations were conducted to confirm the modeled phase composition of the obtained samples. The microstructure of the deposited metal is depicted in Figure 21, while the phase composition as shown in the XRD pattern is presented in Figure 22.
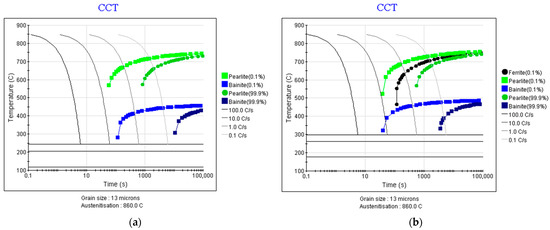
Figure 19.
CCT diagram for deposited metals of hardfacing using (a) FCAW-SS-E5; (b) FCAW-SS-E6.
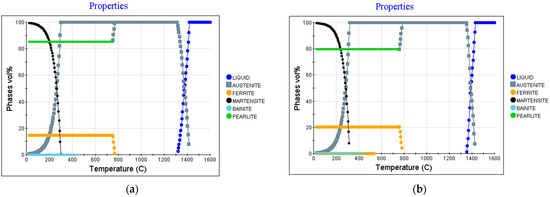
Figure 20.
The phase composition of the deposited metals during the welding cycle (rate of heating RH = 1000 °C/s, cooling rate CR = 45 °C/s, graine size 13 μm) during hardfacing with a self-shielded, flux-cored wire electrode with indexes (a) FCAW-SS-E5; (b) FCAW-SS-E6.
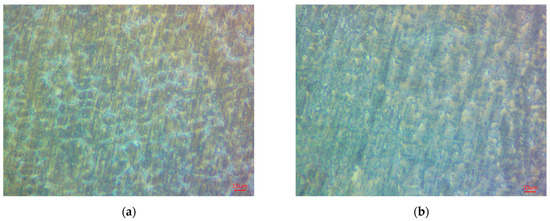
Figure 21.
Microstructure of specimens of hardfacing using (a) FCAW-SS-E5; (b) FCAW-SS-E6.

Figure 22.
XRD pattern of specimens of hardfacing using (a) FCAW-SS-E5; (b) FCAW-SS-E6.
The microstructure of the sample deposited with a flux-cored wire electrode indexed as FCAW-SS-E5 consists of a ferrito-perlitic mixture with carbide eutectics (Figure 22a). The eutectic is located at the boundaries of dendrites in the form of a mesh (Figure 21a). The eutectic represents a solid solution based on ferrite and chromium carbides Cr23C6. The presence of eutectics increases the hardness of the deposited metal but also leads to a decrease in ductility (increased susceptibility to brittle fracture). Figure 21b and Figure 22b show that the structure of the sample made with FCAW-SS-E6 consists of a ferrito-perlitic mixture with isolated chromium carbides (Cr23C6). That is, a ferritic base with uniformly distributed carbides. This structure possesses lower hardness.
4. Discussion
Our research has shown that the introduction of exothermic additive components into the core filler will have a significant impact on the stability of the flux-cored arc welding process. In this case, attention should be paid to the significant influence of variables including the ratio of oxidizing agent to reducing agent in the composition of the exothermic mixture (CuO/Al) on the studied parameters characterizing the welding current and arc voltage (Figure 13). Also, the ratio of graphite to oxidizing agent in the exothermic mixture (CuO/C) will have a significant influence, except for the influence on average arc voltage (Uaw). The value of the Uaw is more influenced by exothermic addition. The explanation of the influence of variables on the investigated parameters of the welding current and arc voltage will be considered separately.
The high influence of CuO/Al and CuO/C ratios on the average welding current (Iaw) can be explained by the change in power consumption transferred from the power supply at the contact-tip-to-work distance. The constant section from the contact tip to the substrate materials, referred to as contact-tip-to-work distance, can be considered as a parallel-connected chain of individual sections of the electrode extension—arc column, which dynamically changes due to mutual compensation. Increasing the length of the electrode extension section leads to heating of the flux-cored wire electrode in front of the tip, due to Joule heat [101,102]. The presence of an additional heat source (exothermic reaction) introduces changes into the energy distribution. Depending on the welding parameters, the exothermic reaction can take place both in the electrode extension section and in the arc column. In the first case, the introduction of exothermic addition will lead to the melting of the core filler and the heating of the metal sheath. The latter will lead to an increase in the electrical resistance of the sheath and a drop in the average welding current (Iaw). However, the presence of carbon-containing components in the core filler in the form of graphite leads to the possibility of cupric oxide (CuO) reduction due to a carbothermal reaction: 2CuO + C→2Cu + CO2 [84]. This reaction is characterized by a significantly lower thermal effect (QCuO+C = 16.49 kJ/mol O2 against QCuO+Al = 798.87 kJ/mol O2 [64]) compared to the thermal effect of the exothermic reaction from the additive: 2CuO + 4/3Al → 2/3Al2O3 + 2Cu. In the case of an exothermic reaction in the arc column, the arc temperature will increase [65,103] by changing the electrical characteristics of the arc, which leads to an increase in the average welding current [72].
The significant influence of the CuO/Al ratio on the arc voltage parameters can also be explained by its influence on the elemental composition of the welding arc, i.e., which compounds will enter the arc column. When using exothermic addition in the core filler, we can assume three different variants in the behavior of their components: (1) an ingress in the form of cupric oxide (CuO) and pure aluminum (Al) in the case that the exothermic reaction has not started; (2) fully reduced copper (Cu) and aluminum oxide; and (3) a combination of elements (1) and (2) in case of an incomplete exothermic reaction. The second case (2) can be explained by the insufficient level of heating of the filler to the temperature of the exothermic reaction [77]. When metal vapor enters the arc column, the distribution of the current density and the energy transmitted to the workpiece changes [104,105]. The vapor additives cause the changes, and in turn, affect the energy transport as well as temperature and velocity distributions in the arc column [106,107]. Thus, research by Jia et al. [108] has shown that during the FCAW-SS process in the arc column, it is possible to detect in addition to the compounds providing gas protection (mainly CO and CO2 as well as F2 and F) and gases inevitably coming from the surrounding atmosphere (O2, H, N, and N2), also ions or molecules of most of the core filler components such as Mg, Si, K, Ca, Ti, Cr, Mn, Fe, and Ni. Their fraction in the arc column will depend primarily on the thermal stability of their compounds, as well as on the amount of the introduced component in the core filler and the fraction of the introduced component. Better arc stability could be obtained by adding low-ionizable components [109]. The more complete this reaction is, the greater the amount of easily evaporated copper (Cu) in the arc plasma will be. For content with a large amount of graphite (which will correspond to low values of CuO/C ratio), as well as lack of aluminum powder (high CuO/Al ratio), it becomes more thermodynamically probable that a less calorific carbothermic reaction of cupric oxide reduction at the expense of graphite will take place. In this case, the aluminum that has not entered into an exothermic reaction will be partially spent on the deoxidation of the weld pool, but mainly deposited metal will be absorbed. However, it can also enter the arc plasma in the form of vapor, changing its characteristics. Thus, the ingress of vapor containing copper or aluminum will explain the change in arc stability. The studies of Li et al. [72] showed similar results of the effect of adding Al + Fe2O3 powder of low ionization voltage into coating, which caused the arc voltage to be decreased at a given arc length with increasing thermite levels. In addition, the presence of Al + Fe2O3 powder had low ionization, thereby improving the arc stability. Research by Zhang et al. [107] also reported a reduction in the welding voltage and an increased welding current when introducing Fe2O3 into filler materials. This explains that the decomposition and evaporation of the filler materials produced oxygen, which led to a narrowing of the arc [107].
Many authors point out the positive effects of different contents of copper vapor on the arc morphology, arc voltage, arc pressure, current density, and arc axial temperature [105,106,110]. In this case. due to the relatively low boiling temperature of copper (Tboil.(Cu) = 2860 K) [64], copper vapors can fall into the arc zone in large quantities. Thermodynamic calculations performed by Guo et al. [110] showed the significant influence of copper vapor on arc plasma parameters at Cu mole fractions above a 10% start [111]. The influence of copper vapor has been explained by the fact that the current tends to flow through the edge of the electrode, which expands the conductive path and makes the arc disperse [105]. The content of copper vapor arc voltage gradually increased (1.5 V) [105]. This is consistent with the data we obtained, in which with the increase in the amount of introduced exothermic addition (EA wt.%), an increase in the average arc voltage (Uaw) is observed. Mostaghimi-Tehrani and Pfender [106] associate this with the significant contribution of electrons obtained from copper vapor to the electrical conductivity of the arc in a temperature range of 6000 K to 10,000 K.
Also, the influence of exothermic addition components on the surface tension of droplets when transferring filler materials from the electrode to the substrate should be taken into account. The authors of the paper point to a decrease in droplet size due to a decrease in the surface tension of the molten droplet [72].
The characteristics of the arc and plasma composition [112] will affect weld bead morphology [61,113], cooling conditions [114], as well as the thermo-stressed state [115,116,117], its microstructure [118], mechanical properties [119,120,121,122,123,124,125], and operational properties [126,127,128,129,130].
Future research plans to investigate the influence of changing the composition of the core filler with an exothermic addition on weld bead morphology and mechanical properties.
5. Conclusions
At present, there is great experience in analyzing and using parameters for research and comparison of arc burning stability in the fusion arc welding process. As parameters characterizing arc stability, both graphical (current and voltage cyclograms, box plots with frequency histograms) and statistical parameters such as standard variation and coefficients of variation for welding current and arc voltage have been used. In this paper, an experimental study of the influence of the introduction of exothermic addition (CuO-Al) into the core filler of a self-shielded, flux-cored wire electrode on the average of the welding current and arc voltage as well as arc stability, was carried out, with conclusions as follows:
- It has been determined that the introduction of exothermic addition components into the core filler will have a significant effect on the stability of the flux-cored arc welding process. This can be attributed to changes in the chemical composition of the arc column, resulting from enrichment, depending on the composition of the core filler, with easily ionizable elements or compounds (such as Cu) or with less readily ionizable compounds (such as Al2O3);
- The results of research have shown that the greatest influence on the parameters characterizing the welding current and arc voltage was exerted by the parameter of the ratio of oxidizing agent to reducing agent in the composition of exothermic mixture (CuO-Al), which had a significant influence on the completeness of the exothermic reaction in the core filler. To a lesser extent the ratio of exothermic mixture oxidizing agent to graphite content CuO/C had an influence, except for the parameter of average arc voltage;
- The lowest values of coefficients of variation of the arc voltage CV(U) and standard variation of the arc voltage Std(U) are characterized by a hardfacing process with a high ratio of CuO/Al ≥ 4.5 (x2 ≥ 0.5) and the content of exothermic mixture in the core filler (EA) being below average EA = 26–29 wt.% (x3 < 0.33).
- The investigation of microstructures revealed that weld beads deposited by self-shielded, flux-cored wire electrodes with a high content of exothermic additive (EA = 38 wt.%) and moderate graphite content (CuO/C = 4) exhibited higher hardness and are preferable for the reinforcement of surfaces subjected to abrasive wear in combination with metal-to-metal friction. Additionally, they showed high arc stability.
Author Contributions
Conceptualization, B.T.; methodology, B.T., S.K., H.K. and L.R.; software, S.K., M.K. and O.K.; validation, V.L. and B.T.; formal analysis, E.K., O.B. and K.S.; investigation, B.T.; resources, B.T.; data curation, B.T.; writing—original draft preparation, V.L., B.T. and L.R.; writing—review and editing, V.L., B.T. and O.R.; visualization, H.K. and I.K.; supervision, V.L.; project administration, B.T. and V.L.; funding acquisition, B.T. All authors have read and agreed to the published version of the manuscript.
Funding
This study was carried out as part of the project “Belt and Road Initiative Centre for Chinese-European studies (BRICES)” and was funded by the Guangdong University of Petrochemical Technology. This research was funded by the Ministry of Education and Science of Ukraine for the grant to implement projects 0123U101858 and 0124U000668.
Data Availability Statement
The data are contained within this article.
Acknowledgments
The authors express their sincere gratitude and respect to the Armed Forces of Ukraine, who made it possible to complete the preparation of this article for publication. The authors are also grateful to the editor and reviewers for their comments that helped improve the content of this paper.
Conflicts of Interest
The authors declare no conflicts of interest.
References
- Kotov, M.A.; Konoplianyk, O.Y.; Volchuk, V.M.; Plakhtii, Y.G.; Plakhtii, A.O. Light Structurally Thermal Insulating Concrete with a Wide Range of Applications from Recycled Waste Polypropylene Container. Adv. Transdiscipl. Eng. 2023, 43, 515–521. [Google Scholar] [CrossRef]
- Bausk, E.A.; Volchuk, V.M.; Uzlov, O.V. Remaining Service Life Evaluation of Nuclear Power Plants Construction Steel Elements. J. Phys. Conf. Ser. 2021, 1926, 012050. [Google Scholar] [CrossRef]
- Bondarenko, I.; Keršys, R.; Neduzha, L. Studying of Dynamic Parameters Impulse Impact of the Vehicle Taking into Account the Track Stiffness Variations. In Proceedings of the Transport Means 2021: Proceedings of the 25th International Conference, Kaunas, Lithuania, 6–8 October 2021; pp. 684–689. [Google Scholar]
- Ulbrich, D.; Kowalczyk, J.; Jósko, M.; Sawczuk, W.; Chudyk, P. Assessment of Selected Properties of Varnish Coating of Motor Vehicles. Coatings 2021, 11, 1320. [Google Scholar] [CrossRef]
- Bondarenko, I.; Severino, A.; Olayode, I.O.; Campisi, T.; Neduzha, L. Dynamic Sustainable Processes Simulation to Study Transport Object Efficiency. Infrastructures 2022, 7, 124. [Google Scholar] [CrossRef]
- Viňáš, J.; Brezinová, J.; Sailer, H.; Brezina, J.; Sahul, M.; Maruschak, P.; Prentkovskis, O. Properties Evaluation of the Welded Joints Made by Disk Laser. Materials 2021, 14, 2002. [Google Scholar] [CrossRef]
- Kalivoda, J.; Neduzha, L. Running Dynamics of Rail Vehicles. Energies 2022, 15, 5843. [Google Scholar] [CrossRef]
- Hlushkova, D.B.; Bagrov, V.A.; Saenko, V.A.; Volchuk, V.M.; Kalinin, A.V.; Kalinina, N.E. Study of wear of the building-up zone of martensite-austenitite-austenitic and secondary hardening steels of the Cr–Mn–Ti system. Probl. At. Sci. Technol. 2023, 2, 105–109. [Google Scholar] [CrossRef]
- Selech, J.; Majchrzycki, W.; Ulbrich, D. Field and Laboratory Wear Tests of Machine Components Used for Renovation of Dirt Roads—A Case Study. Materials 2023, 16, 6180. [Google Scholar] [CrossRef]
- Romek, D.; Ulbrich, D.; Selech, J.; Kowalczyk, J.; Wlad, R. Assessment of Padding Elements Wear of Belt Conveyors Working in Combination of Rubber–Quartz–Metal Condition. Materials 2021, 14, 4323. [Google Scholar] [CrossRef] [PubMed]
- Bondarenko, I.; Campisi, T.; Tesoriere, G.; Neduzha, L. Using Detailing Concept to Assess Railway Functional Safety. Sustainability 2023, 15, 18. [Google Scholar] [CrossRef]
- Dubei, O.Y.; Tutko, T.F.; Ropyak Lya Shovkoplias, M.V. Development of Analytical Model of Threaded Connection of Tubular Parts of Chrome-Plated Metal Structures. Metallofiz. Noveishie Tekhnologii 2022, 44, 251–272. [Google Scholar] [CrossRef]
- Pokhmurskii, V.I.; Zin, I.M.; Bily, L.M.; Vynar, V.A.; Zin, Y.I. Aluminium alloy corrosion inhibition by chromate-free composition of zinc phosphate and ion-exchanged zeolite. Surf. Interface Anal. 2013, 45, 1474–1478. [Google Scholar] [CrossRef]
- Volkov, O.; Knyazev, S.; Vasilchenko, A.; Doronin, E. Alternative Strengthening of Jewelry Tools Using Chemical-Thermal and Local Surface Treatments. Mater. Sci. Forum 2021, 1038, 68–76. [Google Scholar] [CrossRef]
- Shatskyi, I.; Makoviichuk, M.; Ropyak, L.; Velychkovych, A. Analytical Model of Deformation of a Functionally Graded Ceramic Coating under Local Load. Ceramics 2023, 6, 1879–1893. [Google Scholar] [CrossRef]
- Shatskyi, I.P.; Makoviichuk, M.V.; Ropyak, L.Y. Equilibrium of Laminated Cu/Ni/Cr Coating Under Local Load. Nanosistemi Nanomater. Nanotehnologii 2023, 21, 379–389. [Google Scholar] [CrossRef]
- Bembenek, M.; Makoviichuk, M.; Shatskyi, I.; Ropyak, L.; Pritula, I.; Gryn, L.; Belyakovskyi, V. Optical and Mechanical Properties of Layered Infrared Interference Filters. Sensors 2022, 22, 8105. [Google Scholar] [CrossRef]
- Martsynkovskyy, V.; Tarelnyk, V.; Konoplianchenko, I.; Gaponova, O.; Dumanchuk, M. Technology support for protecting contacting surfaces of half-coupling—Shaft press joints against fretting wear. In Design, Simulation, Manufacturing: The Innovation Exchange; Springer International Publishing: Cham, Switzerland, 2020; pp. 216–225. [Google Scholar] [CrossRef]
- Gaponova, O.P.; Antoszewski, B.; Tarelnyk, V.B.; Kurp, P.; Myslyvchenko, O.M.; Tarelnyk, N.V. Analysis of the Quality of Sulfomolybdenum Coatings Obtained by Electrospark Alloying Methods. Materials 2021, 14, 6332. [Google Scholar] [CrossRef]
- Tarelnyk, V.B.; Gaponova, O.P.; Konoplianchenko, I.e.V.; Tarelnyk, N.V.; Dumanchuk, M.Y.; Pirogov, V.O.; Voloshko, T.P.; Hlushkova, D.B. Development the Directed Choice System of the Most Efficient Technology for Improving the Sliding Bearings Babbitt Covers Quality. Pt. 2. Mathematical Model of Babbitt Coatings Wear. Criteria for Choosing the Babbitt Coating Formation Technology. Metallofiz. Noveishie Tekhnol. 2022, 44, 1643–1659. [Google Scholar] [CrossRef]
- Umanskyi, O.P.; Storozhenko, M.S.; Tarelnyk, V.B.; Koval, O.Y.; Gubin, Y.V.; Tarelnyk, N.V.; Kurinna, T.V. Electrospark Deposition of Fenicrbsic–Meb2 Coatings on Steel. Powder Metall. Met. Ceram. 2020, 59, 57–67. [Google Scholar] [CrossRef]
- Kotsyubynsky, V.; Shyyko, L.; Shihab, T.; Prysyazhnyuk, P.; Aulin, V.; Boichuk, V. Multilayered MoS2/C nanospheres as high performance additives to lubricating oils. Mater. Today Proc. 2019, 35, 538–541. [Google Scholar] [CrossRef]
- Student, M.; Gvozdetsky, V.; Student, O.; Prentkovskis, O.; Maruschak, P.; Olenyuk, O.; Titova, L. The Effect of Increasing the Air Flow Pressure on the Properties of Coatings during the Arc Spraying of Cored Wires. Stroj. Časopis-J. Mech. Eng. 2019, 69, 133–146. [Google Scholar] [CrossRef]
- Tarelnyk, V.B.; Konoplianchenko, I.V.; Gaponova, O.P.; Tarelnyk, N.V.; Martsynkovskyy, V.S.; Sarzhanov, B.O.; Sarzhanov, O.A.; Antoszewski, B. Effect of Laser Processing on the Qualitative Parameters of Protective Abrasion-Resistant Coatings. Powder Metall. Met. Ceram. 2020, 58, 703–713. [Google Scholar] [CrossRef]
- Prysyazhnyuk, P.; Ivanov, O.; Matvienkiv, O.; Marynenko, S.; Korol, O.; Koval, I. Impact and abrasion wear resistance of the hardfacings based on high-manganese steel reinforced with multicomponent carbides of Ti–Nb–Mo–V–C system. Procedia Struct. Integr. 2022, 36, 130–136. [Google Scholar] [CrossRef]
- Lozynskyi, V.; Trembach, B.; Hossain, M.M.; Kabir, M.H.; Silchenko, Y.; Krbata, M.; Sadovyi, K.; Kolomiitse, O.; Ropyak, L. Prediction of phase composition and mechanical properties Fe–Cr–C–B–Ti–Cu hardfacing alloys: Modeling and experimental Validations. Heliyon 2024, 10, e25199. [Google Scholar] [CrossRef]
- Trembach, B.O.; Sukov, M.G.; Vynar, V.A.; Trembach, I.O.; Subbotina, V.V.; Rebrov, O.Y.; Rebrova, O.M.; Zakiev, V.I. Effect of incomplete replacement of Cr for Cu in the deposited alloy of Fe–C–Cr–B–Ti alloying system with a medium boron content (0.5% wt.) on its corrosion resistance. Metallofiz. Noveishie Tekhno 2022, l44, 493–513. [Google Scholar] [CrossRef]
- Wolski, A.; Świerczyńska, A.; Lentka, G.; Fydrych, D. Storage of high-strength steel flux-cored welding wires in urbanized areas. Int. J. Precis. Eng. Manuf.-Green Technol. 2023, 11, 55–70. [Google Scholar] [CrossRef]
- Vynnykov, Y.; Kharchenko, M.; Manhura, S.; Muhlis, H.; Aniskin, A.; Manhura, A. Analysis of corrosion fatigue steel strength of pump rods for oil wells. Min. Miner. Depos. 2022, 16, 31–37. [Google Scholar] [CrossRef]
- Student, M.M.; Pokhmurs’ka, H.V.; Zadorozhna, K.R.; Veselivs’ka, H.H.; Hvozdets’kyi, V.M.; Sirak, Y.Y. Corrosion resistance of VC–FeCr and VC–FeCrCo coatings obtained by supersonic gas-flame spraying. Mater. Sci. 2019, 54, 535–541. [Google Scholar] [CrossRef]
- Świerczyńska, A.; Varbai, B.; Pandey, C.; Fydrych, D. Exploring the trends in flux-cored arc welding: Scientometric analysis approach. Int. J. Adv. Manuf. Technol. 2024, 130, 87–110. [Google Scholar] [CrossRef]
- Bembenek, M.; Prysyazhnyuk, P.; Shihab, T.; Machnik, R.; Ivanov, O.; Ropyak, L. Microstructure and wear characterization of the Fe–Mo–B–C–based hardfacing alloys deposited by flux-cored arc welding. Materials 2022, 15, 5074. [Google Scholar] [CrossRef]
- Vahrusheva, V.S.; Hlushkova, D.B.; Volchuk, V.M.; Nosova, T.V.; Mamhur, S.I.; Tsokur, N.I.; Bagrov, V.A.; Demchenko, S.V.; Ryzhkov, Y.V.; Scrypnikov, V.O. Increasing the corrosion resistance of heat-resistant alloys for parts of power equipment. Probl. At. Sci. Technol. 2022, 4, 140. [Google Scholar] [CrossRef]
- Hlushkova, D.B.; Volchuk, V.M. Multifractal analysis of the influence of chromium-nickel cast iron structure on its quality criteria. Probl. At. Sci. Technol. 2024, 2024, 145–153. [Google Scholar] [CrossRef]
- Boiko, I.A.; Grin’, A.G. Effect of the surface condition of fluxed-cored wires on the stability of the arc process. Weld. Int. 2015, 29, 543–547. [Google Scholar] [CrossRef]
- Spiridonova, I.M.; Sukhovaya, E.V.; Pilyaeva, S.B. Wear-resistant composite coatings with fillers of Fe-BC system. Paton Weld. J. 2002, 2003, 30–33. [Google Scholar]
- Selech, J.; Ulbrich, D.; Romek, D.; Kowalczyk, J.; Wlodarczyk, K.; Nadolny, K. Experimental Study of Abrasive, Mechanical and Corrosion Effects in Ring-on-Ring Sliding Contact. Materials 2020, 13, 4950. [Google Scholar] [CrossRef]
- Guzanova, A.; Džupon, M.; Draganovská, D.; Brezinová, J.; Viňáš, J.; Cmorej, D.; Janoško, E.; Maruschak, P. The corrosion and wear resistance of laser and MAG weld deposits. Acta Met. Slovaca 2020, 26, 37–41. [Google Scholar] [CrossRef]
- Shihab, S.T.A.; Prysyazhnyuk, P.; Andrusyshyn, R.; Lutsak, L.; Ivanov, O.; Tsap, I. Forming the structure and the properties of electric arc coatings based on high manganese steel alloyed with titanium and niobium carbides. East-Eur. J. Enterp. Technol. 2020, 1, 38–44. [Google Scholar] [CrossRef]
- Ivanov, O.; Prysyazhnyuk, P.; Lutsak, D.; Matviienkiv, O.; Aulin, V. Improvement of Abrasion Resistance of Production Equipment Wear Parts by Hardfacing with Flux-Cored Wires Containing Boron Carbide/Metal Powder Reaction Mixtures. Manag. Syst. Prod. Eng. 2020, 28, 178–183. [Google Scholar] [CrossRef]
- Viňáš, J.; Brezinová, J.; Brezina, J.; Hermel, P. Innovation of Biomass Crusher by Application of Hardfacing Layers. Metals 2021, 11, 1283. [Google Scholar] [CrossRef]
- Hlushkova, D.B.; Bagrov, V.A.; Volchuk, V.M.; Murzakhmetova, U.A. Influence of structure and phase composition on wear resistance of sparingly alloyed alloys. Funct. Mater. 2023, 30, 74–78. [Google Scholar]
- Viňáš, J.; Kaščák, L. Possibilities of using welding-on technologies 1 in crane wheel renovation. Bull. Mater. Sci. 2008, 31, 125–131. [Google Scholar] [CrossRef]
- Viňáš, J.; Brezinová, J.; Brezina, J.; Maruschak, P.O. Structural and mechanical features of laser-welded joints of zinc-coated advanced steel sheets. Mater. Sci. 2019, 55, 46–51. [Google Scholar] [CrossRef]
- Sawczuk, W.; Merkisz-Guranowska, A.; Ulbrich, D.; Kowalczyk, J.; Cañás, A.-M.R. Investigation and Modelling of the Weight Wear of Friction Pads of a Railway Disc Brake. Materials 2022, 15, 6312. [Google Scholar] [CrossRef]
- Ulbrich, D.; Stachowiak, A.; Kowalczyk, J.; Wieczorek, D.; Matysiak, W. Tribocorrosion and Abrasive Wear Test of 22MnCrB5 Hot-Formed Steel. Materials 2022, 15, 3892. [Google Scholar] [CrossRef] [PubMed]
- Erohin, A.A. Fundamentals of fusion welding. In Physical and Chemical Laws; Mashinostroyeniye: Moscow, Russia, 1973. [Google Scholar]
- Świerczyńska, A.; Fydrych, D.; Rogalski, G. Diffusible hydrogen management in underwater wet self-shielded flux cored arc welding. Int. J. Hydrog. Energy 2017, 42, 24532–24540. [Google Scholar] [CrossRef]
- Sukhova, O.V. Solubility of Cu, Ni, Mn in boron-rich Fe–B–C alloys. J. Phys. Chem. Solids 2021, 22, 110–116. [Google Scholar] [CrossRef]
- Sukhova, O.V. Effect of Ti, Al, Si on the structure and mechanical properties of boron-rich Fe–B–C alloys. East. Eur. J. Phys. 2021, 2021, 115–121. [Google Scholar] [CrossRef]
- Sukhova, O.V. Formation of structure and properties of boron-rich Fe–B–C alloys alloyed with Cr, V, Nb or/and mo. Metallofiz. Noveishie Tekhnologii 2021, 43, 355–365. [Google Scholar] [CrossRef]
- Sukhova, O.V. Structure and properties of Fe–B–C powders alloyed with Cr, V, Mo or Nb for plasma-sprayed coatings. Probl. At. Sci. Technol. 2020, 4, 77–83. Available online: http://dspace.nbuv.gov.ua/handle/123456789/194417 (accessed on 18 December 2023). [CrossRef]
- Samardžć, I.; Žagar, D.; Klarić, Š. Application and Upgrading of On-line Monitoring System for Measurement and Processing of Electric Signals at Arc Stud Welding Process. Stroj. Časopis Za Teor. I Praksu U Stroj. 2009, 51, 355–363. [Google Scholar]
- Krbata, M.; Krizan, D.; Eckert, M.; Kaar, S.; Dubec, A.; Ciger, R. Austenite Decomposition of a Lean Medium Mn Steel Suitable for Quenching and Partitioning Process: Comparison of CCT and DCCT Diagram and Their Microstructural Changes. Materials 2022, 15, 1753. [Google Scholar] [CrossRef]
- Krbata, M.; Ciger, R.; Kohutiar, M.; Eckert, M.; Barenyi, I.; Trembach, B.; Dubec, A.; Escherova, J.; Gavalec, M.; Beronská, N. Microstructural Changes and Determination of a Continuous Cooling Transformation (CCT) Diagram Using Dilatometric Analysis of M398 High-Alloy Tool Steel Produced by Microclean Powder Metallurgy. Materials 2023, 16, 4473. [Google Scholar] [CrossRef]
- Gramajo, J.; Gualco, A.; Svoboda, H. Effect of welding parameters on nanostructured Fe–(C.B)–(Cr.Nb) alloys. Mater. Res. 2019, 22, 1–8. [Google Scholar] [CrossRef]
- Gualco, A.; Svoboda, H.G.; Surian, E.S. Effect of welding parameters on microstructure of Fe-based nanostructured weld overlay deposited through FCAW–S. Weld. Int. 2016, 30, 573–580. [Google Scholar] [CrossRef]
- Hlushkova, D.B.; Volchuk, V.M.; Polyansky, P.M.; Saenko, V.A.; Efimenko, A.A. Fractal modeling the mechanical properties of the metal surface after ion-plasma chrome plating. Funct. Mater. 2023, 30, 275–281. [Google Scholar] [CrossRef]
- Spiridonova, I.M.; Sukhovaya, E.V.; Butenko, V.F.; Zhudra, A.P.; Litvinenko, A.I.; Belyj, A.I. Structure and properties of boron-bearing iron granules for composites. Powder Metall. Met. Ceram. 1993, 32, 45–49. [Google Scholar] [CrossRef]
- Krbaťa, M.; Eckert, M.; Cíger, R.; Kohutiar, M. Physical modeling of CCT diagram of tool steel 1.2343. Procedia Struct. Integr. 2023, 43, 270–275. [Google Scholar] [CrossRef]
- Trembach, B.; Grin, A.; Turchanin, M.; Makarenko, N.; Markov, O.; Trembach, I. Application of Taguchi method and ANOVA analysis for optimization of process parameters and exothermic addition (CuO–Al) introduction in the core filler during self-shielded flux-cored arc welding. Int. J. Adv. Manuf. Technol. 2021, 114, 1099–1118. [Google Scholar] [CrossRef]
- Júnior, J.G.F.; Cardoso, A.H.C.; Bracarense, A.Q. Effects of TiC formation in situ by applying titanium chips and other ingredients as a flux of tubular wire. J. Braz. Soc. Mech. Sci. Eng. 2020, 42, 375. [Google Scholar] [CrossRef]
- Júnior, J.G.F.; Clementecardoso, A.H.; Bracarense, A.Q. Addition of TiO2, CaCo3 and CaF2 as a flux of tubular wire applied for TiC in-situ reaction. Soldag. Insp. 2020, 25, e2511. [Google Scholar] [CrossRef]
- Trembach, B.; Grin, A.; Makarenko, N.; Zharikov, S.; Trembach, I.; Markov, O. Influence of the core filler composition on the recovery of alloying elements during the self-shielded flux-cored arc welding. J. Mater. Res. Technol. 2020, 9, 10520–10528. [Google Scholar] [CrossRef]
- Park, Y.D.; Kang, N.; Malene, S.H.; Olson, L. Effect of exothermic additions on heat generation and arc process efficiency in flux-cored arc welding. Metals Mater. Int. 2007, 13, 501–509. [Google Scholar] [CrossRef]
- Malene, S.H.; Park, Y.D.; Olson, D.L. Response of exothermic additions to the flux cored arc welding electrode-Part 1 Effectiveness of exothermically reacting magnesium-type flux additions was investigated with the flux-cored arc welding process. Weld. J. 2007, 86, 293–302. [Google Scholar]
- Allen, J.W.; Olson, D.L.; Frost, R.H. Exothermically assisted shielded metal arc welding. Weld. J. 1998, 77, 277–285. [Google Scholar]
- Zharikov, S.V.; Grin, A.G. Investigation of slags in surfacing with exothermic flux-cored wires. Weld. Int. 2015, 29, 386–389. [Google Scholar] [CrossRef]
- Vlasov, A.F.; Makarenko, N.A. Special features of heating and melting electrodes with an exothermic mixture in the coating. Weld. Int. 2016, 30, 717–722. [Google Scholar] [CrossRef]
- Chigarev, V.V.; Zarechenskii, D.A.; Belik, A.G. Optimisation of the composition and melting parameters of powder strips with the exothermic mixture in the filler. Weld. Int. 2016, 30, 557–559. [Google Scholar] [CrossRef]
- Vlasov, A.F.; Makarenko, N.A.; Kushchiy, A.M. Using exothermic mixtures in manual arc welding and electroslag processes. Weld. Int. 2017, 31, 565–570. [Google Scholar] [CrossRef]
- Li, H.; Liu, D.; Guo, N.; Chen, H.; Du, Y.; Feng, J. The effect of alumino-thermic addition on underwater wet welding process stability. J. Mater. Process Technol. 2017, 245, 149–156. [Google Scholar] [CrossRef]
- Wang, J.; Li, H.; Hu, C.; Wang, Z.; Han, K.; Liu, D.; Wang, J.; Zhu, Q. The Efficiency of Thermite-Assisted Underwater Wet Flux-Cored Arc Welding Process: Electrical Dependence, Microstructural Changes, and Mechanical Properties. Metals 2023, 13, 831. [Google Scholar] [CrossRef]
- Levchuk, K.H.; Radchenko, T.M.; Tatarenko, V.A. High-temperature entropy effects in tetragonality of the ordering interstitial–substitutional solution based on body-centred tetragonal metal. Metallofiz. Noveishie Tekhnol. 2021, 43, 1–26. [Google Scholar] [CrossRef]
- Solomenko, A.G.; Balabai, R.M.; Radchenko, T.M.; Tatarenko, V.A. Functionalization of quasi-two-dimensional materials: Chemical and strain-induced modifications. Prog. Phys. Met. 2022, 23, 147–238. [Google Scholar] [CrossRef]
- Henckell, P.; Gierth, M.; Ali, Y.; Reimann, J.; Bergmann, J.P. Reduction of Energy Input in Wire Arc Additive Manufacturing (WAAM) with Gas Metal Arc Welding (GMAW). Materials 2020, 13, 2491. [Google Scholar] [CrossRef]
- Lankin, Y.N. Indicators of stability of the GMAW process. Paton Weld. J. 2011, 1, 6–13. [Google Scholar]
- Kah, P.; Edigbe, G.O.; Ndiwe, B.; Kubicek, R. Assessment of arc stability features for selected gas metal arc welding conditions. SN Appl. Sci. 2022, 4, 268. [Google Scholar] [CrossRef]
- Trembach, B.O.; Hlushkova, D.V.; Hvozdetskyi, V.M.; Vynar, V.A.; Zakiev, V.I.; Kabatskyi, O.V.; Savenok, D.V.; Zakavorotnyi, O.Y. Prediction of Fill Factor and Charge Density of Self-Shielding Flux-Cored Wire with Variable Composition. Mater. Sci. 2023, 59, 18–25. [Google Scholar] [CrossRef]
- Jartovsky, O.V.; Larichkin, O.V. Pressure welding through a layer of hydrocarbon substance: Physical processes of a diffusion joint formation. Prog. Phys. Met. 2021, 22, 440–460. [Google Scholar] [CrossRef]
- Tarelnyk, V.B.; Gaponova, O.P.; Tarelnyk, N.V.; Myslyvchenko, O.M. Aluminizing of metal surfaces by electric-spark alloying. Prog. Phys. Met. 2023, 24, 282–318. [Google Scholar] [CrossRef]
- Trembach, B.; Starikov, V.; Sukov, M.G.; Zharikov, S.; Kabatskyi, O.; Ivanova, Y. Application of Mixture design in optimization of physical properties of slag during self-shielded flux-cored wire arc welding process. In Proceedings of the IEEE 5th International Conference on Modern Electrical and Energy System, MEES 2023, Kremenchuk, Ukraine, 27–30 September 2023; pp. 1–5. [Google Scholar] [CrossRef]
- Trembach, B. Comparative studies of the three-body abrasion wear resistance of hardfacing Fe-Cr-C-B-Ti alloy. Proc. IOP Conf. Ser. Mater. Sci. Eng. 2023, 1277, 012016. [Google Scholar] [CrossRef]
- Trembach, B.; Balenko, O.; Davydov, V.; Brechko, V.; Trembach, I.; Kabatskyi, O. Prediction the Melting Characteristics of Self-Shielded Flux Cored arc Welding (FCAW–S) with Exothermic Addition (CuO–Al). In Proceedings of the 2022 IEEE 4th International Conference on Modern Electrical and Energy System, MEES 2022, Kremenchuk, Ukraine, 20–23 October 2022; pp. 1–6. [Google Scholar] [CrossRef]
- Trembach, B.O.; Silchenko, Y.u.A.; Sukov, M.G.; Ratska, N.B.; Duriagina, Z.A.; Krasnoshapka, I.V.; Kabatskyi, O.V.; Rebrova, O.M. Development of a model of assimilation of alloying elements self-protecting powder wire and optimization of its charge composition. Mater. Sci. 2024; in press. [Google Scholar]
- Suban, M.; Tušek, J. Methods for the determination of arc stability. J. Mater. Process Technol. 2003, 143, 430–437. [Google Scholar] [CrossRef]
- Pessoa, E.; Ribeiro, L.F.; Bracarense, A.Q.; Tao, X.; Jin, P.; Feng, J. Arc stability indexes evaluation on underwater wet welding. Int. Conf. Offshore Mech. Arct. Eng. 2010, 49149, 19–201. [Google Scholar] [CrossRef]
- Joseph, A.; Harwig, D.; Farson, D.F.; Richardson, R. Measurement and calculation of arc power and heat transfer efficiency in pulsed gas metal arc welding. Sci. Technol. Weld. Join. 2003, 8, 400–406. [Google Scholar] [CrossRef]
- Cottis, R.A. Electrochemical noise for corrosion monitoring. In Techniques for Corrosion Monitoring, 2nd ed.; Yang, L.T., Ed.; Woodhead Publishing: Cambridge, UK, 2021; pp. 99–122. [Google Scholar] [CrossRef]
- Świerczyńska, A.; Łabanowski, J.; Fydrych, D. The effect of welding conditions on mechanical properties of superduplex stainless steel welded joints. Adv. Mater. Sci. 2014, 14, 14–23. [Google Scholar] [CrossRef]
- Wang, J.; Sun, Q.; Jiang, Y.; Zhang, T.; Ma, J.; Feng, J. Analysis and improvement of underwater wet welding process stability with static mechanical constraint support. J. Manuf. Process 2018, 34, 238–250. [Google Scholar] [CrossRef]
- Mazzaferro, J.A.E.; Machado, I.G. Study of arc stability in underwater shielded metal arc welding at shallow depths. Proc. Inst. Mech. Eng. Part C 2009, 223, 699–709. [Google Scholar] [CrossRef]
- Chen, T.; Xue, S.; Wang, B.; Zhai, P.; Long, W. Study on short-circuiting GMAW pool behavior and microstructure of the weld with different waveform control methods. Metals 2019, 9, 1326. [Google Scholar] [CrossRef]
- Ricardo, P.C.; Serudo, R.L.; Ţălu, Ş.; Lamarão, C.V.; da Fonseca Filho, H.D.; de Araújo Bezerra, J.; Sanches, E.A.; Campelo, P.H. Encapsulation of bromelain in combined sodium alginate and amino acid carriers: Experimental design of simplex-centroid mixtures for digestibility evaluation. Molecules 2022, 27, 6364. [Google Scholar] [CrossRef]
- Bandura, A.I. Composition of entire functions and bounded L-index in direction. Mat. Stud. 2017, 47, 179–184. [Google Scholar] [CrossRef]
- Baksa, V.; Bandura, A.; Skaskiv, O. Growth estimates for analytic vector-valued functions in the unit ball having bounded L-index in joint variables. Constr. Math. Anal. 2020, 3, 9–19. [Google Scholar] [CrossRef]
- Kumar, J.; Kumar, G.; Mehdi, H.; Kumar, M. Optimization of FSW parameters on mechanical properties of different aluminum alloys of AA6082 and AA7050 by response surface methodology. Int. J. Interact. Des. Manuf. 2023, 1–13. [Google Scholar] [CrossRef]
- Li, H.; Liu, D.; Yan, Y.; Guo, N.; Liu, Y.; Feng, J. Effects of heat input on arc stability and weld quality in underwater wet flux-cored arc welding of E40 steel. J. Manuf. Process 2018, 31, 833–843. [Google Scholar] [CrossRef]
- Halmešová, K.; Procházka, R.; Koukolíková, M.; Džugan, J.; Konopík, P.; Bucki, T. Extended Continuous Cooling Transformation (CCT) Diagrams Determination for Additive Manufacturing Deposited Steels. Materials 2022, 15, 3076. [Google Scholar] [CrossRef]
- Dykas, J.; Samek, L.; Grajcar, A.; Kozłowska, A. Modelling of Phase Diagrams and Continuous Cooling Transformation Diagrams of Medium Manganese Steels. Symmetry 2023, 15, 381. [Google Scholar] [CrossRef]
- Assunção, M.T.; Bracarense, A.Q. A novel strategy to improve melting efficiency and arc stability in underwater FCAW via contact tip air chamber. J. Manuf. Process 2023, 104, 1–16. [Google Scholar] [CrossRef]
- Mohamat, S.A.; Ibrahim, I.A.; Amir, A.; Ghalib, A. The effect of flux core arc welding (FCAW) processes on different parameters. Procedia Eng. 2012, 41, 1497–1501. [Google Scholar] [CrossRef]
- Bozhenko, B.L.; Shalimov, V.N.; Puchkin, P.A.; Kupar, R.Y. Oxidation kinetics of metal vapours in the arc in consumable electrode welding. Weld. Int. 1999, 13, 894–896. [Google Scholar] [CrossRef]
- Haidar, J. The dynamic effects of metal vapour in gas metal arc welding. J. Phys. D 2010, 43, 165204. [Google Scholar] [CrossRef]
- Ding, F.; Xinglong, Y.; Yingjie, H.; Jiankang, H.; Dequan, L. The study of arc behavior with different content of copper vapor in GTAW. China Weld. 2022, 31, 1–14. [Google Scholar] [CrossRef]
- Mostaghimi-Tehrani, J.; Pfender, E. Effects of metallic vapor on the properties of an argon arc plasma. Plasma Chem. Plasma Process 1984, 4, 129–139. [Google Scholar] [CrossRef]
- Zhang, S.; Wang, Y.; Xiong, Z.; Zhu, M.; Zhang, Z.; Li, Z. Mechanism and optimization of activating fluxes for process stability and weldability of hybrid laser-arc welded HSLA steel. Weld. World 2021, 65, 753–766. [Google Scholar] [CrossRef]
- Jia, C.; Zhang, T.; Maksimov, S.Y.; Yuan, X. Spectroscopic analysis of the arc plasma of underwater wet flux-cored arc welding. J. Mater. Process Technol. 2013, 213, 1370–1377. [Google Scholar] [CrossRef]
- Fattahi, M.; Nabhani, N.; Vaezi, M.R.; Rahimi, E. Improvement of impact toughness of AWS E6010 weld metal by adding TiO2 nanoparticles to the electrode coating. Mater. Sci. Eng. A 2011, 528, 8031–8039. [Google Scholar] [CrossRef]
- Guo, X.; Li, X.; Murphy, A.B.; Zhao, H. Calculation of thermodynamic properties and transport coefficients of CO2–O2–Cu mixtures. J. Phys. D 2017, 50, 345203. [Google Scholar] [CrossRef]
- Li, D.; Fan, D.; Huang, J.; Yao, X. Effect of copper vapor on arc characteristics under DC magnetic field. Trans. China Weld. Inst. 2023, 44, 71–76. [Google Scholar] [CrossRef]
- Ropyak, L.; Shihab, T.; Velychkovych, A.; Bilinskyi, V.; Malinin, V.; Romaniv, M. Optimization of Plasma Electrolytic Oxidation Technological Parameters of Deformed Aluminum Alloy D16T in Flowing Electrolyte. Ceramics 2023, 6, 146–167. [Google Scholar] [CrossRef]
- Touileb, K.; Attia, E.; Djoudjou, R.; Hedhibi, A.C.; Benselama, A.; Ibrahim, A.; Ahmed, M.M.Z. Effect of Microchemistry Elements in Relation of Laser Welding Parameters on the Morphology 304 Stainless Steel Welds Using Response Surface Methodology. Crystals 2023, 13, 1138. [Google Scholar] [CrossRef]
- Sukhova, O.V. Influence of the Structure and Cooling Rate of Fe–B–C Alloys on Mechanical Properties and Wear Resistance. Metallofiz. Noveishie Tekhno 2023, 45, 1337–1348. [Google Scholar] [CrossRef]
- Nouira, M.; Oliveira, M.C.; Khalfallah, A.; Alves, J.L.; Menezes, L.F. Comparative fracture prediction study for two materials under a wide range of stress states using seven uncoupled models. Eng. Fract. Mech. 2023, 279, 108952. [Google Scholar] [CrossRef]
- Viňáš, J.; Brezinová, J.; Pástor, M.; Šarga, P.; Džupon, M.; Brezina, J. Determination of the Effect of Heat Input during Laser Welding on the Magnitude of Residual Stresses in the Refurbishment of Al Alloy Casting. Metals 2023, 13, 2003. [Google Scholar] [CrossRef]
- Bembenek, M.; Kopei, V.; Ropyak, L.Y.; Levchuk, K. Stressed State of Chrome Parts During Diamond Burnishing. Metallofiz. Noveishie Tekhnol 2023, 45, 239–250. [Google Scholar] [CrossRef]
- Mabuwa, S.; Msomi, V. Investigation of the Microstructure and Mechanical Properties in Friction Stir Welded Dissimilar Aluminium Alloy Joints via Sampling Direction. Crystals 2023, 13, 1108. [Google Scholar] [CrossRef]
- Ivanov, O.O.; Prysiazhniuk, P.M.; Bodrova, L.G.; Kramar, G.M.; Marynenko, S.Y.; Koval, I.V.; Guryk, O.Y. 3D Modeling of the Structure of Deposited Materials Based on Fe–Ti–Mo–B–C System. Mater. Sci. 2024, 59, 163–169. [Google Scholar] [CrossRef]
- Beygi, R.; Zarezadeh Mehrizi, M.; Akhavan-Safar, A.; Mohammadi, S.; da Silva, L.F.M. A Parametric Study on the Effect of FSW Parameters and the Tool Geometry on the Tensile Strength of AA2024–AA7075 Joints: Microstructure and Fracture. Lubricants 2023, 11, 59. [Google Scholar] [CrossRef]
- Boughrara, N.; Benzarti, Z.; Khalfallah, A.; Oliveira, J.C.; Evaristo, M.; Cavaleiro, A. Thickness-dependent physical and nanomechanical properties of AlxGa1−xN thin films. Mater. Sci. Semicond. Process. 2022, 151, 107023. [Google Scholar] [CrossRef]
- Veselivska, H.H.; Hvozdetskyi, V.M.; Student, M.M.; Zadorozhna, K.R.; Dzioba, Y.V. The Influence of the Electrolyte Composition for Hard Anodizing of Aluminum on Corrosion Resistance of Synthesized Coatings. Mater. Sci. 2024, 59, 228–233. [Google Scholar] [CrossRef]
- Andreikiv, O.Y.; Dolinska, I.Y.; Zviahin, S.; Liubchak, M.O. Acoustic-emission method for determining residual life of power equipment with creep cracks under static load. Mater. Sci. 2023, 59, 103–111. [Google Scholar] [CrossRef]
- Prysyazhnyuk, P.; Di Tommaso, D. The thermodynamic and mechanical properties of Earth-abundant metal ternary boride Mo2 (Fe,Mn)B2 solid solutions for impact- and wear-resistant alloys. Mater. Adv. 2023, 4, 3822–3838. [Google Scholar] [CrossRef]
- Luzan, S.A.; Bantkovskiy, V.A. Structure and Tribotechnical Properties of Deposited Composite Layers Based on PG 10N-01 Alloy Containing AL2O3. Mater. Sci. 2023, 59, 328–334. [Google Scholar] [CrossRef]
- Katinas, E.; Antonov, M.; Jankauskas, V.; Goljandin, D. Effect of Local Remelting and Recycled WC-Co Composite Reinforcement Size on Abrasive and Erosive Wear of Manual Arc Welded Hardfacings. Coatings 2023, 13, 734. [Google Scholar] [CrossRef]
- Pashechko, M.I.; Shyrokov, V.V.; Duryahina, Z.A.; Vasyliv, K.B. Structure and Corrosion-Mechanical Properties of the Surface Layers of Steels after Laser Alloying. Mater. Sci. 2003, 39, 108–117. [Google Scholar] [CrossRef]
- Vynnykov, Y.; Kharchenko, M.; Manhura, S.; Aniskin, A.; Manhura, A. Degradation of the internal well equipment steel under continuous service in the corrosive and aggressive environments. Min. Miner. Depos. 2023, 17, 84–92. [Google Scholar] [CrossRef]
- Allan, I.; Aknazarov, S.; Golovchenko, O.; Bairakova, O.; Ponomareva, Y.; Mutushev, A. Influence of fluxing additives on aluminothermic synthesis of aluminum borides. Eng. J. Satbayev Univ. 2022, 144, 19–25. [Google Scholar] [CrossRef]
- Andreikiv, Y.; Dolinska, I.Y.; Zviahin, N.S. Acoustic-Emission Method of Determining Residual Life of Thin-Walled Structural Elements Under the Action of Force Loads and Corrosive Environments. Mater. Sci. 2023, 58, 693–700. [Google Scholar] [CrossRef]
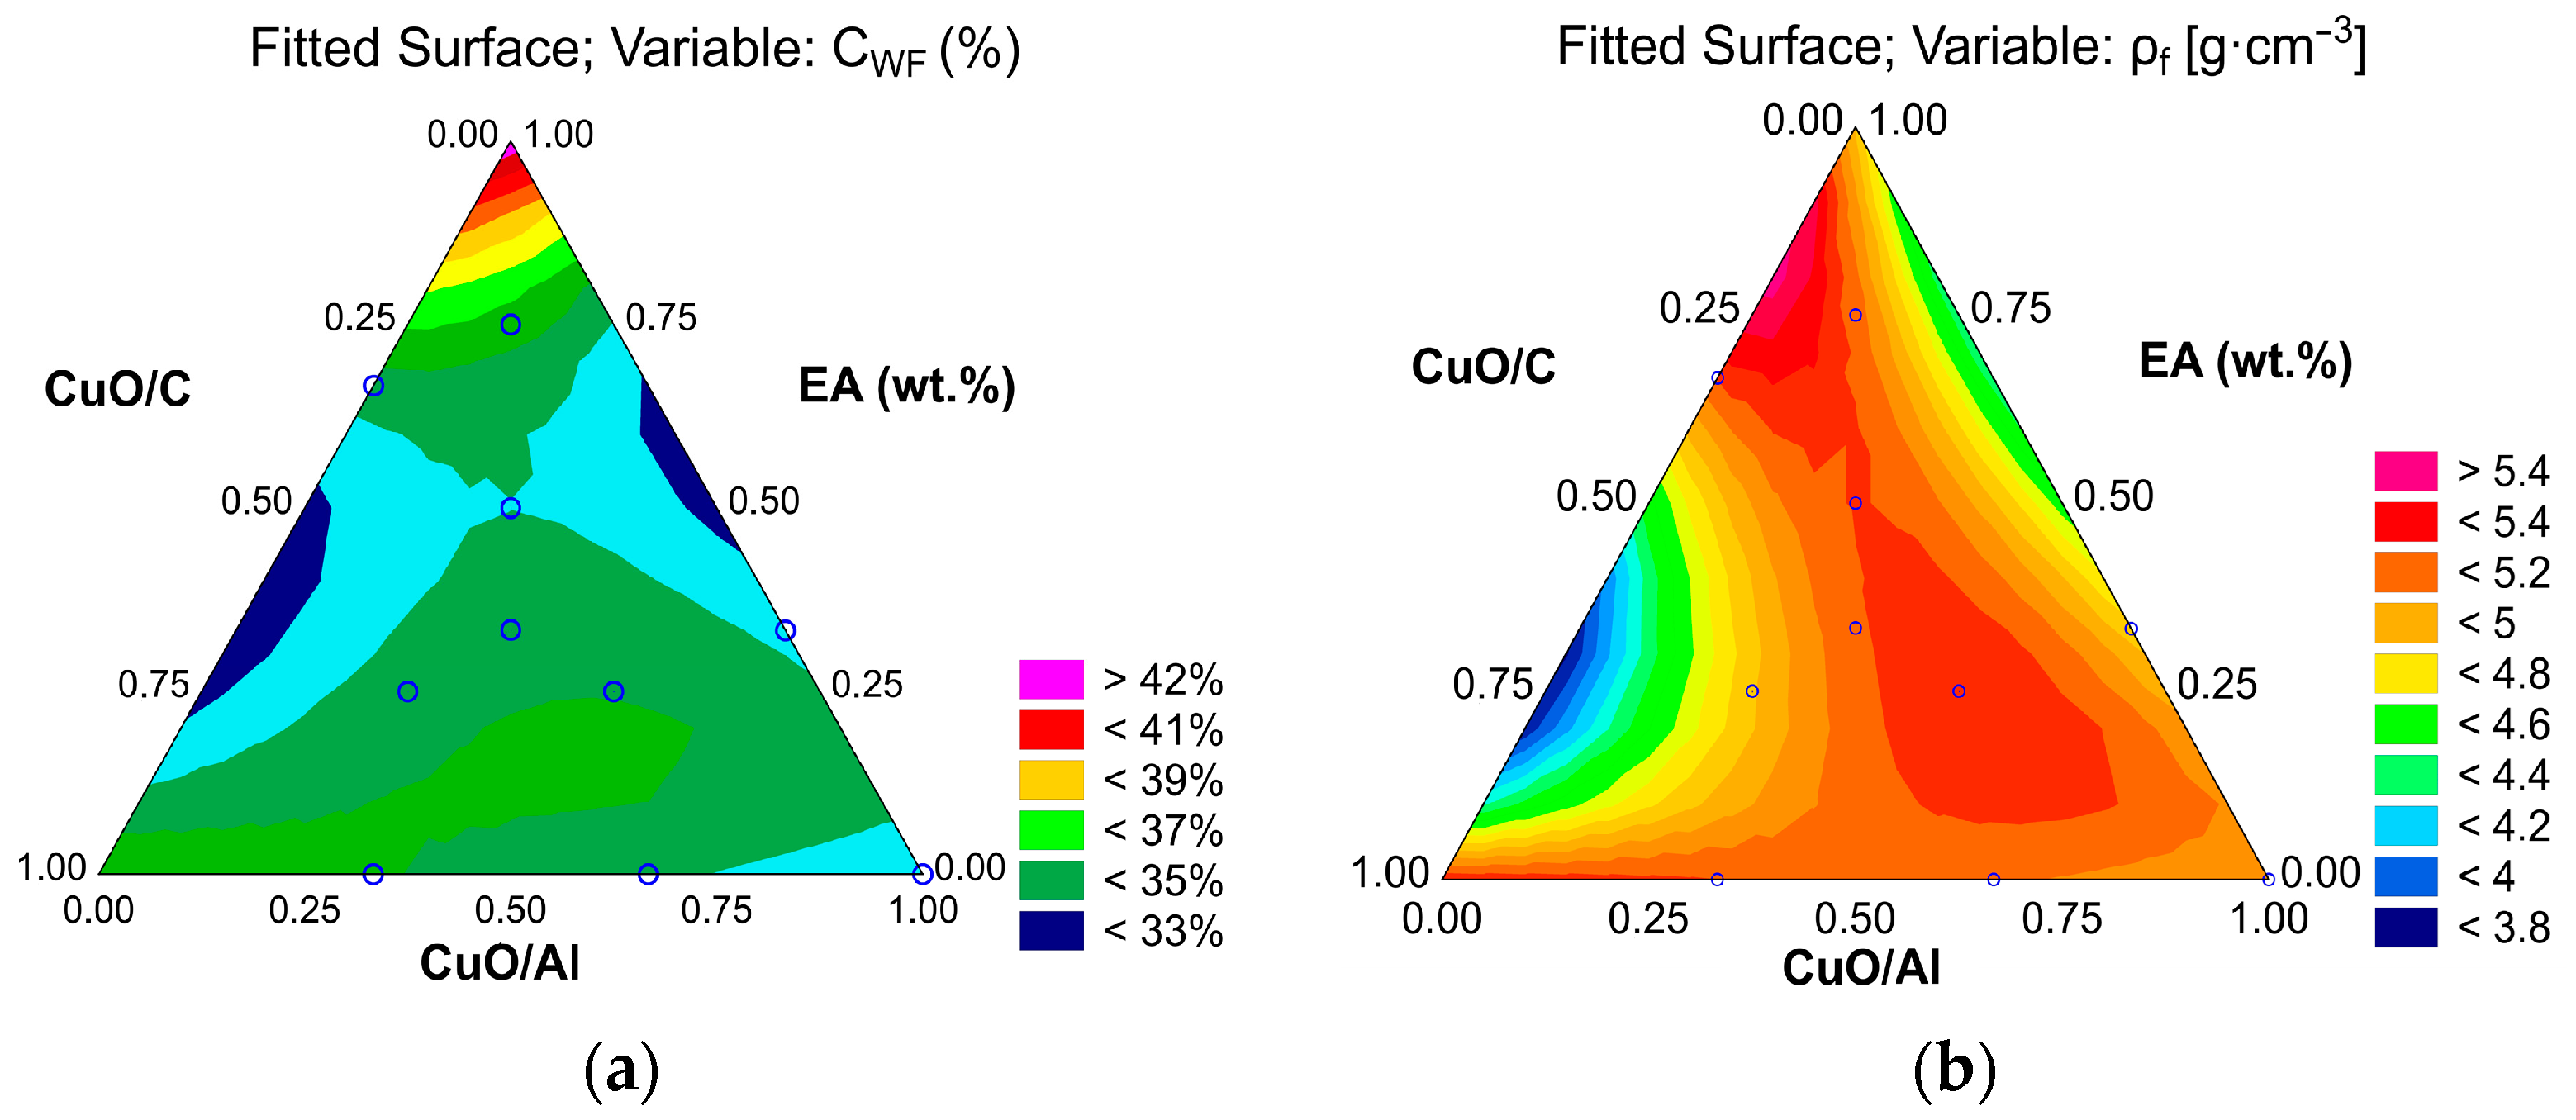
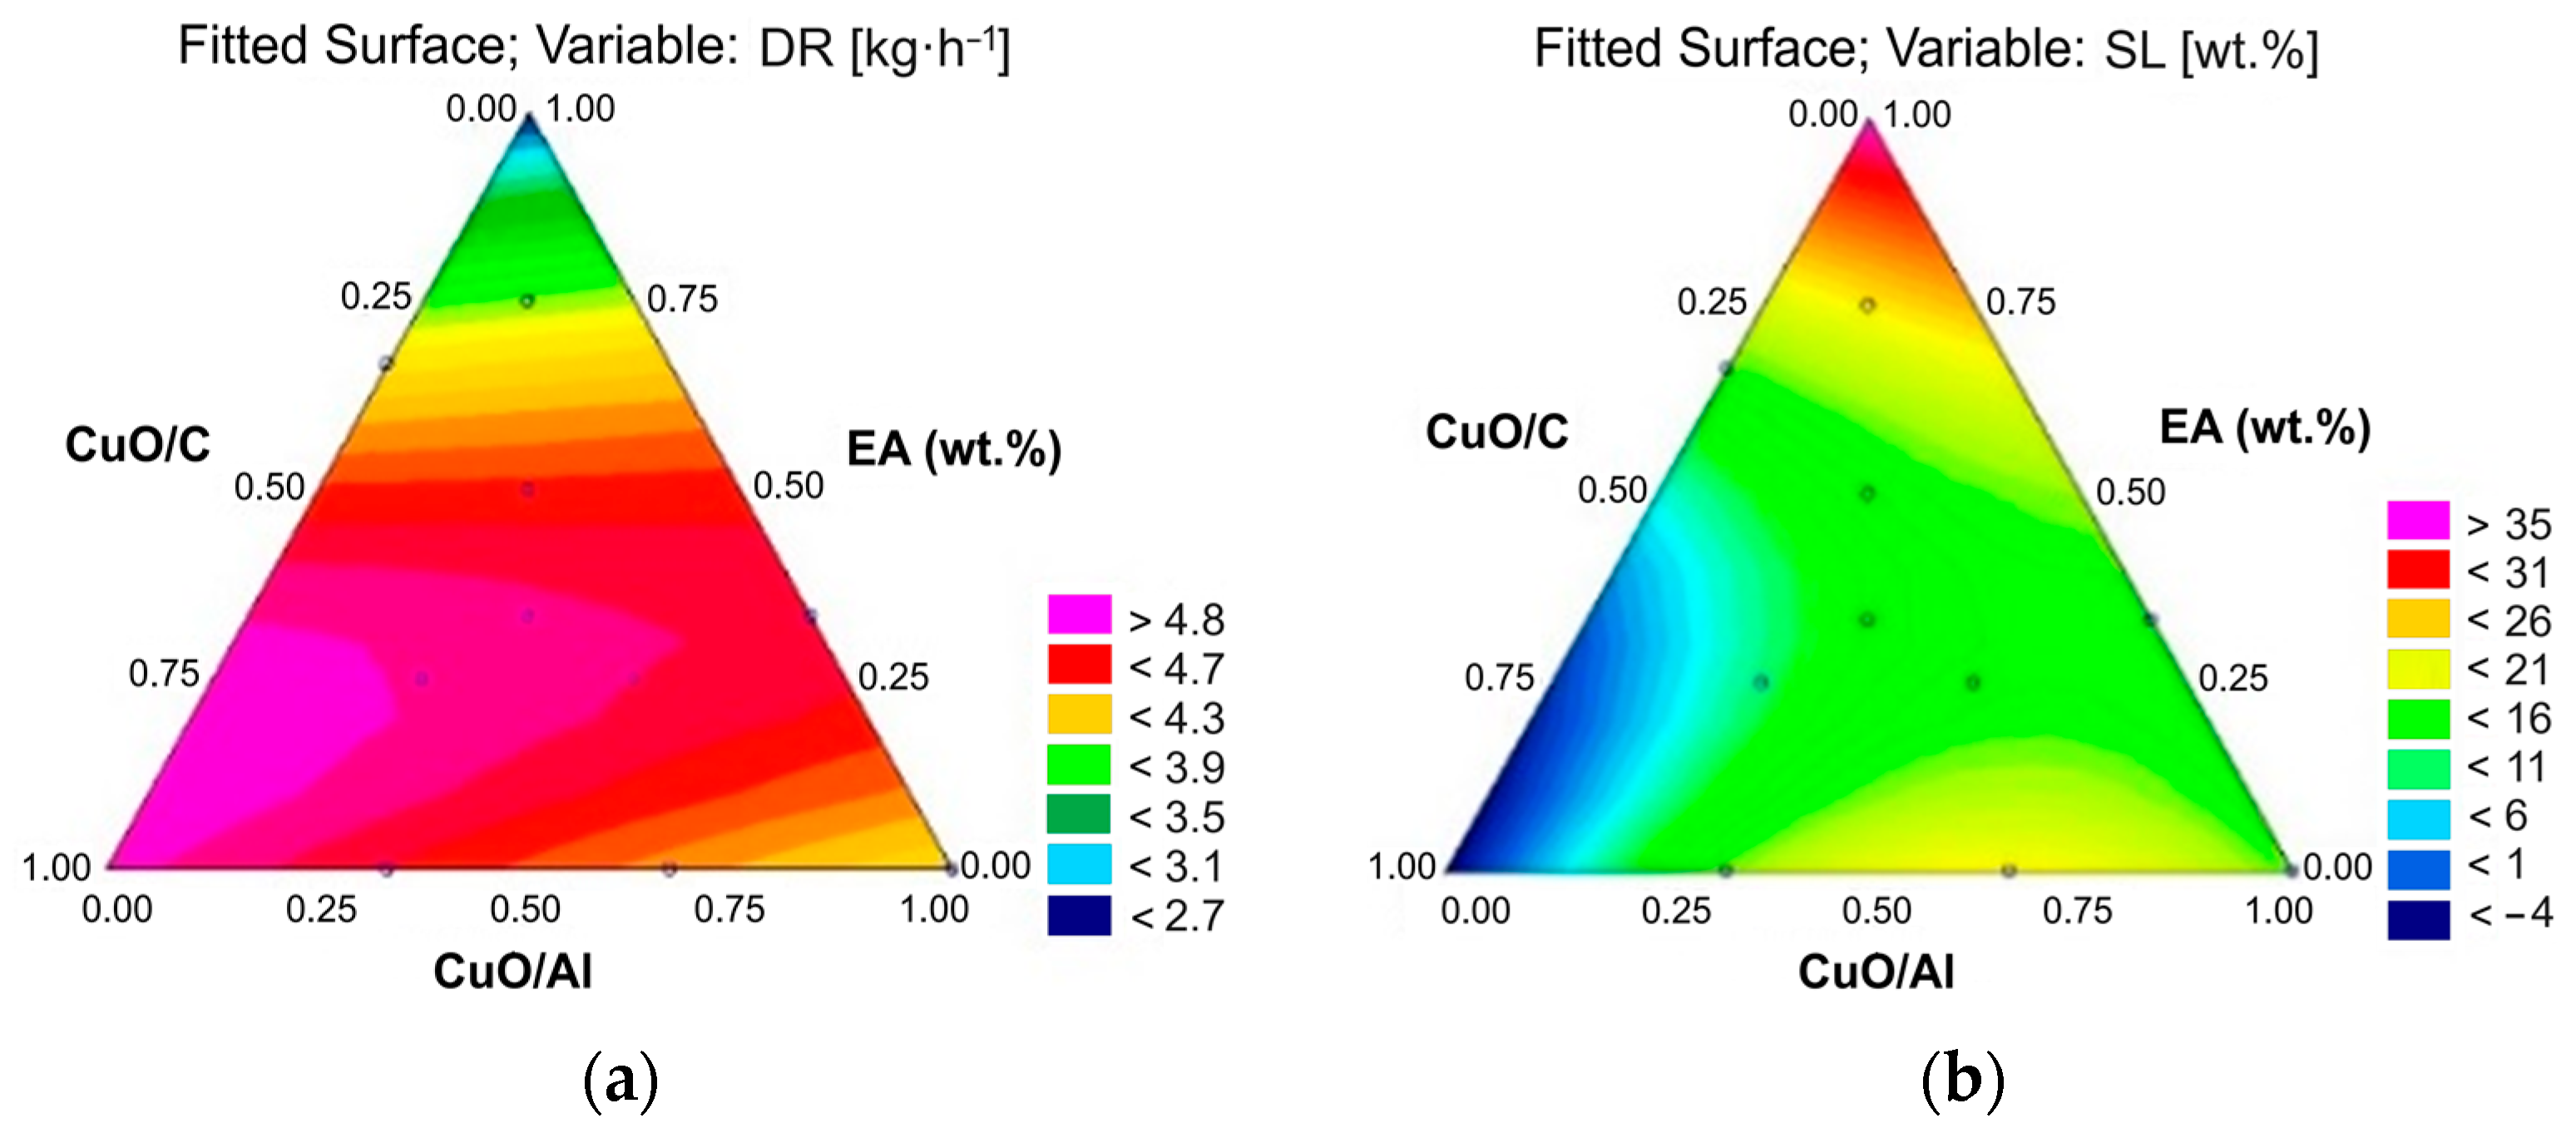
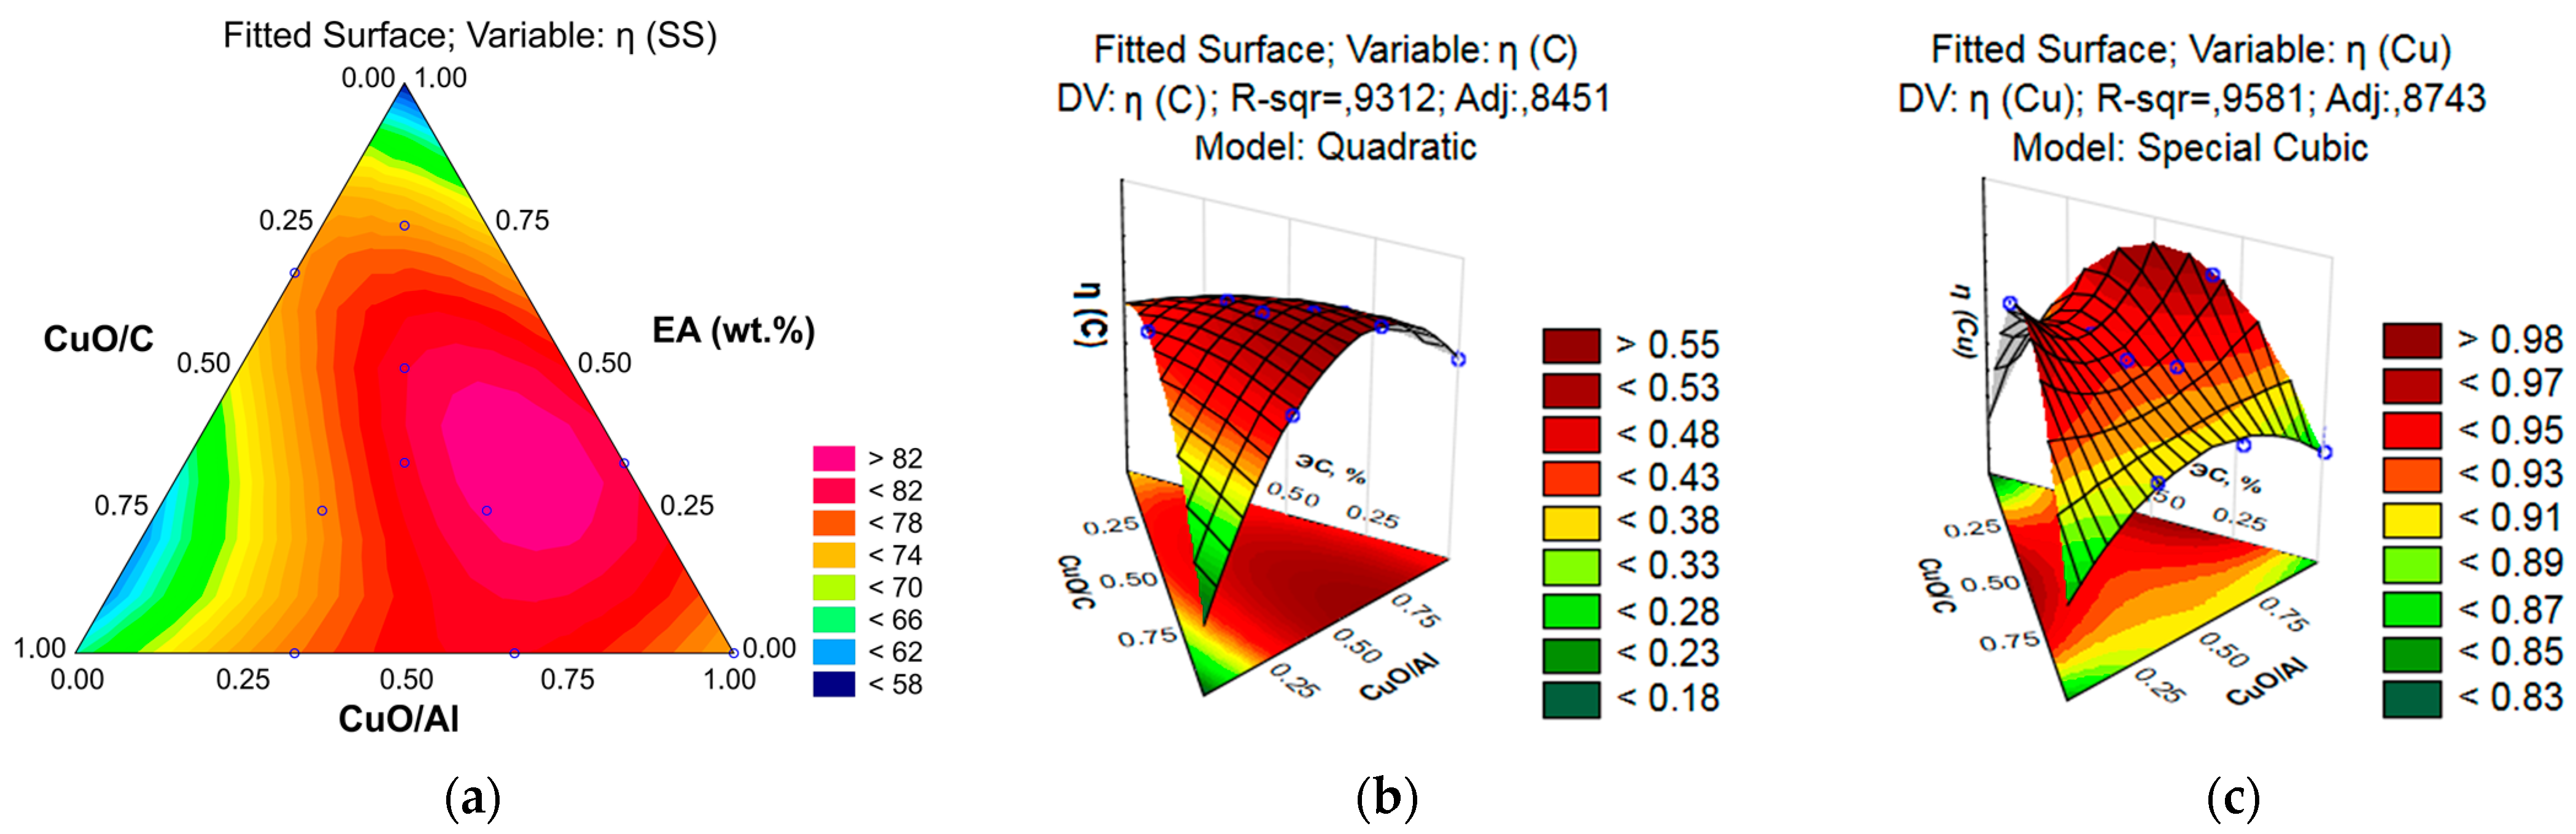
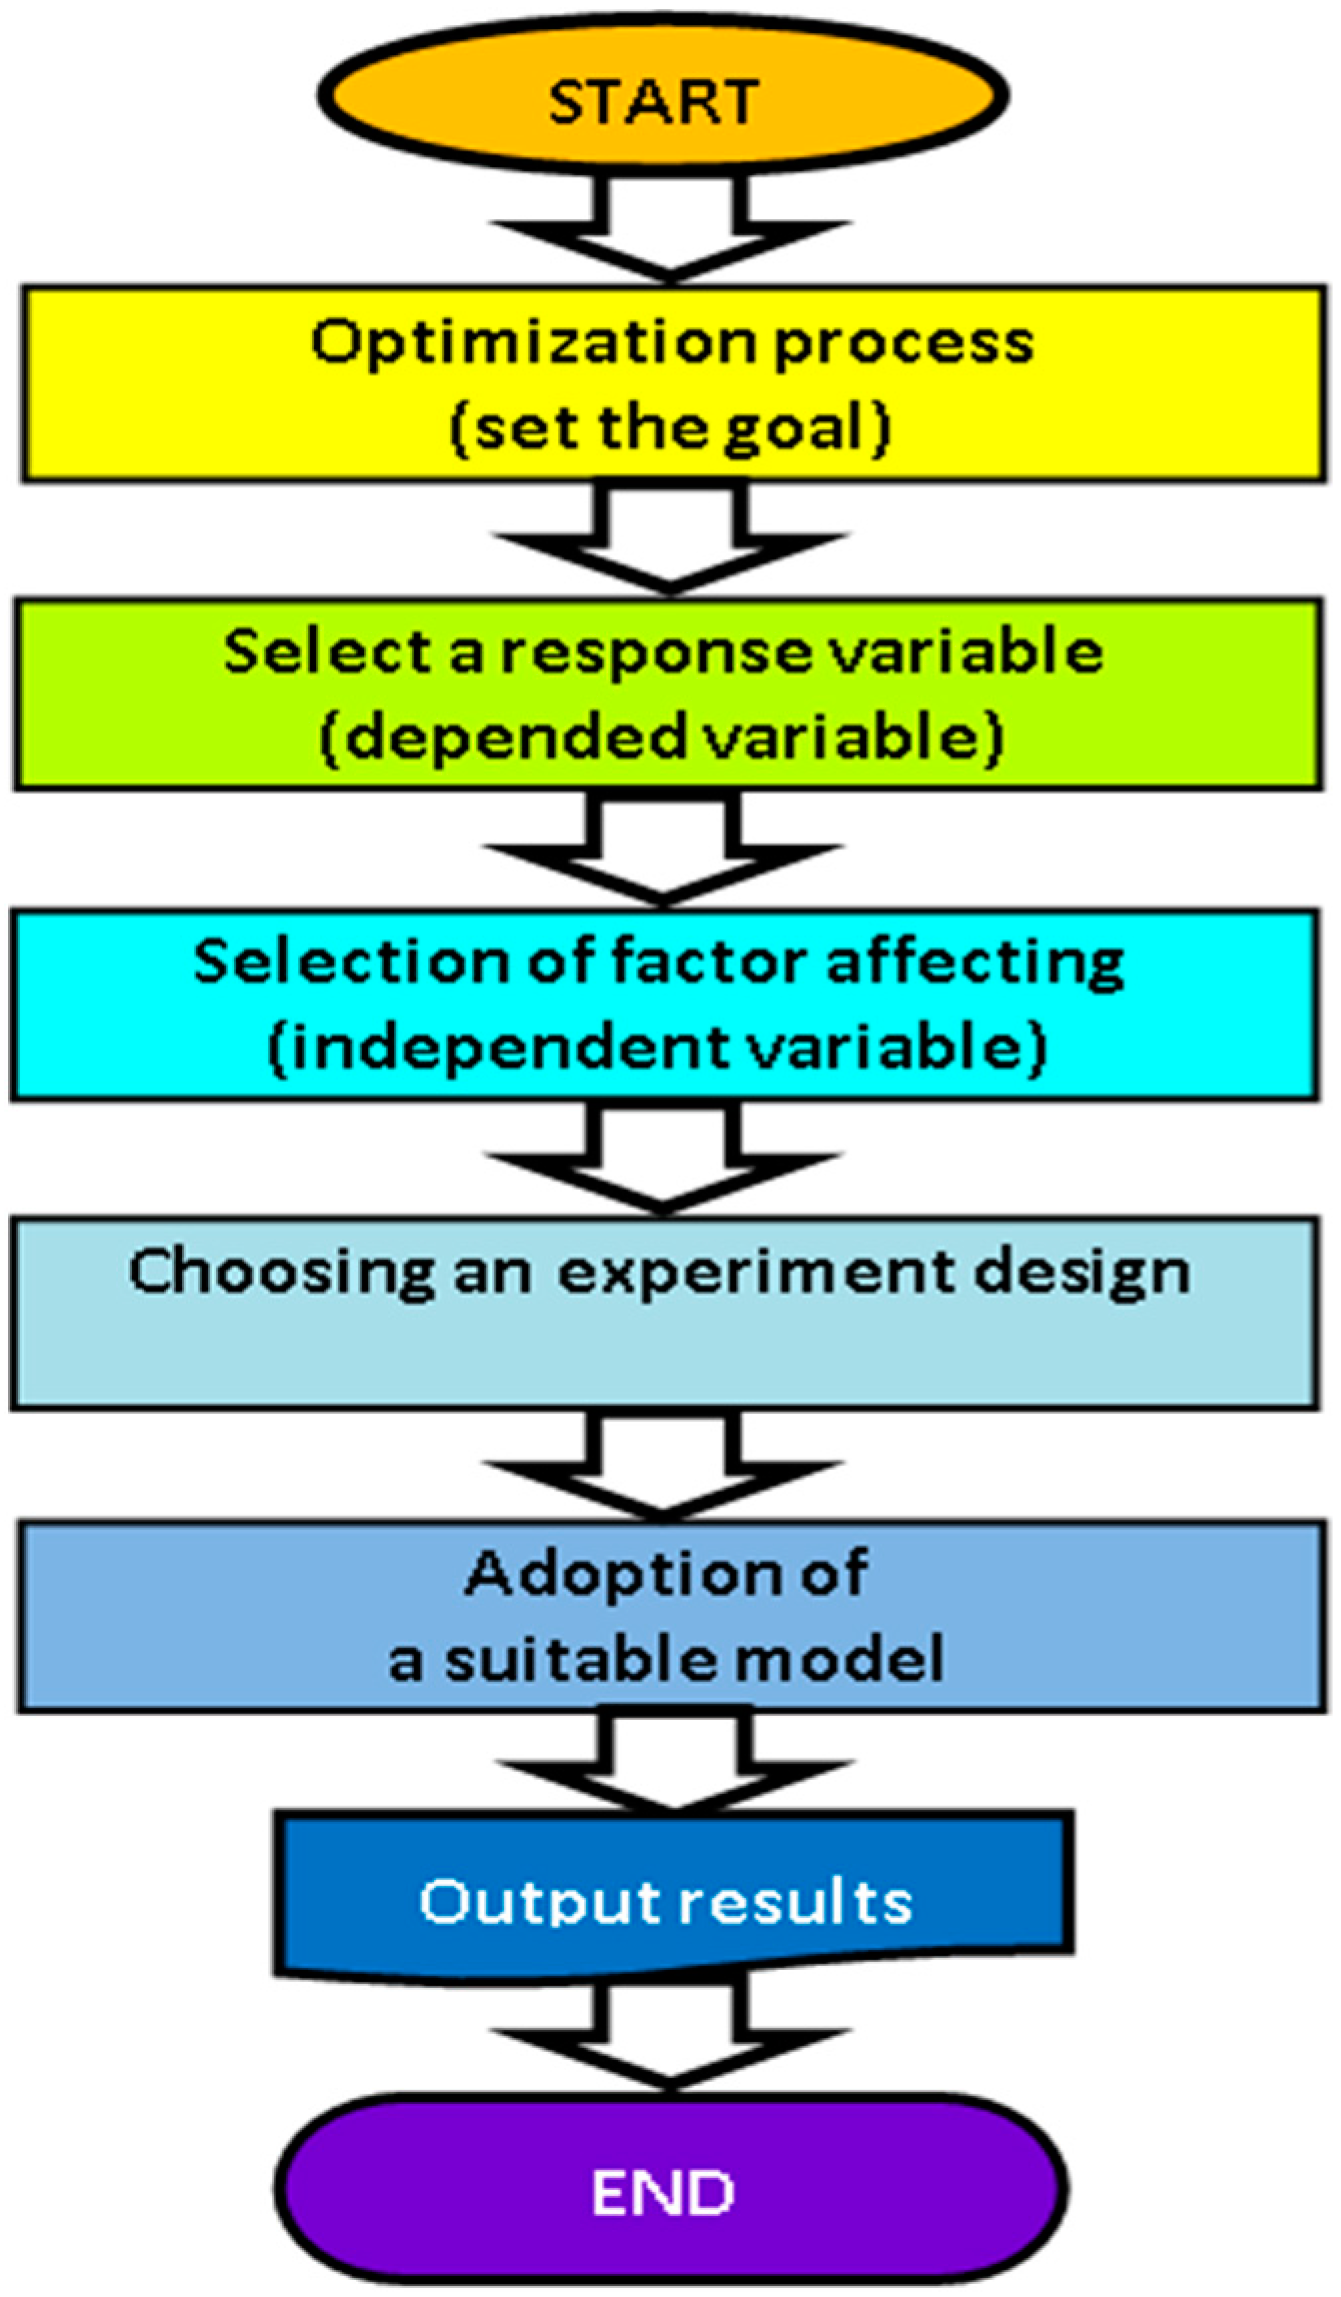
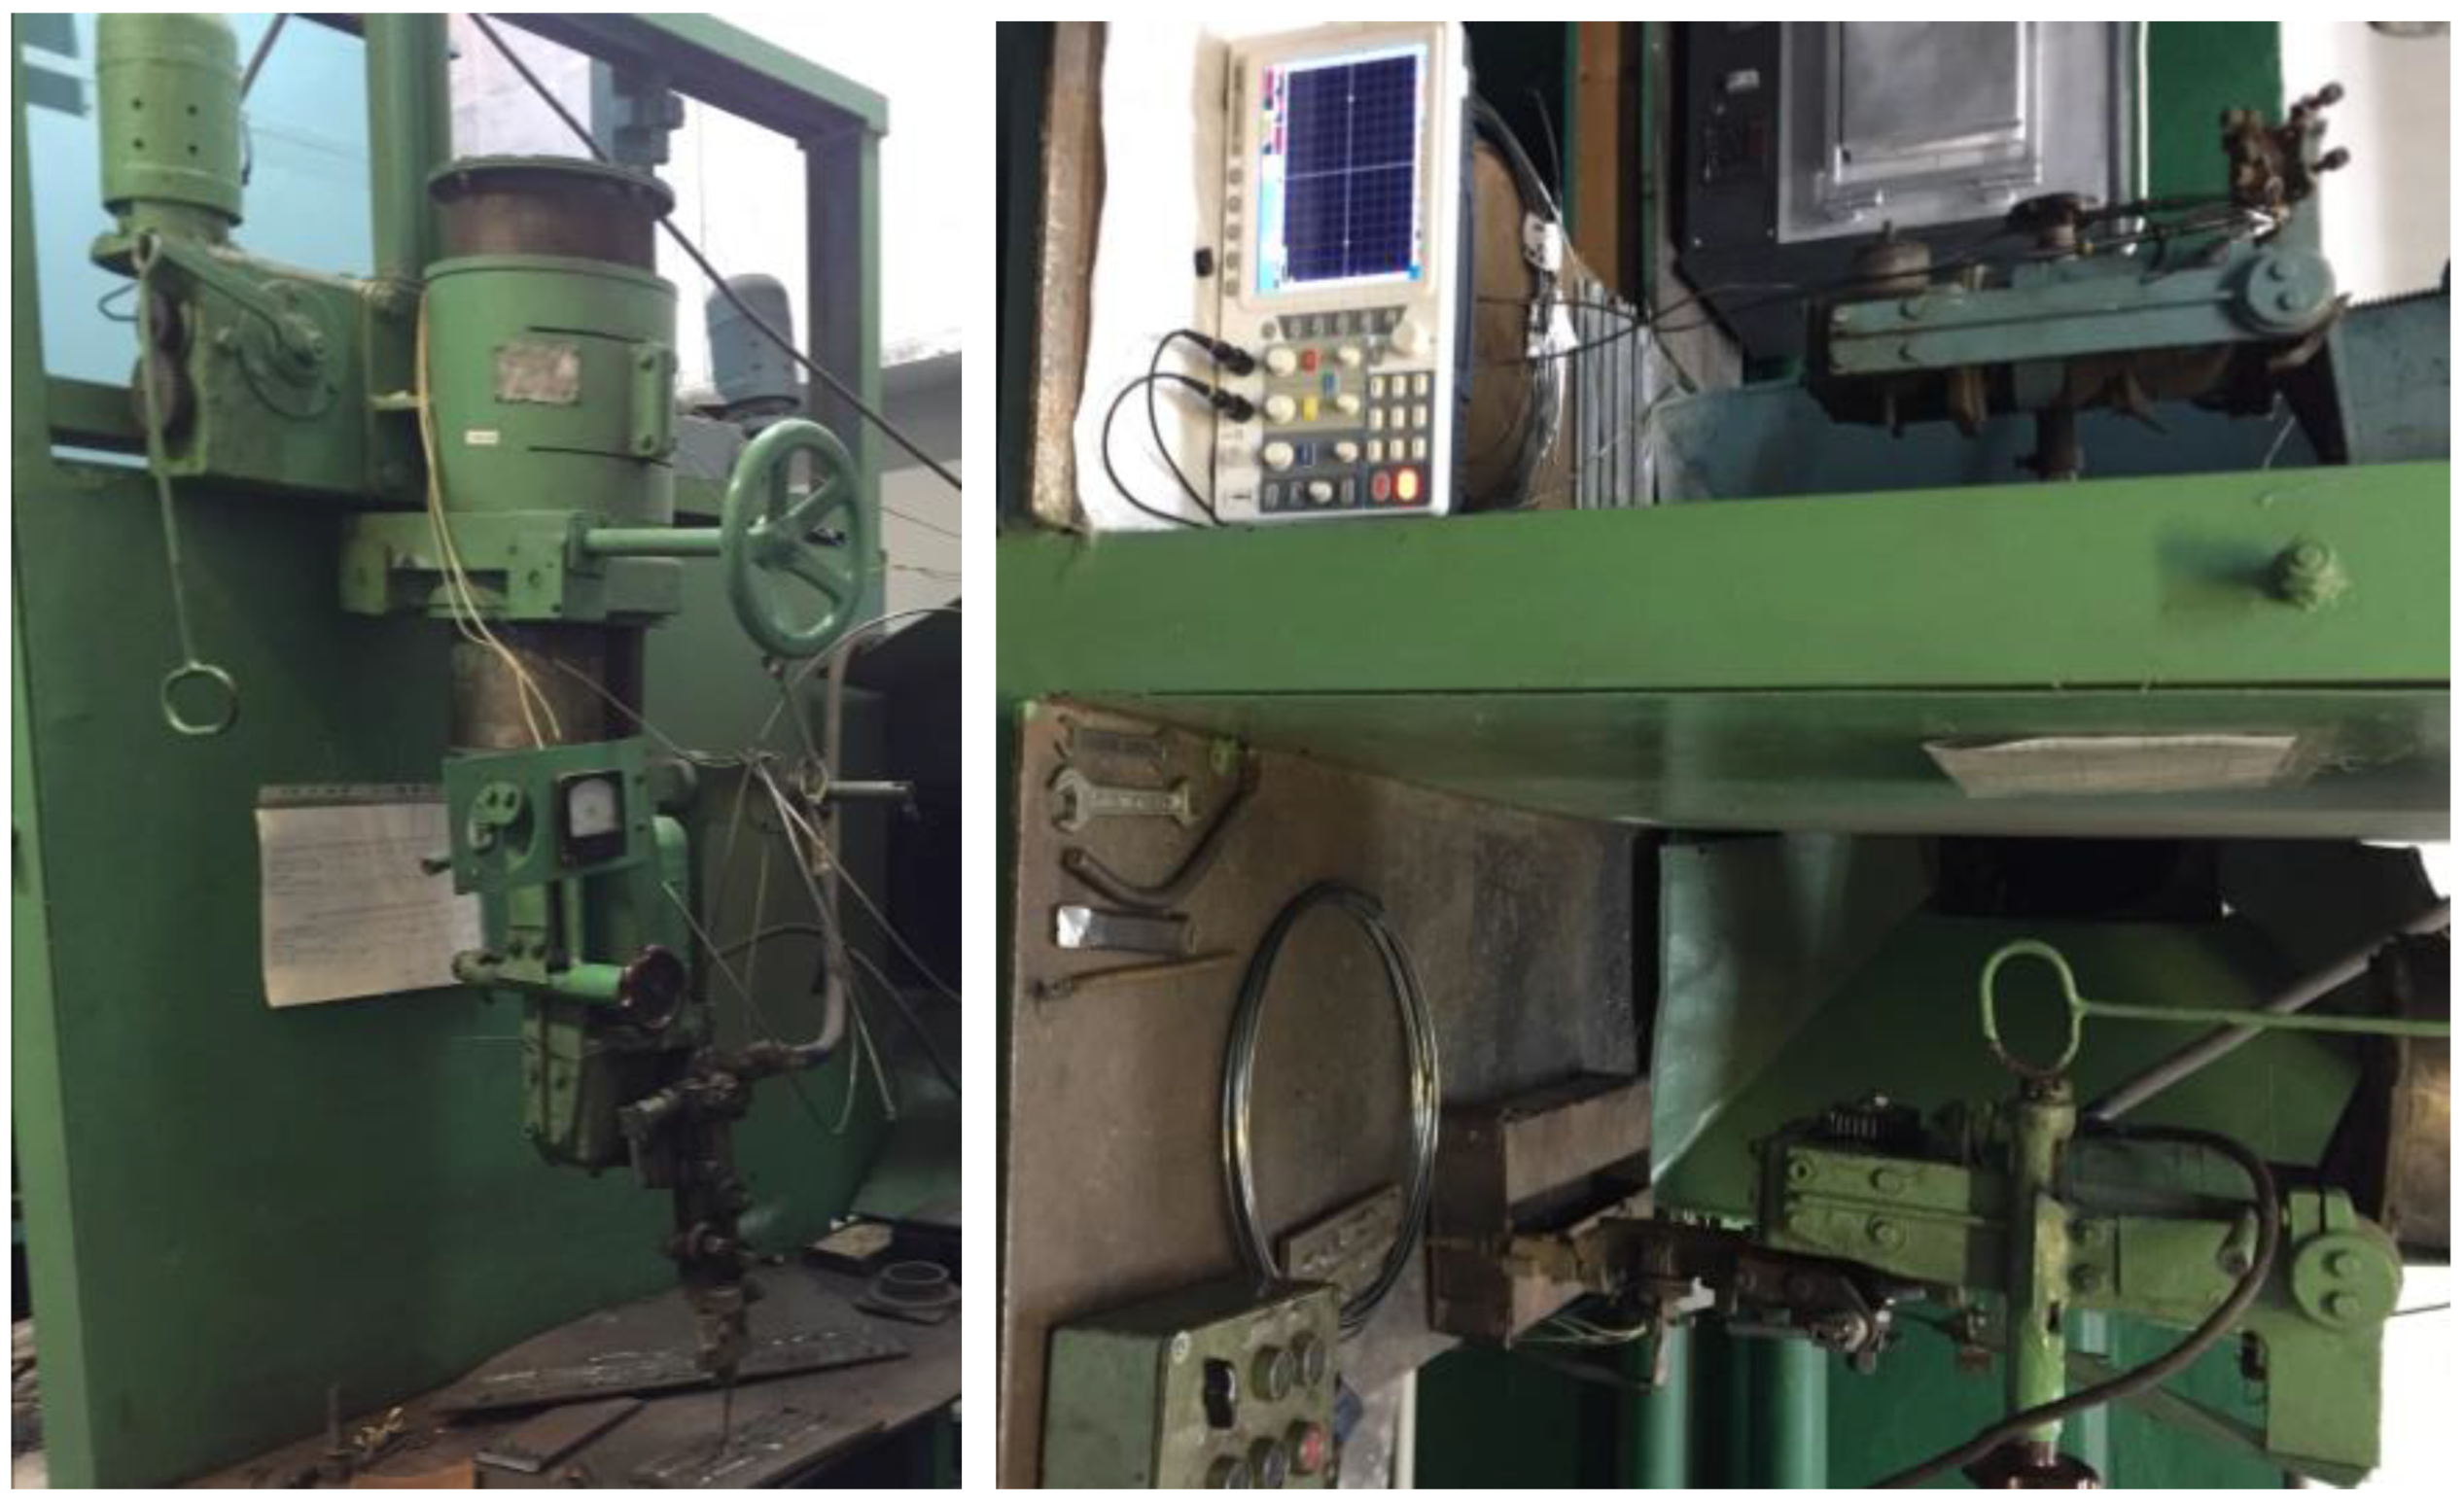
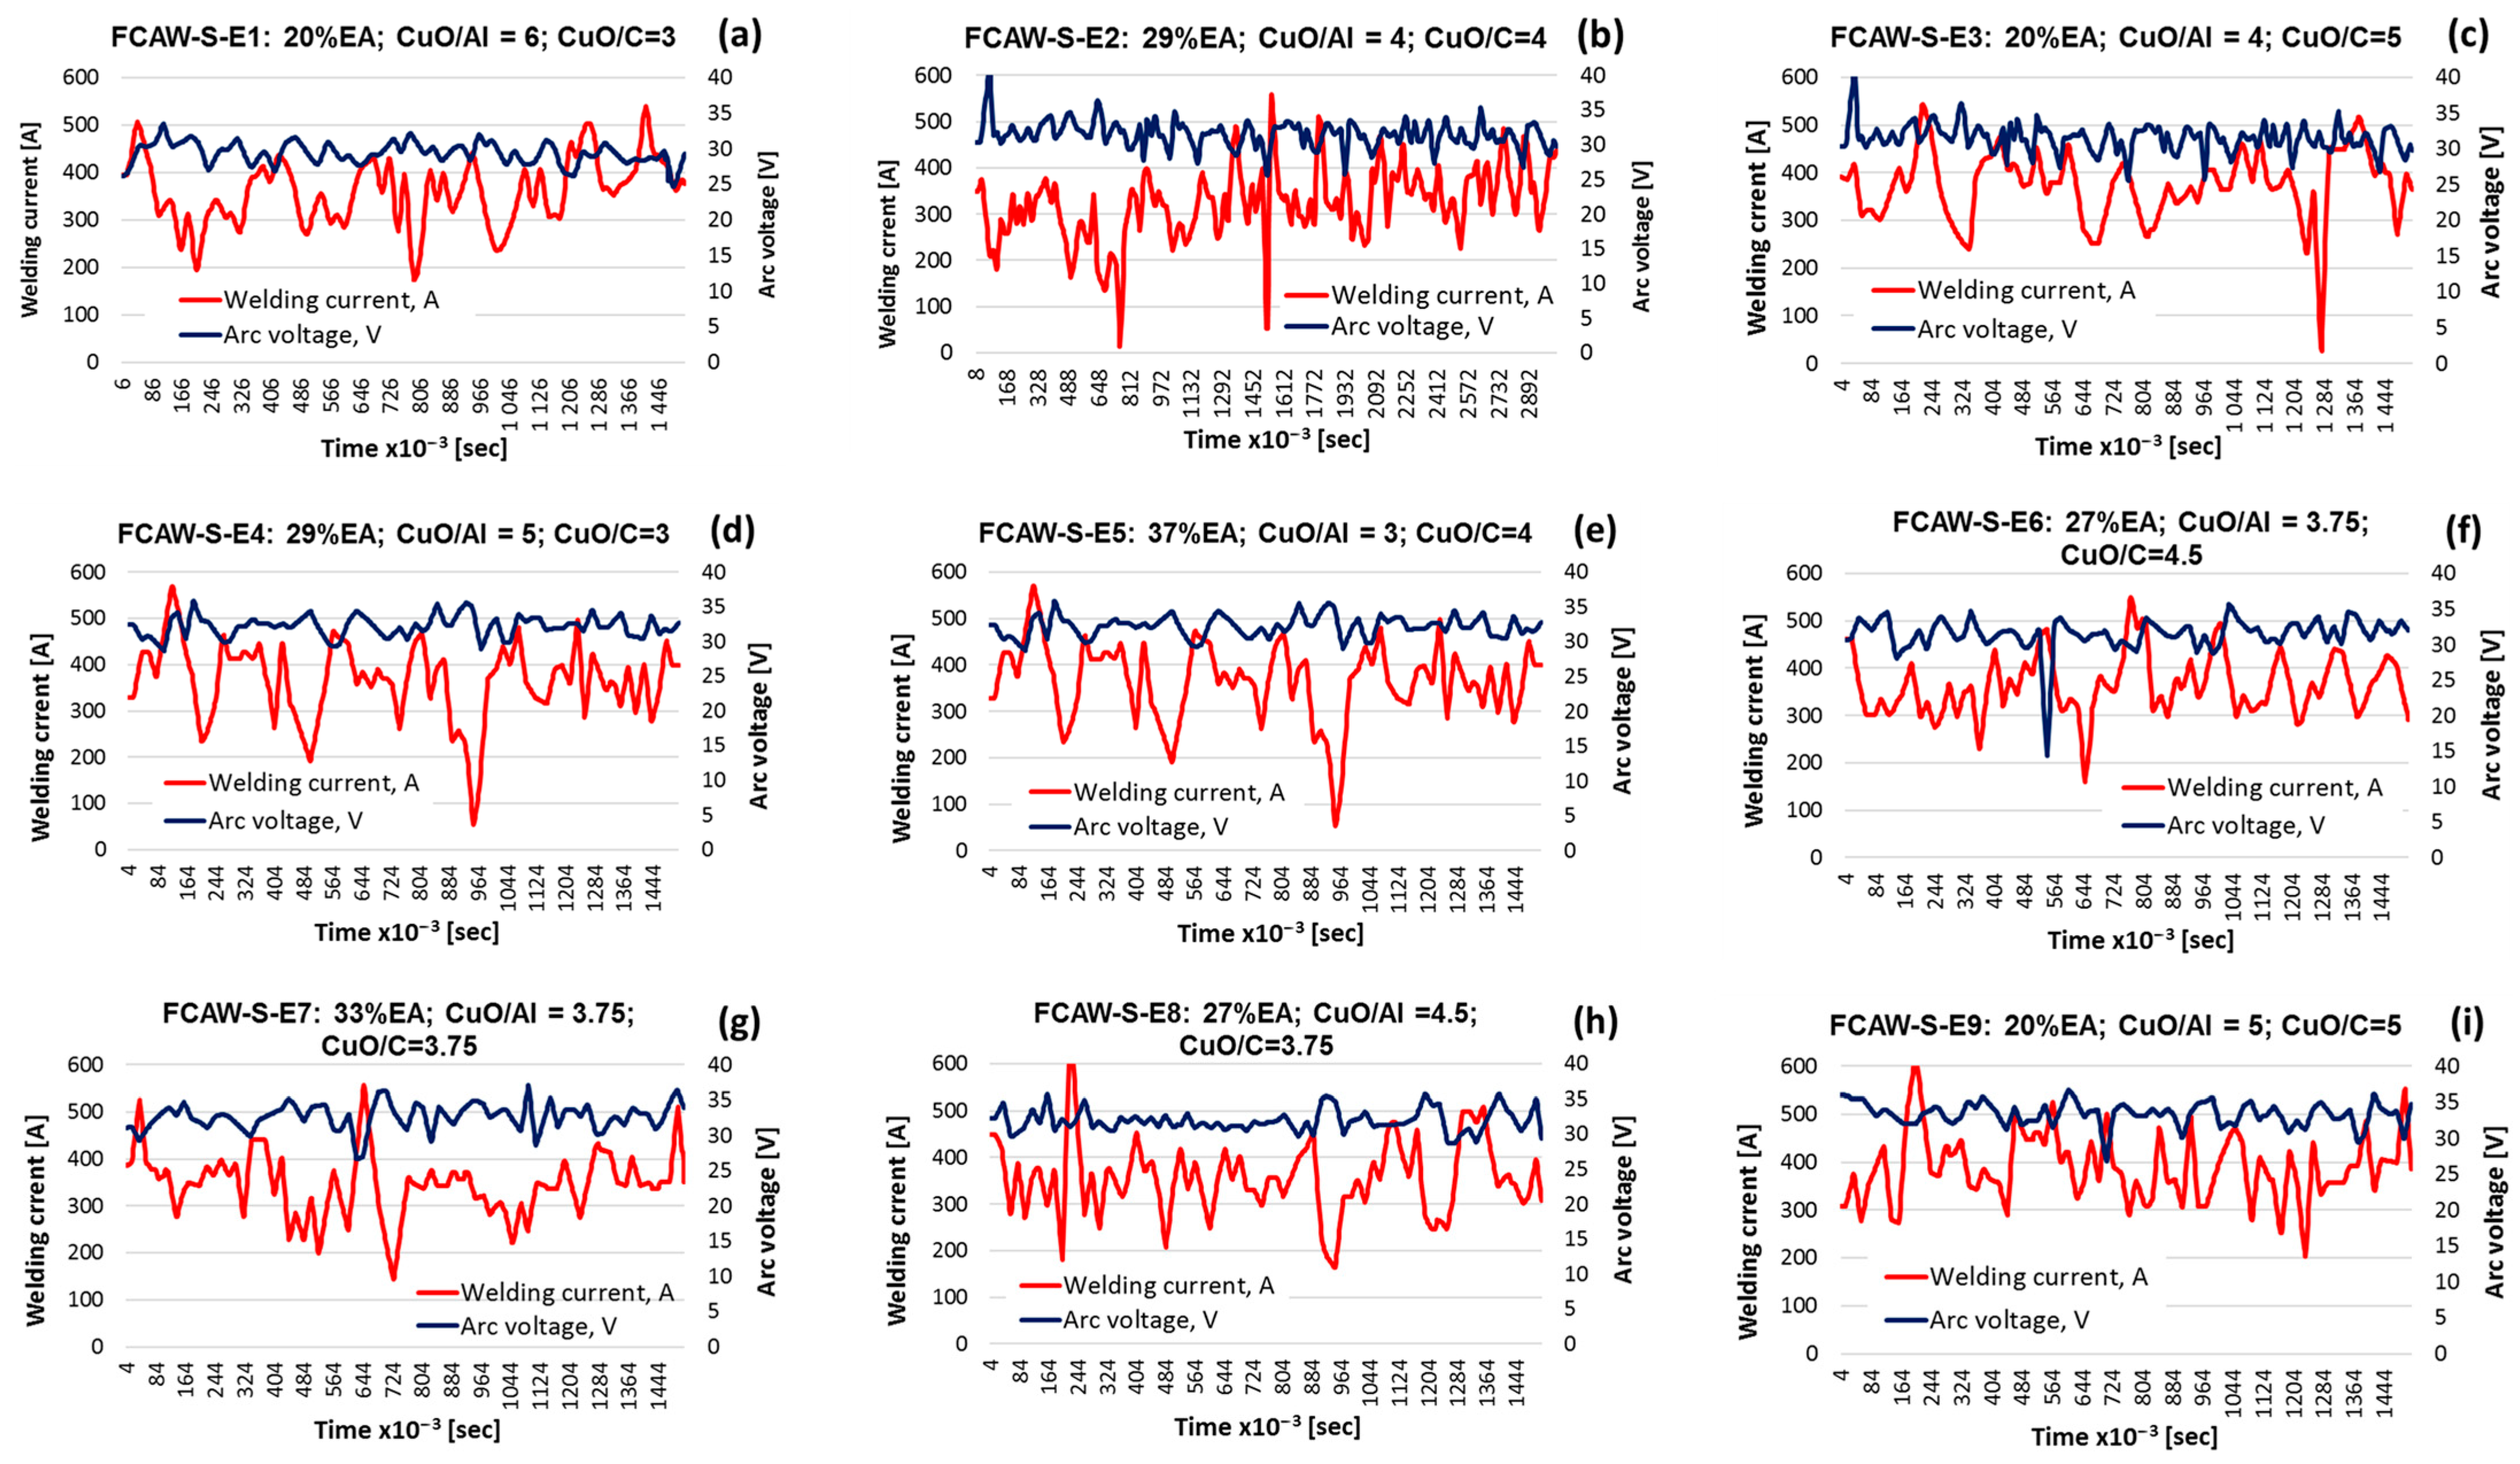
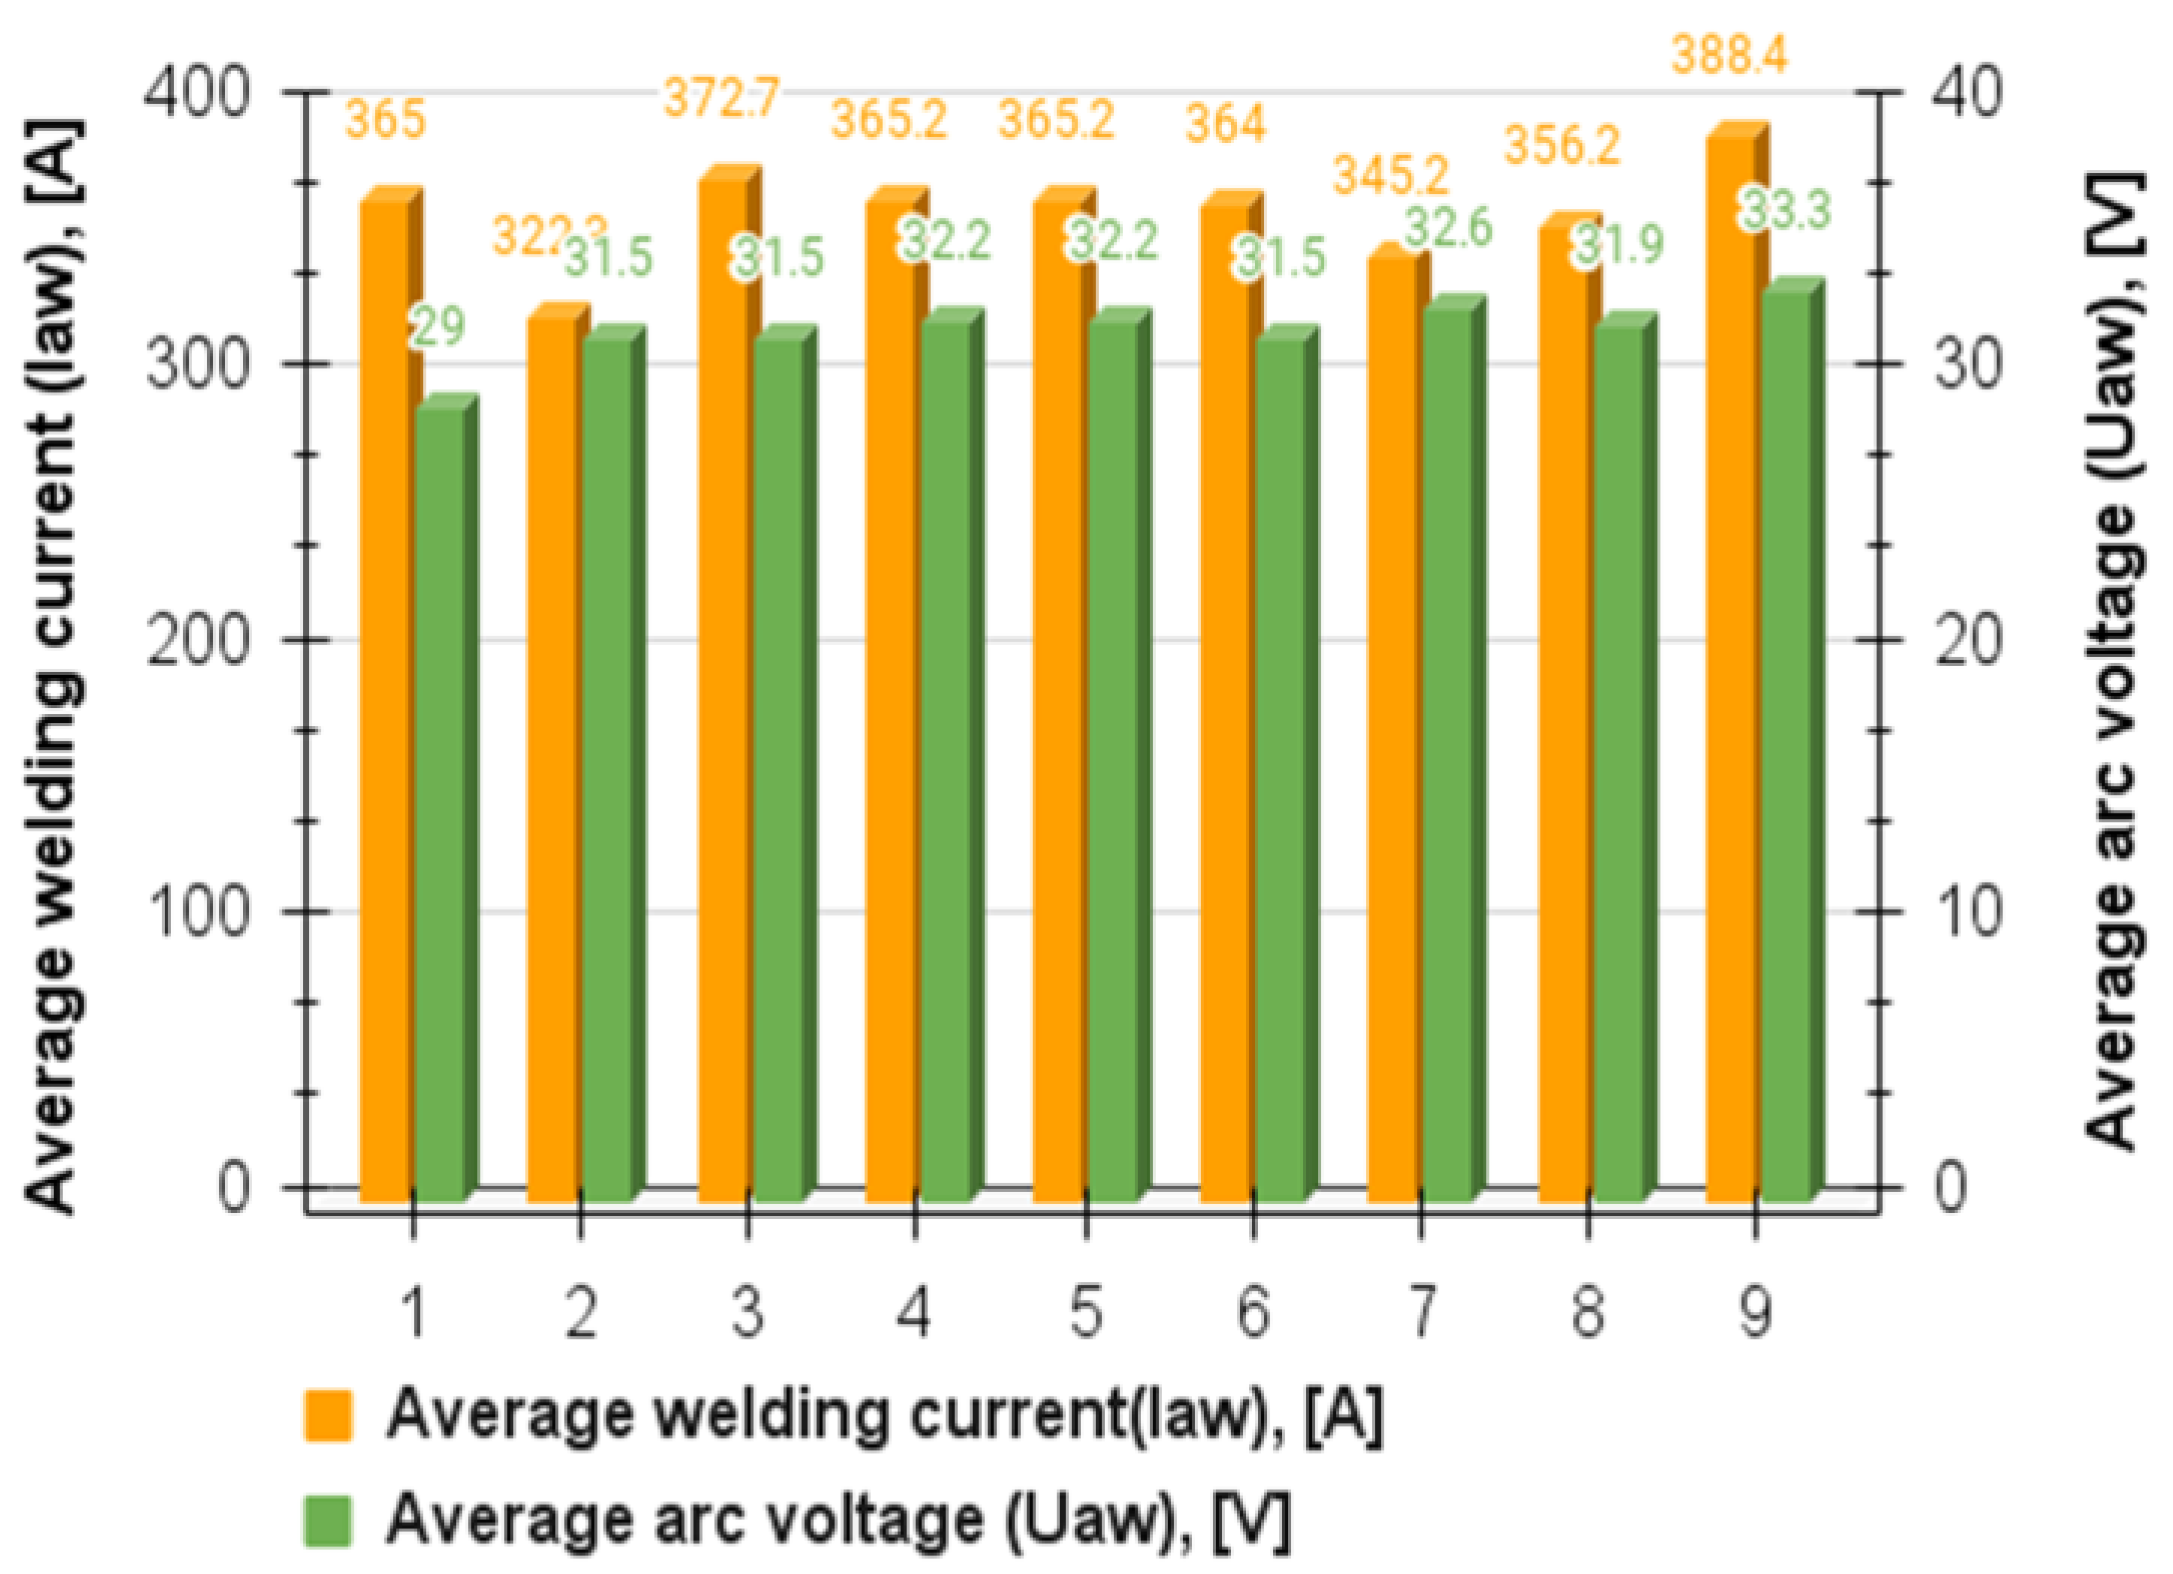
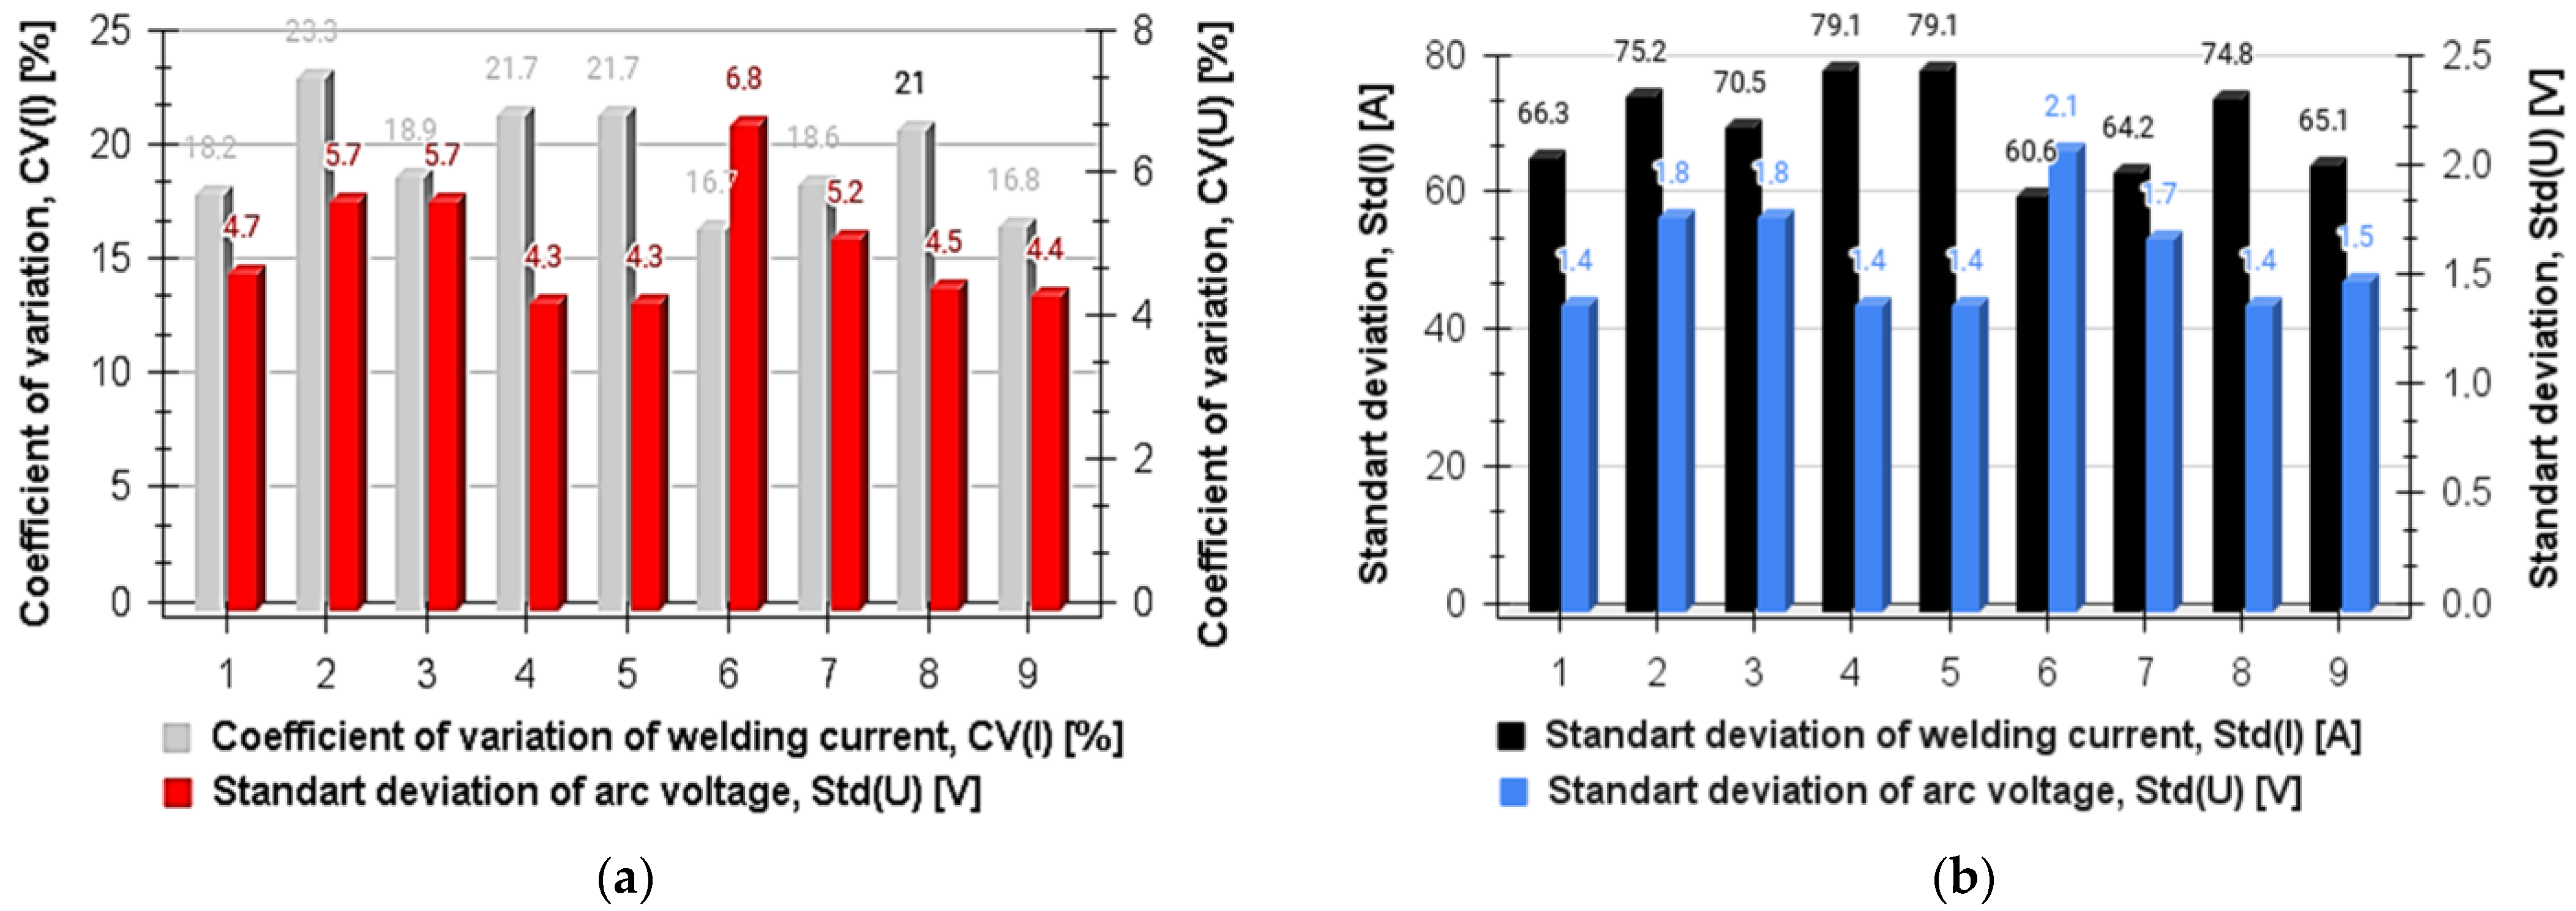
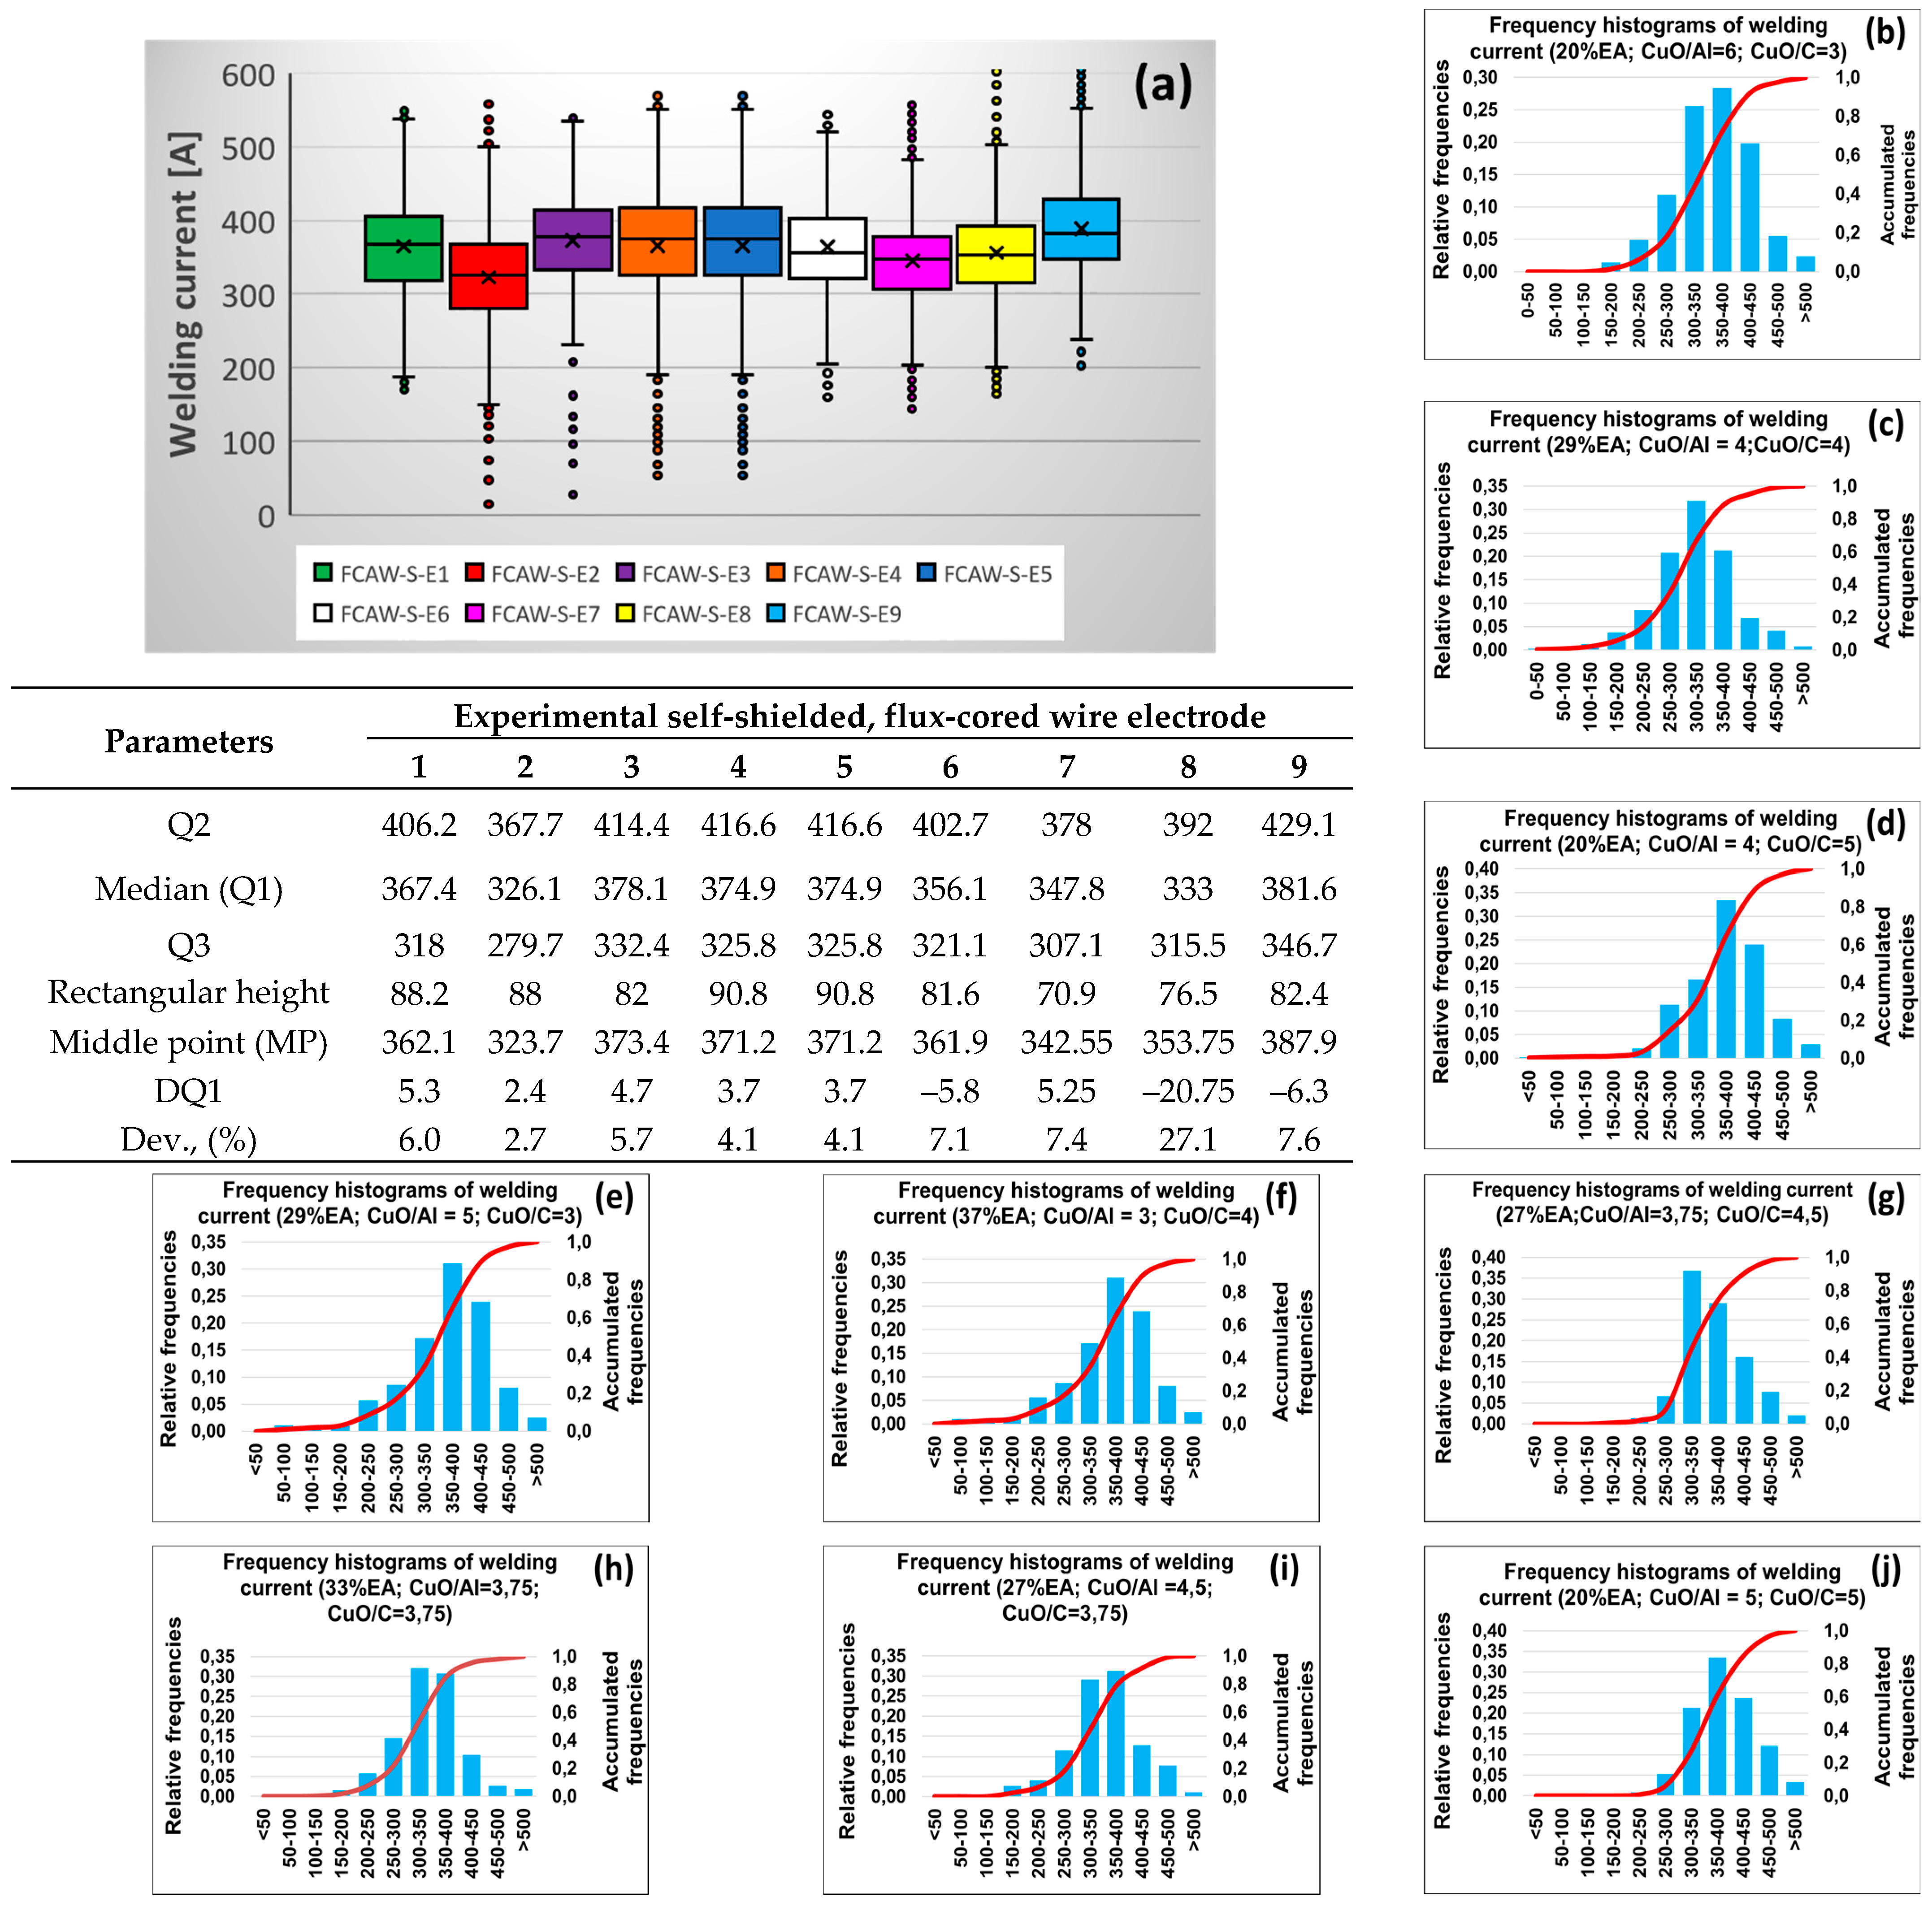
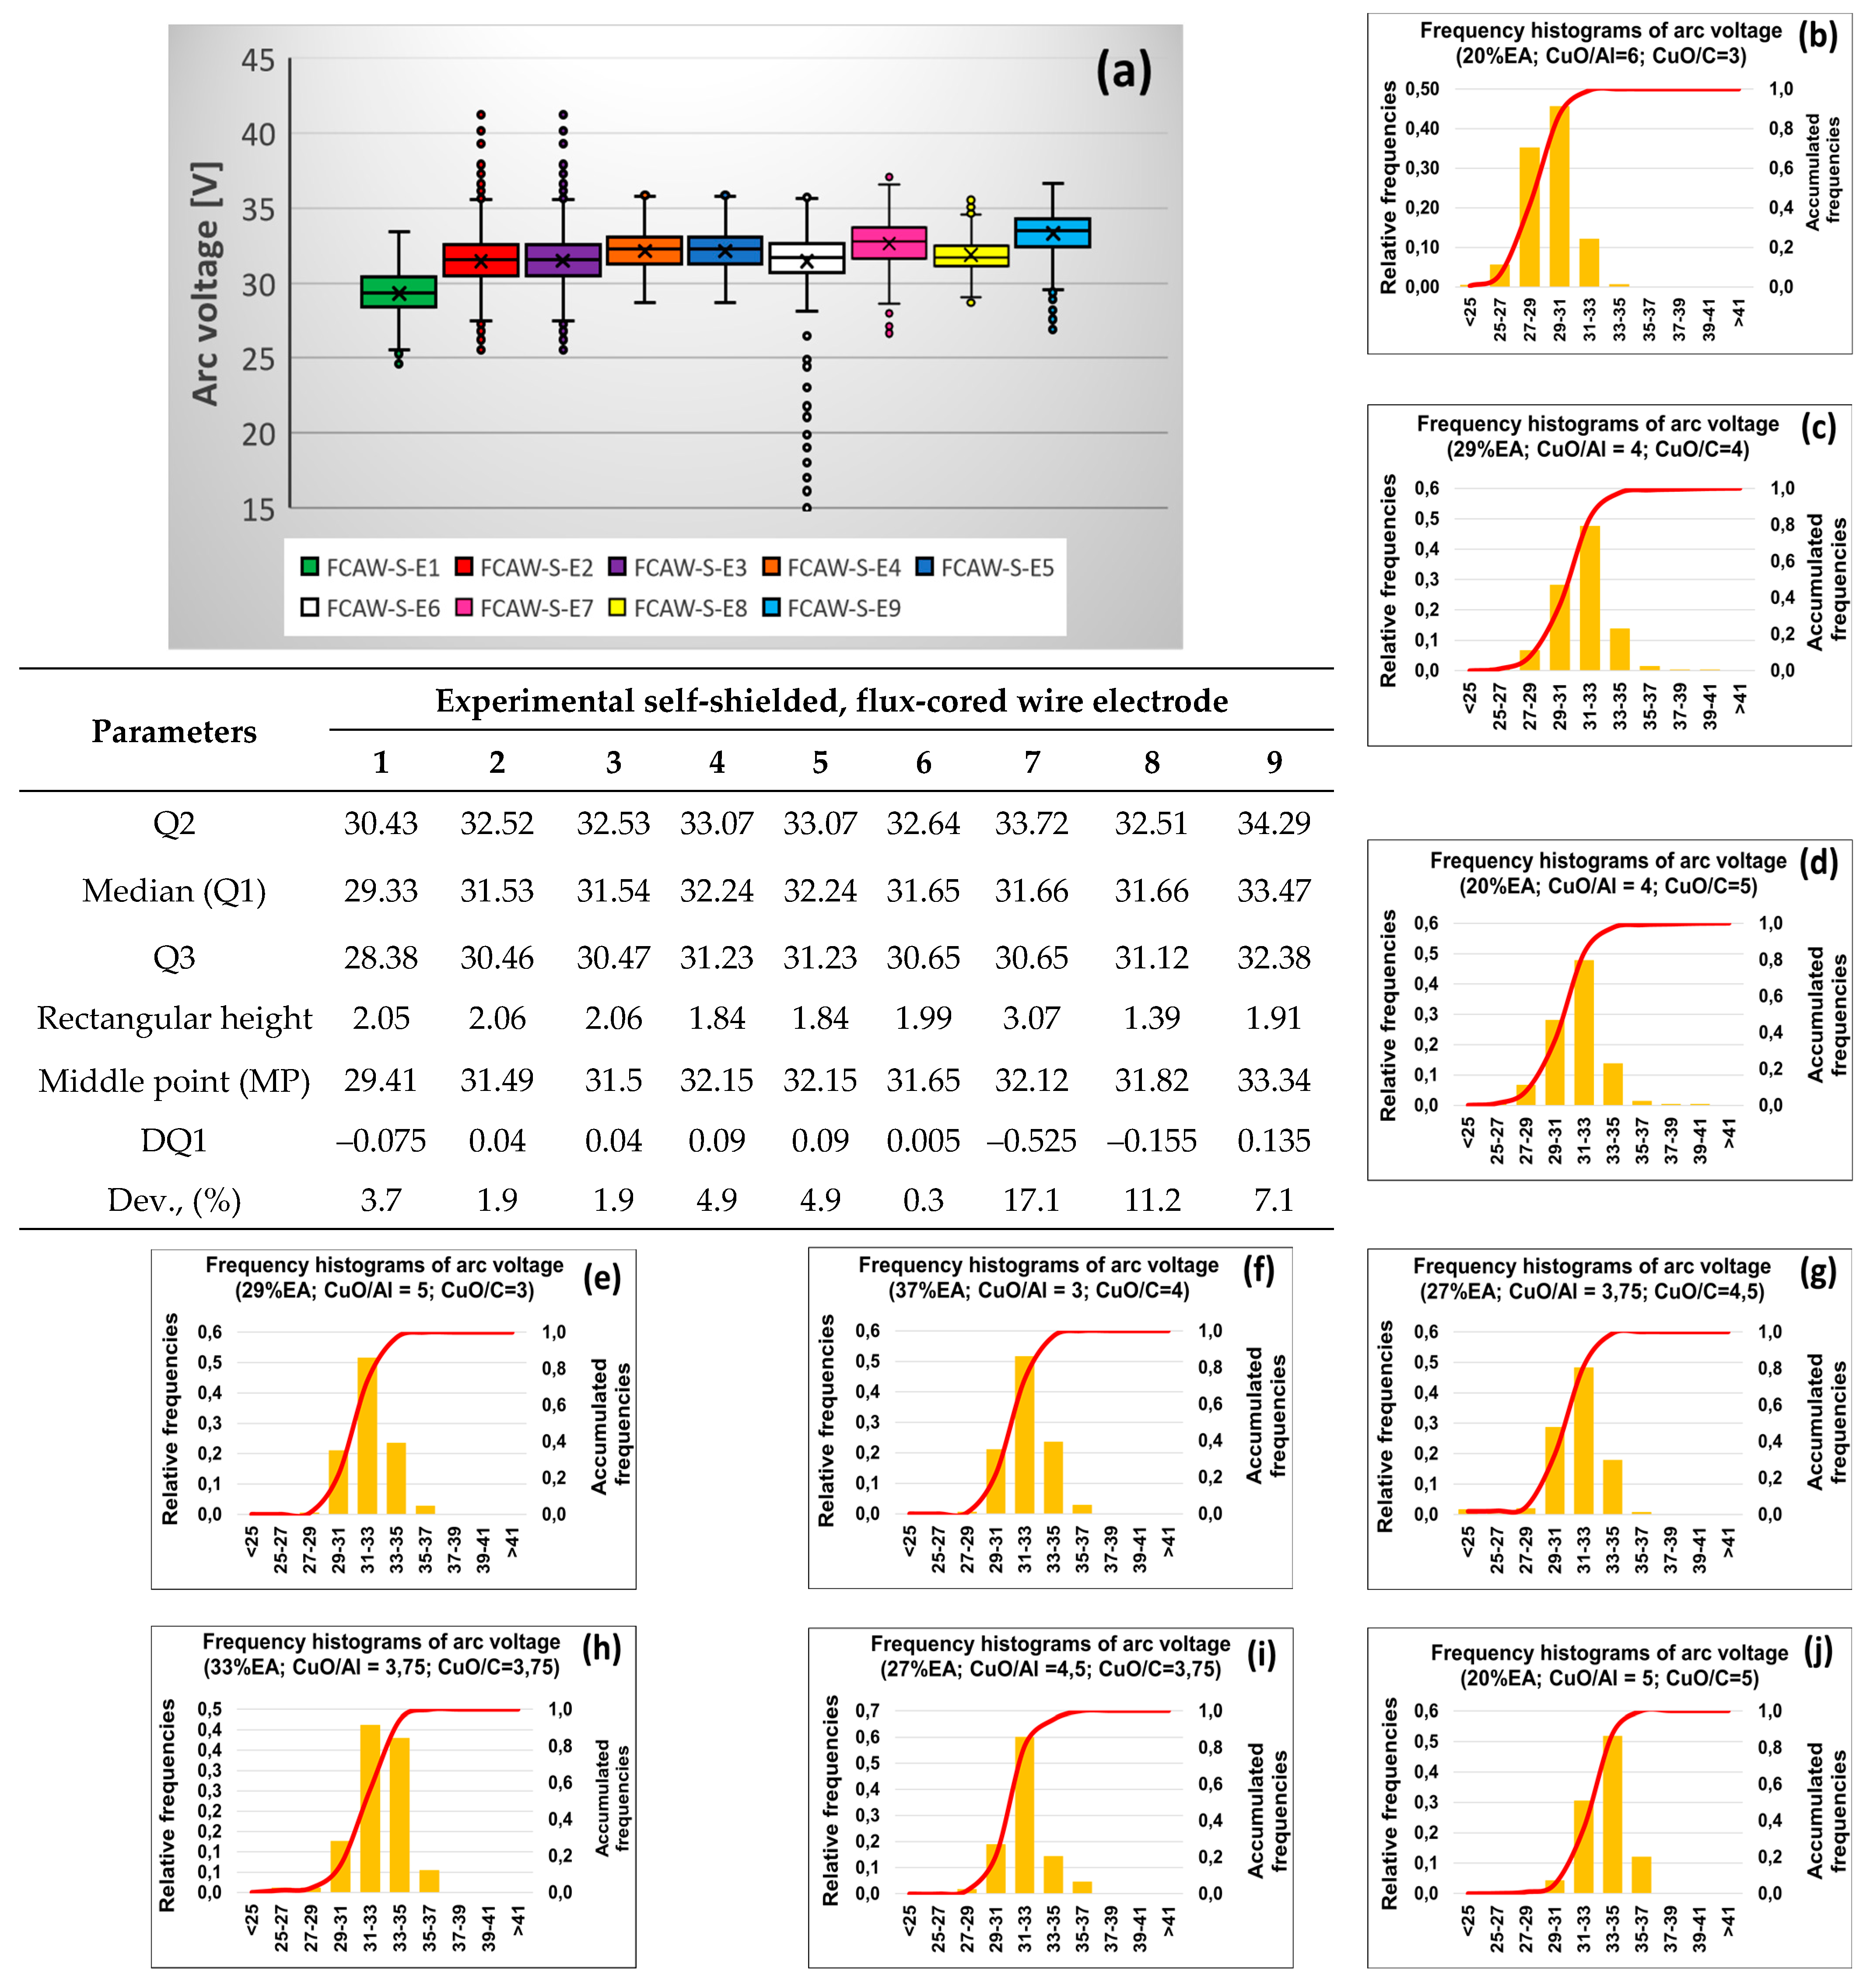
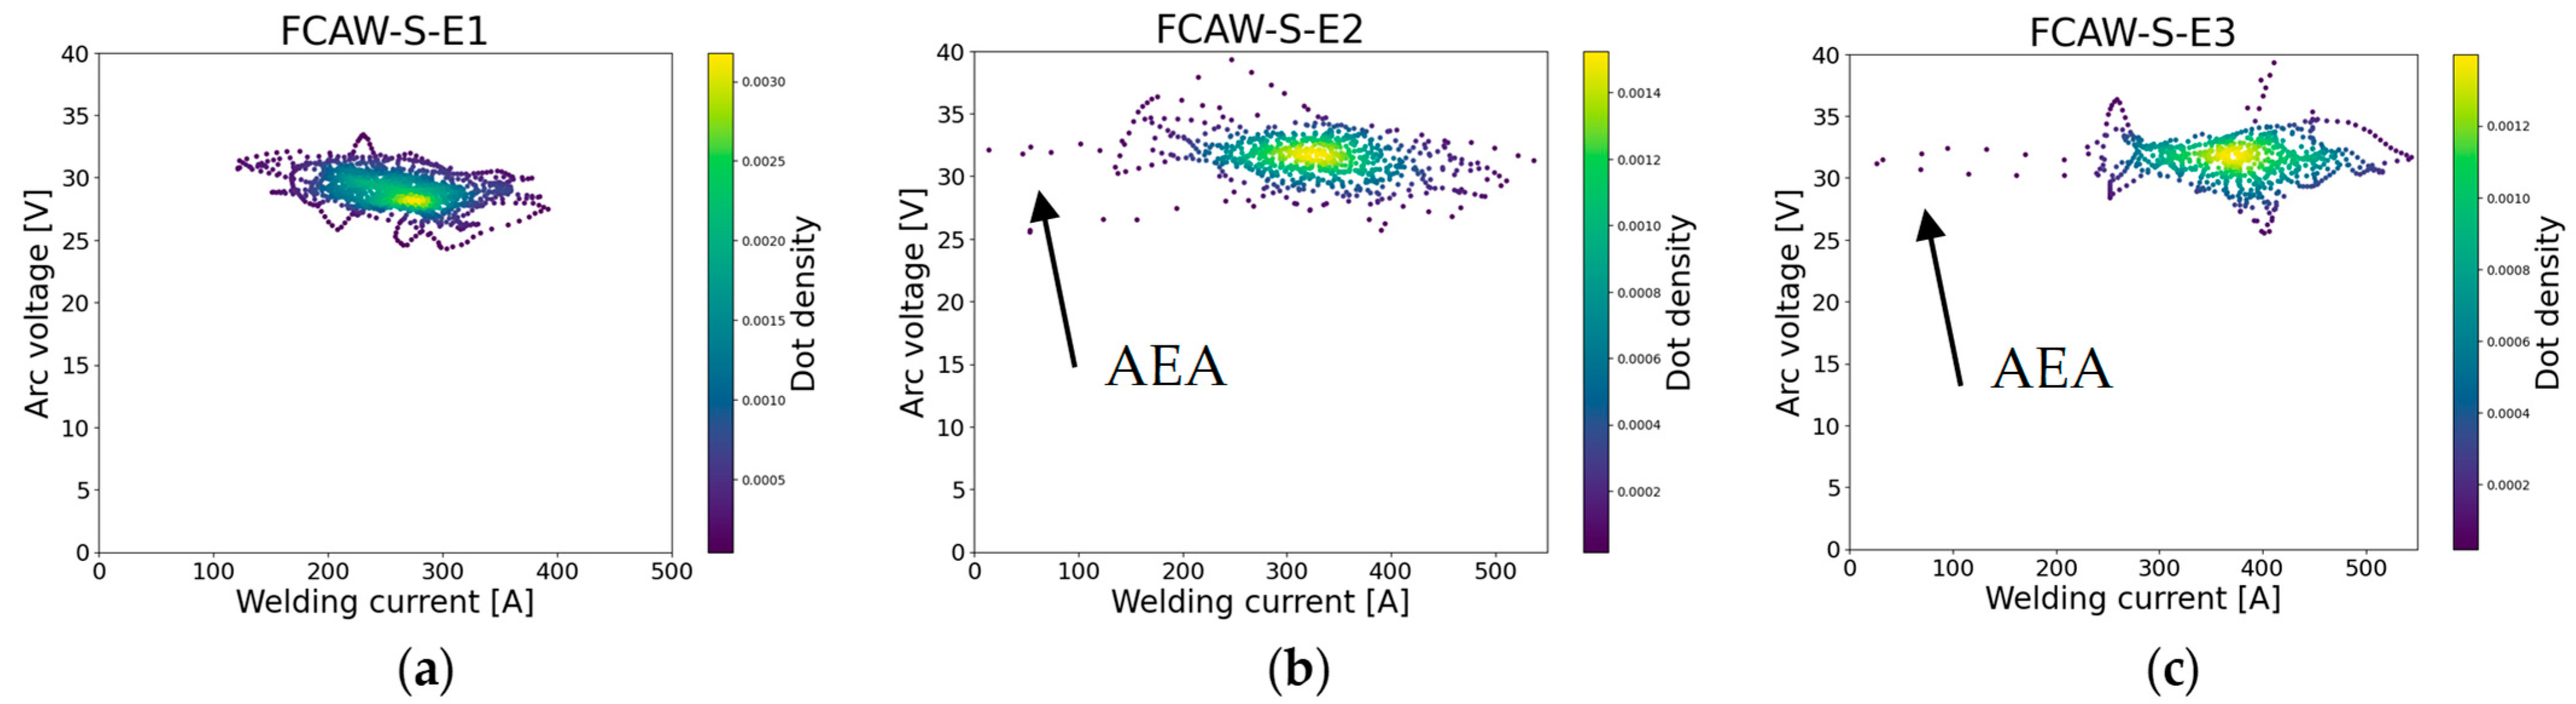
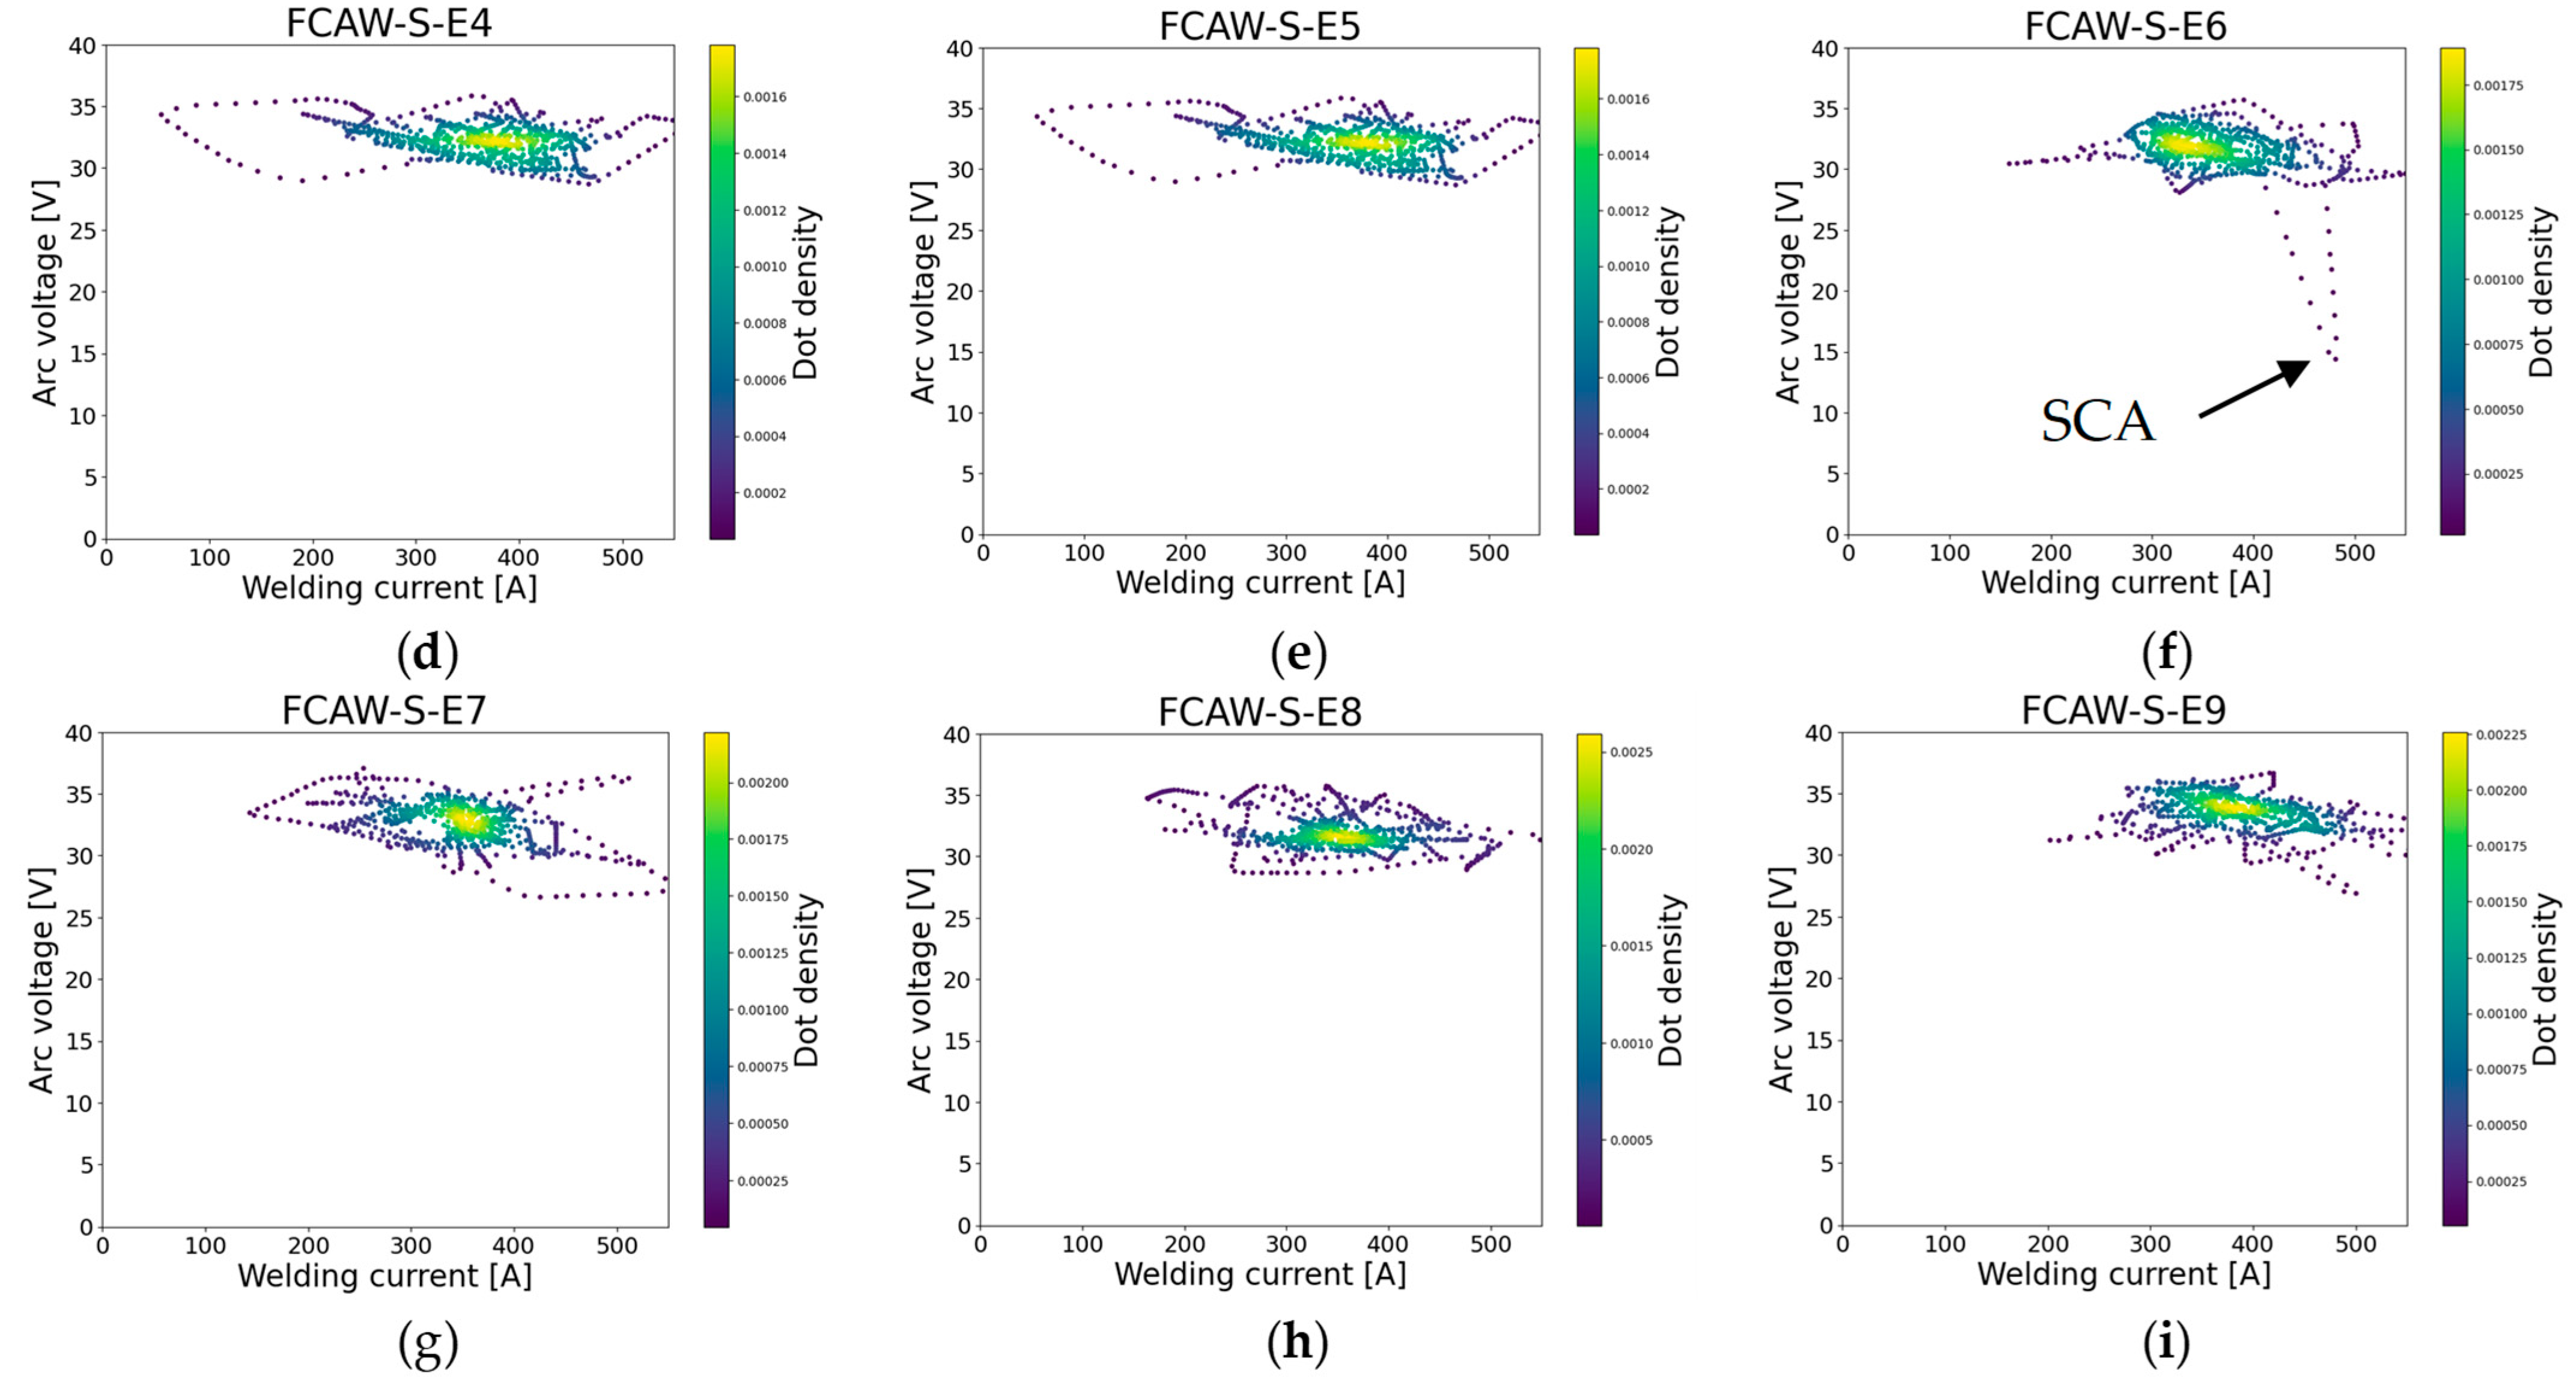
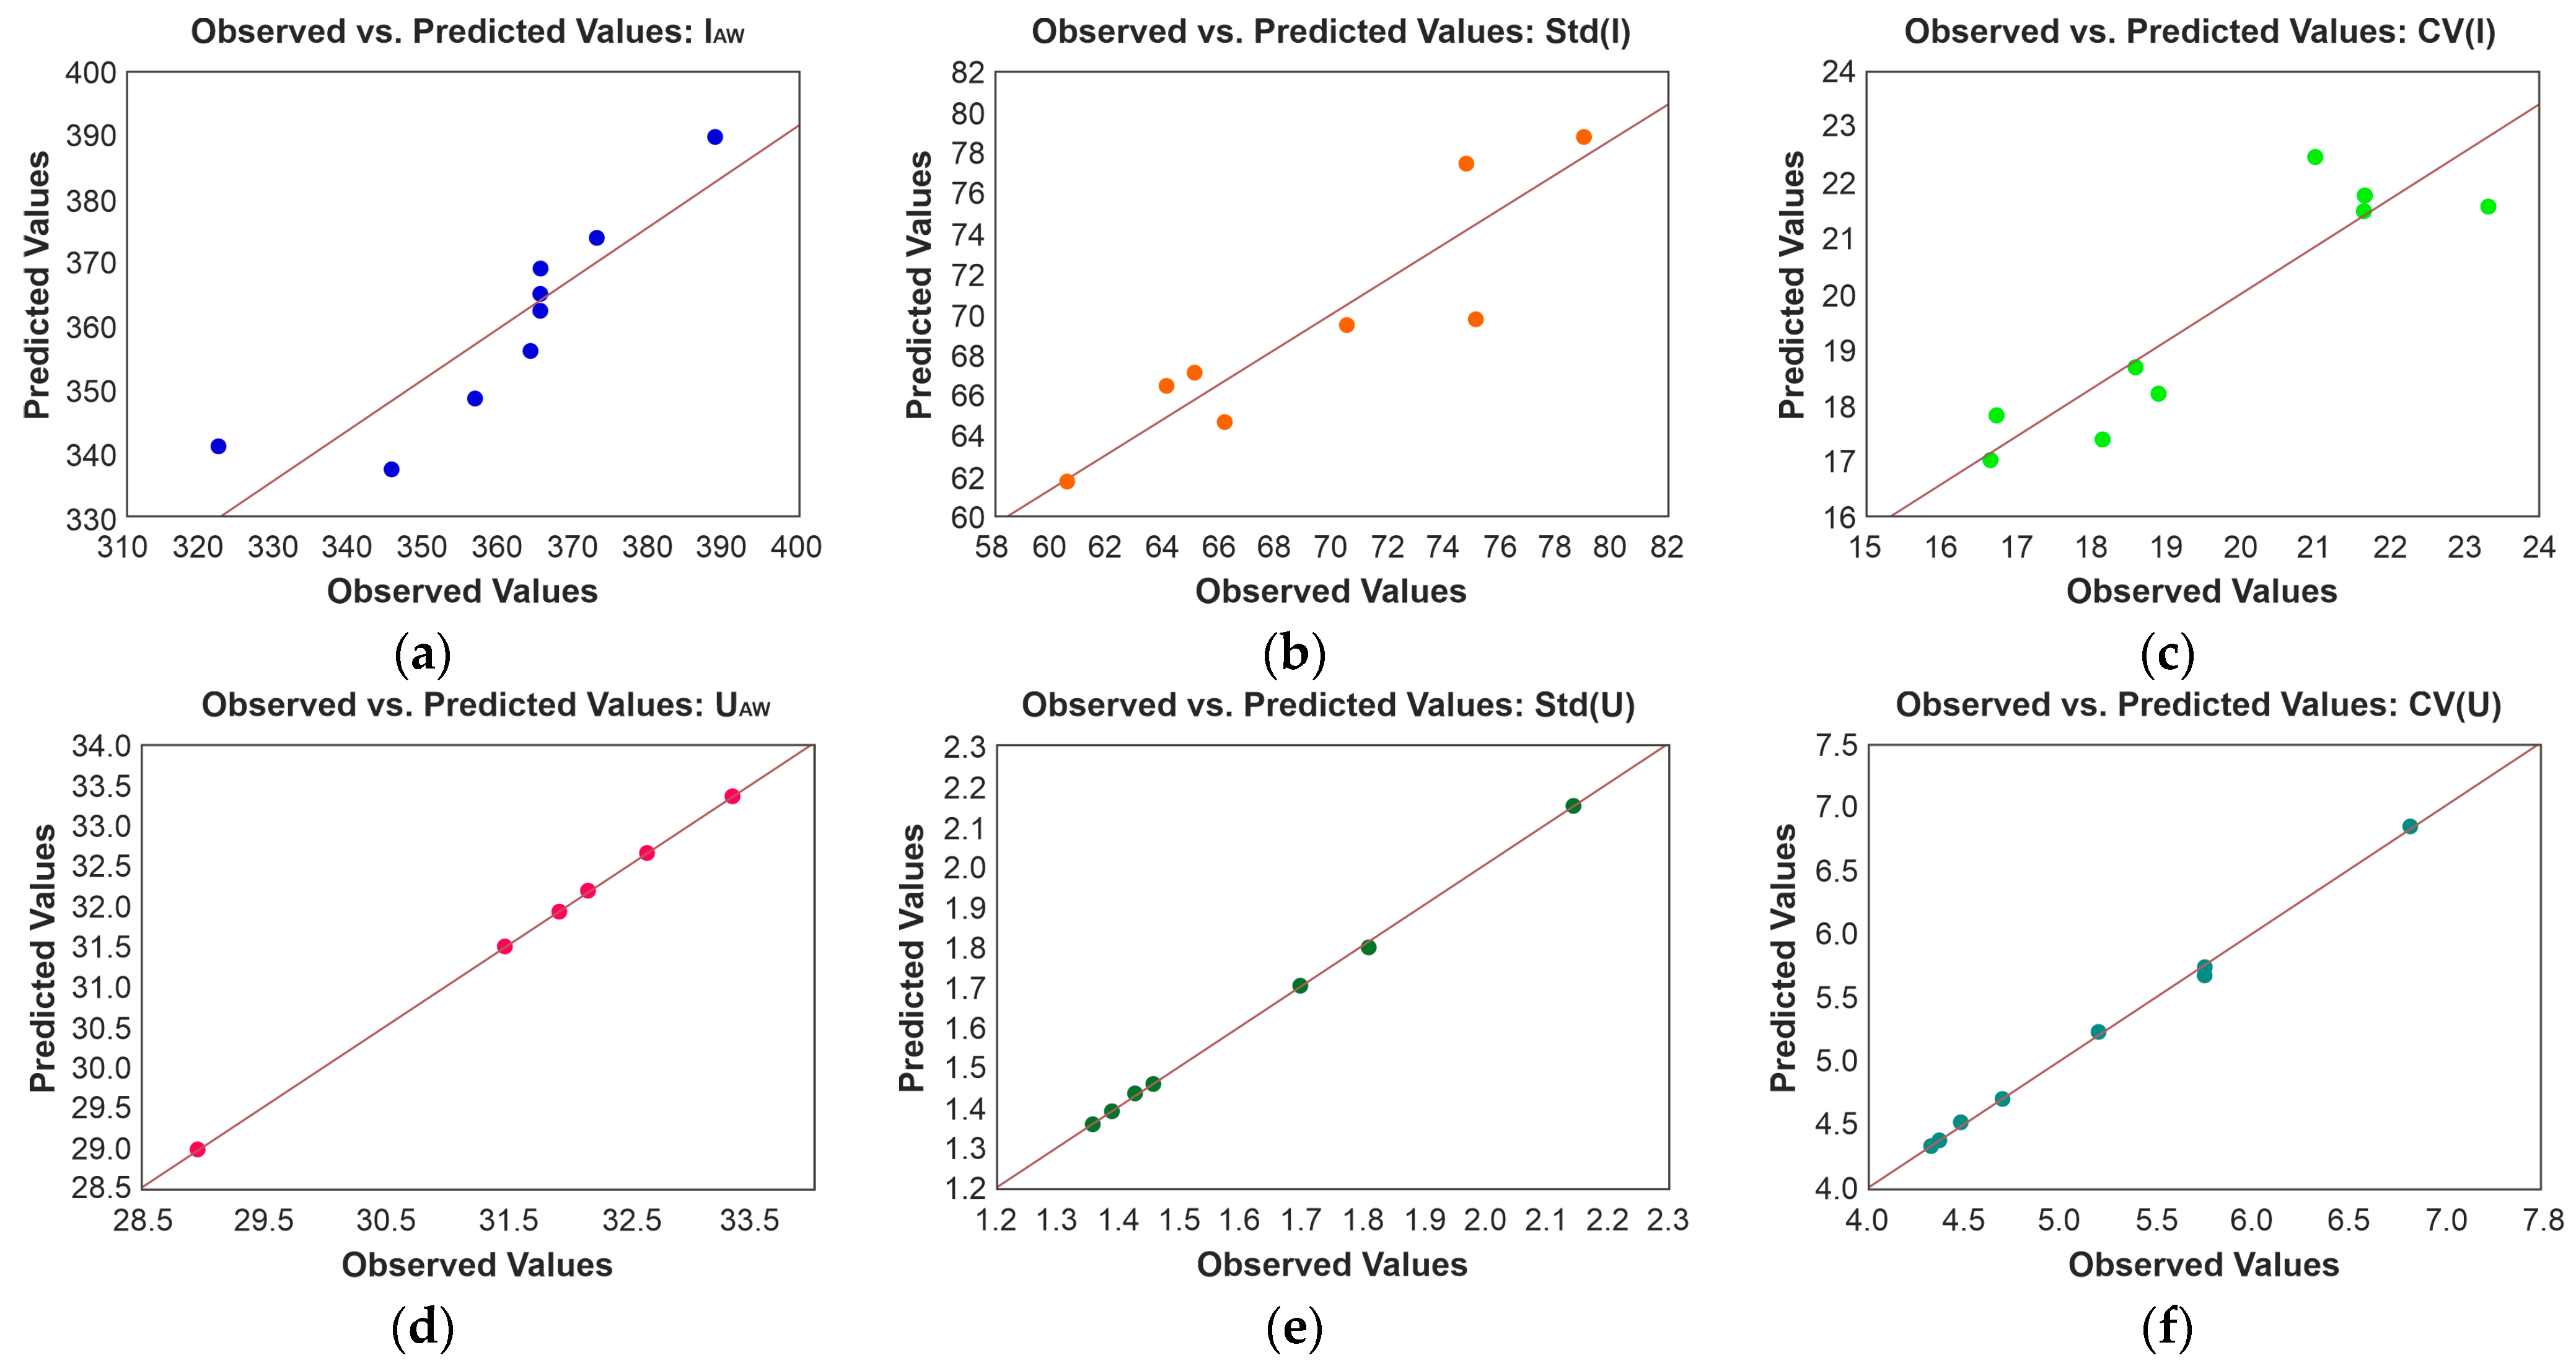
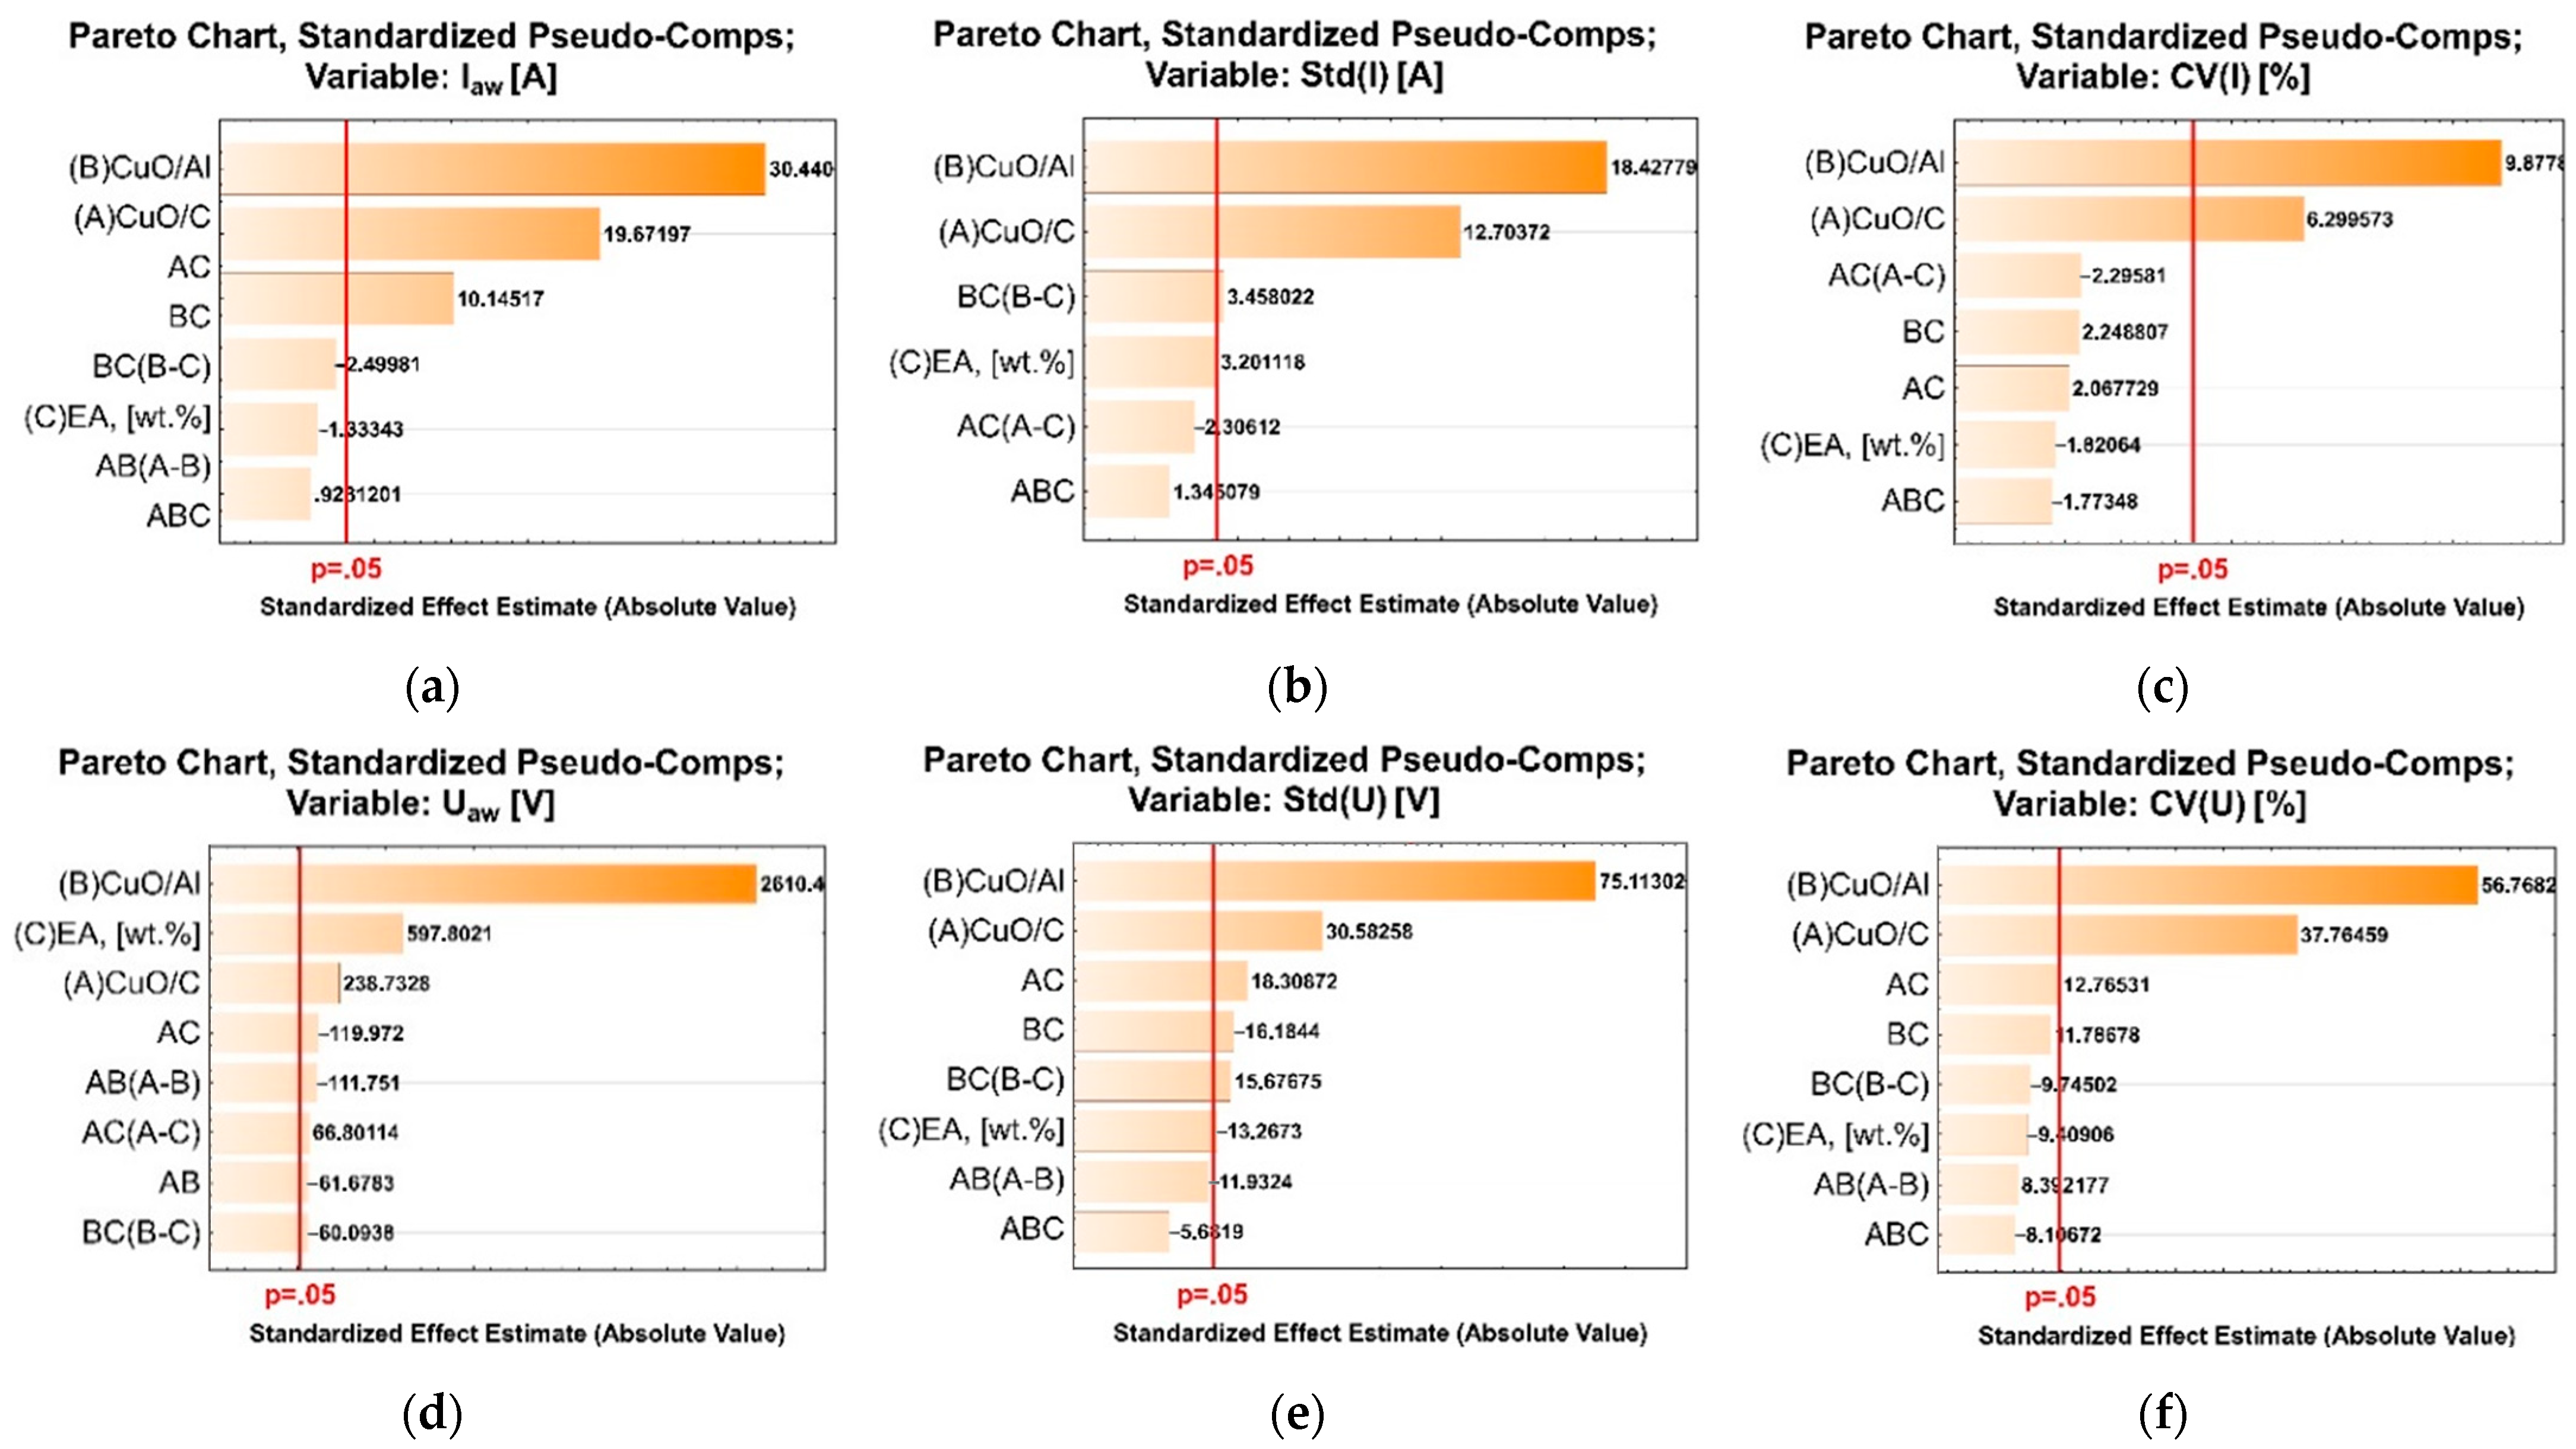


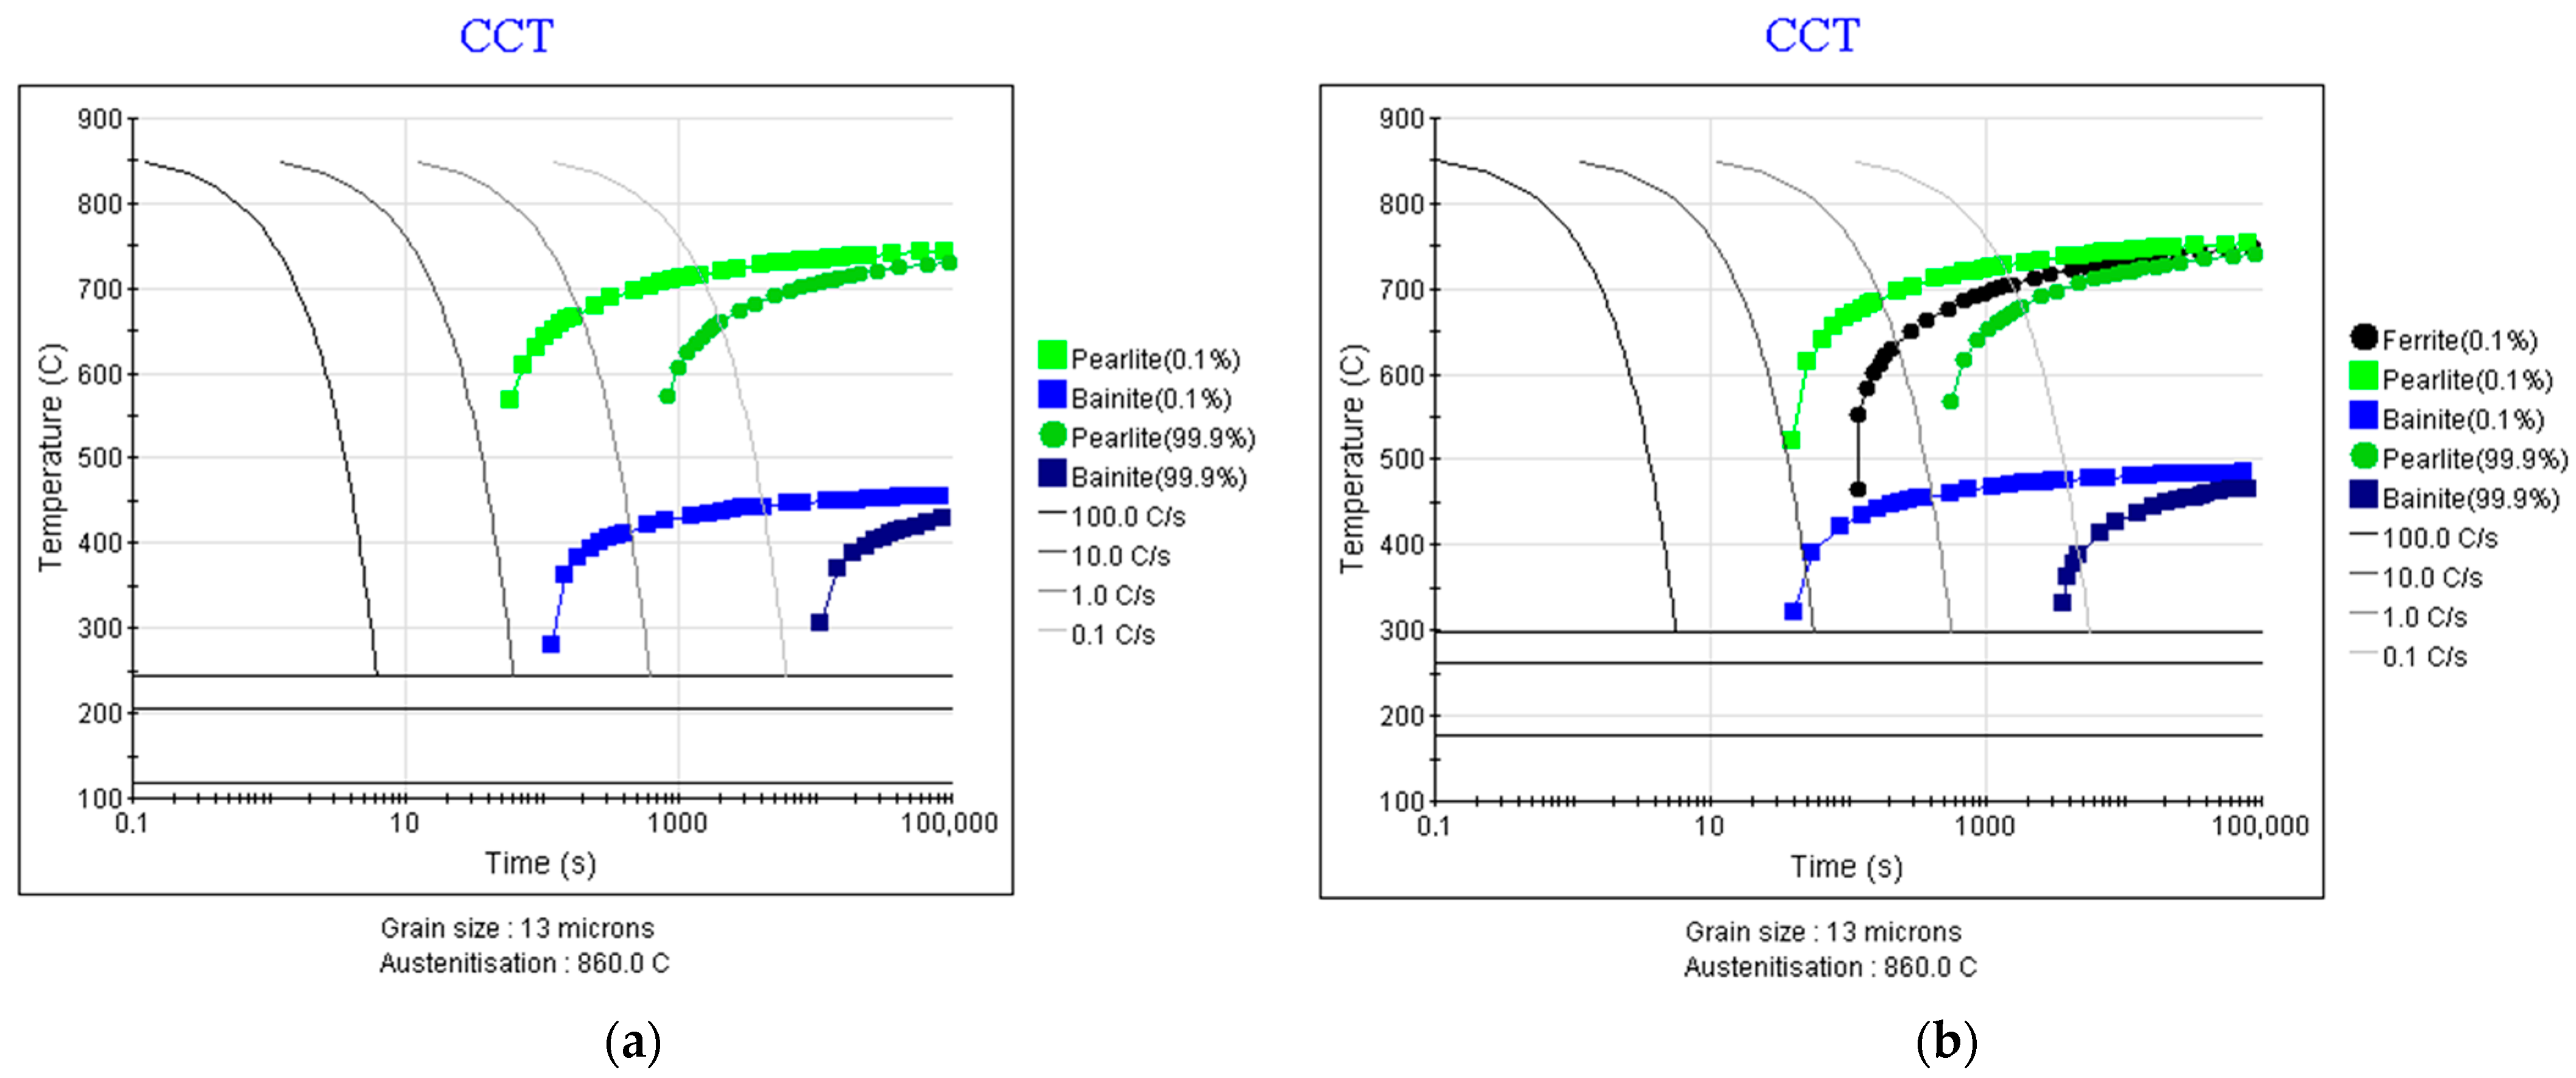
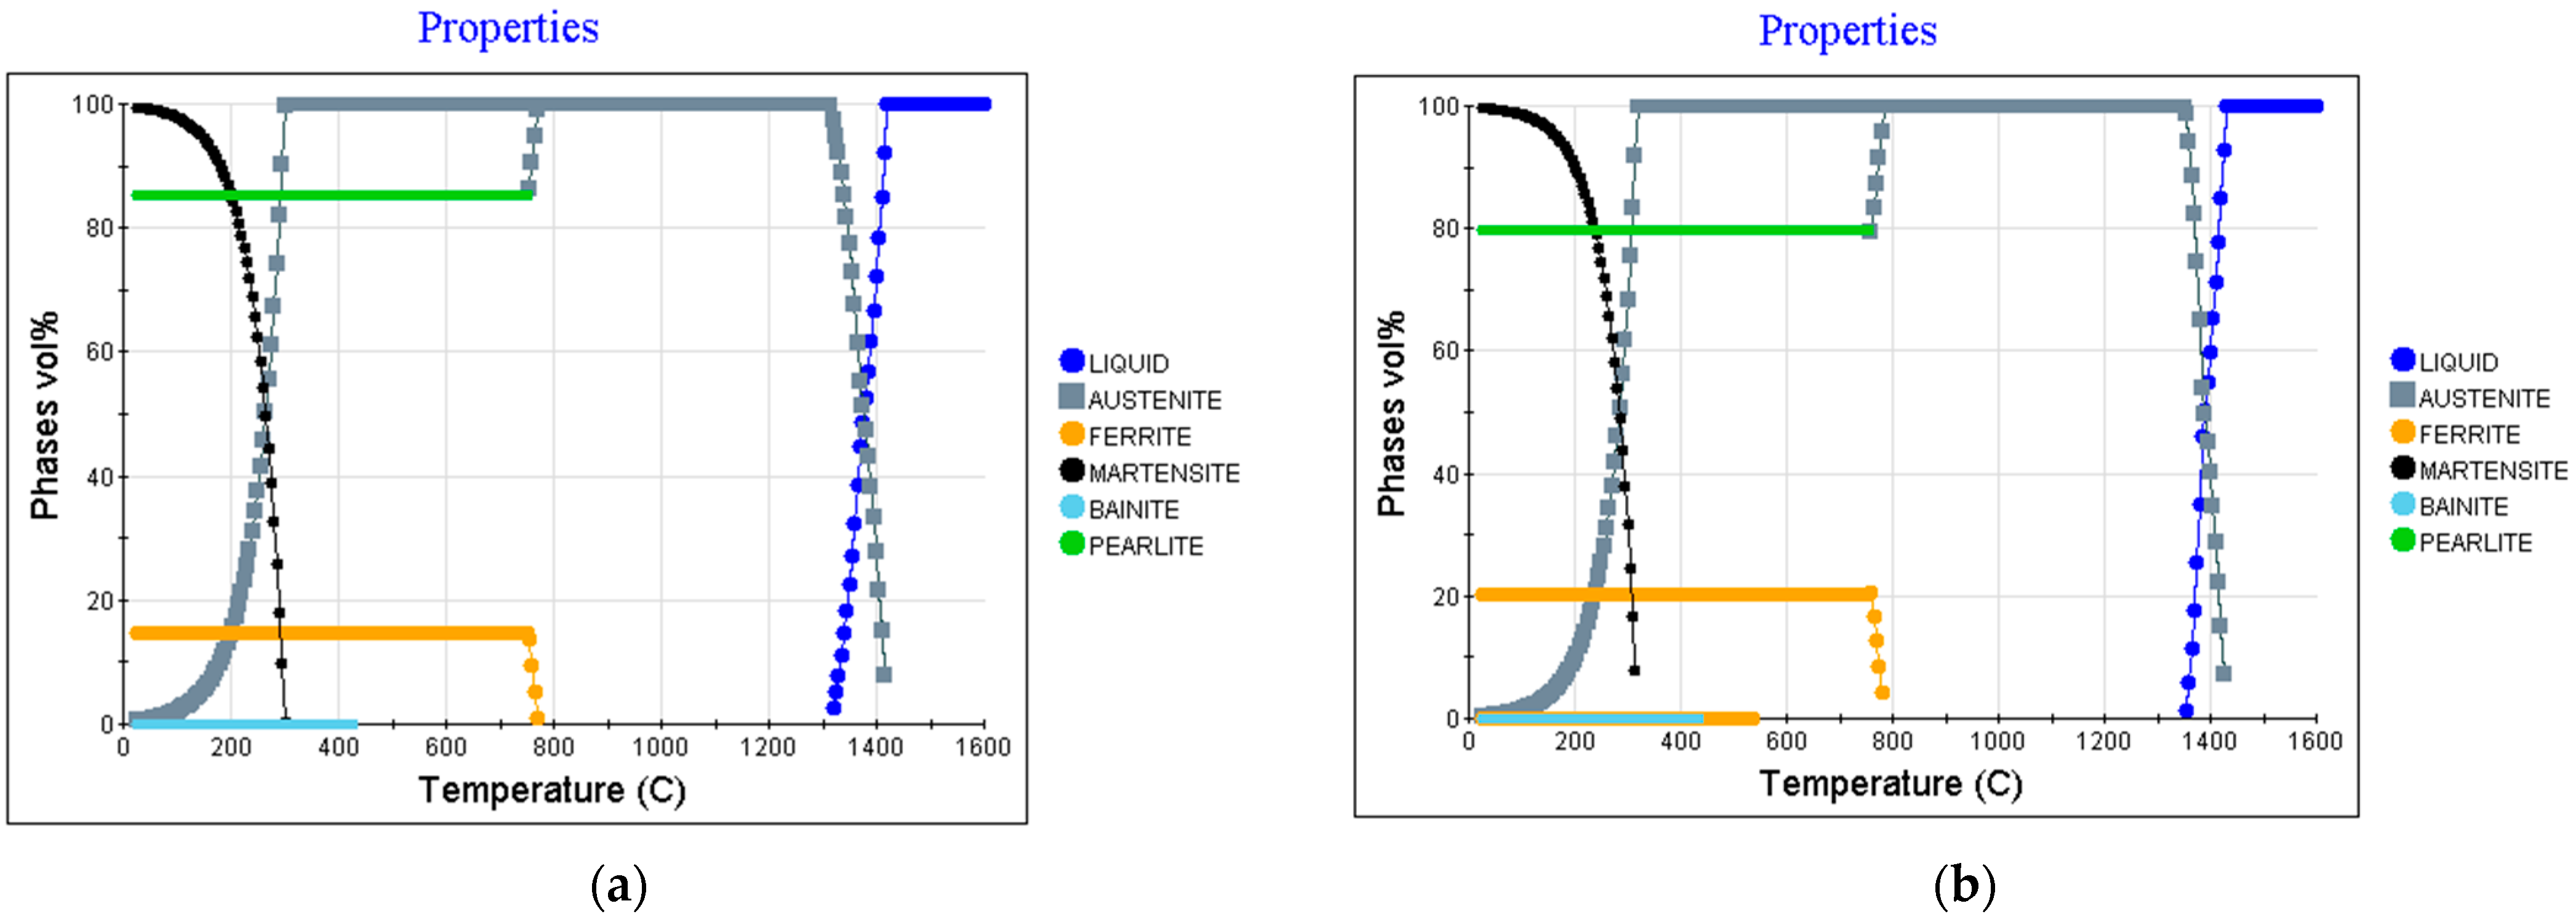
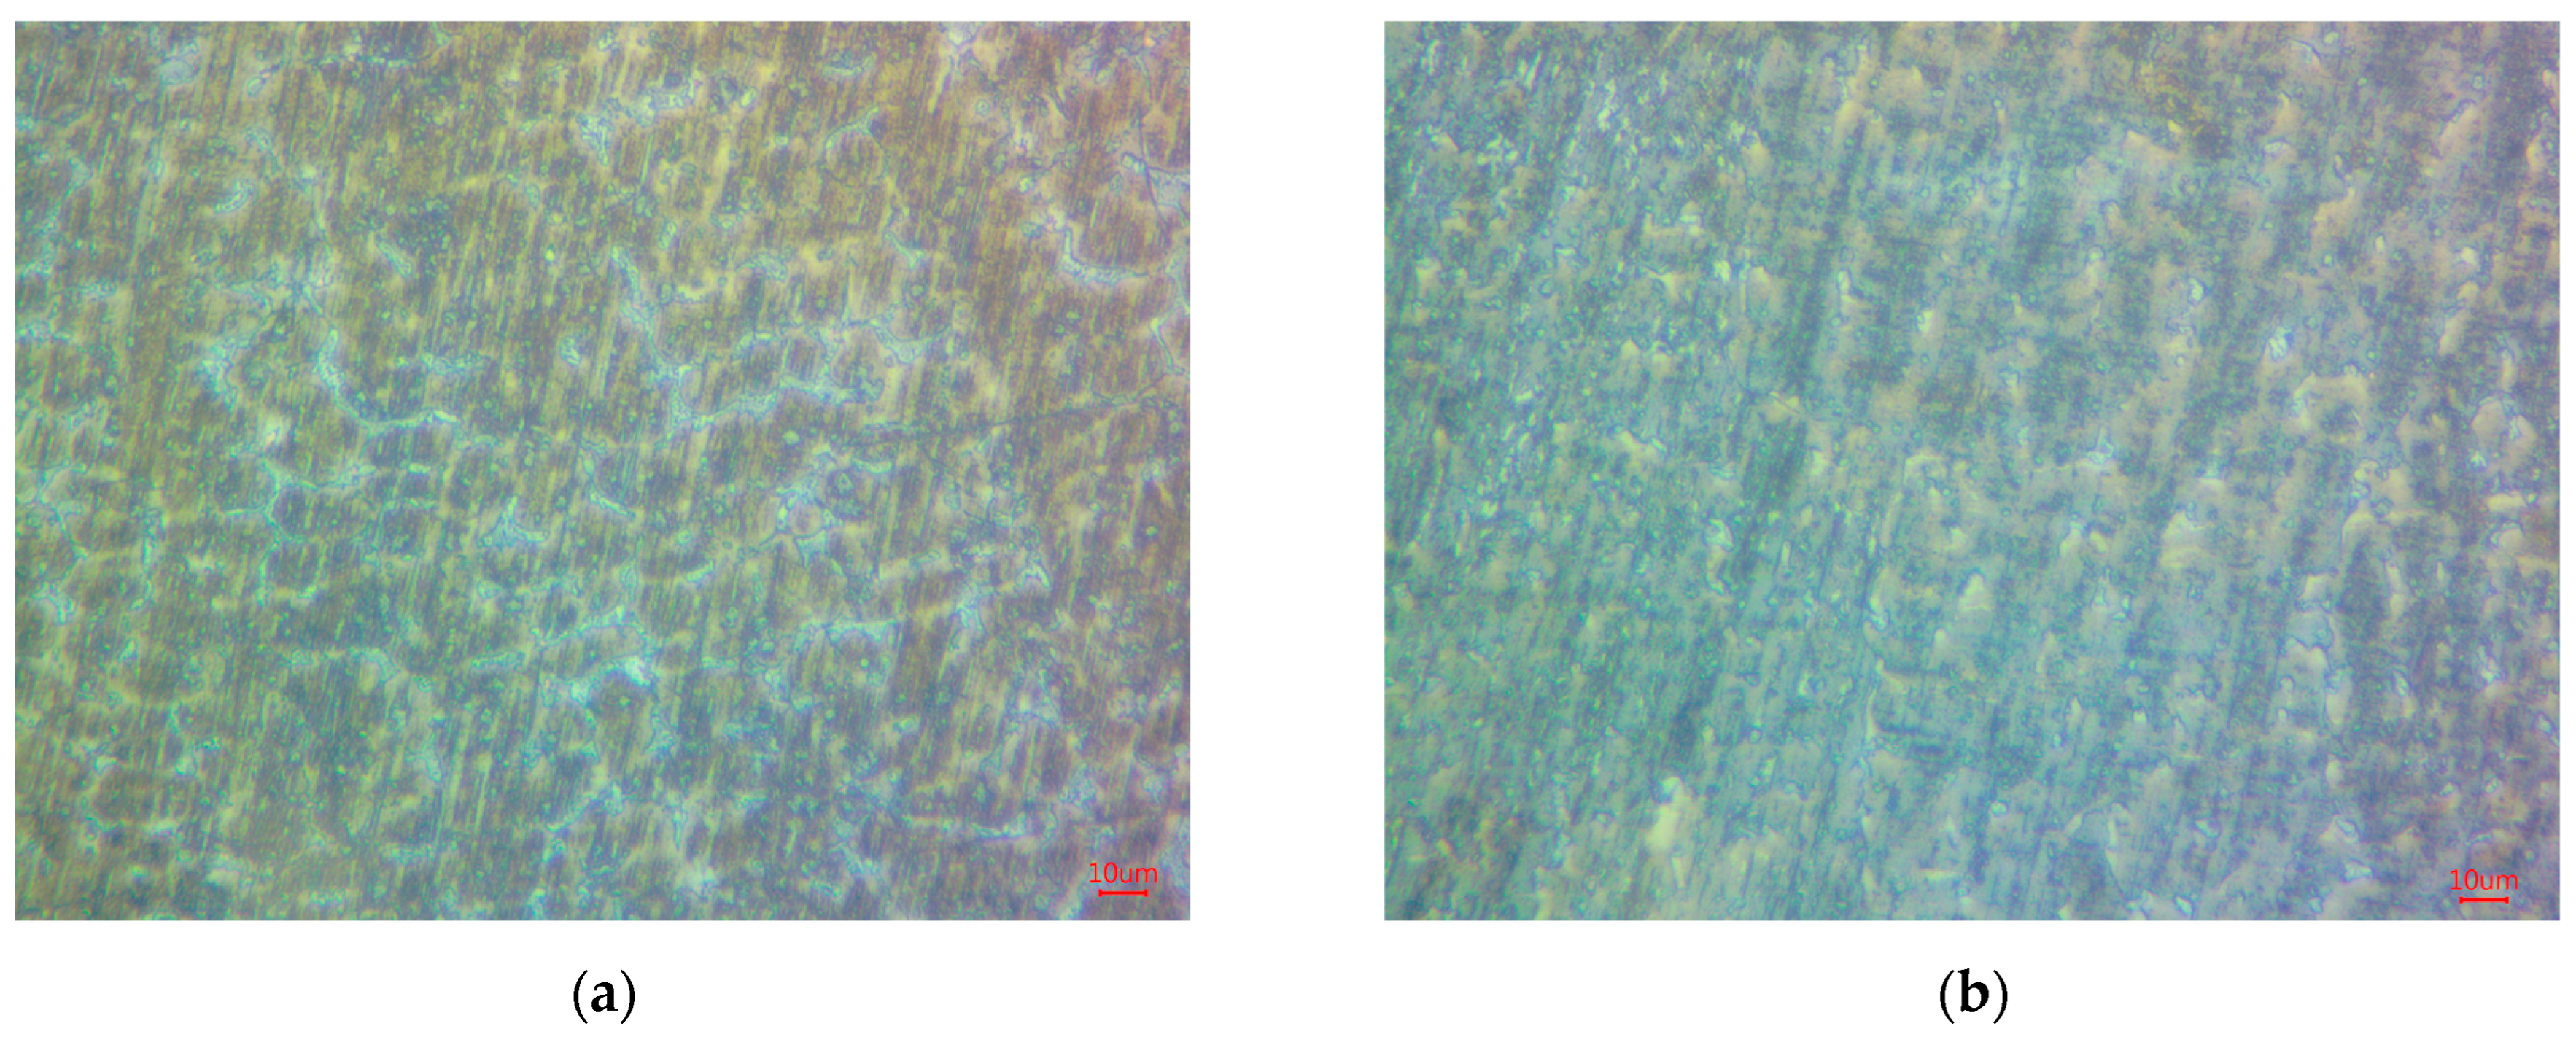
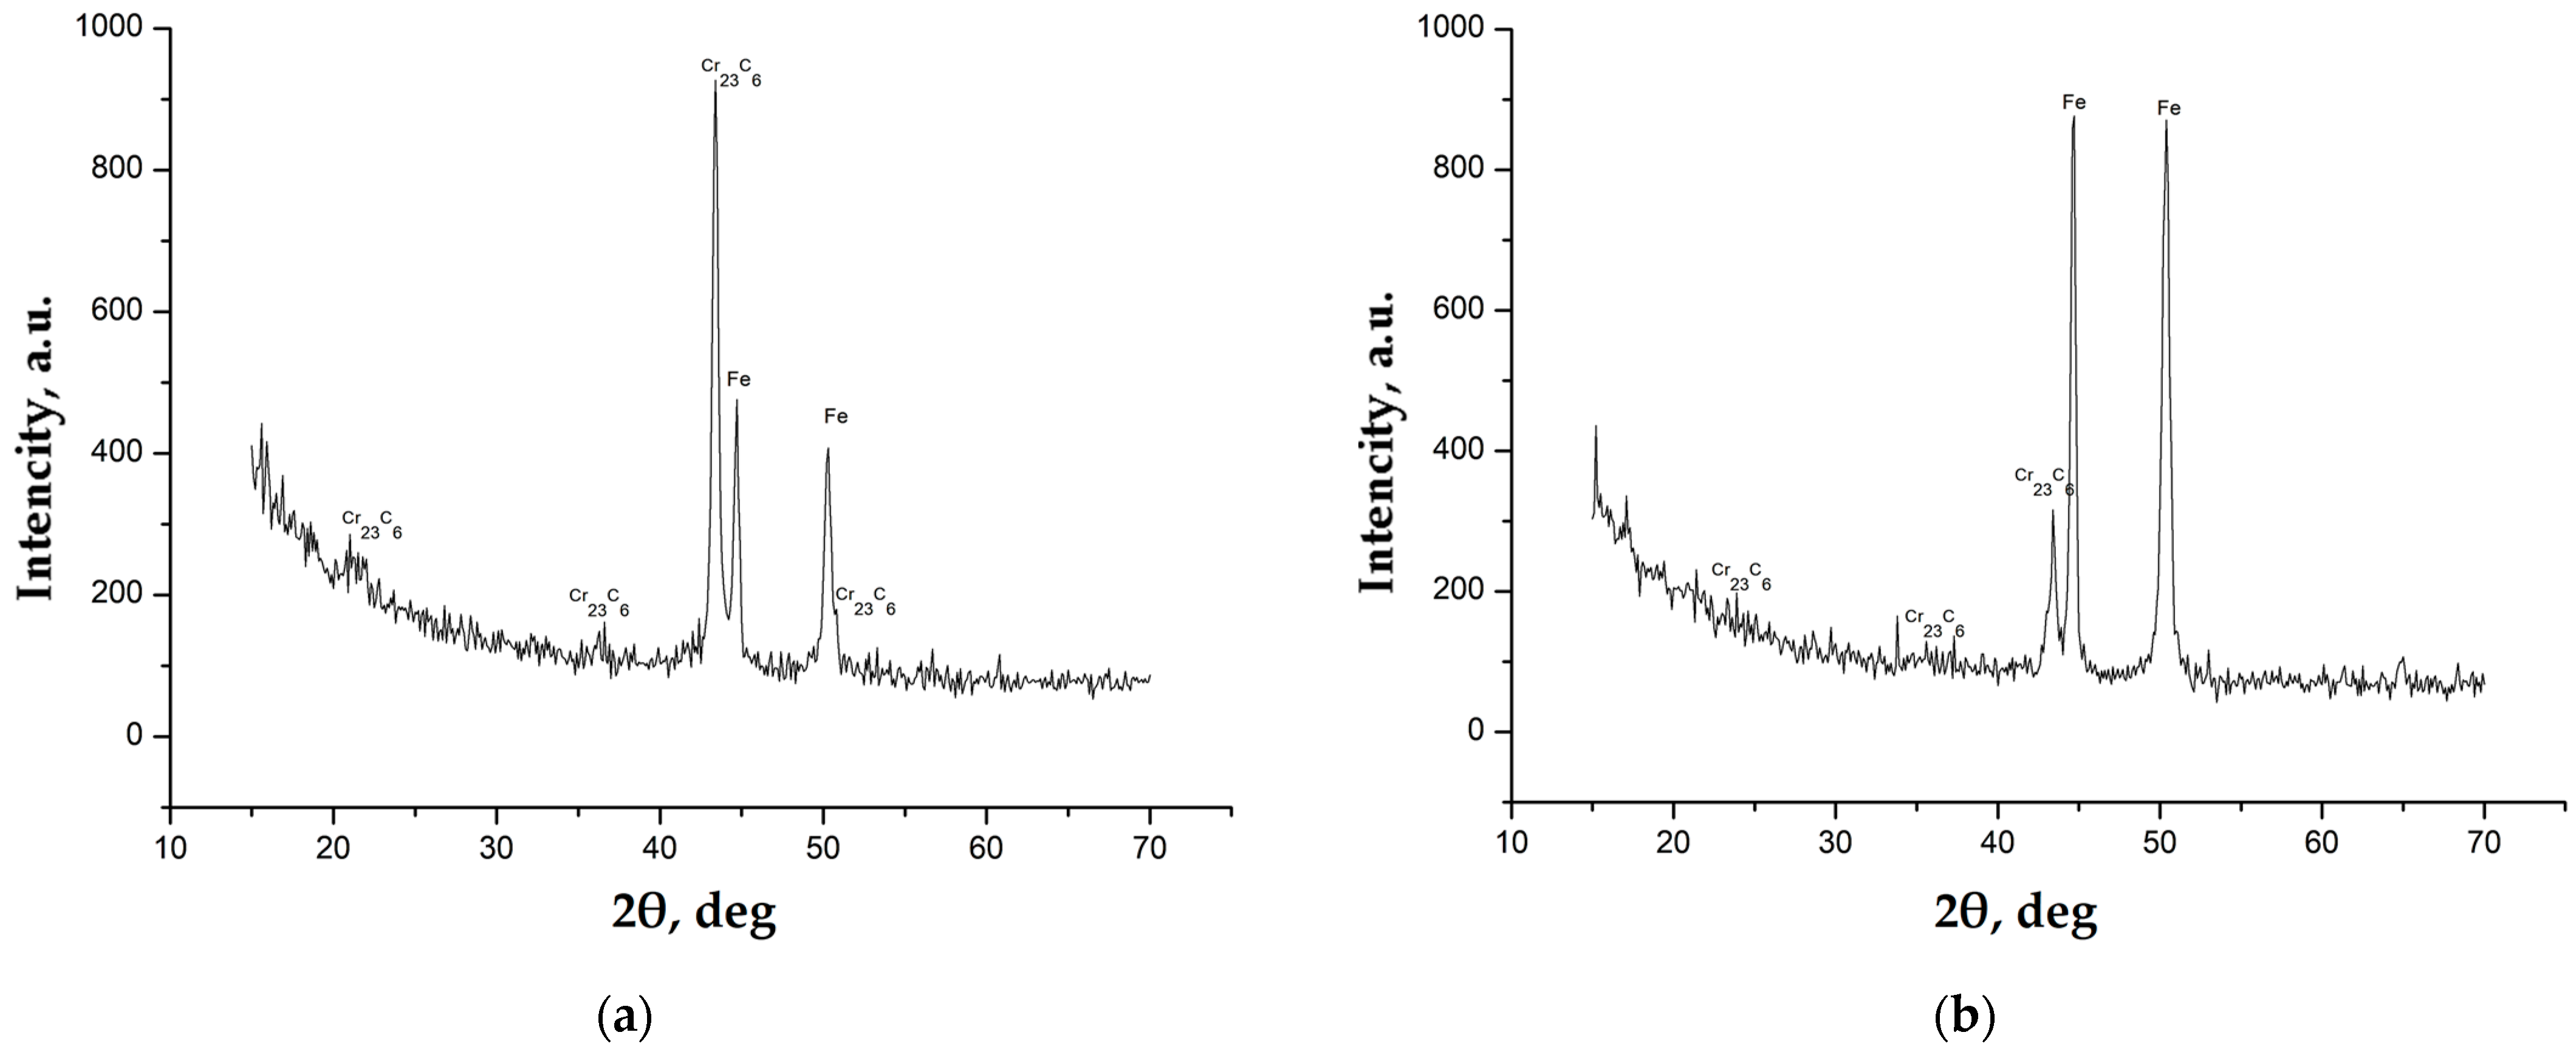
Disclaimer/Publisher’s Note: The statements, opinions and data contained in all publications are solely those of the individual author(s) and contributor(s) and not of MDPI and/or the editor(s). MDPI and/or the editor(s) disclaim responsibility for any injury to people or property resulting from any ideas, methods, instructions or products referred to in the content. |
© 2024 by the authors. Licensee MDPI, Basel, Switzerland. This article is an open access article distributed under the terms and conditions of the Creative Commons Attribution (CC BY) license (https://creativecommons.org/licenses/by/4.0/).