1. Introduction
For many decades, rare earth orthoborates REBO
3 have been of tremendous scientific interest due to their outstanding optical properties. They exhibit, e.g., a rather large optical band gap and are thus transparent down to the vacuum ultraviolet (VUV) range. Moreover, they display a large optical damage threshold and high luminescence efficiency for the dopants Ce
3+, Eu
3+, Gd
3+, and Tb
3+. Hence, they were frequently used for various practical applications, like in gas discharge lamps, radiation detectors, and plasma display panels [
1,
2,
3].
One important member of the rare earth ortho-borates is LuBO
3 due to its excellent scintillating properties [
4,
5]. LuBO
3 can crystalize in the calcite structure (
), or vaterite structure (
if it is heated above 1310 °C [
6]. Trivalent cations are octahedrally coordinated in both structures, and an additional 12-coordinated site is available in the vaterite structure [
7]. The symmetry of the cation environment decreases accordingly with the phase change [
8]. Therefore, researchers have investigated different synthesis methods, such as the solid-state reaction, sol−gel method, or hydrothermal approach, to yield the desired crystal structure, particle size, and morphology [
9]. Despite these efforts and the relevance of LuBO
3 as a host lattice for optical materials, the photoluminescence of various LuBO
3:RE
3+ were not systematically studied. This paper coherently presents, to the best of our knowledge, the excitation, emission, X-ray-excited emission, energy-dependent emission, and temperature-dependent emission properties of LuBO
3:RE
3+ with RE = Ce
3+, Eu
3+, Gd
3+, and Tb
3+ for the first time.
2. Experimental Section
A series of several microscale powder samples of the compound LuBO3, substituted with 1% each of Ce, Eu, Gd, and Tb (e.g., Lu0.99Ce0.01BO3), were prepared by the solid-state method. For this purpose, stoichiometric amounts of Lu2O3 (Treibacher Industrie AG, Althofen, Austria, 99.9%) and, depending on the activator ion used, CeO2 (Treibacher Industrie AG, Althofen, Austria, 99.9%), Eu2O3 (Treibacher Industrie AG, Althofen, Austria, 99.9%), Gd2O3 (Treibacher Industrie AG, Althofen, Austria, 99.9%), and Tb4O7 (Treibacher Industrie AG, Althofen, Austria, 99.9%) were weighed in. In addition, H3BO3 (Merck KGaA Darmstadt, Germany) was added to the solid solution with an excess of 20%.
The precursors were thoroughly mixed in a mortar with acetone and then homogenized. After the acetone has completely evaporated, the reactant mixture was transferred to a corundum crucible and calcined at 1200 °C for 12 h.
The reaction atmosphere was adjusted to the corresponding activator ions. Eu3+, Gd3+, and Tb3+ were heated in air, while the Ce3+-doped borate was heated under CO to ensure that such oxidation sensitive trivalent ion is not oxidized. After the heating step, the products were again thoroughly triturated in a mortar.
3. Analytical Measurements
3.1. Determination of the Phase Purity
Powder X-ray diffraction (PXRD) patterns were recorded for each sample with a Rigaku Miniflex II diffractometer. The measurement geometry corresponds to the Bragg-Brentano geometry using a Cu Kα radiation source with an electrical input power of 450 W. Diffractograms were recorded between 2θ = 10–80° with a step width of 0.02°.
3.2. Particle Size Distribution
The volume-based particle size distributions were characterized via laser scattering (λ1 = 405 nm, λ2 = 650 nm). The measurements were performed with the partica LA-950V2 (HORIBA France SAS, Lyon, France) laser scattering particle size distribution analyzer. It was assumed that representative samples were taken via a random sampling due to the small batch sizes. The powders were suspended in water and underwent dual ultrasonic treatments for 2 min to mitigate agglomeration. The refractive index for each sample was approximated to be 1.626.
3.3. Reflection Spectroscopy
Diffuse reflectance spectra were recorded on an Edinburgh Instruments FLS920 spectrometer, Edinburgh, Scotland, UK with an integration sphere coated by Spectralon®, an ozone-free Xe-arc lamp (450 W) and a single photon counting photomultiplier (Hamamatsu, R298, Hamamatsu, Japan), which was cooled to 253 K. The white powder standard used was optical grade BaSO4 (Sigma Aldrich, St. Louis, MO, USA, 99.99%).
3.4. Photoluminescence Studies
Photoluminescence spectra for VUV excitation were performed with a fluorescence spectrometer based on a modified Edinburgh Instruments FLS920 spectrometer, Edinburgh, Scotland. The standard UV/VIS excitation arm was exchanged by a VUV excitation arm. Which was equipped with a D2 lamp (DS-775) as the excitation source, a VM-504 VUV monochromator (Acton research) and a focusing device that was mirror-based. The monochromator is equipped with 1200 grooves per mm (F/mm) and manually adjustable (micrometer screw) inputs and outputs. The internal volume of the monochromator and focusing unit is under vacuum (<5 × 10⁻⁵ mbar) created by an attached turbopump. The D2 lamp emits directly into the vacuum path through an MgF2 window. The sample is measured with a modified sample holder at a 45° angle to the excitation beam. Measurements were therefore performed at 90°.
Measurements under X-ray excitation were performed using Edinburgh Instruments FLS920 spectrometer, Edinburgh, Scotland. The spectrometer is equipped with a photomultiplier R 298P (Hamamatsu) cooled to 253 K by a Peltier element. An Oxford Instruments PLC, Neptune 5200 X-ray tube, Oxfordshire, England, UK with an operating voltage range of 10–50 kV was used as the excitation source.
4. Results and Discussion
4.1. X-ray Diffraction Studies
The present microscale LuBO
3 samples belong to the orthoborates and thus crystallize in a trigonal crystal system with space group
(#167) [
1].
The unit cell has a volume of 0.33899 nm
3, where a = b = 0.4914(13) nm and c = 1.621(7) nm. It comprises six formula units and therefore 30 atoms. Each atomic species occupies one layer.
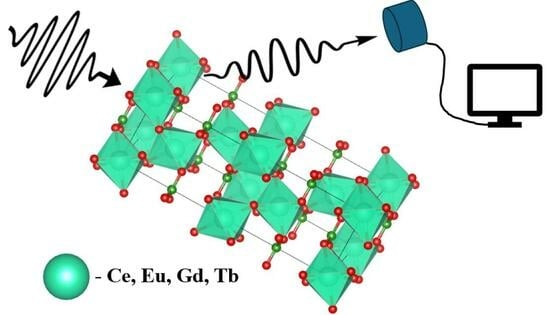
Figure 1 shows a schematic representation of the unit cell and the arrangement of the polyhedra. The lutetium atoms are coordinated six-fold to an octahedron (in blue) and the boron atoms are coordinated threefold to a coplanar triangle (in green). Each oxygen atom of the BO
3 polyhedron is corner-linked to a LuO
6 polyhedron [
1].
The results are shown in
Figure 2. Columns a–e show the X-ray patterns of the as-synthesized powder samples with the indicated activators, respectively. The reference is shown in the bottom row f (ICDD: 04-007-5725). The recorded powder diffractograms of the other samples are also in line with the reference data from literature, so it is assumed that the samples are mostly single phase. The doped samples show a minor signal at 2θ ≈ 28° that hints to the presence of the vaterite phase (space group C2/c), which should not influence the investigation significantly.
4.2. Particle Size Distribution
Particle size distribution measurements were conducted for all of the samples. The particle size of the prepared LuBO
3:Ce
3+ sample is representatively shown in
Figure 3. The sample is unimodally distributed, but shows tailing due to the presence of bigger particles. This broadening of the distribution leads to a high D
90 values.
Similar distributions were observed for the other samples. Furthermore, the D
10 and D
50 values were similar, whereas the D
90 values varied significantly (see
Table 1). The products may have been insufficiently homogenized after sintering or agglomerates may not have been broken up during ultrasonic treatment. A mechanical milling method, such as a ball mill, could make the particle size distributions more reproducible and increase comparability.
4.3. Reflection Spectra
Undoped LuBO
3 showed a very high reflectance between 350 and 800 nm, which caused the pure white body color (
Figure 4). Below 350, a weak absorption band appeared, which might have been caused by defect centers (Urbach tailing), as the band gap of LuBO
3 was about 6.4 eV [
10].
The reflectance spectrum of the Ce3+ comprising microscale sample (blue line) shows a strong absorption feature, which was observed in the range between 280 and 410 nm. The minimal reflectance was around 303 and 335 nm with a shoulder at 376 nm. This composition exhibited a high reflectivity of almost 100% between 400 and 800 nm. The Eu-doped sample showed a sharp increase at 250 nm due to the ligand-to-metal charge transfer, which started steadily decreasing at roughly 280 nm. Beyond this, the material exhibited a strong reflectance, and no absorption bands or lines were observed. Finally, the Gd3+- and Tb3+-substituted sample did not absorb in the investigated spectral range. There were no absorptions in the spectra that might be attributed to absorption by Tb3+, other rare earths or impurities. The measurements were consistent with the white body color of the samples.
4.4. Photoluminescence Spectroscopy
4.4.1. LuBO3:Ce3+
In addition to the reflectance, an excitation spectrum (red spectrum) was recorded between 120 and 350 nm with a fixed emission wavelength of 362 nm, which is depicted in
Figure 5. This spectrum showed a band between 295 and 350 nm with two maxima around 303 and 335 nm which were assigned to the transitions from the spin-orbit split ground state level
7F
5/2 and
7F
7/2 to the lowest crystal-field component of the 5d
1 configuration of Ce
3+ [
2,
3].
The position of the excitation maxima agreed quite well with the position of the absorption bands of the reflection measurement.
An excitation maximum around 167 nm was observed, thus at the high energy edge to the band between 295 and 350 nm. This excitation band could be attributed to a band-to-band transition, since the band gap of the material was approximately 6.4 eV (194 nm) [
10].
Furthermore, an emission spectrum was recorded under an excitation wavelength of 160 nm between 200 and 800 nm. The result is shown as the black curve in
Figure 5.
A broad emission pattern with three maxima around 240, 288, and 311 nm can be recognized between 200 and 250, which was probably due to recombination processes of self-trapped excitons (STE) [
2]. Furthermore, a broad emission band with two maxima between 350 and 550 nm could be observed. The maxima were around 363 nm and 401 nm. The maxima around 363 nm showed the highest relative emission intensity and was due to a transition from the lowest crystal-field component of the [Xd]5d
1 configuration to the ground state
2F
5/2. The maxima around 401 nm was due to the transition from the 5d-band to
2F
7/2 [
2,
3,
10,
11]. Between 500 and 800 nm, there were no further emission bands or lines detectable.
4.4.2. LuBO3:Eu3+
The excitation spectrum showed a charge transfer occurring in the VUV and UV-C range (see
Figure 6), which can be attributed to the transfer of electron density from 2p orbitals of O
2− to europium’s 4f orbitals. Strong emission lines were observed at 587 nm and 589 nm. These correspond to the
5D
0 →
7F
1 transition, which is significantly split due to the calcite symmetry of the host lattice. The additional present 4f-4f transitions indicate deviations from the S
6 symmetry of the Eu
3+ ions, allowing electric dipole transitions according to the parity transition rules [
8,
9]. The broad emission band at 300 nm is likely related to defect-related fluorescence phenomena.
4.4.3. LuBO3:Gd3+
The excitation spectrum shows a peak at 175 nm with a very steep low energy edge. This excitation corresponds to the band excitation of the host matrix, and thus fits rather well to the optical band gap of LuBO
3. A single sharp emission line was observed at 312 nm, which can be assigned to the
6P
7/2 →
8S
7/2 transition. This line overlapped with a broad emission band that was assigned to an STE emission due to defects in the material (see
Figure 7).
4.4.4. LuBO3:Tb3+
The lutetium orthoborate terbium was also optically characterized in terms of excitation and emission behavior. The results are shown in
Figure 8.
The excitation spectrum was monitored for the Tb
3+ emission at 553 nm and is shown as a red line. Two excitation maxima were observed between 250 and 300 nm. The first band was located at 261 nm and the second one at 274 nm with a shoulder at 283 nm. In addition, minor signals were found between 300 and 550 nm. The bands between 250 and 300 nm were presumably due to a transition from the [Xe]4f
8 ground state configuration to the [Xe]4f
75d
1 excited state configuration, which were assigned as spin-forbidden 4d5d transitions. These were split in local S
6 symmetry to three crystal-field components [
12]. Another strong band at 230 nm was observed, which was assigned as the spin-allowed 4f5d transition. The energetic splitting resulted from the high-spin
9D
J and the low-spin
7D
J configurations, respectively [
13,
14]. On the basis of Hund’s rule, the energetically higher maximum could be traced back to the transition to the low-spin configuration.
As the transition to the low-spin configuration (7FJ → 7D) was spin allowed in contrast with the high-spin variant (7FJ → 9D), it was assumed that the intensity of the signal for the transition to the low-spin configuration was more intense than that of the signal representing the transition to the high-spin configuration. In contrast with the signals between 200 and 300 nm, the peaks between 300 and 500 nm were 4f → 4f transitions, which were parity forbidden in contrast with the 4f5d transitions, which explained the difference in intensity.
The emission spectrum is shown in black and was recorded at a fixed excitation wavelength of 160 nm between 200 and 800 nm. A broad band could be seen between 200 and 450 nm, which was due to STE Luminescence [
2]. Between 450 and 800 nm, bands with narrow maxima were seen that were due to the 4f → 4f transitions within the Tb
3+. The maximum around 487 nm was due to the transition out of the
5D
4 →
7F
6, and the one around 546 nm was due to the transition between the
5D
4 →
7F
5 states. The signal around 582 nm was due to the transition
5D
4 →
7F
4 and the signal around 622 nm could be linked to the transition between the levels
4D
5 →
7F
3.
A comparison of the recorded spectra with previously published spectra shows that they were in good agreement with previously published results [
13,
14,
15,
16].
4.4.5. CIE Diagram for the Ce-, Eu-, and Tb-Doped LuBO3 Samples
The CIE1931 chromaticity coordinates (x, y) were calculated for all of the samples that were emitted in the visible spectral range (see
Figure 9). Moreover, the luminous efficacy was derived from the LuBO
3:Ce
3+ emission spectrum The calculation resulted in a luminous efficacy of 8 lm/W
vis and the color coordinates were x = 0.1691 and y = 0.0397. As with LuBO
3:Eu
3+, the emission from the LuBO
3:Tb
3+ phosphor sample was within the visible spectral range, so the luminous efficacy and CIE1931 chromaticity coordinates (x, y) were calculated. The calculation resulted in a luminous efficacy of 473 lm/W
vis and the coordinates were x = 0.3188 and y = 0.6030. As LuBO
3:Eu
3+ showed an orange emission in the visible spectral range, the calculation resulted in a luminous efficacy of 342 lm/W
vis and the color coordinates are x = 0.5910 and y = 0.3907.
Even though Ce3+ showed an allowed f-d transition, the luminous efficacy was smaller by a factor of 40–60 compared with the spin and parity forbidden transitions of Eu3+ and Tb3+. This was due to the positions of the emission bands in relation to the eye sensitivity curve, which had its maximum at 555 nm. Thus, the emission band of Ce3+, which had its peak at 364 nm, exhibited only a minor overlap with the luminosity function, resulting in a small luminous efficacy.
4.5. X-ray Excited Emission Spectra
In addition to the fluorescence spectra, X-ray excited emission spectroscopy (XES) spectra were recorded for the presented samples. Thereby, all luminescent species were excited, which included low laying bands that were not excited with classical excitation sources. The measurements were conducted with a voltage of 50 keV, and an electrical current of 1.69 mA.
The XES spectra of the undoped LuBO
3 are shown in
Figure 10. An intense emission band occurred right at the high energy edge of the investigated spectral range. This was followed by two bands, which were observed at 230 nm and 300 nm. The weak lines around 550 nm indicated Tb-impurities and were also present in the Tb-doped sample (see
Figure 10). Finally, a steady increase was detected towards longer wavelengths.
The XES spectra of the doped samples are presented in
Figure 11. These show similarities to the previously shown emission spectra. First, the Ce
3+-doped sample (see
Figure 11a) showed the same characteristic 5d-4f transition at the same position. The ratio of the two transitions varied notably, and the 4f5d →
2F
7/2 transition showed a similar intensity as the 4f5d →
2F
5/2 relaxation process under X-ray excitation. Further signals were observed, which were not present under the excitation with 160 nm. These were a weak band, which lay between 600 nm and 680 nm, and a sharp peak at 770 nm. The Gd
3+ sample behaved differently as well (
Figure 11c). The characteristic peak at 312 nm was missing, and only the band−band transition occurred. The formed excitons did not transfer the energy to the Gd as it was monovalent. The band at 330 nm was also not observed, which appeared in the undoped sample. The relaxation via the band−band transition was either more efficient or the energy transfer was very inefficient, so that the energy was not transferred to the dopant Gd
3+.
In comparison, the curve of the Eu
3+ (
Figure 11b) and Tb
3+ sample (
Figure 11d) did not show a significant deviation compared with excitation in the UV-range, indicating the effective energy transfer to the activator in these cases. The observed intensities were also slightly larger than the Ce
3+ and Gd
3+-doped material.
5. Conclusions
Phase-pure LuBO3:RE3+ (RE = Ce3+, Eu3+, Gd3+, and Tb3+) samples were prepared via a solid-state reaction, which crystalized in the calcite structure. These showed a large band gap, which agreed with Balcerzyk’s estimations. The recorder emission spectra were typically for the investigated rare earth ions, and STEs were responsible for the weak emission band in the UV-A range. Efficient scintillating properties were indicated for the Ce3+-, Eu3+-, and Tb3+-doped materials due to the efficient band excitation and charge transfer to the activator ions. The exact scintillation yields should be investigated in future, as well as time-resolved spectroscopy, which can yield information about the nature of the internal processes. LuBO3:Tb3+ showed the highest recorded intensity. LuBO3:Gd3+ could possibly be used as a scintillator if it was sensitized with Pr3+, and, thus, should be investigated. These materials can be used in medical imaging techniques, such as positron emission tomography. Co-doping also offers the possibility to tune the color, which can extent the area of application.
Author Contributions
Methodology, F.S.; investigation, F.S.; writing—original draft, F.S. and S.R.; writing—review and editing S.R. and T.J.; supervision, T.J.; resources, T.J. All authors have read and agreed to the published version of the manuscript.
Funding
This research received no external funding.
Data Availability Statement
The raw data supporting the conclusions of this article will be made available by the authors upon request.
Acknowledgments
The authors are thankful for David Enseling’s contributions to the spectroscopic measurements, and for maintaining the analytical equipment.
Conflicts of Interest
The authors declare that they have no known competing financial interests or personal relationships that could have appeared to influence the work reported in this paper.
References
- Zhang, Z.-J.; Jin, T.-T.; Xu, M.-M.; Huang, Q.-Z.; Li, M.-R.; Zhao, J.-T. Low-Temperature Vaterite-Type LuBO3, a Vacancy-Stabilized Phase Synthesized at High Temperature. Inorg. Chem. 2015, 54, 969–975. [Google Scholar] [CrossRef] [PubMed]
- Mansuy, C.; Nedelec, J.M.; Dujardin, C.; Mahiou, R. Scintillation of Sol-Gel Derived Lutetium Orthoborate Doped with Ce3+ Ions. J. Sol-Gel Sci. Technol. 2004, 32, 253–258. [Google Scholar] [CrossRef]
- Shmurak, S.Z.; Kedrov, V.V.; Kiselev, A.P.; Fursova, T.N.; Smyt’ko, I.M. Spectral characteristics and energy transfer from Ce3+ to Tb3+ in compounds Lu1–x–y CexTbyBO3. Phys. Solid State 2016, 58, 578–591. [Google Scholar] [CrossRef]
- Chadeyron-Bertrand, G.; Boyer, D.; Dujardin, C.; Mansuy, C.; Mahiou, R. Structural and scintillation properties of spray coated lutetium borate films doped with Ce3+ and Eu3+. Nucl. Instrum. Methods Phys. Res. Sect. B Beam Interact. Mater. At. 2005, 229, 232–239. [Google Scholar] [CrossRef]
- Mansuy, C.; Nedelec, J.; Dujardin, C.; Mahiou, R. Concentration effect on the scintillation properties of sol–gel derived LuBO3 doped with Eu3+ and Tb3+. Opt. Mater. 2007, 29, 697–702. [Google Scholar] [CrossRef]
- Hölsä, J. Luminescence of Eu3+ ion as a structural probe in high temperature phase transformations in lutetium orthoborates. Inorganica Chim. Acta 1987, 139, 257–259. [Google Scholar] [CrossRef]
- Wolfert, A.; Oomen, E.; Blasse, G. Host lattice dependence of the Bi3+ luminescence in orthoborates LnBO3 (with Ln = Sc, Y, La, Gd, or Lu). J. Solid State Chem. 1985, 59, 280–290. [Google Scholar] [CrossRef]
- Li, Y.; Zhang, J.; Zhang, X.; Luo, Y.; Lu, S.; Ren, X.; Wang, X.; Sun, L.; Yan, C. Luminescent Properties in Relation to Controllable Phase and Morphology of LuBO3:Eu3+ Nano/Microcrystals Synthesized by Hydrothermal Approach. Chem. Mater. 2009, 21, 468–475. [Google Scholar] [CrossRef]
- Yang, J.; Li, C.; Zhang, X.; Quan, Z.; Zhang, C.; Li, H.; Lin, J. Self-Assembled 3D Architectures of LuBO3:Eu3+: Phase-Selective Synthesis, Growth Mechanism, and Tunable Luminescent Properties. Chemistry 2008, 14, 4336–4345. [Google Scholar] [CrossRef] [PubMed]
- Balcerzyk, M.; Gontarz, Z.; Moszynski, M.; Kapusta, M. Future hosts for fast and high light output cerium-doped scintillator. J. Lumin. 2000, 87–89, 963–966. [Google Scholar] [CrossRef]
- Sun, C.; Li, X.; Wang, H.; Xue, D. Crystallization-Dependent Luminescence Properties of Ce:LuPO4. Inorg. Chem. 2016, 55, 2969–2976. [Google Scholar] [CrossRef] [PubMed]
- Hoeke, V.; Gieb, K.; Müller, P.; Ungur, L.; Chibotaru, L.F.; Heidemeier, M.; Krickemeyer, E.; Stammler, A.; Bögge, H.; Schröder, C.; et al. Hysteresis in the ground and excited spin state up to 10 T of a [MnIII6MnIII]3+ triplesalen single-molecule magnet. Chem. Sci. 2012, 3, 2868. [Google Scholar] [CrossRef]
- Gao, Y.; Yang, F.; Han, W.; Fang, Q.; Xu, Z. Quasi-spherical LuBO3 nanoparticles: Synthesis, formation, and luminescence properties. Mater. Res. Bull. 2014, 51, 13–18. [Google Scholar] [CrossRef]
- Yang, J.; Zhang, C.; Wang, L.; Hou, Z.; Huang, S.; Lian, H.; Lin, J. Hydrothermal synthesis and luminescent properties of LuBO3:Tb3+ microflowers. J. Solid State Chem. 2008, 181, 2672–2680. [Google Scholar] [CrossRef]
- Zhang, L.-H.; Zhou, Y.-B.; Li, W.-L.; Zhao, X.-Y.; Wang, Y.-B. Controllable synthesis and luminescence property of spherical Lu(OH)CO3:Ln3+/LuBO3:Ln3+ (Ln = Eu, Tb) nanoparticles. Chem. Pap. 2019, 73, 1761–1766. [Google Scholar] [CrossRef]
- Mikhailin, V.; Spassky, D.; Kolobanov, V.; Meotishvili, A.; Permenov, D.; Zadneprovski, B. Luminescence study of the LuBO3 and LuPO4 doped with RE3+. Radiat. Meas. 2010, 45, 307–310. [Google Scholar] [CrossRef]
Figure 1.
Schematic representation of the LuBO
3 unit cell modified after [
1]. The LuO
6 polyhedra (in blue) form an octahedron and the BO
3 polyhedra (in green) form a coplanar triangle [
1]. The Oxygen atoms should stay in red.
Figure 1.
Schematic representation of the LuBO
3 unit cell modified after [
1]. The LuO
6 polyhedra (in blue) form an octahedron and the BO
3 polyhedra (in green) form a coplanar triangle [
1]. The Oxygen atoms should stay in red.
Figure 2.
X-ray diffraction patterns (Cu K alpha radiation) of the as-prepared µ-scale powder samples of LuBO3:RE3+ with RE = Ce3+, Eu3+, Gd3+, and Tb3+ from the top (a–e), the bottom graph (f) represents the reference X-ray pattern of LuBO3.
Figure 2.
X-ray diffraction patterns (Cu K alpha radiation) of the as-prepared µ-scale powder samples of LuBO3:RE3+ with RE = Ce3+, Eu3+, Gd3+, and Tb3+ from the top (a–e), the bottom graph (f) represents the reference X-ray pattern of LuBO3.
Figure 3.
Particle size distribution of LuBO3:Ce3+, which is representative of the particle size distributions of all samples investigated in this work. The red curve show the summation.
Figure 3.
Particle size distribution of LuBO3:Ce3+, which is representative of the particle size distributions of all samples investigated in this work. The red curve show the summation.
Figure 4.
Reflection spectra of the as-prepared LuBO3 samples. Undoped LuBO3 (left image) and substituted with 1% of Ce, Eu, Gd, or Tb as activators (right image). (color should be used).
Figure 4.
Reflection spectra of the as-prepared LuBO3 samples. Undoped LuBO3 (left image) and substituted with 1% of Ce, Eu, Gd, or Tb as activators (right image). (color should be used).
Figure 5.
Excitation (red) and emission (black) spectra of Ce3+-doped LuBO3.
Figure 5.
Excitation (red) and emission (black) spectra of Ce3+-doped LuBO3.
Figure 6.
Excitation (red) and emission (black) spectra of Eu3+ doped LuBO3.
Figure 6.
Excitation (red) and emission (black) spectra of Eu3+ doped LuBO3.
Figure 7.
Excitation (red) and emission (black) spectra of the sample LuBO3:Gd3+.
Figure 7.
Excitation (red) and emission (black) spectra of the sample LuBO3:Gd3+.
Figure 8.
Excitation (red line) and emission (black line) spectra of the Tb3+-doped LuBO3 sample.
Figure 8.
Excitation (red line) and emission (black line) spectra of the Tb3+-doped LuBO3 sample.
Figure 9.
CIE1931 color chart with the x, y color point of LuBO3:Ce3+ (●), LuBO3:Eu3+ (), and LuBO3:Tb3+ ().
Figure 9.
CIE1931 color chart with the x, y color point of LuBO3:Ce3+ (●), LuBO3:Eu3+ (), and LuBO3:Tb3+ ().
Figure 10.
Emission under X-ray excitation of the undoped LuBO3 sample.
Figure 10.
Emission under X-ray excitation of the undoped LuBO3 sample.
Figure 11.
Emission under X-ray excitation of (a) LuBO3:Ce3+, (b) LuBO3:Eu3+, (c) LuBO3:Gd3+, and (d) LuBO3:Tb3+.
Figure 11.
Emission under X-ray excitation of (a) LuBO3:Ce3+, (b) LuBO3:Eu3+, (c) LuBO3:Gd3+, and (d) LuBO3:Tb3+.
Table 1.
Measured particle size distribution D10, D50, and D90 of the prepared microscale phosphor samples.
Table 1.
Measured particle size distribution D10, D50, and D90 of the prepared microscale phosphor samples.
| Sample | D10/µm | D50/µm | D90/µm |
|---|
| LuBO3 | 7.35 | 14.38 | 70.06 |
| LuBO3:Ce3+ | 7.74 | 14.48 | 32.69 |
| LuBO3:Eu3+ | 7.18 | 14.10 | 51.76 |
| LuBO3:Gd3+ | 8.11 | 17.61 | 119.21 |
| LuBO3:Tb3+ | 8.34 | 17.12 | 63.50 |
| Disclaimer/Publisher’s Note: The statements, opinions and data contained in all publications are solely those of the individual author(s) and contributor(s) and not of MDPI and/or the editor(s). MDPI and/or the editor(s) disclaim responsibility for any injury to people or property resulting from any ideas, methods, instructions or products referred to in the content. |
© 2024 by the authors. Licensee MDPI, Basel, Switzerland. This article is an open access article distributed under the terms and conditions of the Creative Commons Attribution (CC BY) license (https://creativecommons.org/licenses/by/4.0/).


