Article

Indium-Doped SnO2 Based Surface Acoustic Wave Gas Sensor with Ba0.6Sr0.4TiO3 Film

Center of Excellence for Thin-Film Research and Surface Engineering, Department of Electrical and Computer Engineering, University of Dayton, Dayton, OH 45469, USA
*
Author to whom correspondence should be addressed.
Crystals 2024, 14(4), 366; https://doi.org/10.3390/cryst14040366
Submission received: 16 March 2024 / Revised: 6 April 2024 / Accepted: 9 April 2024 / Published: 12 April 2024
(This article belongs to the Section Inorganic Crystalline Materials)

Abstract

:
SnO2-based gas sensors have been widely synthesized and used for the detection of various hazardous gases. However, the use of doped SnO2 in sensing applications has recently attracted increased interest due to the formation of a synergistic effect between the dopant and the host. Moreover, in the case of a surface acoustic wave (SAW) sensor, the piezoelectric material used in the fabrication of the sensor plays a crucial role in defining the response of the SAW sensor. As a ferroelectric material, barium strontium titanate (Ba0.6Sr0.4TiO3) has recently been studied due to its intriguing dielectric and electromechanical properties. Its high acoustic velocity and coupling coefficient make it a promising candidate for the development of acoustic devices; however, its use as a piezoelectric material in SAW sensors is still in its infancy. In this paper, we present the design, fabrication and validation of an indium doped SnO2-based SAW gas sensor on Ba0.6Sr0.4TiO3 thin film for room temperature (RT) applications. Pulsed laser deposition was used to deposit thin films of Ba0.6Sr0.4TiO3 and indium-doped SnO2. Different characterization techniques were employed to analyze the morphology and crystallization of the films. The performance of the fabricated sensor was validated by exposing it to different concentrations of ethanol and then analyzing the recorded frequency shift. The sensor exhibited fast response (39 s) and recovery (50 s) times with a sensitivity of 9.9 MHz/Δ. Moreover, the sensor had good linear response and reproducibility. The fabricated indium-doped SnO2-based SAW gas sensor could be suitable for practical room temperature applications.

1. Introduction

Along with the advancement of microelectromechanical system technology, surface acoustic wave (SAW) sensors have attracted a lot of interest in regard to practical gas-sensing applications. This is mainly due to their advantages, including high sensitivity, high stability, ease of fabrication, fast response time, fast recovery time and reproducibility [1,2,3,4]. Another major advantage of a SAW sensor is its ability to operate at room temperature, making it more attractive for practical sensing applications. A SAW sensor consists of a piezoelectric substrate or thin film, input and output interdigitated transducers (IDT) and a sensing film in the middle. Piezoelectric materials, such as aluminum nitride, quartz, langasite, zinc oxide and lithium niobate, have been extensively used to develop SAW devices [5,6]; however, those materials have some drawbacks, such as low acoustic velocities, electromechanical coupling coefficients and/or tunability [7,8]. Thus, continuous research efforts have been devoted to exploring piezoelectric materials having high acoustic velocities and tunability characteristics. In this context, ferroelectric materials have received a great deal of attention, which is attributed to their excellent ferroelectric, piezoelectric and electroacoustic coupling properties and switching characteristics [9].
Among various ferroelectric materials, Ba0.6Sr0.4TiO3 (henceforth BST) has been widely used in the development of reconfigurable RF and microwave devices [10,11,12,13], mainly due to its large and voltage tunable dielectric constant and low dielectric losses. Moreover, BST has interesting properties, such as high acoustic velocity and a high electromechanical coupling coefficient, which are essential for acoustic devices. For instance, a thin film of BST has been used in the fabrication of bulk acoustic wave (BAW) resonators in the design of filters and low noise oscillators with high quality factors and better coupling coefficients [14,15]. Gevorgian et al. demonstrated the use of BST thin film as piezoelectric material in the fabrication of solid mounted tunable resonators [15]. In addition, Sandeep et al. demonstrated the fabrication and characterization of Ba0.5Sr0.5Tio3-based high overtone acoustic wave resonators (HBARs) using the pulsed laser deposition and resonant spectrum method [16]. The HBARs exhibited a high-quality factor and tunability while applying a dc bias. Moreover, the effect of coating an additional layer on BST-based HBARs has been demonstrated [17]. Because of the coating, the frequency spectra of the HBARs were altered, caused by significant changes in their key performance parameters. Goud et al. reported the low-temperature crystallization of a BST thin film using an excimer laser by switching between the deposition and annealing processes, opening up several new possibilities in flexible electronic devices [18]. Nevertheless, its application in the fabrication of SAW devices remains in its early stage. In this study, the pulsed laser deposition (PLD) technique was used to deposit thin films of BST. PLD has some intrinsic benefits, such as large-area deposition, precise thickness control and stoichiometry transfer [19].
As a sensing film, metal oxide semiconductors, such as ZnO, NiO, CuO, In2O3 and SnO2, have been extensively used as sensing materials for the detection of hazardous gases [20,21,22,23]. Among them, tin oxide (IV) (SnO2) is an n-type semiconductor that has received a great deal of attention due to its superior sensitivity, low cost, fast kinetics, chemical stability and reproducibility [24,25]. However, most of the SnO2-based gas sensors currently available operate at elevated temperatures, typically in the range of 200–400 °C [26,27]. For instance, Shooshtari et al. reported the fabrication of TiO2 nanowire-based resistive ethanol vapor sensors and evaluated the performance of the sensors at different operating temperatures [28]. The fabricated ethanol sensors exhibited excellent sensitivity, fast responses and recovery time, as well as good responses at an operating temperature of 180 °C. Moreover, they demonstrated the effect of humidity on the response of the sensors. In general, these gas sensors need an additional heater, which increases energy consumption and results in poor stability. To address such limitations, effective strategies, such as doping SnO2 with other metal oxides and metal ions, have been used to reduce the operating temperature [29,30]. Therefore, exploring the characteristics and sensing applications of BST-based SAWs with In-doped SnO2 sensing film would present new possibilities for the development of practical gas sensing applications.
Here, we present the design, fabrication and testing of indium-doped SnO2-based SAW gas sensors on BST thin film. To the best of our knowledge, the development of a BST-based SAW sensor with In-doped SnO2 sensing film for room temperature sensing applications has not yet been reported. The sensing performance of the indium-doped SnO2-based SAW with BST thin film gas sensor was tested by exposing it to different concentrations of ethanol vapor.

2. Materials and Methods

2.1. Materials

Ethanol (CH3CH2OH) was purchased from Sigma−Aldrich Inc., St. Louis, MO, USA. Ceramic In-doped SnO2 (8:92 wt%) and BST targets were purchased from Kurt J. Lesker Co., Jefferson Hills, PA, USA. C-plane sapphire substrates (Al2O3) were obtained from Nova Electronic Materials Inc., Flower Mound, TX, USA. All raw chemical reagents were of analytical grade and used without further purification.

2.2. Method

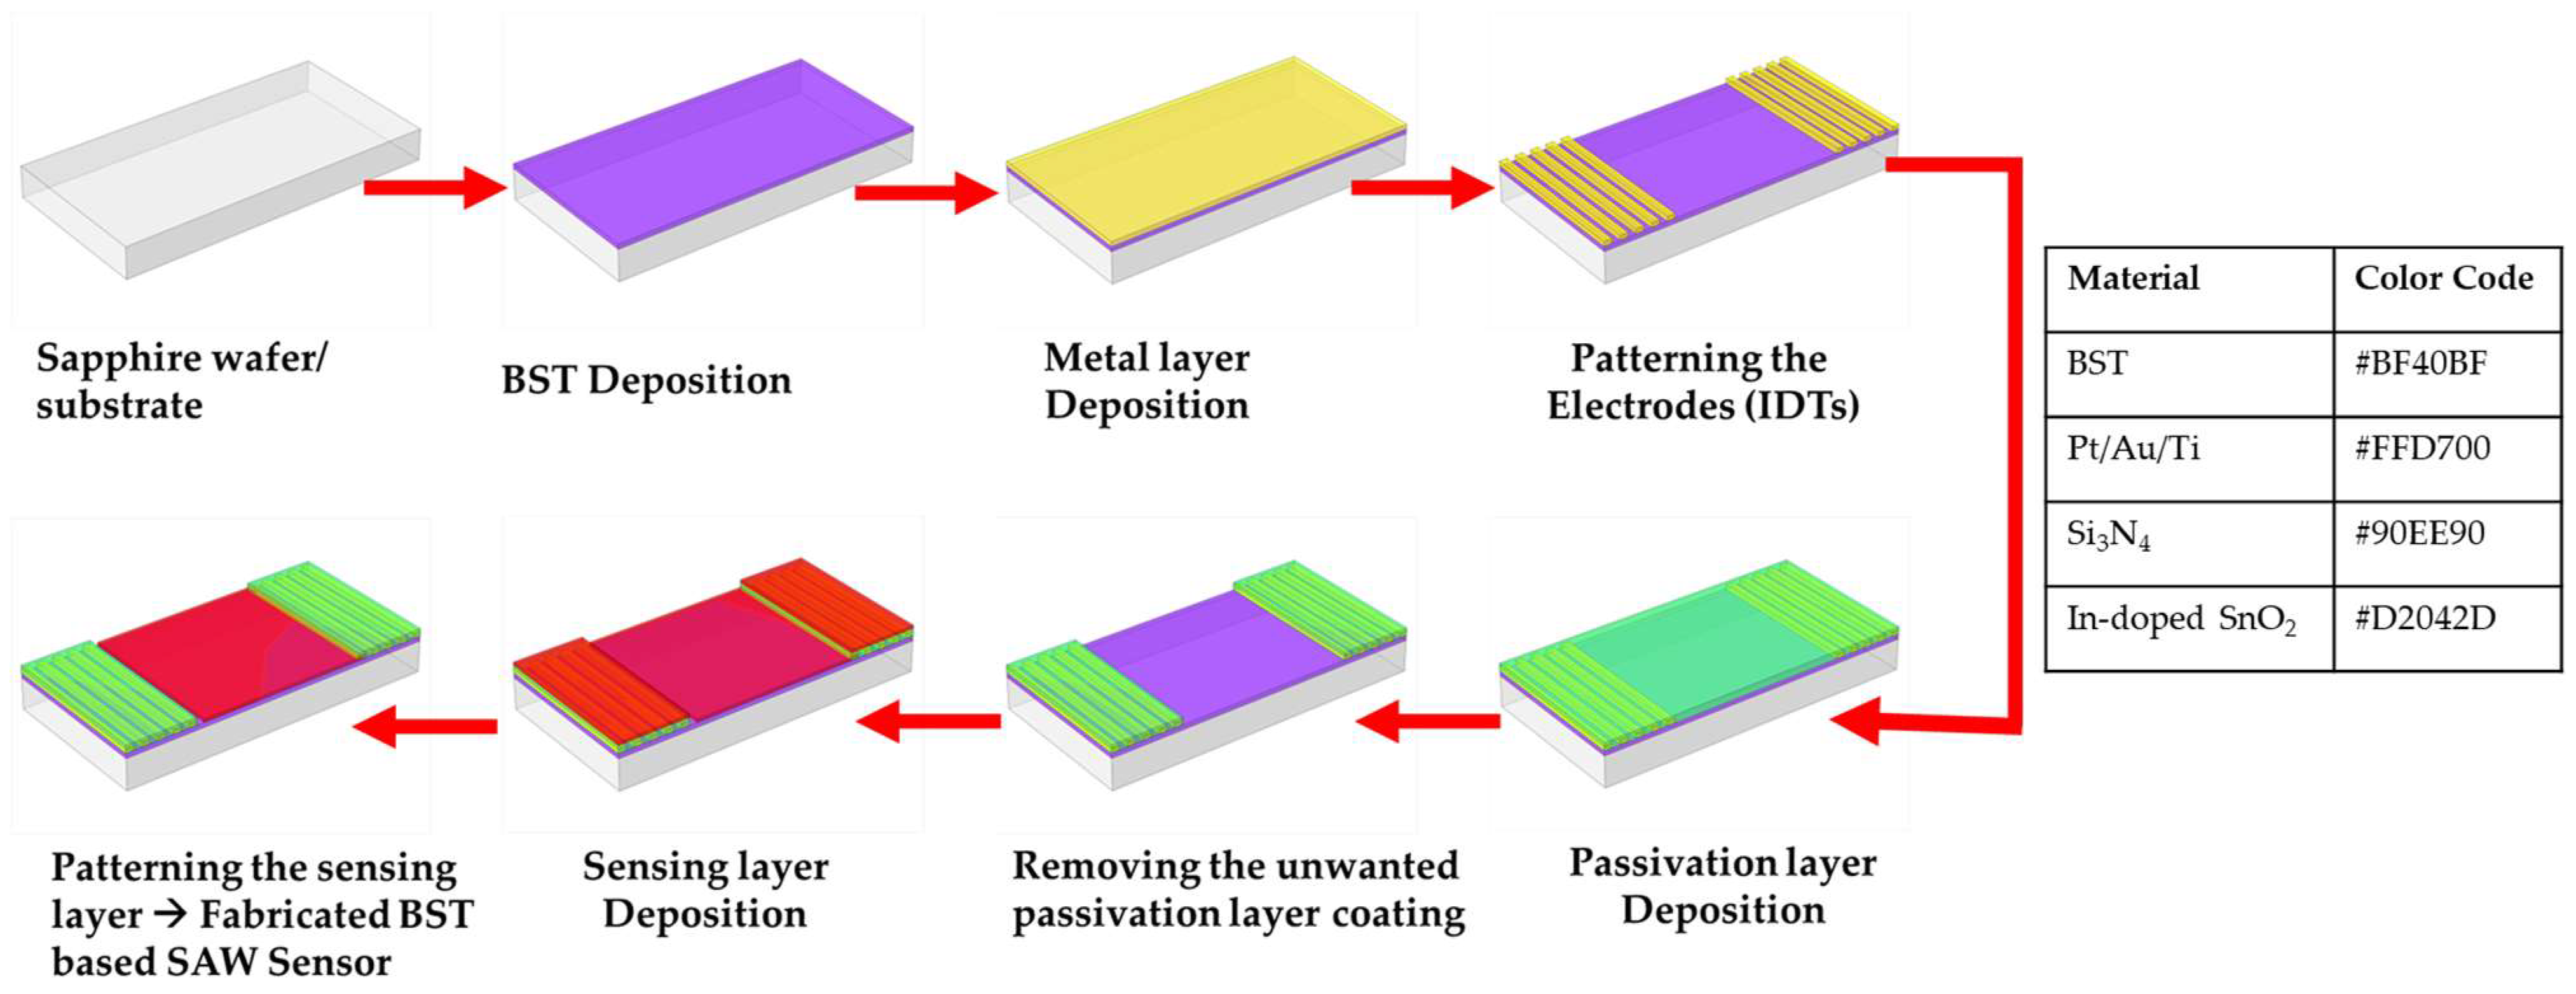
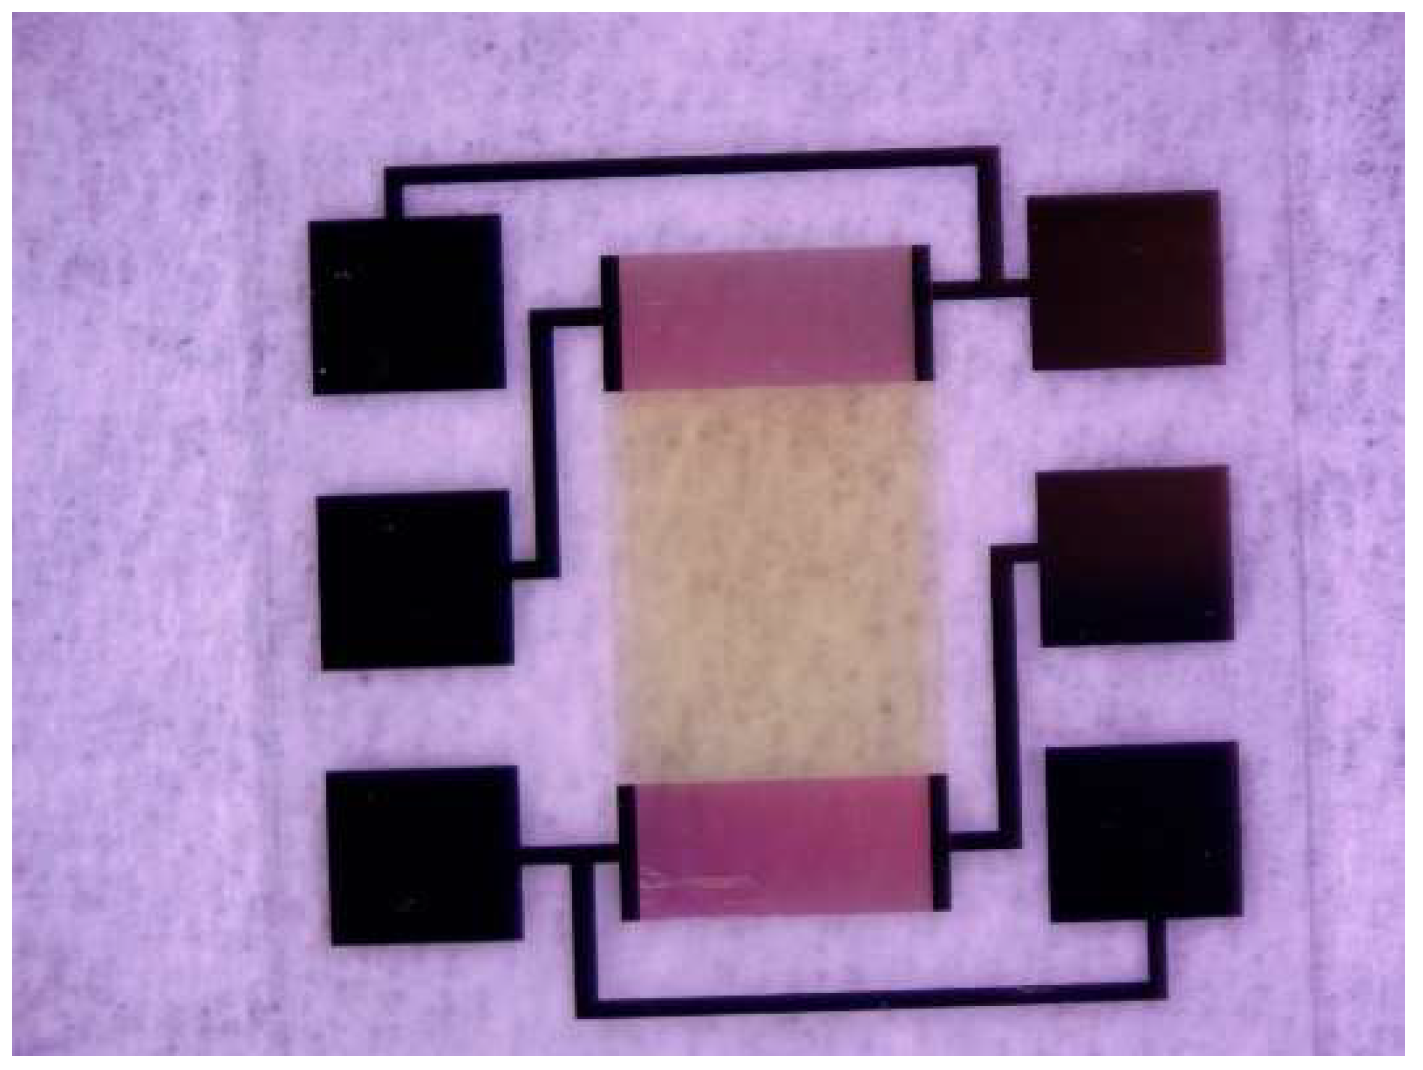
2.2.1. Design and Fabrication of BST-Based SAW Devices

The key parameters that define the center frequency of a SAW device are the type of piezoelectric material used and the width of the fingers (IDT). The IDT structures are mainly defined by width of the fingers (W) and the spacing (S). The desired W and S were determined based on the surface acoustic wave theory. Acoustic waves are activated to maximum by IDT when the spacing between fingers is equal to the integral multiple of the half wavelength (λ/2) of the SAW device. The wavelength of a SAW device is expressed as 2 × W + 2 × S .   It implies that the finger width needs to be equal to the spacing. Here, a uniform interdigitated structure with a 50% metallization ratio (W = S, thus λ = 4 × W) was used. Furthermore, the center frequency and wavelength are related by f 0 = v / λ , f 0 = center frequency. This indicates that, to increase the center frequency, the width of the figure must be narrowed; however, the minimum achievable finger width is dictated by the fabrication process used. The minimum width is often limited to a few micrometers because of challenges with the lithography-based fabrication process. Another important parameter that affects the strength of the acoustic waves is the number of pairs of fingers. The stimulated acoustic wave energies produced by the IDTs increase with the increase in the number of fingers. Thus, the efficiency of the transducers can be maximized by adding more pairs of fingers, but this increases the size of the device. In this work, the number of pairs of fingers for the input and output IDT was 130. In this study, SAW sensors with different widths of interdigitated transducer structures were fabricated. Among them, SAW sensors with IDT structure widths of 2.5, 4, 7 and 10 µm were designed and their frequence response was recorded. The center frequency of the SAW devices for these designs ranged from 510 to 127 MHz, with a wider finger resulting in a lower frequency. It is well known that the sensitivity of a SAW sensor increases with the increase in the center frequency, i.e., the higher f 0 , the better the sensitivity of the SAW sensors. Thus, for ethanol vapor testing experiments, the SAW sensor with a center frequency of around 510 MHz (W = 2.5 µm) was used. Subsequently, the SAW devices were fabricated using the conventional photolithography process and different deposition techniques.
The designed BST-based SAW devices were fabricated on the C-plane sapphire substrate. Initially, BST thin film was deposited onto the cleaned wafer using PLD, and the deposition chamber was first vacuumed down to a pressure of 75 mTorr. The wafer was heated to 760 °C and kept at that temperature throughout the deposition process. A KrF excimer laser operating at a wavelength of 248 nm (Lambda Physik LPX210, Coherent Inc., Saxonburg, PA, USA) with a pulse repetition rate of 30 Hz was used to deposit a thin film of BST on the surface of the wafer. The laser energy density at the target surface was set to approximately 2.6 J/cm2. The laser pulse energy was approximately 175 mJ. The distance between the target and the substrate was 50 mm [11,31]. The fabrication processes are illustrated in Figure 1.
As reported in the previous paper [32], the IDT structures and sensing films were synthesized as follows: 250 nm thick Pt/Au/Ti (100/130/20 nm) IDT structures were created using the e-beam evaporation technique and a lift-off process. Then, the sensing film, In-doped SnO2, was synthesized. A thin film of In-doped SnO2 was deposited onto the wafer using PLD at room temperature [16]. Then, a lift-off process was conducted to remove the sensing layer coating from the unwanted areas before annealing it in a furnace at 330 °C. Figure 2 shows the microscopic picture of the BST-based SAW gas sensor with the In-doped SnO2 sensing film. An example of a swept frequency measurement scattering parameter S21 of a BST-based SAW sensor with a finger width of 2.5 µm and a spacing of 2.5 µm is shown in Figure 3. An S21 scattering parameter indicates the ratio of the power at the Output Port 2 to the input power at Port 1 in dB. The measurement shows the resonances corresponding to the fundamental frequency of the SAW as well as the higher-order modes. The fundamental resonance frequency is around 550 MHz for this sensor.

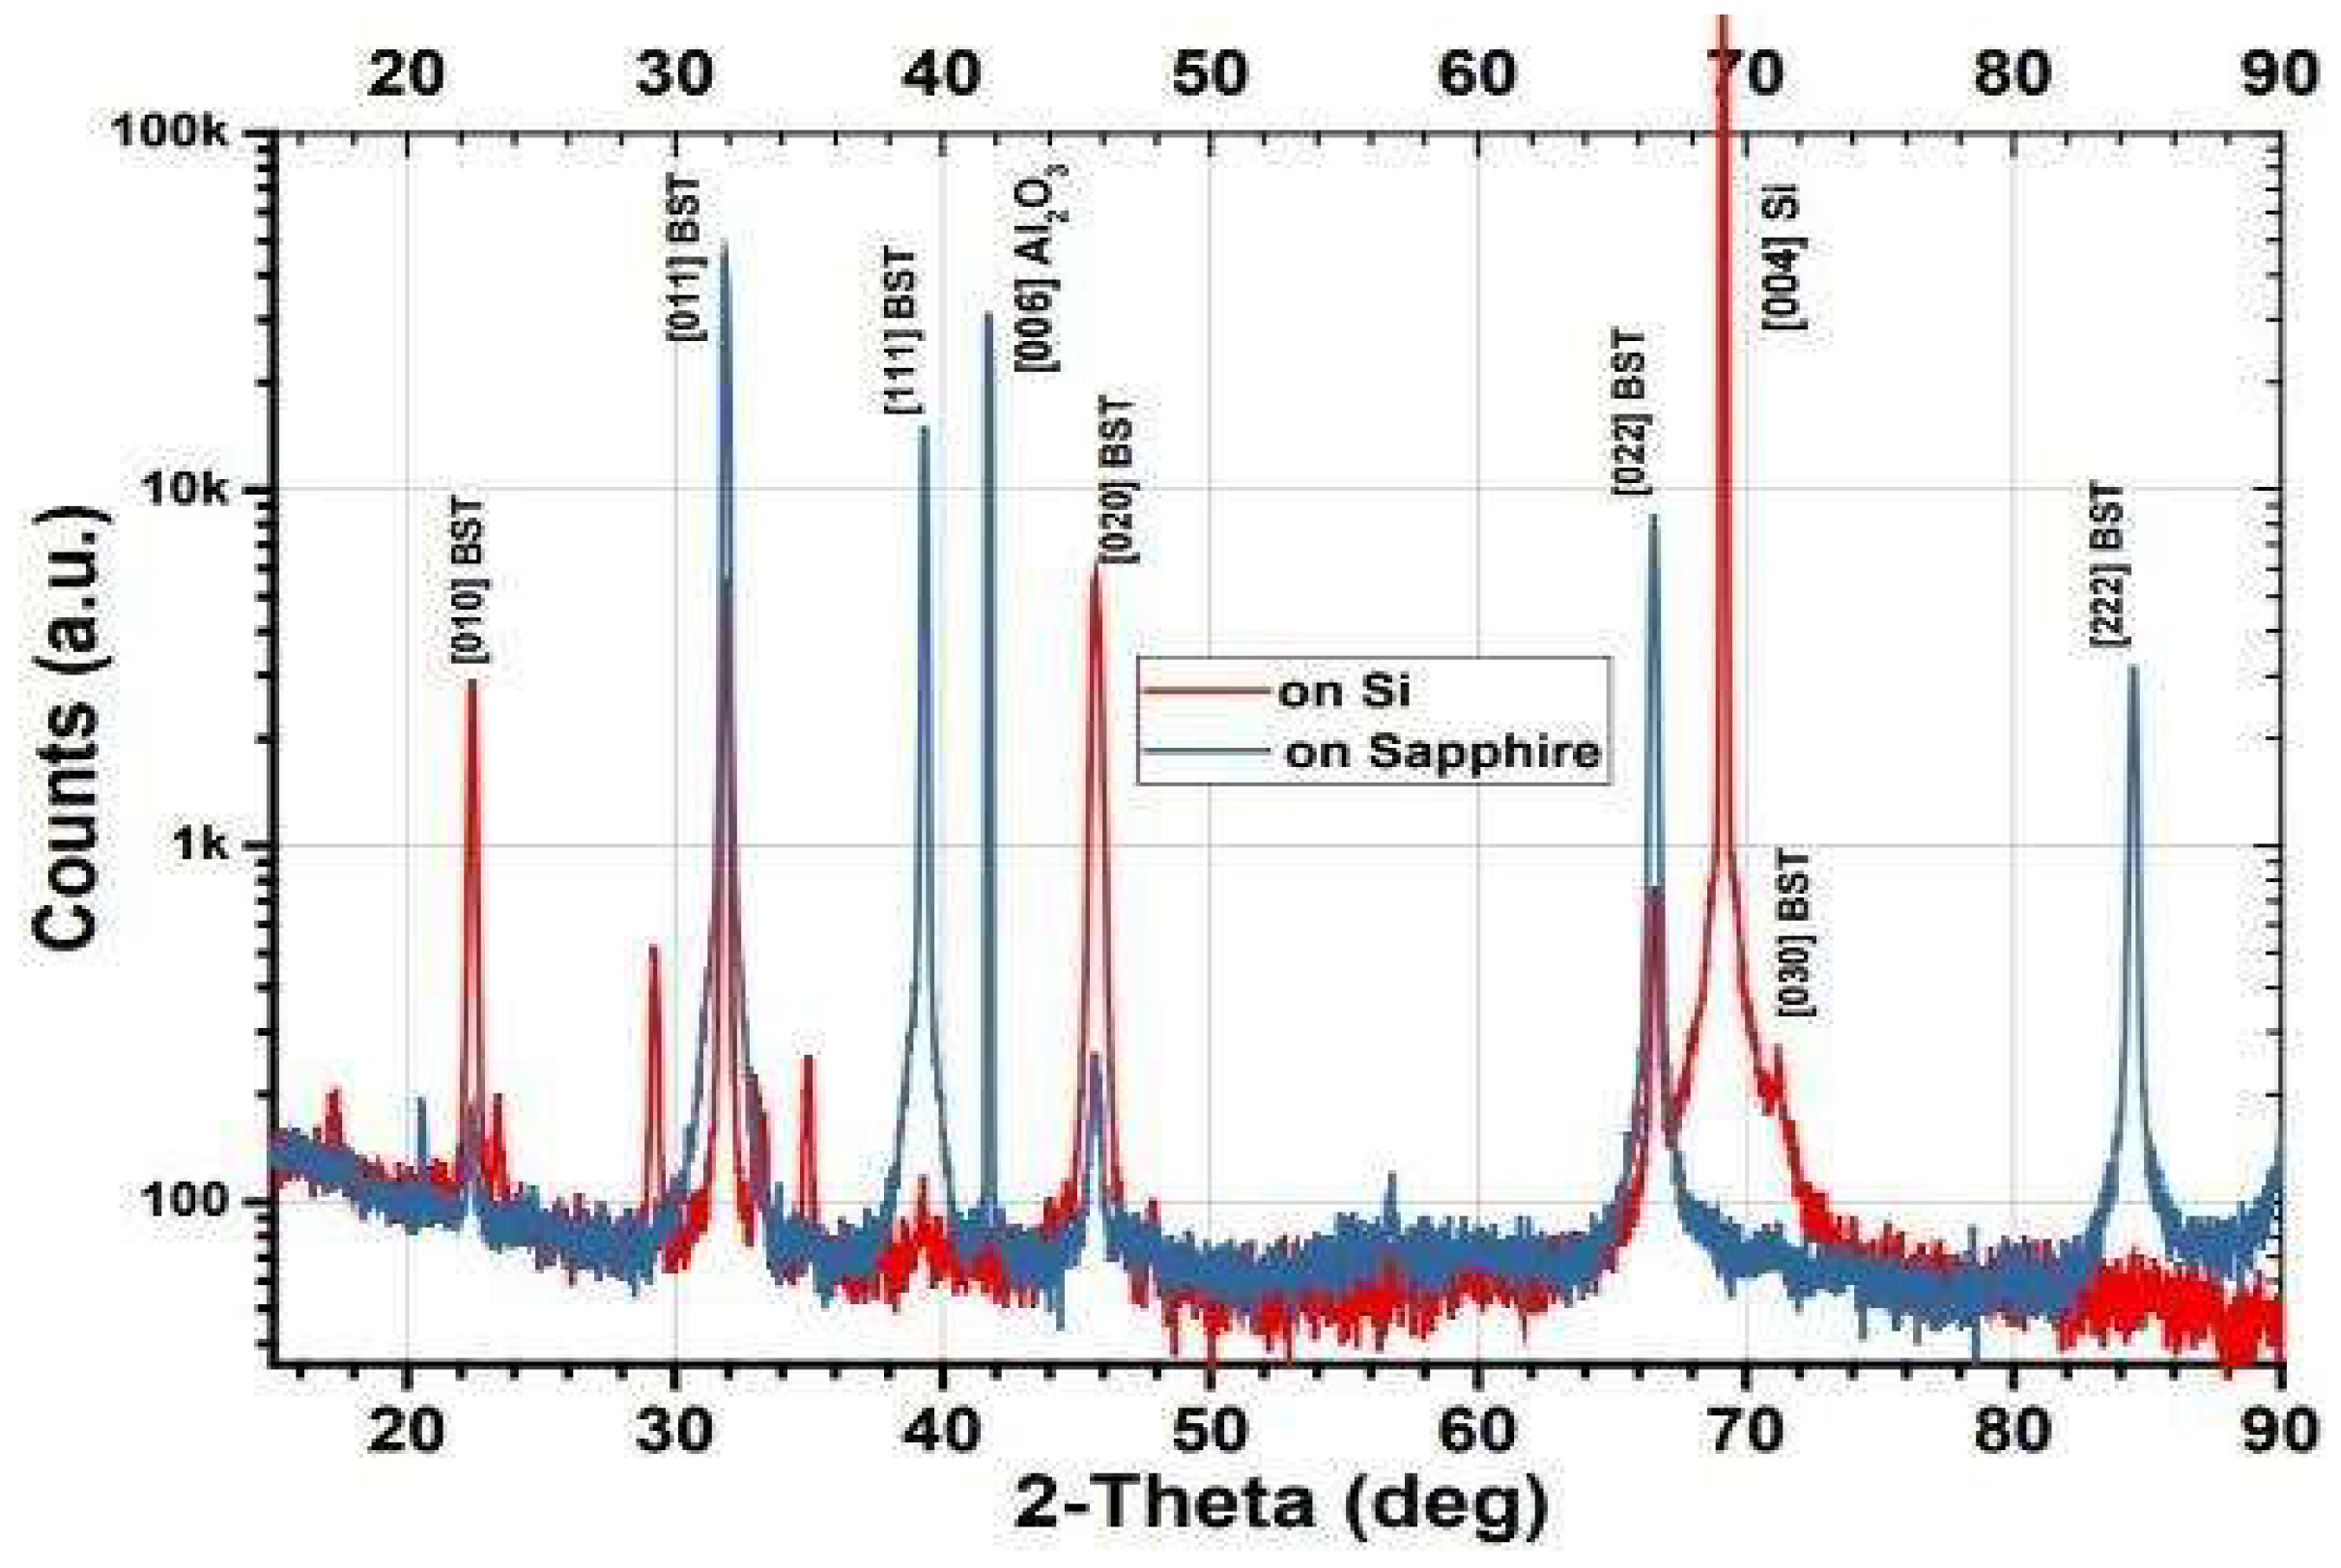
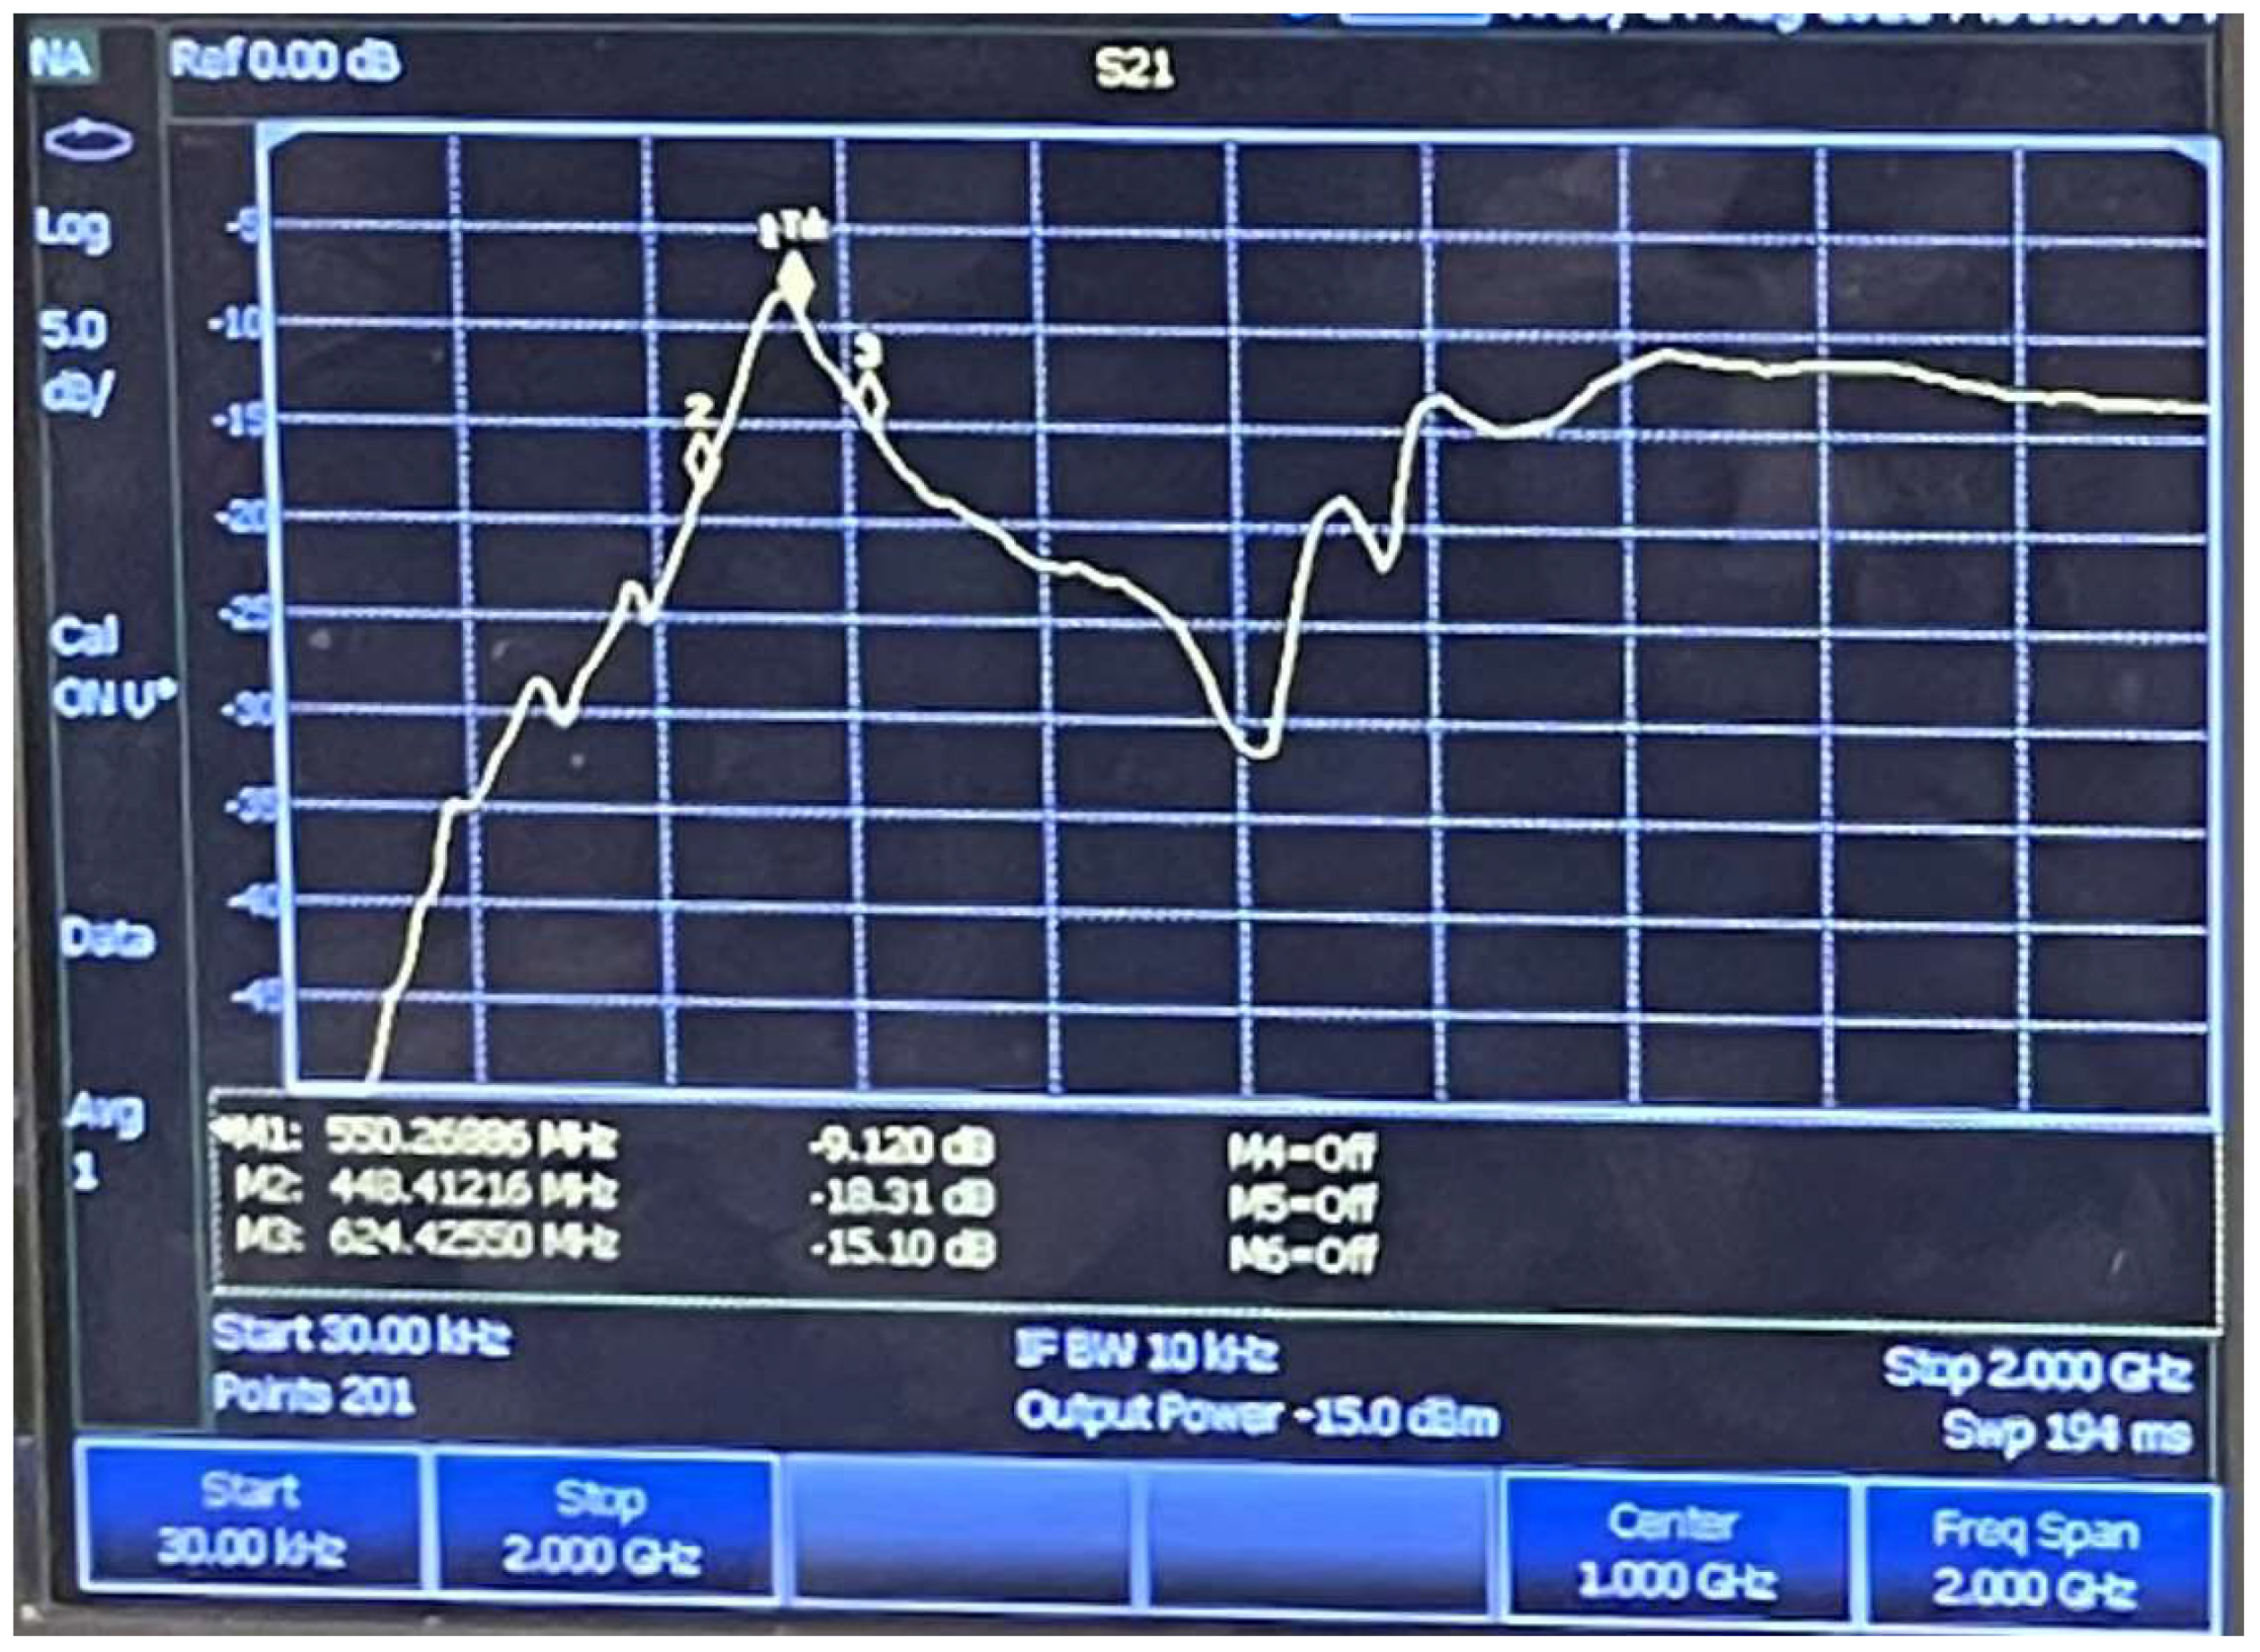
2.2.2. Film Characterization

The chemical composition and crystal structure of all samples were confirmed by X-ray diffraction (XRD, Cu Kα radiation at a step size of 0.02 in a 2θ range of 15° to 90°). The surface and cross-sectional morphologies of the as-deposited thin films were characterized using high-resolution scanning electron microscopy (HRSEM, Hitachi S-4800, Hitachi, Japan) with an acceleration voltage of 10 kV. The chemical compositions of the samples were analyzed using an environmental scanning electron microscope (ESEM, Zeiss EVO-50XVP, Jena, Germany). EDS was also applied to obtain the elemental mapping of each element. Specimens for both the HRSEM and EDS observations were prepared by mounting the samples onto standard aluminum studs using conductive double-sided carbon tapes. All characterizations were carried out at room temperature.

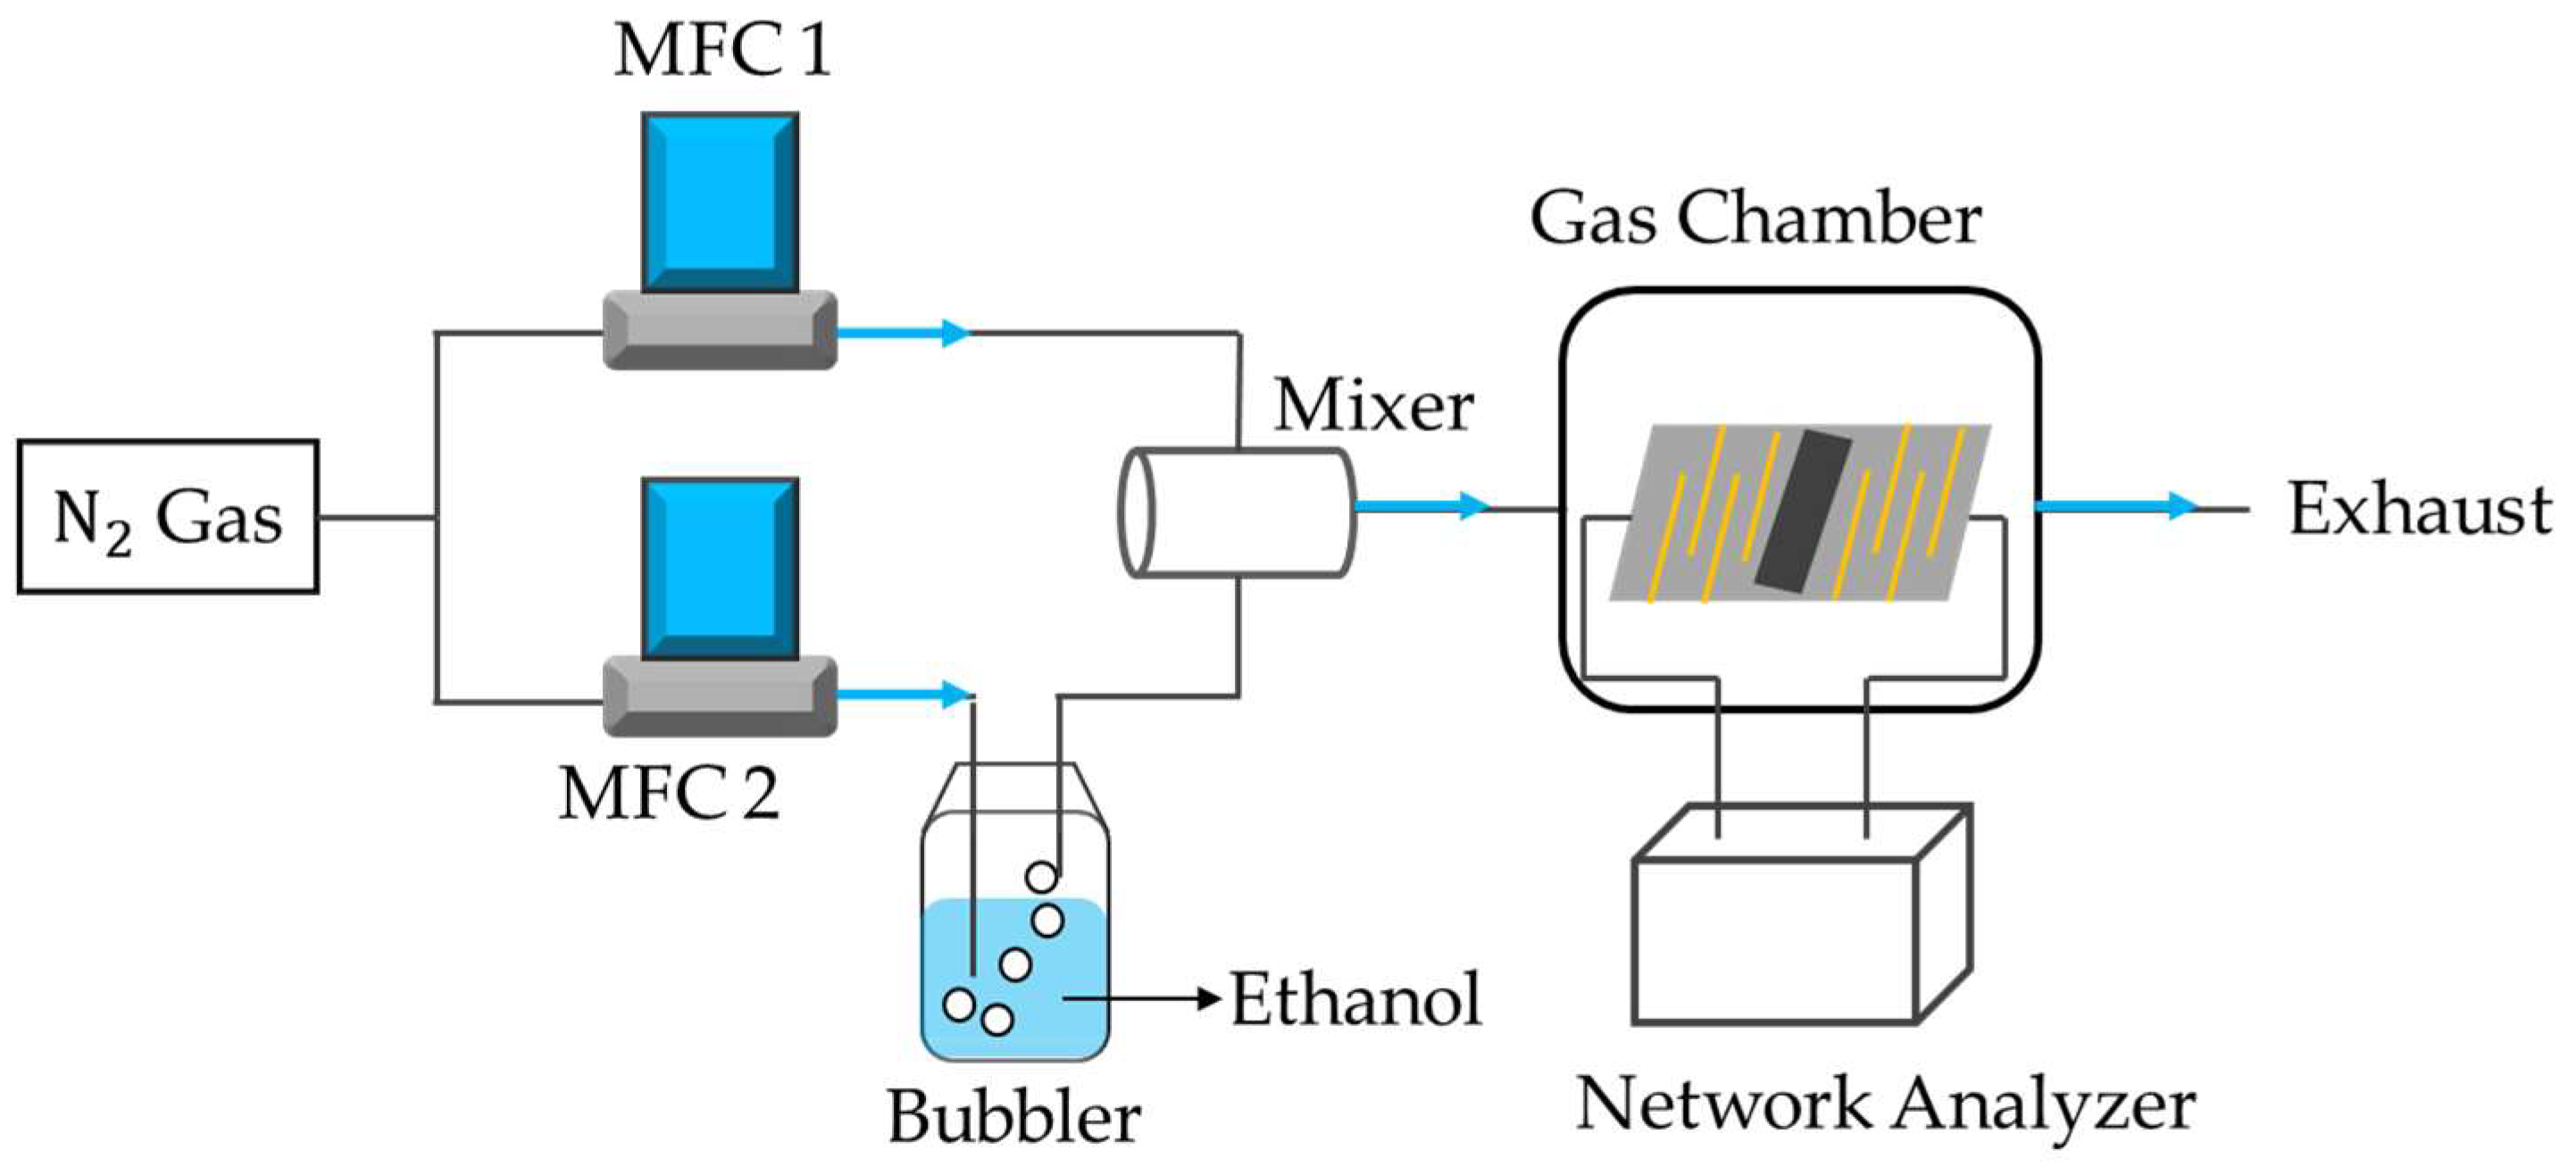
2.2.3. Experimental Setup and Procedures

All experimental procedures were performed using a custom-made test setup shown in Figure 4. A fabricated SAW sensor was placed in a sealed gas chamber with a gas inlet and a gas outlet. It was then connected to a portable vector network analyser (VNA), the Keysight FieldFox N9914A. The ultra-high purity nitrogen gas served as a carrier gas. N2 gas was used mainly for two purposes: dilution and purging. Before the experiments were carried out, the entire set-up was purged by continuously flowing N2 gas. Ethanol vapor was generated by introducing N2 gas into the liquid ethanol in the bubbler. The concentrations of ethanol vapor were controlled by adjusting the flow rates of the two mass flow controllers (GE50A, MKS Instrument Inc., Andover, MA, USA). The total flow rate was maintained at 1000 sccm. The concentration of ethanol vapor in ppm can be calculated using Equation (1).
C p p m = 10 6 p s v c p ( v c + v d )   ,
where vd and vc are the flow rates of MFC1 and MFC2 (in sccm), respectively. Additionally, p is the atmospheric pressure, while ps is the saturated vapor pressure and is calculated using the Antoine equation [33]. After purging, the N2 gas was allowed to flow through the test chamber to establish a baseline. Subsequently, ethanol vapor and N2 gas were alternatively introduced into the test chamber for each phase of the experiment. The sensing response of the sensor was then recorded. To ensure consistency, all experiments were conducted in controlled environments at room temperature and a relative humidity of 32% RH. Moreover, the room was fully air-conditioned and monitored with a commercially available humidity sensor (DHT22/AM2302, Adafruit, New York, NY, USA). The DHT22 humidity sensor has a humidity precision of 2% RH with a sensitivity of 0.1% RH and a temperature precision of less than 0.5 °C and a sensitivity of 0.1 °C.

3. Results and Discussion

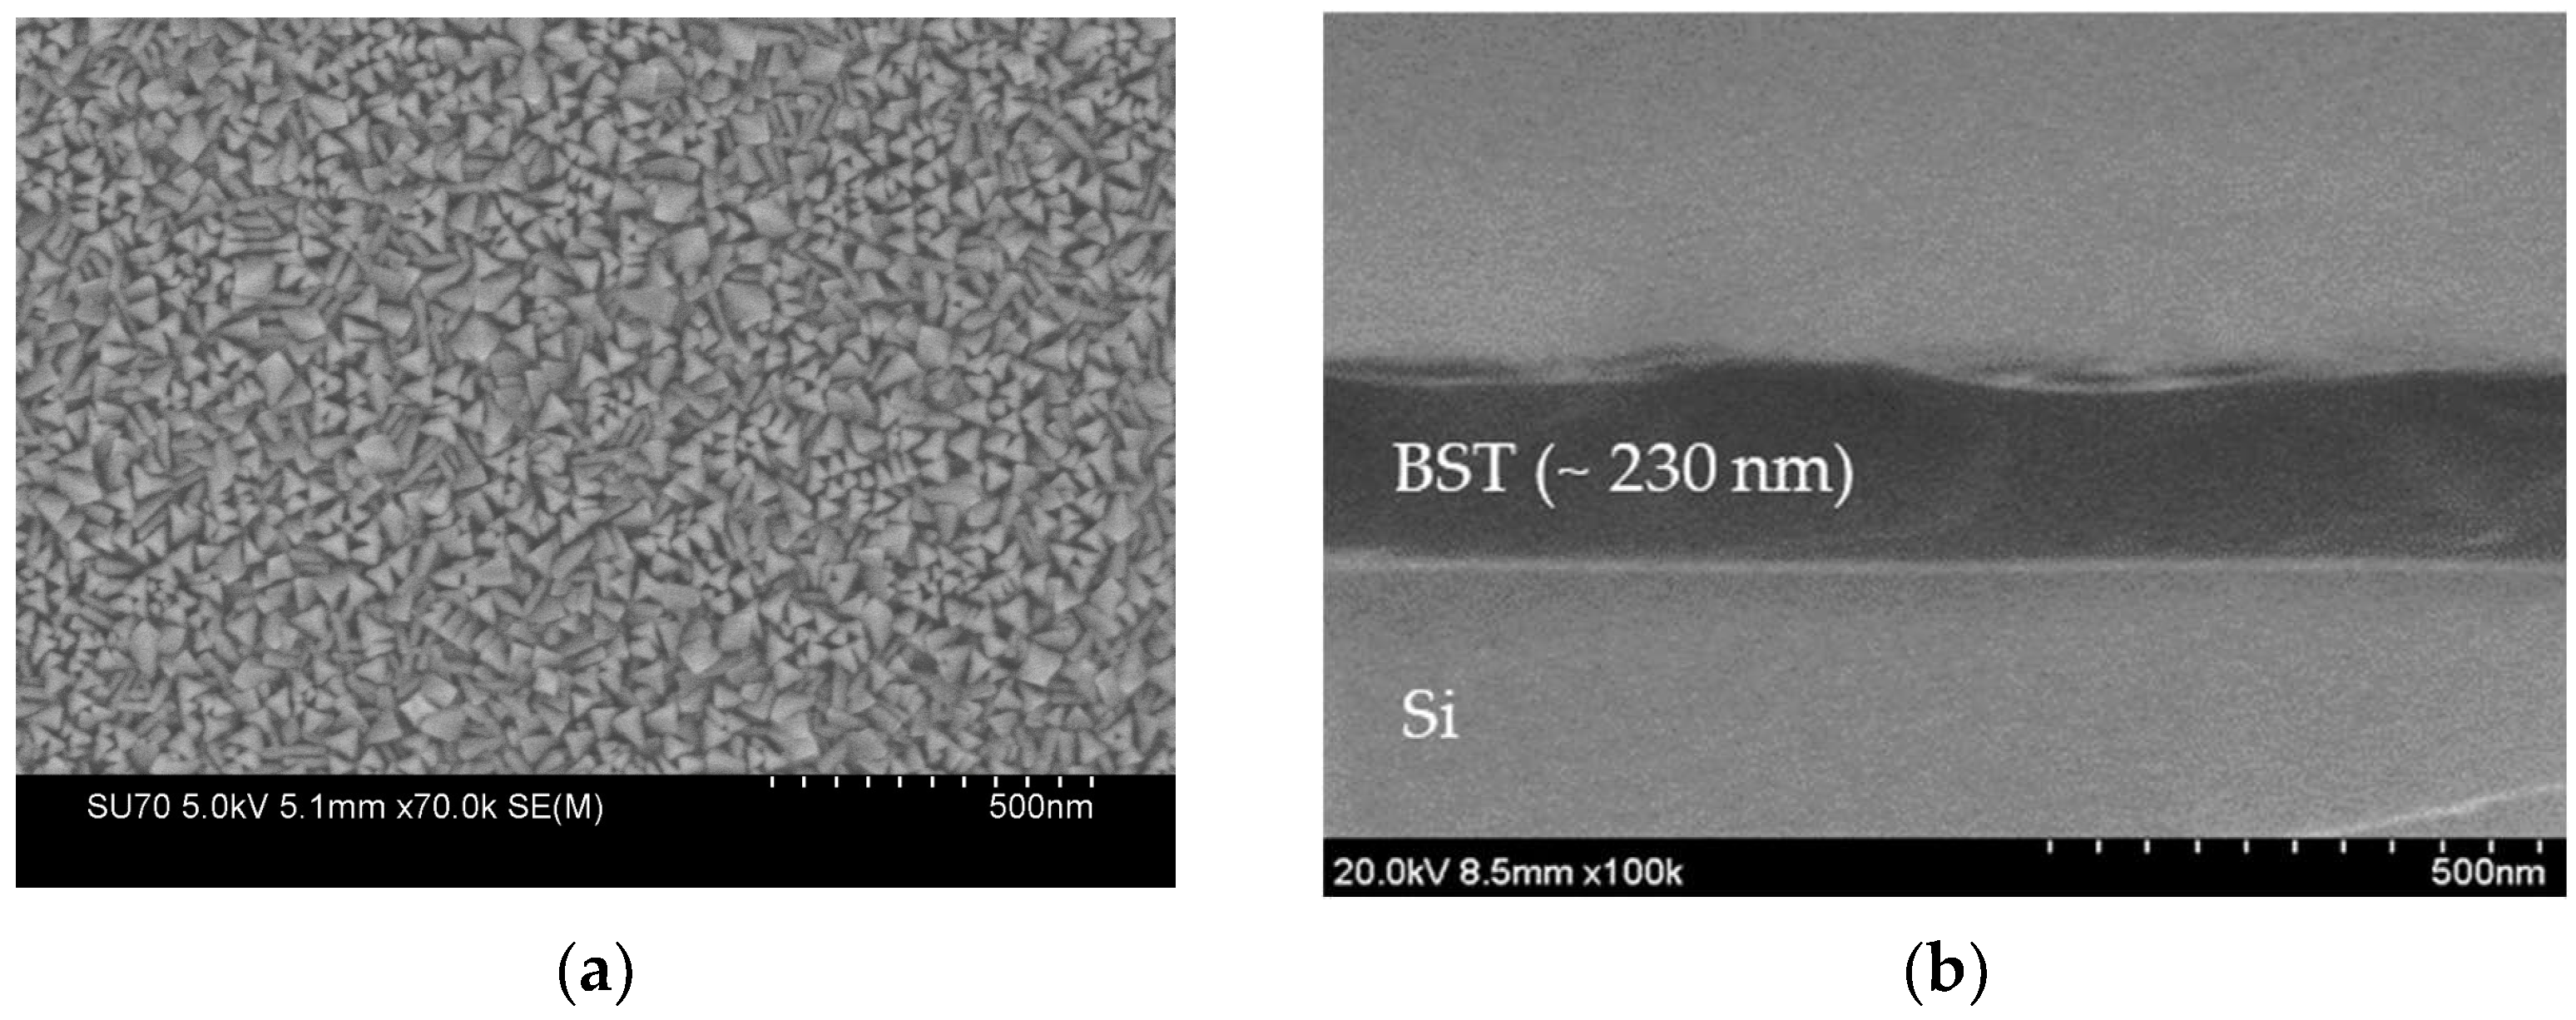
3.1. Film Characterization

BST films were deposited on high resistivity silicon and sapphire substrates using PLD, and their crystal structures were analyzed using XRD. Figure 5 shows the XRD patterns obtained for both samples. It is evident that the diffraction peaks of the samples were sharp and strong in intensity, revealing that the samples were completely crystallized. Moreover, the XRD peaks of the samples were well-matched with those for the cubic crystal structure of BST. For example, the 2θ diffraction peaks of the BST film deposited on sapphire substrate at 31.8°, 39.3°, 45.8° and 66.7° were indexed to the (0 1 1), (1 1 1), (0 2 0) and (0 2 2) planes of BST (JCPDS card No. 34-0411). Furthermore, there were no other diffraction peaks, which indicated the purity of the BST film. Similarly, the diffraction peaks of the BST film deposited on silicon at 22.3°, 31.8°, 45.8° and 66.7° corresponded to the (0 1 0), (0 0 1), (0 2 0) and (0 2 2) planes. However, other peaks were also identified at 29.1° and 34.5°, suggesting the existence of impurities in the sample. Sapphire was selected as a substrate to fabricate SAW sensors.
Figure 6 shows the surface and cross-sectional SEM images of the BST films deposited on platinum and silicon substrates, respectively. As can be seen in Figure 6a, the grains of the BST were uniformly distributed across the surface of the film, confirming the quality of the samples. Moreover, the cross-sectional SEM image reveals that the BST thin film had a dense and integrated structure, reflecting the crystallization of the Ba0.6Sr0.4TiO3 film. It also exhibits a uniform thickness of 230 nm and excellent adhesion to the substrate. The characterization of the In-doped SnO2 films were reported in the previous paper [32]. The EDS elementary mapping of In, Sn and O confirms that all elements were uniformly distributed in the sensing film.

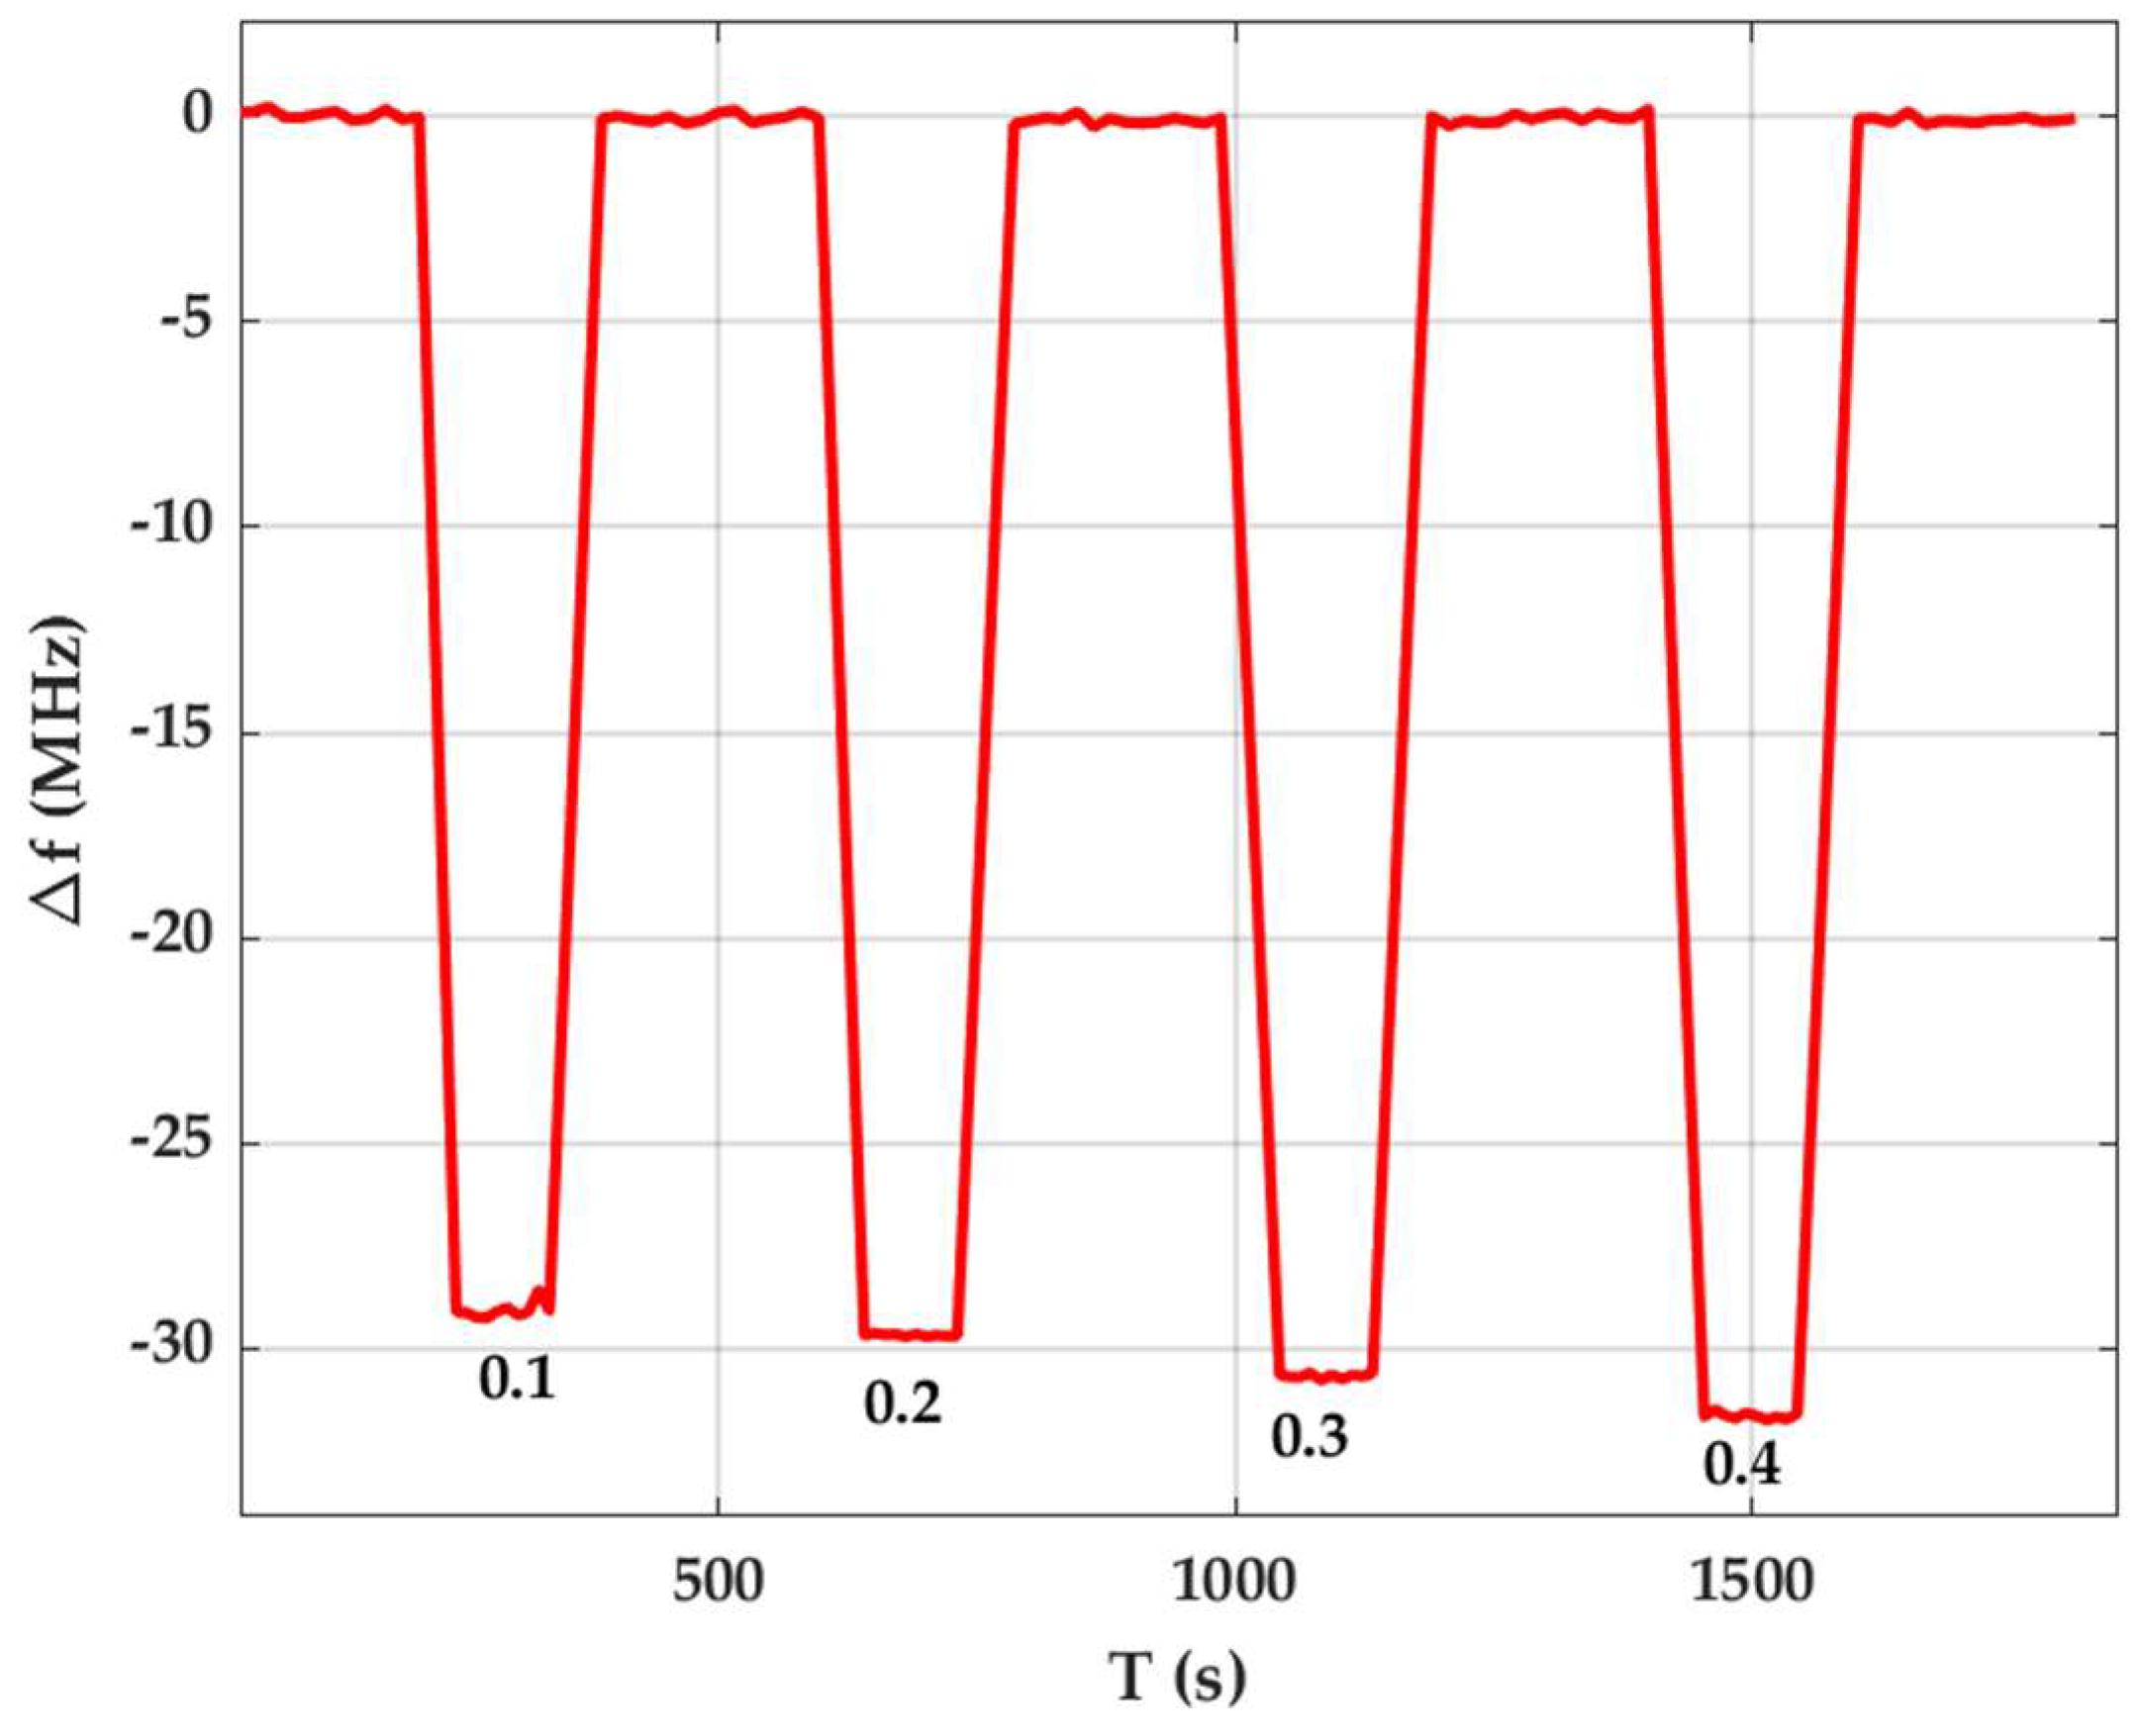
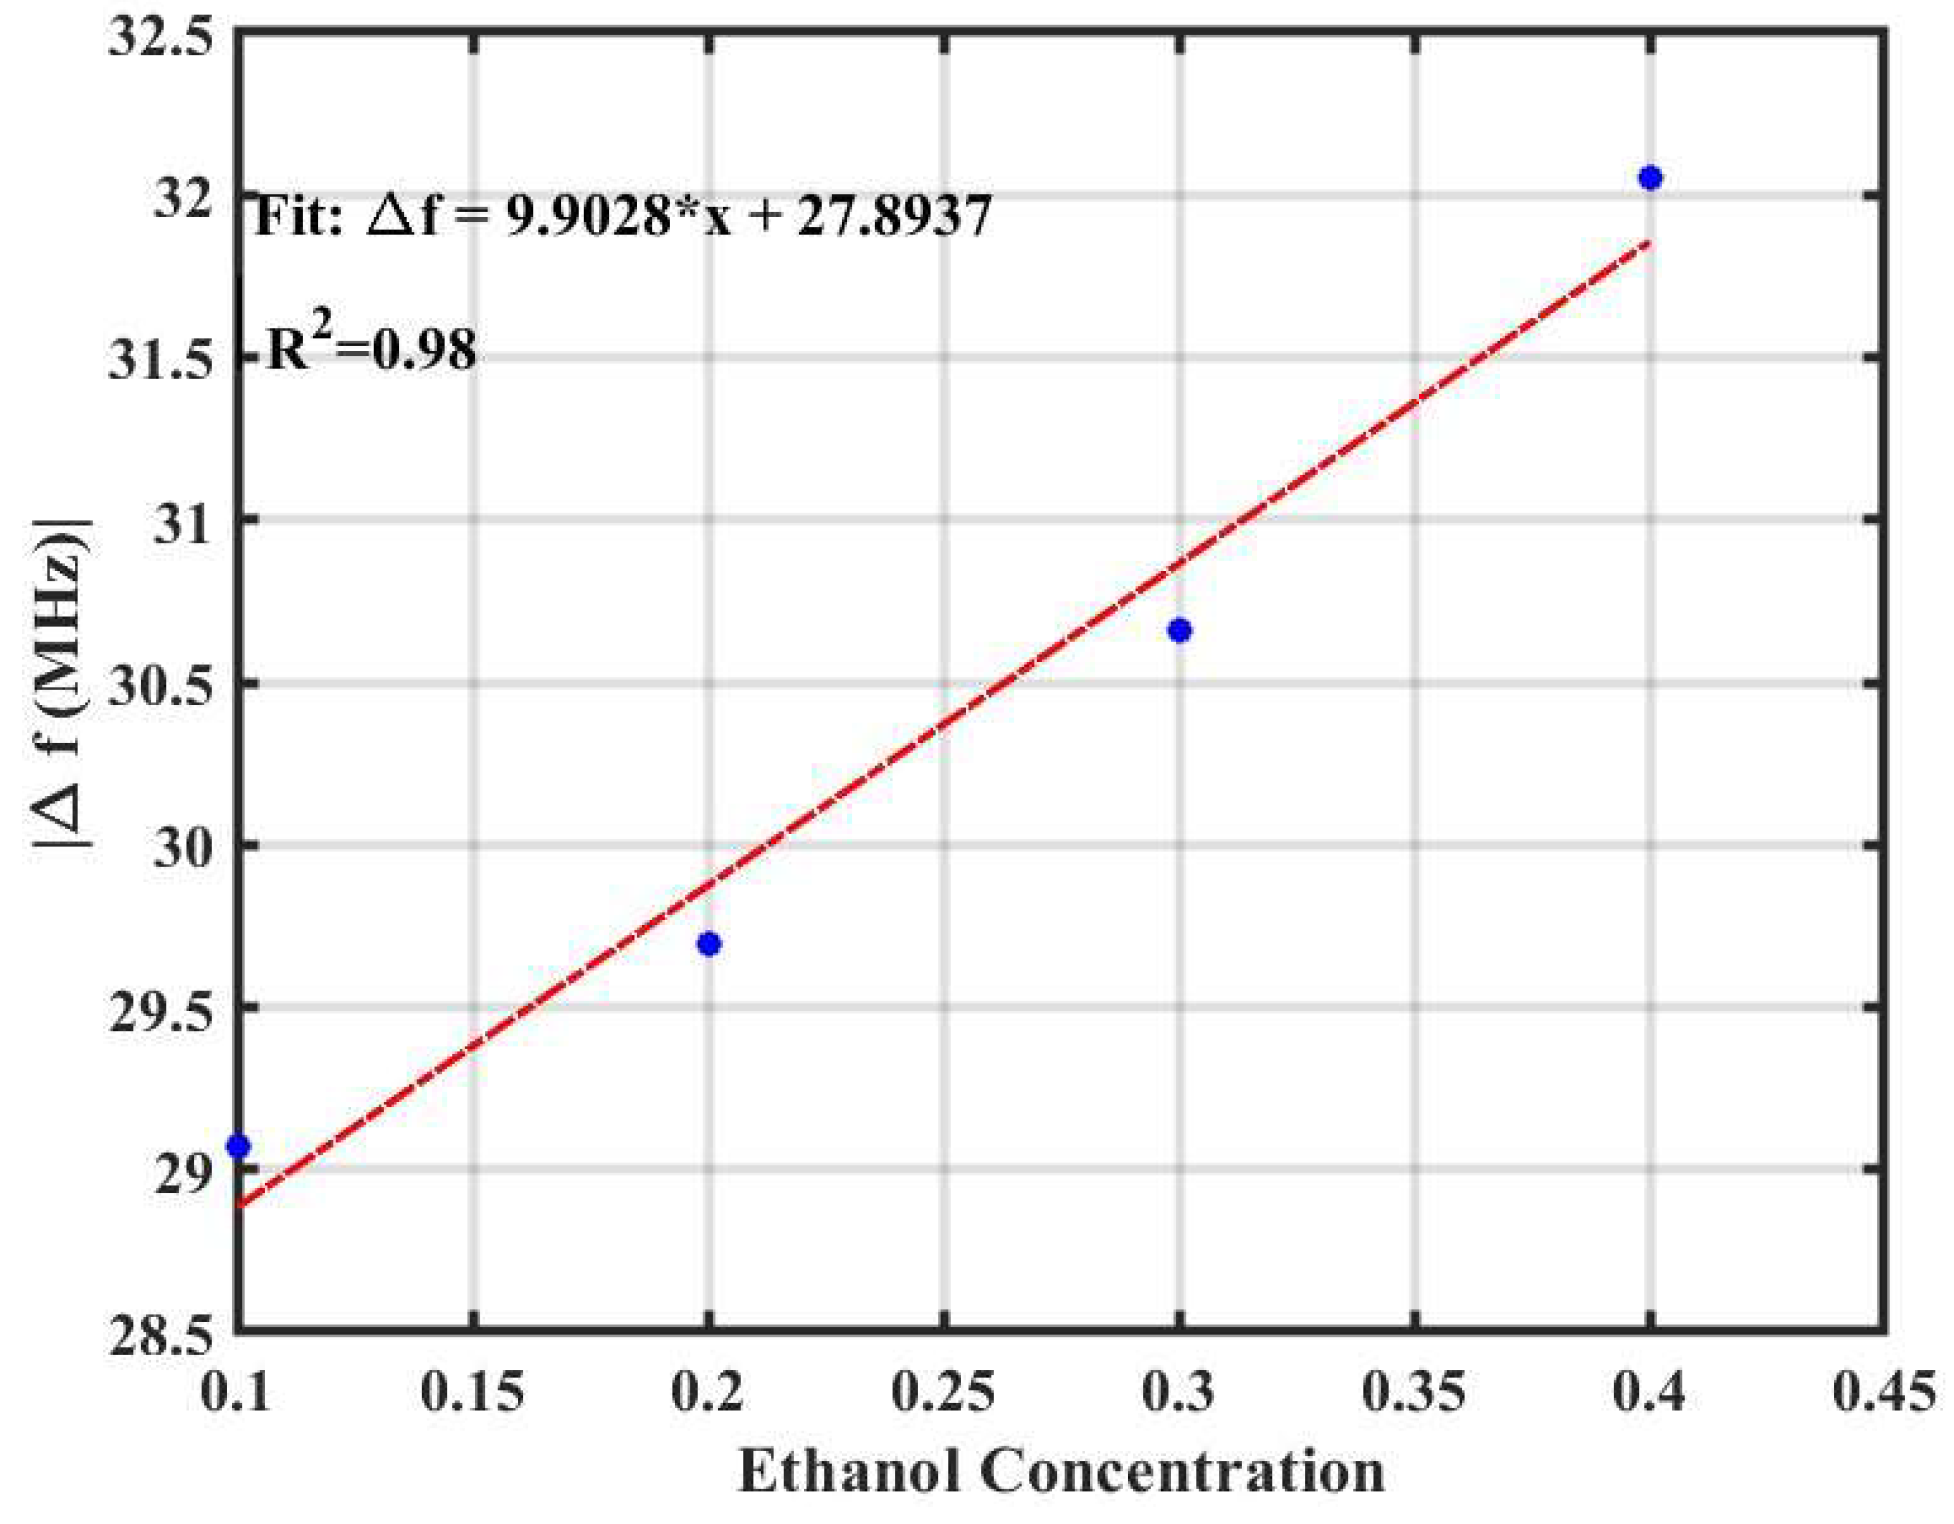
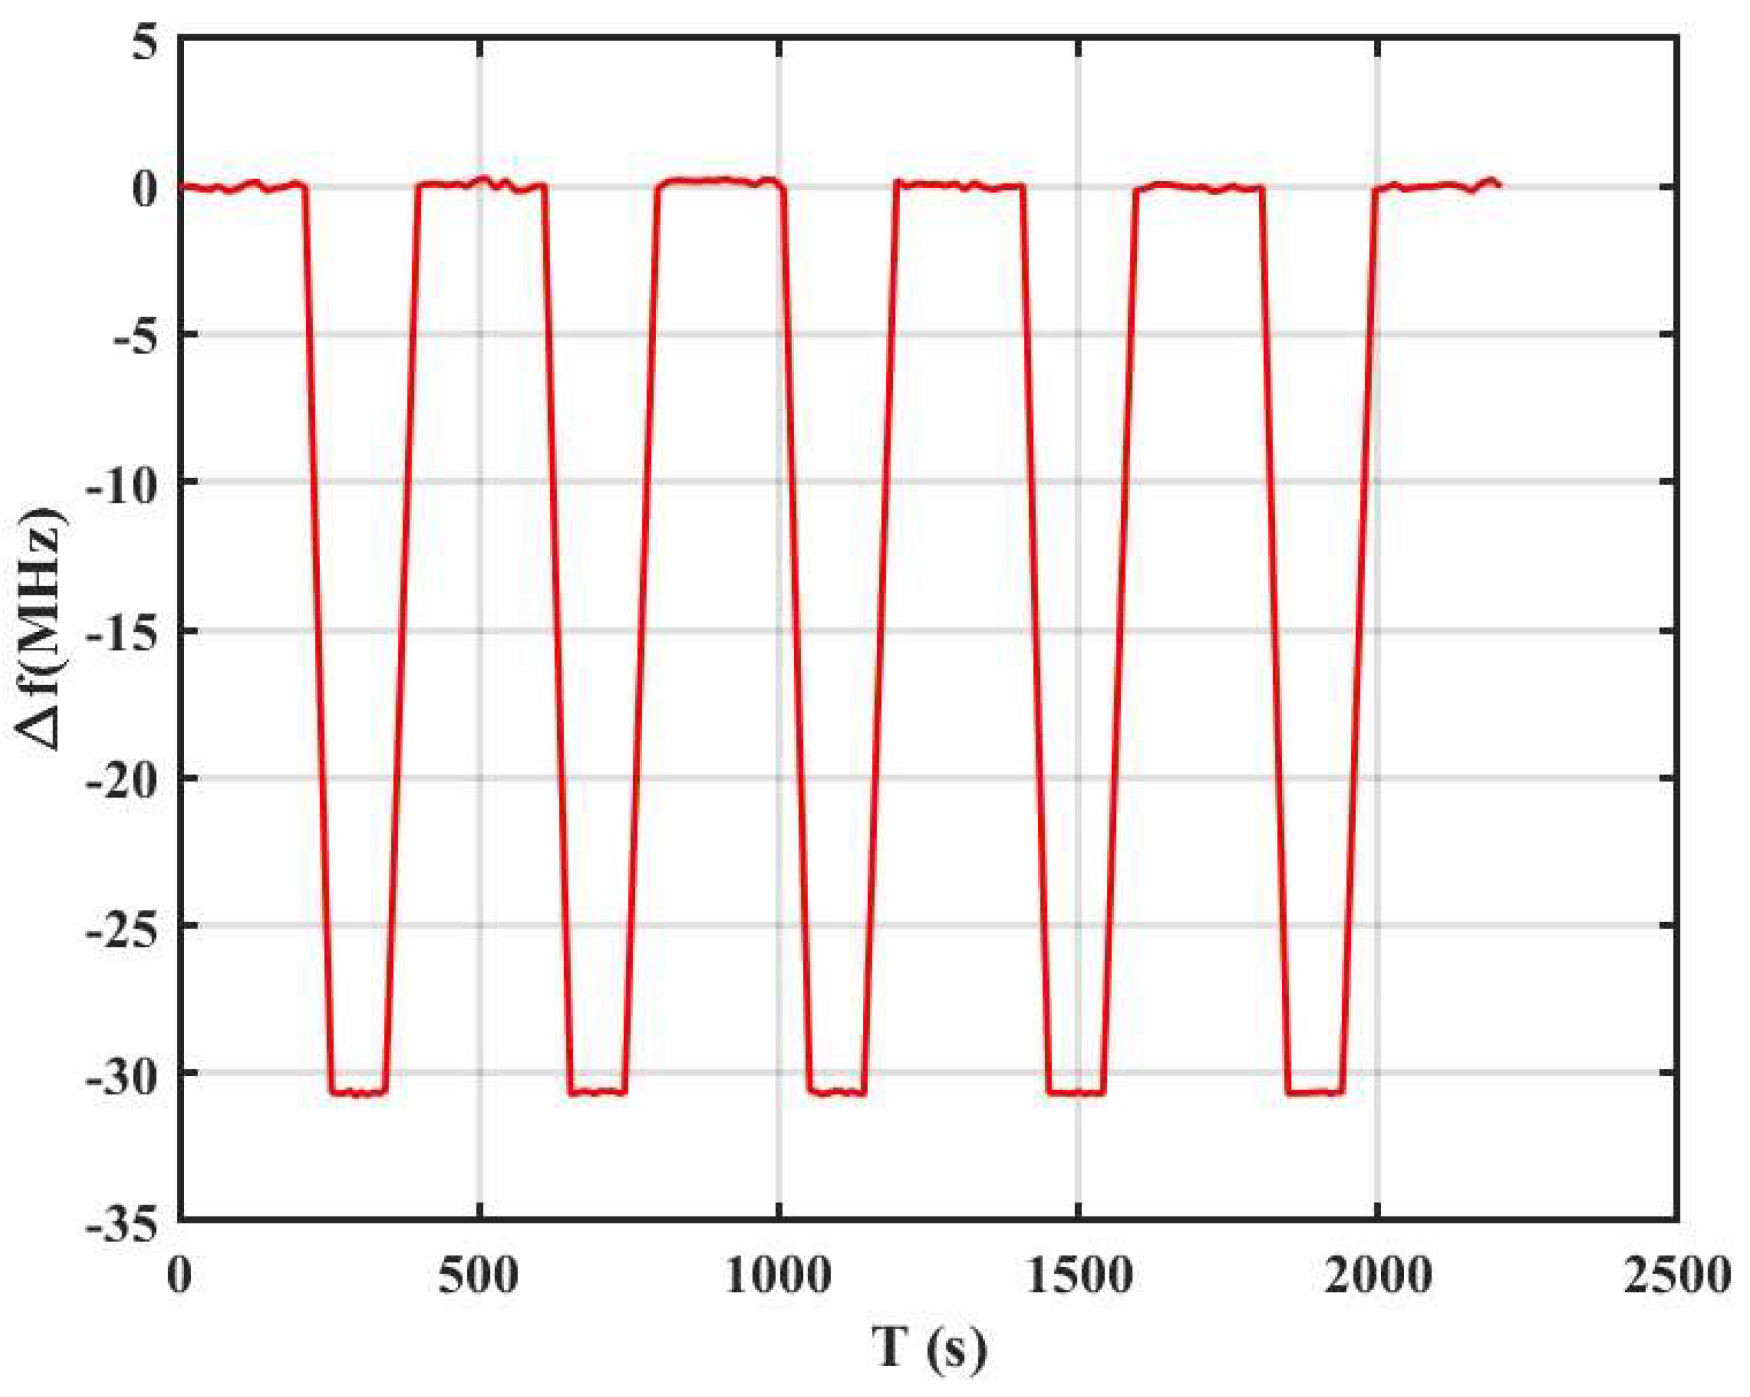
3.2. Gas Sensing Performance

Figure 7 illustrates the responses of the fabricated SAW sensor when exposed to different concentrations of ethanol. The frequency shift (∆f) was defined as the difference between fev and fo, where fo and fev were the central frequency of the sensor in N2 and ethanol, respectively. The flow rates of the carrier gas, vc, and the dilution gas, vd, were adjusted to obtain different concentrations of ethanol. The flow rates ratio expressed as vc/(vd + vc) were used to represent the concentration of ethanol based on the above equation. As can be seen in Figure 7, the BST-based SAW gas sensor exhibited a differential negative frequency shift that rose with an increase in ethanol concentration ranging from 0.1 to 0.4 as a function of time. For example, the sensor had a response of ~ 28.6   M H z to a flow rate ratio of 0.1, and the response can be as large as ~ 32.1   M H z when the ethanol concentration increased to 0.4. Additionally, it is worth noting that the response (∆f) was related to the concentration of ethanol vapor, which can be used to determine the responses of the sensor towards any concentration of ethanol vapor in the range of 0.1−0.4, as shown in Figure 8. It is evident that, with an increase in the ethanol concentration, the response value of the sensor increased linearly. Linearity of 0.993 was achieved.
Another key parameter used to evaluate the performance of a sensor is reproducibility. The reproducibility of the SAW sensor was investigated by evaluating the response of the sensor to exposure of N2-ethanol-N2 at a certain ethanol concentration. These experimental procedures were performed for five successive cycles while keeping the ethanol concentration at a flow rate ratio of 0.3. A typical response curve is shown in Figure 9. The sensor response was nearly identical throughout the five cycles, which demonstrated the reproducibility of the sensor. Finally, the response time and recovery time were determined. Response time is defined as the time it takes for the sensor response to reach 90% of its maximum after exposure to the analytic gas, while recovery time is the time it takes for the sensor response to drop 10% of its baseline values after the gas is removed. The fabricated SAW gas sensor exhibited a fast response time of ∼39 s and a fast recovery time of ~50 s. The sensing responses of various SnO2-based ethanol sensors that have been reported recently are compared in Table 1. The table clearly shows that the response time and recovery time of the SAW sensor reported in this paper are comparable to those of others. The most noticeable difference in the comparison is the low operating temperature of our sensor, which is essential for practical applications.

3.3. Gas Sensing Mechanism

A SAW sensor uses the piezoelectric effect principle to convert an electrical signal to a mechanical wave. The mechanical wave then travels through the surface of the piezoelectric film to the other interdigitated transducer structures, where the mechanical signal is converted back to an electric signal [39,40]. The absorption or desorption of ethanol molecules on the surface of the indium doped SnO2 film causes a perturbation of surface acoustic wave propagation, thus changing the center frequency of the SAW sensor. The changes in the sheet conductivity (electric loading), mass loading on the film (mass loading) and Young’s modulus (elastic loading) can affect the center frequency or sensitivity of the SAW gas sensor after ethanol molecule adsorption [41,42,43]. The effect of electric loading on the response (Δf) of the SAW gas sensor can be explained using the following equation [41,42]:
Δ f = f 0 × K 2 2 × Δ 1 1 + v 0 C s σ s 2
where f 0 and v 0 are the center frequency of the SAW sensor and the acoustic velocity of BST and K 2 is the electromechanical coupling coefficient of the BST film. Additionally, C s and σ s represent the capacitance per unit length of the sensor and the sheet conductivity of the sensing film. To identify the contribution of the electric loading, the v 0 C s σ s term was analyzed. It was found that the value of   v 0 C s σ s is <<1 since σ s is greater than 1, while C s is mostly in the range of a few pF/cm [43]. This suggests that the change in concentration or sheet conductivity hardly contributes to the electric loading effect. However, due to the high center frequency and K 2   [44], Δ f in the above equation can be as high as a few megahertz. Therefore, it can be assumed that the electric loading effect was one of the causes of the higher response of the sensor. The effect of mass loading and elastic loading can be described using the equation below [41,42]:
Δ f = C m × f 0 2 × Δ ρ s + C e f 0 h Δ 4 μ v 0 2 × μ + λ μ + 2 λ
where μ and λ are the shear and bulk modulus of elasticity, Cm and Ce represent the sensitivity coefficients of mass and elasticity, respectively, and h and ρ s are the thickness and density per unit area of the sensing film. The first term refers to the mass loading effect that causes a negative frequency shift and is a function of the gas concentration (Cm). The second term represents the contribution of elastic loading of the sensing layer and results in a positive frequency shift. The above equation can also be expressed in terms of the change in Young’s modulus ( Δ E ) and the mass ( Δ m ) of the sensing film [45],
Δ f = q Δ m + p Δ E
where p and q are positive constants that include all other constants. As shown in Figure 7, the frequency shift was negative during exposure to ethanol vapor, demonstrating that the mass loading effect was more dominant than the elastic loading effect. Thus, the large negative frequency shifts of the SAW sensor were mainly attributed to the mass loading and the electric loading effects.

4. Conclusions

In summary, Ba0.6Sr0.4TiO3-based SAW gas sensors with In-doped SnO2 sensing film were successfully fabricated using the PLD technique and a conventional photolithography process. As-deposited films were analysed using different characterization techniques. The performance of the fabricated gas sensor was validated by exposing it to different concentrations of ethanol at room temperature. The sensor exhibited a negative Δf. The sensor was also able to detect ethanol concentrations ranging from 0.1 to 0.4 with a fast response time and recovery time. Moreover, the sensor exhibited good reproducibility. The source of the large negative frequency shifts of the SAW sensor was attributed to the mass and electric loading effects of the In-doped SnO2 sensing film. Finally, the gas sensing mechanism of the In-doped SnO2-based SAW sensor with BST thin film was presented briefly. Overall, we anticipated that the fabricated In-doped SnO2-based SAW gas sensor with BST thin film could be suitable for practical room-temperature-gas-sensing applications.

Author Contributions

Conceptualization, B.A., K.A. and G.S.; methodology, B.A. and E.S.; formal analysis, B.A.; investigation, B.A., K.A., E.S. and G.S.; resources, E.S. and G.S.; writing—original draft preparation, B.A.; writing—review and editing, K.A., E.S. and G.S.; supervision, G.S. and E.S.; project administration, G.S.; funding acquisition, G.S. All authors have read and agreed to the published version of the manuscript.

Funding

This research received no external funding.

Data Availability Statement

Data is contained within the article.

Acknowledgments

The authors thank the funding support from CETRASE, University of Dayton, for this research.

Conflicts of Interest

The authors declare no conflicts of interest.

References

  1. Cole, M.; Spulber, I.; Gardner, J.W. Surface Acoustic Wave Electronic Tongue for Robust Analysis of Sensory Components. Sens. Actuators B Chem. 2015, 207, 1147–1153. [Google Scholar] [CrossRef]
  2. Li, D.; Zu, X.; Ao, D.; Tang, Q.; Fu, Y.; Guo, Y.; Bilawal, K.; Faheem, M.B.; Li, L.; Li, S. High Humidity Enhanced Surface Acoustic Wave (SAW) H2S Sensors Based on Sol–Gel CuO Films. Sens. Actuators B Chem. 2019, 294, 55–61. [Google Scholar] [CrossRef]
  3. Devkota, J.; Greve, D.W.; Hong, T.; Kim, K.-J.; Ohodnicki, P.R. An 860 MHz Wireless Surface Acoustic Wave Sensor with a Metal-Organic Framework Sensing Layer for CO2 and CH4. IEEE Sens. J. 2020, 20, 9740–9747. [Google Scholar] [CrossRef]
  4. Pan, Y.; Zhang, G.; Guo, T.; Liu, X.; Zhang, C.; Yang, J.; Cao, B.; Zhang, C.; Wang, W. Environmental Characteristics of Surface Acoustic Wave Devices for Sensing Organophosphorus Vapor. Sens. Actuators B Chem. 2020, 315, 127986. [Google Scholar] [CrossRef]
  5. Wang, J.; Guo, Y.; Long, G.; Tang, Y.L.; Tang, Q.; Zu, X.-T.; Ma, J.; Du, B.; Torun, H.; Fu, Y. Integrated Sensing Layer of Bacterial Cellulose and Polyethyleneimine to Achieve High Sensitivity of ST-Cut Quartz Surface Acoustic Wave Formaldehyde Gas Sensor. J. Hazard. Mater. 2020, 388, 121743. [Google Scholar] [CrossRef] [PubMed]
  6. Tang, Y.-L.; Li, Z.-J.; Ma, J.-Y.; Guo, Y.-J.; Fu, Y.-Q.; Zu, X.-T. Ammonia Gas Sensors Based on ZnO/SiO2 Bi-Layer Nanofilms on ST-Cut Quartz Surface Acoustic Wave Devices. Sens. Actuators B Chem. 2014, 201, 114–121. [Google Scholar] [CrossRef]
  7. Cleland, A.; Pophristic, M.; Ferguson, I. Single-Crystal Aluminum Nitride Nanomechanical Resonators. Appl. Phys. Lett. 2001, 79, 2070–2072. [Google Scholar] [CrossRef]
  8. Fu, Y.Q.; Luo, J.; Nguyen, N.-T.; Walton, A.; Flewitt, A.J.; Zu, X.-T.; Li, Y.; McHale, G.; Matthews, A.; Iborra, E. Advances in Piezoelectric Thin Films for Acoustic Biosensors, Acoustofluidics and Lab-on-Chip Applications. Prog. Mater. Sci. 2017, 89, 31–91. [Google Scholar] [CrossRef]
  9. Liang, L.; Kang, X.; Sang, Y.; Liu, H. One-dimensional Ferroelectric Nanostructures: Synthesis, Properties, and Applications. Adv. Sci. 2016, 3, 1500358. [Google Scholar] [CrossRef]
  10. Liu, M.; Ma, C.; Collins, G.; Liu, J.; Chen, C.; Alemayehu, A.D.; Subramanyam, G.; Ding, Y.; Chen, J.; Dai, C. Ferroelectric BaTiO3/SrTiO3 Multilayered Thin Films for Room-Temperature Tunable Microwave Elements. Nanoscale Res. Lett. 2013, 8, 338. [Google Scholar] [CrossRef]
  11. Varanasi, C.; Leedy, K.; Tomich, D.; Subramanyam, G. Large Area Ba1− xSrxTiO3 Thin Films for Microwave Applications Deposited by Pulsed Laser Ablation. Thin Solid Film. 2009, 517, 2878–2881. [Google Scholar] [CrossRef]
  12. Annam, K.; Spatz, D.; Shin, E.; Subramanyam, G. Experimental Verification of Microwave Phase Shifters Using Barium Strontium Titanate (BST) Varactors. In Proceedings of the 2019 IEEE National Aerospace and Electronics Conference (NAECON), Dayton, OH, USA, 15–19 July 2019; IEEE: Piscataway, NJ, USA, 2019; pp. 63–66. [Google Scholar]
  13. Annam, K. Reconfigurable RF/Microwave and Millimeterwave Circuits Using Thin Films of Barium Strontium Titanate and Phase Change Materials; University of Dayton: Dayton, OH, USA, 2021; ISBN 9798780609728. [Google Scholar]
  14. Goud, J.P.; Kumar, A.; Alkathy, M.S.; Sandeep, K.; Raman, A.; Sahoo, B.; Ryu, J.; Raju, K.J. Thickness Dependence of Microwave Dielectric Tunability in Ba0.5Sr0.5TiO3 Thin Films Deposited by Pulsed Laser Deposition. Ceram. Int. 2023, 49, 1188–1194. [Google Scholar] [CrossRef]
  15. Gevorgian, S.S.; Tagantsev, A.K.; Vorobiev, A.K. Tuneable Film Bulk Acoustic Wave Resonators; Springer: Berlin/Heidelberg, Germany, 2013; ISBN 1-4471-4944-0. [Google Scholar]
  16. Sandeep, K.; Pundareekam Goud, J.; James Raju, K. Resonant Spectrum Method for Characterizing Ba0.5Sr0.5TiO3 Based High Overtone Bulk Acoustic Wave Resonators. Appl. Phys. Lett. 2017, 111, 012901. [Google Scholar] [CrossRef]
  17. Kongbrailatpam, S.S.; Goud, J.P.; Raju, K.J. The Effects of a Coated Material Layer on High-Overtone Bulk Acoustic Resonator and Its Possible Applications. IEEE Trans. Ultrason. Ferroelectr. Freq. Control 2020, 68, 1253–1260. [Google Scholar] [CrossRef] [PubMed]
  18. Goud, J.P.; Kumar, A.; Sandeep, K.; Ramakanth, S.; Ghoshal, P.; Raju, K.C.J. Tunable Microwave Device Fabrication on Low-Temperature Crystallized Ba0. 5Sr0. 5TiO3 Thin Films by an Alternating Deposition and Laser Annealing Process. Adv. Electron. Mater. 2021, 7, 2000905. [Google Scholar] [CrossRef]
  19. Constantinoiu, I.; Viespe, C. Development of Pd/TiO2 Porous Layers by Pulsed Laser Deposition for Surface Acoustic Wave H2 Gas Sensor. Nanomaterials 2020, 10, 760. [Google Scholar] [CrossRef] [PubMed]
  20. Arafat, M.; Dinan, B.; Akbar, S.A.; Haseeb, A. Gas Sensors Based on One Dimensional Nanostructured Metal-Oxides: A Review. Sensors 2012, 12, 7207–7258. [Google Scholar] [CrossRef]
  21. Wang, L.; Ma, S.; Li, J.; Wu, A.; Luo, D.; Yang, T.; Cao, P.; Ma, N.; Cai, Y. Mo-Doped SnO2 Nanotubes Sensor with Abundant Oxygen Vacancies for Ethanol Detection. Sens. Actuators B Chem. 2021, 347, 130642. [Google Scholar] [CrossRef]
  22. Chen, Y.; Yu, L.; Feng, D.; Zhuo, M.; Zhang, M.; Zhang, E.; Xu, Z.; Li, Q.; Wang, T. Superior Ethanol-Sensing Properties Based on Ni-Doped SnO2 p–n Heterojunction Hollow Spheres. Sens. Actuators B Chem. 2012, 166, 61–67. [Google Scholar] [CrossRef]
  23. Rao, A.; Long, H.; Harley-Trochimczyk, A.; Pham, T.; Zettl, A.; Carraro, C.; Maboudian, R. In Situ Localized Growth of Ordered Metal Oxide Hollow Sphere Array on Microheater Platform for Sensitive, Ultra-Fast Gas Sensing. ACS Appl. Mater. Interfaces 2017, 9, 2634–2641. [Google Scholar] [CrossRef]
  24. Wang, Y.; Liu, C.; Wang, L.; Liu, J.; Zhang, B.; Gao, Y.; Sun, P.; Sun, Y.; Zhang, T.; Lu, G. Horseshoe-Shaped SnO2 with Annulus-like Mesoporous for Ethanol Gas Sensing Application. Sens. Actuators B Chem. 2017, 240, 1321–1329. [Google Scholar] [CrossRef]
  25. Shaikh, F.; Chikhale, L.; Nadargi, D.; Mulla, I.; Suryavanshi, S. Structural, Optical and Ethanol Sensing Properties of Dy-Doped SnO2 Nanoparticles. J. Electron. Mater. 2018, 47, 3817–3828. [Google Scholar] [CrossRef]
  26. Nascimento, E.P.; Firmino, H.C.; Santos, A.M.; Sales, H.B.; Silva, V.D.; Macedo, D.A.; Neves, G.A.; Medeiros, E.S.; Menezes, R.R. Facile Synthesis of Hollow F-doped SnO2 Nanofibers and Their Efficiency in Ethanol Sensing. J. Am. Ceram. Soc. 2021, 104, 1297–1308. [Google Scholar] [CrossRef]
  27. Jin, W.; Ma, S.; Tie, Z.; Li, W.; Luo, J.; Cheng, L.; Xu, X.; Wang, T.; Jiang, X.; Mao, Y. Synthesis of Hierarchical SnO2 Nanoflowers with Enhanced Acetic Acid Gas Sensing Properties. Appl. Surf. Sci. 2015, 353, 71–78. [Google Scholar] [CrossRef]
  28. Shooshtari, M.; Salehi, A.; Vollebregt, S. Effect of Temperature and Humidity on the Sensing Performance of TiO2 Nanowire-Based Ethanol Vapor Sensors. Nanotechnology 2021, 32, 325501. [Google Scholar] [CrossRef] [PubMed]
  29. Wang, Q.; Bai, J.; Huang, B.; Hu, Q.; Cheng, X.; Li, J.; Xie, E.; Wang, Y.; Pan, X. Design of NiCo2O4@ SnO2 Heterostructure Nanofiber and Their Low Temperature Ethanol Sensing Properties. J. Alloys Compd. 2019, 791, 1025–1032. [Google Scholar] [CrossRef]
  30. Inyawilert, K.; Sukee, A.; Siriwalai, M.; Wisitsoraat, A.; Sukunta, J.; Tuantranont, A.; Phanichphant, S.; Liewhiran, C. Effect of Er Doping on Flame-Made SnO2 Nanoparticles to Ethylene Oxide Sensing. Sens. Actuators B Chem. 2021, 328, 129022. [Google Scholar] [CrossRef]
  31. Varanasi, C.; Leedy, K.D.; Tomich, D.H.; Subramanyam, G.; Look, D.C. Improved Photoluminescence of Vertically Aligned ZnO Nanorods Grown on BaSrTiO3 by Pulsed Laser Deposition. Nanotechnology 2009, 20, 385706. [Google Scholar] [CrossRef]
  32. Alemayehu, B.; Shin, E.; Vasilyev, V.; Subramanyam, G. Synthesis and Characterization of Indium-Doped SnO2-Based Impedance Spectroscopy Sensor for Real-Time Humidity Sensing Applications. Crystals 2024, 14, 82. [Google Scholar] [CrossRef]
  33. Thomson, G.W. The Antoine Equation for Vapor-Pressure Data. Chem. Rev. 1946, 38, 1–39. [Google Scholar] [CrossRef]
  34. Shaikh, F.; Chikhale, L.; Mulla, I.; Suryavanshi, S. Facile Co-Precipitation Synthesis and Ethanol Sensing Performance of Pd Loaded Sr Doped SnO2 Nanoparticles. Powder Technol. 2018, 326, 479–487. [Google Scholar] [CrossRef]
  35. He, Y.; Tang, P.; Li, J.; Zhang, J.; Fan, F.; Li, D. Ultrafast Response and Recovery Ethanol Sensor Based on SnO2 Quantum Dots. Mater. Lett. 2016, 165, 50–54. [Google Scholar] [CrossRef]
  36. Ma, L.; Ma, S.; Kang, H.; Shen, X.; Wang, T.; Jiang, X.; Chen, Q. Preparation of Ag-Doped ZnO-SnO2 Hollow Nanofibers with an Enhanced Ethanol Sensing Performance by Electrospinning. Mater. Lett. 2017, 209, 188–192. [Google Scholar] [CrossRef]
  37. Kotchasak, N.; Wisitsoraat, A.; Tuantranont, A.; Phanichphant, S.; Yordsri, V.; Liewhiran, C. Highly Sensitive and Selective Detection of Ethanol Vapor Using Flame-Spray-Made CeOx-Doped SnO2 Nanoparticulate Thick Films. Sens. Actuators B Chem. 2018, 255, 8–21. [Google Scholar] [CrossRef]
  38. Qin, S.; Tang, P.; Feng, Y.; Li, D. Novel Ultrathin Mesoporous ZnO-SnO2 Nn Heterojunction Nanosheets with High Sensitivity to Ethanol. Sens. Actuators B Chem. 2020, 309, 127801. [Google Scholar] [CrossRef]
  39. Tang, Y.; Li, Z.; Ma, J.; Wang, L.; Yang, J.; Du, B.; Yu, Q.; Zu, X. Highly Sensitive Surface Acoustic Wave (SAW) Humidity Sensors Based on Sol–Gel SiO2 Films: Investigations on the Sensing Property and Mechanism. Sens. Actuators B Chem. 2015, 215, 283–291. [Google Scholar] [CrossRef]
  40. Kirschner, J. Surface Acoustic Wave Sensors (SAWS). Micromech. Syst. 2010, 6, 1–11. [Google Scholar]
  41. Tang, Y.; Xu, X.; Han, S.; Cai, C.; Du, H.; Zhu, H.; Zu, X.; Fu, Y. ZnO-Al2O3 Nanocomposite as a Sensitive Layer for High Performance Surface Acoustic Wave H2S Gas Sensor with Enhanced Elastic Loading Effect. Sens. Actuators B Chem. 2020, 304, 127395. [Google Scholar] [CrossRef]
  42. Tang, Y.; Wu, W.; Wang, B.; Dai, X.; Xie, W.; Yang, Y.; Zhang, R.; Shi, X.; Zhu, H.; Luo, J. H2S Gas Sensing Performance and Mechanisms Using CuO-Al2O3 Composite Films Based on Both Surface Acoustic Wave and Chemiresistor Techniques. Sens. Actuators B Chem. 2020, 325, 128742. [Google Scholar] [CrossRef]
  43. Tang, Y.; Ao, D.; Li, W.; Zu, X.; Li, S.; Fu, Y.Q. NH3 Sensing Property and Mechanisms of Quartz Surface Acoustic Wave Sensors Deposited with SiO2, TiO2, and SiO2-TiO2 Composite Films. Sens. Actuators B Chem. 2018, 254, 1165–1173. [Google Scholar] [CrossRef]
  44. Assali, A.; Kanouni, F.; Laidoudi, F.; Arab, F.; Bouslama, M. Structural and Electromechanical Properties of Sr-Substituted Barium Titanate (BST) as Potential Material for High Performance Electroacoustic Devices. Mater. Today Commun. 2020, 25, 101643. [Google Scholar]
  45. Raj, V.B.; Singh, H.; Nimal, A.; Sharma, M.; Tomar, M.; Gupta, V. Distinct Detection of Liquor Ammonia by ZnO/SAW Sensor: Study of Complete Sensing Mechanism. Sens. Actuators B Chem. 2017, 238, 83–90. [Google Scholar] [CrossRef]
Figure 1. Schematic representation of the fabrication process of a BST-based SAW gas sensor with In-doped SnO2 sensing film.
Crystals 14 00366 g001
Figure 2. A microscopic picture of the fabricated SAW gas sensor.
Crystals 14 00366 g002
Figure 3. S21 measurement of the BST based SAW sensor with Indium doped SnO2 with a 2.5 µm of finger width and spacing of the IDT structures. The fundamental resonance was around 550 MHz. Higher order resonances can also be seen.
Crystals 14 00366 g003
Figure 4. Schematic illustration of ethanol vapor sensing measurement test setup. The flow rates were controlled using the two MFCs, and the sensor was mounted inside the gas chamber and connected to the network analyzer to record the data.
Crystals 14 00366 g004
Figure 5. XRD patterns of the BST films grown on silicon and sapphire substrates using PLD.
Crystals 14 00366 g005
Figure 6. SEM images of BST films deposited on different substrates: (a) top-view; (b) cross-sectional view of the BST film on Si.
Crystals 14 00366 g006
Figure 7. Dynamic response of the BST based SAW sensor with In-doped SnO2 at different concentrations of ethanol (at flow rates ratio of 0.1, 0.2, 0.3 and 0.4) at room temperature.
Crystals 14 00366 g007
Figure 8. Fit for a plot of frequency shift versus concentration of ethanol.
Crystals 14 00366 g008
Figure 9. The reproducibility of the fabricated sensor at ethanol concentration of 0.3.
Crystals 14 00366 g009
Table 1. Comparison of the sensing response of ethanol sensors based on SnO2 materials.
Sensing MaterialsT [°C]Response TimeRecovery TimeRefs.
Pd loaded Sr doped SnO227015[34]
SnO2 Quantum dots19011[35]
Ag-doped ZnO-SnO220055[36]
Ce-doped SnO23501120 [37]
ZnO-SnO2 heterostructures240724[38]
In-doped SnO2RT3950This work
Disclaimer/Publisher’s Note: The statements, opinions and data contained in all publications are solely those of the individual author(s) and contributor(s) and not of MDPI and/or the editor(s). MDPI and/or the editor(s) disclaim responsibility for any injury to people or property resulting from any ideas, methods, instructions or products referred to in the content.

