Article

Structural Study of Nematogenic Compound 5OS5

by
Aleksandra Deptuch
1,*,
Bartosz Sęk
2,
Sebastian Lalik
3,
Wojciech Zając
1,
Mirosława D. Ossowska-Chruściel
4,
Janusz Chruściel
4 and
Monika Marzec
3
1
Institute of Nuclear Physics Polish Academy of Sciences, Radzikowskiego 152, PL-31342 Kraków, Poland
2
Faculty of Physics and Applied Computer Science, AGH University of Kraków, Reymonta 19, PL-30059 Kraków, Poland
3
Institute of Physics, Jagiellonian University, Łojasiewicza 11, PL-30348 Kraków, Poland
4
Faculty of Science, University of Siedlce, 3 Maja 54, PL-08110 Siedlce, Poland
*
Author to whom correspondence should be addressed.
Crystals 2024, 14(4), 367; https://doi.org/10.3390/cryst14040367
Submission received: 25 March 2024 / Revised: 9 April 2024 / Accepted: 12 April 2024 / Published: 13 April 2024
(This article belongs to the Special Issue Liquid Crystal Research and Novel Applications in the 21st Century)

Abstract

:
The S-(4-pentylphenyl) 4-(pentyloxy)benzothioate, forming the nematic phase, is investigated by X-ray diffraction in temperatures between 263 K and 365 K, with the support of differential scanning calorimetry and polarizing optical microscopy. The microscopic observations show changes within the solid state, while X-ray diffraction does not indicate any transitions between the crystal phases. The Rietveld refinement shows that the crystal phase formed from the melt is the same monoclinic crystal phase with the P21/c space group as reported for a single crystal grown from an ethanol solution. The temperature dependence of the unit cell parameters in the 263–335 K range is determined and the coefficients of thermal expansion are obtained. The unit cell expands on heating along the longer ac-diagonal and b-axis while, along the shorter ac-diagonal, a very small shrinkage occurs. The diffraction patterns of the liquid crystalline nematic phase indicate the formation of dimers via hydrogen bonding. Density functional theory calculations (def2TZVPP basis set, B3LYP-D3(BJ) correlation-exchange functional) are applied for geometry optimization of an isolated molecule and selected dimers.

Graphical Abstract

1. Introduction

The nematic phase is the simplest liquid crystalline phase, which possesses only the long-range orientational order. The long axes of molecules are oriented on average in a common direction, denoted by the director versor n ^ (Figure 1a). The nematic phase does not show long-range positional order, but short-range positional order is present [1,2]. Compounds forming the nematic phase have an important place in the display technology, which is continuously developed [3,4,5]. They are also subjects of ongoing basis studies, as new types of the nematic phase are searched for, e.g., biaxial or twist-bend nematics [6,7,8]. S-(4-pentylphenyl) 4-(alkyloxy)benzothioates (Figure 1b) are the homologous series known from their mesomorphic properties, which depend on the length of the CnH2n+1 chain [9,10,11,12,13,14,15,16,17,18,19]. They were tested as components of mixtures with other liquid crystals, e.g., [19]. Homologues with n = 4–6 show only the nematic phase and longer homologues with n = 7–12 exhibit also the smectic C phase (n = 7) or a few smectic phases (n = 8–12) [9,10,11,12,13,14,15,16,17,18,19] with the lamellar order [1,2]. For the homologues with n = 4–7, crystal structures were solved by single-crystal X-ray diffraction (XRD) [14,15,16,17]. While, for n = 7, the crystal phase and both liquid crystalline phases (nematic and smectic C) were investigated by XRD at various temperatures [14], for n = 4–6, as far as we are aware, only the XRD results at room temperature were published [15,16,17]. Herein, we present the structural investigations by XRD for the S-(4-pentylphenyl) 4-(pentyloxy)benzothioate compound, with n = 5, abbreviated either as 5 ¯ S5 or 5OS5 (used in this paper). The phase sequence of 5OS5 on heating is crystal (335 K) nematic (353 K) isotropic liquid [18]. These three phases are abbreviated further as Cr, N and Iso, respectively. The crystal structure obtained at 295 K for the 5OS5 single-crystal grown from an ethanol solution is monoclinic (abc, β ≠ 90°, α = γ = 90°), with the P21/c space group. The molecules are arranged parallel to each other, which corresponds well to the N phase observed above the melting temperature. Weak hydrogen bonds of the C-H…O type exist in the Cr phase [17]. Our aim is to examine whether 5OS5 shows polymorphism in the solid state, as well as to investigate the short-range positional order in the N and Iso phases. Although the main experimental method is XRD, the results of differential scanning calorimetry (DSC) and polarizing optical microscopy (POM) are also presented for comparison.

2. Materials and Methods
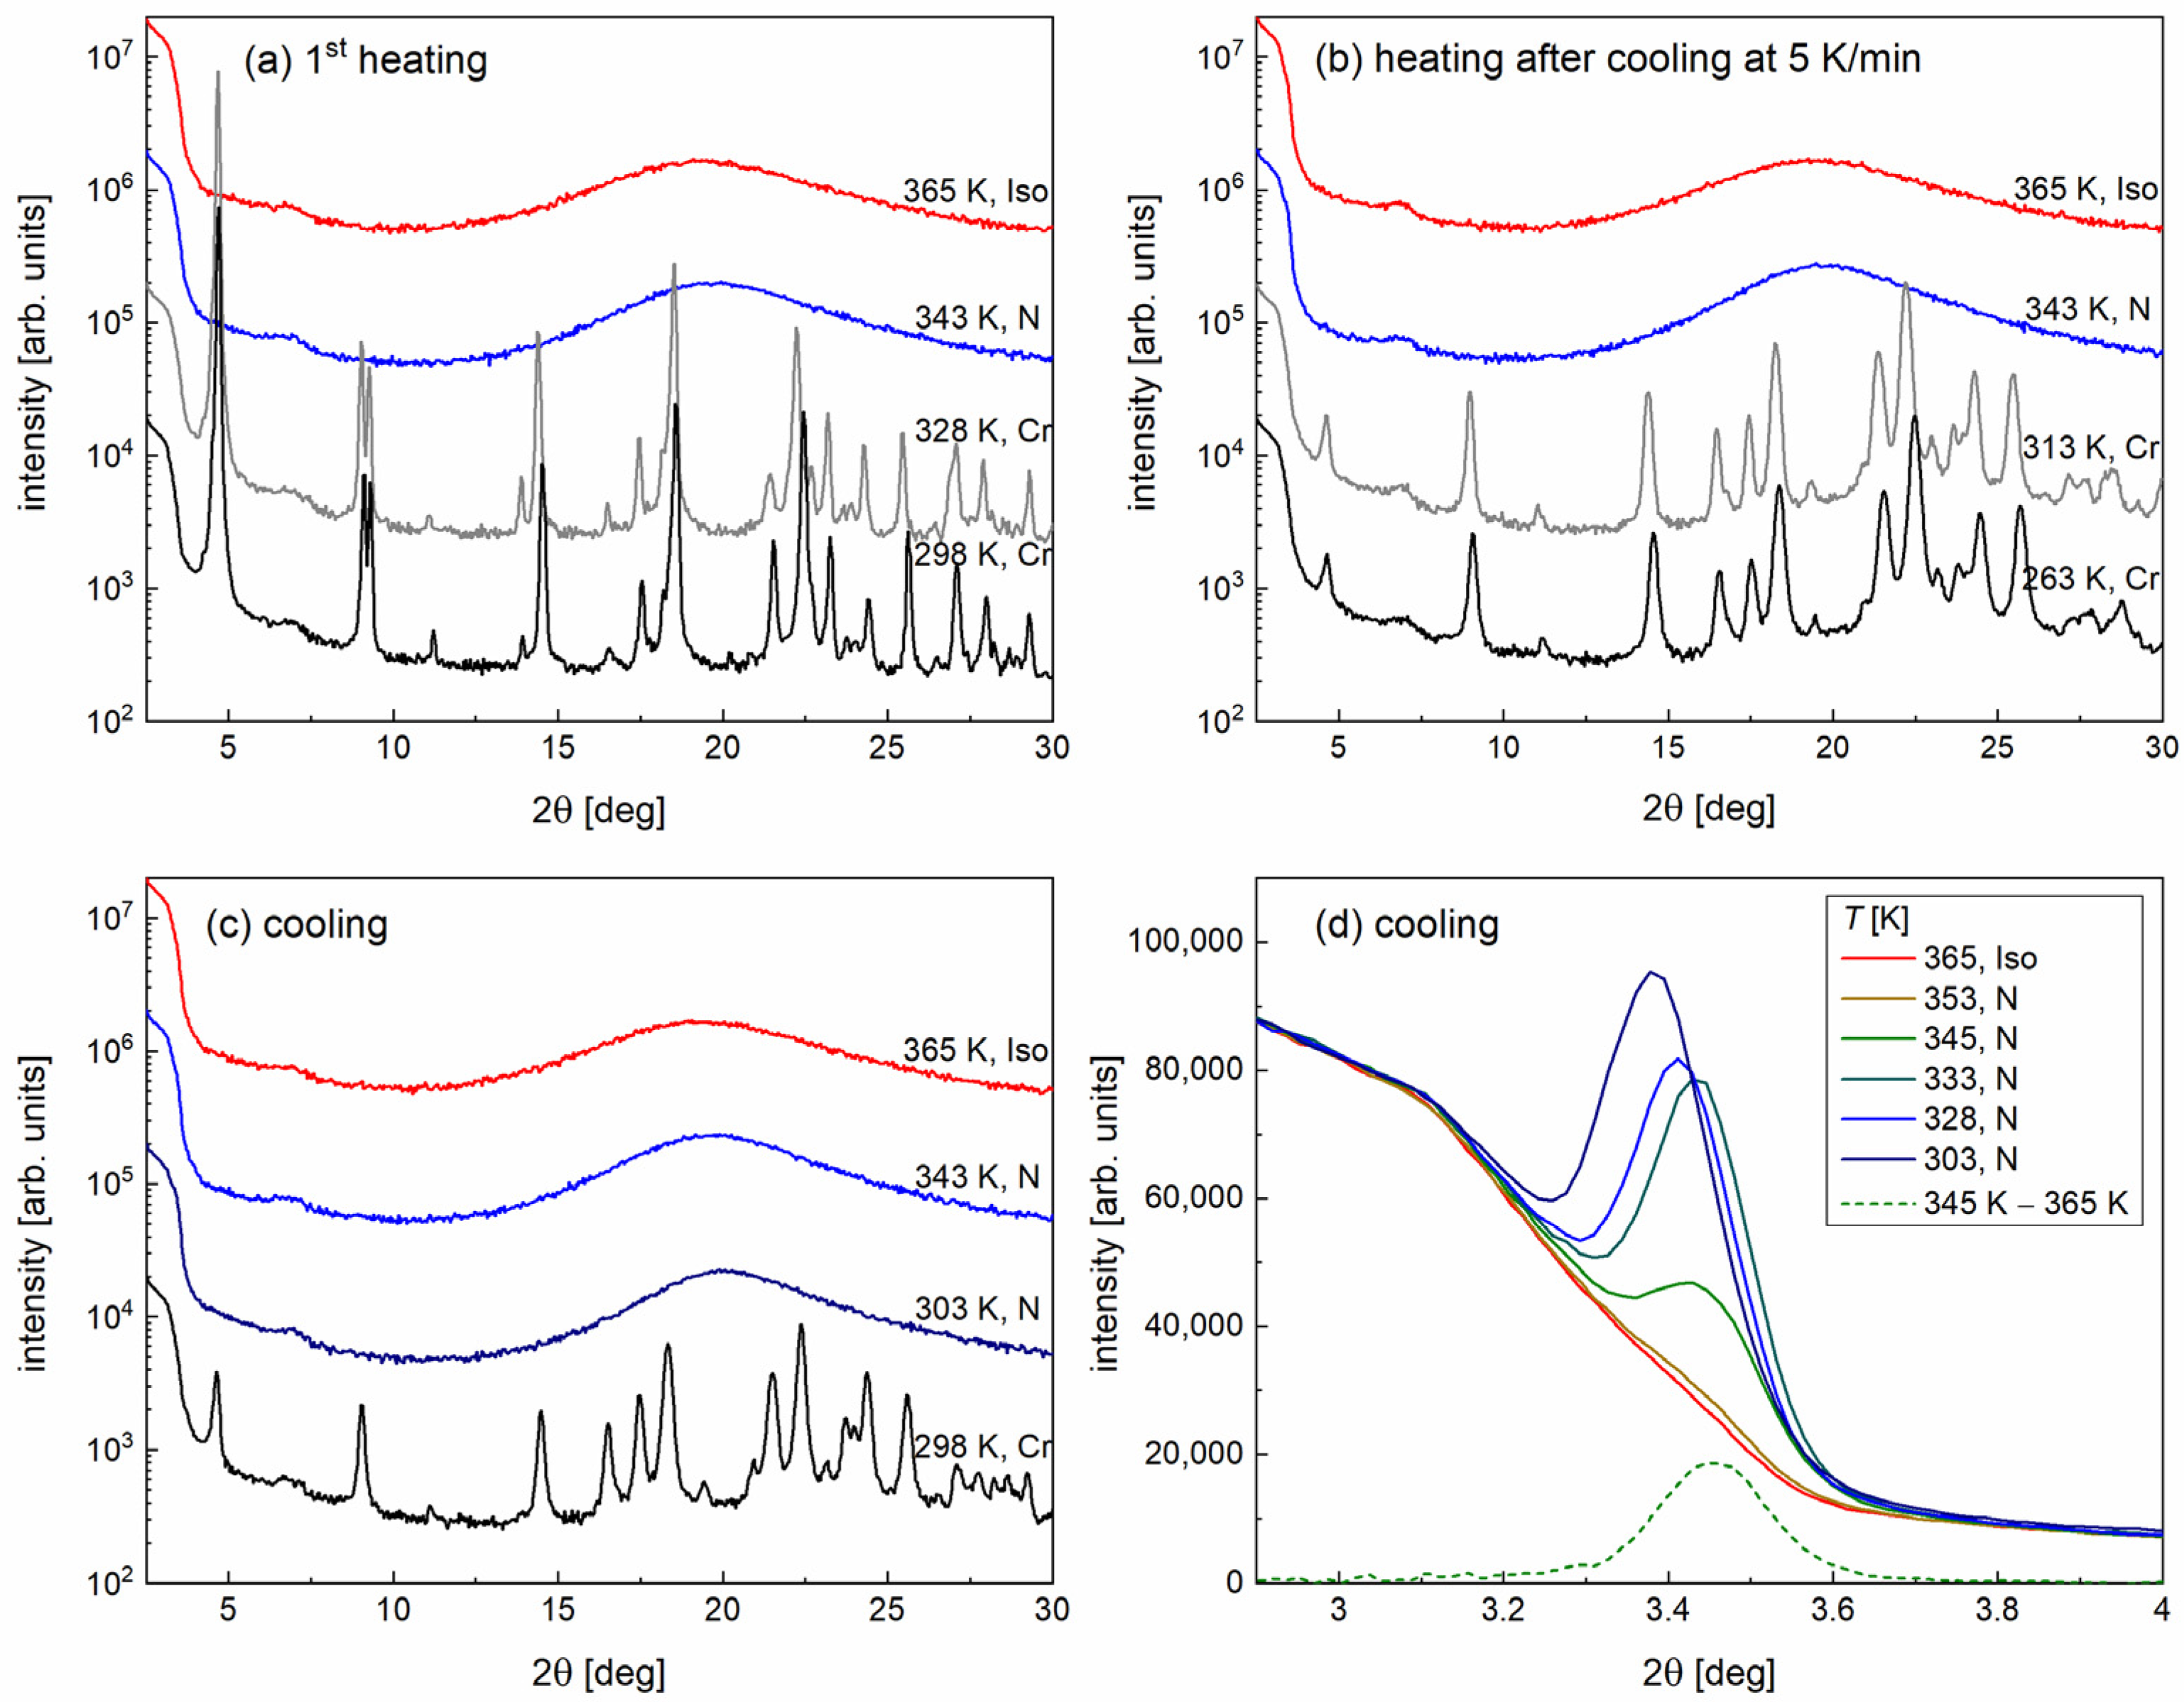
Polycrystalline S-(4-pentylphenyl) 4-(pentyloxy)benzothioate was synthesized according to the method described in [13].
DSC measurements were performed with the PerkinElmer DSC 8000 calorimeter in the 263–373 K range in two cycles of heating and cooling with a 5 K/min rate. The results from the second cycle were used in analysis. The calibration was based on the melting points of indium and water. The sample weighting 3.10 mg was sealed within an aluminum pan. Data analysis was carried out using the PerkinElmer software. The phase transition temperatures and enthalpy changes were determined with uncertainties of 0.5 K and 0.08 kJ/mol, respectively.
The POM measurements were carried out with the Leica DM2700 P microscope in the 263–365 K range in three cycles of cooling and heating with a 5 K/min rate. The temperature was controlled by the Linkam attachment. The phase transitions in the vicinity of the clearing temperature were additionally observed during cooling with a 1 K/min rate from 363 K to 343 K. The transition within the solid state was investigated in isothermal conditions for temperatures of 280, 282 and 284 K. The sample was heated to 365 K and cooled down to 263 K at 20 K/min, then heated to a selected temperature, also at 20 K/min, and observed at a constant temperature. The sample was placed between two glass slides not covered by any aligning layer. The average luminance of recorded textures as a function of temperature was calculated using the TOApy program [20,21].
The XRD measurements were performed with the X’Pert PRO diffractometer (PANalytical) using the CuKα radiation with the Bragg–Brentano geometry in the 2θ = 2–30° or 2–8° range. The temperature in the 263–365 K range was controlled by the TTK-450 stage (Anton Paar). The sample in polycrystalline form was placed into a flat sample holder and pressed with a glass slide. The diffraction patterns were collected during different temperature programs:
(a)
first heating of a pristine sample which was not melted after synthesis,
(b)
heating after direct cooling with a 5 K/min rate from 365 to 263 K,
(c)
cooling from 365 to 298 K,
(d)
cooling from 365 to 298 K in the low-angle region only.
In programs (a–c), the measurements were carried out in the 2θ = 2–30° range with a rate of 0.078°/s, the 0.033° step and 4 diffraction patterns collected for each temperature. In program (d), the measurements were carried out in the 2θ = 2–8° range with a rate of 0.046°/s, the 0.017° step and 24 diffraction patterns collected for each temperature. The data analysis was performed in FullProf [22], PASCal [23,24] and OriginPro.
The DFT calculations for an isolated molecule and dimers were carried out in Gaussian, version 16.C.01 [25], with the def2TZVPP basis set [26], B3LYP correlation-exchange functional [27,28] and Grimme’s D3 dispersion with Becke–Johnson damping [29]. The optimized models were visualized in Avogadro [30].

3. Results

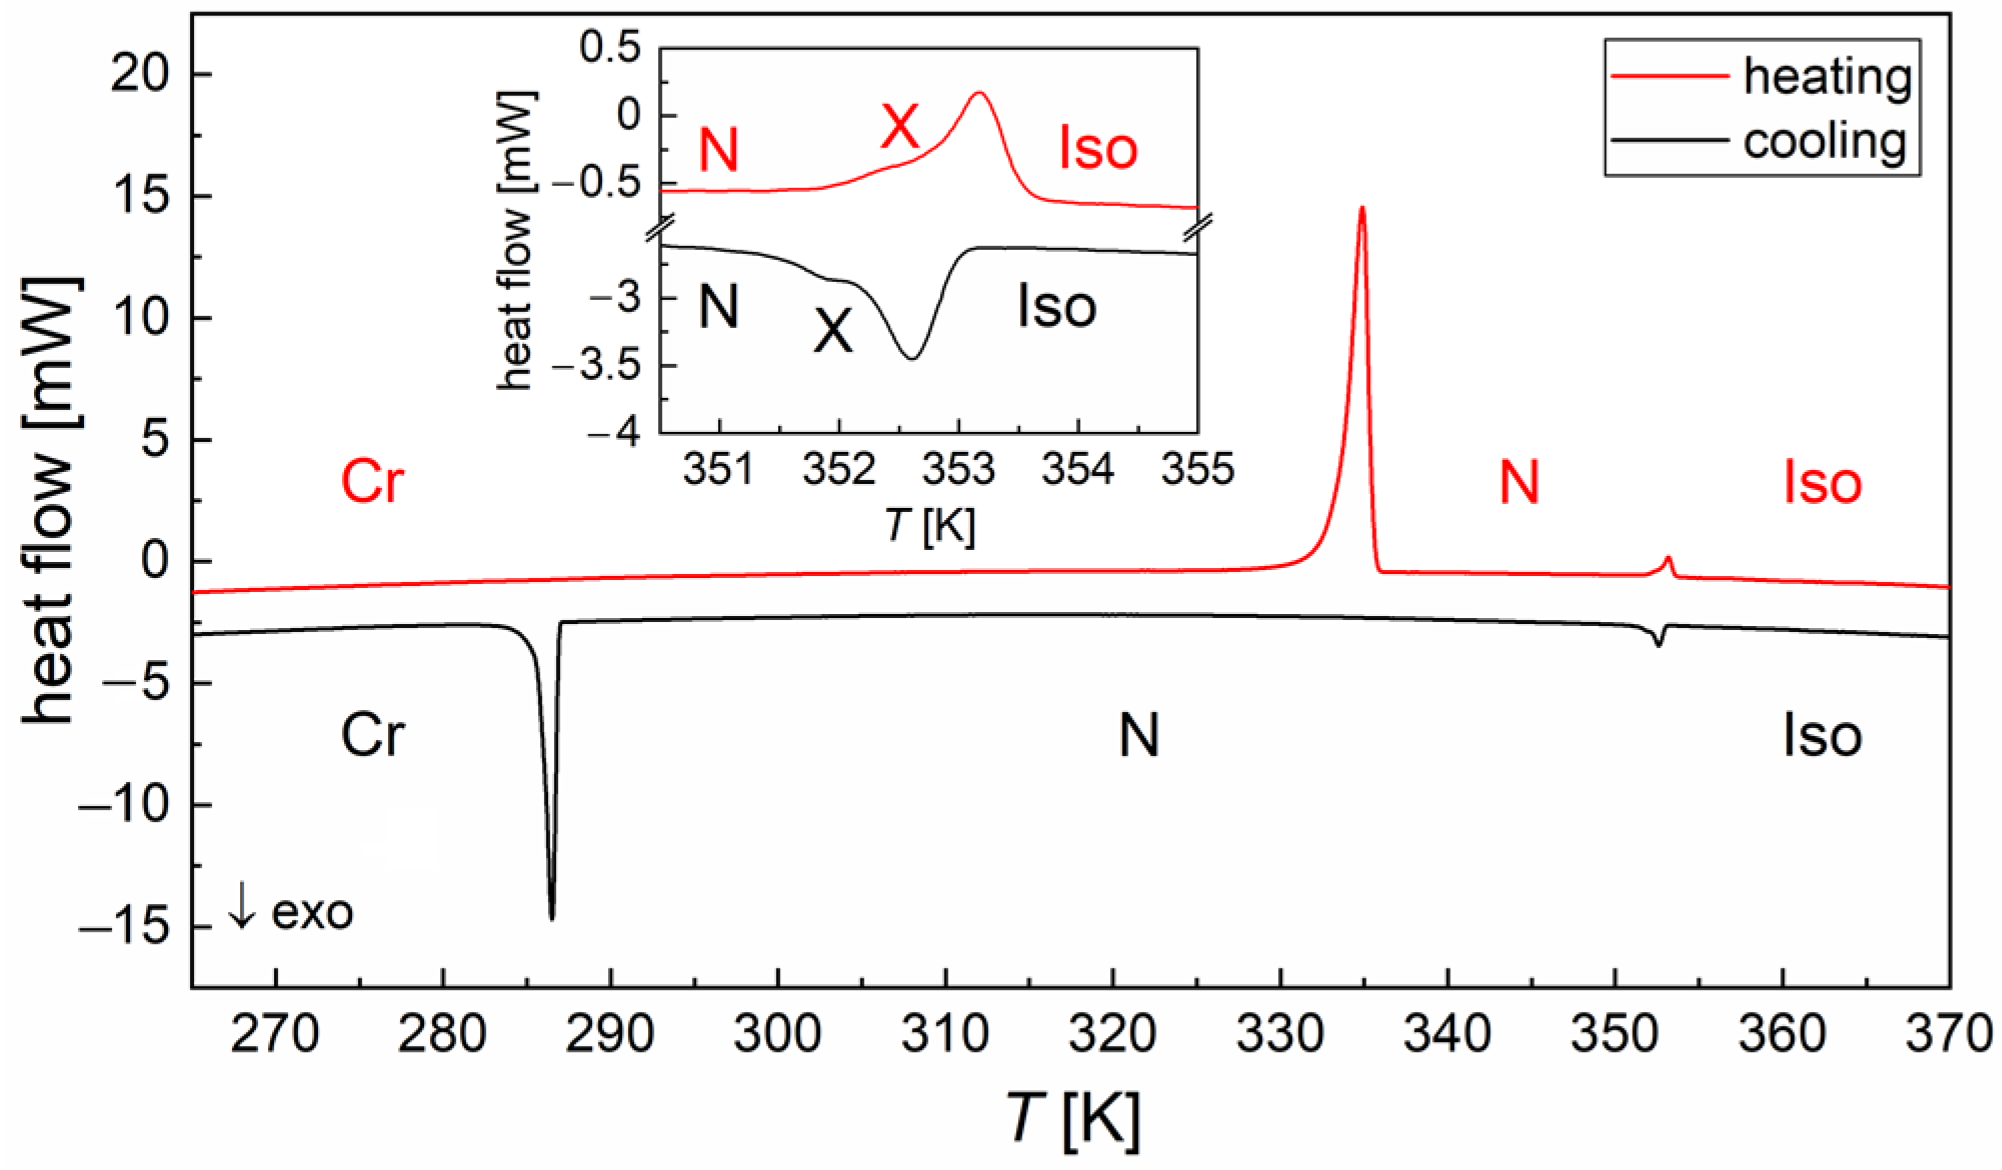
3.1. DSC Thermograms

The DSC results are presented in Figure 2 and Table 1. During cooling, 5OS5 shows the N phase at the wide temperature range and crystallization is observed at room temperature. The large supercooling of the nematic phase is likely to be caused by too low a nucleation rate above room temperature, which prevents crystallization [31]. Supercooling is commonly reported for liquid crystals [32,33,34]. No transition between the crystal phases is observed during cooling down to 263 K and during heating. However, the absolute value of the enthalpy change during crystallization, 14.6 kJ/mol, is much smaller than the enthalpy of melting, 33.2 kJ/mol. This indicates that the recrystallization effect occurs in the sample before melting, but its rate is too slow to be visible as an anomaly in the DSC curve. The anomaly between the N and Iso phases has an irregular shape both for cooling and heating, which can be interpreted as two overlapping anomalies. The unknown phase, present in a narrow temperature range between N and Iso, is denoted as X. In some chiral compounds, the blue phase is present between N* and Iso [35], but this is not the case for 5OS5, which is achiral. Another explanation is the presence of two types of the nematic phase, e.g., regular N at higher temperatures and twist-bent NTB at lower temperatures [6,7]. On the other hand, the NTB phase is formed by molecules with a bent shape, while 5OS5 molecules are rather rod-like and are expected to form only a regular N phase.

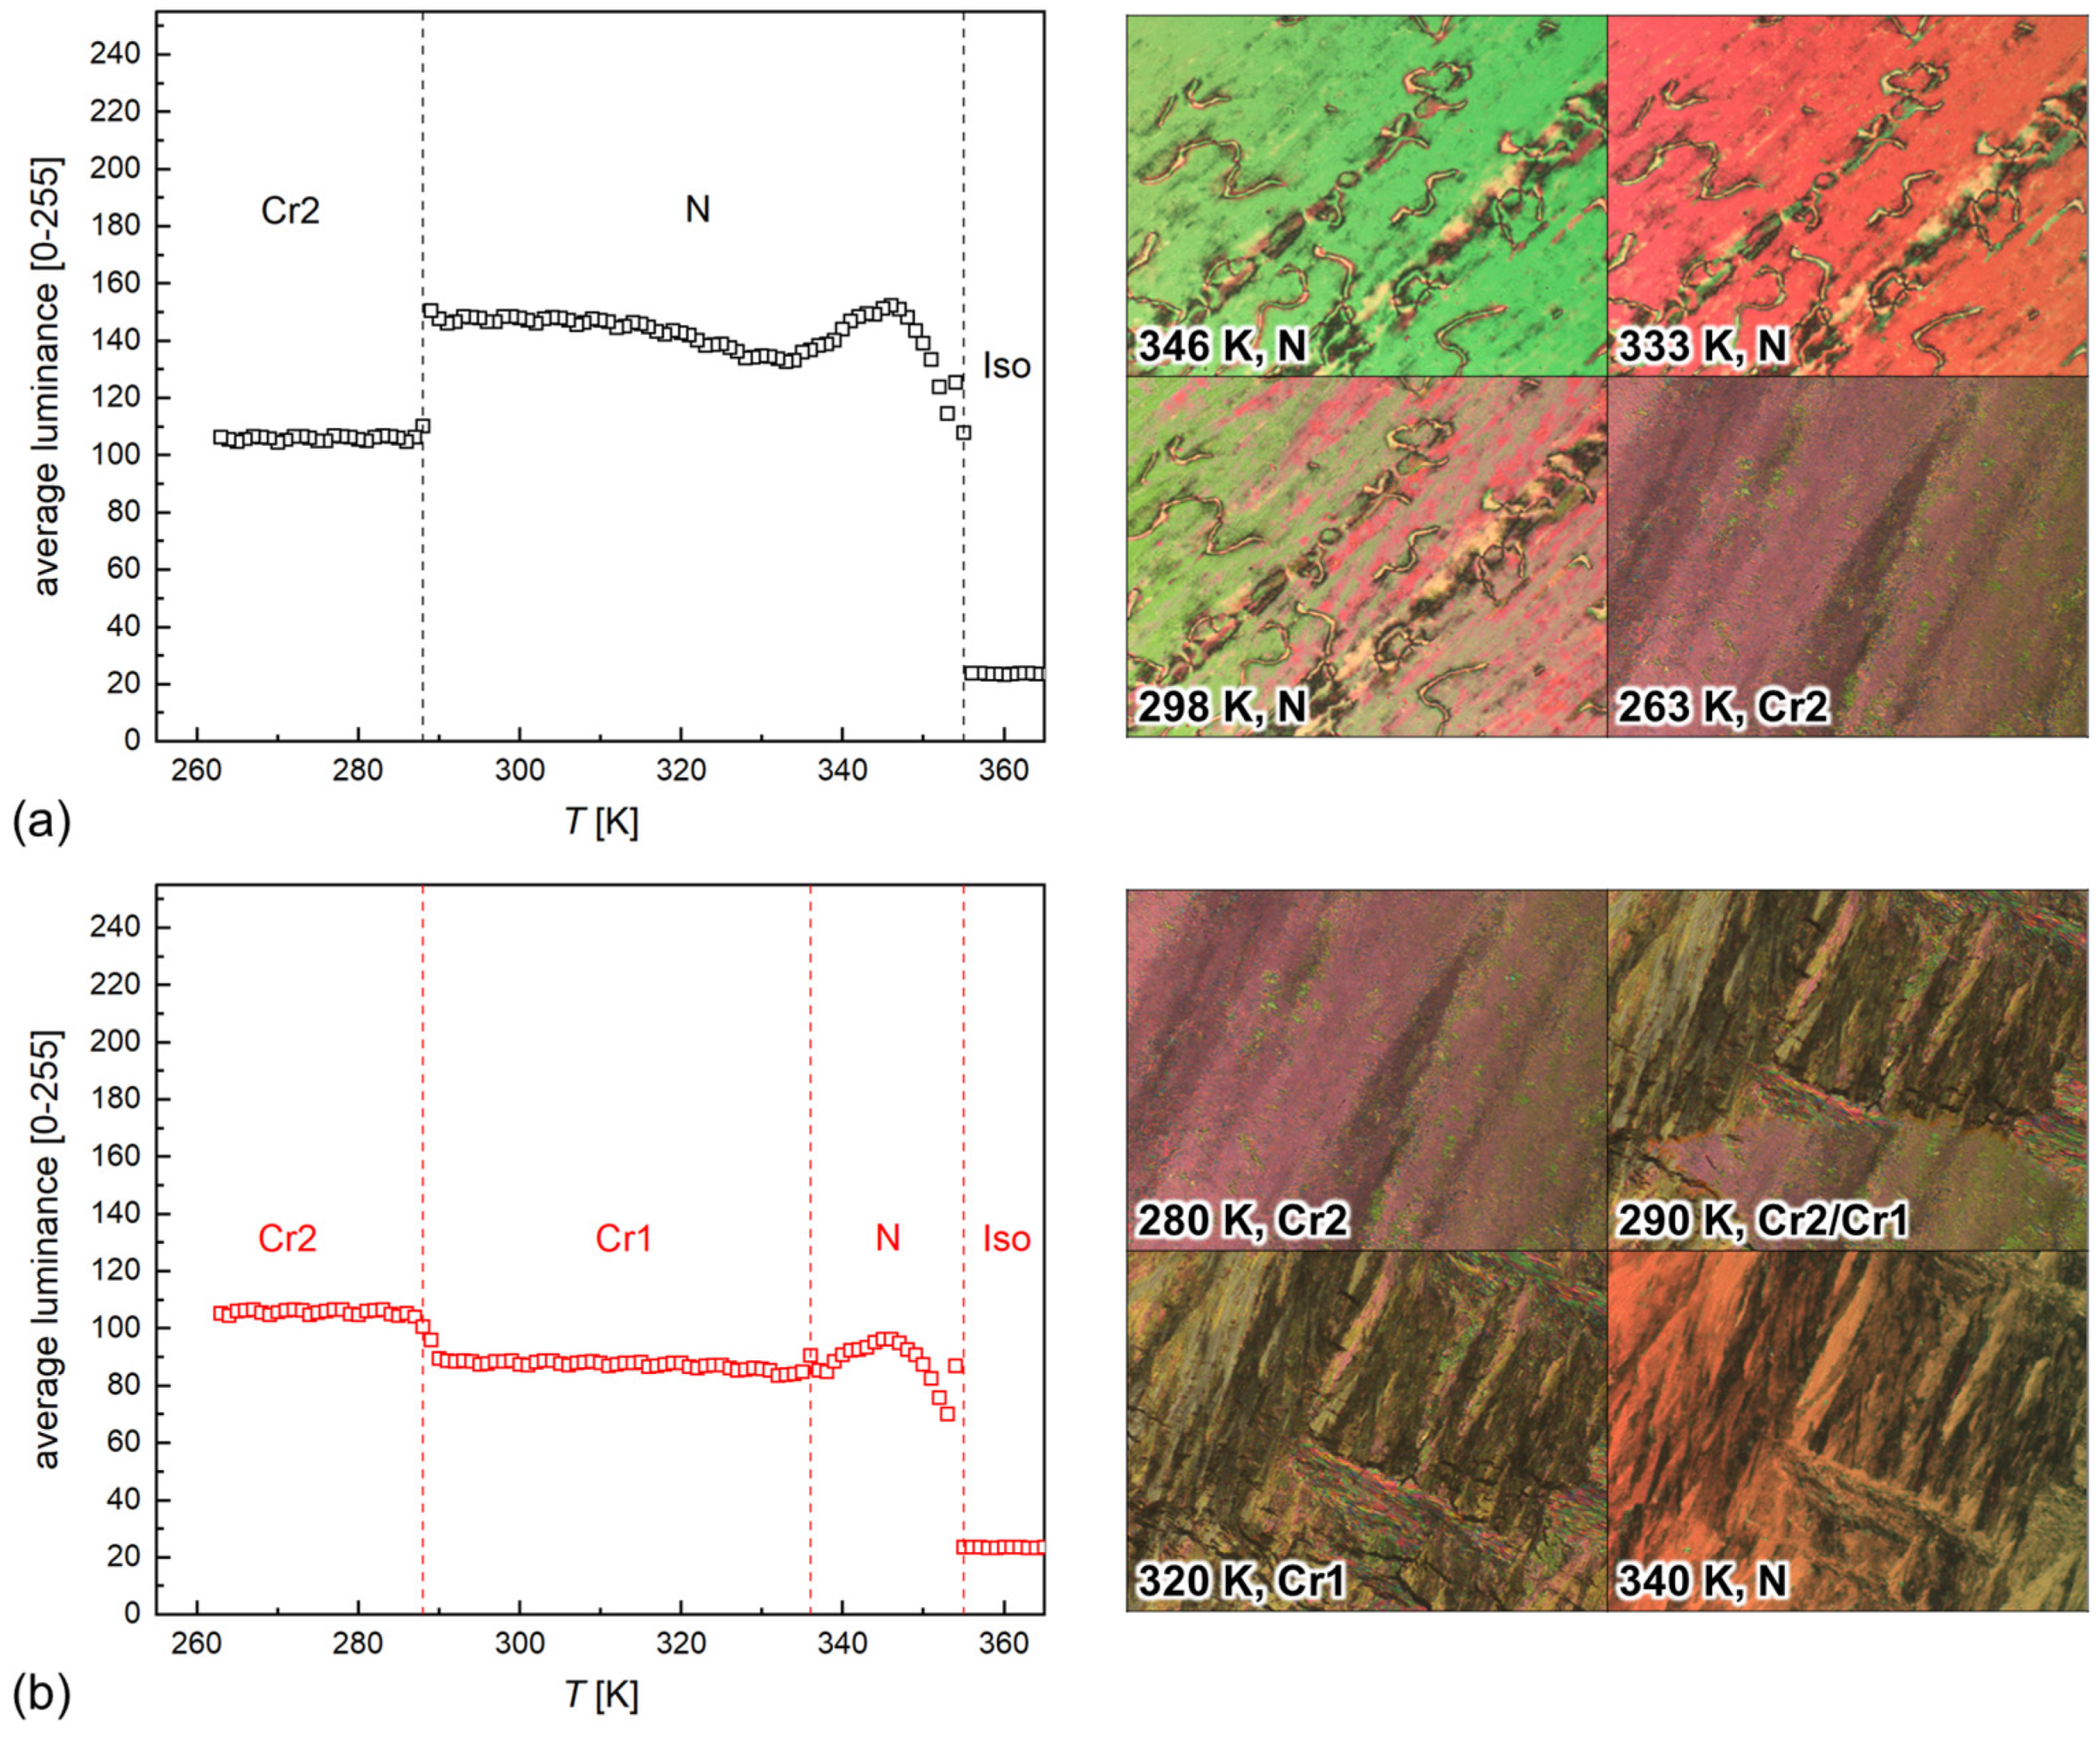
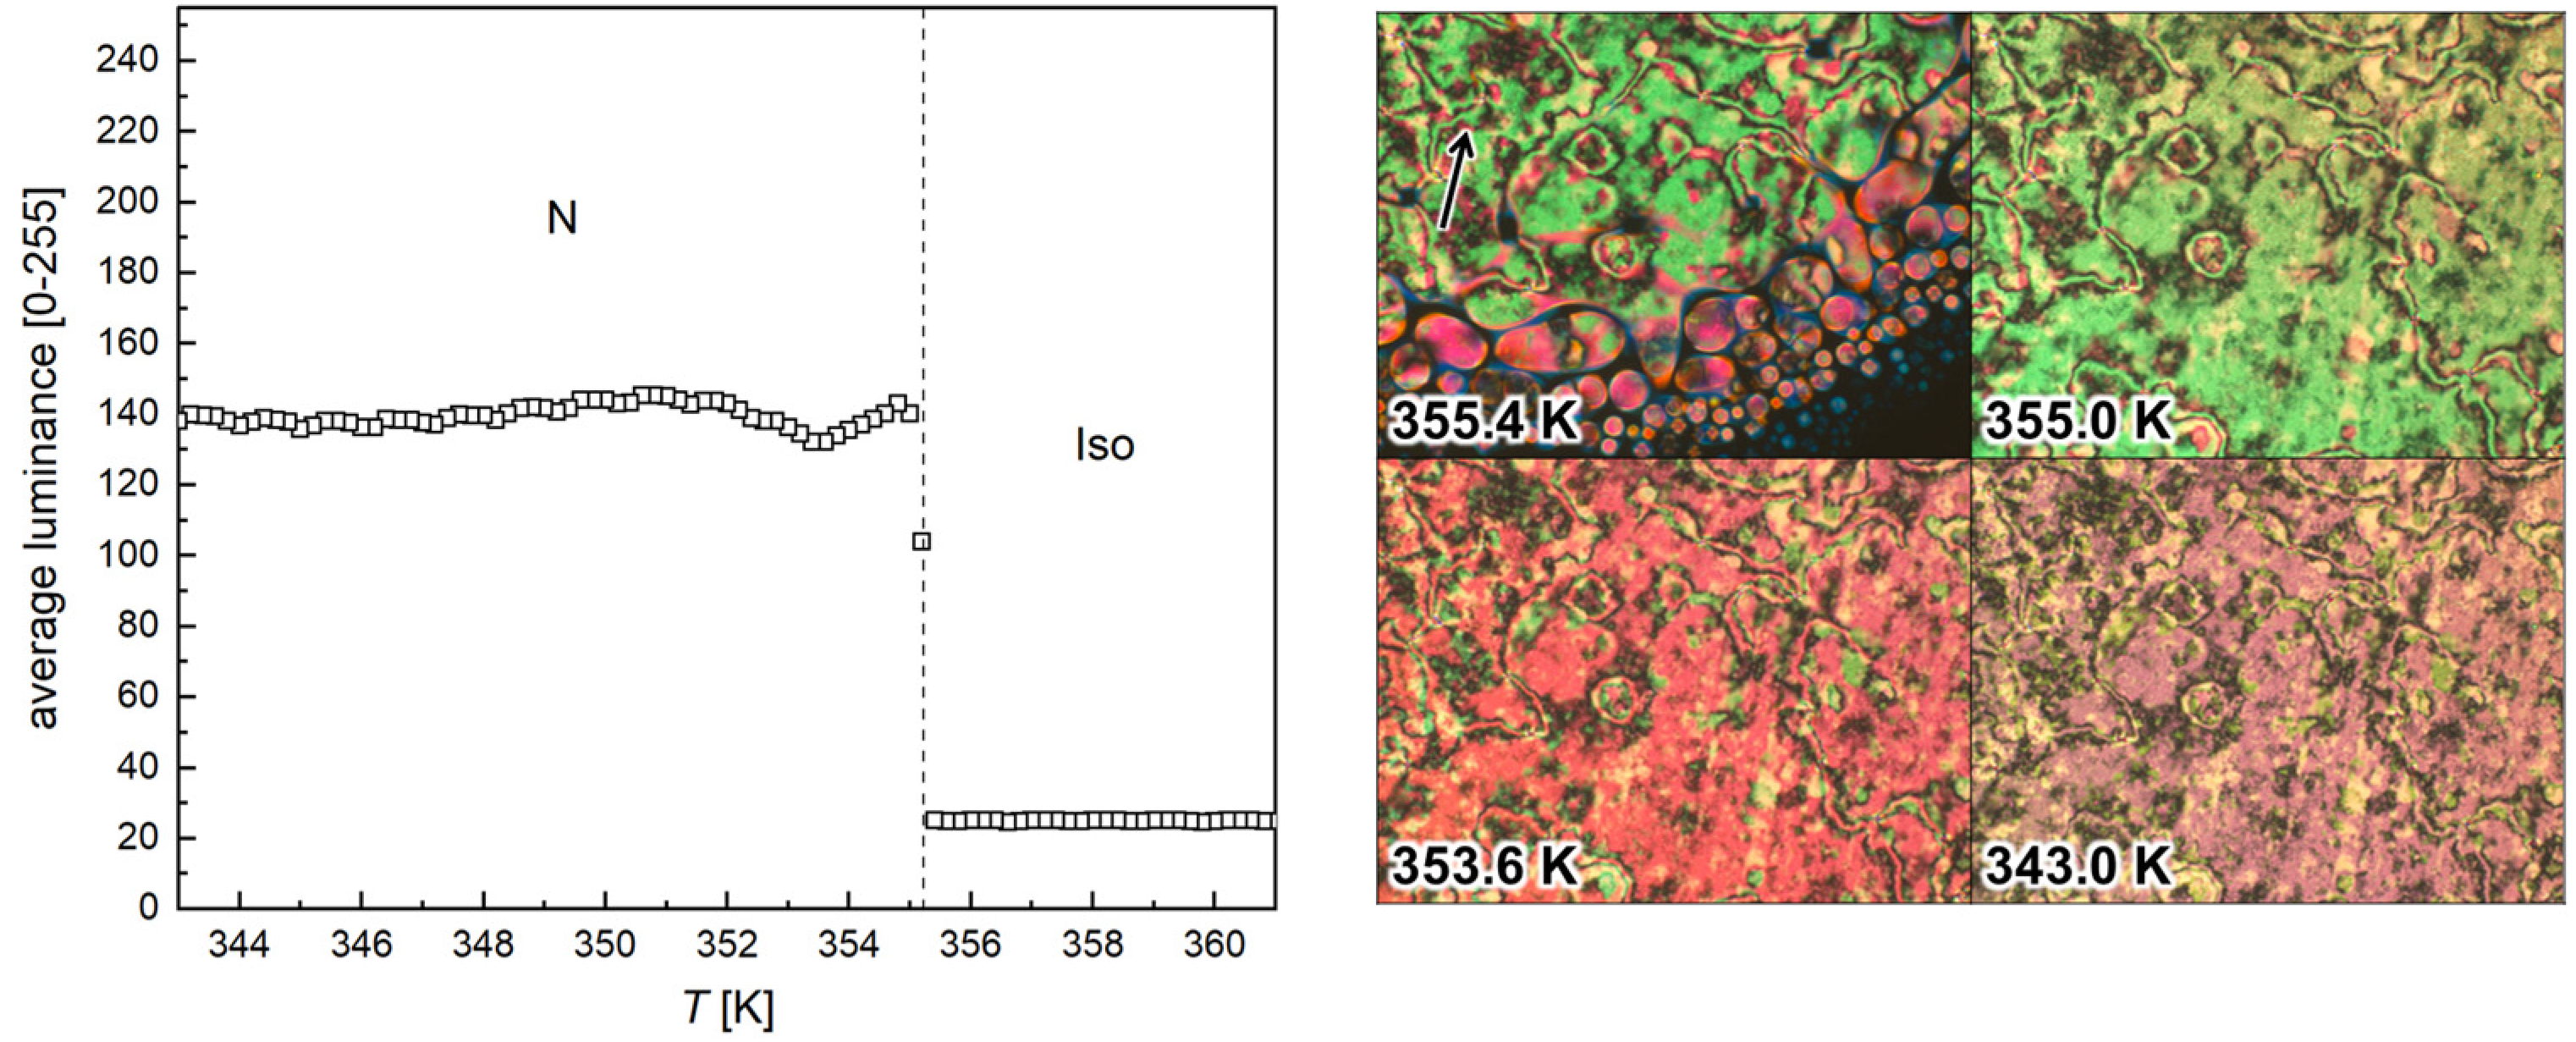
3.2. POM Observations

The POM measurements at the 5 K/min rate (Figure 3) confirm the presence of the nematic phase with a schlieren texture during cooling [2]. After cooling to 288–289 K, the transition to the crystal phase denoted as Cr2 is observed. The transition occurs via a single front of crystallization. During heating, the Cr2 phase transforms to another crystal phase, Cr1. The new crystal phase is formed by gradual growth of crystallites, instead of the single front of crystallization. In isothermal conditions at 260–264 K, the Cr2 → Cr1 transition lasts for a few minutes (up to 440 s). After melting of the crystal phase, the texture of N resembles that of Cr1. The phase transition temperatures, obtained as an average over three cooling/heating cycles, are Iso (355 K) N (288 K) Cr2 during cooling and Cr2 (287 K) Cr1 (337 K) N (356 K) Iso during heating. The results from three cycles agree with each other within 1 K, except for the Cr2/Cr1 transition temperature, which is 291, 282, 288 K for the first, second and third cycle, respectively. The melt crystallization and Cr2/Cr1 transition occur at the same temperature region close to room temperature. The schlieren textures collected during slow cooling at 1 K/min in the range of the Iso → X → N transitions (Figure 4) show only changes in color, while observed defects are the same. The four-brush disclination, indicated by an arrow in the top-left corner of a texture collected at 355.4 K, is visible down to 343 K, which is well below the X → N transition. Such a defect indicates uniaxiality of the N phase [8]. Thus, the X → N transition cannot be the transition between the uniaxial and biaxial nematic phases.

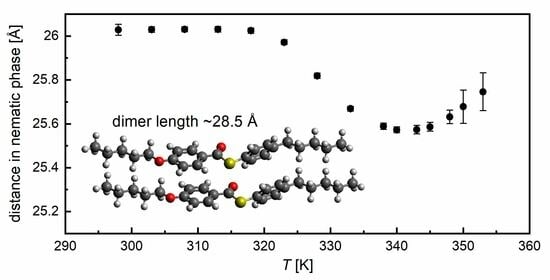
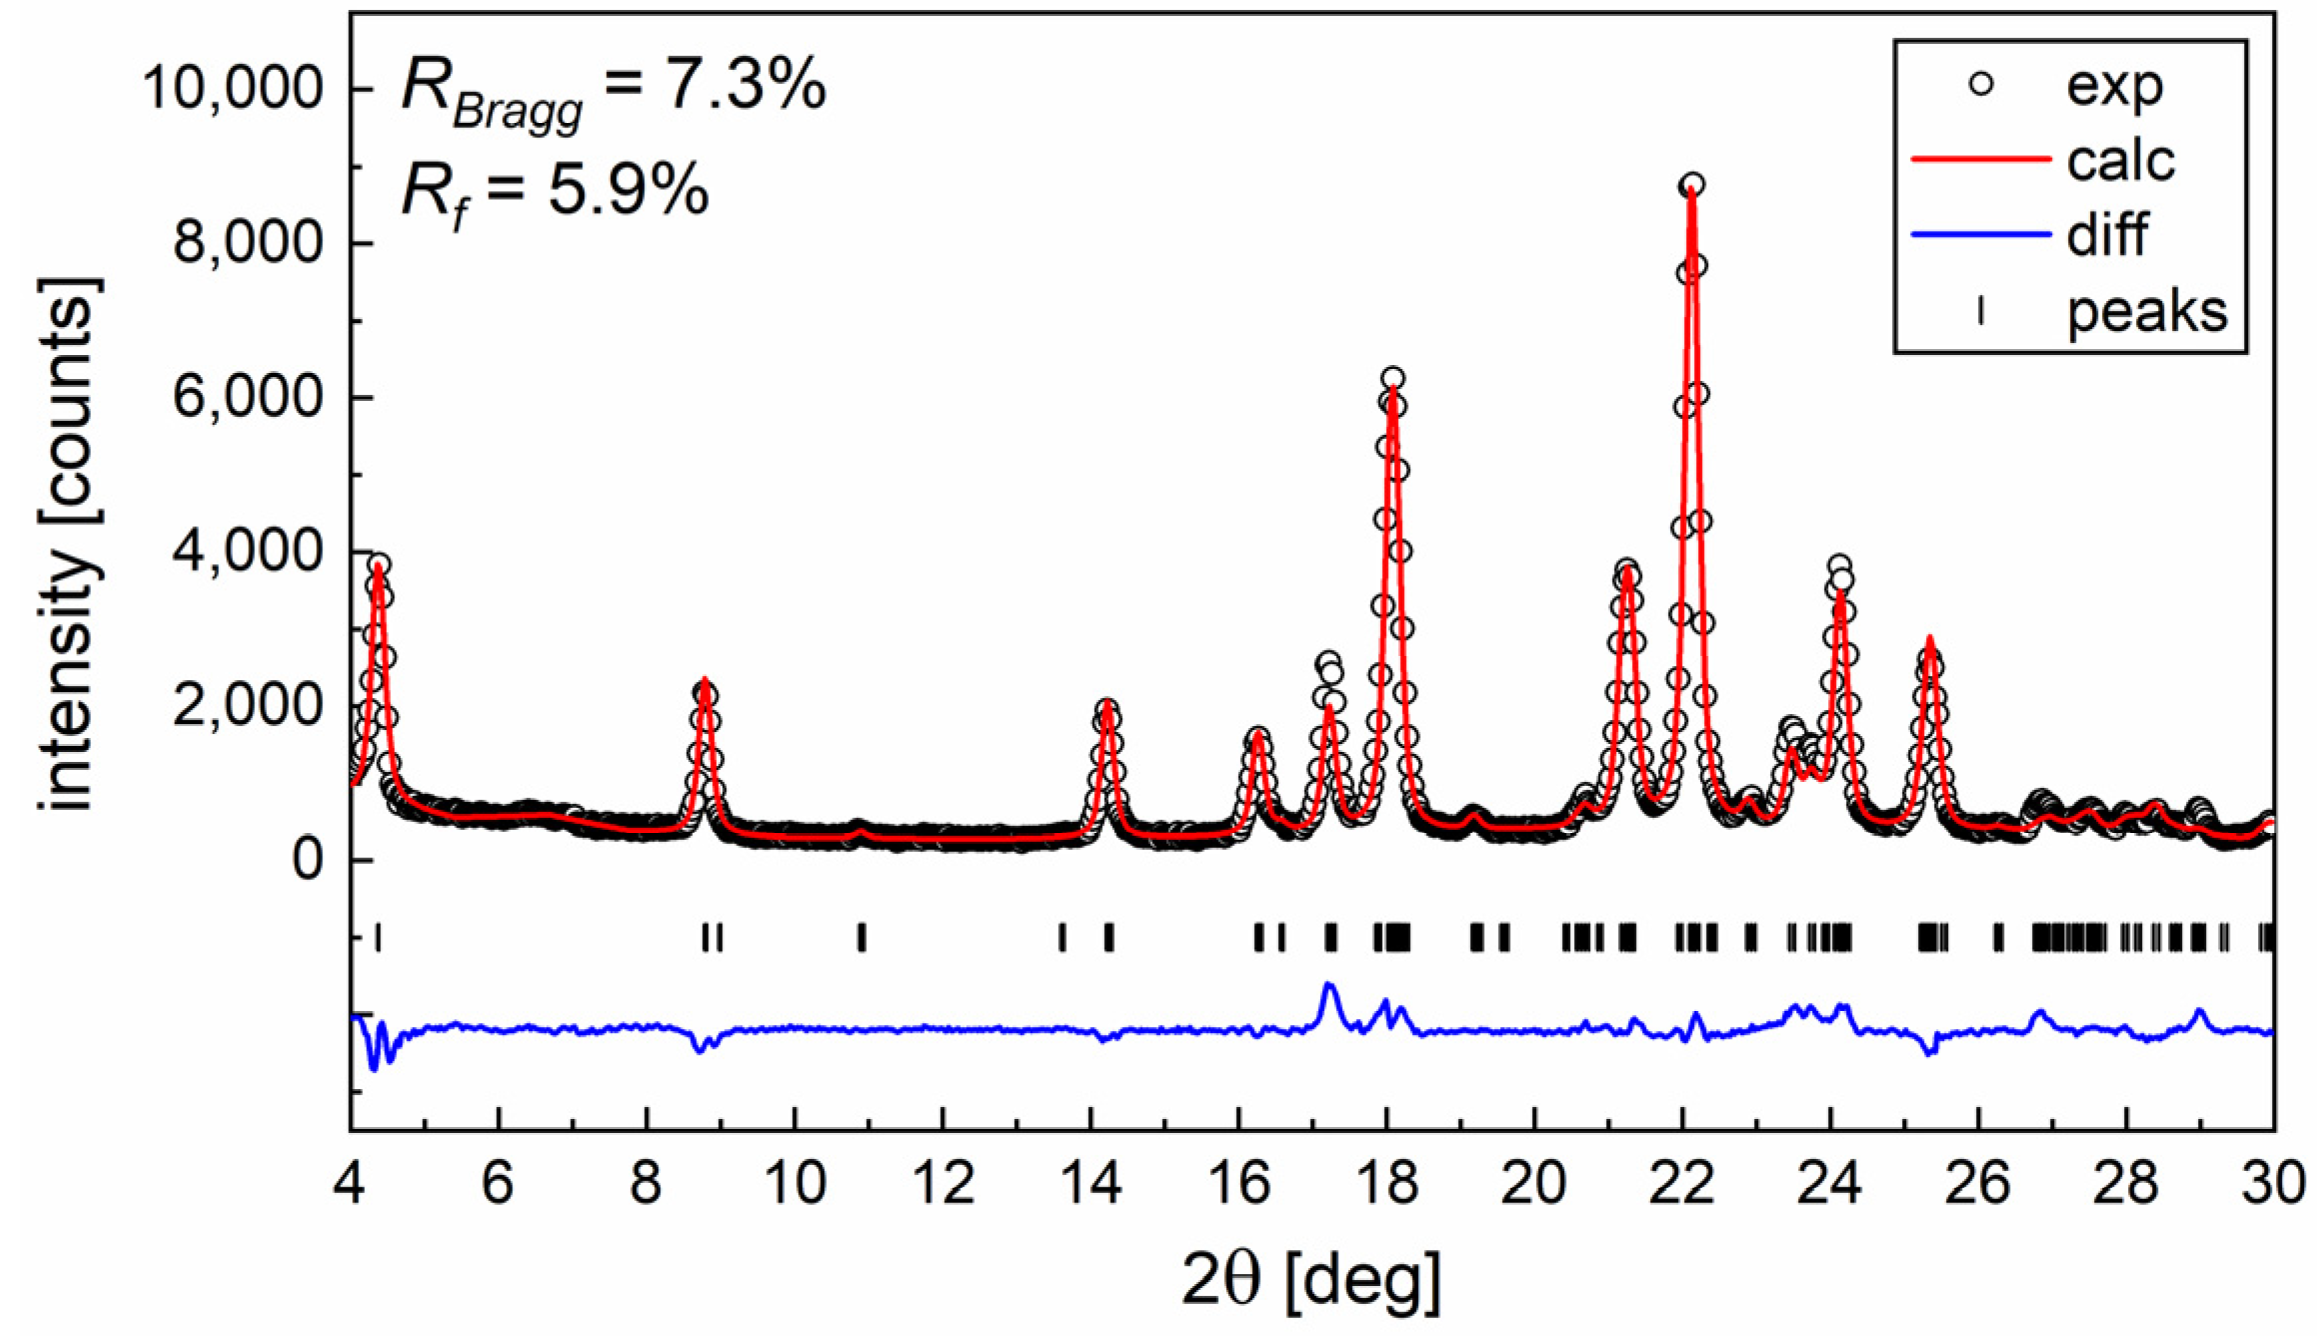
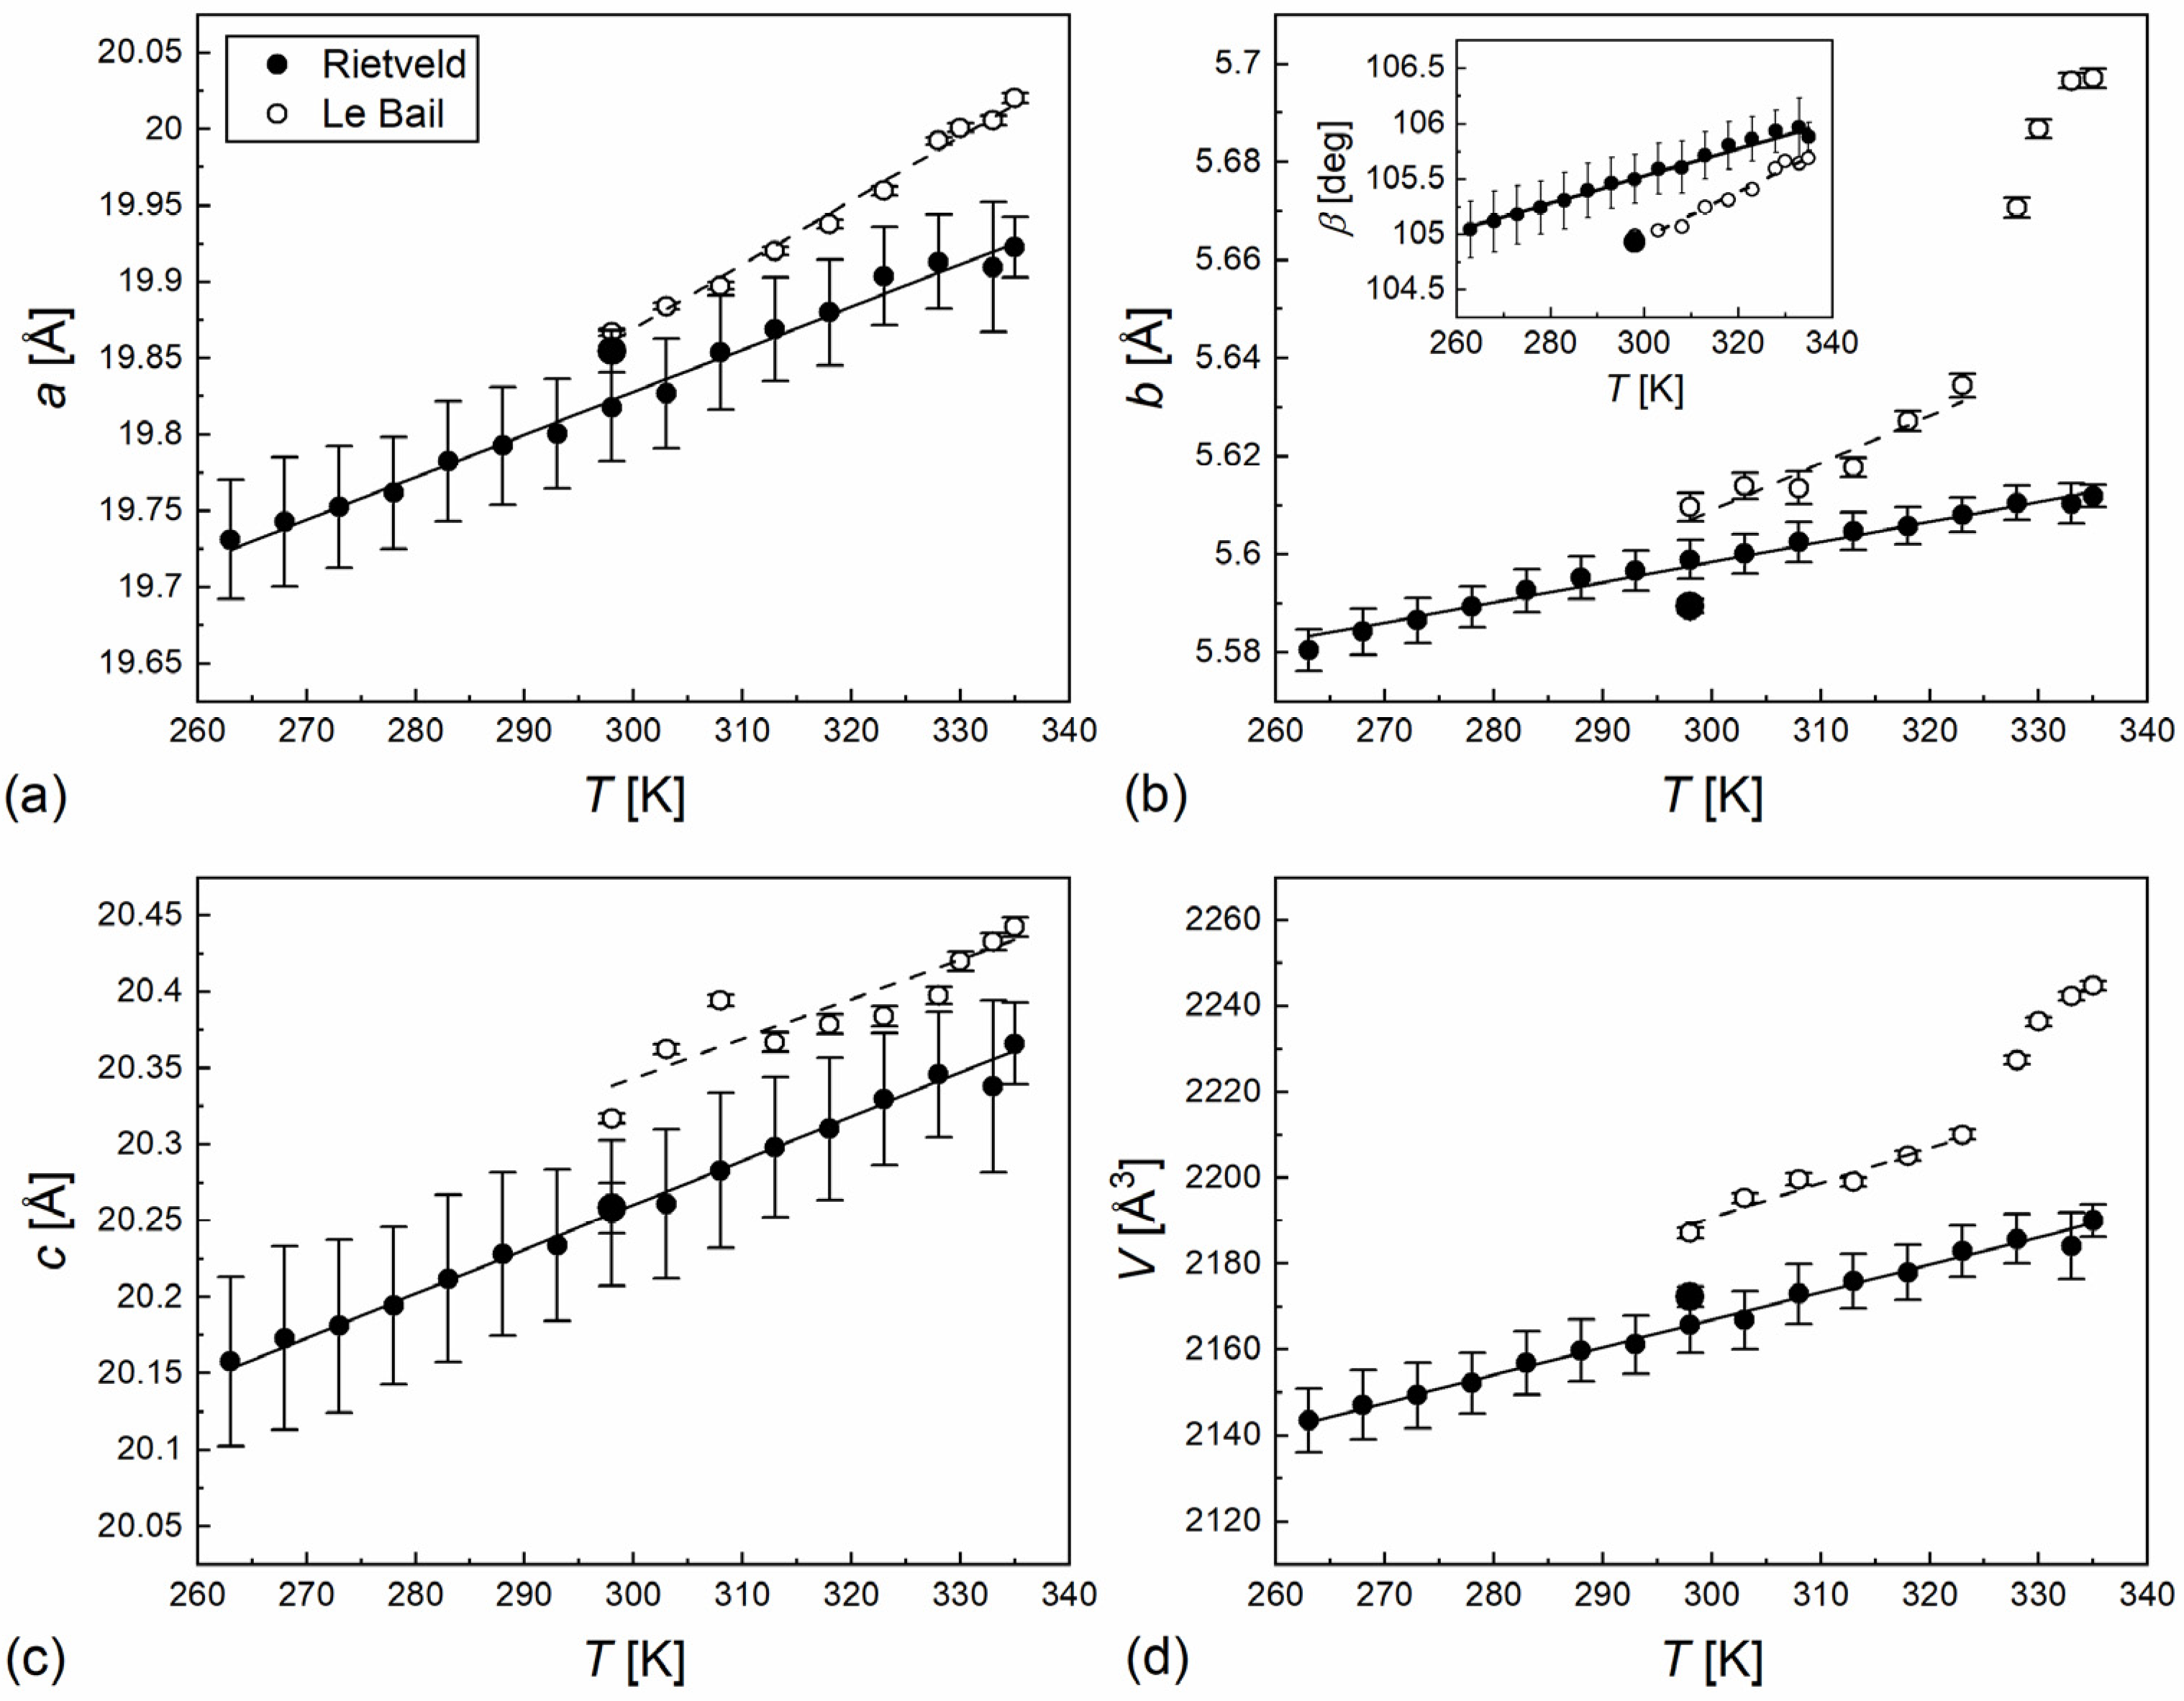
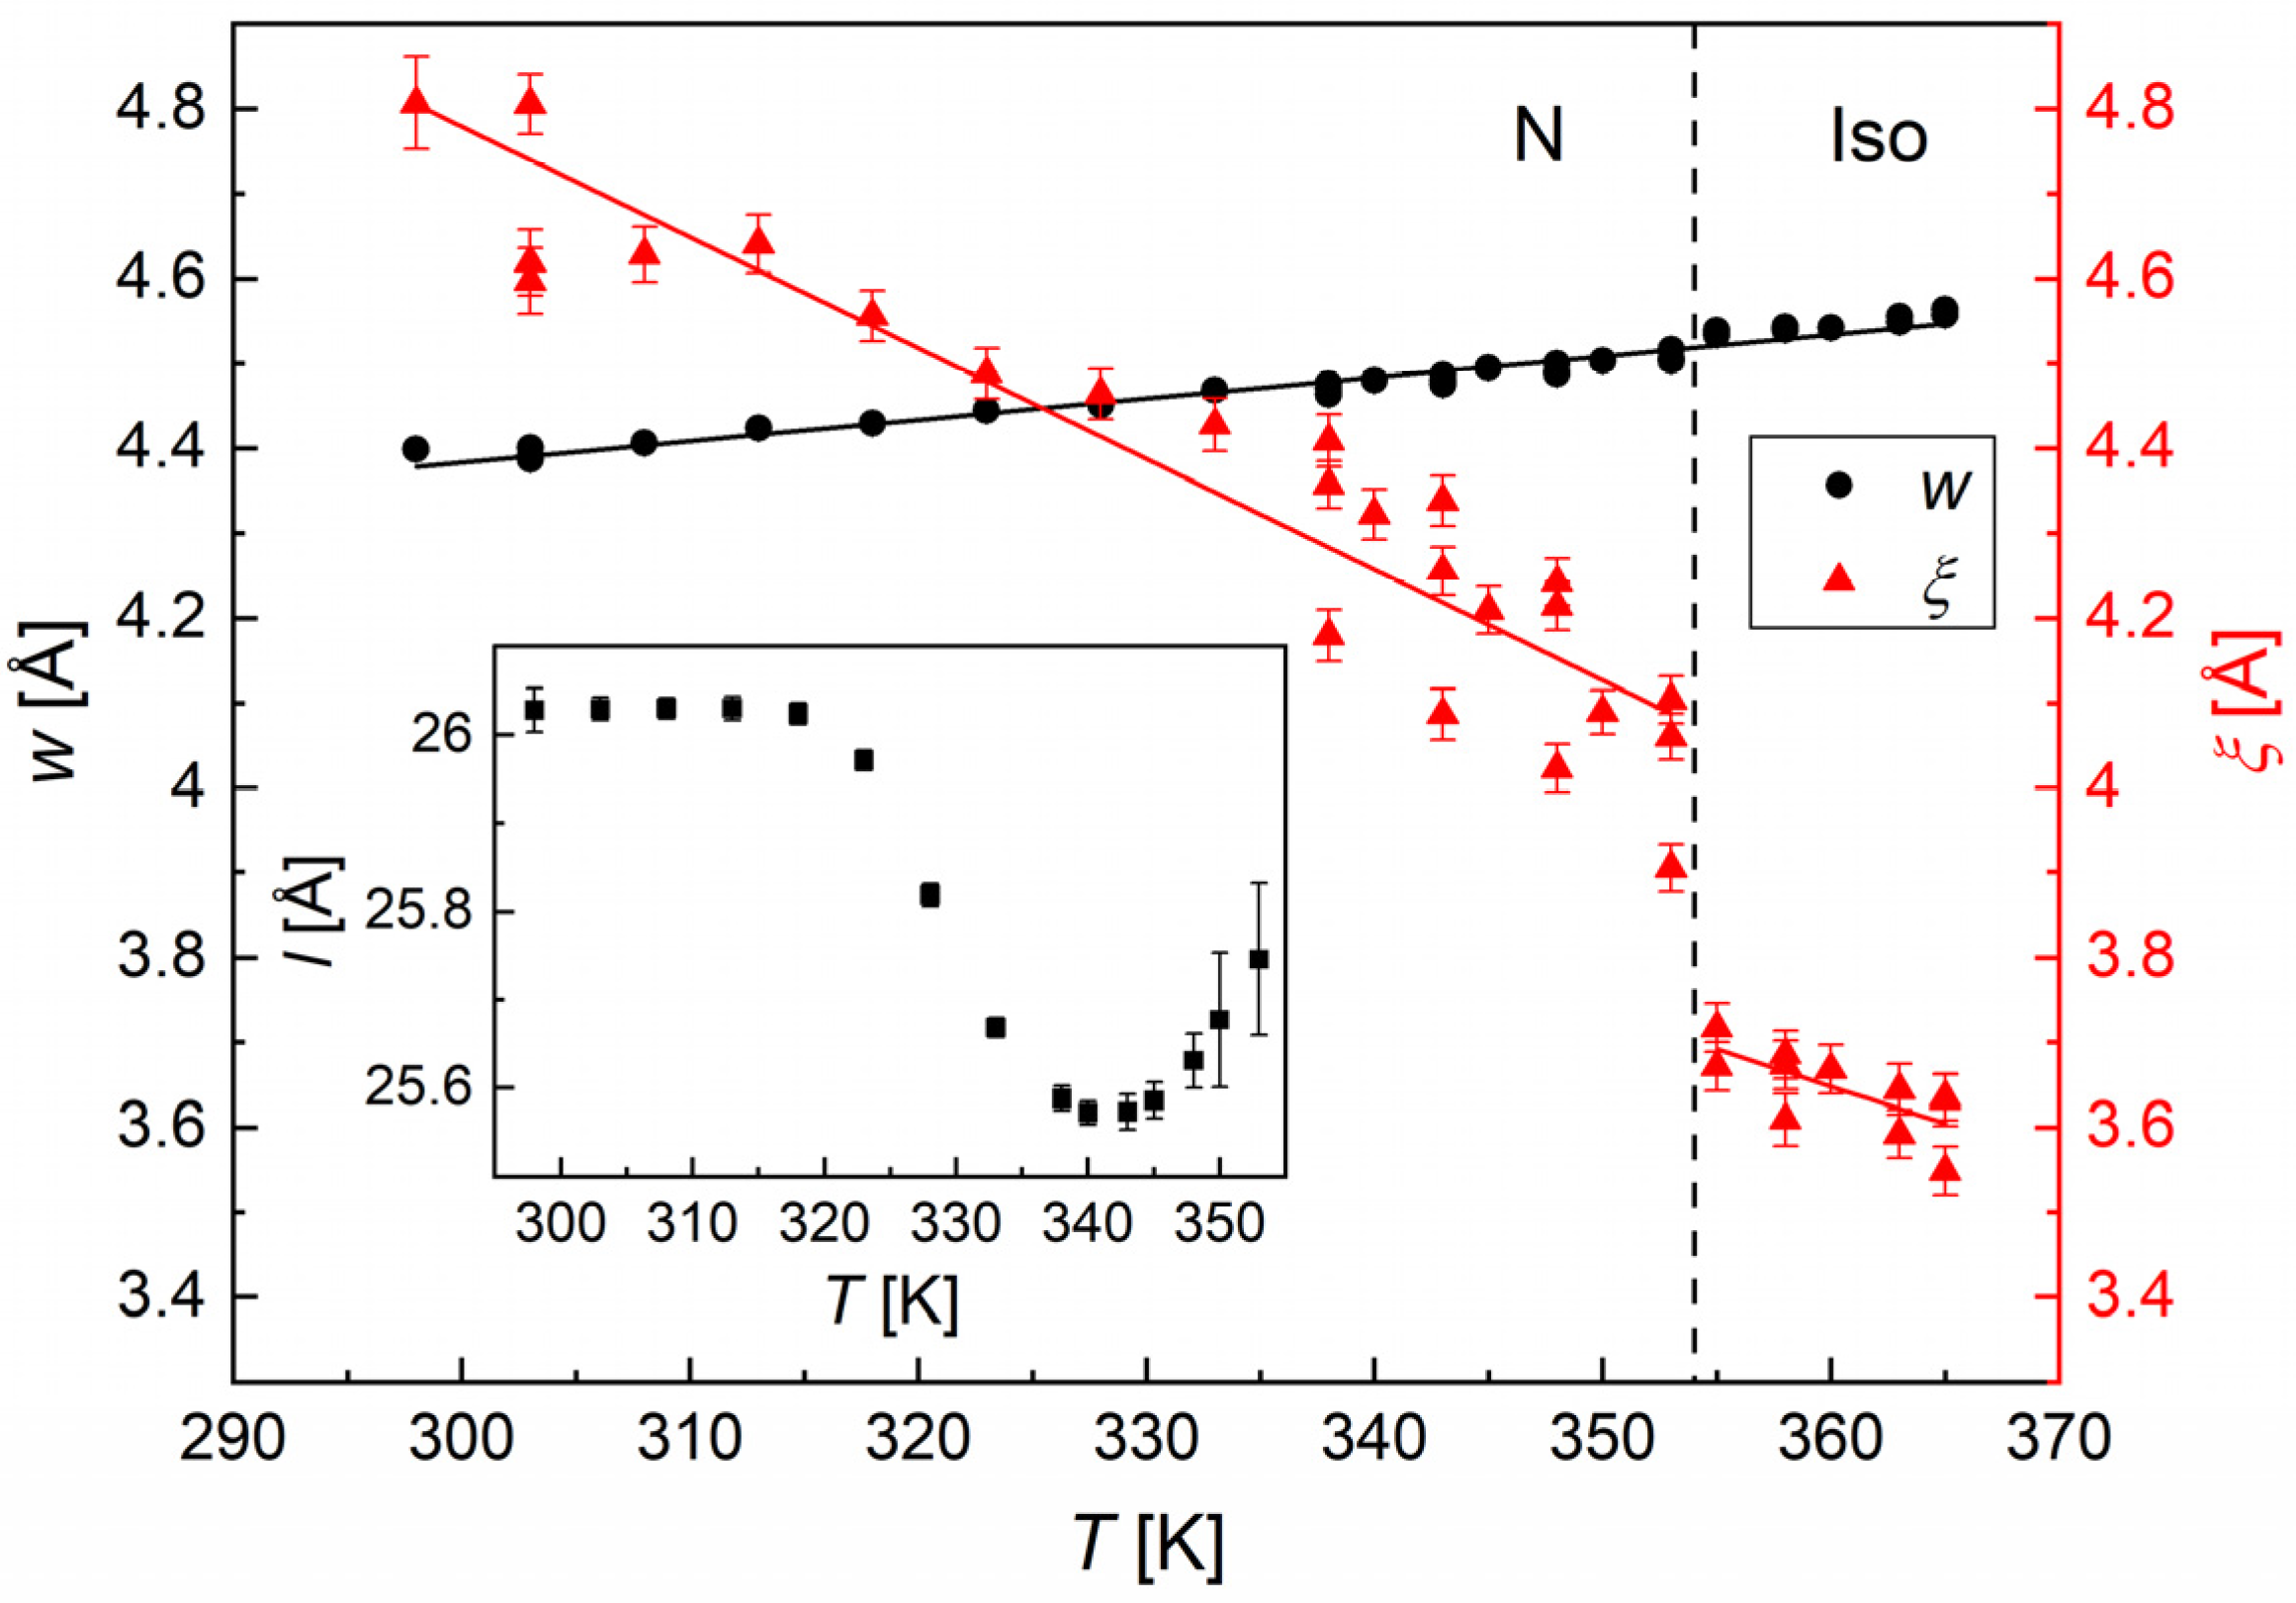
3.3. Structural Study by XRD

Only one crystal phase is observed in the XRD patterns of 5OS5 (Figure 5), as the positions of the diffraction peaks are the same both for the pristine sample and for the crystal grown from melt. The differences in the relative intensities of the peaks are caused by the effect of the preferred orientation of crystallites. The Rietveld refinement [36], performed for the patterns of the crystal phase grown from melt (Figure 6), shows that the observed crystal phase is the same as the monoclinic one reported for a single crystal in [17]. The coordinates of non-hydrogen atoms and their isotropic thermal coefficients were fixed to values from [17]. The hydrogen’s coordinates were generated in the Avogadro program [30] and their isotropic thermal coefficients were assumed to be the same as the corresponding carbon atoms. The fitting parameters were the lattice constants, β angle, scale factor, zero of diffractometer (systematic shift in 2θ), half-width of the peaks and preferred orientation (selection of the [101] direction gave the best fitting results). For the pristine sample, the preferred orientation, probably in the [100] direction, was so strong that we were unable to perform a satisfactory Rietveld refinement. Instead, the Le Bail fitting [37] was applied, where the peak intensities are treated as fitting parameters and are not calculated from the atomic coordinates. The determined parameters of the monoclinic unit cell are presented in Figure 7. Although the values obtained by the Le Bail fitting have smaller uncertainty bars, the results of the Rietveld refinement are treated as more reliable because in the latter method, the peak intensities are based on the experimental crystal structure. This is supported by the fact that the unit cell parameters reported for a single crystal in 295 K in [17] are in better agreement with the results of the Rietveld refinement than with the Le Bail fitting (with the exception of the β angle).
The results of the linear fits to the lattice parameters are presented in Table 2. All lattice constants a, b, c increase with increasing temperature; however, the β angle also increases, therefore the coefficients of thermal expansion (CTEs) do not have to be positive in all directions. The PASCal program [23,24] was applied to calculate the relationship between the principal strain axes x, y, z and the axes of the monoclinic unit cell a, b, c, as well as to obtain CTEs (Table 3):
α i = 1 T L i ( T ) L i 0 1 ,
where L i and L i 0 are lengths along the i = x, y, z directions at temperatures T and 0, respectively. Only the results from the Rietveld refinement for the patterns collected on heating from 263 K to 335 K were used. The x principal axis is approximately parallel to the shorter diagonal of the ac-base ( [ 110 ] direction) and the corresponding CTE is negative but very close to zero, α x = −7.5(6.5)·10−6/K. The y axis is oriented along the b crystallographic axis and the CTE along this direction has an intermediate value, α y = 75(3)·10−6/K. The largest CTE, α z = 226(5)·10−6/K, is along the z axis, which is approximately parallel to the longer diagonal of the ac-base ( [ 1 ¯ 10 ] direction). These results mean that the increasing temperature leads mainly to increasing distance between long molecular axes in the 5OS5 crystal, the same as for previously investigated 7OS5 [14].
The short-range positional order in the N and Iso phases appears in XRD patterns as a wide maximum with a center at 2θ ≈ 20°. If the patterns are plotted as a function of the scattering vector q , the relationship with the 2θ angle of which is as follows:
q = 4 π sin θ λ ,
then the wide maximum is described by the Lorentz function [1,38]:
I q = A 1 + ξ 2 ( q q 0 ) 2 + B q + C .
The position of the maximum q0 is inversely proportional to the average distance w between molecules: q0 = 2π/w and the half-width of the maximum is inversely proportional to the correlation length ξ of the short-range order. The A parameter is the height of the maximum, while B and C are the slope and intercept of the linear background. The w and ξ values obtained for 5OS5 are shown in Figure 8. The w distance both in the N and Iso phases increases slowly with increasing temperature in the 4.39–4.56 Å range with the slope of 0.00252(9) Å/K and it is interpreted as the average distance between the long axes of molecules (or the width of a molecule) [1,38]. There is no significant step in w at the transition between N and Iso, while this is noticeable for the correlation length, which decreases by ca. 0.4 Å after transition to the Iso phase. Both in N and Iso, the ξ values decrease with increasing temperature with slopes equal within uncertainties, −0.013(2) Å/K and −0.009(3) Å/K, respectively. In the N phase, ξ has values in the 3.90–4.81 Å range, while in Iso it is only 3.55–3.72 Å. The small correlation length indicates that there are only next-neighbor positional correlations between molecules in a direction perpendicular to their long axes.
In the nematic phase, the positional short-range order in the direction parallel to the director results in a diffuse maximum in the low-angle region. The position of this peak is related to the length of molecules and the half-width is inversely proportional to the parallel correlation length, which is much larger than the previously discussed correlation length in a direction perpendicular to the director [1]. In the XRD patterns of 5OS5 collected in the 2θ = 2–30° range (Figure 5a–c), this maximum was in general not visible. Only in 303 K one could notice an additional intensity over the low-angle background after comparison with the patterns of the Iso phase. This is why the slower XRD measurement in the low-angle region, described as procedure (d) in Section 2, was necessary. The representative patterns obtained in this measurement are shown in Figure 5d. The low-angle peak in the N phase is much stronger than in the previous results because the sample had more time to align. The high background at low angles was removed by subtracting the pattern collected in the Iso phase, as it is presented for 345 K. The diffuse maxima from the short-range order are described by the Lorentz function; however, the fitting of Equation (3) to the low-angle maximum for 5OS5 did not give proper agreement. This indicates that the resolution of the diffractometer and the short-range order give comparable contribution to the peak’s overall shape. Because of this, the low-angle peak was fitted with the pseudo-Voigt function, which is a sum of the Lorentz and Gaussian peaks, and the correlation length in the direction parallel to the director was not determined. The parameter which was obtained from the peak’s position is the characteristic distance l (inset in Figure 8). The l distance evolves with temperature: just below the Iso/N transition, it decreases on cooling and has a minimum of 25.6 Å at 340–343 K, then increases with decreasing temperature and has a constant value of 26.0 Å below 323 K. The orientational order parameter in the N phase is expressed as [2,39]:
S = 1 2 3 c o s 2 φ 1 ,
where φ is the angle between the long molecular axis of each molecule and the director, and the averaging is over all molecules. As the orientational order parameter in the N phase is lower than 1, the l value is expected to be smaller than the molecular length. Based on the crystal structure, the length of the 5OS5 molecule is 25.22 Å [17]. Meanwhile, the experimental l distance is equal to 25.6–26.0 Å, which exceeds slightly the molecular length. The isolated molecule optimized by the DFT method (Figure 9) is slightly longer, 27.0 Å, where the molecular length is calculated as the maximal H–H distance plus the non-bonded H–H contact distance 2.2 Å from [40]. Still, it leads to unusually high values of the order parameter in the N phase, S = 0.85–0.89. The possible explanation is the presence of molecular associations [41]. For 5OS5, these can be dimers formed via weak hydrogen bonds, which was tested using molecular models optimized by the DFT method. Two examples of dimers are presented in Figure 9. The starting model was the 5OS5 molecule with atomic coordinates determined from the single-crystal X-ray diffraction results [17]. The numbering of atoms in Figure 9a is the same as in [17]. The C(26)-H(26)…O(1) hydrogen bonds present in the crystal phase involve neighbors in the b-direction, between the aromatic ring from one molecule and the C=O group from another molecule. This was the basis for the optimization of the head-to-head dimer (Figure 9b). During optimization, the C(26)-H(26)…O(1) bond was preserved and another C(8)-H(8)…O(2) bond was formed between molecules. The length of the head-to-head dimer is 28.5 Å. This corresponds to the φ angle equal to 23.8–26.0° and the orientational order parameter of 0.71–0.76, which is within the range of S = 0.3–0.8 obtained experimentally for other compounds in the nematic phase [1,42,43]. The increased l distance in 348-353 K indicates that other types of dimers may be present at higher temperatures. It also suggests that the X phase may be a nematic phase, only formed by other dimers than in lower temperatures. A head-to-tail dimer (Figure 9c) was prepared based on the hydrogen bonds present in the crystal phase of the 7OS5 homologue [14]. This dimer is formed by two C(27)-H(27)…O(1) bonds between the alkyl chain and the C=O group and after optimization it has a length of 34.5 Å, which corresponds to φ = 41.0–42.1° and S = 0.33–0.36, close to the bottom value observed for other nematogenic compounds [1,42,43]. The energy of a dimer in Figure 9c is larger by 10.2 kJ/mol (mol of molecules, not dimers) than the energy of a dimer in Figure 9b. The presented dimers are only examples; however, based on the XRD results, it can be assumed that the fraction of longer dimers decreases with decreasing temperature. It explains the initial decrease of l just below the clearing temperature. The further increase of l below 340 K is caused by an increasing order parameter.

4. Summary and Conclusions

The phase transitions of liquid crystalline S-(4-pentylphenyl) 4-(pentyloxy)benzothioate (5OS5) were investigated by X-ray diffraction and complementary methods. The additional X phase was detected in a narrow temperature range between the isotropic liquid and nematic phases. The achirality of molecules and their rod-like molecular shape make the presence of the blue phase or the transition between the regular and twist-bend nematic phases very unlikely. The texture observation excluded the transition between the uniaxial and biaxial nematic. For the temperature dependence of the low-angle diffuse maximum in the nematic phase, let us hypothesize that the X → N transition is related to the change in a building block, i.e., the types of dimers present in the nematic phase. The X phase is likely to be a nematic formed mainly by longer dimers, while the N phase is a nematic formed mainly by shorter dimers. The XRD patterns confirmed the presence of one crystal phase, for which the coefficients of thermal expansion were determined. In the POM observations, the transition between the crystal phases was clearly visible during heating, which was not observed by any other method, the DSC thermograms indicating only some recrystallization effects. Apparently, in the thin sample placed between two glass slides, used in texture observations, the melt crystallization leads to the metastable crystal phase, and transition to the stable crystal phase investigated by XRD occurs via cold crystallization during heating.

Author Contributions

Conceptualization, A.D.; formal analysis, A.D., B.S. and S.L.; investigation, A.D., B.S., S.L. and W.Z.; resources, M.D.O.-C., J.C. and M.M.; writing—original draft preparation, A.D.; writing—review and editing, B.S., S.L., W.Z., M.D.O.-C., J.C. and M.M.; funding acquisition, M.M. All authors have read and agreed to the published version of the manuscript.

Funding

The PerkinElmer DSC 8000 calorimeter was purchased thanks to the financial support of the European Regional Development Fund in the framework of the Polish Innovation Economy Operational Program (contract no. POIG.02.01.00-12-023/08). This research was supported in part by the Excellence Initiative—Research University Program at the Jagiellonian University in Kraków.

Data Availability Statement

Dataset available on request from the authors.

Acknowledgments

We gratefully acknowledge Poland’s high-performance Infrastructure PLGrid Academic Computer Centre Cyfronet AGH for providing computer facilities and support within computational grant no. plgmolkryst8.

Conflicts of Interest

The authors declare no conflicts of interest.

References

  1. Demus, D.; Goodby, J.; Gray, G.W.; Spiess, H.-W.; Vill, V. (Eds.) Handbook of Liquid Crystals; WILEY-VCH Verlag GmbH: Weinheim, Germany, 1998. [Google Scholar]
  2. Vertogen, G.; de Jeu, W.H. Thermotropic Liquid Crystals: Fundamentals; Springer: Berlin/Heidelberg, Germany, 1988. [Google Scholar]
  3. Schadt, M. Nematic liquid crystals and twisted-nematic LCDs. Liq. Cryst. 2015, 42, 646–652. [Google Scholar] [CrossRef]
  4. Shivaraja, S.J.; Gupta, R.K.; Kumar, S.; Manjuladevi, V. Enhanced electro-optical response of nematic liquid crystal doped with functionalised silver nanoparticles in twisted nematic configuration. Liq. Cryst. 2020, 47, 1678–1690. [Google Scholar]
  5. Ma, Z.; Gao, Y.; Cao, H. The Effect of Chemically Modified Multi-Walled Carbon Nanotubes on the Electro-Optical Properties of a Twisted Nematic Liquid Crystal Display Mode. Crystals 2022, 12, 1482. [Google Scholar] [CrossRef]
  6. Stevenson, W.D.; Zhou, H.; Zeng, X.; Welch, C.; Ungar, G.; Mehl, G.H. Dynamic calorimetry and XRD studies of the nematic and twist-bend nematic phase transitions in a series of dimers with increasing spacer length. Phys. Chem. Chem. Phys. 2018, 20, 25268–25274. [Google Scholar] [CrossRef]
  7. Tomczyk, W.; Longa, L. Role of molecular bend angle and biaxiality in the stabilization of the twist-bend nematic phase. Soft Matter 2020, 16, 4350–4357. [Google Scholar] [CrossRef]
  8. Tschierske, C.; Photinos, D.J. Biaxial nematic phases. J. Mater. Chem. 2010, 20, 4263–4294. [Google Scholar] [CrossRef]
  9. Brisbin, D.; DeHoff, R.; Lockhart, T.E.; Johnson, D.L. Specific Heat near the Nematic-Smectic-A Tricritical Point. Phys. Rev. Lett. 1979, 43, 1171–1174. [Google Scholar] [CrossRef]
  10. Gane, P.A.C.; Leadbetter, A.J. Modulated crystal B phases and B-to-G phase transitions in two types of liquid crystalline compound. J. Phys. C Solid State Phys. 1983, 16, 2059–2067. [Google Scholar] [CrossRef]
  11. Leadbetter, A.J.; Tucker, P.A.; Gray, G.W.; Tajbakhsh, A.R. The Phase Behaviour of 4-n-Hexylphenyl 4-n-Tetra-Decyloxybenzthiolate (14S6) and 4-n-Pentylphenyl 4-n-Decyloxybenzthiolate (10S5). Mol. Cryst. Liq. Cryst. Lett. 1985, 1, 19–24. [Google Scholar] [CrossRef]
  12. Ocko, B.M.; Birgeneau, R.J.; Litster, J.D. Crossover to tricritical behavior at the nematic to smectic A transition: An x-ray scattering study. Z. Phys. B Condens. Matter 1986, 62, 487–497. [Google Scholar] [CrossRef]
  13. Chruściel, J.; Wróbel, S.; Kresse, H.; Urban, S.; Otowski, W. Dielectric Studies of 4-n-Pentylphenyl-4-Octyloxythiobenzoate. Mol. Cryst. Liq. Cryst. 1985, 127, 57–65. [Google Scholar] [CrossRef]
  14. Deptuch, A.; Jaworska-Gołąb, T.; Kusz, J.; Książek, M.; Nagao, K.; Matsumoto, T.; Yamano, A.; Ossowska-Chruściel, M.D.; Chruściel, J.; Marzec, M. Single crystal X-ray structure determination and temperature-dependent structural studies of the smectogenic compound 7OS5. Acta Cryst. B 2020, 76, 1128–1135. [Google Scholar] [CrossRef]
  15. Ossowska-Chruściel, M.D.; Karczmarzyk, Z.; Chruściel, J. The Polymorphism Of 4-N-Pentylphenyl-4″-N-Butyloxythio-Benzoate, (4OS5) In The Crystalline State. Mol. Cryst. Liq. Cryst. 2002, 382, 37–52. [Google Scholar] [CrossRef]
  16. Karczmarzyk, Z.; Ossowska-Chruściel, M.D.; Chruściel, J. The Crystal and Molecular Structure of 4-n-Pentylphenyl-4′-n-Hexyloxythiobenzoate (6OS5). Mol. Cryst. Liq. Cryst. 2001, 357, 117–125. [Google Scholar] [CrossRef]
  17. Chruściel, J.; Pniewska, B.; Ossowska-Chruściel, M.D. The Crystal and Molecular Structure of 4-Pentylphenyl-4′-Pentioxythiobenzoate (5S5). Mol. Cryst. Liq. Cryst. 1995, 258, 325–331. [Google Scholar] [CrossRef]
  18. Chruściel, J.; Wróbel, S.; Kresse, H.; Urban, S.; Otowski, W. Odd-Even Effect in the Homologous Series of Thioesters. Mol. Cryst. Liq. Cryst. 1990, 192, 107–112. [Google Scholar] [CrossRef]
  19. Rudzki, A. Liquid crystal mixtures with the chiral benzoate dopant. Phase Transit. 2023, 96, 139–148. [Google Scholar] [CrossRef]
  20. Osiecka, N.; Galewski, Z.; Massalska-Arodź, M. TOApy program for the thermooptical analysis of phase transitions. Thermochim. Acta 2017, 655, 106–111. [Google Scholar] [CrossRef]
  21. Osiecka-Drewniak, N.; Galewski, Z.; Juszyńska-Gałązka, E. Distinguishing the Focal-Conic Fan Texture of Smectic A from the Focal-Conic Fan Texture of Smectic B. Crystals 2023, 13, 1187. [Google Scholar] [CrossRef]
  22. Rodríguez-Carvajal, J. Recent advances in magnetic structure determination by neutron powder diffraction. Phys. B Condens. Matter 1993, 192, 55–69. [Google Scholar] [CrossRef]
  23. Cliffe, M.J.; Goodwin, A.L. PASCal: A principal axis strain calculator for thermal expansion and compressibility determination. J. Appl. Cryst. 2012, 45, 1321–1329. [Google Scholar] [CrossRef]
  24. Lertkiattrakul, M.; Ewans, M.L.; Cliffe, M.J. PASCal Python: A Principal Axis Strain Calculator. J. Open Source Softw. 2023, 8, 5556. [Google Scholar] [CrossRef]
  25. Frisch, M.J.; Trucks, G.W.; Schlegel, H.B.; Scuseria, G.E.; Robb, M.A.; Cheeseman, J.R.; Scalmani, G.; Barone, V.; Petersson, G.A.; Nakatsuji, H.; et al. Gaussian 16, Revision C.01, Gaussian, Inc.: Wallingford, CT, USA, 2019.
  26. Weigend, F.; Ahlrichs, R. Balanced basis sets of split valence, triple zeta valence and quadruple zeta valence quality for H to Rn: Design and assessment of accuracy. Phys. Chem. Chem. Phys. 2005, 7, 3297–3305. [Google Scholar] [CrossRef]
  27. Lee, C.; Yang, W.; Parr, R.G. Development of the Colle-Salvetti correlation-energy formula into a functional of the electron density. Phys. Rev. B 1988, 37, 785–789. [Google Scholar] [CrossRef]
  28. Becke, A.D. Density-functional thermochemistry. III. The role of exact exchange. J. Chem. Phys. 1993, 98, 5648–5652. [Google Scholar] [CrossRef]
  29. Grimme, S.; Ehrlich, S.; Goerigk, L. Effect of the damping function in dispersion corrected density functional theory. J. Comput. Chem. 2011, 32, 1456–1465. [Google Scholar] [CrossRef]
  30. Hanwell, M.D.; Curtis, D.E.; Lonie, D.C.; Vandermeersch, T.; Zurek, E.; Hutchison, G.R. Avogadro: An advanced semantic chemical editor, visualization, and analysis platform. J. Cheminform. 2012, 4, 17. [Google Scholar] [CrossRef]
  31. Blaabjerg, L.I.; Lindenberg, E.; Löbmann, K.; Grohganz, H.; Rades, T. Glass Forming Ability of Amorphous Drugs Investigated by Continuous Cooling and Isothermal Transformation. Mol. Pharm. 2016, 13, 3318–3325. [Google Scholar] [CrossRef]
  32. Jasiurkowska-Delaporte, M.; Rozwadowski, T.; Juszyńska-Gałązka, E. Kinetics of Non-Isothermal and Isothermal Crystallization in a Liquid Crystal with Highly Ordered Smectic Phase as Reflected by Differential Scanning Calorimetry, Polarized Optical Microscopy and Broadband Dielectric Spectroscopy. Crystals 2019, 9, 205. [Google Scholar] [CrossRef]
  33. Piwowarczyk, M.; Osiecka-Drewniak, N.; Gałązka, M.; Galewski, Z. Synthesis, mesogenic and photoisomerization studies of (E)-4-[(4-pentyloxyphenyl)diazenyl]phenyl alkanoates. Phase Transit. 2019, 92, 1066–1076. [Google Scholar] [CrossRef]
  34. Nakum, K.J.; Katarija, K.D.; Savani, C.J.; Jadeja, R.N. The influence of molecular flexibility on the mesogenic behavior of a new homologous series based on azo-azomethine: Synthesis, characterization, photoisomerization and DFT study. J. Mol. Struct. 2022, 1249, 131586. [Google Scholar] [CrossRef]
  35. Bagchi, K.; Emeršič, T.; Martínez-González, J.A.; de Pablo, J.J.; Nealey, P.F. Functional soft materials from blue phase liquid crystals. Science 2023, 9, eadh9393. [Google Scholar] [CrossRef] [PubMed]
  36. Rietveld, H.M. A profile refinement method for nuclear and magnetic structures. J. Appl. Cryst. 1969, 2, 65–71. [Google Scholar] [CrossRef]
  37. Le Bail, A.; Duroy, H.; Fourquet, J.L. Ab-initio structure determination of LiSbWO6 by X-ray powder diffraction. Mater. Res. Bull. 1988, 23, 447–452. [Google Scholar] [CrossRef]
  38. Budai, J.; Pindak, R.; Davey, S.C.; Goodby, J.W. A structural investigation of the liquid crystal phases of 4-(2’-methylbutyl)phenyl 4’-n-octylbiphenyl-4-carboxylate. J. Phys. Lett. 1984, 45, 1053–1062. [Google Scholar] [CrossRef]
  39. de Vries, A. The description of the smectic A and C phases and the smectic A-C phase transition of TCOOB with a diffuse-cone model. J. Chem. Phys. 1979, 71, 25–31. [Google Scholar] [CrossRef]
  40. Rowland, R.S.; Taylor, R. Intermolecular Nonbonded Contact Distances in Organic Crystal Structures: Comparison with Distances Expected from van der Waals Radii. J. Phys. Chem. 1996, 100, 7384–7391. [Google Scholar] [CrossRef]
  41. Sinha, D.; Mandal, P.K.; Dąbrowski, R. High birefringence laterally fluorinated terphenyl isothiocyanates: Structural, optical and dynamical properties. Phys. B Condens. Matter 2014, 441, 100–106. [Google Scholar] [CrossRef]
  42. Bielejewska, N.; Chrzumnicka, E.; Mykowska, E.; Przybylski, R.; Szybowicz, M. Comparative Study of Orientational Order of Some Liquid Crystals from Various Homologous Series. Acta Phys. Pol. A 2006, 110, 777–793. [Google Scholar] [CrossRef]
  43. Bauman, D.; Zięba, A.; Mykowska, E. Oriental behaviour of some homologues of 4-n-pentyl-phenylthio-4′-n-alkoxybenzoate doped with dichroic dye. Opto-Electron. Rev. 2008, 16, 244–250. [Google Scholar] [CrossRef]
Figure 1. Scheme of the nematic phase (a) and the molecular formula of S-(4-pentylphenyl) 4-(alkyloxy)benzothioates (nOS5) (b). For the homologue in this study, n = 5.
Crystals 14 00367 g001
Figure 2. DSC thermogram of 5OS5 registered during the second heating/cooling cycle at a 5 K/min rate. The inset shows the enlarged region around the clearing temperature.
Crystals 14 00367 g002
Figure 3. POM textures of 5OS5 collected during cooling (a) and heating (b) at a 5 K/min rate, with the corresponding results of numerical analysis in the TOApy program. Each texture shows an area of 622 μm × 466 μm.
Crystals 14 00367 g003
Figure 4. POM textures of 5OS5 collected during cooling at a 1 K/min rate, with the corresponding results of numerical analysis in the TOApy program. Each texture shows an area of 622 μm × 466 μm.
Crystals 14 00367 g004
Figure 5. X-ray diffraction patterns of 5OS5 collected during the 1st heating of a pristine sample (a), heating after direct cooling at 5 K/min from 365 to 263 K (b), cooling from 365 K in the 2θ = 2–30° range (c) and slower cooling from 365 K in the 2θ = 2–8° range (d). The wide maximum at 2θ ≈ 7° is a background contribution. The 2θ values were corrected by the zero of the diffractometer determined from the Rietveld refinement for the crystal phase.
Crystals 14 00367 g005
Figure 6. Example of the Rietveld refinement for the diffraction pattern of 5OS5 collected after slow cooling to 298 K.
Crystals 14 00367 g006
Figure 7. Monoclinic unit cell parameters of 5OS5: lattice constants (ac), volume (d) and the β angle (inset in (b)) as a function of temperature. Open points denote results obtained by the Le Bail fitting for the pristine sample, and solid points denote results obtained by the Rietveld refinement for the crystal formed from the melt. The linear fits to the experimental points are shown. The enlarged solid circles refer to the lattice parameters in 298 K after slow cooling and were excluded from the linear fits.
Crystals 14 00367 g007
Figure 8. Average distance w between long axes of molecules and correlation length ξ of the short-range order in the N and Iso phases of 5OS5 as a function of temperature. The inset shows the average distance between short axes of molecules in the nematic phase. The solid lines denote the results of linear fits and the dashed line indicates the Iso → N transition temperature.
Crystals 14 00367 g008
Figure 9. Isolated 5OS5 molecule (a) and examples of possible head-to-head (b) and head-to-tail (c) dimers formed via hydrogen bonds. The geometry optimizations were carried out with the DFT/B3LYP-D3(BJ)-def2TZVPP method.
Crystals 14 00367 g009
Table 1. Thermodynamic parameters of the phase transitions of 5OS5 determined by the DSC method (5 K/min): onset temperature, peak temperature, enthalpy change and entropy change.
Transition T o (K) T p (K) H (kJ/mol) S (J/(mol·K))
Cr → N333.6335.133.299.1
N → X352.0352.60.20.6
X → Iso352.8353.30.61.8
Iso → X353.1352.7−0.7−1.9
X → N-352.1−0.3−0.7
N → Cr287.0286.6−14.6-
Table 2. Results of linear fits to the monoclinic unit cell parameters of 5OS5 as a function of increasing temperature, determined by the Le Bail fitting for the pristine sample and by the Rietveld refinement for the crystal grown from melt.
ParameterPristine SampleCrystal Grown from Melt
InterceptSlopeInterceptSlope
a18.61(5) Å0.0042(2) Å/K18.99(3) Å0.00279(7) Å/K
b5.32(6) Å0.0010(2) Å/K5.476(4) Å0.00041(2) Å/K
c19.6(2) Å0.0026(5) Å/K19.39(2) Å0.00290(7) Å/K
β98.8(4)°0.021(2)°/K102.0(2)°0.0119(7)°/K
V1947(33) Å30.8(1) Å3/K1974(5) Å30.64(2) Å3/K
Table 3. Matrix of transition between the unit cell axes a, b, c and principal axes x, y, z, and the coefficients of thermal expansion along the principal axes calculated in PASCal based on results of the Rietveld refinement for the crystal phase of 5OS5.
Principal Axisabc α i [10−6/K]
x0.729800.6837−7.5(6.5)
y0−1075(3)
z−0.688000.7257226(5)
V---295(8)
Disclaimer/Publisher’s Note: The statements, opinions and data contained in all publications are solely those of the individual author(s) and contributor(s) and not of MDPI and/or the editor(s). MDPI and/or the editor(s) disclaim responsibility for any injury to people or property resulting from any ideas, methods, instructions or products referred to in the content.

