The following supporting information can be downloaded at:
https://www.mdpi.com/article/10.3390/cryst14040377/s1. Figure S1. A top-down depiction showing 10,000 velocity streamlines color-coded according to temperature within the chambers, under the conditions of N
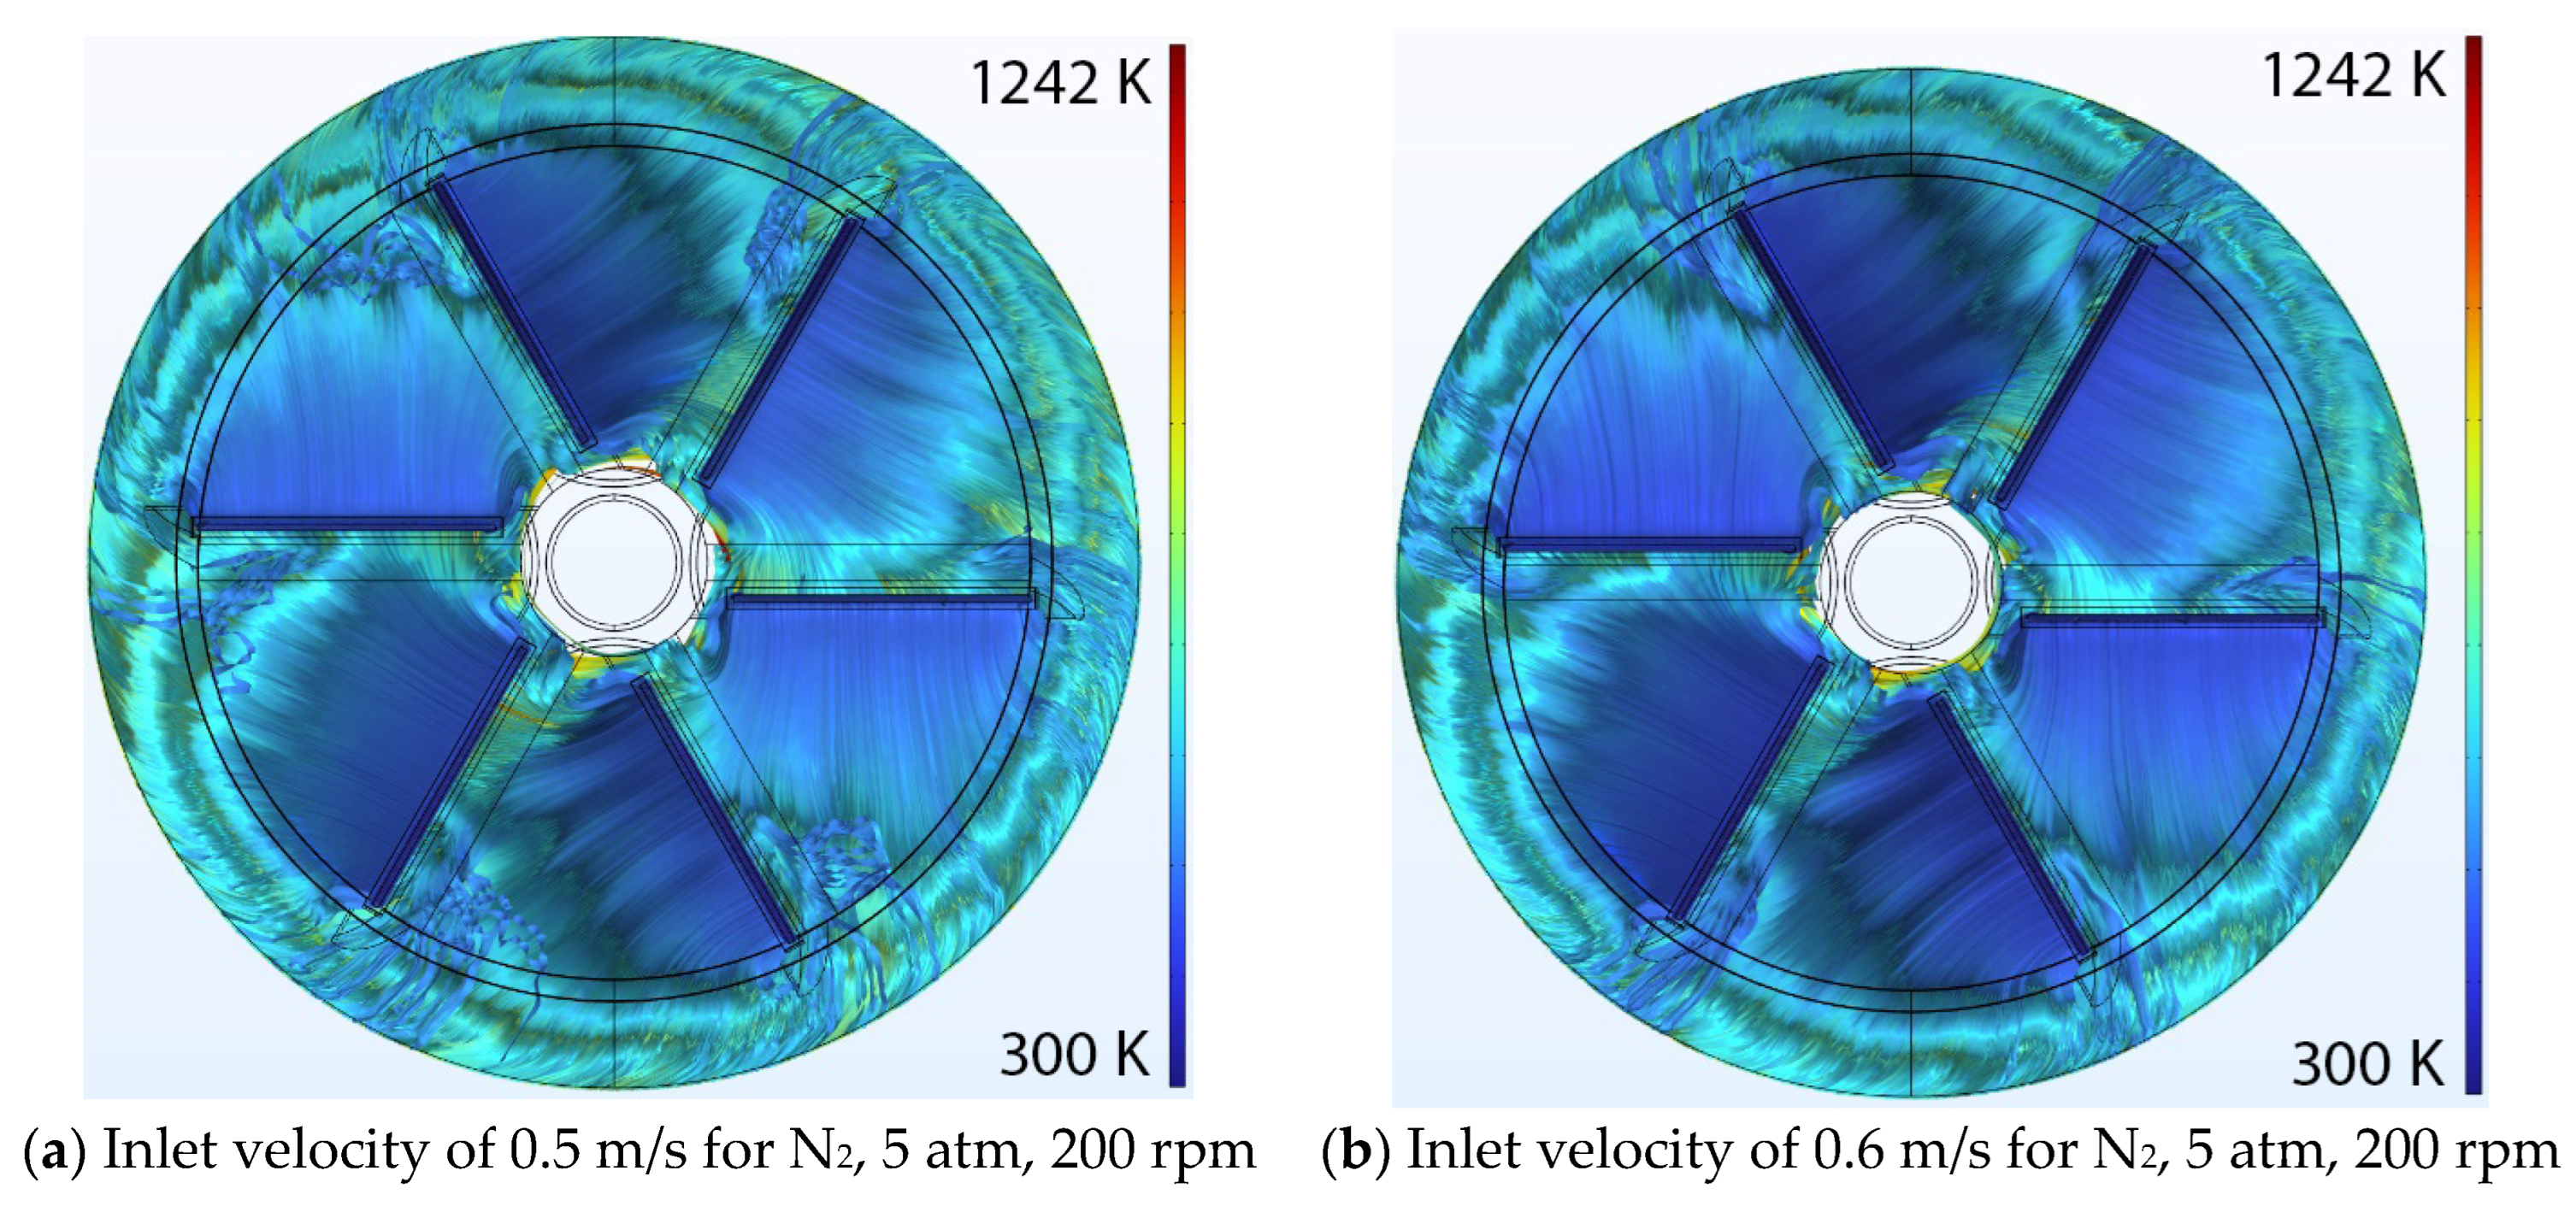
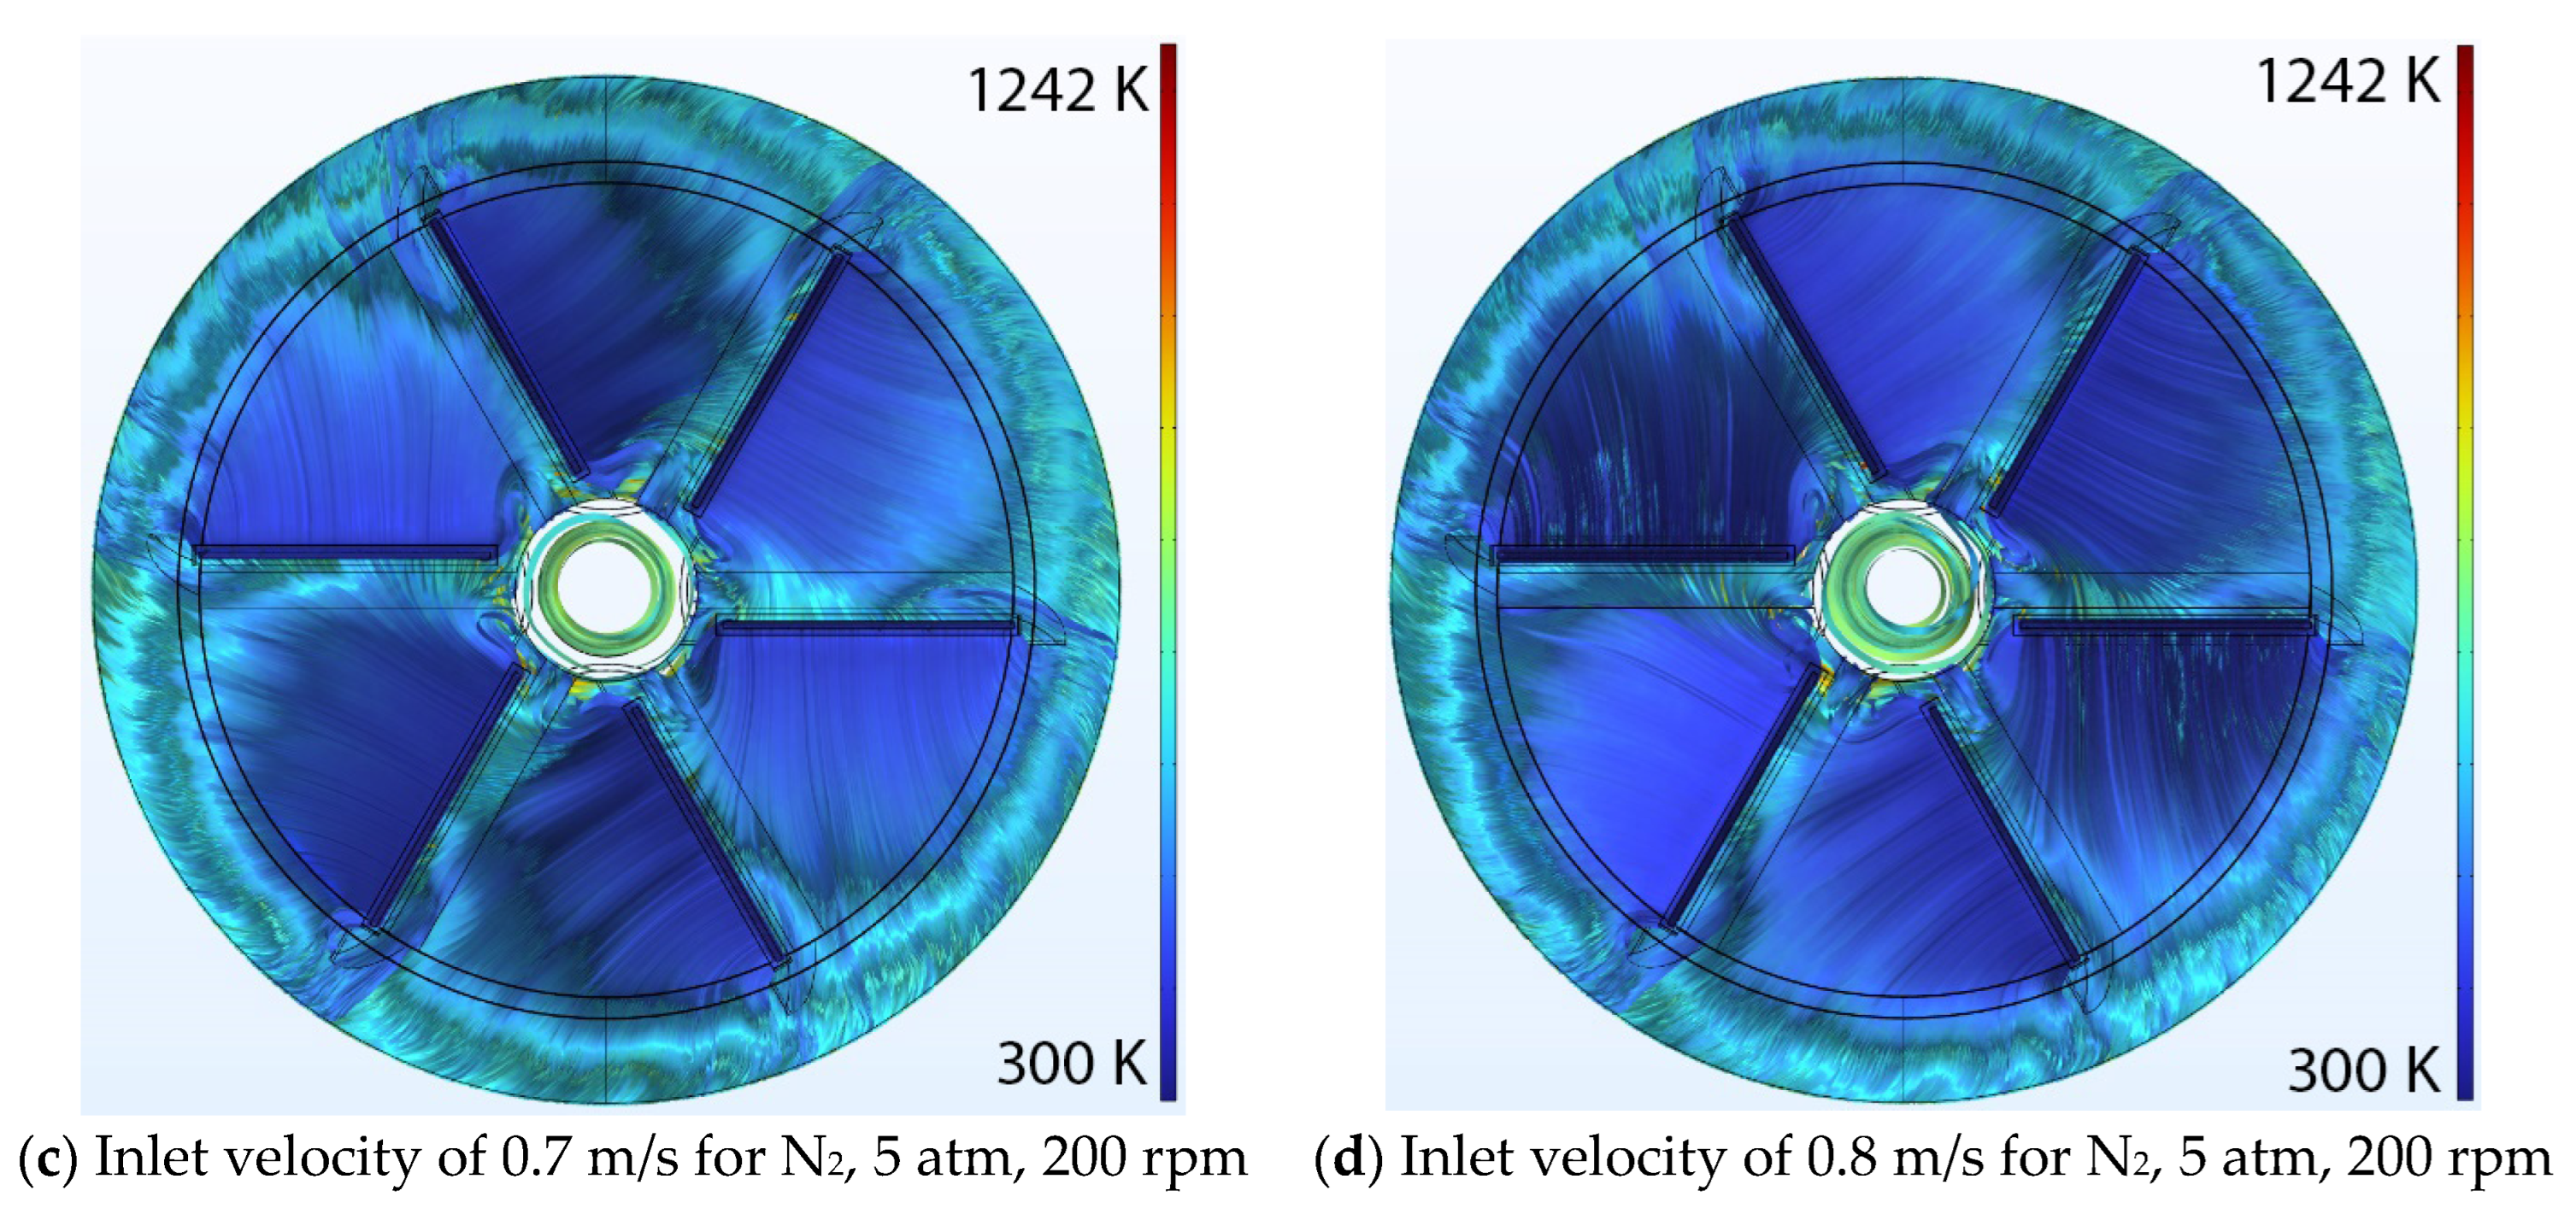
2 at 10 atm pressure. The disk rotates at 100 rpm, while gas is introduced at inlet velocities of (a) 0.5 m/s, (b) 0.6 m/s, (c) 0.7 m/s, and (d) 0.8 m/s. Gas temperature is consistently color-coded across all panels, varying from 300 K (blue) to 1235 K (red); Figure S2. A top-down depiction showing 10,000 velocity streamlines color-coded according to temperature within the chambers, under the conditions of N
2 at 10 atm pressure. The disk rotates at 200 rpm, while gas is introduced at inlet velocities of (a) 0.5 m/s, (b) 0.6 m/s, (c) 0.7 m/s, and (d) 0.8 m/s. Gas temperature is consistently color-coded across all panels, varying from 300 K (blue) to 1234 K (red); Figure S3. A top-down depiction showing 10,000 velocity streamlines color-coded according to temperature within the chambers, under the conditions of N
2 at 10 atm pressure. The disk rotates at 300 rpm, while gas is introduced at inlet velocities of (a) 0.5 m/s, (b) 0.6 m/s, (c) 0.7 m/s, and (d) 0.8 m/s. Gas temperature is consistently color-coded across all panels, varying from 300 K (blue) to 1158 K (red); Figure S4. A top-down depiction showing 10,000 velocity streamlines color-coded according to temperature within the chambers, under the conditions of N
2 at 20 atm pressure. The disk rotates at 200 rpm, while gas is introduced at inlet velocities of (a) 0.5 m/s, (b) 0.6 m/s, (c) 0.7 m/s, and (d) 0.8 m/s. Gas temperature is consistently color-coded across all panels, varying from 300 K (blue) to 1376 K (red); Figure S5. A top-down depiction showing 10,000 velocity streamlines color-coded according to temperature within the chambers, under the conditions of N
2 at 20 atm pressure. The disk rotates at 300 rpm, while gas is introduced at inlet velocities of (a) 0.5 m/s, (b) 0.6 m/s, (c) 0.7 m/s, and (d) 0.8 m/s. Gas temperature is consistently color-coded across all panels, varying from 300 K (blue) to 1196 K (red); Figure S6. A top-down depiction showing 10,000 velocity streamlines color-coded according to temperature within the chambers, under the conditions of N
2 at 20 atm pressure. The disk rotates at 400 rpm, while gas is introduced at inlet velocities of (a) 0.5 m/s, (b) 0.6 m/s, (c) 0.7 m/s, and (d) 0.8 m/s. Gas temperature is consistently color-coded across all panels, varying from 300 K (blue) to 1126 K (red); Figure S7. A top-down depiction showing 10,000 velocity streamlines color-coded according to temperature within the chambers, under the conditions of N
2 at 30 atm pressure. The disk rotates at 200 rpm, while gas is introduced at inlet velocities of (a) 0.5 m/s, (b) 0.6 m/s, (c) 0.7 m/s, and (d) 0.8 m/s. Gas temperature is consistently color-coded across all panels, varying from 300 K (blue) to 1288 K (red); Figure S8. A top-down depiction showing 10,000 velocity streamlines color-coded according to temperature within the chambers, under the conditions of N
2 at 30 atm pressure. The disk rotates at 300 rpm, while gas is introduced at inlet velocities of (a) 0.5 m/s, (b) 0.6 m/s, (c) 0.7 m/s, and (d) 0.8 m/s. Gas temperature is consistently color-coded across all panels, varying from 300 K (blue) to 1257 K (red); Figure S9. A top-down depiction showing 10,000 velocity streamlines color-coded according to temperature within the chambers, under the conditions of N
2 at 30 atm pressure. The disk rotates at 400 rpm, while gas is introduced at inlet velocities of (a) 0.5 m/s, (b) 0.6 m/s, (c) 0.7 m/s, and (d) 0.8 m/s. Gas temperature is consistently color-coded across all panels, varying from 300 K (blue) to 1288 K (red); Figure S10. A top-down depiction showing 10,000 velocity streamlines color-coded according to temperature within the chambers, under the conditions of H
2 at 10 atm pressure. The disk rotates at 100 rpm, while gas is introduced at inlet velocities of (a) 0.5 m/s, (b) 0.6 m/s, (c) 0.7 m/s, and (d) 0.8 m/s. Gas temperature is consistently color-coded across all panels, varying from 300 K (blue) to 1306 K (red); Figure S11. A top-down depiction showing 10,000 velocity streamlines color-coded according to temperature within the chambers, under the conditions of H
2 at 10 atm pressure. The disk rotates at 200 rpm, while gas is introduced at inlet velocities of (a) 0.5 m/s, (b) 0.6 m/s, (c) 0.7 m/s, and (d) 0.8 m/s. Gas temperature is consistently color-coded across all panels, varying from 300 K (blue) to 1337 K (red); Figure S12. A top-down depiction showing 10,000 velocity streamlines color-coded according to temperature within the chambers, under the conditions of H
2 at 10 atm pressure. The disk rotates at 300 rpm, while gas is introduced at inlet velocities of (a) 0.5 m/s, (b) 0.6 m/s, (c) 0.7 m/s, and (d) 0.8 m/s. Gas temperature is consistently color-coded across all panels, varying from 300 K (blue) to 1350 K (red); Figure S13. A top-down depiction showing 10,000 velocity streamlines color-coded according to temperature within the chambers, under the conditions of H
2 at 20 atm pressure. The disk rotates at 200 rpm, while gas is introduced at inlet velocities of (a) 0.5 m/s, (b) 0.6 m/s, (c) 0.7 m/s, and (d) 0.8 m/s. Gas temperature is consistently color-coded across all panels, varying from 300 K (blue) to 1388 K (red); Figure S14. A top-down depiction showing 10,000 velocity streamlines color-coded according to temperature within the chambers, under the conditions of H
2 at 20 atm pressure. The disk rotates at 300 rpm, while gas is introduced at inlet velocities of (a) 0.5 m/s, (b) 0.6 m/s, (c) 0.7 m/s, and (d) 0.8 m/s. Gas temperature is consistently color-coded across all panels, varying from 300 K (blue) to 1355 K (red); Figure S15. A top-down depiction showing 10,000 velocity streamlines color-coded according to temperature within the chambers, under the conditions of H
2 at 20 atm pressure. The disk rotates at 400 rpm, while gas is introduced at inlet velocities of (a) 0.5 m/s, (b) 0.6 m/s, (c) 0.7 m/s, and (d) 0.8 m/s. Gas temperature is consistently color-coded across all panels, varying from 300 K (blue) to 1330 K (red); Figure S16. A top-down depiction showing 10,000 velocity streamlines color-coded according to temperature within the chambers, under the conditions of H
2 at 30 atm pressure. The disk rotates at 200 rpm, while gas is introduced at inlet velocities of (a) 0.5 m/s, (b) 0.6 m/s, (c) 0.7 m/s, and (d) 0.8 m/s. Gas temperature is consistently color-coded across all panels, varying from 300 K (blue) to 1330 K (red); Figure S17. A top-down depiction showing 10,000 velocity streamlines color-coded according to temperature within the chambers, under the conditions of H2 at 30 atm pressure. The disk rotates at 300 rpm, while gas is introduced at inlet velocities of (a) 0.5 m/s, (b) 0.6 m/s, (c) 0.7 m/s, and (d) 0.8 m/s. Gas temperature is consistently color-coded across all panels, varying from 300 K (blue) to 1350 K (red); Figure S18 A top-down depiction showing 10,000 velocity streamlines color-coded according to temperature within the chambers, under the conditions of H
2 at 30 atm pressure. The disk rotates at 400 rpm, while gas is introduced at inlet velocities of (a) 0.5 m/s, (b) 0.6 m/s, (c) 0.7 m/s, and (d) 0.8 m/s. Gas temperature is consistently color-coded across all panels, varying from 300 K (blue) to 1282 K (red); Figure S19. A top-down depiction showing 10,000 velocity streamlines color-coded according to temperature within the chambers, under the conditions of NH
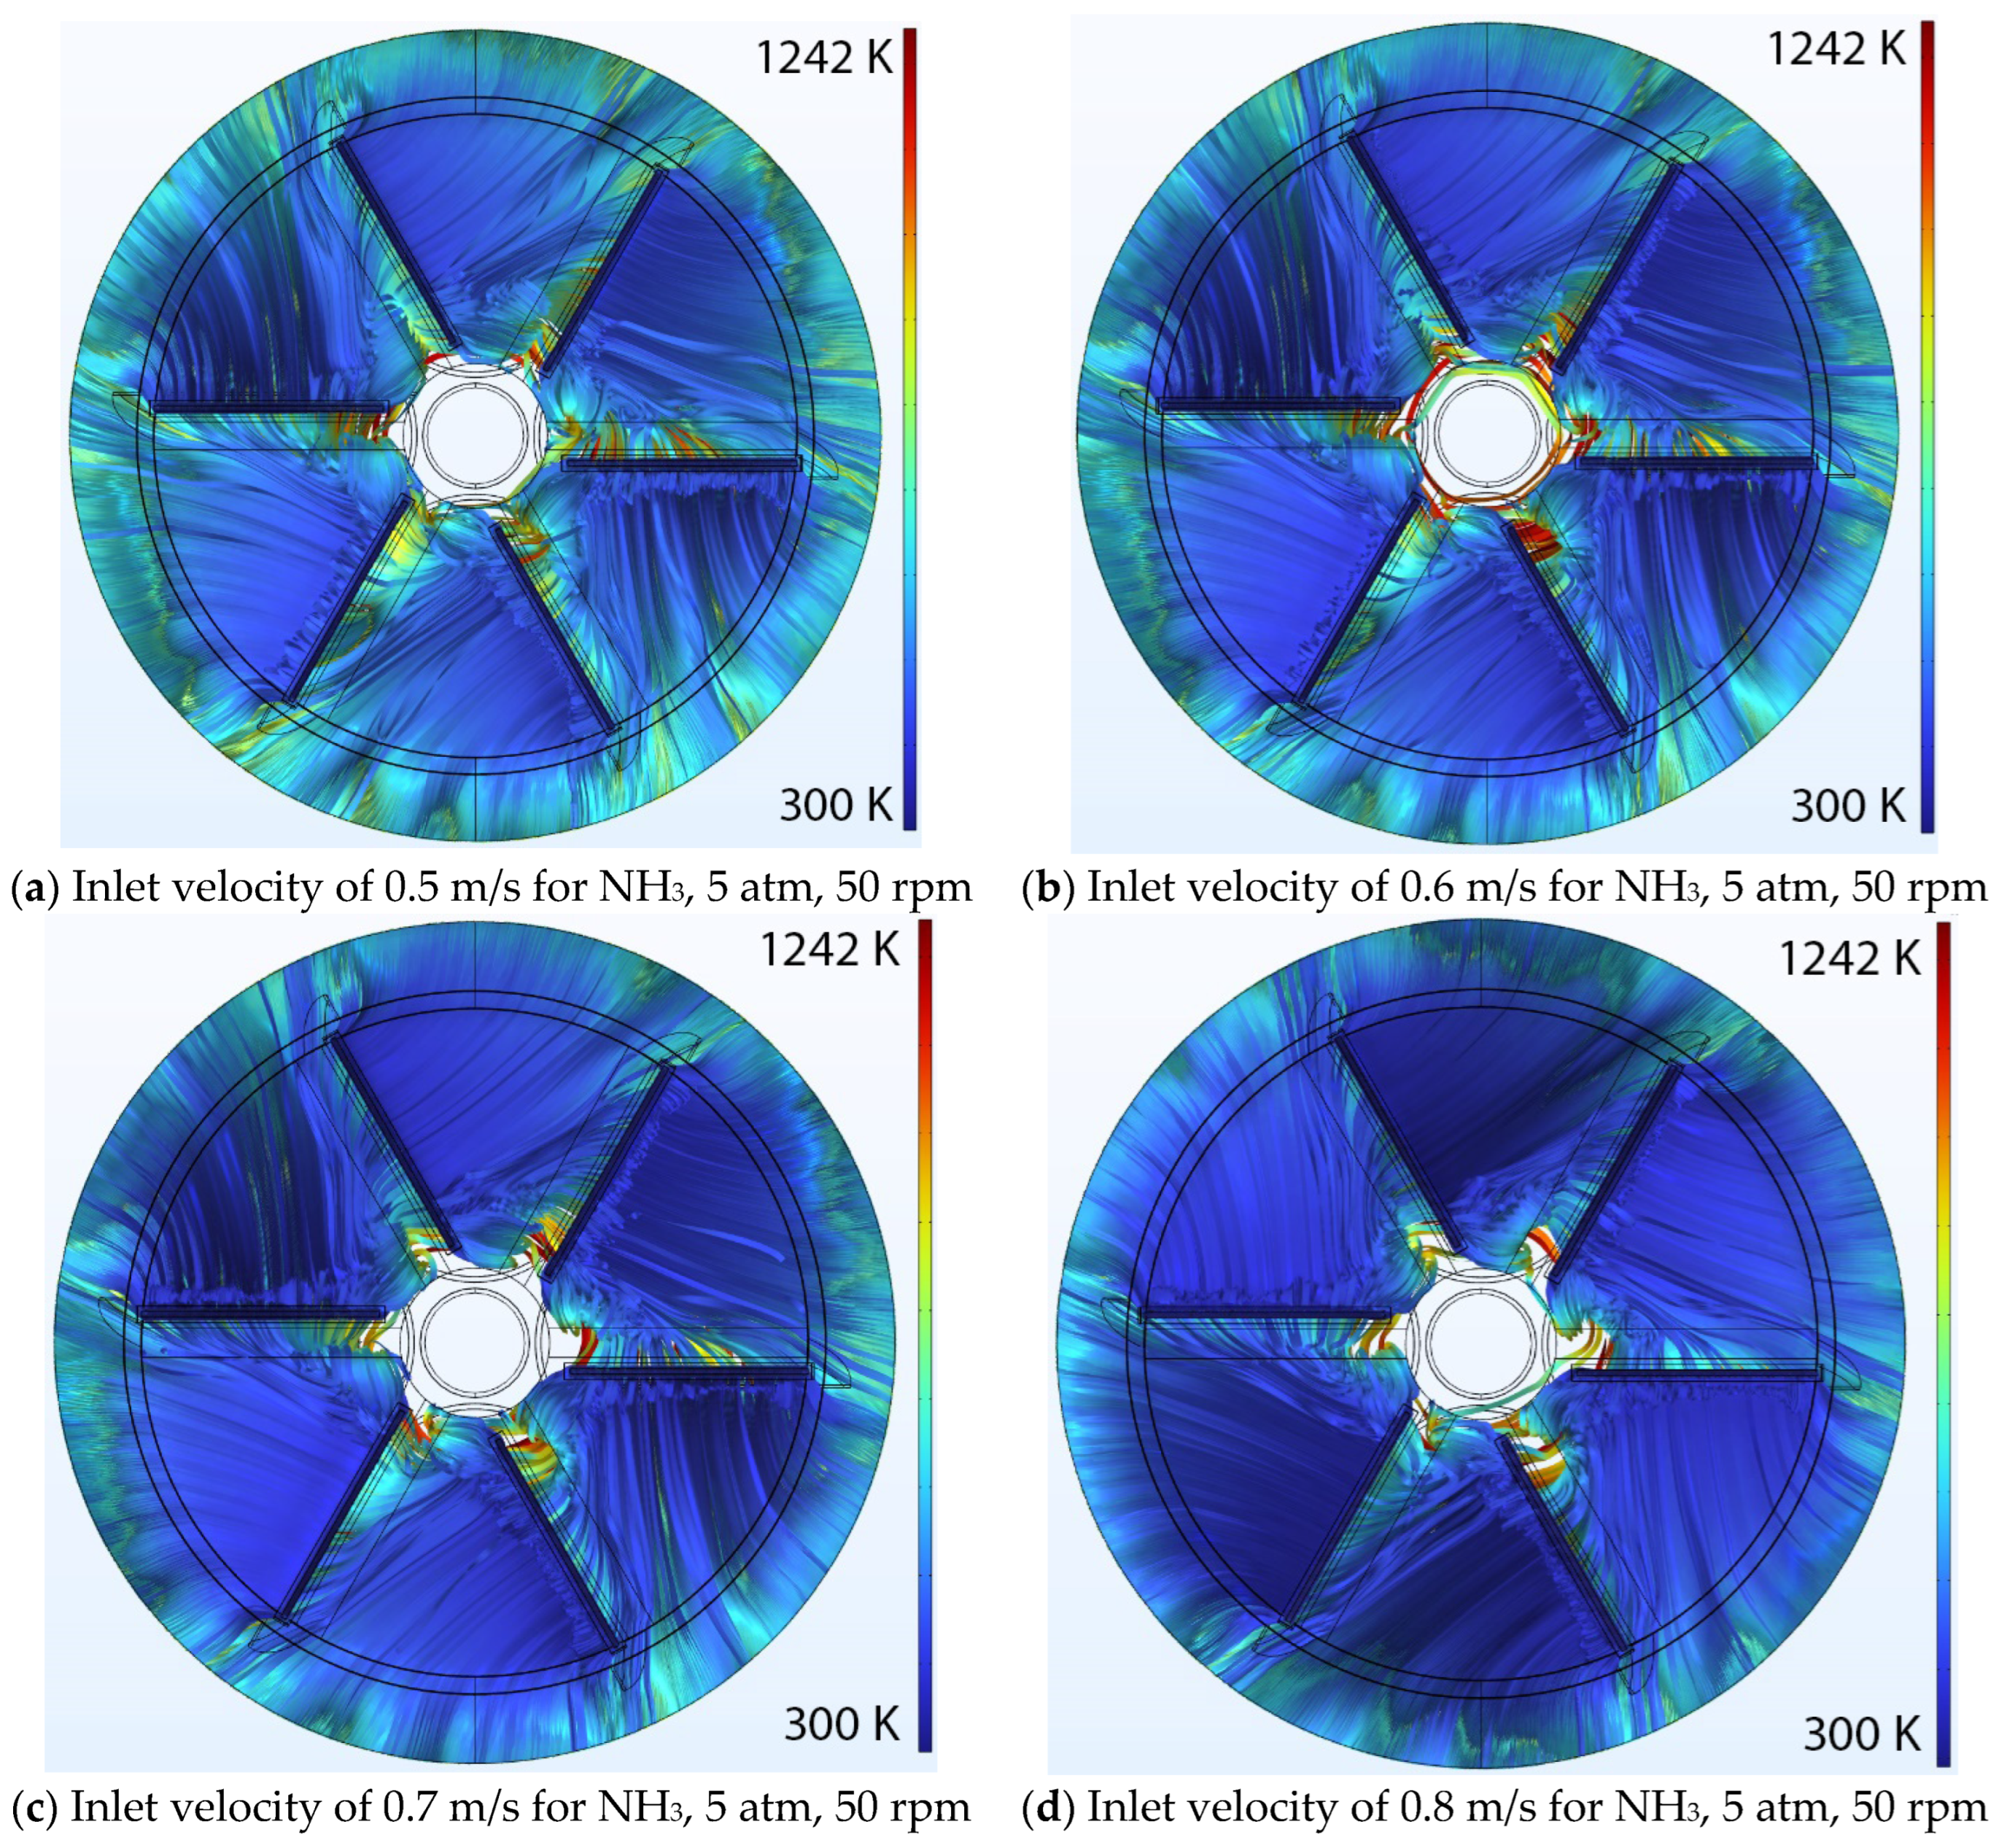
3 at 10 atm pressure. The disk rotates at 200 rpm, while gas is introduced at inlet velocities of (a) 0.5 m/s, (b) 0.6 m/s, (c) 0.7 m/s, and (d) 0.8 m/s. Gas temperature is consistently color-coded across all panels, varying from 300 K (blue) to 1313 K (red); Figure S20. A top-down depiction showing 10,000 velocity streamlines color-coded according to temperature within the chambers, under the conditions of NH
3 at 10 atm pressure. The disk rotates at 300 rpm, while gas is introduced at inlet velocities of (a) 0.5 m/s, (b) 0.6 m/s, (c) 0.7 m/s, and (d) 0.8 m/s. Gas temperature is consistently color-coded across all panels, varying from 300 K (blue) to 1252 K (red); Figure S21. A top-down depiction showing 10,000 velocity streamlines color-coded according to temperature within the chambers, under the conditions of NH
3 at 10 atm pressure. The disk rotates at 400 rpm, while gas is introduced at inlet velocities of (a) 0.5 m/s, (b) 0.6 m/s, (c) 0.7 m/s, and (d) 0.8 m/s. Gas temperature is consistently color-coded across all panels, varying from 300 K (blue) to 1212 K (red).


