Article

Experimental Investigations on the Electrical Conductivity and Complex Dielectric Permittivity of ZnxMn1−xFe2O4 (x = 0 and 0.4) Ferrites in a Low-Frequency Field

1
Faculty of Physics, West University of Timisoara, Bd. V. Parvan No. 4, 300223 Timisoara, Romania
2
Institute for Advanced Environmental Research, West University of Timisoara (ICAM-WUT), Oituz Str., No. 4, 300086 Timisoara, Romania
3
National Institute of Research and Development for Electrochemistry and Condensed Matter, 144 Dr. A. P. Podeanu, 300569 Timisoara, Romania
4
Spin-Off Nattive-Senz SRL, Str. Dr. A. P. Podeanu, Nr. 144, 300569 Timisoara, Romania
*
Author to whom correspondence should be addressed.
Crystals 2024, 14(5), 437; https://doi.org/10.3390/cryst14050437
Submission received: 15 March 2024 / Revised: 29 April 2024 / Accepted: 1 May 2024 / Published: 4 May 2024
(This article belongs to the Section Polycrystalline Ceramics)

Abstract

:
Two samples of ZnxMn1−xFe2O4 (x = 0, sample A; and x = 0.4, sample B) were synthesized by the hydrothermal method. From complex impedance measurements in the range 100 Hz–2 MHz and for temperatures T between 30 and 130 °C, the barrier energy between localized states ΔErelax was determined for the first time in these samples. For sample B, a single value of ΔErelax was highlighted (0.221 eV), whilst, for sample A, two values were obtained (0.012 eV and 0.283 eV, below 85 °C and above 85 °C, respectively), associated with two zones of different conductivities. Using the Mott’s VRH model and the CBH model, we determined for the first time both the bandgap energy barrier (Wm) and the hopping (crossover) frequency (ωh), at various temperatures. The results show that, for sample A, Wm has a maximum equal to 0.72 eV at a temperature between 70 and 80 °C, whilst, for sample B, Wm has a minimum equal to 0.28 eV at a temperature of 60 °C, the results being in good agreement with the temperature dependence of the static conductivity σDC(T) of the samples. By evaluating σDC and eliminating the conduction losses, we identified, using a novel approach, a dielectric relaxation phenomenon in the samples, characterized by the activation energy EA,rel. At various temperatures, we determined EA,rel, which ranged from 0.195 eV to 0.77 eV. These results are important, as understanding these electrical properties is crucial to various applications, especially in technologies where temperature variation is significant.

1. Introduction

Ferrites represent an important class of materials, being used in many applications: in the electronic and telecommunication industry [1,2], in the field of biomedical applications, photocatalysis, ferrofluid technology, etc. [3,4,5]. This wide range of applications is due to their electrical, magnetic, optical, or catalytic properties, which can be obtained by appropriate variations in the particle size, chemical composition, and the processing parameters of the ferrite [6,7,8]. The general chemical formula of ferrites is of the form M 2 + O 2 F e 2 3 + O 3 2 , where M is a divalent element of the type Mn, Co, Ni, and Mg or a metallic combination of mono, bi, or trivalent elements, which is equivalent to a divalent element. In the reference [9], the authors carried out experimental investigations on the structural transformations in manganese ferrite induced by heat treatment, concluding that, above 400 °C, a chemical phase transformation occurs from spinel MnFe2O4 to perovskite MnFeO3, which strongly affects both the magnetic and electrical behavior of the samples.
Among the useful ferrites which have been developed, the Mn-Zn ferrite with a cubic spinel structure can be highlighted. The cation distribution in the ferrite structure is described by the following formula:
( Z n x 2 + M n 1 x 2 + ) A [ F e 2 3 + ] B O 4 2
where the round bracket and the square bracket represent the tetrahedral site (A-site) and the octahedral site (B-site), respectively [10]. The substitution of Mn2+ with Zn2+ ions in the tetrahedral site will lead to the improvement of the structural, morphological, magnetic, and electrical properties of Mn-Zn ferrite [11,12,13]. More researchers have obtained significant results regarding the obtaining methods, morpho-structural characterization, and magnetic properties of Mn-Zn compounds [14,15,16]. There are few articles in the literature regarding the thermo-impedance analysis (dependence on both the temperature and the frequency of the complex impedance and the electrical conductivity) of Mn-Zn ferrites. For this reason, in the present paper, the determination of the electrical conductivity (σ) and the complex dielectric permittivity (ε) in the low-frequency field for ZnxMn1−xFe2O4 compounds as well as the experimental studies regarding the frequency and temperature dependence of σ and ε are very important. Knowledge of the electrical and dielectric properties of these materials, in addition to their magnetic properties, is very useful in applications such as energy storage, photocatalytic applications [17], or microelectronic applications such as power electronics-integrated LC filters [18].
In this context, the experimental measurements of electrical conductivity and complex dielectric permittivity are very useful to obtain information regarding the possibility of using these materials in various applications. Thus, based on thermo-impedance measurements in a frequency range of 20 Hz–2 MHz and at different temperatures T in the range of 30–130 °C, the purpose of this paper is to determine the frequency and temperature dependence of the electrical conductivity σ(f,T) and the complex dielectric permittivity ε(f,T) for the prepared ferrites, ZnxMn1−xFe2O4 (with x = 0 and 0.4), and highlight the possible changes in the conduction regime and the transition temperatures from one regime to another. Also, another purpose of the present paper is to comparatively explain the conduction mechanisms from the samples, using both the obtained results and the VRH (variable range hopping) of Mott [19] and the CBH (correlated barrier hopping) [20] theoretical models, and determine some parameters of these models (the crossover frequency, the activation energy for electrical conduction, and the bandgap energy barrier).

2. Sample Characterization and Experiments

2.1. Synthesis

Using the hydrothermal method [21], two samples were synthesized for the experimental investigations: a manganese ferrite sample (MnFe2O4) for x = 0 (Sample A) and another sample (Sample B), substituted with Zn2+ ions (Zn0.4Mn0.6Fe2O4), for x = 0.4.
The reactants used in the technological process of the two samples’ preparation were of analytical grade and purchased from Merck. For the preparation of sample A, the following reagents were used: 1.7895 g Mn(NO3)2∙H2O and 4.8372 g Fe(NO3)3∙2H2O. Metal salts were dissolved in distilled water and then 1 M NaOH solution was added until the pH reached a value of 11. The manganese ferrite doped with Zn (sample B) was obtained using the same reactants as in the case of sample A, with the difference that 4% of Mn(NO3)2·4H2O was replaced by Zn(NO3)2·6H2O. As a result, the following quantities of reactants were used in the technological process of sample B: 1.2554 g Mn(NO3)2∙H2O, 4.8372 g Fe(NO3)3∙2H2O, and 0.5949 g of Zn(NO3)2∙6H2O solution with a concentration of 0.002 M. The mixture thus obtained for both sample A and sample B was placed in a Morey-type autoclave and maintained at 220 °C for 12 h. After settling and filtering, the resulting precipitates for sample A and sample B were separately washed with distilled water on filter paper and then dried in an air-oven at 800 °C, thus obtaining MnFe2O4-type and Zn0.4Mn0.6Fe2O4-type ferrite powders, respectively.

2.2. Characterization Techniques

The phase structure of the prepared samples was investigated by X-ray diffraction (XRD) using the PANalytical-X’Pert PRO MRD diffractometer—Philips, FEI Company PANalitical BV Netherlands, with Cu-Ka radiation (20° ≤ 2θ ≤ 80°). The results were interpreted with the X’PERT PRO MRD software, FullProf software Version: 2.2b (2.2.2), finally obtaining the diffractogram of the material. Fourier-Transform Infrared Spectroscopy (FTIR) spectra were obtained using a Shimadzu Prestige-21 spectrometer, Japan, in the range 400–4000 cm−1. For the identification of the absorption bands, the existing data in the literature were used [22]. The morphology of the samples was investigated with an FEI Inspect S microscope model scanning electron microscopy (SEM), FEI Company PANalitical Netherlands. At the same time, using the EDX facility of the scanning electron microscope, the elemental analysis of the samples was carried out. The magnetic studies were carried out using the inductive method with a hysteresis graph [23] at a low frequency (50 Hz). Based on the complex impedance measurements in the frequency range of 100 Hz–2 MHz and at different temperatures, between 30 and 130 °C, the frequency and temperature dependence of the electrical conductivity and complex dielectric permittivity of the prepared samples were determined, using an LCR meter (Agilent E-4980-A type) USA, in conjunction with a laboratory experimental setup [24], similar to ASTM D150-98 [25].

3. Results and Discussion

3.1. X-ray Diffraction Analysis

The X-ray diffraction patterns of the prepared samples, ZnxMn1−xFe2O4 (where x = 0 and 0.4), are shown in Figure 1.
The diffraction pattern from Figure 1a shows that both sample A and sample B contain peaks that match the standard data of cubic spinel MnFe2O4 (JCPDS Card no. 75-0034). Also, the XRD pattern obtained for both samples shows that the materials are well crystallized, without any secondary phases (Figure 1). The materials crystallized with the cubic spinel type structure, in the Fd-3m space group. The average crystallite size and lattice constant for the investigated samples were computed using the Scherrer formula and are listed in Table 1.
From Table 1, it can be seen that the average size of the crystallites is lower for x = 0.4 than for x = 0. This may be correlated to the broadening of the diffraction maximum (311) for the Zn-substituted manganese ferrite (sample B), as seen in Figure 1b. At the same time, from Table 1, it can be seen that the lattice constant of sample B substituted with Zn ions (x = 0.4) decreases slightly compared to that of sample A, un-substituted (x = 0). This result can be correlated with the fact that the ionic radius of Zn2+ in the tetrahedral position is 0.060 nm, being slightly smaller than the ionic radius of Mn2+ in the tetrahedral position, which is 0.066 nm [26].

3.2. FTIR Analysis

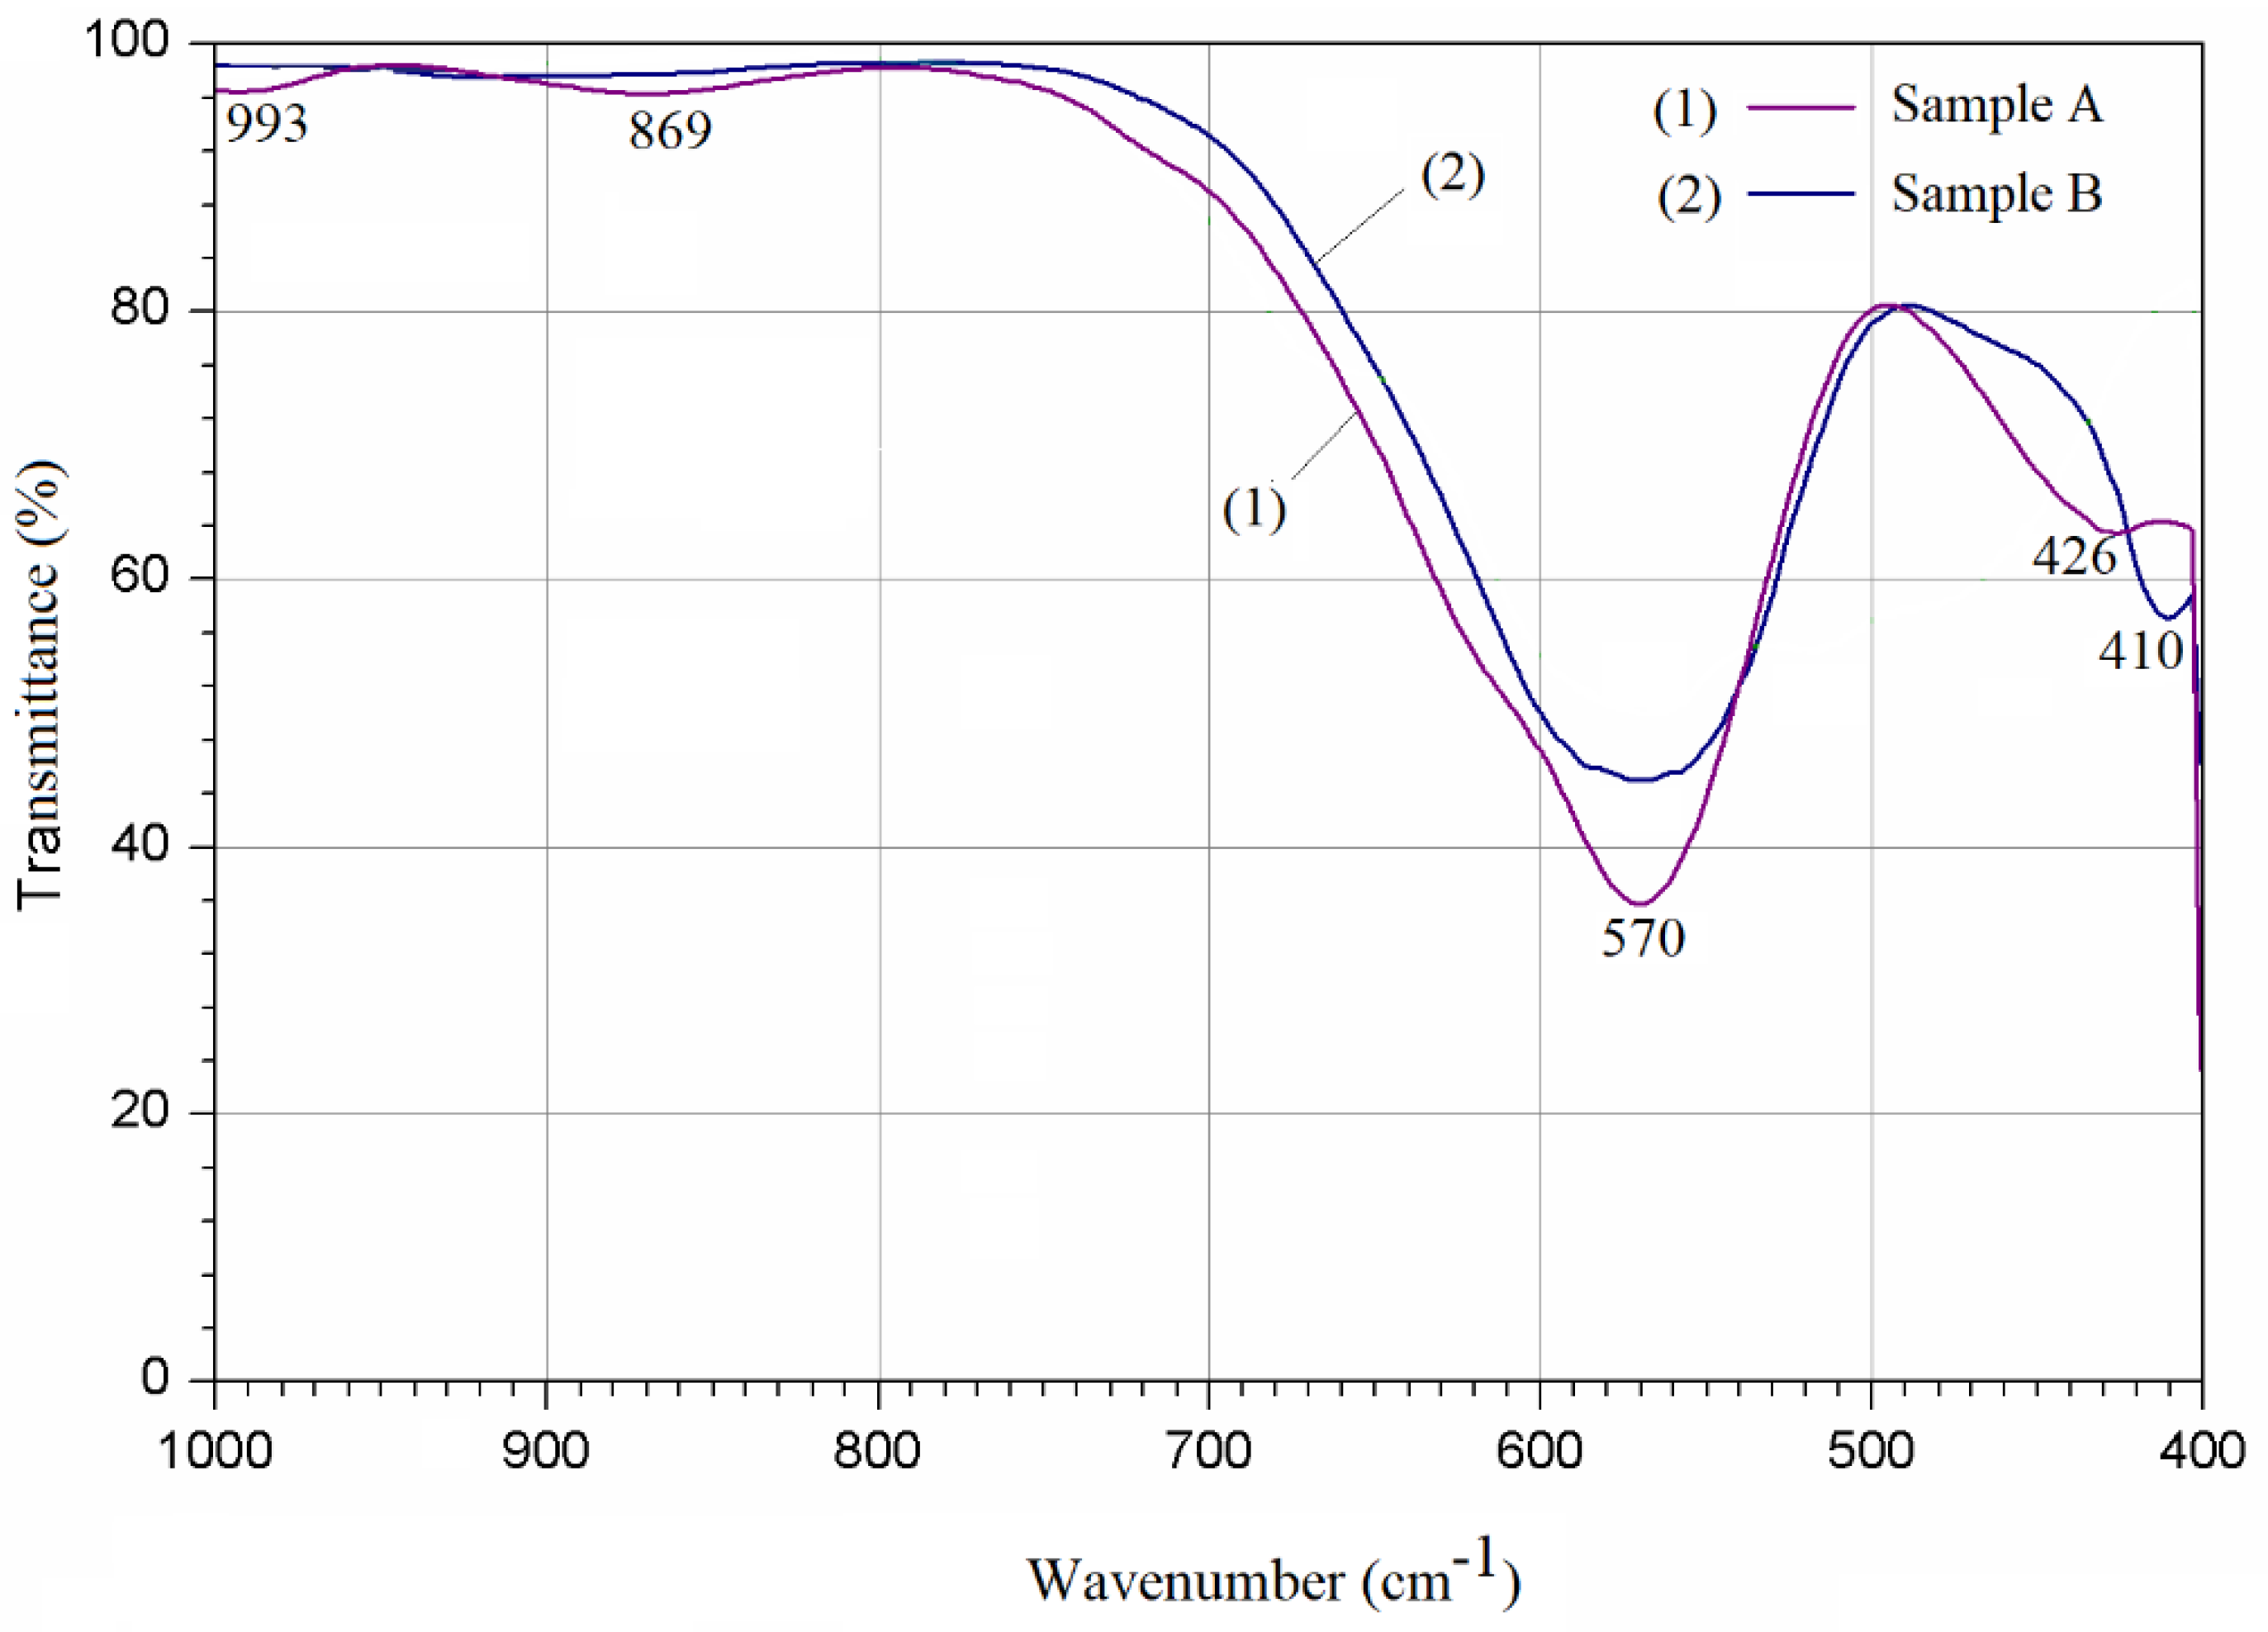
The FTIR spectra of the prepared samples A and B are shown in Figure 2.
From Figure 2, it can be seen that the FTIR absorption spectrum of sample A (MnFe2O4) shows a main absorption band υ1 centered around the value of 570 cm−1, attributed to the stretching vibrations of the tetrahedral group, and a second absorption band υ2 centered around the value of 426 cm−1, attributed to the octahedral group [27]. The two absorption bands indicate the formation of the metal–oxygen bond (M–O) both in the tetrahedral (M–O bond)A and octahedral (M–O bond)B sites in the spinel structure, confirming the result obtained by X-ray diffraction for these samples (Figure 1), in which only one phase appears. From Figure 2, it can also be observed that, for the zinc concentration x = 0.4 in the MnFe2O4 structure (sample B), the spectrum shows the two characteristic absorption bands but with a decrease in the main absorption band, thus indicating the formation of the spinel phase [28].

3.3. Scanning Electron Microscopy

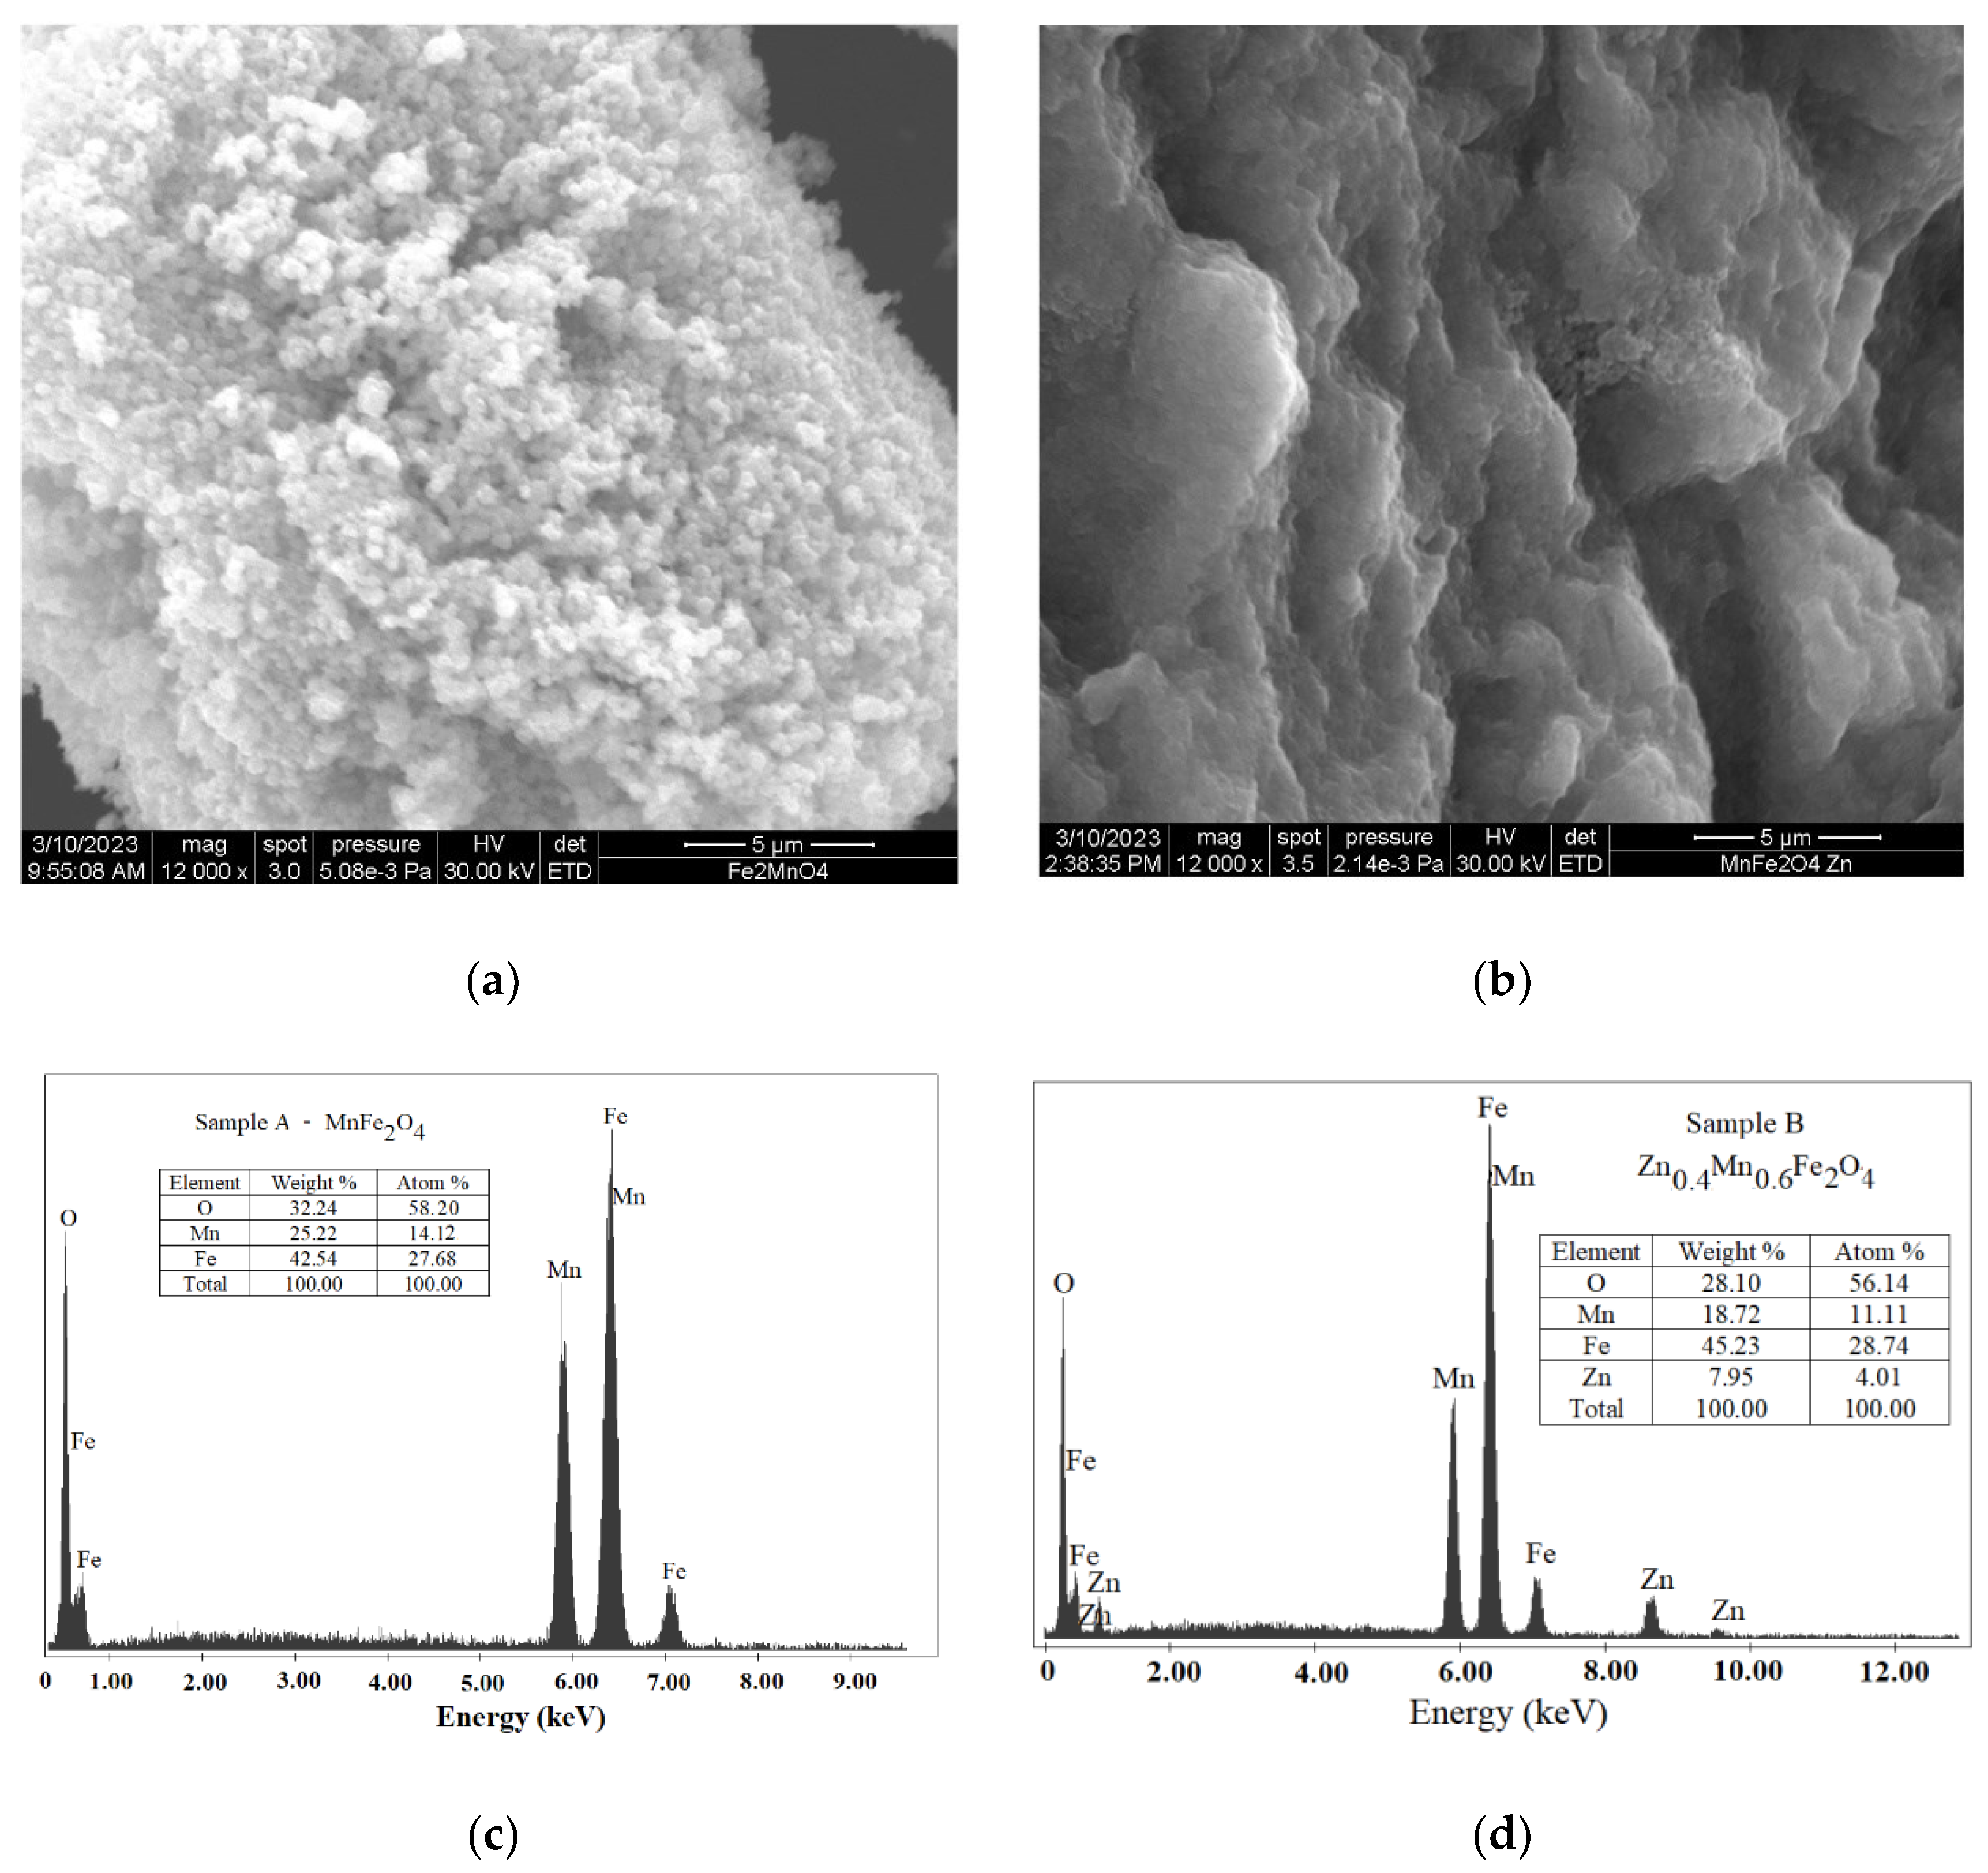
The SEM images and the result of the EDX elemental analysis of the synthesized materials, ZnxMn1−xFe2O4 (with x = 0 and 0.4), are shown in Figure 3.
From Figure 3a,b, one can observe the existence of agglomerated particles of various sizes in the synthesized samples and an increase in agglomeration in the case of manganese ferrites doped with Zn. On the other hand, as shown in Figure 3c,d, the results of EDX (which is a semi-quantitative analysis) confirm the presence of Fe, Mn, Zn, and O elements in the samples, as well as the phase purity of the obtained materials.

3.4. Magnetic Properties

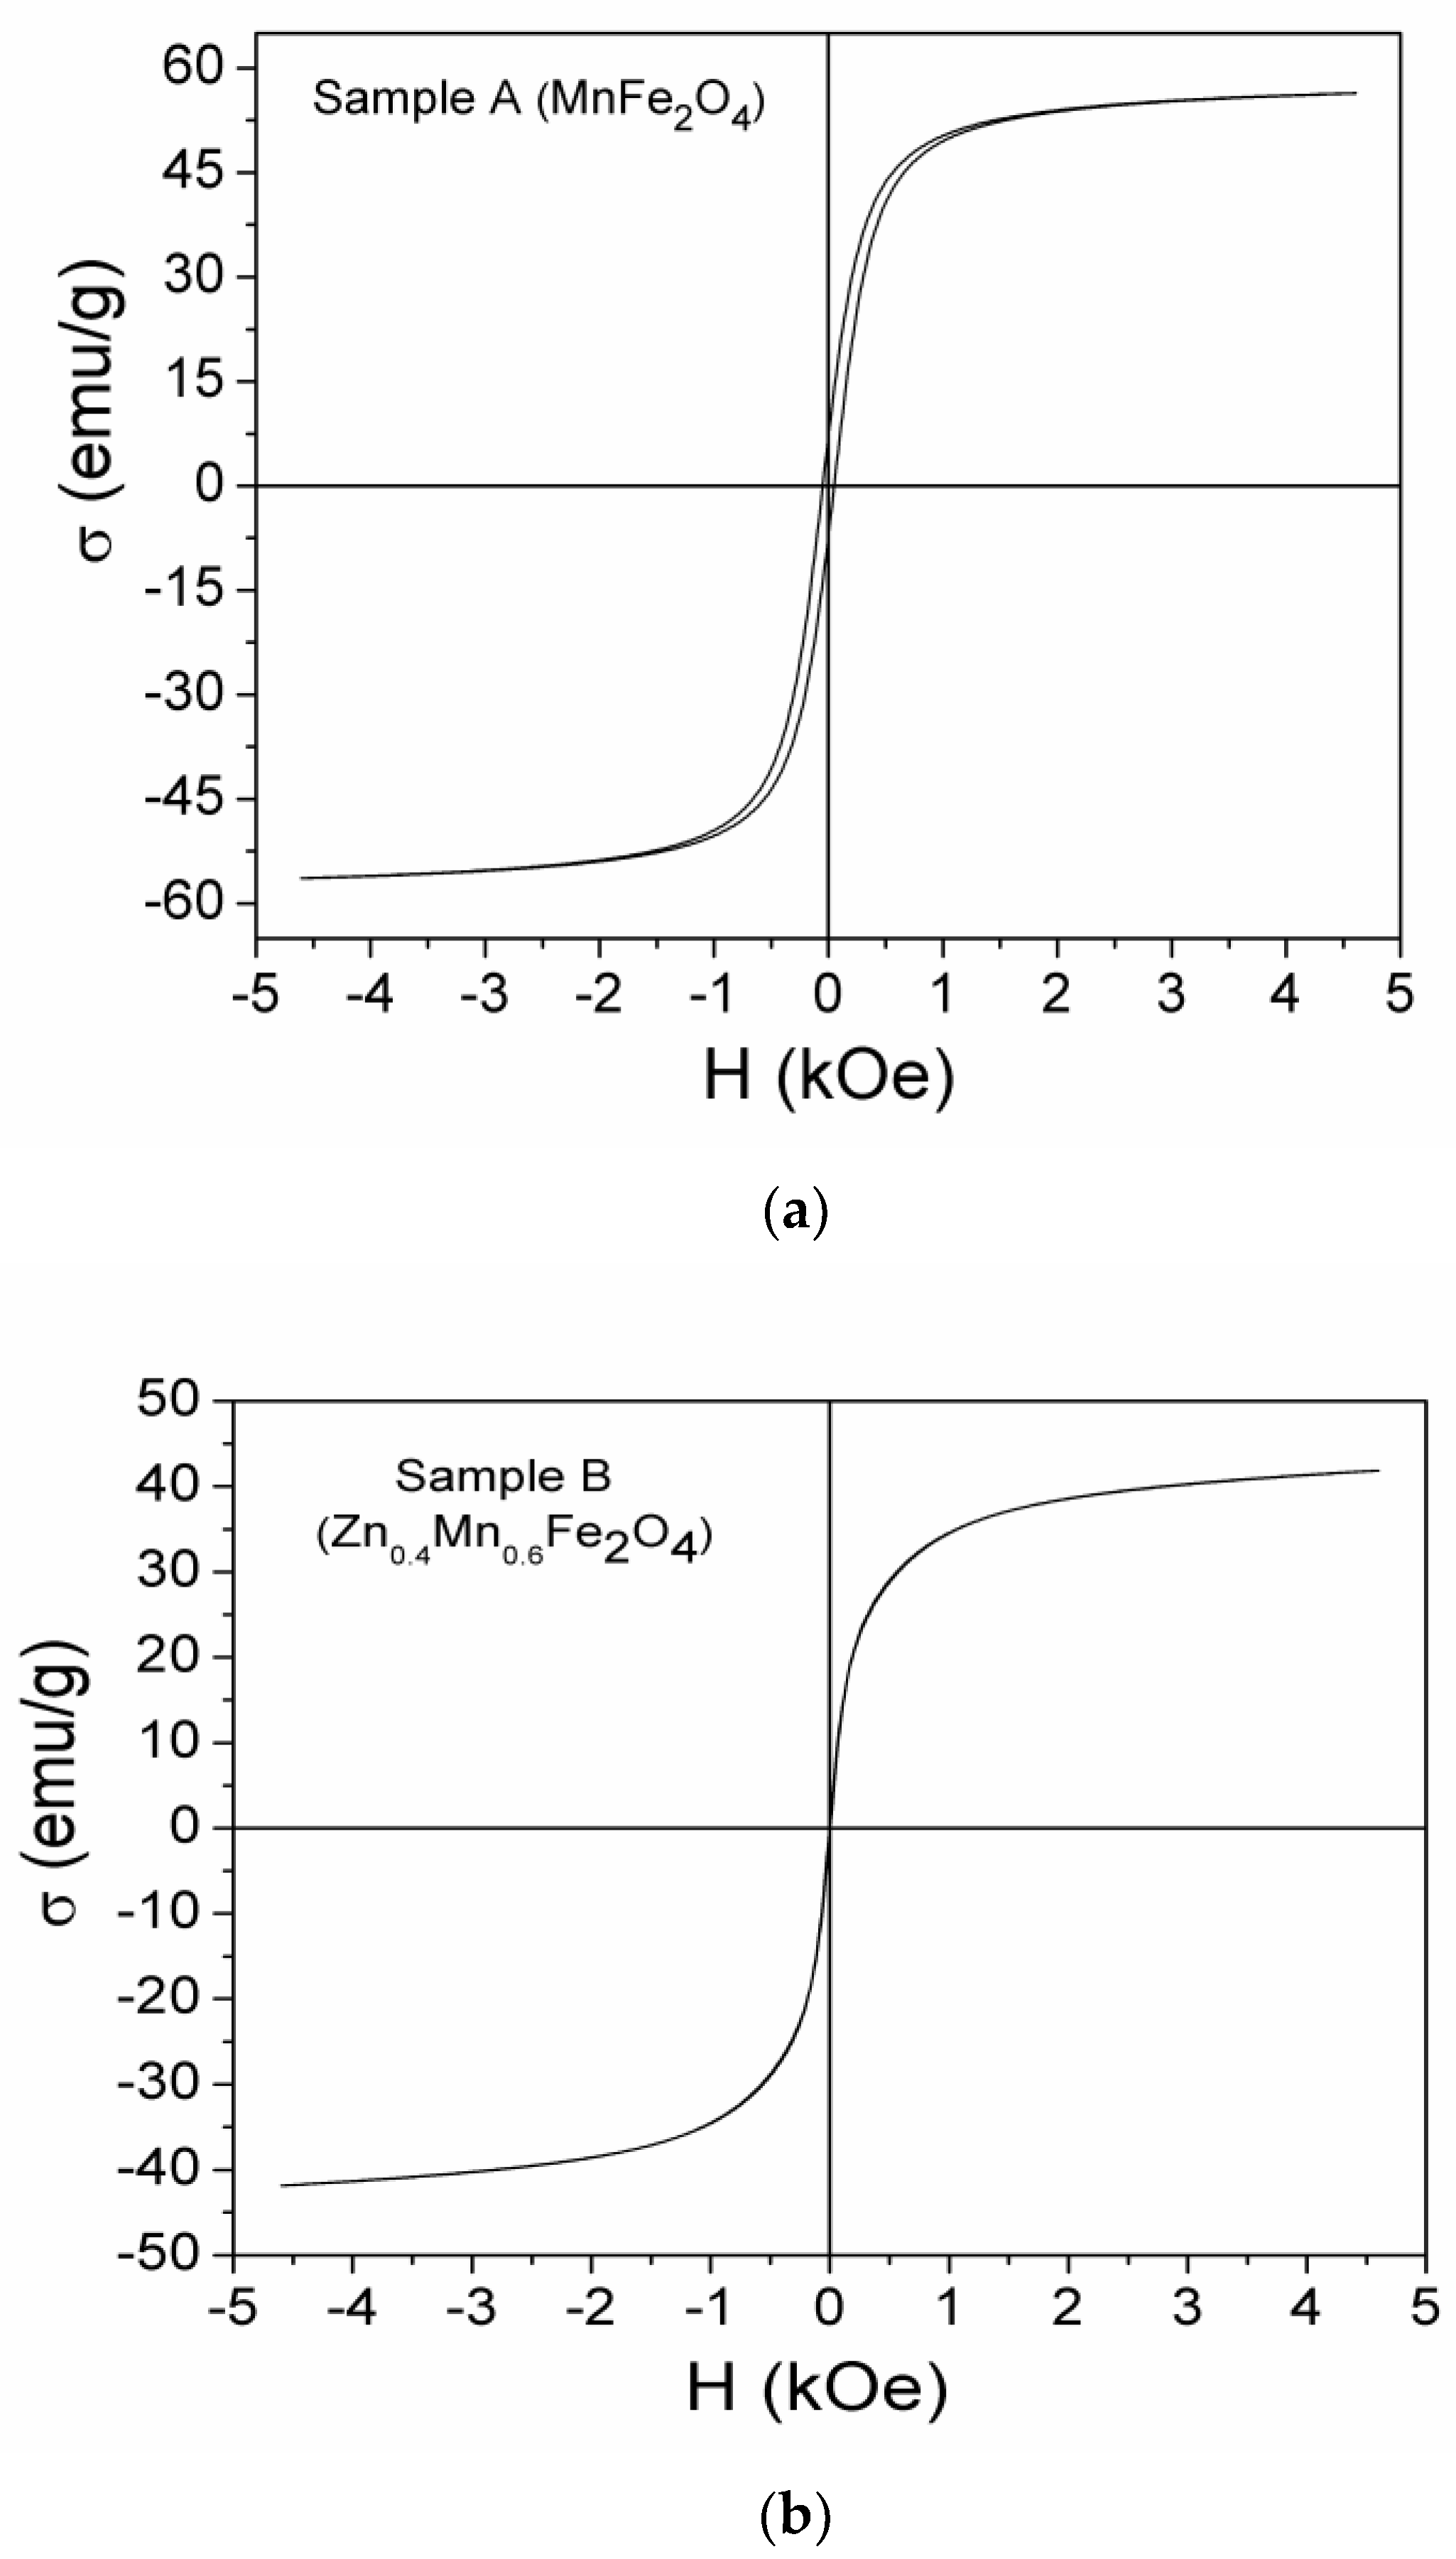
Figure 4 shows the specific magnetization curves of the prepared ZnxMn1−xFe2O4 (with x = 0 and 0.4) ferrite samples. The curve in Figure 4a, corresponding to manganese ferrite sample A, MnFe2O4 (with x = 0), reveals a narrow hysteresis behavior, thus indicating the soft ferrimagnetic nature of the material. The curves in Figure 4b, corresponding to sample B, Zn0.4Mn0.6Fe2O4 (with x = 0.4), show that, by introducing Zn into manganese ferrite, the variation in magnetization with the applied magnetic field has the typical characteristics of a superparamagnetic behavior, such as the absence of hysteresis, coercivity, and zero remanence, as other authors also obtained [26,29,30] for samples of the same kind.
Using the magnetic measurements from Figure 4, the following magnetic parameters of the samples were determined: saturation magnetization (σS), coercive field (Hc), remanent magnetization (σr), and the corresponding remnant ratio (σrS). The obtained values are listed in Table 2.
From Table 2, it can be observed that the saturation magnetization of sample A of manganese ferrite is 58.76 emu/g, being lower than that of bulk manganese ferrite (80 emu/g) [31]. Also, the low value of the remnant ratio σrs of the sample A (see Table 2) represents an indication of the ease with which the magnetization direction reorients towards the direction of the easy-magnetization axis after the removal of the magnetic field, which shows the materials which can be used in biomedical applications or as absorbent materials [32]. At the same time, from Table 2, it can be observed that the saturation magnetization of sample B (Zn0.4Mn0.6Fe2O4), having a superparamagnetic behavior, is 44.21 emu/g. The explanation of the decrease in the σs value of sample B by doping MnFe2O4 ferrite with Zn2+ ions can be attributed to the decrease in size of the particles due to the cationic stoichiometry and the occupation of specific sites by ions [33,34].

3.5. Electrical and Dielectric Properties

3.5.1. Complex Impedance

The complex impedance Z is given by the following equation:
Z = Z′ − iZ″
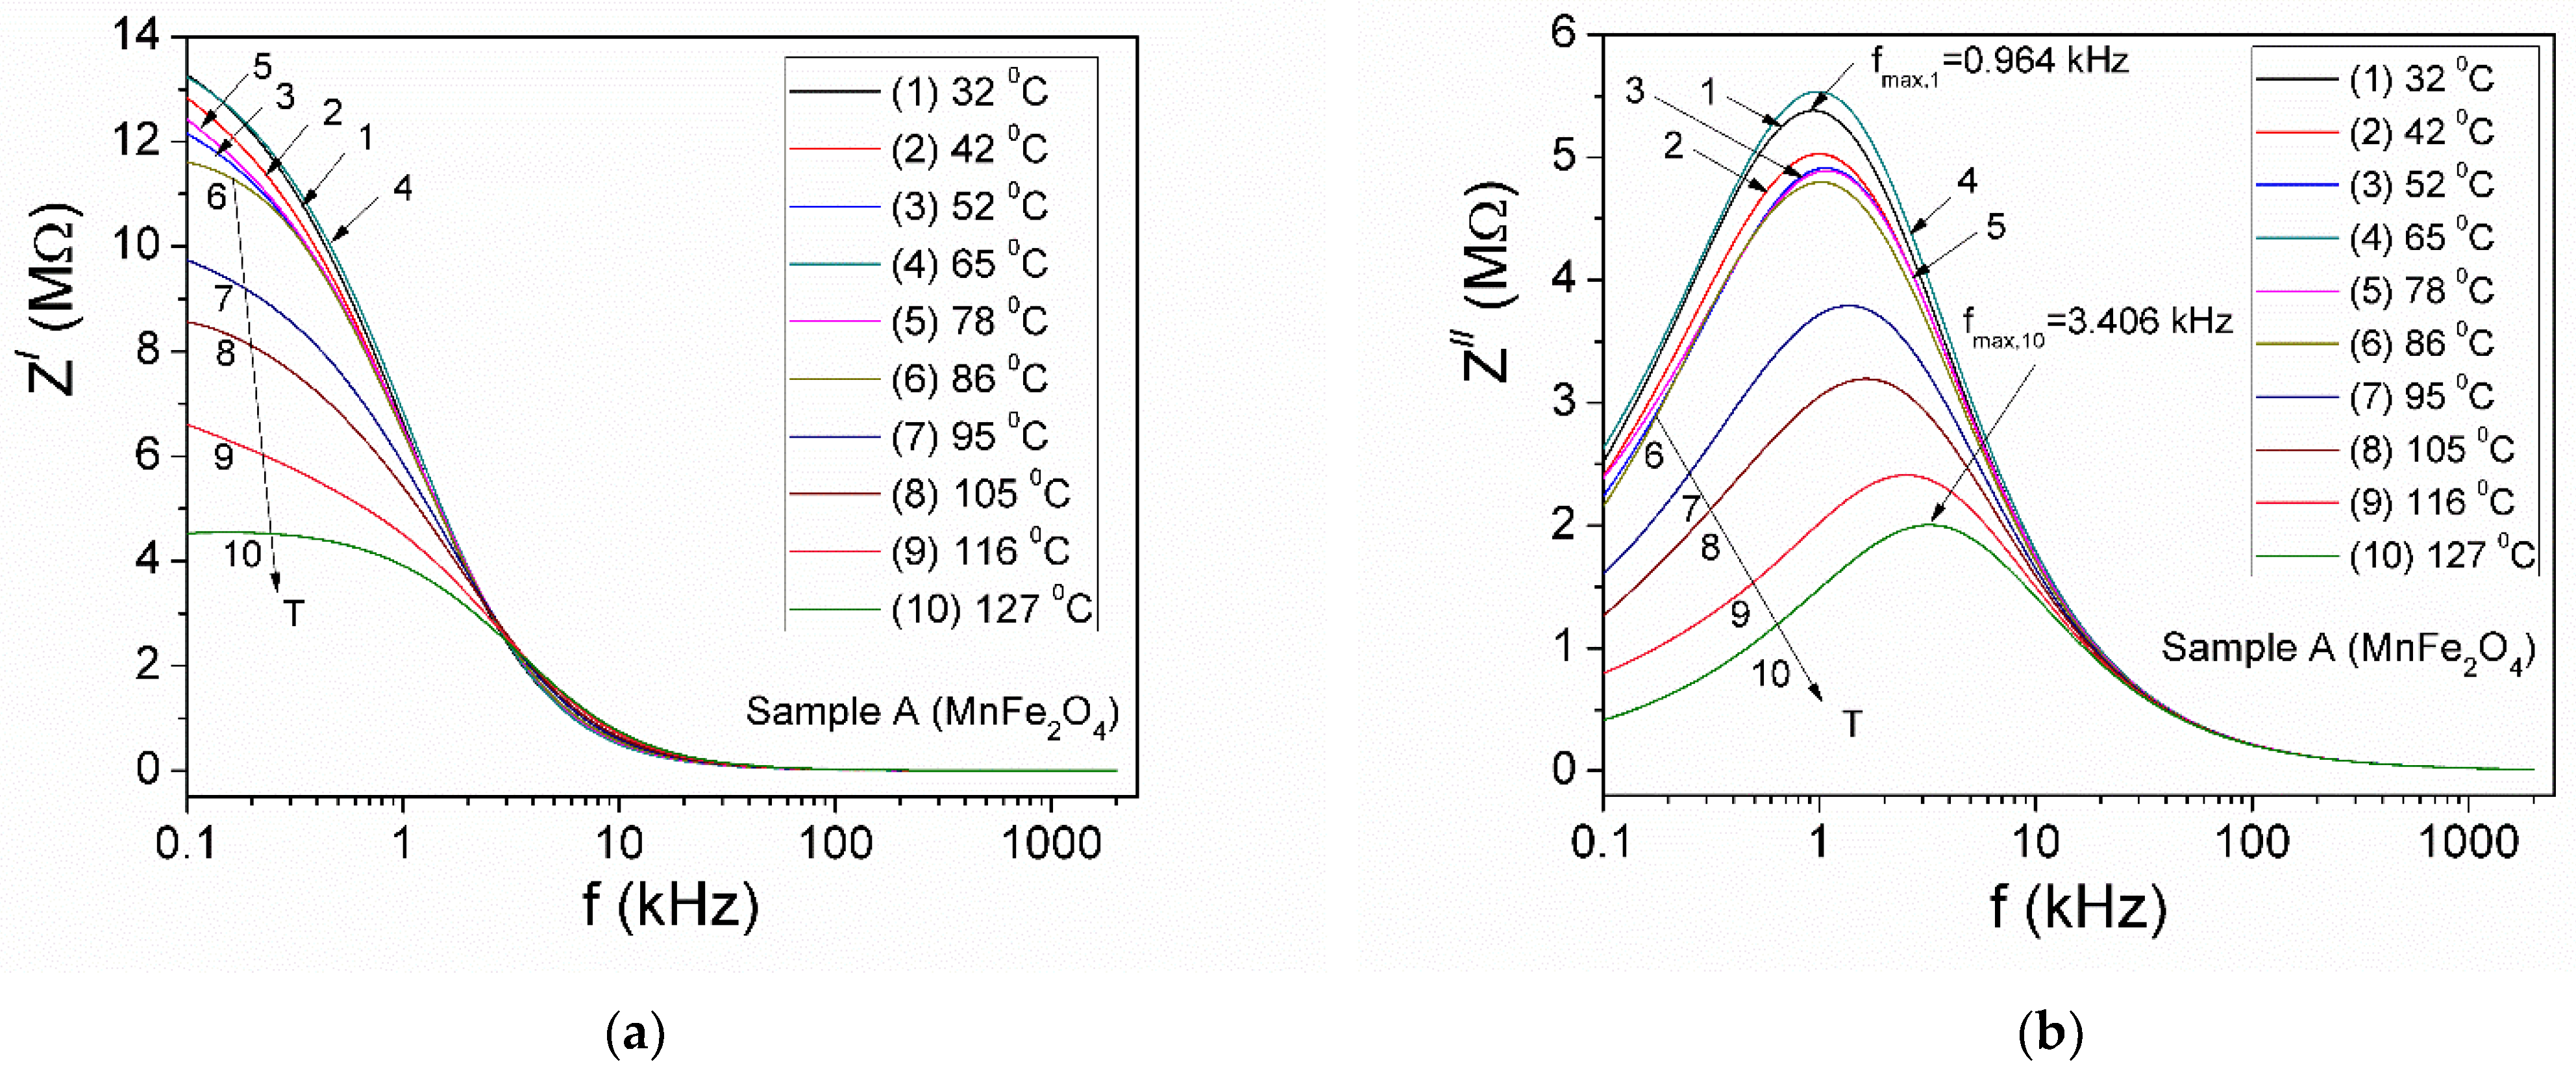
where Z′ and Z″ are the real and imaginary parts of the complex impedance. Figure 5a–d show the frequency dependence of the Z′ and Z″ components in the range 0.1 kHz–2 MHz at different temperatures, between 30 and 130 °C, for the investigated samples.
As it can be seen from Figure 5, the amplitude of the Z′ component decreases with increasing temperature for sample A of manganese ferrite throughout the temperature range (Figure 5a), while, for sample B of Mn-Zn ferrite, the amplitude of Z′ decreases with temperature, up to approximately 78 °C (Figure 5c), after which Z′ increases by increasing the temperature to 128 °C. Also, it is noted that, at a constant temperature T, the real part Z′ of the impedance for sample A (Figure 5a) decreases rapidly up to the frequency f = 4 kHz and then decreases slowly with the increase in frequency to f = 100 kHz. For sample B (Figure 5c), at a constant temperature T, the Z′ component remains approximately constant up to a frequency of approximately 3 kHz, after which it decreases rapidly with increasing frequency up to 20 kHz and then decreases slowly with the increase in frequency up to f = 100 kHz. Next, above 100 kHz, for both samples, in the third region, between 100 kHz and 2 MHz), the Z′ components overlap for all the temperatures. Such an evolution with the temperature of the real component Z′ shows the semiconductor behavior of sample A over the entire temperature range and up to approximately 78 °C for sample B [35]. This result is in accordance with the structural studies obtained by Hajlaoui et al. [36], which show that increasing the temperature induces the hopping of Fe2+ ions towards the tetrahedral sites, where the reduction in Zn ions takes place. As a result, there is a decrease in the electron hopping barrier’s height by increasing the temperature, which causes an increase in the electrical conductivity and, therefore, a decrease in the real component Z′ of the complex impedance, as was also obtained experimentally.
From Figure 5, it can be seen that the amplitude of the Z″ component of the complex impedance decreases with increasing temperature for sample A throughout the temperature range (Figure 5b). For sample B, the amplitude of Z″ decreases with temperature, up to approximately 60–70 °C (Figure 5d), after which Z″ increases by increasing the temperature to 128 °C. Also, the Z″ component presents a maximum at a frequency fmax for all the samples and at all the investigated temperatures. For sample A of manganese ferrite, MnFe2O4, the fmax frequency moves to lower values by increasing the temperature. In the case of sample B of Mn-Zn ferrite, Zn0.4Mn0.6Fe2O4, fmax moves towards lower values when the temperature increases up to 60 °C, after which, as the temperature continues to increase up to 128 °C, fmax moves towards higher values. This behavior of Z″ shows the existence of an electrical relaxation process [37], which is due to the presence of charge carriers in the investigated samples [19,20], being determined by the hopping of these charge carriers between localized states, in compliance with the VRH of the Mott and Davis model [19]. On the other hand, from Figure 5b,d, it can be seen that the relaxation processes take place at frequencies between 7 kHz and 30 kHz for sample B, while, in the case of sample A, relaxation processes are present at lower frequencies, located in the range 1–4 kHz. This experimental result can be correlated with the fact that, by introducing Zn ions into the manganese sample, there is a decrease in the characteristic time of the hopping of charge carriers over the energy barrier.
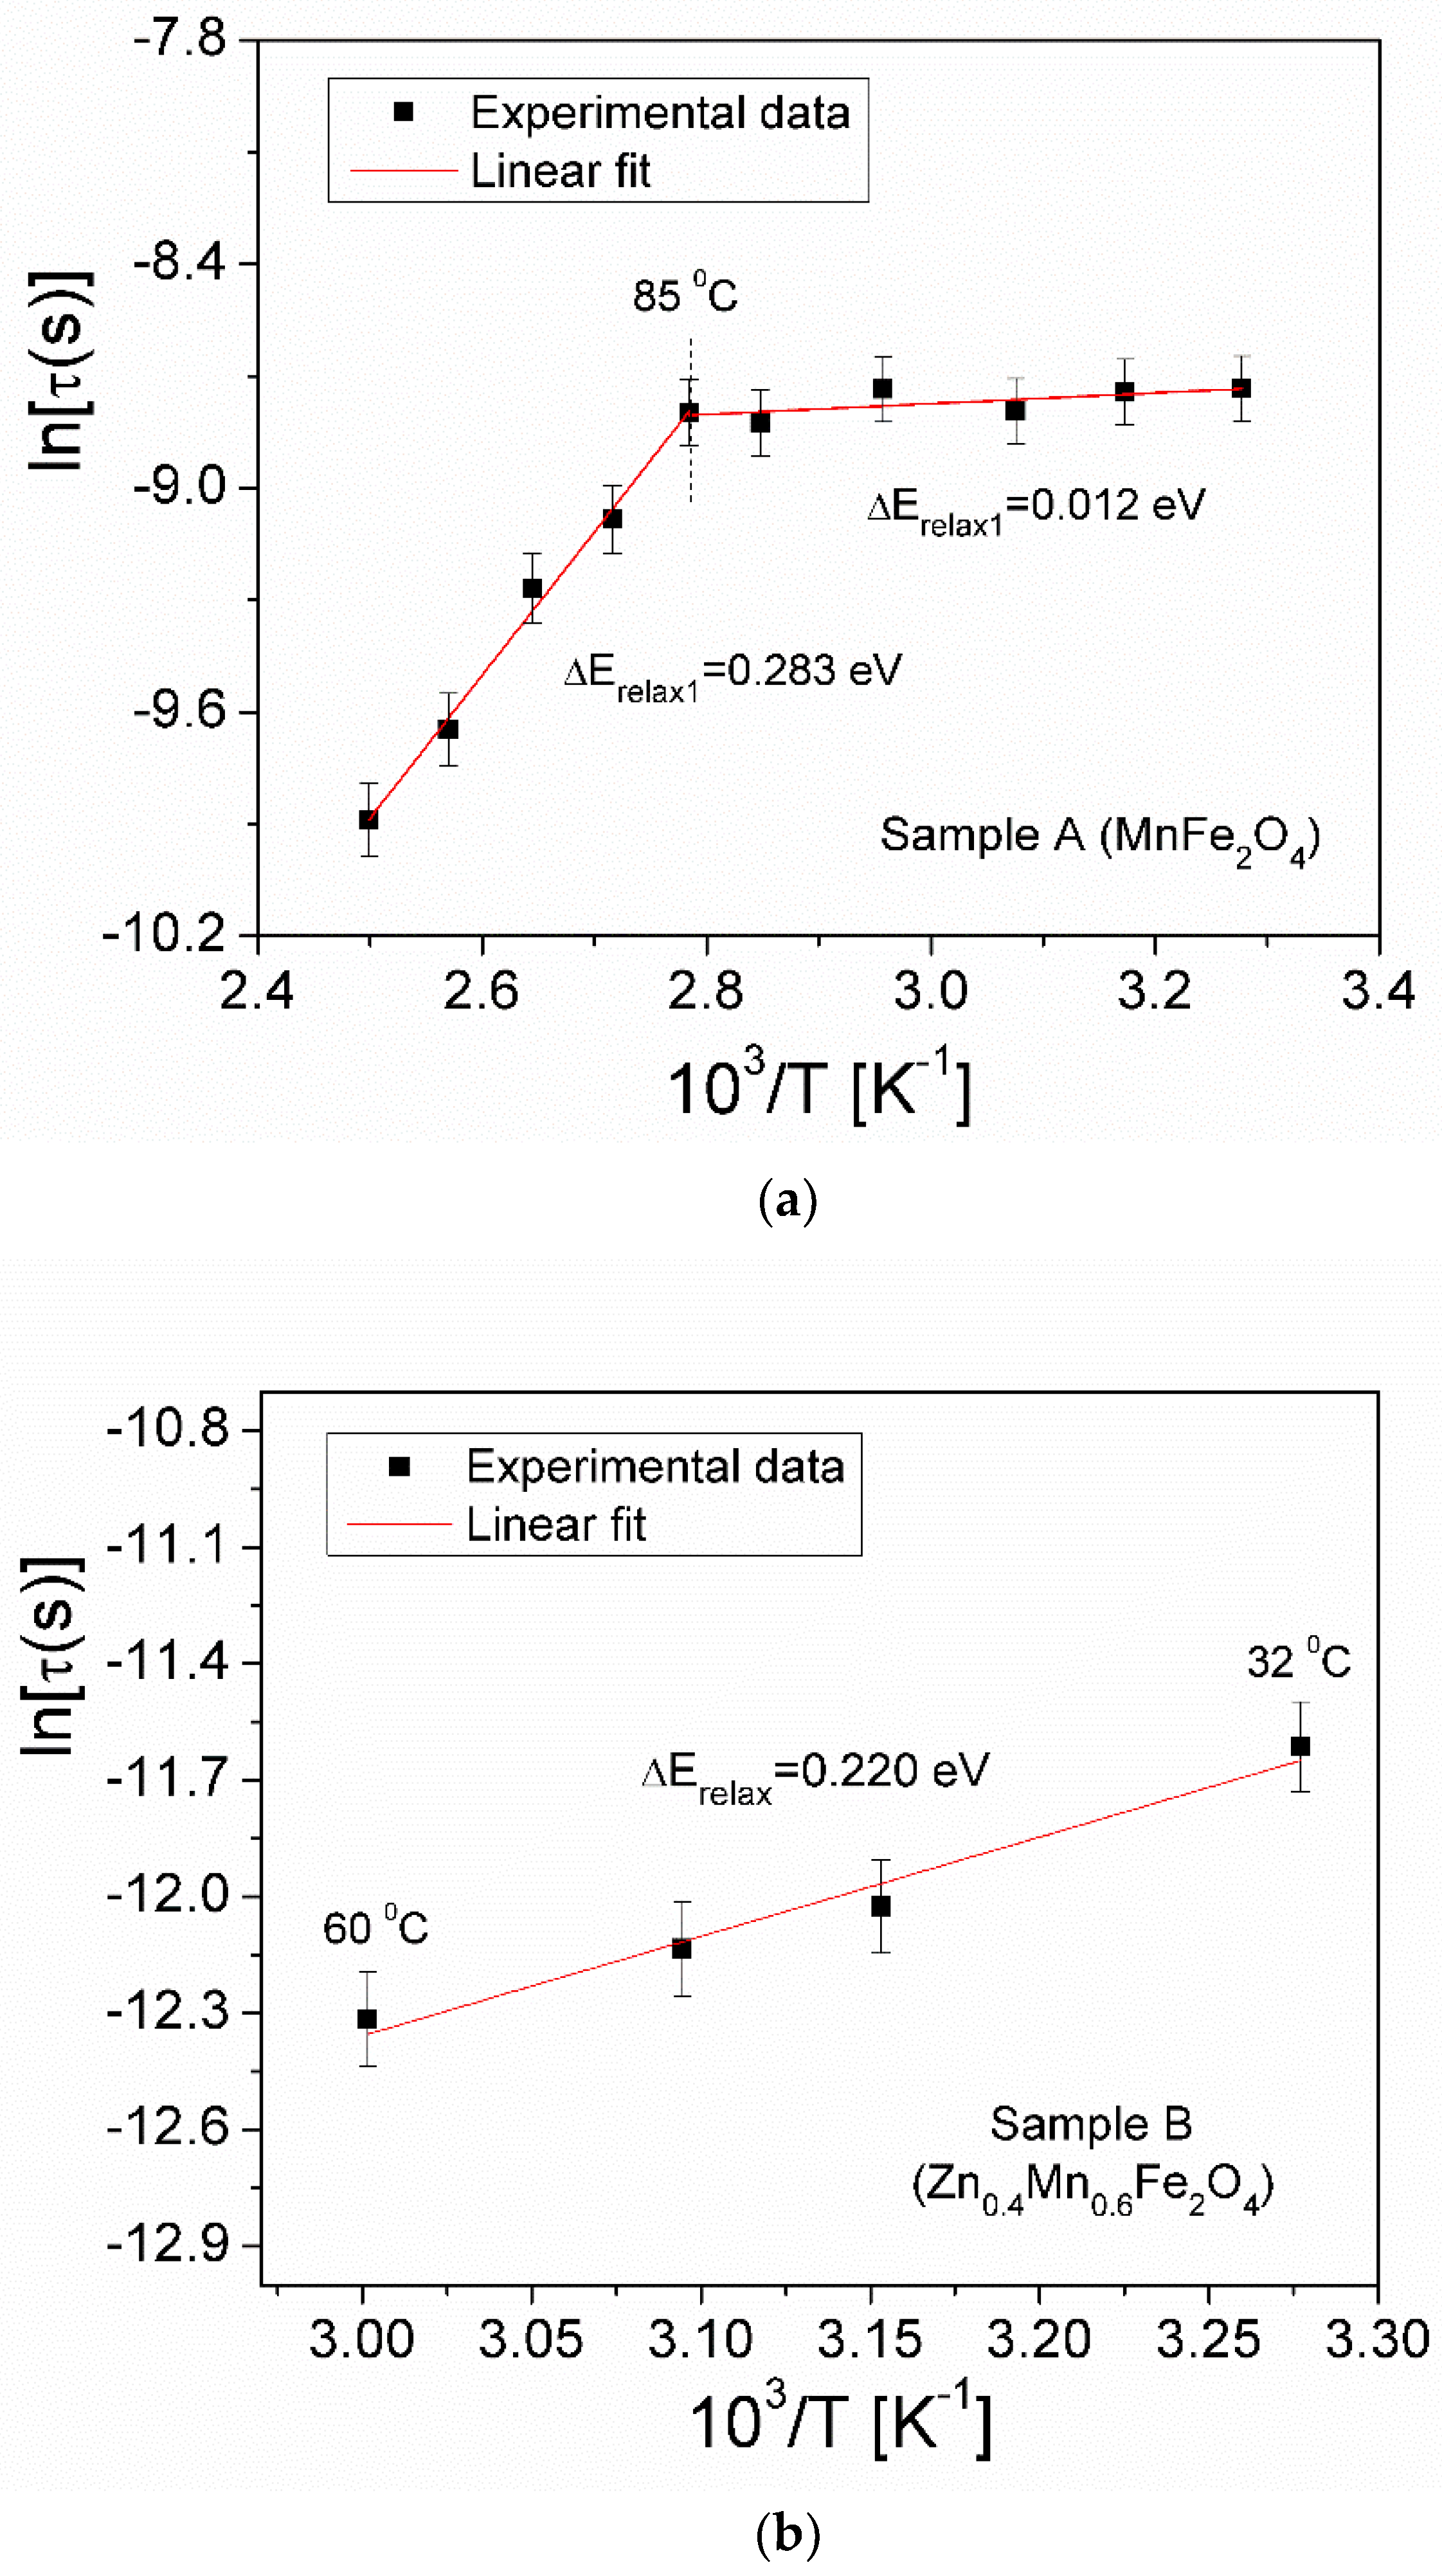
Taking into account the values obtained for fmax from Figure 5b,d, we determined the relaxation times (τ) corresponding to each temperature T for the two investigated samples using the Debye equation, 2πfmaxτ = 1 [38]. Considering that the relaxation time τ depends in an inversely proportional way on the fmax frequency, the results show that, in the case of sample A (manganese ferrite MnFe2O4), the relaxation time decreases with temperature both at the beginning of the interval between 32 and 65 °C and at raised temperatures between 86 and 127 °C (see Figure 5b). In the case of sample B (manganese ferrite doped with Zn ions), the decrease in relaxation time occurs only at the beginning of the temperature range between 32 and 70 °C, after which an increase in τ with temperature is observed (see Figure 5d). The decrease in the relaxation time in the mentioned temperature ranges, specific to the semiconductor-type behavior of the samples, is in agreement with an Arrhenius-type law:
τ = τ 0 exp ( Δ E r e l a x k T )
where k is the Boltzmann constant; τ0 represents the pre-exponential factor of the relaxation time; and ΔErelax is the activation energy or the barrier energy between the localized states [39]. Figure 6a,b present the plot of dependence ln(τ) on (1000/T) for both samples. The measurement error of ln(τ) is approximately 0.8%, and it is represented in Figure 6a,b with error bars. The linear fit of the curve from Figure 6a corresponding to sample A (MnFe2O4) gives two different slopes, corresponding to the two temperature ranges (below 85 °C and above 85 °C), and the fit of the curve from Figure 6b corresponding to sample B (Zn0.4Mn0.6Fe2O4) gives one slope. The curves from Figure 6a,b are fitted with a straight line with equation y = a + bx, where a is the intercept, and b is the slope of the line. For sample A, the fitting parameters are the following: intercept a = −9.20718 and slope b = 144.31527 (for the temperature range below 85 °C) and intercept a = −19.46419 and slope b = 3831.96782 (for the temperature range above 85 °C). For sample B, the fitting parameters are the following: intercept a = −20.07357 and slope b = 2571.78693. Therefore, for sample A, two activation energy values (0.012 eV and 0.283 eV) associated with two areas of different conductivities are obtained, and, for sample B, a value equal to 0.221 eV is obtained. Similar values in terms of the activation energy have also been obtained by other authors for the same type of ferrites [29,40]. Materials similar to sample A, which have two different conduction regimes (with two different thermal activation energies of conduction), can be used in the creation of sensors in which temperature change is involved.

3.5.2. Electrical Conductivity

The investigated sample was inserted into a glass cylindrical tube having a diameter D = 3.8 mm and, therefore, a cross section area A = 11.34 mm2. The sample in the glass tube had a thickness of d = 4 mm and was in contact with two electrodes, which allowed its connection to the LCR meter [24,25]. At the same time, the glass tube with the sample was placed in an electric oven, thermally insulated and heated by an electric resistance connected to a voltage source, with the temperature T being measured with a thermocouple. The real Z′ and imaginary Z″ components of the complex impedance were measured, for each temperature T.
The electrical conductivity can be determined from the measurements of the Z′ and Z″ components of complex impedance (Figure 5), using the following equation:
σ = Z Z 2 + Z 2 ( d A )
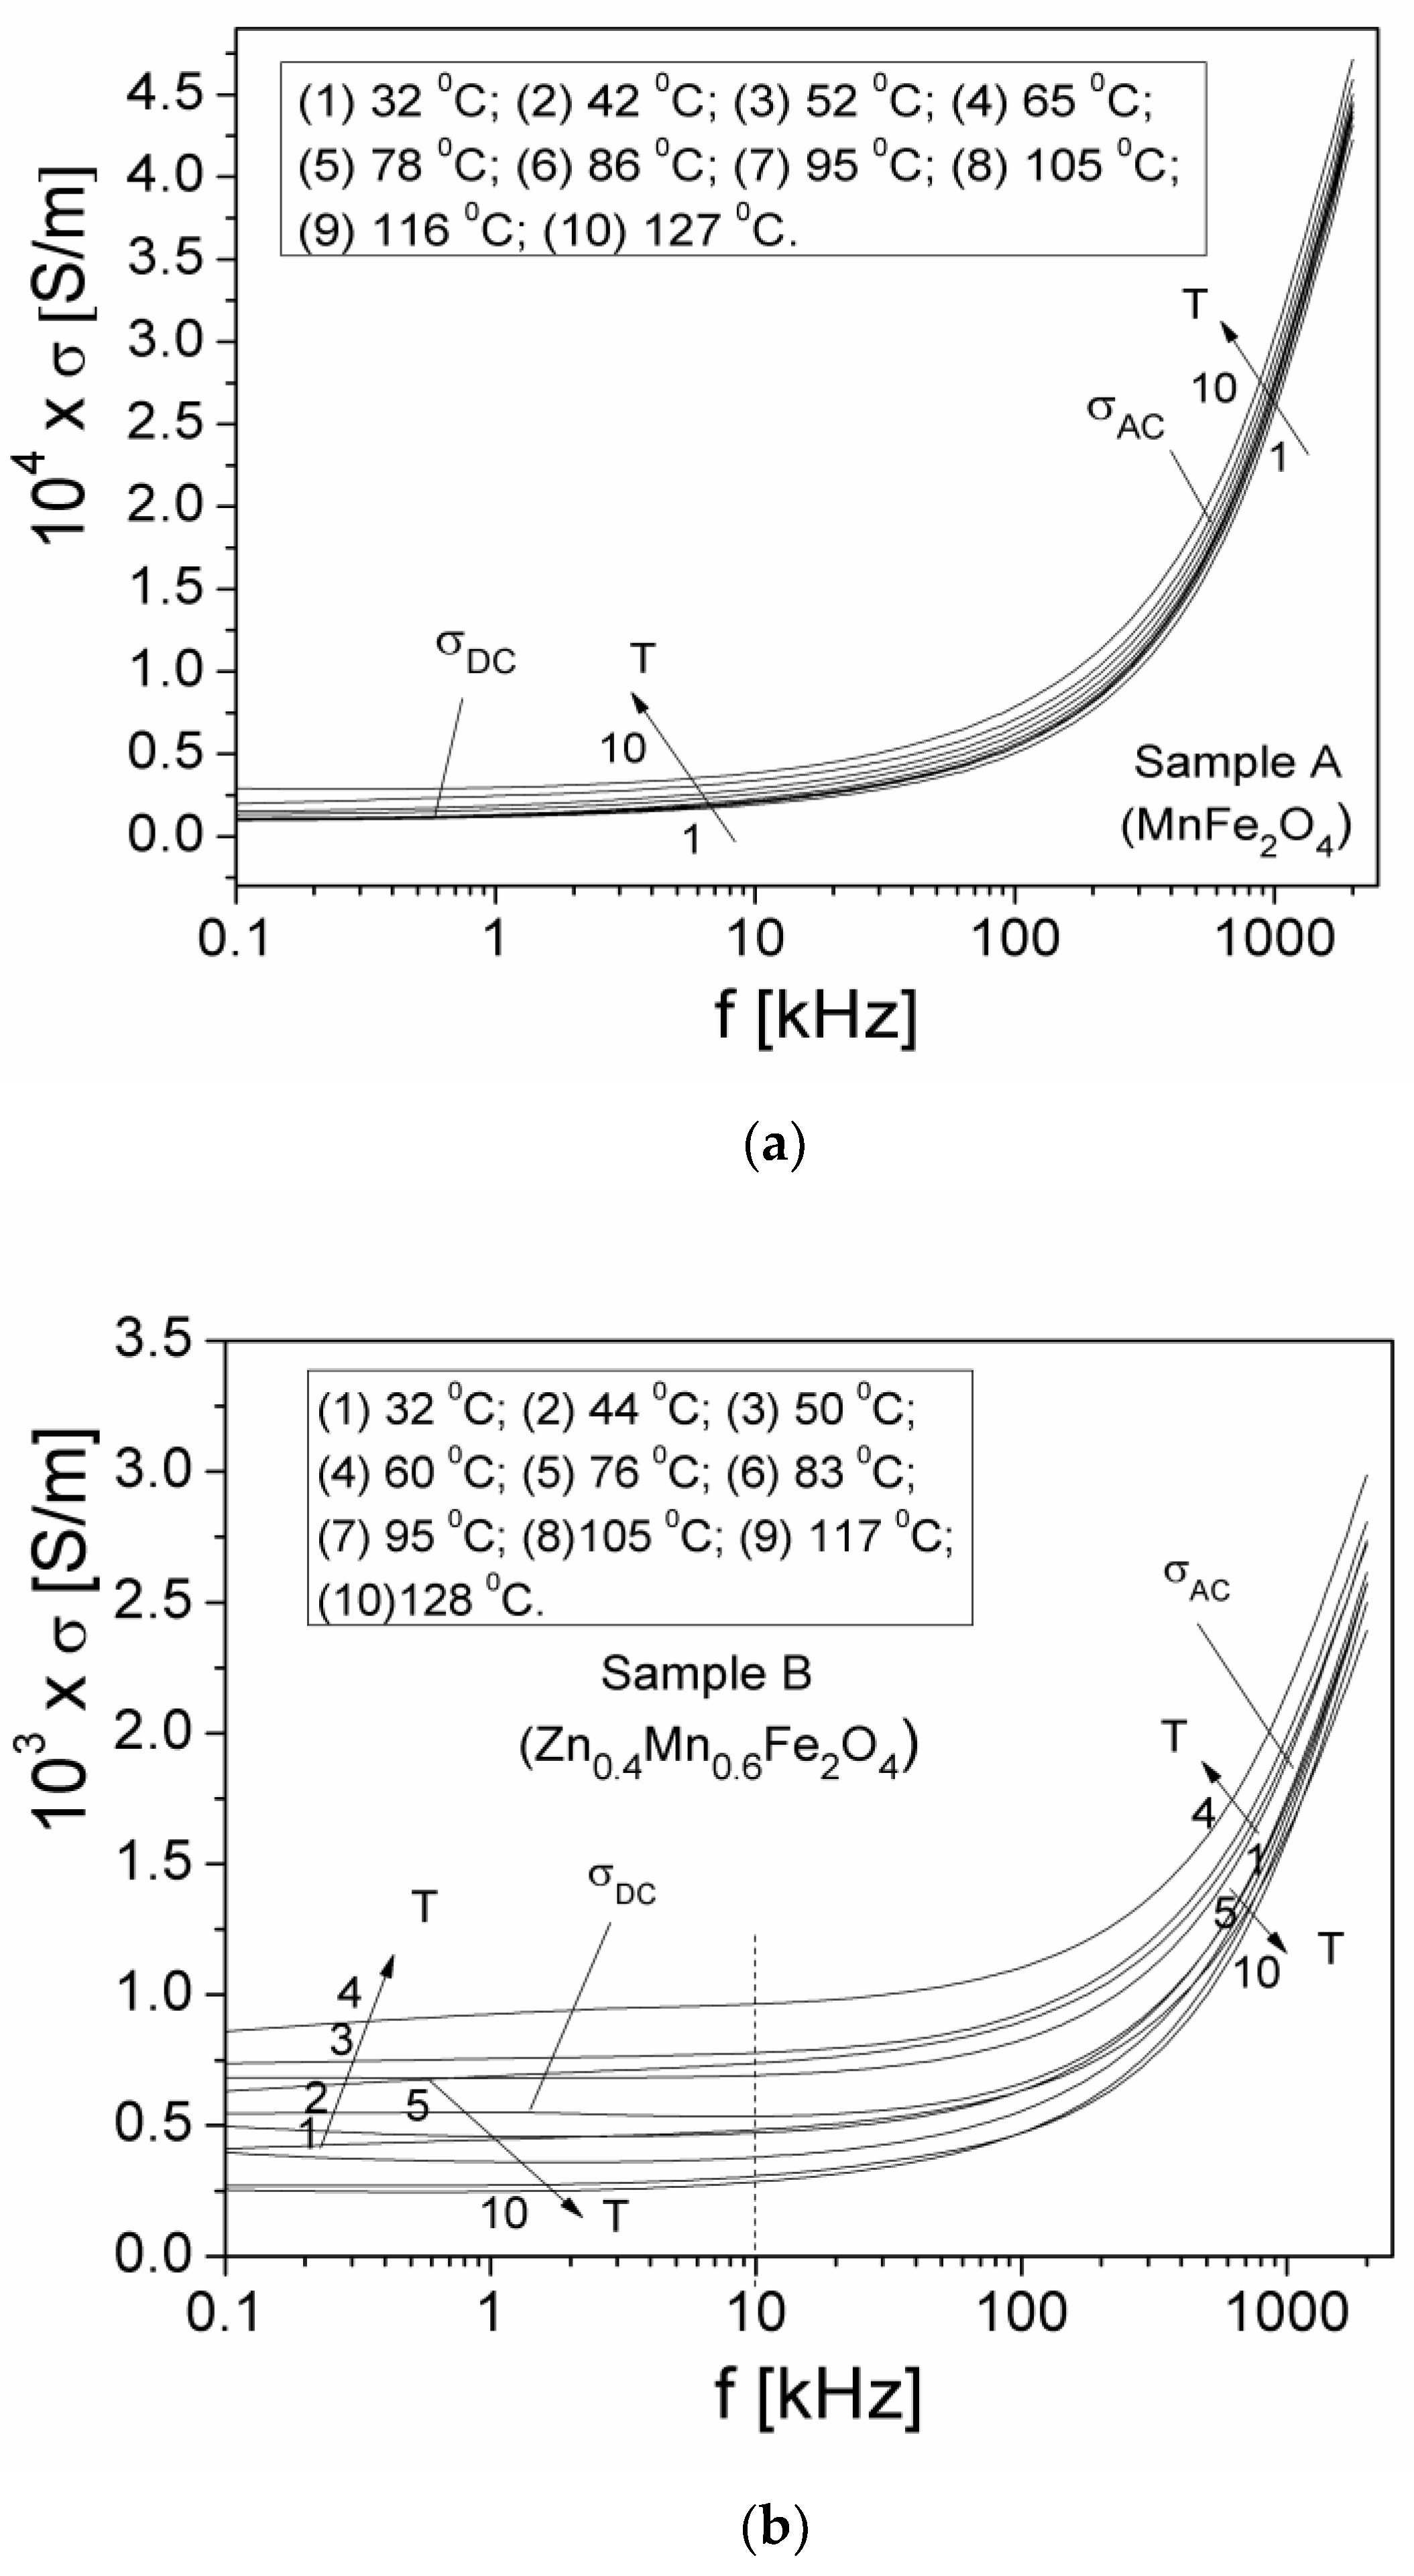
In Figure 7, the frequency and temperature dependencies of the conductivity σ of the samples in the 100 Hz to 2 MHz range and at different temperatures between 30 °C and 130 °C are shown.
From Figure 7, it can be seen that, in the case of both samples, for each temperature T, the conductivity σ remains constant at a low frequency, until it nears the frequency of 10 kHz, at which point it increases sharply with increasing frequencies, being in agreement with Jonscher’s universal law [41]. The conductivity spectrum σ(f,T) in Figure 7 can be divided into two regions: (i) a linear region at low frequencies, corresponding to static conductivity σDC independent of frequency but dependent on temperature; and (ii) a dispersion region at high frequencies, corresponding to the dynamic conductivity σAC dependent on both frequency and temperature. From Figure 7a, it can be observed that, in the case of sample A (manganese ferrite MnFe2O4), the static conductivity σDC increases with temperature over the entire temperature range. In the case of sample B (manganese ferrite doped with Zn ions), the static conductivity σDC increases only at the beginning of the temperature range between 32 and 70 °C, after which a decrease in σDC with temperature is observed between 76 and 128 °C (see Figure 7b).
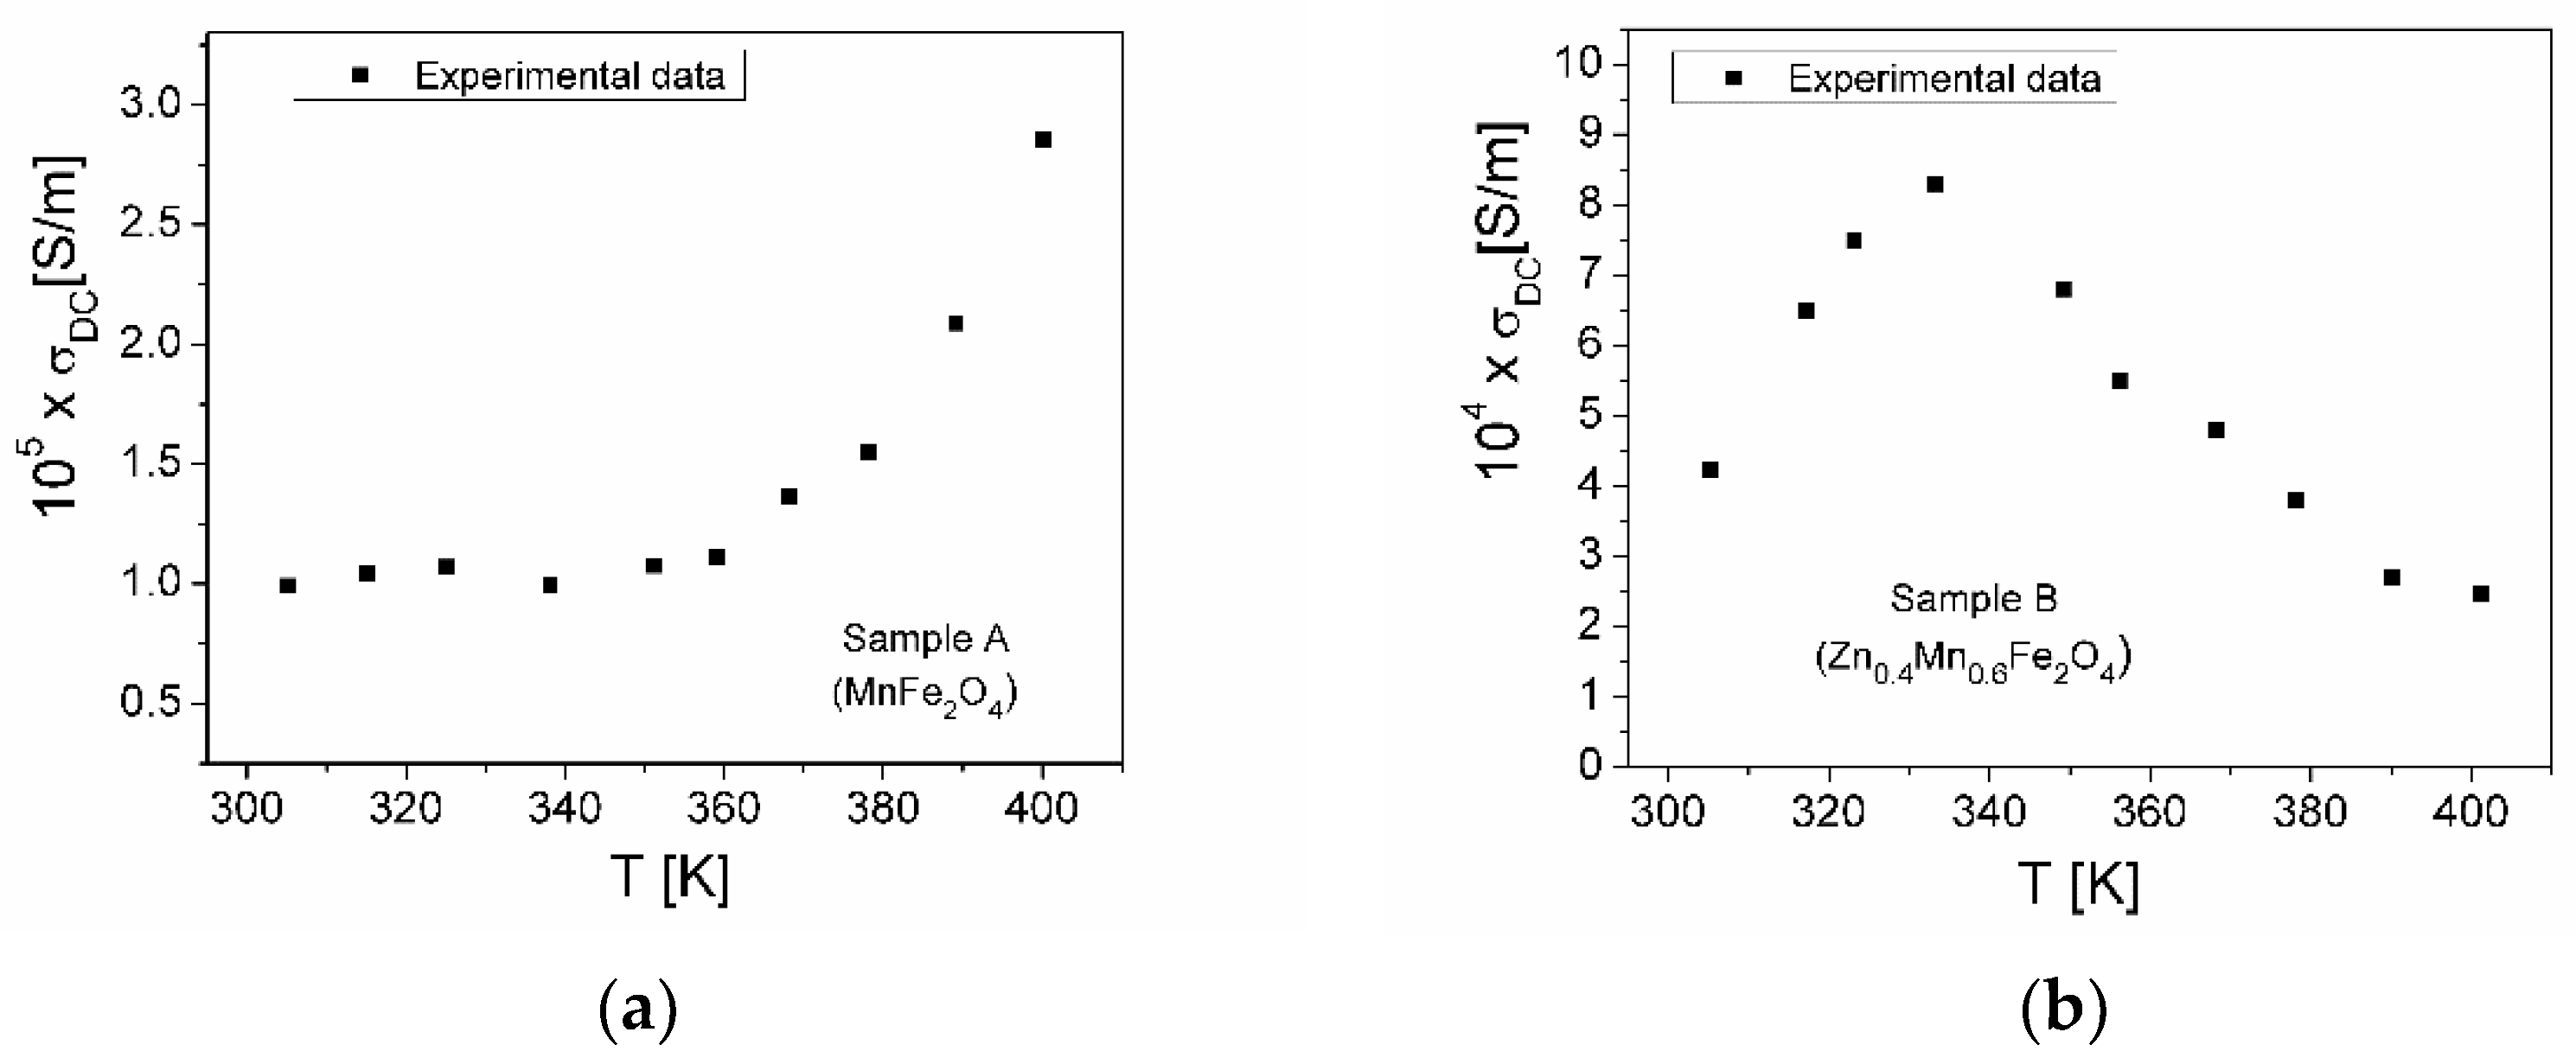
Figure 8 shows the temperature dependence of the static conductivity σDC(T) for the two investigated samples.
From Figure 8a, it can be seen that, in the case of sample A (MnFe2O4), the σDC(T) component increases slightly when the temperature increases from 30 °C to approximately 70 °C, after which the increase is more pronounced at temperatures between 70 °C and 127 °C, indicating that the conduction process is thermally activated over the two temperature ranges, as in Ref. [13]. At the same time, the increase in conductivity σDC with temperature is due to the increase in the drift mobility of the charge carriers, according to Mott’s VRH (variable range hopping) conduction mechanism [19].
In the case of sample B (Zn0.4Mn0.6Fe2O4), the conductivity σDC(T) increases when the temperature increases from 30 °C to about 60 °C (Figure 8b) and then decreases with increasing temperatures from 60 °C to 128 °C. Thus, unlike the results published in Ref. [13], we highlighted that, around the temperature of 60 °C, there is a transition from a semiconductor behavior to a conductor behavior. In the low-temperature range, the electrons are not free, and the conductivity increases with increasing temperatures, with this behavior being a semiconductor-type behavior. At temperatures above 60 °C, the static conductivity decreases with increasing temperatures, the sample behaving like a conductor [19]. On the other hand, from Figure 8, it can be observed that, in the case of the Zn substitution of manganese ferrite (sample B), the conductivity σDC of the Mn-Zn ferrite increases by an order of magnitude compared to the static conductivity σDC of unsubstituted manganese ferrite MnFe2O4.
Based on Mott’s VRH model [19], the temperature dependence of the static conductivity σDC is described by the following equation:
σ D C = σ 0 exp ( D T 1 / 4 )
where D is given by the equation
D = 4 E c o n d k T 3 / 4
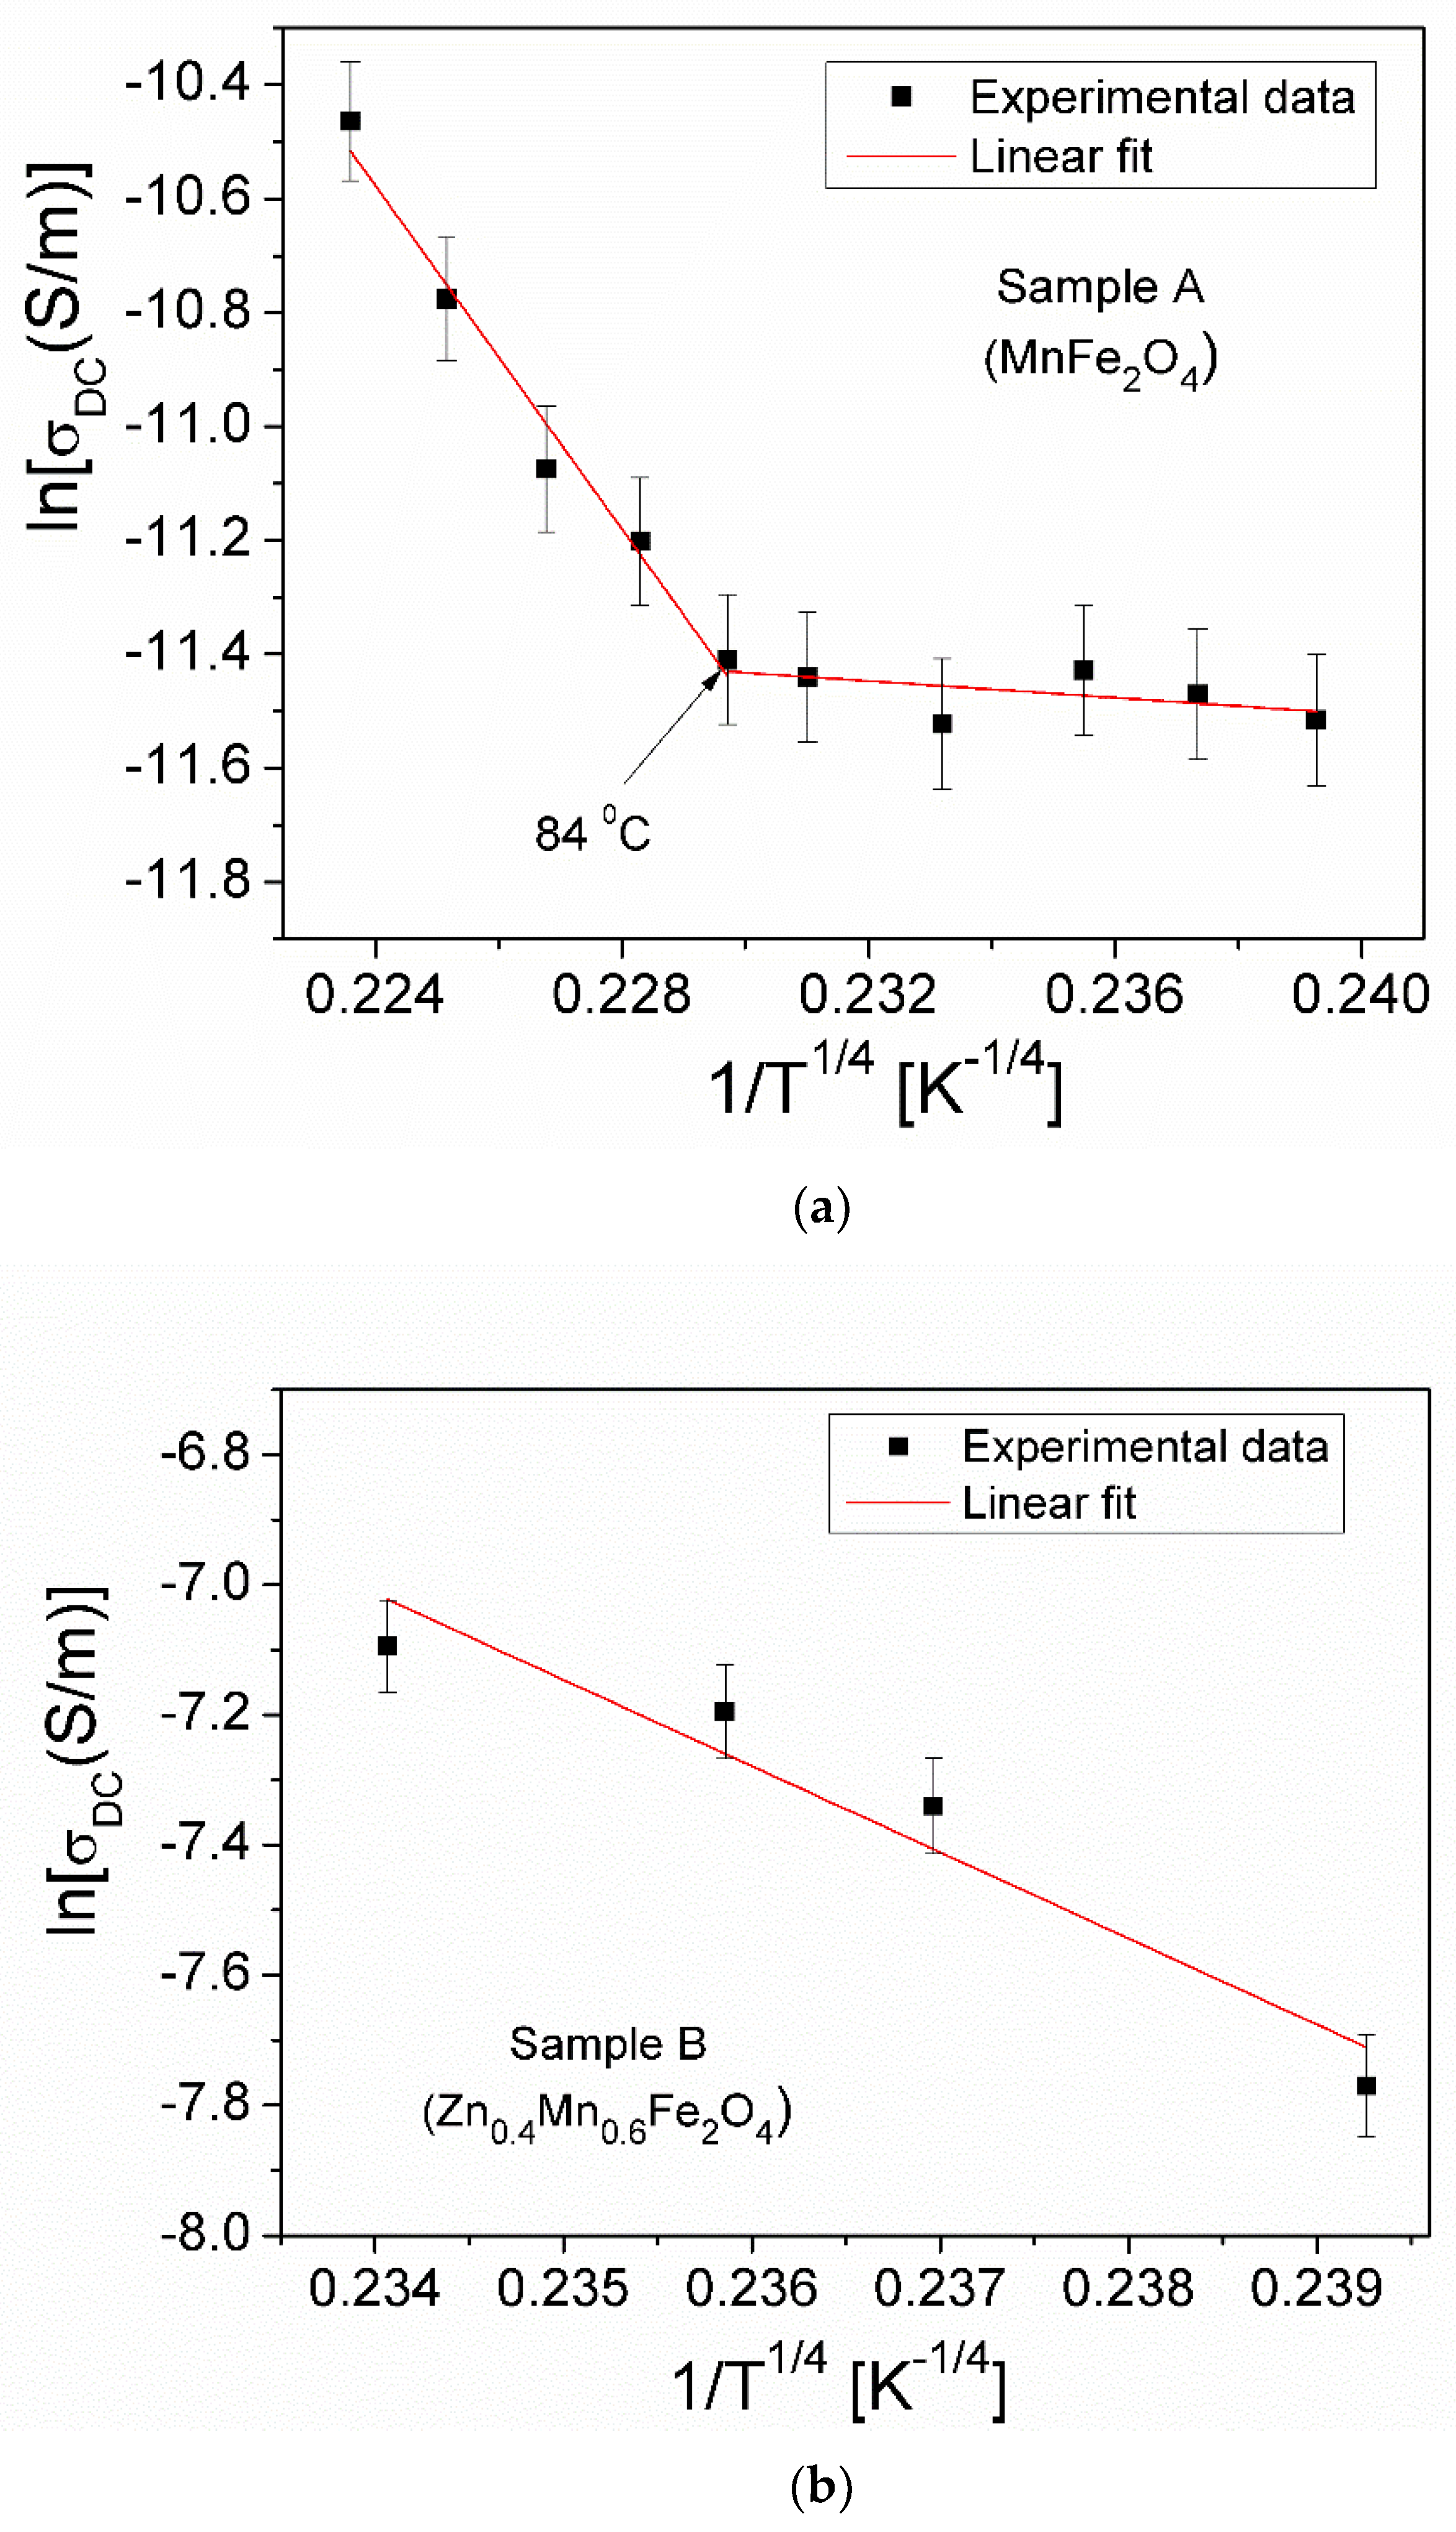
In these relationships, σ0 is the pre-exponential factor, and Econd is the activation energy for electrical conduction [19,42]. The experimental dependence of lnσDC on T−1/4 of the samples, using Equation (5), is shown in Figure 9. The measurement error of lnσDC is approximately 1% and is represented in Figure 9a,b with error bars.
From Figure 9, one can observe that, for sample A of manganese ferrite, there is a change in the slope of the curve at a temperature of 84 °C; this fact is both due to the ferrite nanoparticles (grains) but also to the separation limits between the nanoparticles (grain boundaries) [40,42], which cause the sample conductivity to change. This result is in agreement with the one obtained in Figure 6a, in which the plot dependence ln(τ) on (1000/T) changes its slope at a temperature of 85 °C, causing an increase in electrical conductivity (above 85 °C). Fitting the ln σ D C ( T 1 / 4 ) dependencies in Figure 9 with a straight line, both the slope D corresponding to the two temperature ranges (below 84 °C and above 84 °C, respectively) for sample A (Figure 9a) and the slope D corresponding to the temperature range for sample B (Figure 9b) were determined. The following fitting parameters of sample A were obtained: for the temperature range below 84 °C, the intercept was −9.74876, and slope D was −7.32114, and, for the temperature range above 84 °C, the intercept was 23.20753, and slope D was −150.82696. In the case of sample B, the intercept was 24.01423, and slope D was −132.59746 for the temperature range between 30 and 60 °C. Then, using Equation (6), we were able to calculate the activation energy for conduction Econd(T) for the two samples. Figure 10 shows the temperature dependence of the activation energy Econd(T) for samples A and B in the temperature ranges at which the conductivity variation occurs with the same slope.
From Figure 10, it turns out that the Econd for both samples increases linearly with the increasing temperature, which indicates that the electrical conduction in the investigated samples can be explained by the process of hopping electrons between localized states, in accordance with the VRH model [19]. For sample A, the values obtained for Econd in the temperature range 32–78 °C are between 11 and 12.5 meV, and, in the temperature range 80–127 °C, they are between 0.260 and 0.295 eV (Figure 10a). For sample B (Figure 10b), the values obtained for Econd in the temperature range 32–60 °C are between 0.207 and 0.225 eV. These values of Econd for the two samples are close to the values obtained from the electrical relaxation measurements for the barrier energy between the localized states of the samples, ΔErelax, in the same temperature ranges, according to Figure 6a,b.
From the values obtained for ΔErelax and Econd, in the same temperature ranges, it can be noted that the ΔErelax value is the average value of the interval corresponding to the activation energy of the conduction process, Econd. As a result, it can be said that ΔErelax represents the energy required for hopping between the localized states of the charge carriers.
In the dispersion region at high frequencies, the dynamic conductivity σAC is correlated with the relaxation processes determined by the electric localized charge carriers in the sample [41], given by the following relationship:
σ A C ( ω , T ) = A 0 ω n ( T ) = σ D C ( ω ω c ) n ( T )
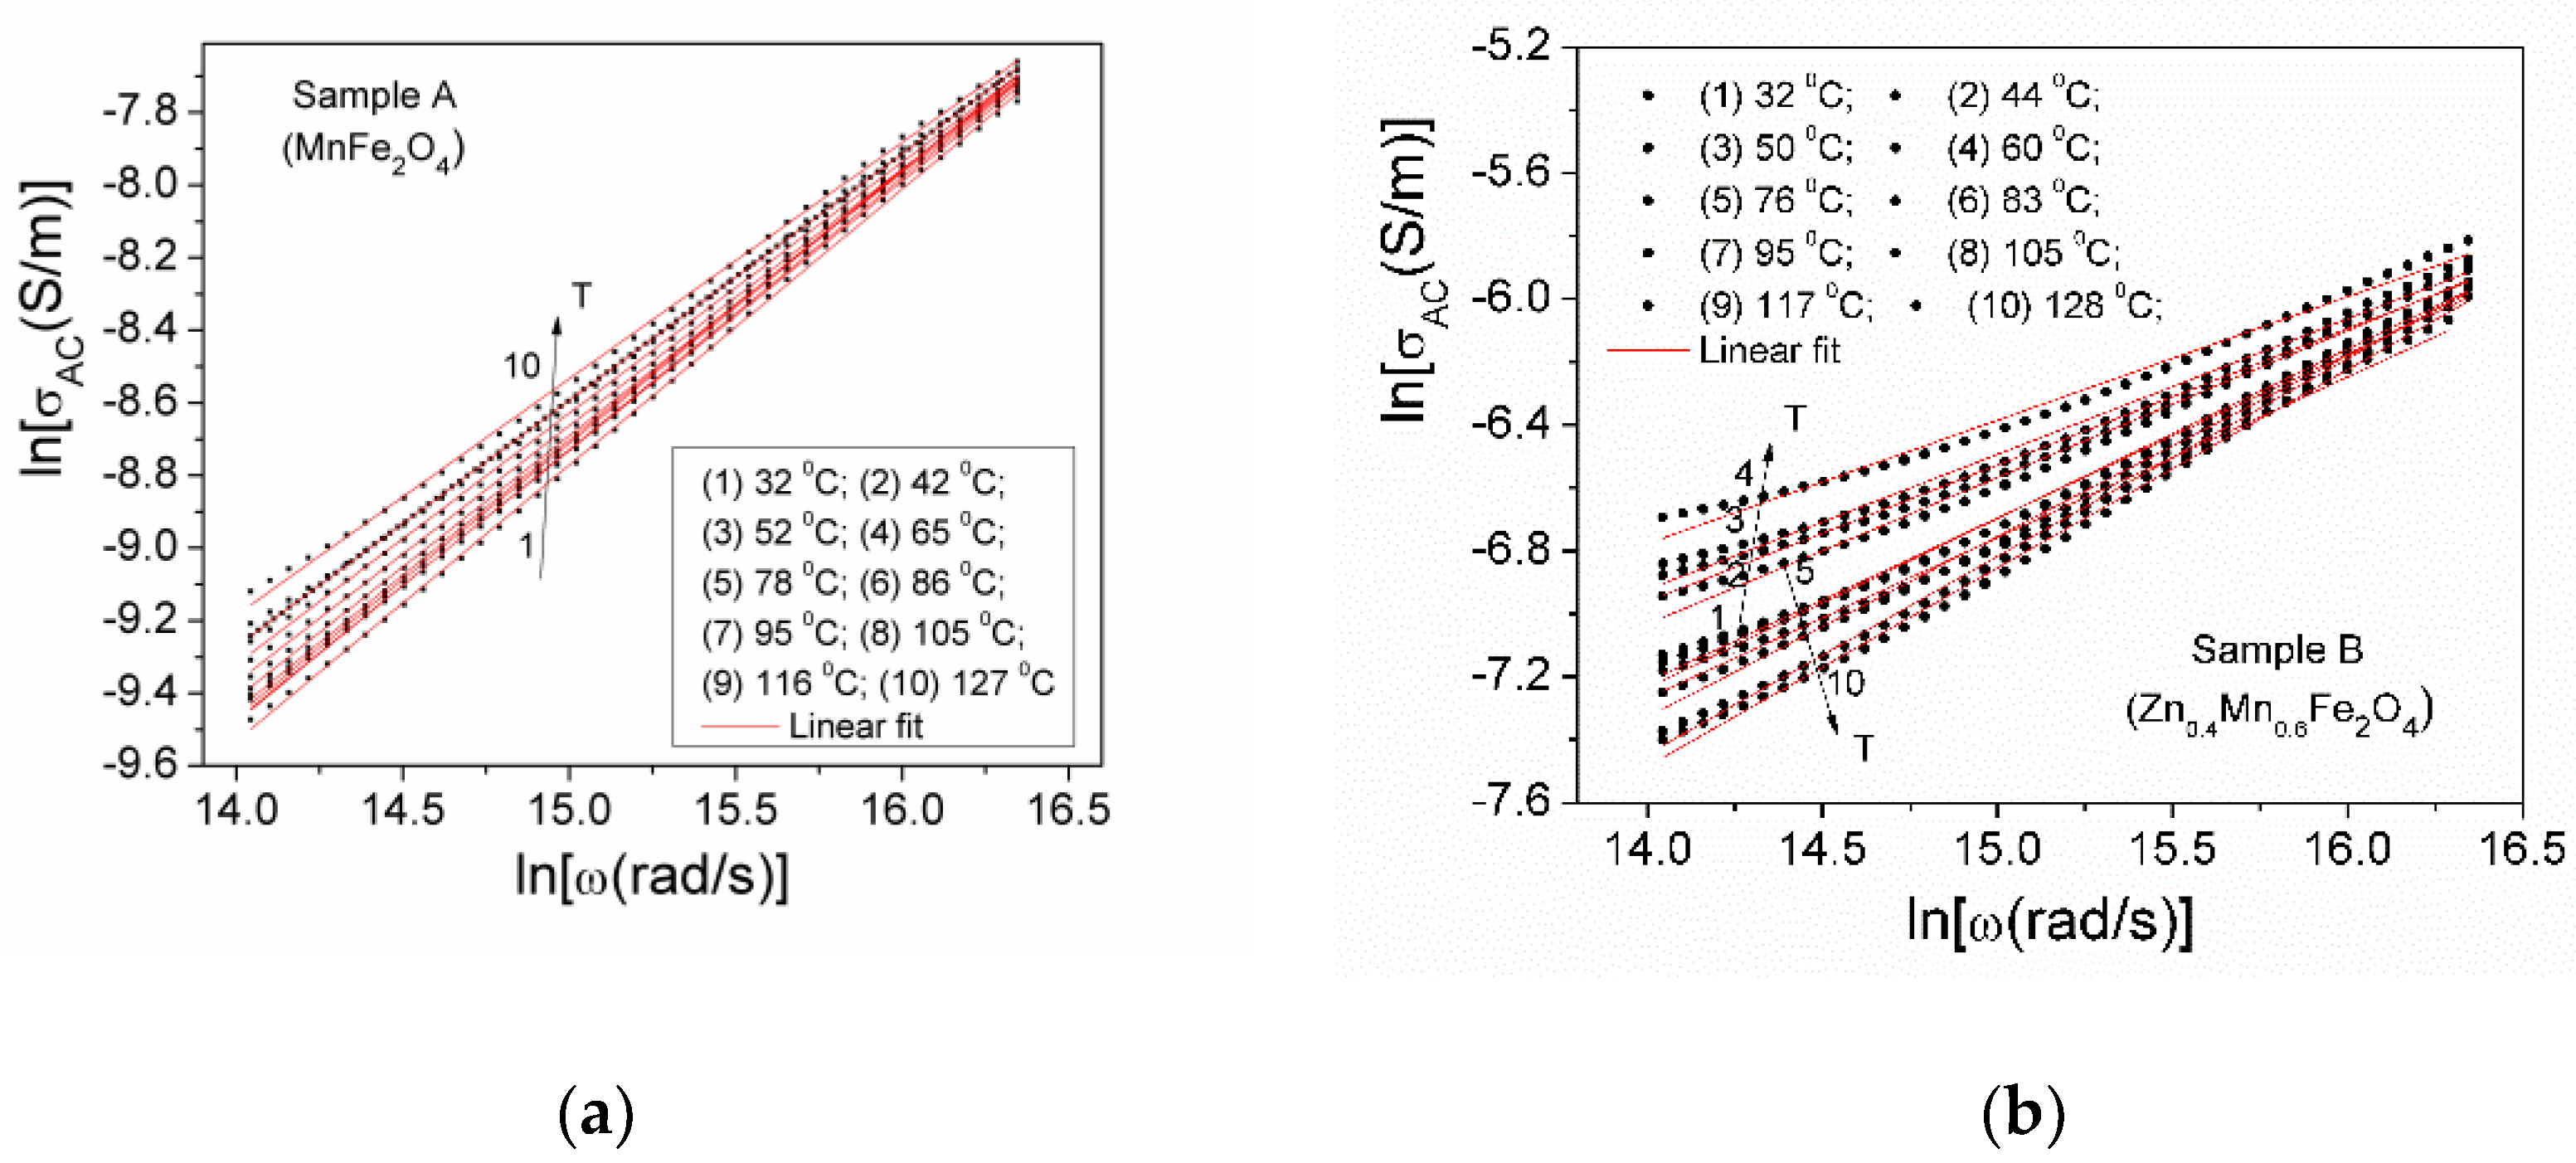
where A0 is a temperature-dependent parameter; the exponent n is dimensionless, dependent on temperature (n < 1) [20,41]; and ωc represents the crossover frequency, i.e., the transition frequency from the static regime, DC, to the dynamic regime, AC, of electrical conductivity (see Figure 6), in accordance with Jonscher’s law [41]. From Equation (7), the following equation is derived:
ω c = ( σ D C A 0 ) 1 / n
which allows the crossover frequency to be determined, based on electrical conductivity measurements and the VRH model. The experimental dependence ln(σAC) on ln(ω), obtained by the logarithm in Equation (7), at all the investigated temperatures, is shown in Figure 11, for both samples. The exponent n and parameter A0 for each temperature of the two samples can be determined by fitting with the straight line of the experimental dependence, ln(σAC) on ln(ω), from Figure 11. For all the investigated temperatures T, the fitting parameters lnA0 and the exponents n and R2 corresponding to each sample, obtained by fitting the experimental dependences from Figure 11a,b, are shown in Table 3.
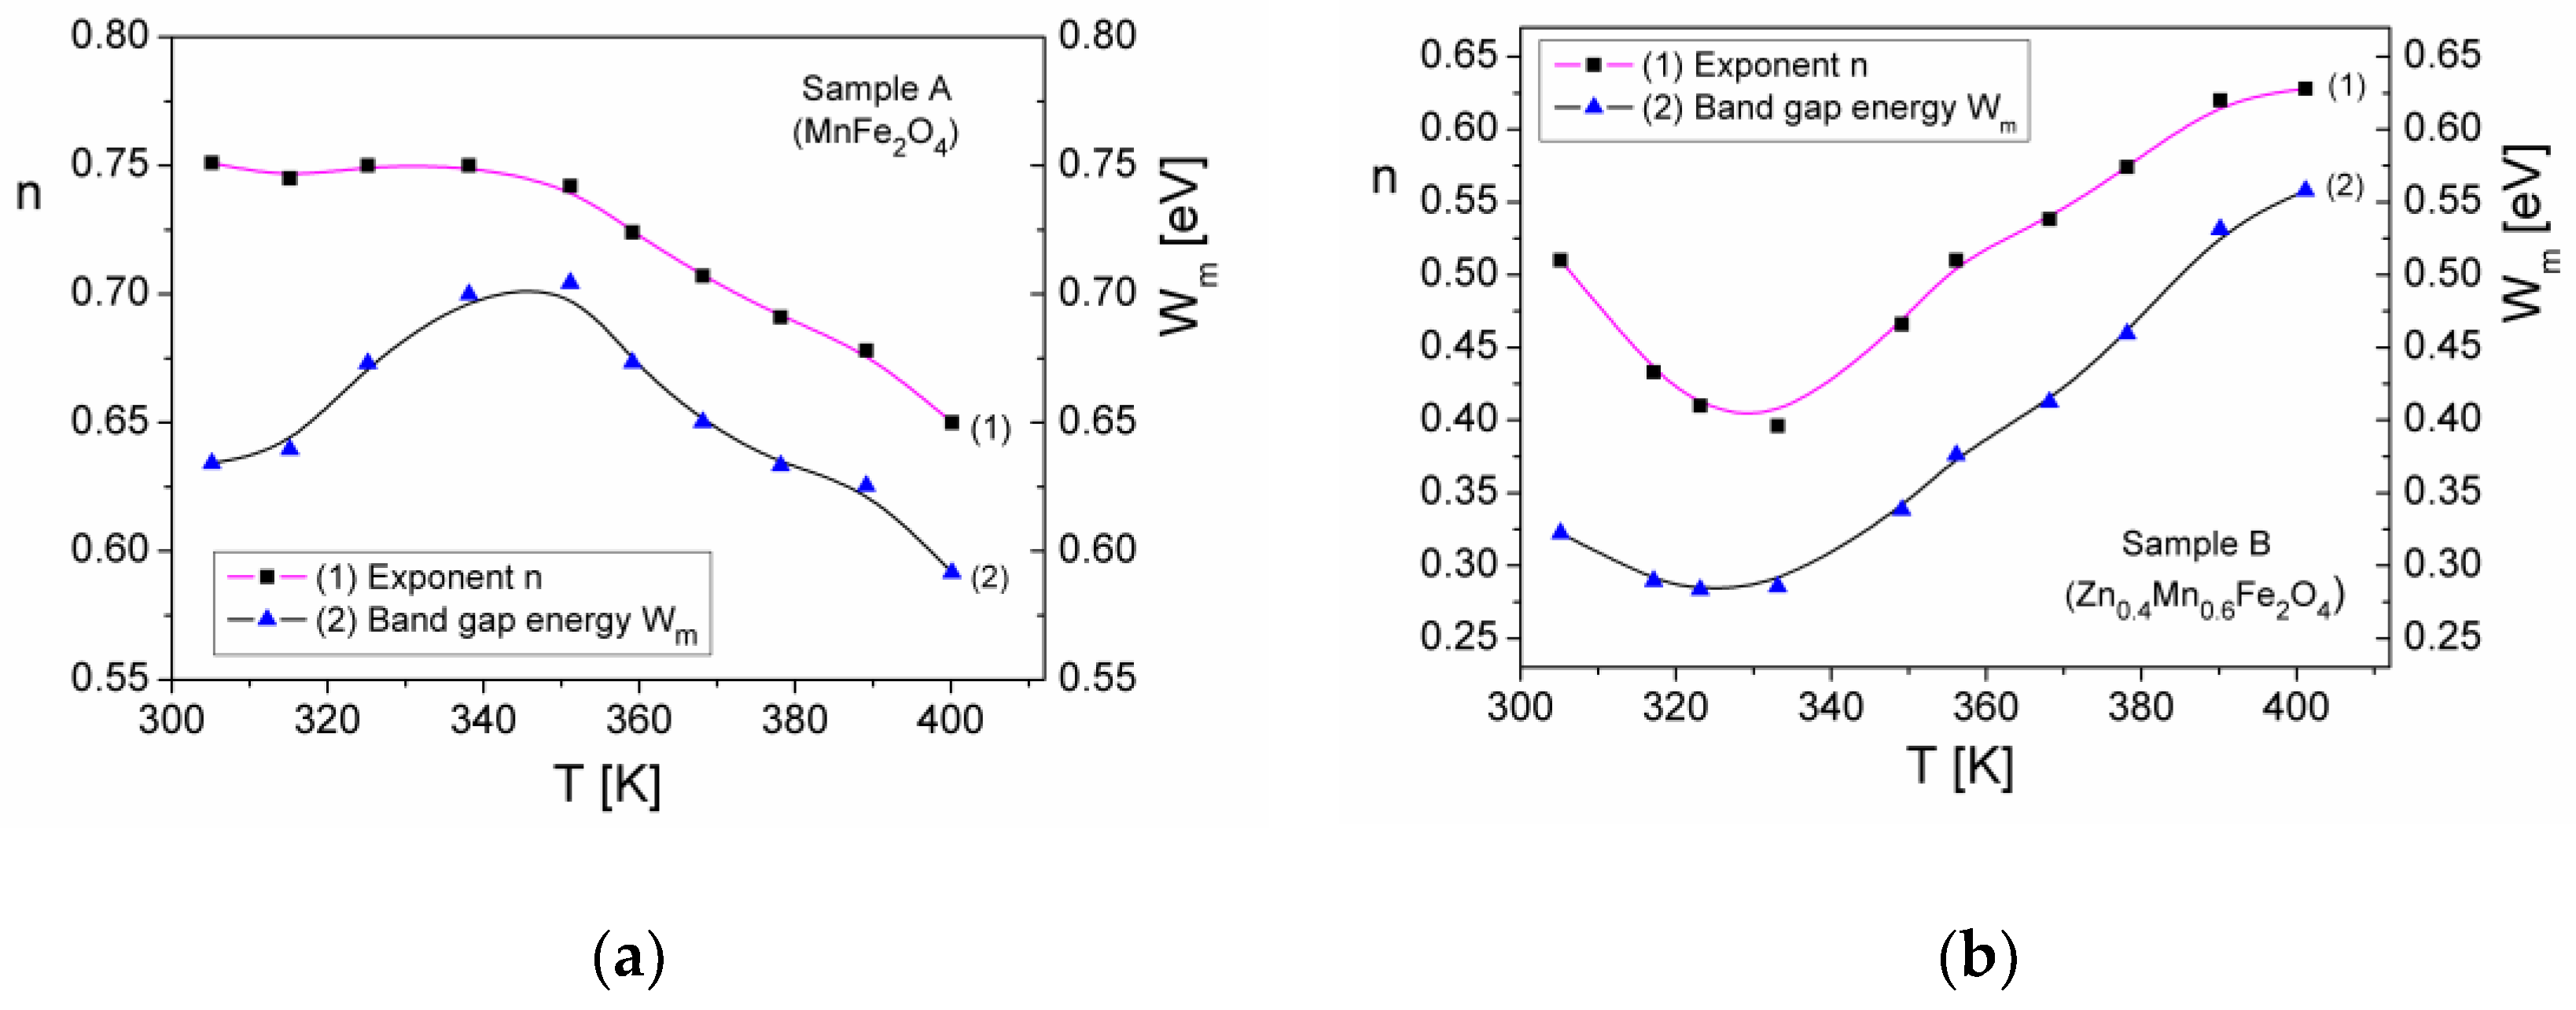
Figure 12 shows the temperature dependence of the exponent n for each ferrite sample.
From Figure 12a, it can be seen that the exponent n for sample A (MnFe2O4) increases very slightly around the value of 0.75 when the temperature increases from 30 °C to 70 °C and then rapidly decreases to the value of 0.65 when the temperature increases from 70 °C to 127 °C. From Figure 12b, it can be observed that the exponent n for sample B (Zn0.4Mn0.6Fe2O4) decreases from 0.51 to 0.39 when the temperature increases from 30 °C to 60 °C, while, at temperatures above 60 °C, n increases from 0.39 to 0.63. At the same time, from Figure 12, it can be observed that the exponent n has relatively high values (n > 0.5), which shows that, in the investigated samples, the conduction mechanism is due to a process of the charge carriers from the material hopping between the closer neighboring states, according to the CBH (correlated barrier hopping) model [43]. According to this model, the exponent n can be written in a first approximation [20,43] in the following form:
n = 1 6 k T W m
where Wm represents the maximum energy of the barrier, considered equal to the energy of the bandgap [43]. Knowing the obtained values of n, shown in Figure 12, for the investigated samples, using Equation (9), the energy of the bandgap Wm was determined, at all the investigated temperatures, with the obtained results also being shown in Figure 12.
As seen in Figure 12a,b, by adding metal ions of Zn in the MnFe2O4 spinel ferrite structure, there is a decrease in the energy of the bandgap (Figure 12b), compared to the unsubstituted MnFe2O4 ferrite (Figure 12a). At the same time, from Figure 12, it can be seen that, in the case of manganese ferrite (sample A), Wm has a maximum equal to 0.72 eV at a temperature of 70–80 °C, while, for the Mn-Zn ferrite sample (sample B), Wm has a minimum equal to 0.28 eV at a temperature of 60 °C. The maximum value of the bandgap energy Wm for sample A correlates very well with the static conductivity σDC, which has a minimum at the respective temperatures for sample A (see Figure 8a). Similarly, the minimum value of the bandgap energy Wm for sample B correlates very well with the static conductivity σDC, which has a maximum at the temperature of 60 °C (see Figure 8b). The values obtained by us for the bandgap energy Wm in Figure 12 are consistent with those obtained by other authors [44,45] for samples of manganese ferrite MnFe2O4 or manganese ferrite substituted with Cu2+ or Ca ions (values between 1 eV and 2 eV).
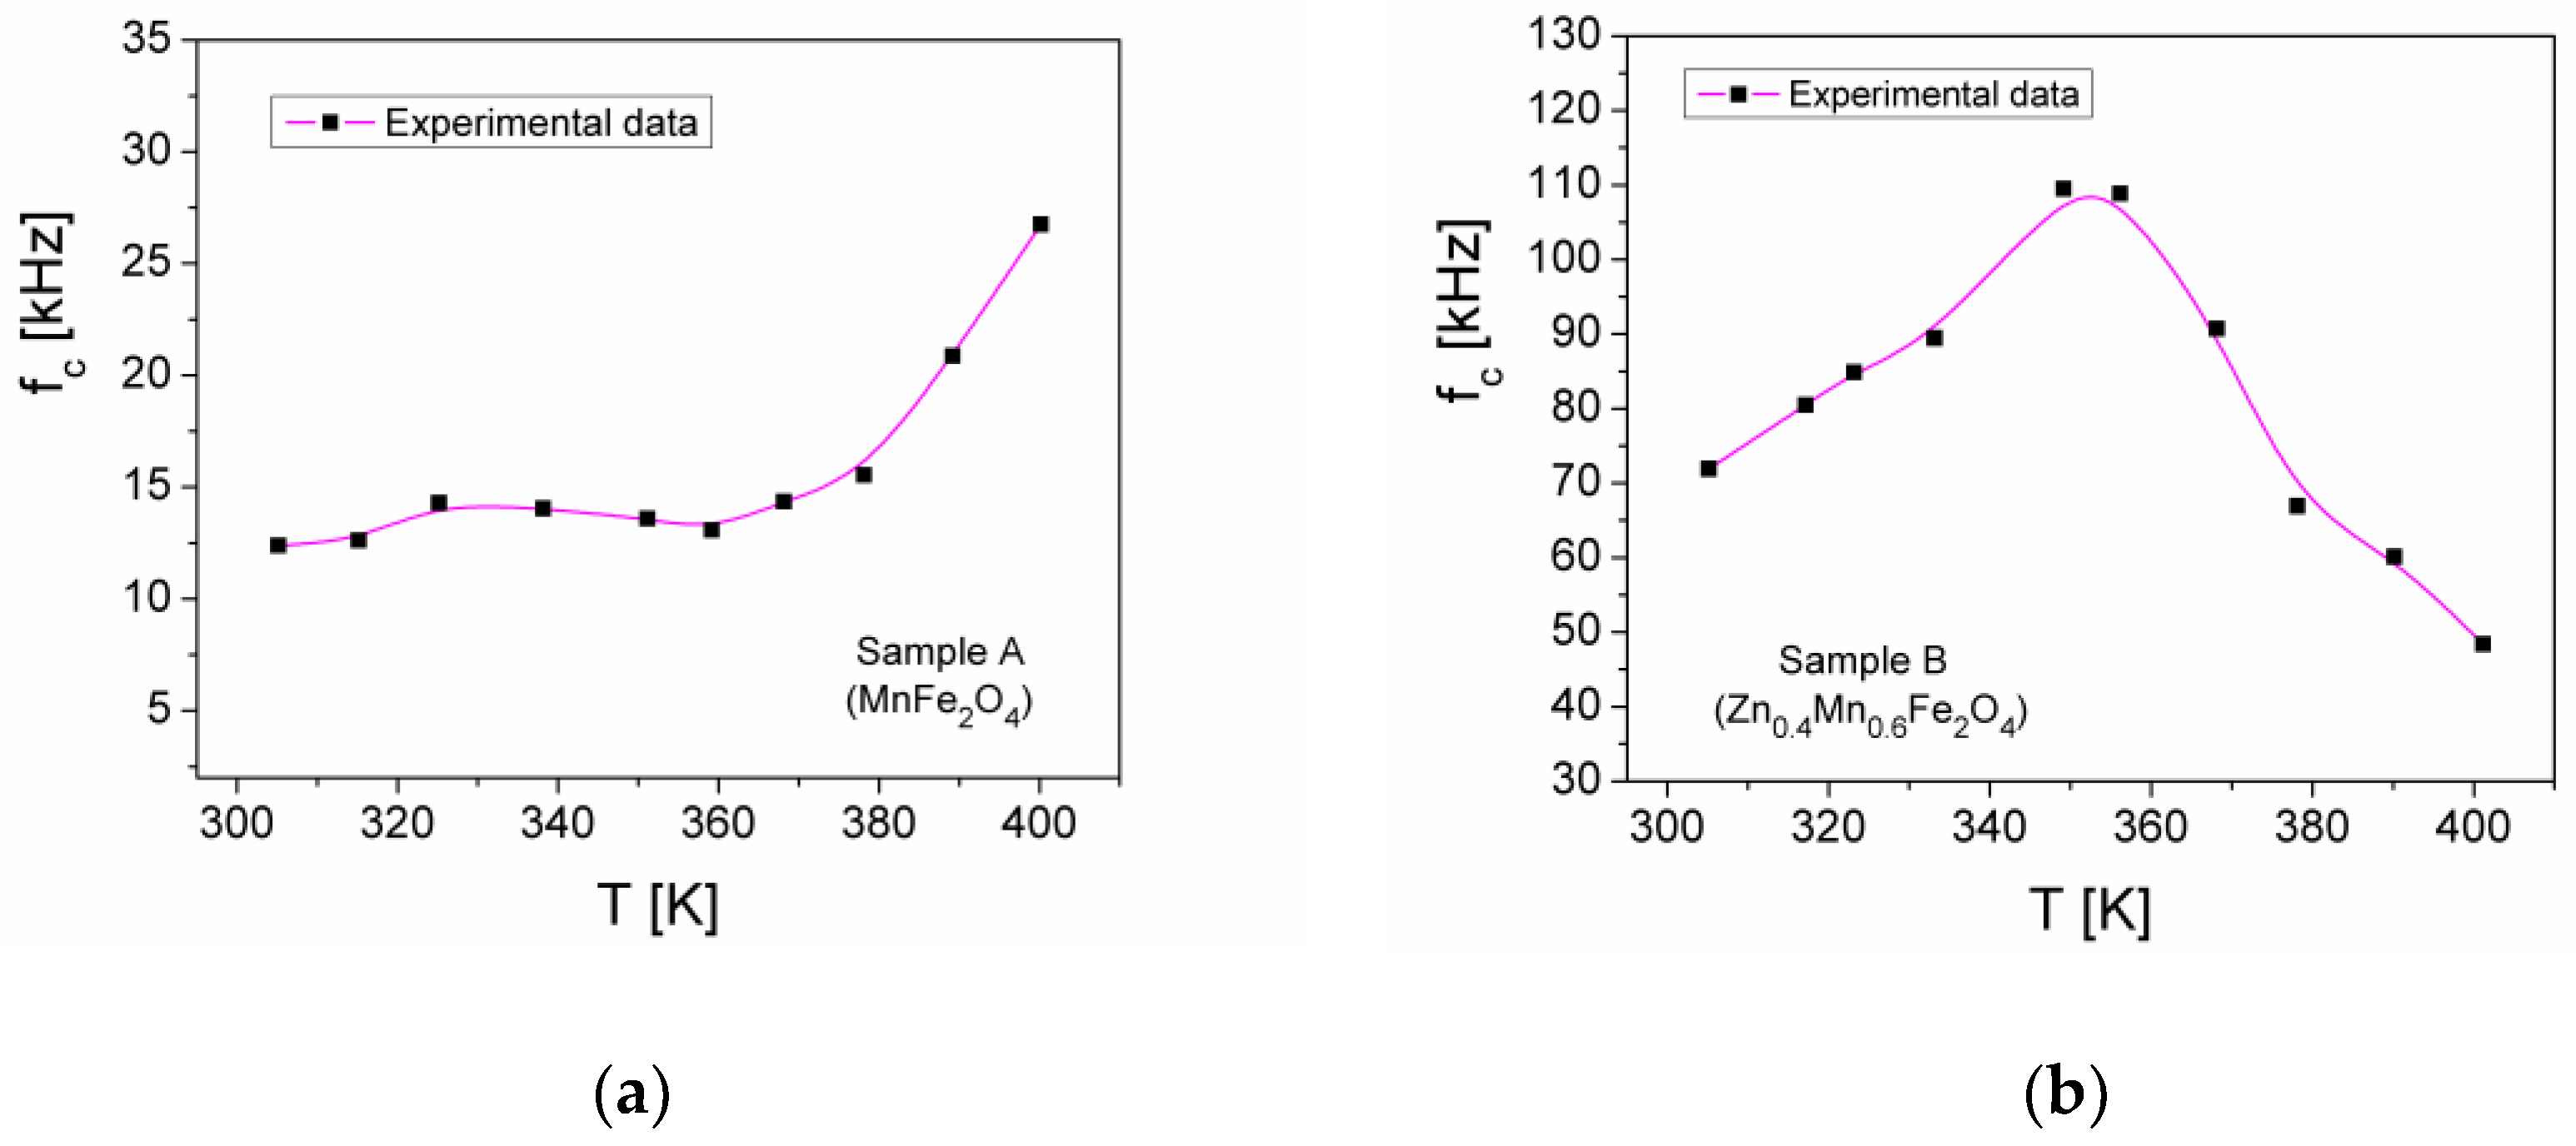
Knowing the values of the parameters n and A0 determined by fitting the straight line of the experimental dependence ln(σAC) of ln(ω) from Figure 11, as well as the σDC values of the electrical conductivity (Figure 8), for each temperature of the two samples, with Equation (8), we calculated the values of the crossover frequency ωc. Figure 13 shows the temperature dependence of the frequency fc = ωc/2π for the two samples.
From Figure 13a, it can be seen that, in the case of sample A (MnFe2O4), the transition frequency fc, from the DC regime to the AC regime, increases slightly from 12.5 kHz to 14 kHz when the temperature increases from 30 °C to approximately 70 °C, after which the increase is more pronounced, up to 27 kHz, at temperatures between 70 °C and 127 °C. At the same time, in the case of Mn-Zn ferrite (sample B, Zn0.4Mn0.6Fe2O4), the fc frequency increases from 71 kHz to 109 kHz when the temperature increases from 30 °C to about 60 °C (Figure 13b) and then decreases to the value of 45 kHz with increasing temperatures from 60 °C to 128 °C. This behavior of the transition frequencies fc of samples A and B is similar to the experimental temperature dependence of the DC conductivity (see Figure 6), which is in agreement with the VRH theory of Mott and Davis [19].

3.5.3. Complex Dielectric Permittivity

In recent years, studies have been carried out on the electrical properties in the high-frequency range (tens of kHz to hundreds of MHz) of some artificial composite materials, such as ceramic materials doped with indium [46] or cermet-type materials doped with copper [47]. For these materials, authors have highlighted a negative dielectric permittivity, as they have a behavior like that of a metamaterial [48], being able to be used in applications with coil-less electrical inductors and electromagnetic shielding. At the same time, a great technological interest for researchers relates to the study of the electrical properties in the microwave field of some materials resulting from the combination of hexaferrite with spinel ferrite (AFe2O4, where A = Co, Ni, Cu, Zn, and Mn) [49]. This results in a new functional material characterized by magneto-dielectric and absorption properties in the microwave range.
To determine the real (ε′) and imaginary (ε″) components of complex dielectric permittivity in the ZnxMn1−xFe2O4 ferrite samples (x = 0 and 0.4), based on complex impedance measurements in the low-frequency field, we used the following equations:
ε = 1 ω ε 0 Z Z 2 + Z 2 d A
where ε0 is the dielectric permittivity of free space (ε0 = 8.856·10−12 F/m).
Figure 14 shows the frequency dependence of the real ε′ and imaginary ε″ components of complex dielectric permittivity at different temperatures for the two investigated samples.
From Figure 14a,c, we can see that the values of the real component ε′ at the frequency of 100 Hz are between 300 and 800. For sample A, the ε′ value increases by increasing the temperature over the entire temperature range (Figure 14a). In the case of sample B, the increase in ε′ is observed in the range of 32–60 °C, after which ε′ decreases as the temperature increases up to 128 °C (Figure 14c). This behavior of ε′ can be correlated with the conduction mechanism in ferrites and is explained by the hopping between Fe2+ and Fe3+ ions on octahedral sites [40,50]. Also, in Mn-Zn ferrite (sample B) in tetrahedral sites due to the volatility of the Zn2+ ion, by increasing the temperature, part of the Fe2+ ions from the octahedral sites will be forced to transfer to the tetrahedral sites, which will lead to an increase in dielectric permeability [40,50]. By increasing the frequency, the ε′ component of the dielectric permittivity decreases significantly at high frequencies (over 200 kHz), tending towards the value of approximately 100 (Figure 14a,c), which shows that the charge carriers are influenced by the interfacial polarization mechanism [51].
From Figure 14b,d, it can be observed that the values of the imaginary component ε″ for both samples, at low frequencies, are between 1700 and 15,000 and decrease rapidly by increasing the frequency, for any temperature value. At the same time, it can be observed that the values of ε″ are much higher than the values of the component ε′ for all temperatures T (see inset in Figure 14b,d), up to the frequencies included in the range of 1.37–4.10 kHz (sample A) and, respectively, 9.685–36.881 kHz (sample B). This shows us that, up to these frequencies, there are large conduction losses in the inherited samples. Over the frequencies between approximately 1.37 and 4.10 kHz (sample A) and, respectively, between 9.685 and 36.881 kHz (sample B), corresponding to all the T values of the temperature (see Figure 14b,d), the values of ε″ decrease below the values of ε′, thus indicating that conduction losses become negligible and dielectric relaxation losses become important. It is known that the total dielectric losses in a material [52] are determined by both electrical conduction (conduction losses, ε c o n d ) and dielectric relaxation (relaxation losses, ε r e l ). As a result,
ε ( ω ) = ε r e l ( ω ) + ε c o n d ( ω )
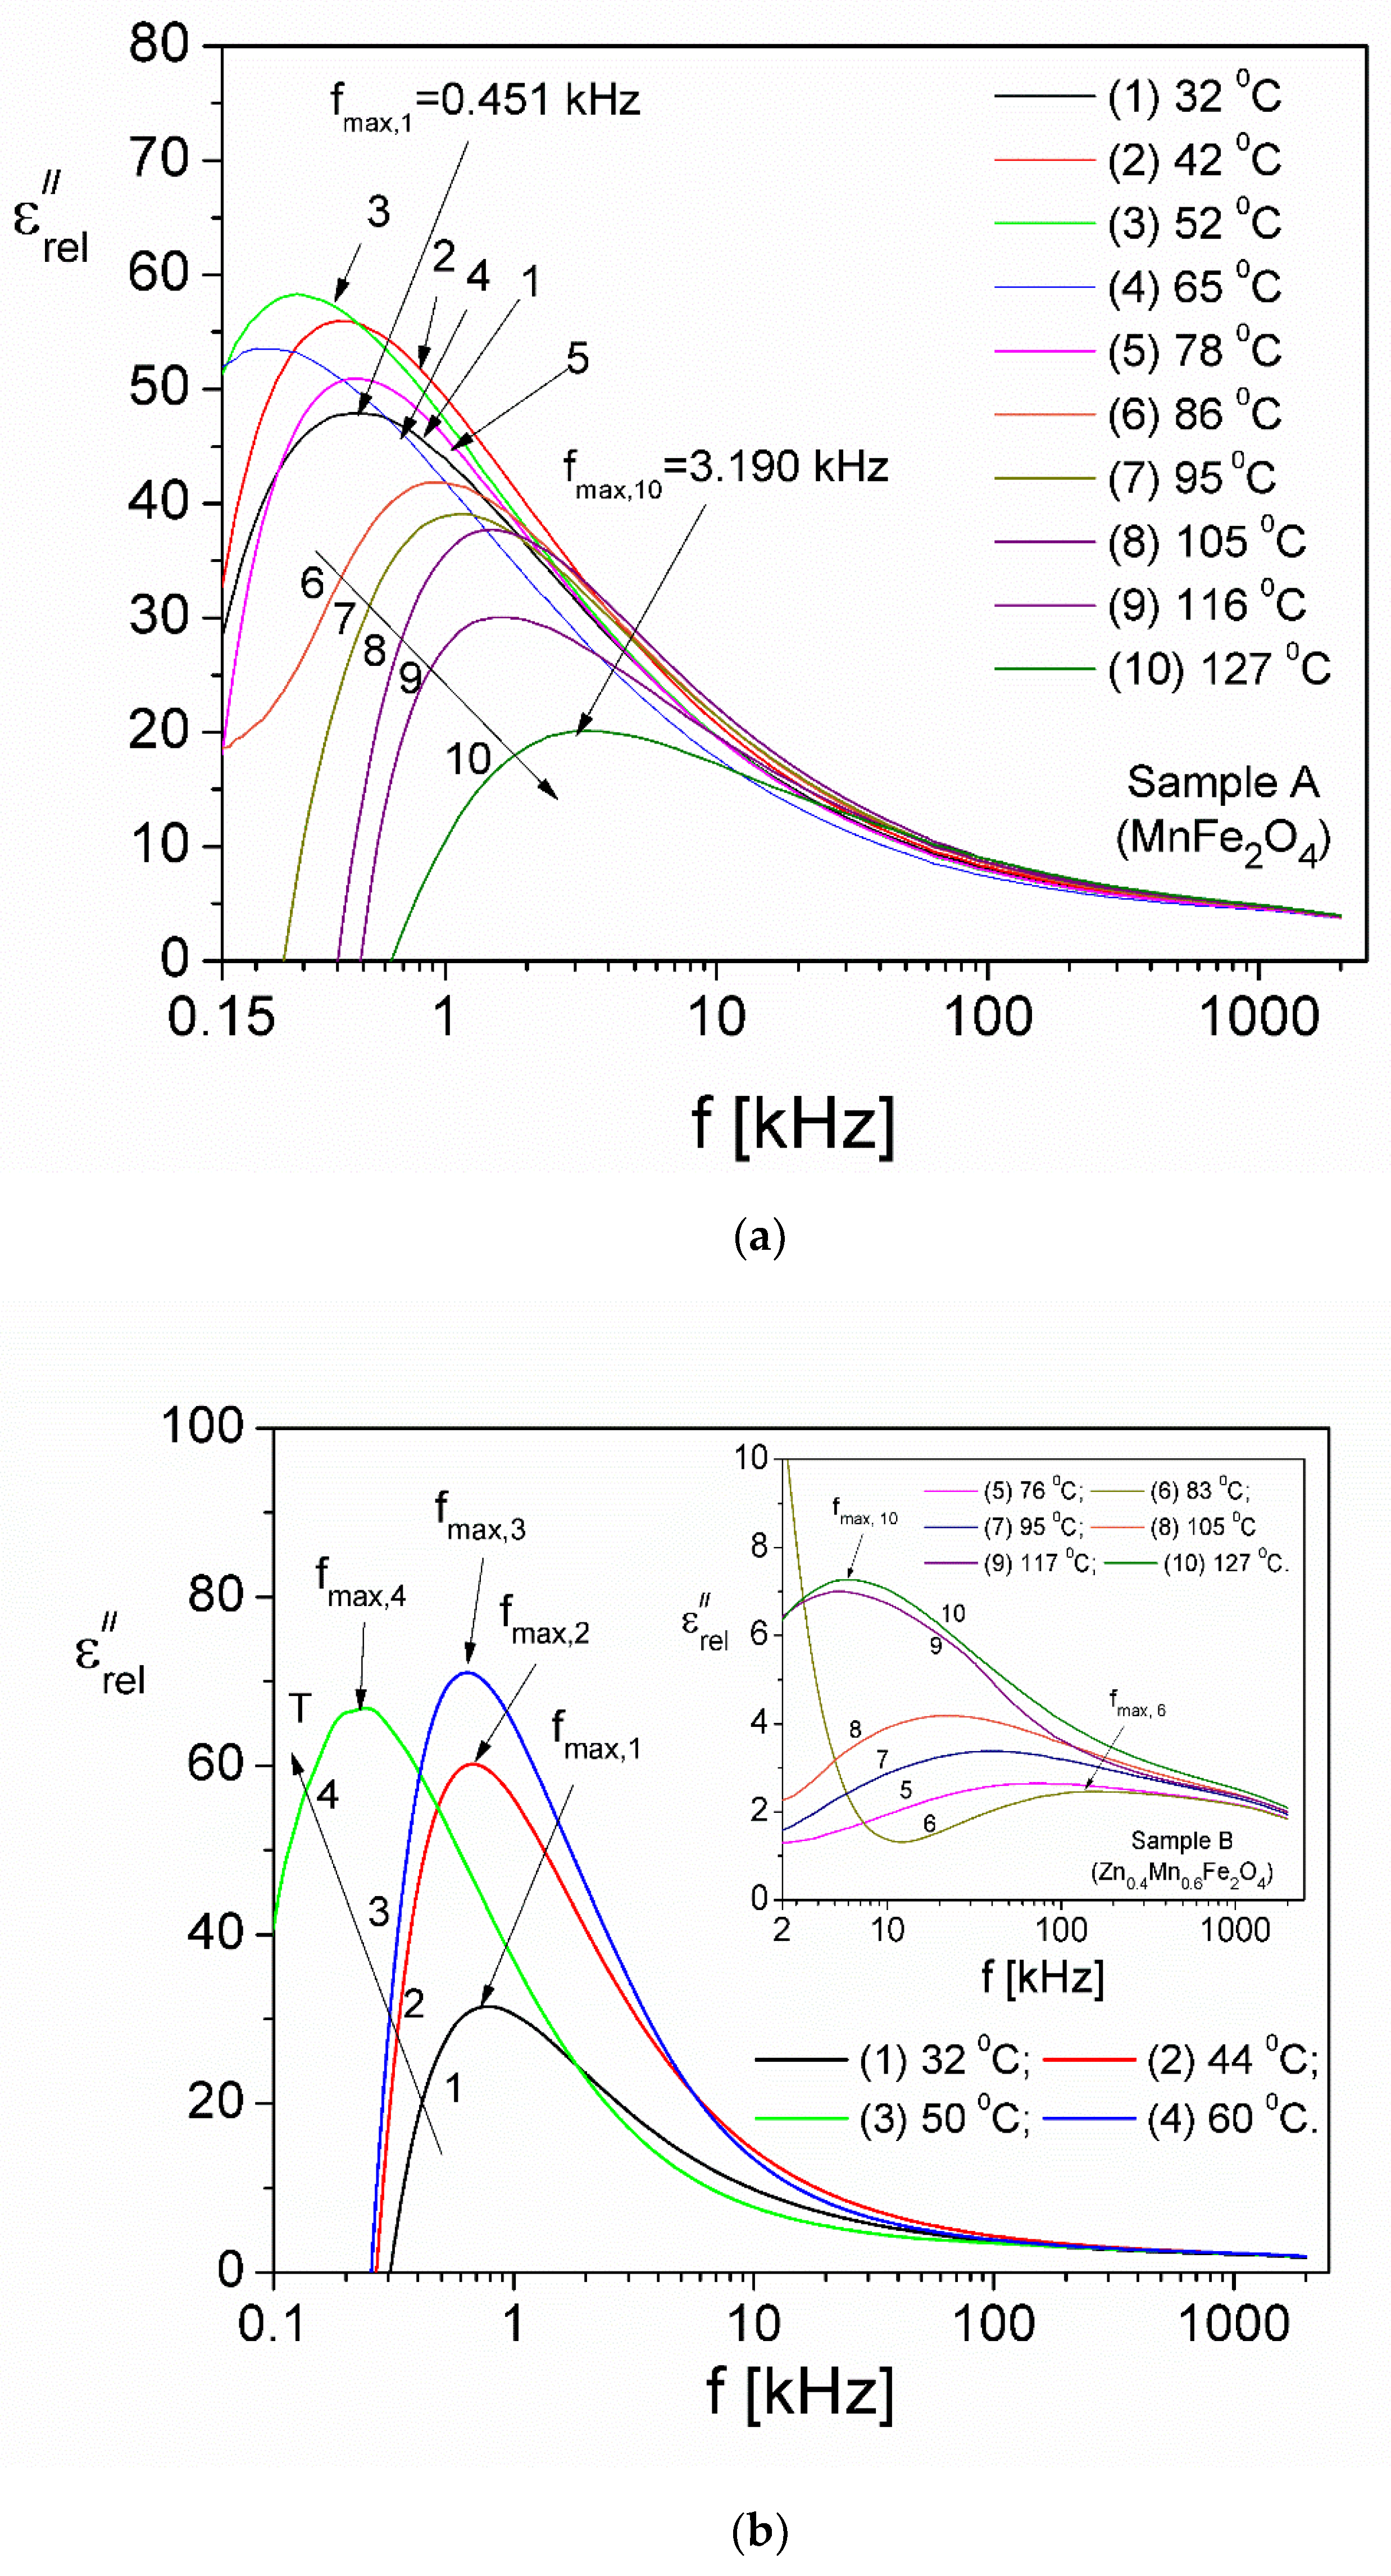
Taking into account that ε c o n d = σ / ω ε 0 [52] and assuming σ = σDC, corresponding to each temperature T (see Figure 8), with Equation (12), we were able to determine the component ε r e l , due only to the dielectric relaxation of the investigated samples. The frequency dependence of the component ε r e l at different temperatures is presented in Figure 15.
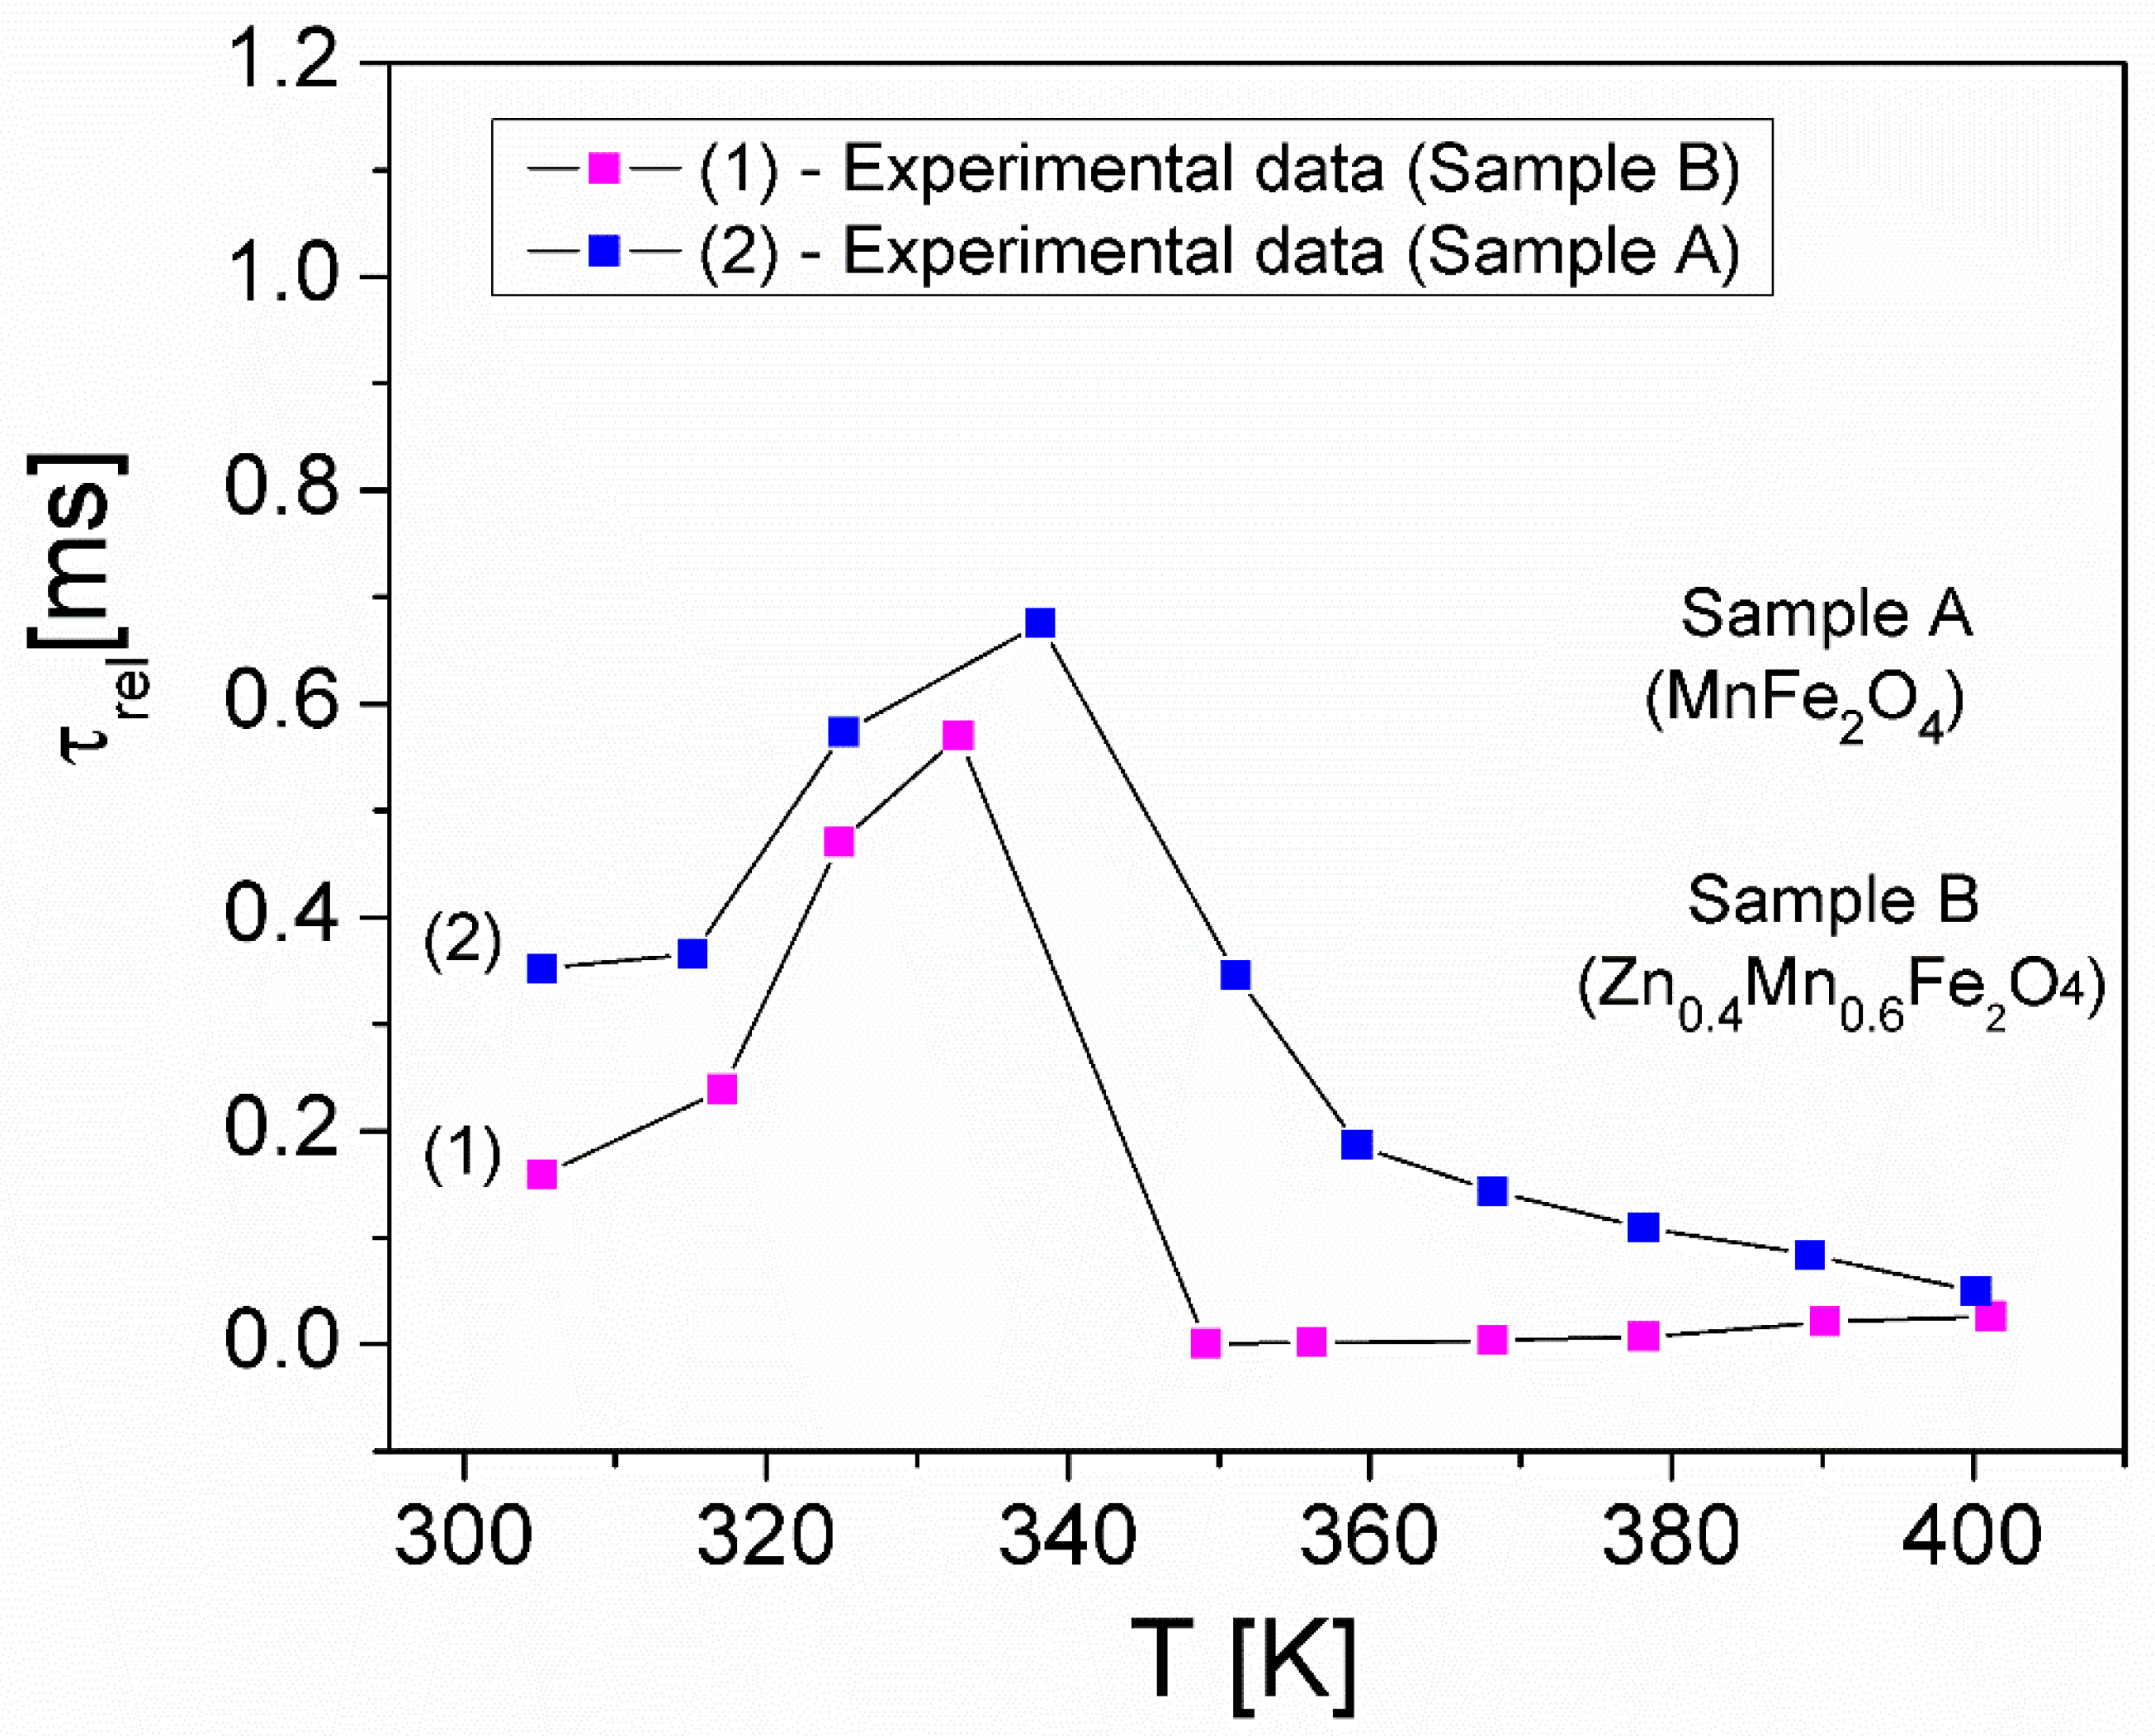
From Figure 15, it can be seen that ε r e l has a maximum at fmax frequency, corresponding to each temperature T, which indicates the existence of a relaxation process attributed to interfacial relaxation [53]. Using the experimental values of fmax from Figure 15a,b and the Debye equation, the relaxation times due to the interfacial relaxation process τrel for each investigated sample were determined. The temperature dependence of τrel for samples A and B is shown in Figure 16.
As seen from Figure 16, for manganese ferrite (sample A), τrel increases in the temperature range of 32–65 °C, after which it decreases when the temperature increases from 65 °C to 127 °C. In the case of Mn-Zn ferrite (sample B), the increase in τrel with temperature occurs both in the range of 30–60 °C and between 76 and 128 °C. This variation with temperature in the relaxation time τrel obeys an Arrhenius-type law, in the form of Equation (3), where we denoted with EA,rel the activation energy of the dielectric relaxation process for the two ferrite samples in different temperature ranges. Using Equation (3), by fitting the experimental dependence (lnτrel)(1/T) with a straight line, it is possible to determine the activation energy EA,rel corresponding to the mentioned temperature ranges for the two samples. The obtained values are the following: EA,rel = 0.195 eV for sample A in the temperature range of 32–65 °C; EA1,rel = 0.430 eV for sample B in the first temperature range (30–60 °C); and EA2,rel = 0.770 eV for sample B in the second temperature range (76–128 °C). Similar values for the dielectric relaxation activation energy have been reported by other authors [40,42] for similar ferrite samples.

4. Conclusions

MnFe2O4 and Zn0.4Mn0.6Fe2O4 ferrite samples were prepared by the hydrothermal method. The X-ray diffractogram showed that the samples were well crystallized, without secondary phases and crystallized in the cubic spinel system with the Fd-3m space group, also confirmed by the FTIR absorption spectra of the samples. The magnetic measurements showed that, by doping manganese ferrite with Zn2+ ions, sample B of Mn-Zn ferrite had a superparamagnetic behavior, with a saturation magnetization σs lower than that of sample A of manganese ferrite. From the complex impedance measurements, over the frequency range 100 Hz–2 MHz and at different temperatures, between 30 and 130 °C, a maximum of the imaginary component Z″ of the complex impedance was highlighted at all the investigated temperatures, which indicated the existence of an electrical relaxation process determined by the hopping of the charge carriers between localized states, in both samples. These measurements allowed the determination, for the first time, of the barrier energy between the localized states ΔErelax of the samples, obtaining, for sample A, two values (0.012 eV and 0.283 eV) associated with two areas of different conductivities and, for sample B, a value equal to 0.221 eV. The frequency and temperature dependencies of both the electrical conductivity (σ) and the complex dielectric permittivity (ε) of the samples were determined, using the complex impedance measurements. The results show that, at all the investigated temperatures, the conductivity spectrum σ(f) for the two investigated samples consisted of both the static component σDC, corresponding to low frequencies, and the dynamic component σAC, which increased rapidly with frequency and corresponded to high frequencies, in agreement with Jonscher’s law. The σDC component for sample B (Zn0.4Mn0.6Fe2O4 ferrite) was an order of magnitude higher than the σDC conductivity of sample A (manganese ferrite, MnFe2O4). Based on the temperature dependence of the static conductivity σDC(T) and Mott’s VRH model, the temperature dependence of the activation energy of the conduction process Econd(T) in the investigated samples was determined. The results show that the values of Econd for the two samples were close to the values obtained for the barrier energy between the localized states ΔErelax of the samples in the same temperature ranges. As a result, it can be stated that ΔErelax represented the energy required for the hopping of the charge carriers between the localized states, thus ensuring electrical conduction in the samples. In the dispersion region, at frequencies over to 200 kHz, using the CBH theoretical model, the temperature dependence of the bandgap energy (Wm) of both of the samples was determined for the first time. The obtained results show that, by adding Zn2+ ions to the manganese spinel ferrite structure, there was a decrease in the bandgap energy Wm, compared to the Wm of unsubstituted MnFe2O4 ferrite, from a maximum Wm = 0.72 eV (sample A) at a minimum Wm = 0.28 eV (sample B), in the temperature range of 60–70 °C. At the same time, based on the VRH and CBH models, we determined, for the first time, both for manganese ferrite (sample A) and Mn-Zn ferrite (sample B), the transition frequency fc from the DC regime to the AC regime at all the investigated temperatures. The results obtained for the complex dielectric permittivity of the samples show that, after the elimination of the conduction losses, the imaginary component () due to the dielectric relaxation showed a maximum at the frequency fmax, which changed with temperature, proving the existence of a relaxation process attributed to the interfacial relaxation. The activation energy of the dielectric relaxation process EA,rel was determined for the two ferrite samples in different temperature ranges.

Author Contributions

Conceptualization, I.M. and C.N.M.; methodology, M.O.B.; software, C.N.M. and P.S.; validation, I.M., C.N.M. and M.O.B.; formal analysis, P.V.; investigation, I.M., P.S., and P.V.; resources, C.N.M. and M.O.B.; writing—original draft preparation, I.M.; writing—review and editing, C.N.M. and I.M.; visualization, M.O.B., P.S. and P.V.; supervision, I.M. and C.N.M. All authors have read and agreed to the published version of the manuscript.

Funding

This research received no external funding.

Data Availability Statement

The raw data supporting the conclusions of this article will be made available by the authors on request.

Acknowledgments

Paula Sfirloaga acknowledges partial support for the SEM-EDX measurements, in the frame of POC/1025/1/3, Cod SMIS 2014+ 156350.

Conflicts of Interest

The authors declare no conflicts of interest.

References

  1. Kefeni, K.K.; Msagati, T.A.; Mamba, B.B. Ferrite nanoparticles: Synthesis, characterization and applications in electronic device. Mater. Sci. Eng. B 2017, 215, 37–55. [Google Scholar] [CrossRef]
  2. Tsakaloudi, V.; Zaspalis, V.T. A new Mn–Zn ferrite for high-speed data transmission applications in telecommunication networks. J. Magn. Magn. Mater. 2007, 310, 2540–2542. [Google Scholar] [CrossRef]
  3. Sahoo, B.; Devi, K.S.P.; Dutta, S.; Maiti, T.K.; Pramanik, P.; Dhara, D. Biocompatible mesoporous silica-coated superparamagnetic manganese ferrite nanoparticles for targeted drug delivery and MR imaging applications. J. Colloid Interf. Sci. 2014, 431, 31–41. [Google Scholar] [CrossRef] [PubMed]
  4. Desai, H.B.; Hathiya, L.J.; Joshi, H.H.; Tanna, A.R. Synthesis and Characterization of Photocatalytic MnFe2O4 Nanoparticles. Mat. Today Proc. 2020, 21, 1905–1910. [Google Scholar] [CrossRef]
  5. Arulmurugan, R.; Vaidyanathan, G.; Sendhilnathan, S.; Jeyadevan, B. Mn–Zn ferrite nanoparticles for ferrofluid preparation: Study on thermal–magnetic properties. J. Magn. Magn. Mater. 2006, 298, 83–94. [Google Scholar] [CrossRef]
  6. Kamar, E.M.; Khairy, M.; Mousa, M.A. Effect of morphology and particle size on the electrical properties of nano-nickel ferrite. J. Mat. Res. Technol. 2023, 24, 7381–7393. [Google Scholar] [CrossRef]
  7. Kardile, H.; Somvanshi, S.B.; Chavan, A.R.; Pandit, A.; Jadhav, K. Effect of Cd2+ doping on structural, morphological, optical, magnetic and wettability properties of nickel ferrite thin films. Optik 2020, 207, 164462. [Google Scholar] [CrossRef]
  8. Kaur, N.; Kaur, M. Comparative studies on impact of synthesis methods on structural and magnetic properties of magnesium ferrite nanoparticles. Process. Appl. Ceram. 2014, 8, 137–143. [Google Scholar] [CrossRef]
  9. Malaescu, I.; Lungu, A.; Marin, C.N.; Vlazan, P.; Sfirloaga, P.; Turi, G.M. Experimental investigations of the structural transformations induced by the heat treatment in manganese ferrite synthesized by ultrasonic assisted co-precipitation method. Cer. Int. 2016, 42, 16744–16748. [Google Scholar] [CrossRef]
  10. Humbe, A.V.; Kounsalye, J.S.; Somvanshi, S.B.; Kumar, A.; Jadhav, K. Cation distribution, magnetic and hyperfine interaction studies of Ni–Zn spinel ferrites: Role of Jahn Teller ion (Cu2+) substitution. Mater. Adv. 2020, 1, 880–890. [Google Scholar] [CrossRef]
  11. Anupama, M.; Srinatha, N.; Matteppanavar, S.; Angadi, B.; Sahoo, B.; Rudraswamy, B. Effect of Zn substitution on the structural and magnetic properties of nanocrystalline NiFe2O4 ferrites. Ceram. Int. 2018, 44, 4946–4954. [Google Scholar] [CrossRef]
  12. Kumar, D.R.; Lincoln, C.A.; Ravinder, D.; Ahmad, S.I. Structural, morphological, luminescence, magnetic, and electrical transport properties of zinc-doped MnFe2O4 nanomaterials. Appl. Phys. A 2020, 126, 705. [Google Scholar] [CrossRef]
  13. Rafique, T.; Atif, M.; Rehman, A.U.; Wahab, H.; Khalid, W.; Ali, Z.; Nadeem, M. Colossal permittivity, resistive and magnetic properties of zinc substituted manganese ferrites. J. Alloys Comp. 2022, 923, 166454. [Google Scholar] [CrossRef]
  14. Gimenes, R.; Baldissera, M.R.; Da Silva, M.R.A.; Da Silveira, C.A.; Soares, D.A.W.; Perazolli, P.A.; Da Silva, M.R.; Zaghete, M.A. Structural and magnetic characterization of MnxZn1−xFe2O4 (x = 0.2, 0.35, 0.65, 0.8, 1.0) ferrites obtained by the citrate precursor method. Ceram. Int. 2012, 38, 741–746. [Google Scholar] [CrossRef]
  15. Makovec, D.; Drofenik, M.; Žnidaršic, A. Sintering of MnZn-ferrite powders prepared by hydrothermal reactions between oxides. J. Eur. Ceram. Soc. 2001, 21, 1945–1949. [Google Scholar] [CrossRef]
  16. Gopalan, E.V.; Al-Omari, I.A.; Malini, K.A.; Joy, P.A.; Kumar, D.S.; Yoshida, Y. Impact of zinc substitution on the structural and magnetic properties of chemically derived nanosized manganese zinc mixed ferrites. J. Magn. Magn. Mater. 2009, 321, 1092–1099. [Google Scholar] [CrossRef]
  17. El Heda, I.; Dhahri, R.; Massoudi, J.; Dhahri, E.; Bahri, F.; Khirouni, K.; Costa, B.F.O. Study of the structural, electrical, dielectric properties and transport mechanisms of Cu0.5Fe2.5O4 ferrite nanoparticles for energy storage, photocatalytic and microelectronic applications. Heliyon 2023, 9, e17403. [Google Scholar] [CrossRef]
  18. Coulibaly, S.; Malec, D.; Bley, V.; Mary, D.; Schlegel, B. New Use of Mn-Zn Ferrite Material in Power Electronics Integrated LC Filters. Engineering 2017, 9, 993–1007. [Google Scholar] [CrossRef]
  19. Mott, N.F.; Davis, E.A. Electronic Processes in Non-Crystalline Materials; Clarendon: Oxford, UK, 1979. [Google Scholar]
  20. Elliot, S.R. A.c. conduction in amorphous chalcogenide and pnictide semiconductors. Adv. Phys. 1987, 36, 135–217. [Google Scholar] [CrossRef]
  21. Kumar, P.; Pathak, S.; Jain, K.; Singh, A.; Basheed, G.A.; Pant, R.P. Low-temperature large-scale hydrothermal synthesis of optically active PEG-200 capped single domain MnFe2O4 nanoparticles. J. Alloys Comp. 2022, 904, 163992. [Google Scholar] [CrossRef]
  22. Griffiths, P.; de Hasseth, J.A. Fourier Transform Infrared Spectrometry, 2nd ed.; Wiley-Blackwell Inc.: Hoboken, NJ, USA, 2007. [Google Scholar]
  23. Ercuta, A. Sensitive AC hysteresigraph of extended driving field capability. IEEE Trans. Instrum. Meas. 2020, 69, 1643–1651. [Google Scholar] [CrossRef]
  24. Lungu, A.; Malaescu, I.; Marin, C.N.; Vlazan, P.; Sfirloaga, P. The electrical properties of manganese ferrite powders prepared by two different methods. Phys. B Cond. Matter. 2015, 462, 80–85. [Google Scholar] [CrossRef]
  25. ASTM D150-98; Standard Test Methods for AC Loss Characteristics and Permittivity (Dielectric Constant) of Solid Electrical Insulation. ASTM International: West Conshohocken, PA, USA, 2017.
  26. Iyer, R.; Desai, R.; Upadhyay, R.V. Low temperature synthesis of nanosized Mn1−xZnxFe2O4 ferrites and their characterizations. Bull. Mater. Sci. 2009, 32, 141–147. [Google Scholar] [CrossRef]
  27. Srinivasan, T.T.; Srivastava, C.M.; Venkataramani, N.; Patni, M.J. Infrared absorption in spinel ferrites. Bull. Mater. Sci. 1984, 6, 1063–1067. [Google Scholar] [CrossRef]
  28. Raju, M.K. FT-IR studies of Cu substituted Ni-Zn ferrites for structural and vibrational investigations. Chem. Sci. Trans. 2015, 4, 137–142. [Google Scholar]
  29. Devi, E.C.; Soibam, I. Effect of Zn doping on the structural, electrical and magnetic properties of MnFe2O4 nanoparticles. Indian J. Phys. 2017, 91, 861–867. [Google Scholar] [CrossRef]
  30. Liu, X.M.; Shao-Yun, F. Synthesis of nanocrystalline Zn0.5Mn0.5Fe2O4 via in situ polymerization technique. J. Magn. Magn. Mater. 2007, 308, 61–64. [Google Scholar] [CrossRef]
  31. Zaag, P.J.V.; Noordermeer, A.; Johnson, M.T.; Bongers, P.E. Size-dependent Curie temperature in nanoscale MnFe2O4 particles. Phys. Rev. Lett. 1992, 68, 3112–3117. [Google Scholar] [CrossRef] [PubMed]
  32. Gopalan, E.V.; Malini, K.A.; Saravanan, S.; Kumar, D.S.; Yoshida, Y.; Anantharaman, M.R. Evidence for polaron conduction in nanostructured manganese ferrite. J. Phys. D Appl. Phys. 2008, 41, 185005. [Google Scholar] [CrossRef]
  33. Chen, J.P.; Sorenson, C.M.; Klabunde, K.J.; Hadjipanayis, G.G.; Delvin, E.; Kostidas, A. Size-dependent magnetic properties of MnFe2O4 fine particles synthesized by coprecipitation. Phys. Rev. B 1996, 54, 9288–9296. [Google Scholar] [CrossRef]
  34. Arulmurugan, R.; Jeyadevan, B.; Vaidyanathan, G.; Sendhilnathan, S. Effect of zinc substitution on Co-Zn and Mn-Zn ferrite nanoparticles prepared by co-precipitation. J. Magn. Magn. Mater. 2005, 288, 470–477. [Google Scholar] [CrossRef]
  35. Borsa, F.; Torgeson, D.R.; Martin, S.W.; Patel, H.K. Relaxation and fluctuations in glassy-fast-ion conductors Wide-frequency-range NMR and conductivity measurements. Phys. Rev. B 1992, 46, 795–801. [Google Scholar] [CrossRef]
  36. Hajlaoui, M.E.; Dhahri, R.; Hnainia, N.; Benchaabane, A.; Dhahri, E.; Khirouni, K. Dielectric spectroscopy study of the Ni0.2Zn0.8Fe2O4 spinel ferrite as a function of frequency and temperature. Mat. Sci. Eng. B 2020, 262, 114683. [Google Scholar] [CrossRef]
  37. Idrees, M.; Nadeem, M.; Hassan, M.M. Investigation of conduction and relaxation phenomena in LaFe0.9Ni0.1O3 by impedance spectroscopy. J. Phys. D Appl. Phys. 2010, 43, 155401. [Google Scholar] [CrossRef]
  38. Debye, P. Polar Molecules; Chemical Catalog Company, Inc.: New York, NY, USA, 1929. [Google Scholar]
  39. Malaescu, I.; Lungu, A.; Marin, C.N.; Sfirloaga, P.; Vlazan, P.; Brindusoiu, S.; Poienar, M. Temperature dependence of the dynamic electrical properties of Cu1+xMn1−xO2 (x = 0 and 0.06) crednerite materials. Cer. Intern. 2018, 44, 11610–11616. [Google Scholar] [CrossRef]
  40. Hajlaoui, M.E.; Gharbi, S.; Dhahri, E.; Khirouni, K. Impedance spectroscopy and giant permittivity study of spinel ZnFe2O4 ferrite as a function of frequency and temperature. J. Alloys Comp. 2022, 906, 164361. [Google Scholar] [CrossRef]
  41. Jonscher, A.K. Universal Relaxation Law, 1st ed.; Chelsea Dielectrics Press: London, UK, 1996; pp. 198–200. [Google Scholar]
  42. Ponpandian, N.; Balaya, P.; Narayanasamy, A. Electrical conductivity and dielectric behaviour of nanocrystalline NiFe2O4 spinel. J. Phys. Condens. Matter. 2002, 14, 3221–3237. [Google Scholar] [CrossRef]
  43. Elliott, S.R. A theory of a.c. conduction in chalcogenide glasses. Philos. Mag. B 1977, 36, 1291–1304. [Google Scholar] [CrossRef]
  44. Vijaya, J.; Sekaran, G.; Bououdina, M. Effect of Cu2+ doping on structural, morphological, optical and magnetic properties of MnFe2O4 particles/sheets/flakes-like nanostructures. Ceram. Int. 2015, 41, 15–26. [Google Scholar] [CrossRef]
  45. Ustundağ, M.; Aslan, M. Electronic and Magnetic Properties of Ca-Doped Mn-Ferrite. Acta Phys. Pol. A 2016, 130, 362–364. [Google Scholar] [CrossRef]
  46. Fan, G.; Wang, Z.; Sun, K.; Liu, Y.; Fan, R. Doped ceramics of indium oxides for negative permittivity materials in MHz-kHz frequency regions. J. Mat. Sci. Technol. 2021, 61, 125–131. [Google Scholar] [CrossRef]
  47. Fan, G.; Wang, Z.; Ren, H.; Liu, Y.; Fan, R. Dielectric dispersion of copper/rutile cermet: Dielectric resonance, relaxation, and plasma oscillation. Scripta Mater. 2021, 190, 1–6. [Google Scholar] [CrossRef]
  48. Xie, P.; Zhang, Z.; Liu, K.; Qian, L.; Dang, F.; Liu, Y.; Fan, R.; Wang, X.; Dou, S. C/SiO2 meta-composite: Overcoming the λ/a relationship limitation in metamaterials. Carbon 2017, 125, 1–8. [Google Scholar] [CrossRef]
  49. Trukhanov, A.V.; Algarou, N.A.; Slimani, Y.; Almessiere, M.A.; Baykal, A.; Tishkevich, D.I.; Vinnik, D.A.; Vakhitov, M.G.; Klygach, D.S.; Silibin, M.V.; et al. Peculiarities of the microwave properties of hard–soft functional composites SrTb0.01Tm0.01Fe11.98O19–AFe2O4 (A = Co, Ni, Zn, Cu, or Mn). RSC Adv. 2020, 10, 32638–32651. [Google Scholar] [CrossRef] [PubMed]
  50. Krishna, K.R.; Kumar, K.V.; Ravinder, D. Structural and Electrical Conductivity Studies in Nickel-Zinc Ferrite. Adv. Mater. Phys. Chem. 2012, 02, 185–191. [Google Scholar] [CrossRef]
  51. Cao, M.S.; Song, W.L.; Hou, Z.L.; Wen, B.; Yuan, J. The effects of temperature and frequency on the dielectric properties, electromagnetic interference shielding and microwave-absorption of short carbon fiber/silica composites. Carbon 2010, 48, 788–796. [Google Scholar] [CrossRef]
  52. Scaife, B.K. Principles of Dielectrics; Clarendon Press: Oxford, UK, 1998. [Google Scholar]
  53. Batoo, K.M. Study of dielectric and impedance properties of Mn ferrites. Phys. B Cond. Matter. 2011, 406, 382–387. [Google Scholar] [CrossRef]
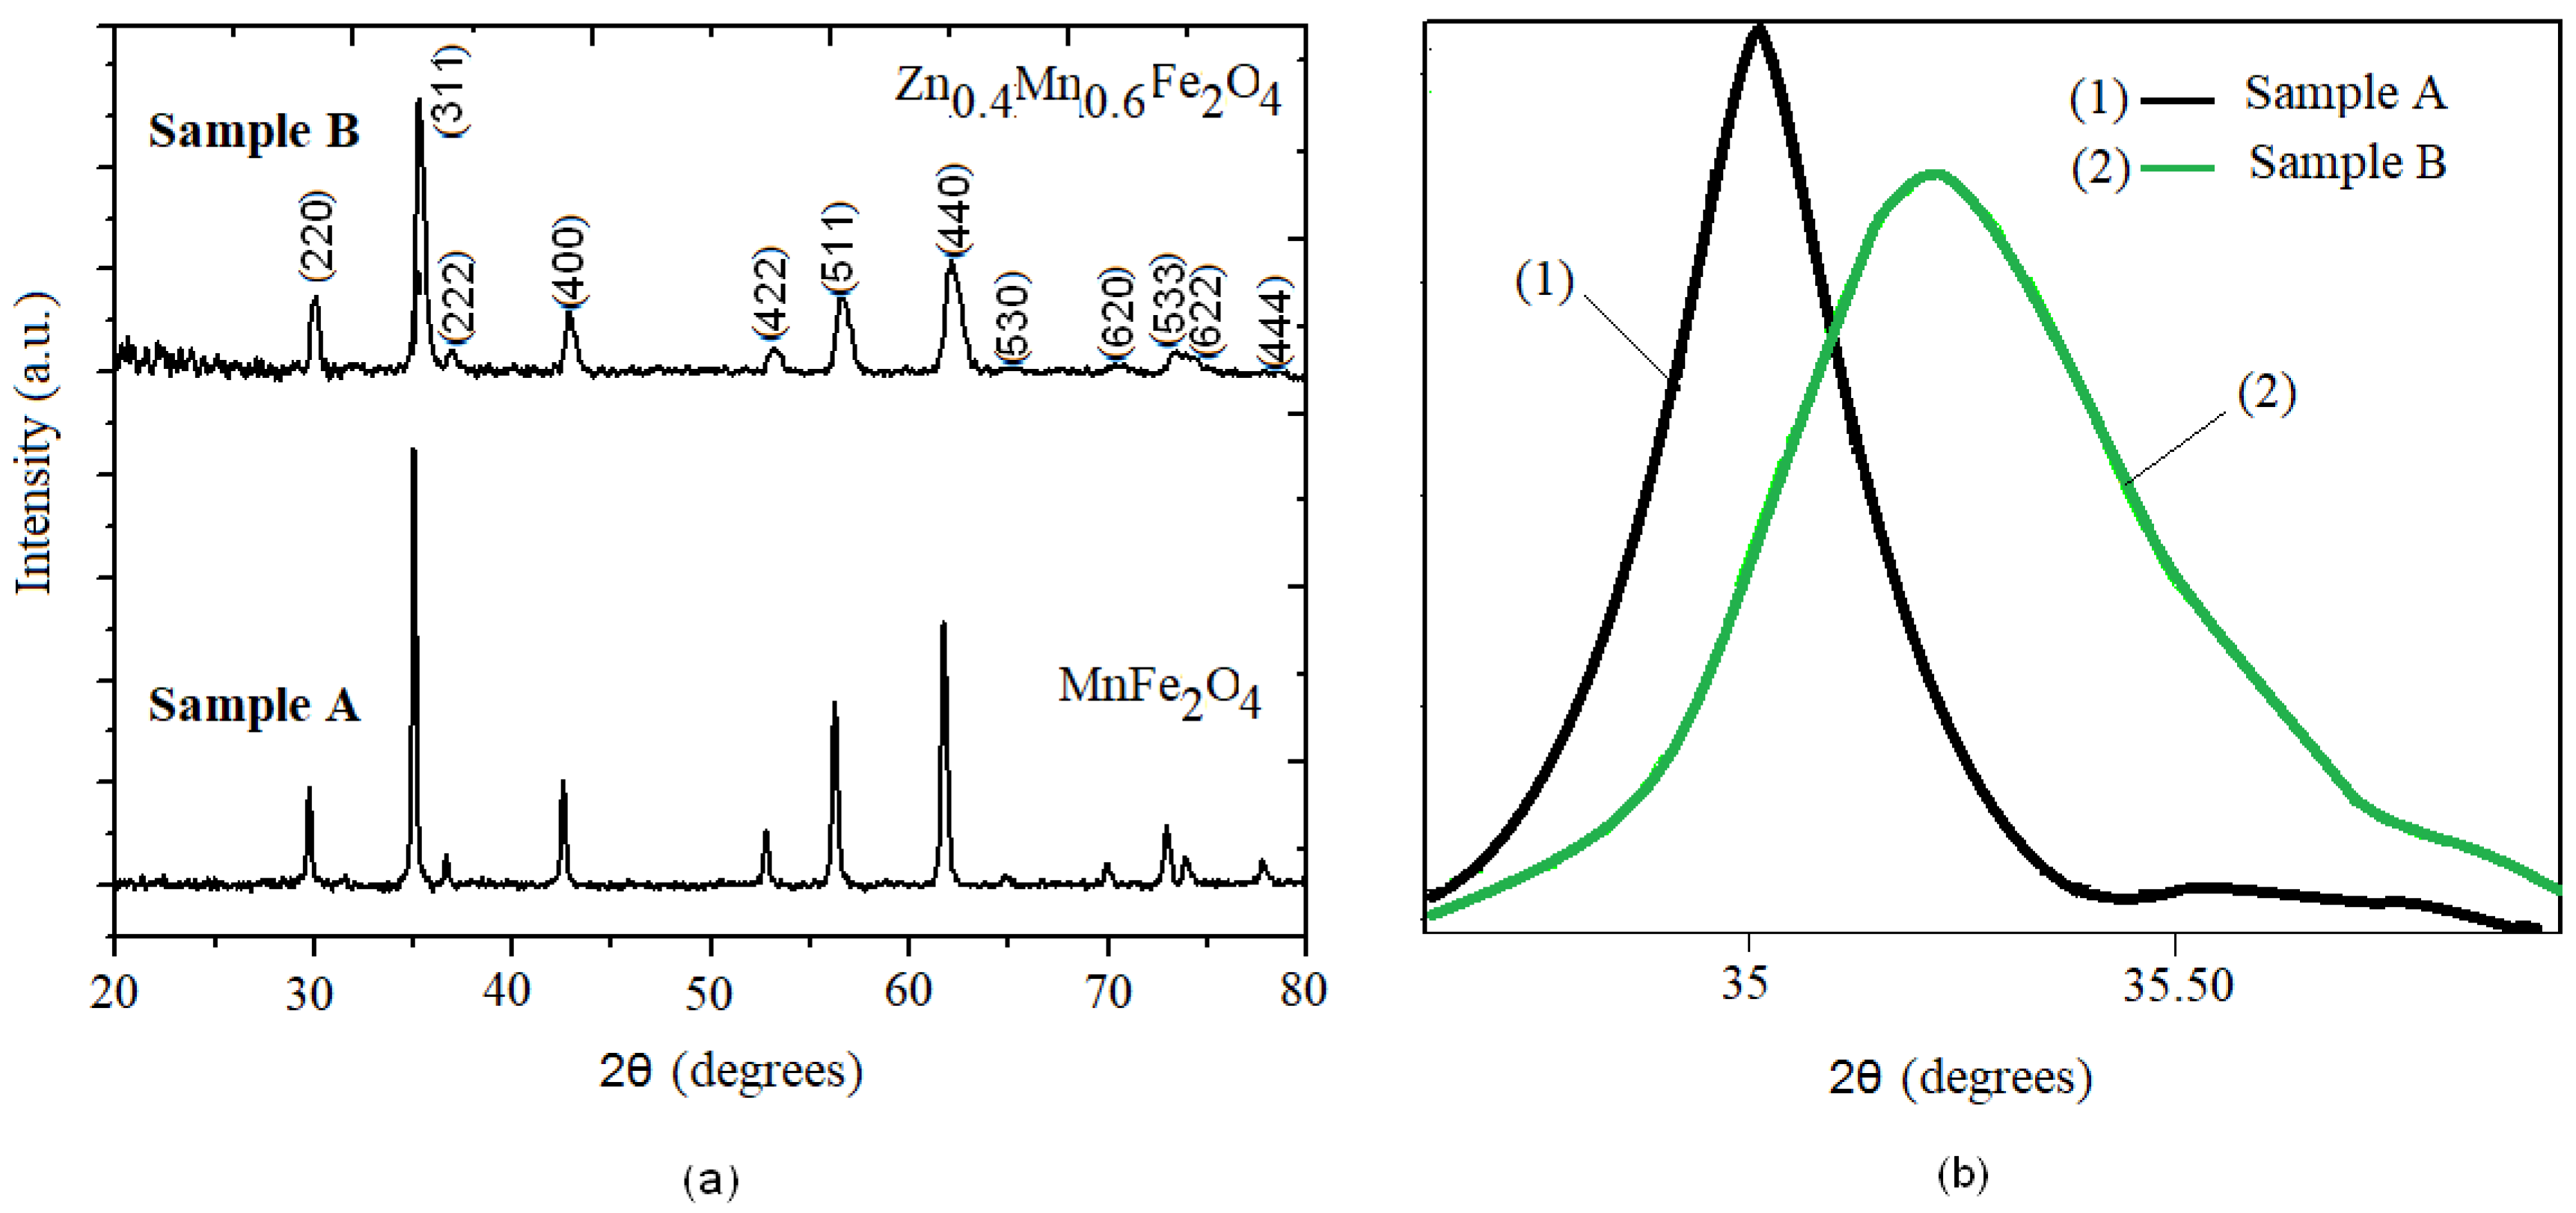
Figure 1. (a) X-ray diffraction patterns of samples A (MnFe2O4) and B (Zn0.4Mn0.6Fe2O4); and (b) diffraction peak (311) for samples A and B.
Crystals 14 00437 g001
Figure 2. FTIR spectra for ZnxMn1-xFe2O4 ferrite samples, with x = 0 (sample A) and x = 0.4 (sample B).
Crystals 14 00437 g002
Figure 3. SEM images for samples A (a) and B (b) and EDX elemental analysis for samples A (c) and B (d).
Crystals 14 00437 g003
Figure 4. Hysteresis curves of the ZnxMn1−xFe2O4 investigated samples: (a) sample A (x = 0) and (b) sample B (x = 0.4).
Crystals 14 00437 g004
Figure 5. Frequency dependence of the Z′ and Z″ components of the complex impedance at different temperatures for (a,b) sample A of MnFe2O4 and (c,d) sample B of Zn0.4Mn0.6Fe2O4.
Crystals 14 00437 g005aCrystals 14 00437 g005b
Figure 6. The ln (τ)(T−1) plots for ZnxMn1−xFe2O4 ferrites: (a) sample A (x = 0) and (b) sample B (x = 0.4).
Crystals 14 00437 g006
Figure 7. The frequency dependence at different temperatures of the (Z′) and (Z″) components of the complex impedance of the ZnxMn1−xFe2O4 samples: (a) x = 0 and (b) x = 0.4.
Crystals 14 00437 g007
Figure 8. Temperature dependence of static conductivity σDC: (a) sample A (MnFe2O4); and (b) sample B (Zn0.4Mn0.6Fe2O4).
Crystals 14 00437 g008
Figure 9. The dependence lnσDC(T−1/4) for (a) sample A (MnFe2O4) and (b) sample B (Zn0.4Mn0.6Fe2O4).
Crystals 14 00437 g009
Figure 10. Temperature dependence of the activation energy for conduction Econd in the case of sample A (a) and sample B (b).
Crystals 14 00437 g010
Figure 11. ln(σAC) dependence on ln(ω) at different temperatures for (a) sample A(MnFe2O4) and (b) sample B (Zn0.4Mn0.6Fe2O4).
Crystals 14 00437 g011
Figure 12. Temperature dependence of the exponent n and the bandgap energy Wm for (a) sample A (MnFe2O4) and (b) sample B (Zn0.4Mn0.6Fe2O4).
Crystals 14 00437 g012
Figure 13. Temperature dependence of the crossover frequency fc = ωc/2π: (a) sample A (MnFe2O4); and (b) sample B (Zn0.4Mn0.6Fe2O4).
Crystals 14 00437 g013
Figure 14. Temperature dependence of the real ε′ and imaginary ε″ components of complex dielectric permittivity at different temperatures for (a,b) sample A of MnFe2O4 and (c,d) sample B of Zn0.4Mn0.6Fe2O4.
Crystals 14 00437 g014
Figure 15. Frequency dependence of the imaginary component ε r e l , due to dielectric relaxation, at different temperatures for (a) sample A and (b) sample B.
Crystals 14 00437 g015
Figure 16. Temperature dependence of the relaxation time τrel due to the dielectric relaxation process.
Crystals 14 00437 g016
Table 1. Computed values of crystallite size and lattice constant for different Zn concentrations x, corresponding to samples A and B.
SamplesZn Concentration (x)Crystallite Size (nm)Lattice Constant (Å)
A (MnFe2O4)0458.498(1)
B (Zn0.4Mn0.6Fe2O4)0.423.98.48(1)
Table 2. Values of the magnetic parameters for the ZnxMn1−xFe2O4 (x = 0 and 0.4) ferrite samples.
Sampleσs [emu/g]Hc [kOe]σr [emu/g]σrs
A (MnFe2O4)58.760.0497.130.121
B (Zn0.4Mn0.6Fe2O4)44.21---
Table 3. Values of the fitting parameters of the experimental dependencies ln(σAC) on ln(ω), from Figure 11, for the ZnxMn1−xFe2O4 (x = 0 and 0.4) ferrite samples.
Sample A Sample B
TA (°C)ln[A0 (S/msn)]nR2TB (°C)ln[A0 (S/msn)]nR2
32−19.971960.750.999532−14.412510.5100.9934
42−19.876590.7450.999444−13.028100.4330.9910
52−19.971920.7490.999550−12.947210.4300.9909
65−20.178970.7600.999560−12.267140.3920.9878
78−19.867040.7420.999576−13.558260.4660.9918
86−19.552690.7240.999583−14.51030.5210.9947
95−19.270130.7070.999495−14.77340.5380.9957
105−19.004020.6910.9993105−15.372150.5740.9971
116−18.778980.6790.9992117−16.309160.6300.99738
127−18.298310.6510.9989128−16.239920.6280.9984
Disclaimer/Publisher’s Note: The statements, opinions and data contained in all publications are solely those of the individual author(s) and contributor(s) and not of MDPI and/or the editor(s). MDPI and/or the editor(s) disclaim responsibility for any injury to people or property resulting from any ideas, methods, instructions or products referred to in the content.