Abstract
This paper presents the effect of the complex strain state resulting from the asymmetric rolling of TRB products on the changes and distribution of the stress state in the material. The evaluation of the stress state in the material was based on measurements of the magnetoelastic parameter (MP) using the Barkhausen magnetic noise method. The key characteristics of the material under study that enabled the use of changes in the MP parameter to assess the stress state were ferromagnetism and a lack of texture. The first of these enabled the detection of the magnetic signals produced when a magnetic field is applied to the material, causing magnetic domains to align and sudden changes in magnetization. On the other hand, the absence of texture in the material precluded the occurrence of magnetocrystalline anisotropy, which could disturb the results of measurements of the magnetoelastic parameter in the material. In order to determine these features in the material under study, its chemical composition was determined, and a phase analysis was carried out using the X-ray diffraction method. The results of these tests showed the possibility of determining the stress state of the material by means of changes in the values of the MP parameter. On this basis, it was shown that in the TRB strips studied, there is a complex state of stress, the values of which and the nature of the changes depending on the direction of the measurements carried out, as well as on the amount of rolling reduction in the studied area of the strip.
1. Introduction
The characteristic feature of Tailored Blanks (TB) is at least one variable, for example, variable thickness, variable properties or different materials (in terms of grade or mechanical properties) on the cross-section of the sheet. On the basis of the type of variable, as well as the technology used to produce them, TB blanks are divided into different subgroups, for example, Tailor Welded Blanks (TWB) or Tailor Rolled Blanks (TRB) [1,2,3,4,5,6,7]. TB blanks are widely used in many industries, such as automotive, aerospace and construction, due to their adaptability to the conditions in which they will operate, thus reducing their weight [8]. Due to the fact that Tailored Blanks are usually semi-finished products from which individual products are then manufactured, deformability is an important issue. This characteristic can be influenced by many factors, such as the state of stress in the material, which, in the case of some TB technologies, significantly affects their formability [9,10].
In this article, the effect of the applied TRB strip-forming technology on the stresses inside the material with a BCC crystal lattice structure was studied. The process studied consisted of rolling using one groove roller and another plain roller. Accordingly, a complex deformation state was introduced into the material, which resulted from variations in the amount of plastic strain across the cross-section of the TRB strips, as well as related differences in material elongation and strip curvature. In addition, intentional and controlled asymmetry was introduced into the rolling process, the source of which can be a variation in the diameter or speed of the rolls, a variation in the value of the friction coefficients, as well as a change in the angle of feed [11,12,13,14]. Asymmetry in the rolling process introduces additional shear stresses into the material, which result in reduced forces during rolling, increased rolling reduction in one rolling pass, as well as the curvature of the strip in the longitudinal direction to the rolling direction [15,16,17,18,19,20,21]. During the conducted tests, asymmetry resulting from different rolling speeds and from the variation of the friction coefficients between the rolls was introduced. This asymmetry, together with the complex state of deformation resulting from the use of a groove roller, contributes to the formation of a complex and difficult-to-determine state of stress in the tested material. Therefore, in order to determine the complexity and changes in the stress state, the magnetoelastic parameter MP was measured, which was possible due to the ferromagnetic characteristics of the material under study.
The MP parameter was measured using Barkhausen noise analysis in the surface layer of the material in the longitudinal and transverse directions. This technique takes advantage of a physical phenomenon that occurs in ferromagnetic materials during their remagnetization. An external magnetic field induces in the material a change in the orientation of magnetic domains and a stepwise movement of their boundaries (domain walls), thus affecting the overall magnetization of the sample. Changes in such magnetization can be detected using a measuring coil (made of conductive material) in the form of magnetic pulses. The intensity of this phenomenon depends on a number of factors, which include the chemical composition of the material, the state of internal stress, the microstructural structure, as well as the degree of magnetization of the material [22,23,24].
2. Materials and Methods
The tested TRB strips were produced from an iron alloy with a BCC crystalline matrix structure, the chemical composition of which is shown in Table 1. The chemical composition of the material was taken from the certificate enclosed from the manufacturer (U. S. Steel Košice, s.r.o., Košice, Slovak Republic). Specimens with dimensions of 2 mm × 50 mm × 100 mm (thickness, width and length) were prepared for testing. The tests were carried out on a WD-2 rolling mill of the DUO type (INOP, Poznań, Poland) which is on the equipment of Łukasiewicz Research Network—Poznań Institute of Technology.

Table 1.
Chemical composition of the tested iron alloy.
The chemical composition of the test material shows that it was a commercial structural steel, characterized by a low carbon content and alloying additives. These values indicate that the main structural component of the tested steel is a phase with a BCC crystalline structure. To confirm this assumption, a diffraction phase analysis of the studied alloy was carried out.
2.1. X-ray Diffraction
Diffraction studies were performed on a D500 diffractometer from Siemens corporation (Siemens, Munich, Germany) equipped with a monochromator using copper anode lamp radiation (CuKα = 0.154 nm). Measurements were performed in the angular range 2θ = 40–120° in step mode with a step of Δ2θ = 0.04 and an exposure time per step of 10 s. The phase analysis was performed using PDF (powder diffraction file) patterns from the ICDD (The International Center for Diffraction Data) database. A line profile analysis was also carried out. The obtained parameters made it possible to determine the lattice cell parameter (a0) and texture coefficient (TC).
The obtained results of the diffraction analysis were used to determine of the cell parameter (a0) using the line relationship a = f(N−R) + a0, where (N−R) is the value of the most frequently used Nelson–Riley extrapolation function calculated from formula [25]:
where θ is the value of the measured Bragg angle for a given hkl plane. Extrapolating functions are used due to the impossibility of making measurements at an angle of θ = 90°, which guarantees the least error in determining the network parameter. Due to hardware reasons, it is not possible to register a beam diffracted at an angle greater than 82°, which is a result of their construction and the inability to overlap the position of the radiation source (lamp) and the counter.
In order to determine the presence of texture in the material, which could disturb the results of measurements of the magnetoelastic parameter using the Barkhausen magnetic noise method, the values of the texture coefficient (TC) were determined for each crystallographic direction. For this purpose, the following formula was used [26]:
where I(hkl)measured the intensity diffraction line hkl, I0(hkl) is the hkl intensity diffraction line of a reference material taken from the ICDD database and n is the number of reflections taken into account.
2.2. Barkhausen Noise Test for Output Sample
A Stresscan 500C device (STRESSTECH OY, Jyväskylä, Finland) was used to measure Barkhausen magnetic noise. The device allows the measurement of the noise level expressed as a magnetoelastic parameter (MP). During the tests, the magnetization was set at 90 and the stress level was analyzed in a layer with a nominal thickness of 0.2 mm. Measurements were made at the intersection points of 3 longitudinal lines (A, B and C), with 11 transverse lines. At each of these points, measurements were taken in the direction parallel to the longitudinal lines (MP║), as well as in the direction perpendicular to them (MPꓕ).
2.3. Material Deformation Methodology
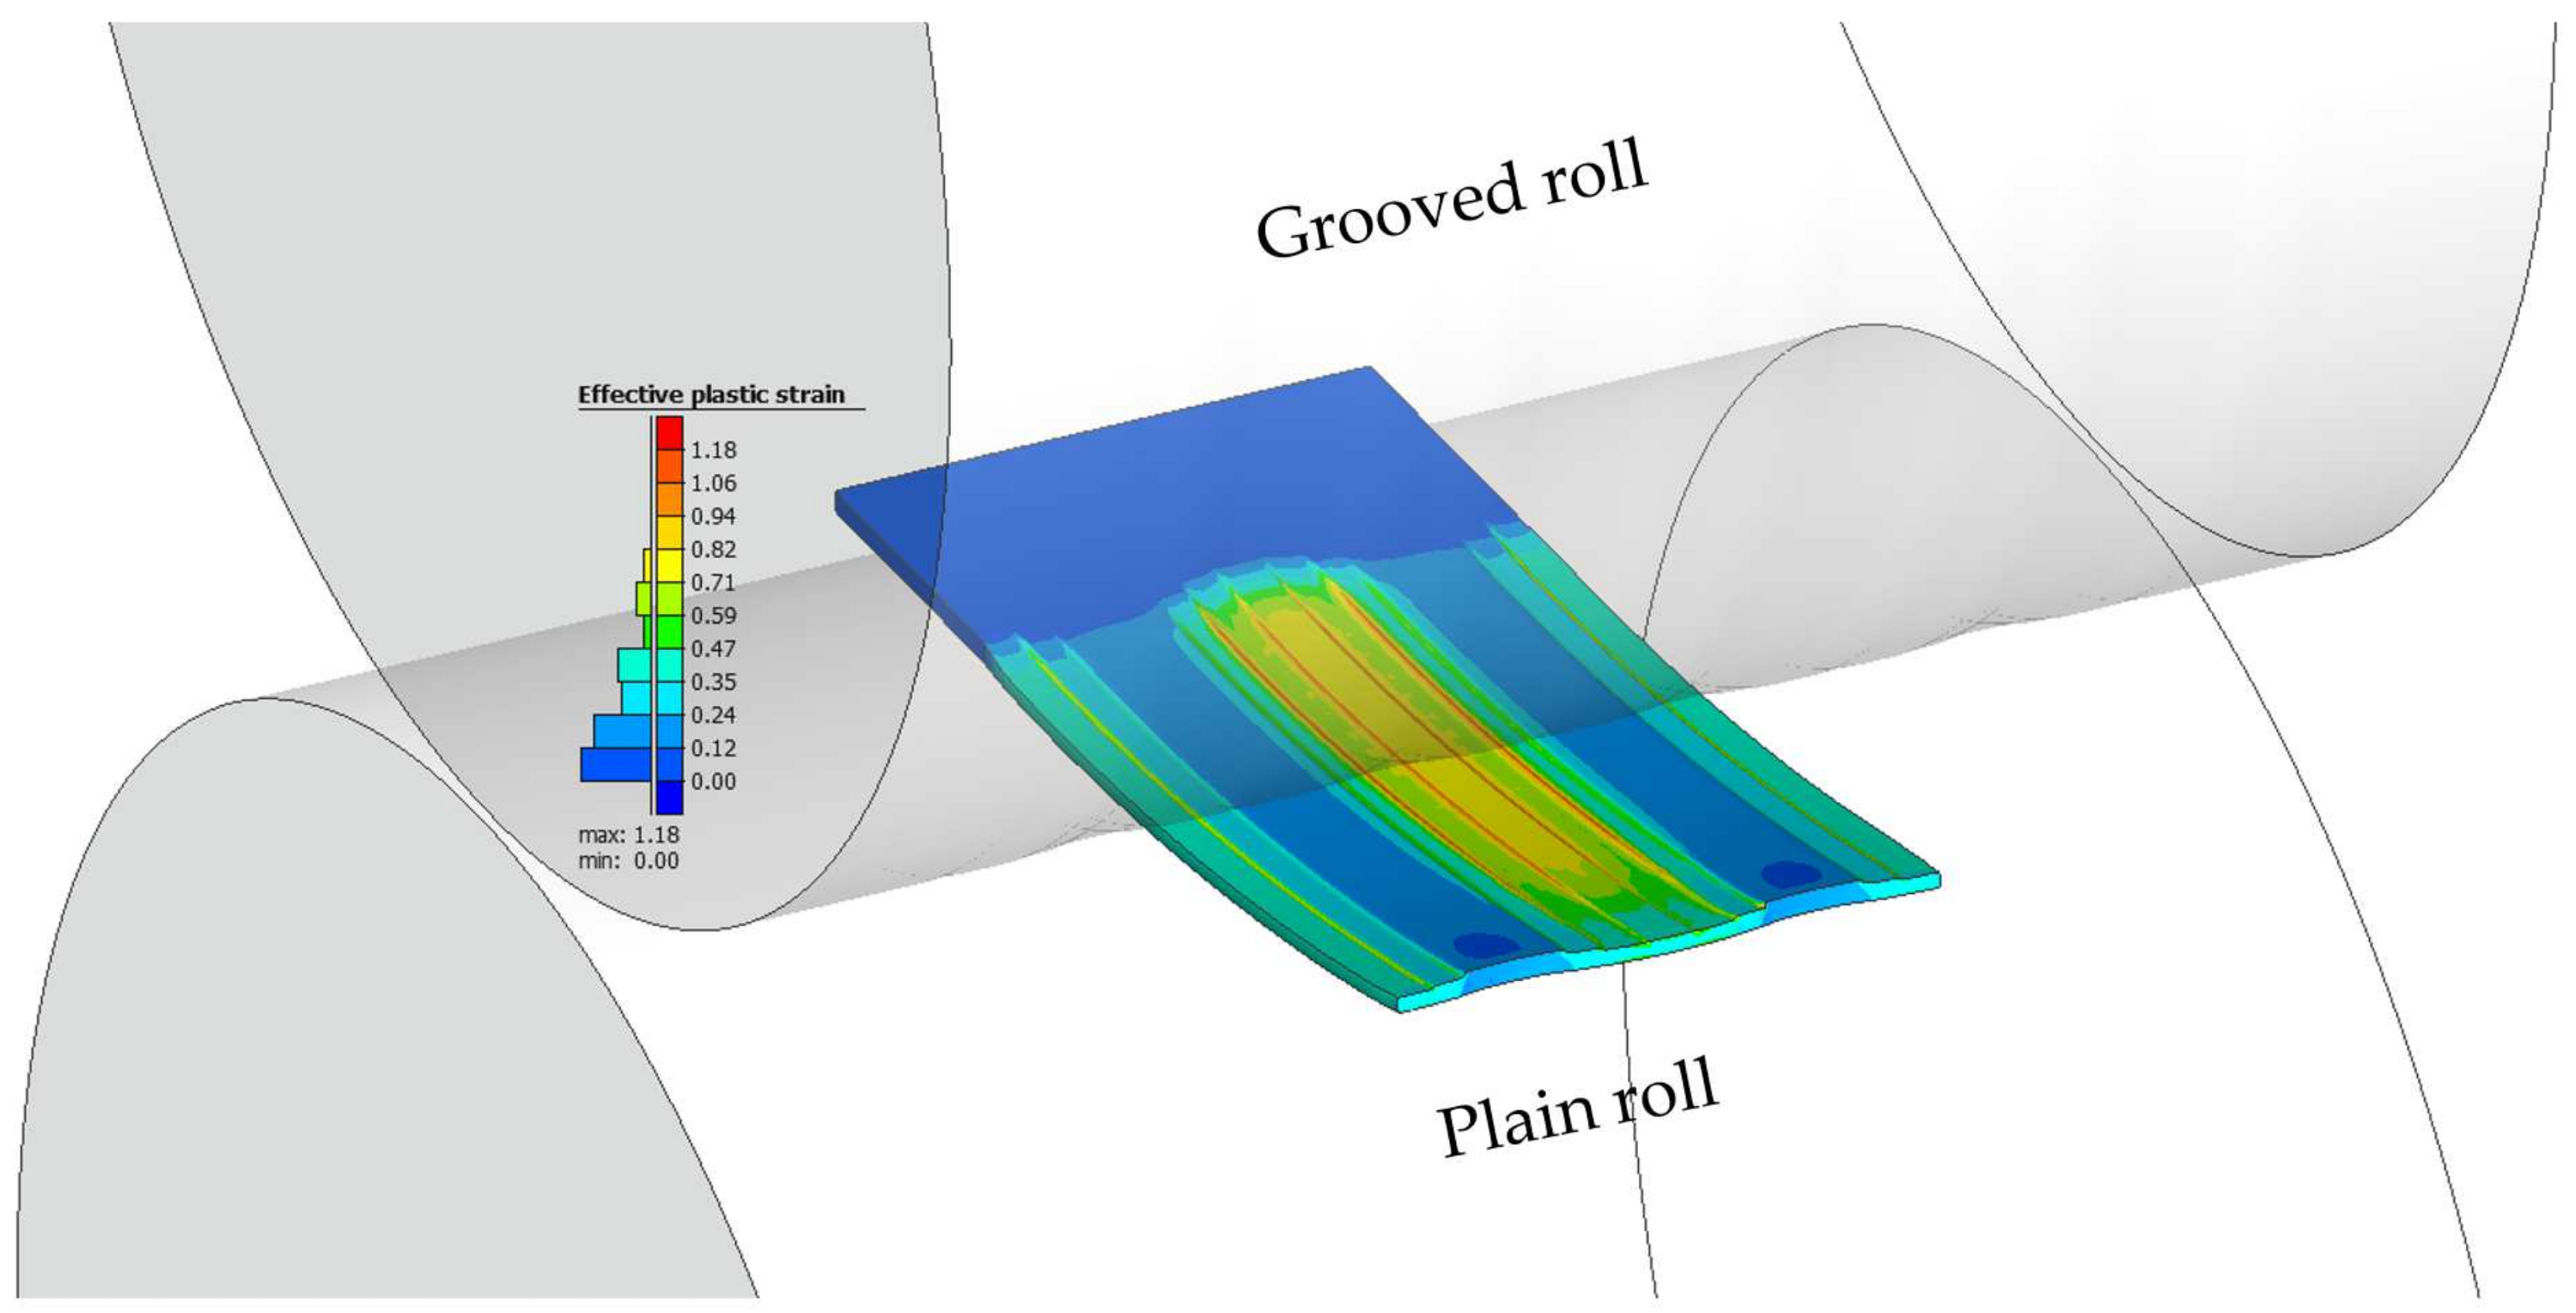
A complex state of stress was then introduced in the material under study using rolling technology with one groove roller and another plain roller (Figure 1).

Figure 1.
Rolling process using a set of rollers consisting of an upper groove roller and a lower plain roller. Simulation results in Simufact Forming v2022.0.0.1660681792 software (MSC Software Corporation, Newport Beach, CA, USA).
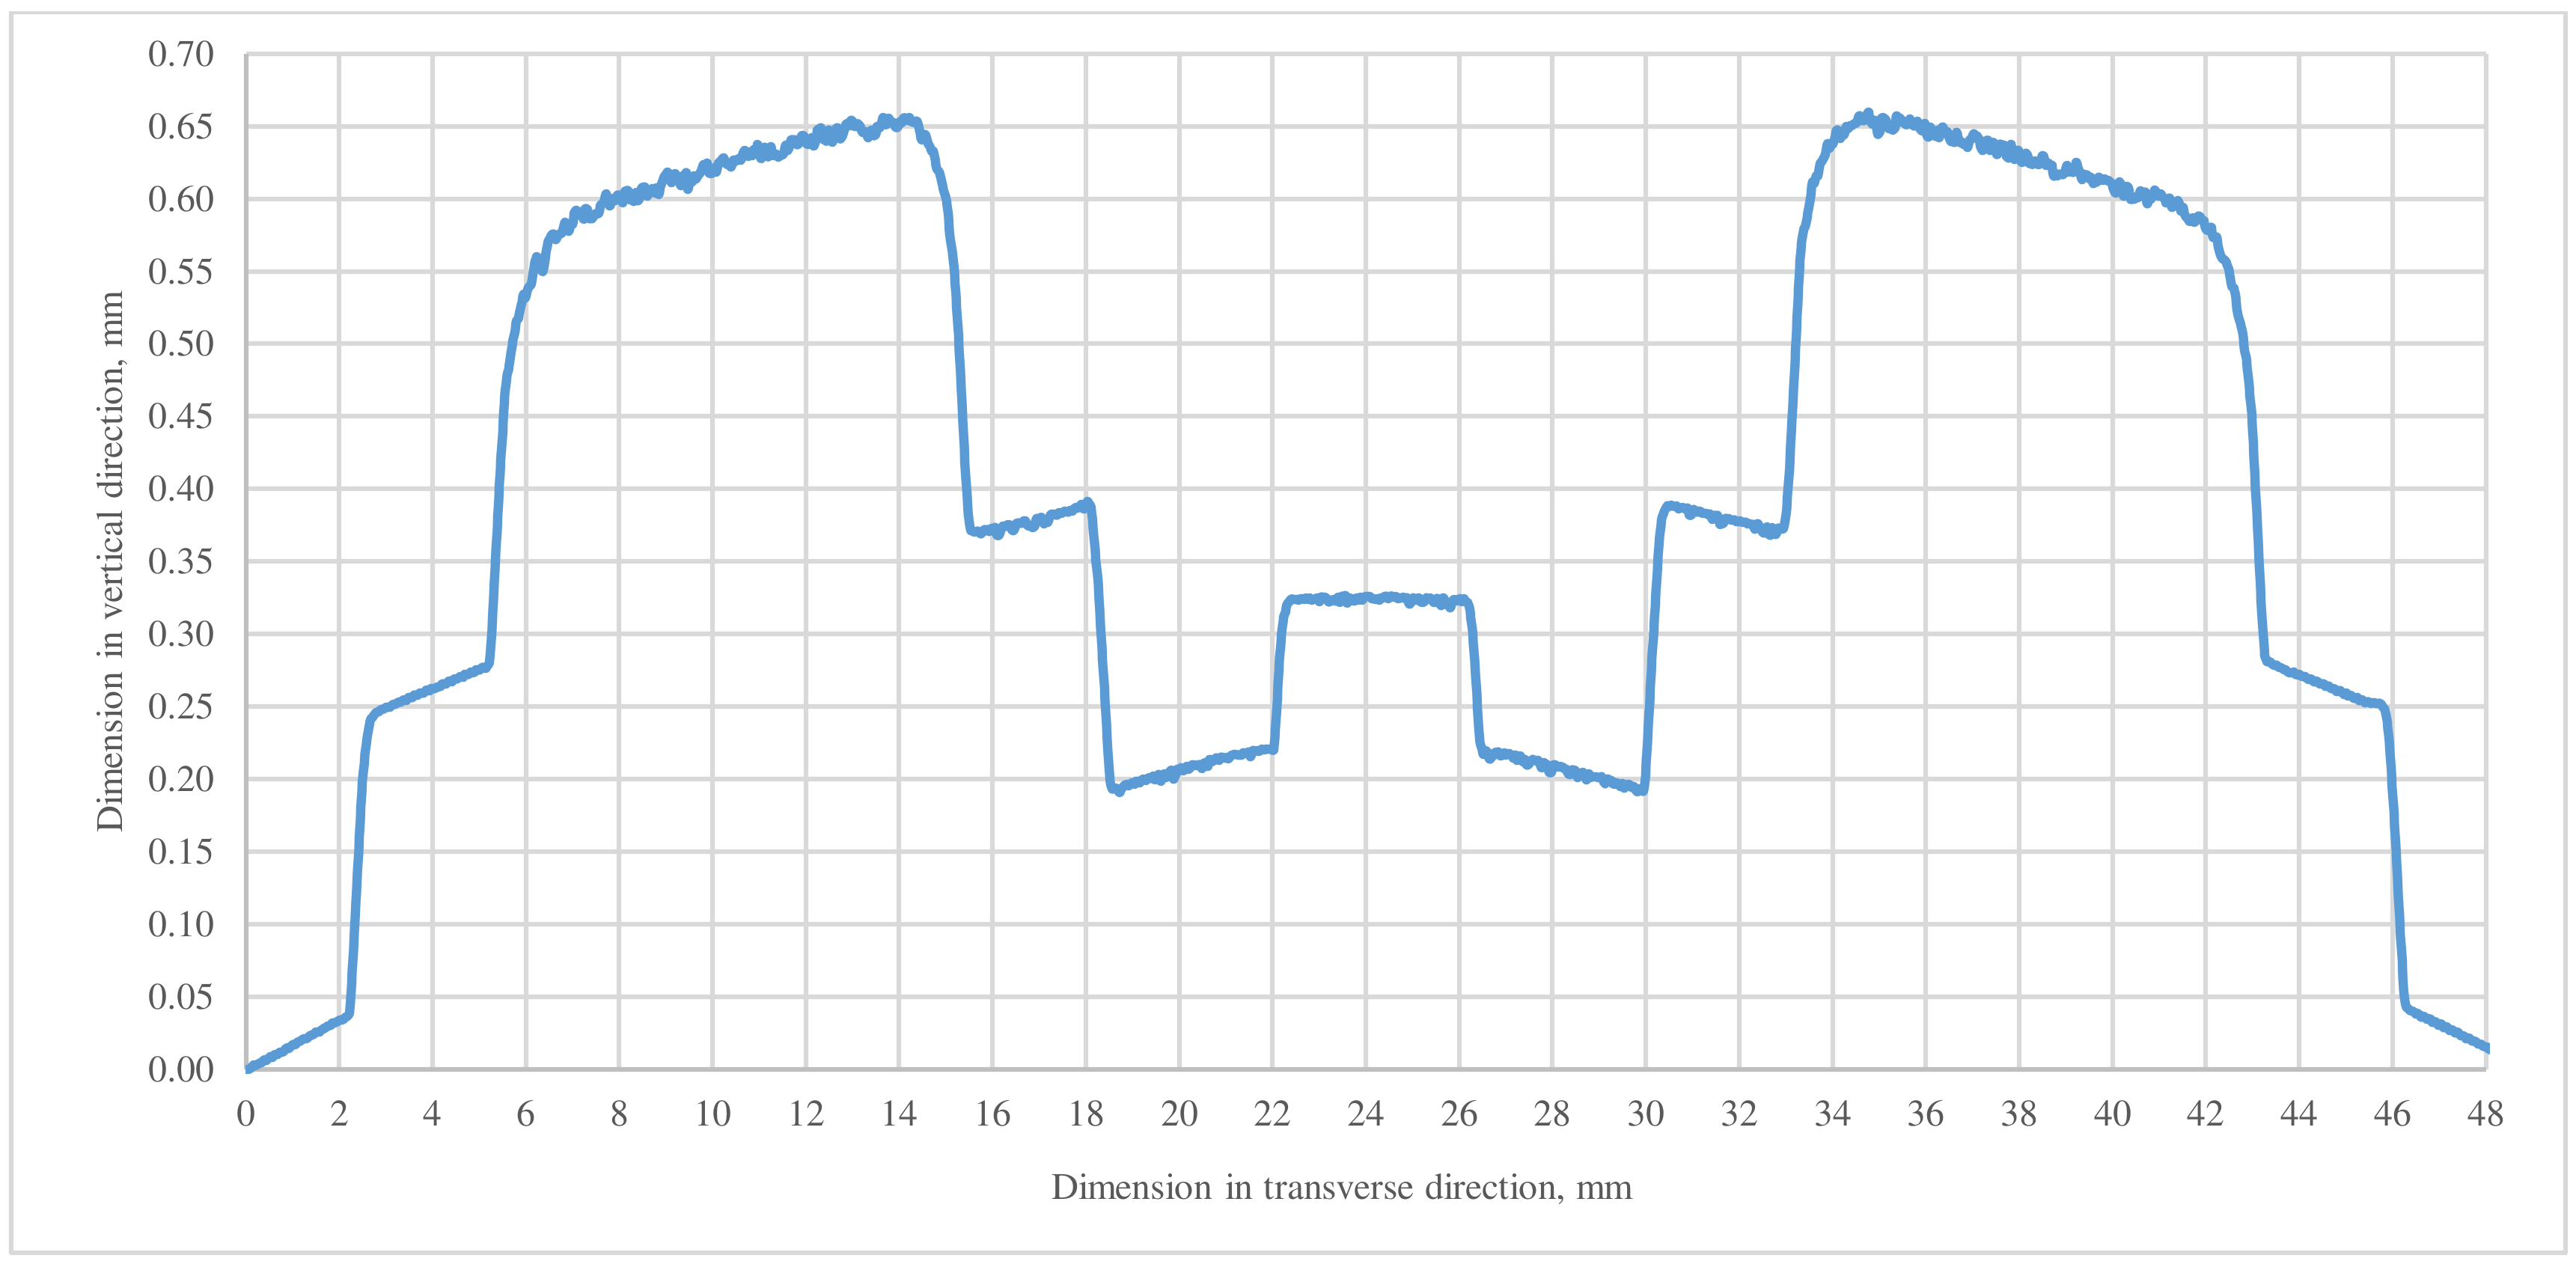
As a result of using such a set of rolls in the material, a differentiated state of deformation was introduced on the cross-section of the strip, as well as between the two parts of the strip relative to the longitudinal plane to the rolling directions. The rolling gap was set so that the value of relative deformation was consistent with theoretical values (Figure 2).
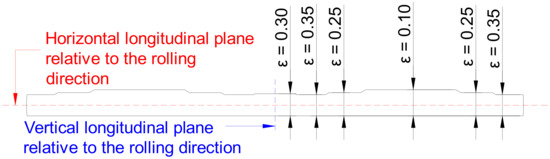
Figure 2.
Cross section of the strip after rolling with one groove roller. The value ε denotes the value of relative strain in a given area of the strip. The strain values are symmetrical with regards to the vertical, longitudinal plane.
The introduced deformations in the material contributed to a complex stress state, which included compressive stresses caused by plastic deformation, tensile stresses resulting from the material flowing in the direction longitudinal to the rolling direction and compressive or tensile stresses (depending on the strip surface under test) resulting from the curvature of the strip in the direction of the groove roll.
Studies for all samples were conducted with an unchanged rolling gap and unchanged strain differences between different areas of the strip (the shape of the groove roller did not change). However, the variable parameter during the rolling tests conducted was the asymmetry of the process and its magnitude.
Asymmetry in the rolling process causes the neutral points to move relative to each other, resulting in a deformation state in the material consisting of a plane strain state and simple shear in the rolling direction. In the course of the present study, asymmetry due to differences in the speed of the rolls and asymmetry due to variations in the friction conditions between the rolls were introduced into the process.
Velocity asymmetry was introduced by reducing the speed of the upper roll by 7%, while keeping the speed of the lower roll Vl = 50 mm/s constant. The value of the analysed asymmetry was due to the limitations of the WD-2 laboratory mill and at the time of the tests, it was the highest possible speed difference that could be introduced. The value of the coefficient of this asymmetry took 0.93 and 1.00 and was calculated from the formula:
where Vu is the speed of the upper roll and Vl is the speed of the lower roll. On the other hand, the asymmetry of the coefficient of friction was introduced by lubricating one of the rolls (lower or upper) with Somentor EH 45 rolling oil (Exxon Mobil Corporation, Irving, TX, USA). During the tests, oil was applied to the entire surface on a specific side of the sample using a brush. The weight of the oil applied per sample was about 0.4 g. The values of the coefficients of asymmetry of friction taken were 0.2, 1.0 and 5.4 and were calculated from the formula:
where µu is the friction coefficient on the upper roll and µl is the friction coefficient on the lower roll. The asymmetry combinations used and the number of tests performed, along with the determinations for each variant tested, are shown in Table 2.
Table 2.
Table of studies with designations of tested variants.
Based on the test table, the following variants can be determined:
- A—rolling process without asymmetry;
- B—rolling process with speed asymmetry (upper roller speed lower by 7%);
- C—rolling process with friction coefficient asymmetry (lubricated upper roll);
- D—rolling process with friction coefficient asymmetry (lubricated lower roll);
- E—rolling process with combined asymmetry (lubricated upper roll along with reduction in the speed of the upper roll by 7%);
- F—rolling process with combined asymmetry (lubricated lower roll along with lowering the speed of the upper roll by 7%).
The complex state of deformation caused by asymmetry contributes to, among other things, the force drop during the rolling process. Within the framework of the present work, due to the use of different types of asymmetries, their different magnitudes and combination, the magnitude of the force drop was simultaneously considered as the magnitude of the asymmetry. The forces during rolling were taken directly from tensometer sensors placed under the lower roll.
In addition, asymmetry during rolling significantly affects the direction and magnitude of the curvature of the strip after rolling [27,28,29,30]. Due to the potential influence of the amount of curvature on the stresses within the material, the longitudinal curvature of the strip after rolling was also measured. For this purpose, laser scans were conducted from the smooth side of the strips. Radii were measured from circles fitted using the Gaussian method. Then, based on the measured radii, curvature values were calculated using the formula:
where R is the radius expressed in meters.
2.4. Methods for Measuring the Effect of Variable Strain and the Amount of Asymmetry on Changes in Elongation and Transverse Shape of TRB Strips
Varying plastic strains on the cross-section of the strips results in variations in the elongation of different areas of the material. In addition, the asymmetry introduced into the process causes an increase in the magnitude of the plastic strain in one rolling pass, which in turn can increase these differences. Differences in material elongation and their magnitude can affect changes in the stress state of the material.
In order to measure the differences in material elongation at the entrance and exit of the samples after rolling, measurements were taken, using a Keyence VHX-7000 light microscope (Keyence, Mechelen, Belgium). Then, using the microscope’s built-in software, the distances between the most elongated areas and the line of the smallest outflow were measured. An example strip, with measurements of material elongation differences, is shown in Figure 3.
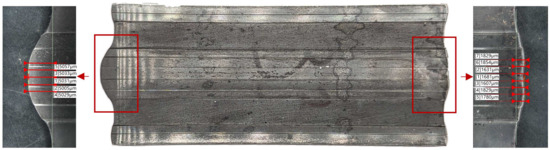
Figure 3.
Example of the result of the discharge measurement for TRB strip.
In addition, the shape of the TRB strips was measured in the direction transverse to the rolling direction. The purpose of this study was also to check the occurrence of shape changes that could affect the stress state of the strips. For this purpose, measurements were made with a Mitutoyo Formtracer Avant FTA-H8 D4000-D contourgraph equipped with a C-4500 measuring head (Mitutoyo, Kawasakaki, Japan). The contour measurement was made on the shaped side of the strip. An example of the obtained contour is shown in Figure 4.
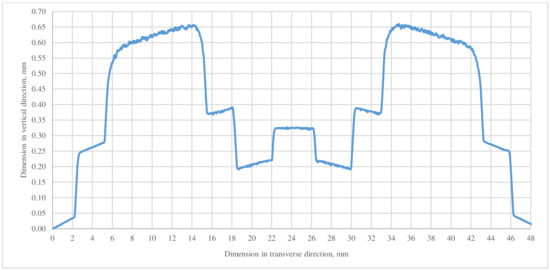
Figure 4.
Shape of TRB strip rolled without asymmetry on the side with a variable shape.
Using the point lines obtained from the measurements, the roundness of the profile in the transverse direction was measured based on the circle fitted by the Chebyshev method.
3. Results and Discussion
3.1. Results of Material Texture Analysis
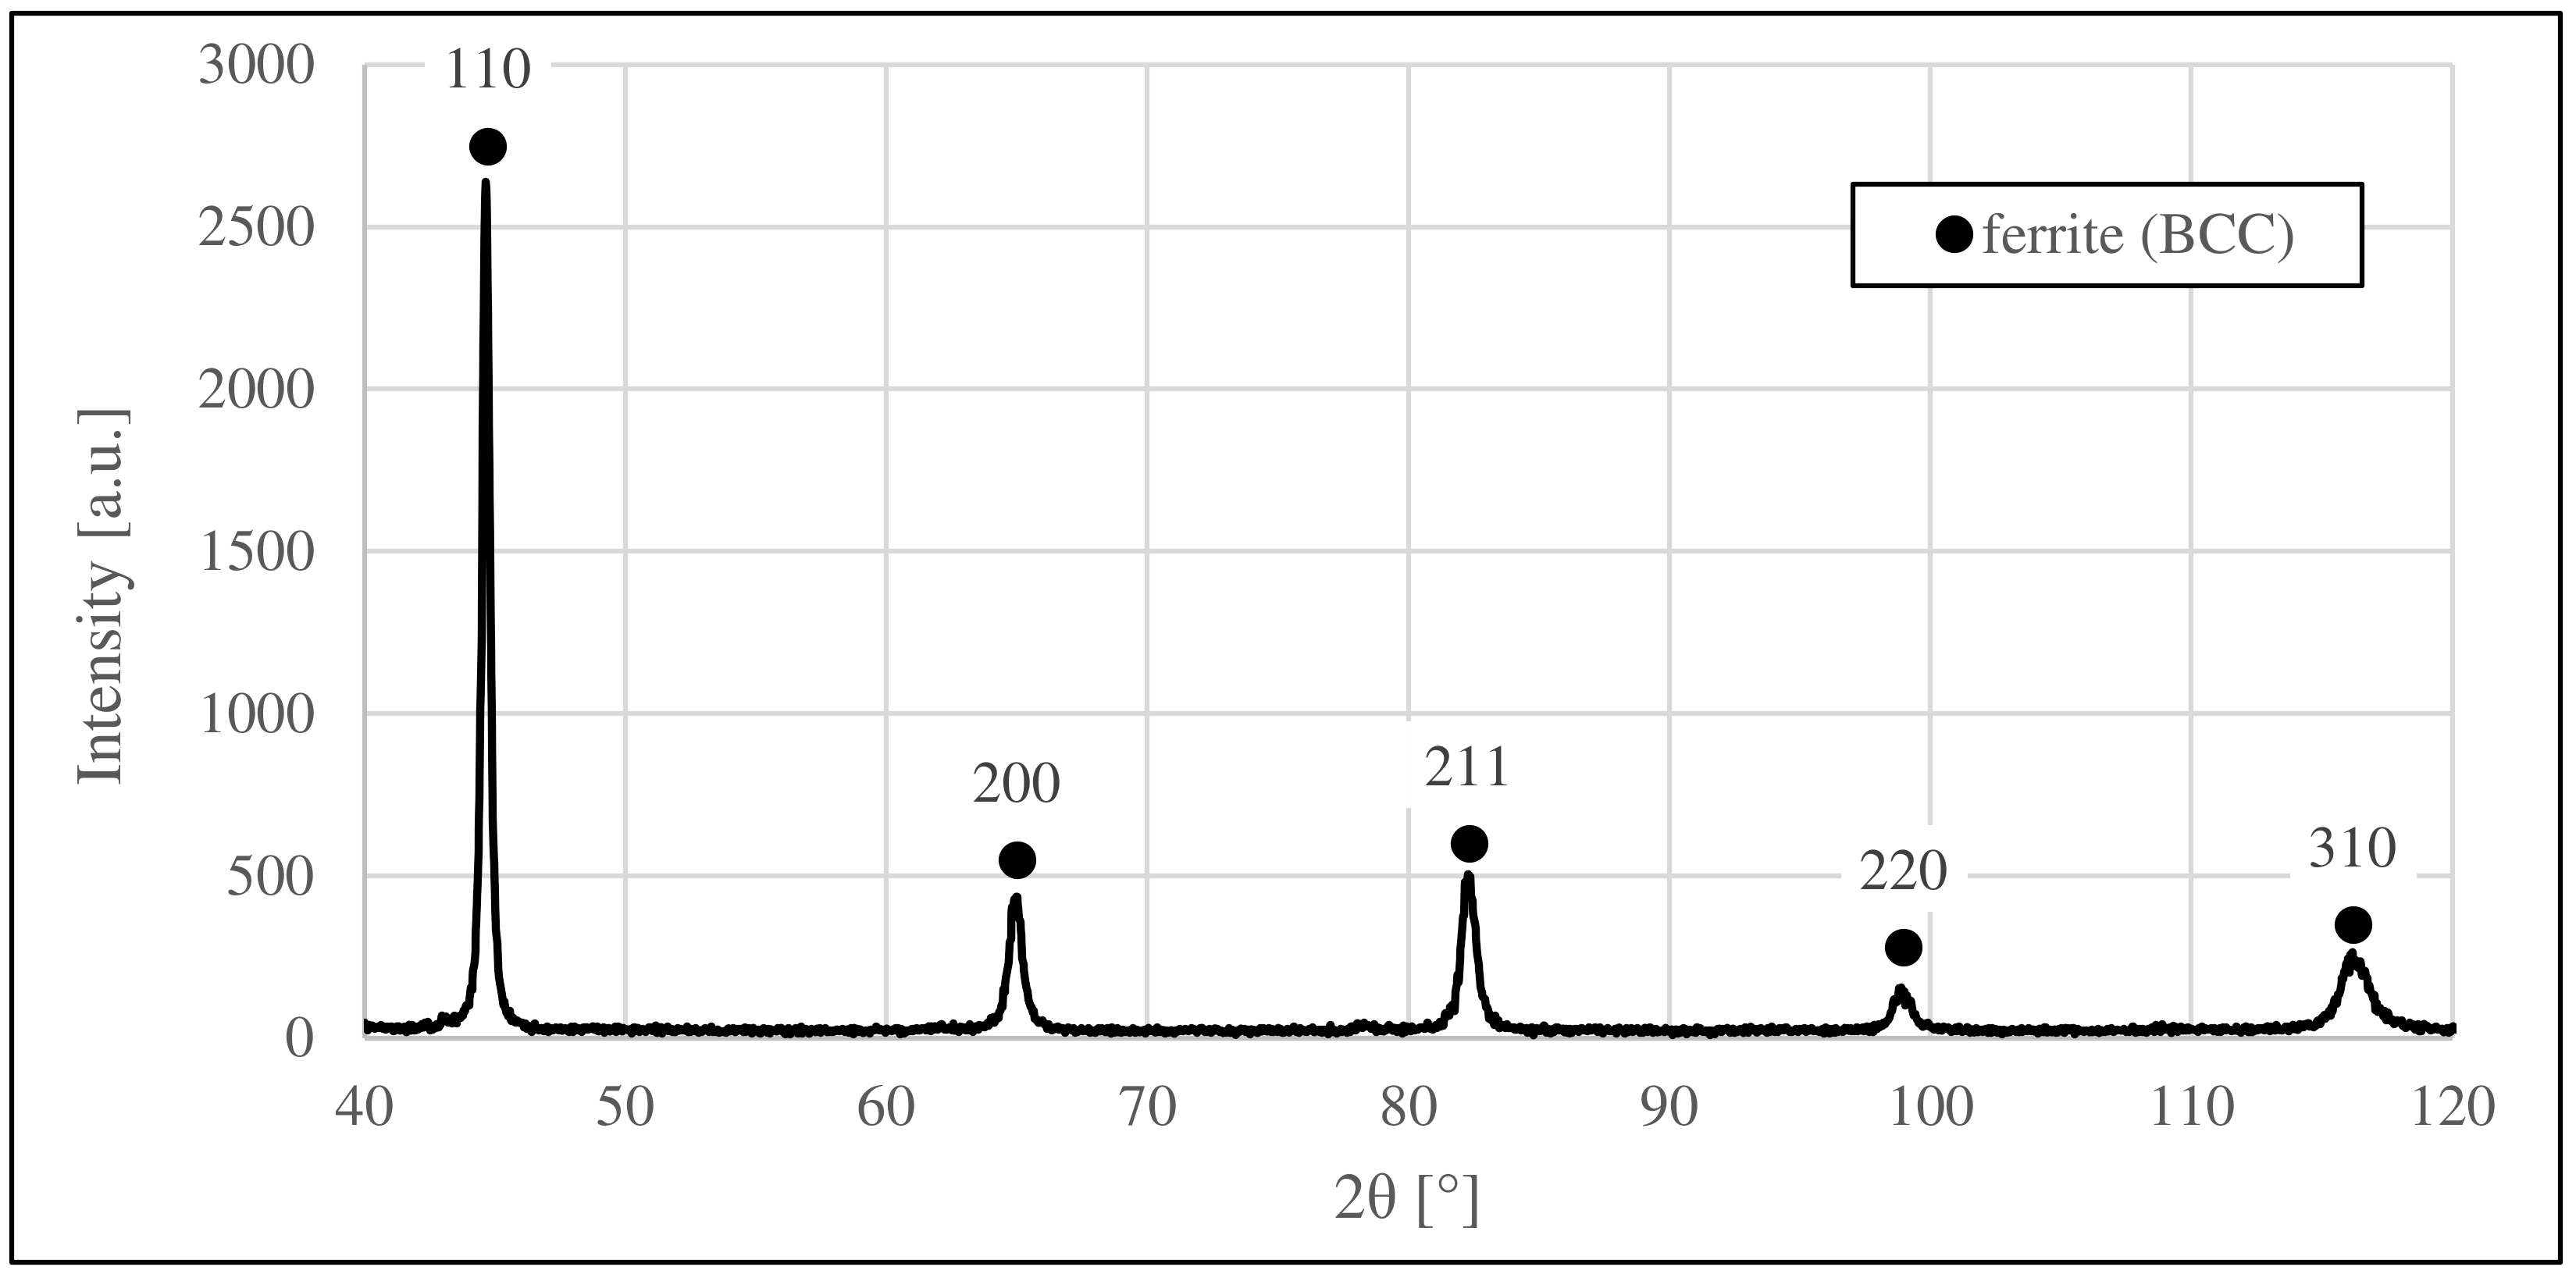
The result of the diffraction analysis performed for the test material is shown in Figure 5.

Figure 5.
X-ray diffraction pattern for analyzed steel.
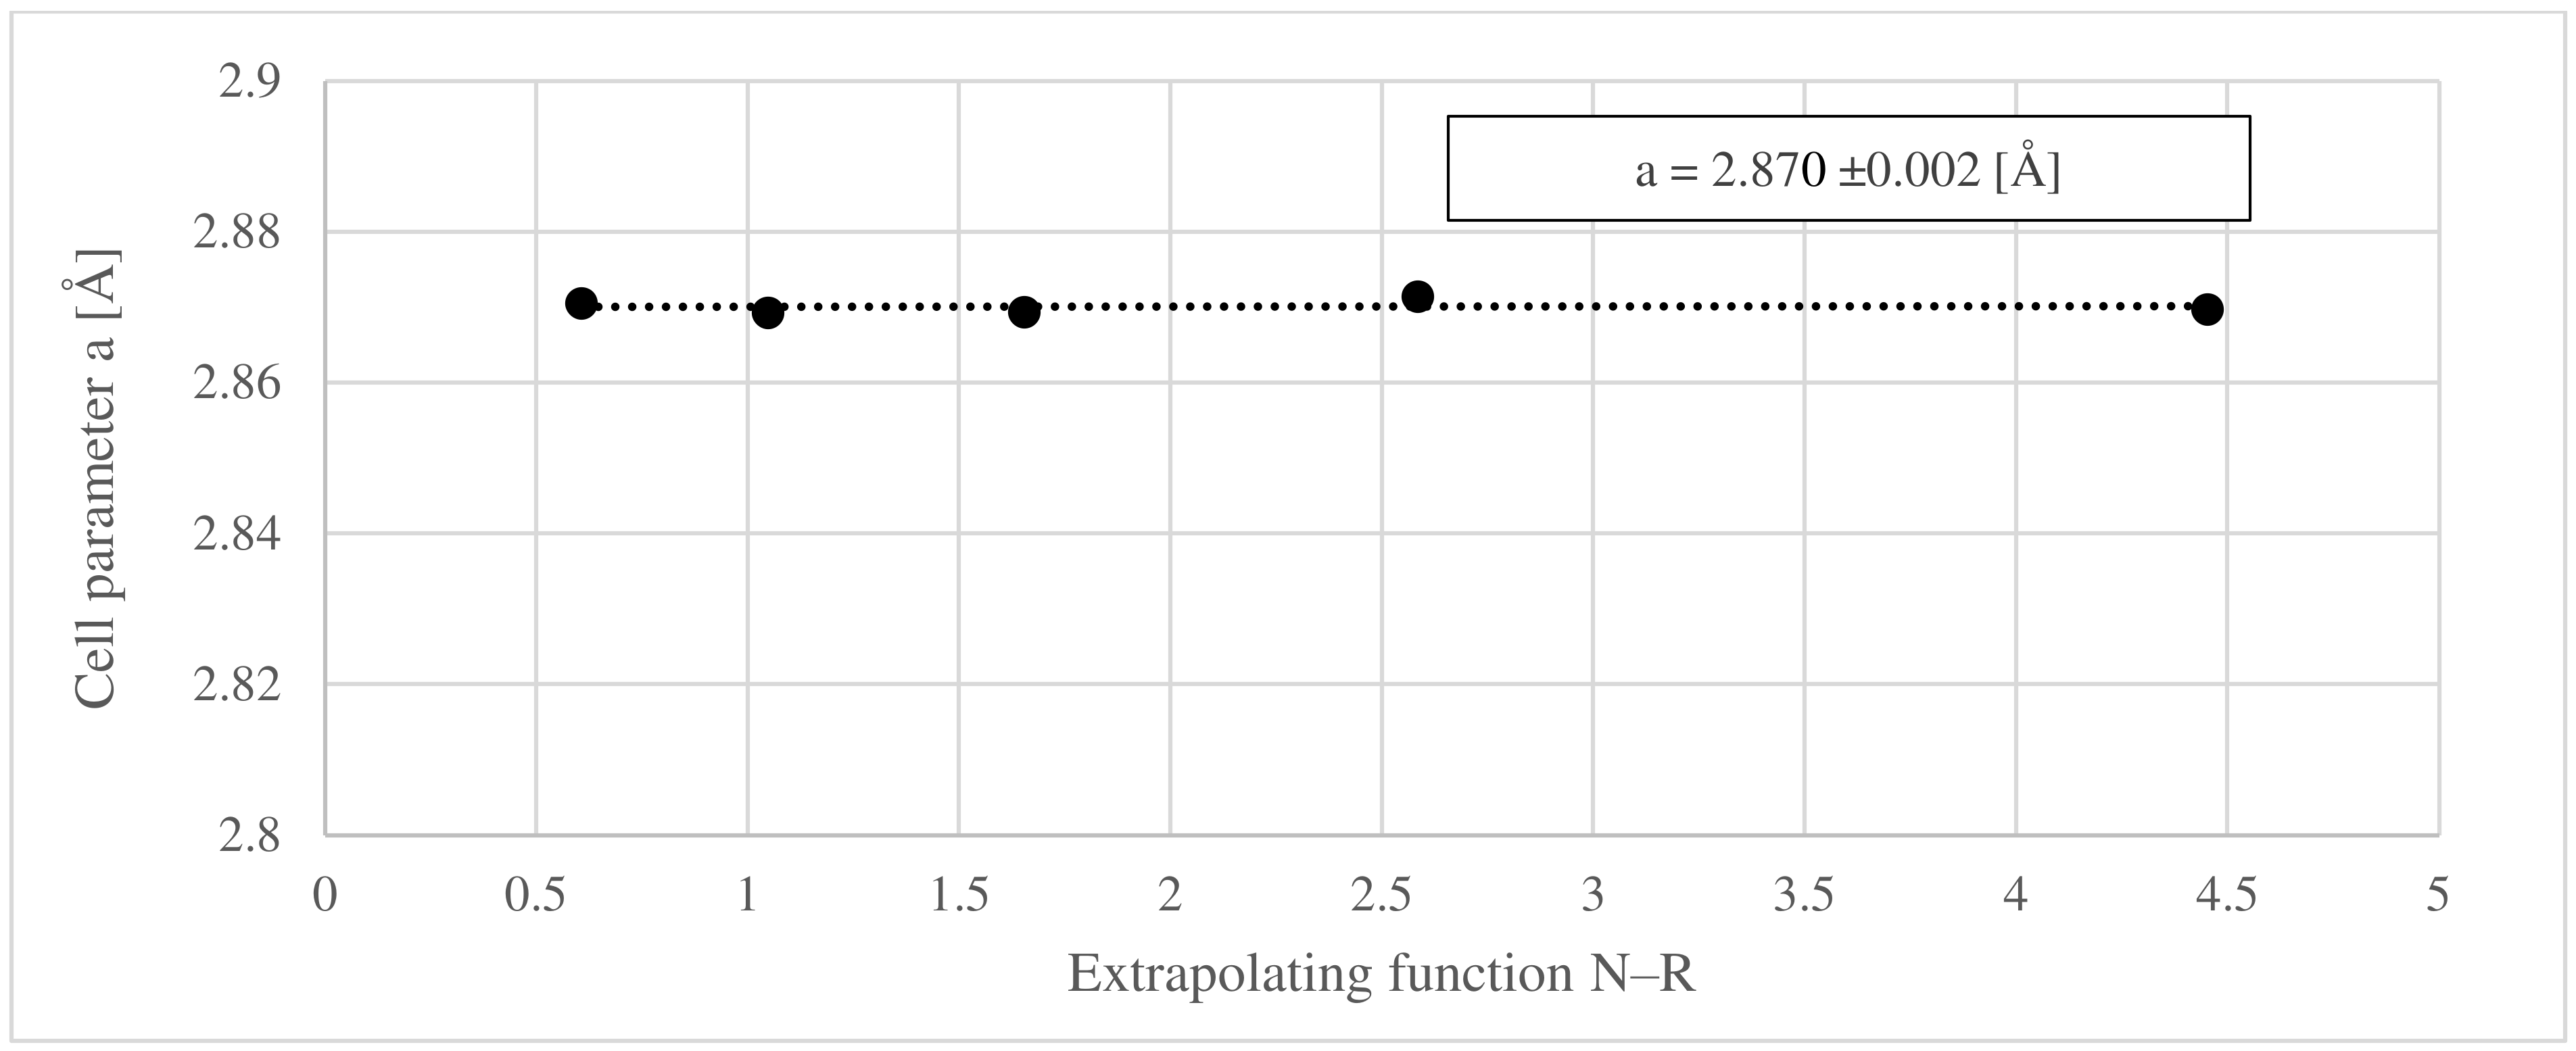
On the basis of the results obtained, the parameter of the lattice cell was determined, whose value was a = 2.870 ± 0.002 [Å]. The results of the lattice cell parameter depending on the extrapolation of the Nelson–Riley function are shown in Figure 6.

Figure 6.
Determination of lattice cell parameter a in Angstrom (10−10 m).
Then, based on the diffraction analysis, the diffraction intensity values for the material under study were measured and compared with standard values. A summary of the intensity values for a given crystallographic plane is shown in Table 3. The results were then used to study the texture of the material. The texture of the material was characterized using the texture coefficient (TC), determined according to the formula [26]:
Table 3.
List of texturing indicators for each hkl.
Analyzing the obtained indicators of texture and referring to the literature data [30], it can be concluded that the studied material does not show strong texture. Small deviations in individual indices from the standard values are visible, but they are not high enough to indicate the presence of texturing in a given crystallographic plane. It is significant that in the case of the <200> plane, which is a plane of easy magnetization, the occurrence of texture was not proved (the value of the TC coefficient is 1.05). Therefore, when measuring the MP parameter, its results will not be affected by the effect of magneto-crystalline anisotropy. This means that when the magnetoelastic parameter is measured using the Barkhausen noise method, changes in the value of the MP parameter will be mainly due to the state of stress in the material and not due to its texture.
3.2. Results of Magnetoelastic Parameter Measurements Using Barkhausen Magnetic Noise in the Testing Material
The obtained measurements of the MP parameter in the longitudinal direction and transverse to the rolling direction over the width and length of the test input sample are shown in Table 4.
Table 4.
Measurement results of the MP parameter for the undeformed (input) sample. ꓕ lines mean transverse measuring lines, ║ lines mean longitudinal measurement lines.
Analyzing the results of measuring the MP parameter for the input sample, one can see a variation in the measured values, depending on the direction of the measurement. Due to the lack of texture shown earlier, it should be concluded that these differences are due to variations in the stress state of the material. The value of the MP parameter, regardless of the longitudinal line of measurement (A, B or C), oscillates around 30 in the longitudinal direction, while in the transverse direction, it oscillates around 90. The differences in the values of the MP parameter may indicate that in the longitudinal direction there was a crystallographic direction of difficult magnetization <111>, while in the transverse direction there was easy magnetization <200>. However, due to the lack of texture, this most likely indicates that there was a higher proportion of compressive stress in the longitudinal direction and a proportion of tensile stress in the transverse direction.
3.3. The Effect of the Introduced Strain Variables and the Magnitude of Asymmetry on the Variation of Material Elongation, as well as Changes in the Magnitude of Rolling Reduction
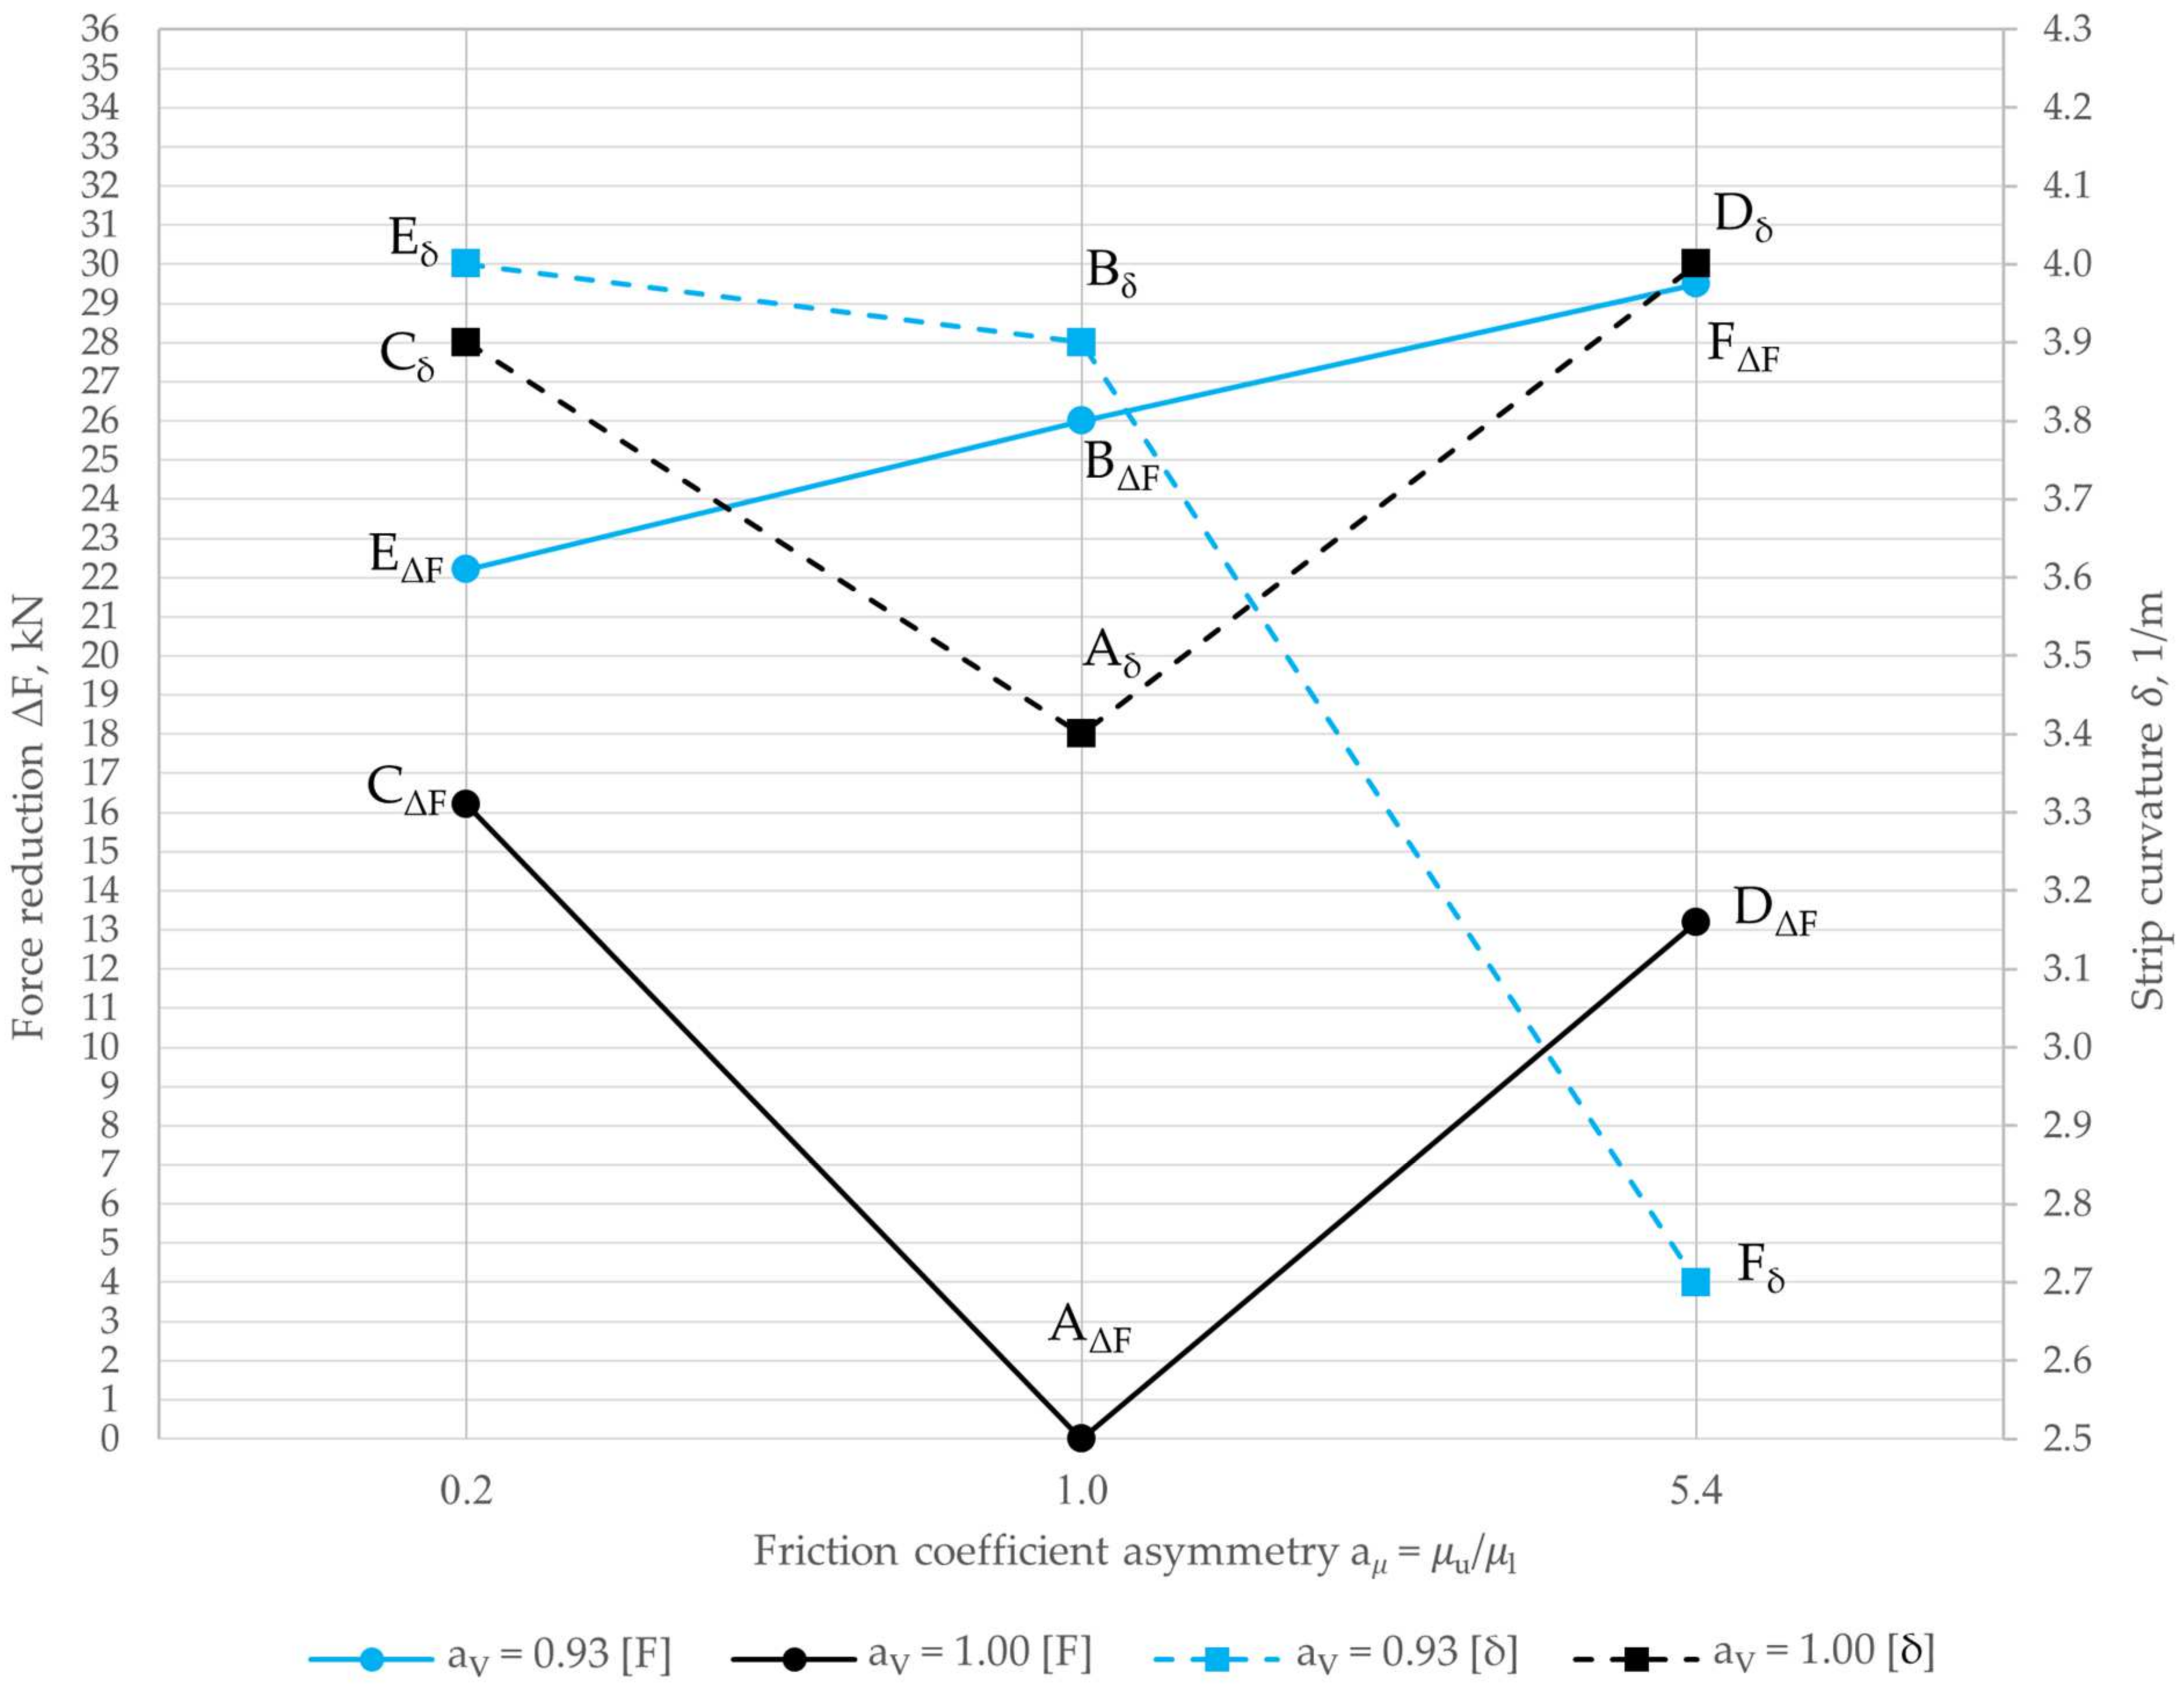
Based on the force and curvature measurements, a graph was developed showing the relationship between the force drop and the magnitude of the strip curvature and the magnitudes and combinations of the asymmetry data (Figure 7). On the left axis of the ordinate are the values of force drop relative to the process without asymmetry, while on the right are the values of measured longitudinal curvatures. The points marked with dots and connected by solid lines refer to force drops, while points marked with squares and connected by dashed lines refer to measured curvatures. On the abscissa axis are marked the values that the friction asymmetry coefficient takes. The values of the velocity asymmetry coefficient, on the other hand, are marked in separate colors.
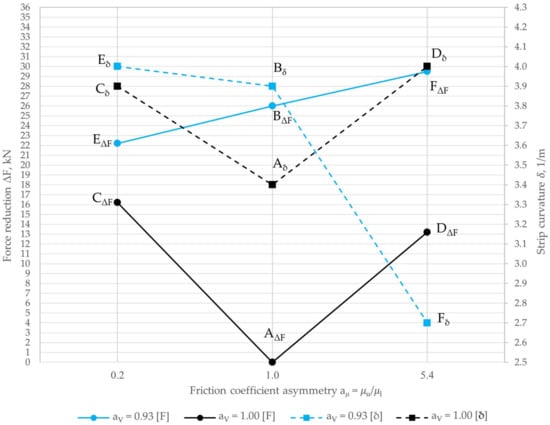
Figure 7.
Effect of velocity asymmetry and friction coefficient on forces during rolling and strip curvature.
Based on the analysis of the graph in Figure 7, it can be concluded that in the studied case of TRB strip rolling, the introduction of asymmetry into the process, regardless of its type or size, results in a decrease in the process forces compared to the process without asymmetry (from BΔF to FΔF on Figure 7). With the application of friction coefficient asymmetry, a similar decrease in forces occurred regardless of the roll being lubricated (CΔF and DΔF on Figure 7), with a greater decrease achieved by lubricating the upper shape roll (CΔF on Figure 7). The 1% difference was most likely due to the surface difference between the two sides of the TRB strip, which is about 1.2% larger on the shaped side. The introduction of velocity asymmetry into the process (BΔF on Figure 7) with a much smaller asymmetry coefficient value compared to friction asymmetry has a much greater effect on reducing forces. On this basis, it can be concluded that velocity asymmetry induces much higher shear stresses in the material than friction asymmetry. The combination of the two tested asymmetries (EΔF and FΔF on Figure 7) results in a greater decrease in forces compared to cases where only frictional asymmetry was used (CΔF and DΔF on Figure 7). Compared to velocity asymmetry, only one case of combined asymmetry resulted in lower forces (FΔF on Figure 7). The reason for obtaining higher forces in the second case of combined asymmetry (EΔF on Figure 7) (relative to velocity asymmetry), may have been the effect of partially removing the influence of both asymmetries, which reduced the value of the introduced shear stresses. The largest decrease in forces occurred in the case in which the speed of the upper roll was lowered and grease was applied to the lower roll (FΔF on Figure 7).
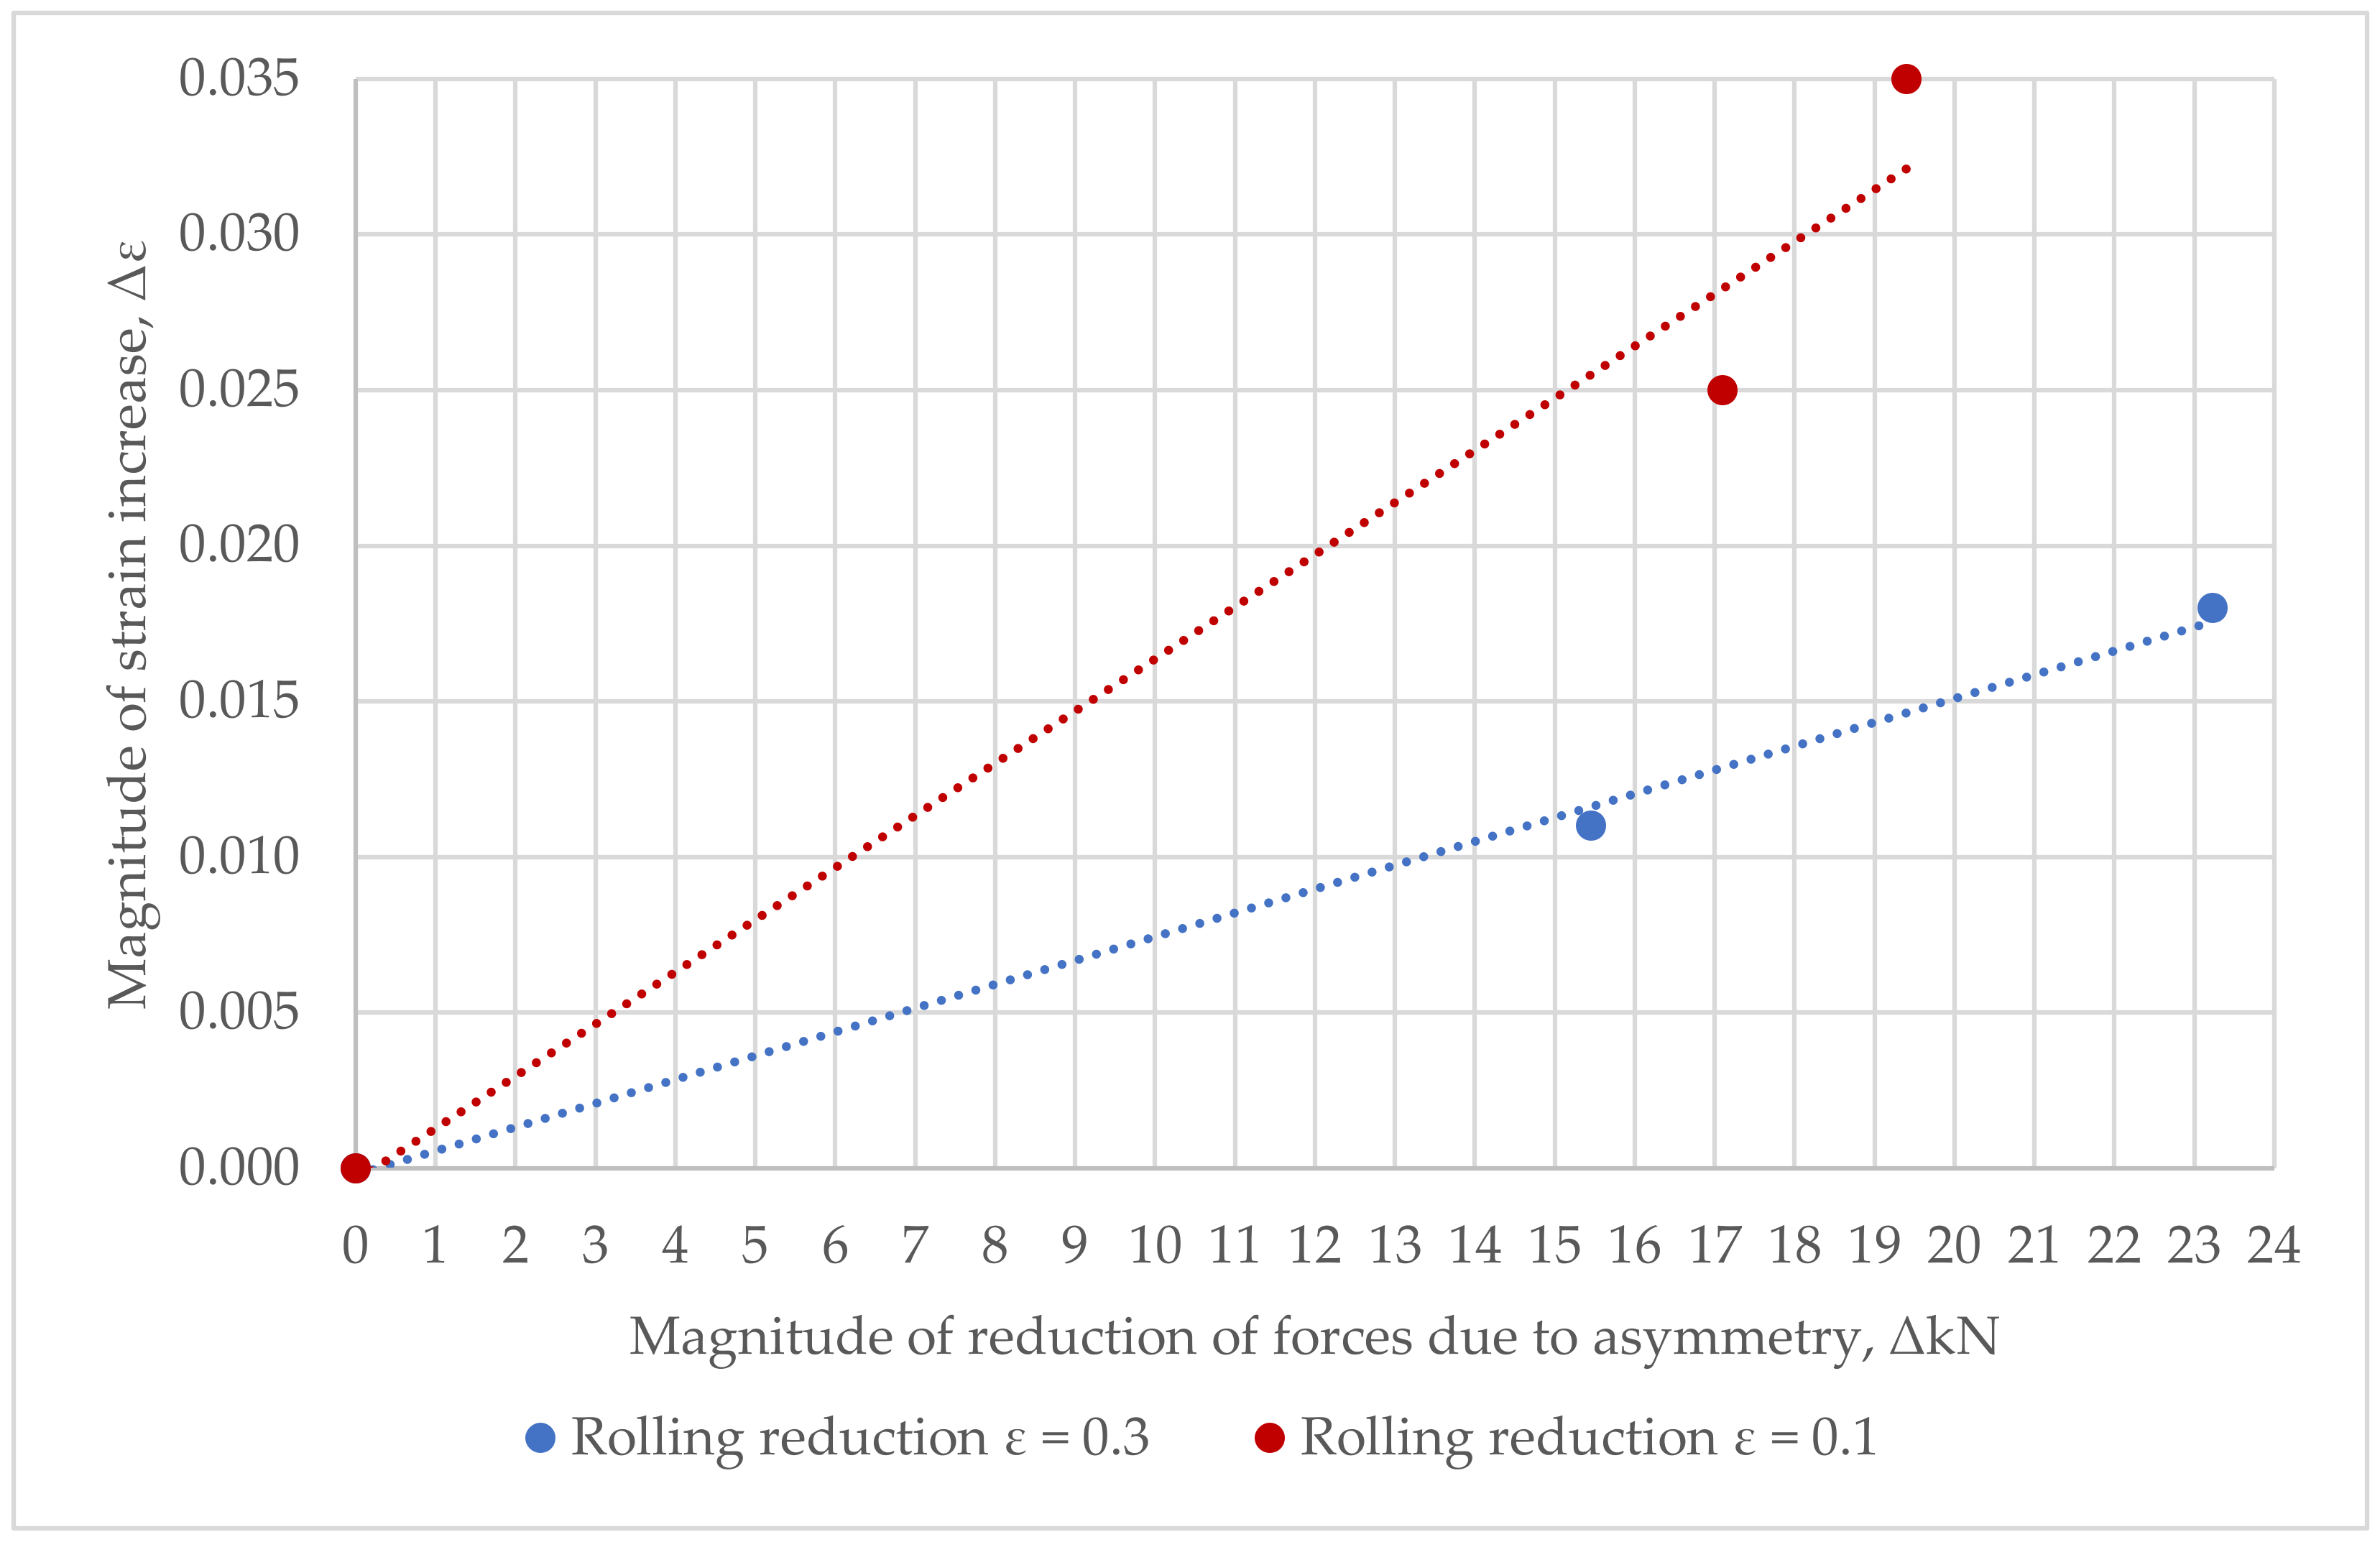
However, an analysis of the results showed no relationship between the type and magnitude of asymmetry on the amount of longitudinal strip curvature. The direction and magnitude of strip curvature even in the case of flat-rolling is dependent not only on the size and type of asymmetry itself, but also on many other factors. One of these is the amount of plastic deformation in a single rolling pass. Due to the fact that asymmetry results in additional shear stresses, an increase in asymmetry results in an increase in plastic strain in one rolling pass. Tests of the asymmetric rolling of TRB strips carried out, for all cases, were conducted with an unchanged rolling gap. In addition, the increase in strain can simultaneously affect the increase in compressive and tensile stresses due to the increase in rolling reductions in one pass with the increase in material elongation. In addition to the effect on strip curvature, this can also affect the results of measuring the magnetoelastic parameter in the material. In order to determine the effect of asymmetry on the magnitude of deformation in one rolling pass (conducted on a WD-2 mill), the values of relative deformation in the material after rolling were measured. These tests were conducted on two plain rolls, due to the complex shape of the TRB strips, which could disturb the measurement results. The process was carried out with two different rolling gaps, which were set so that the magnitude of relative deformation after one pass corresponded to the magnitudes of deformation in the areas of the TRB strip where the MP parameter was measured: ε = 0.1 and ε = 0.3. Asymmetry was introduced by lowering the speed of the upper roll. The results obtained are shown in Figure 8.
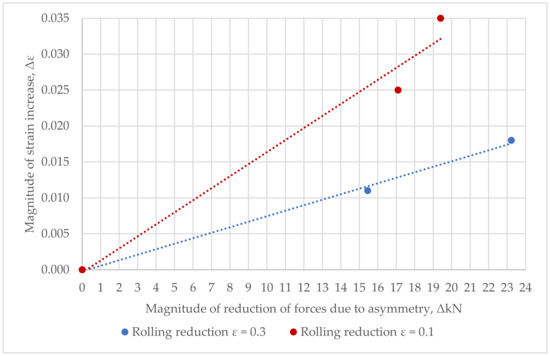
Figure 8.
Plot of the relationship between asymmetry-induced force drop and flat bar thickness reduction for two different strain rates. Dashed lines represent linear trend estimation for different rolling reductions.
The conducted tests confirmed the existence of a relationship between the increase in asymmetry and the amount of deformation in a single rolling pass. Based on the results presented (Figure 8), it can also be concluded that for smaller strain values, the effect of asymmetry is higher than for larger strains. This is most likely related to the deformational hardening of the material, as a result of which, for larger thickness reductions, more force is needed to reduce the material by the same amount as for smaller-thickness reductions.
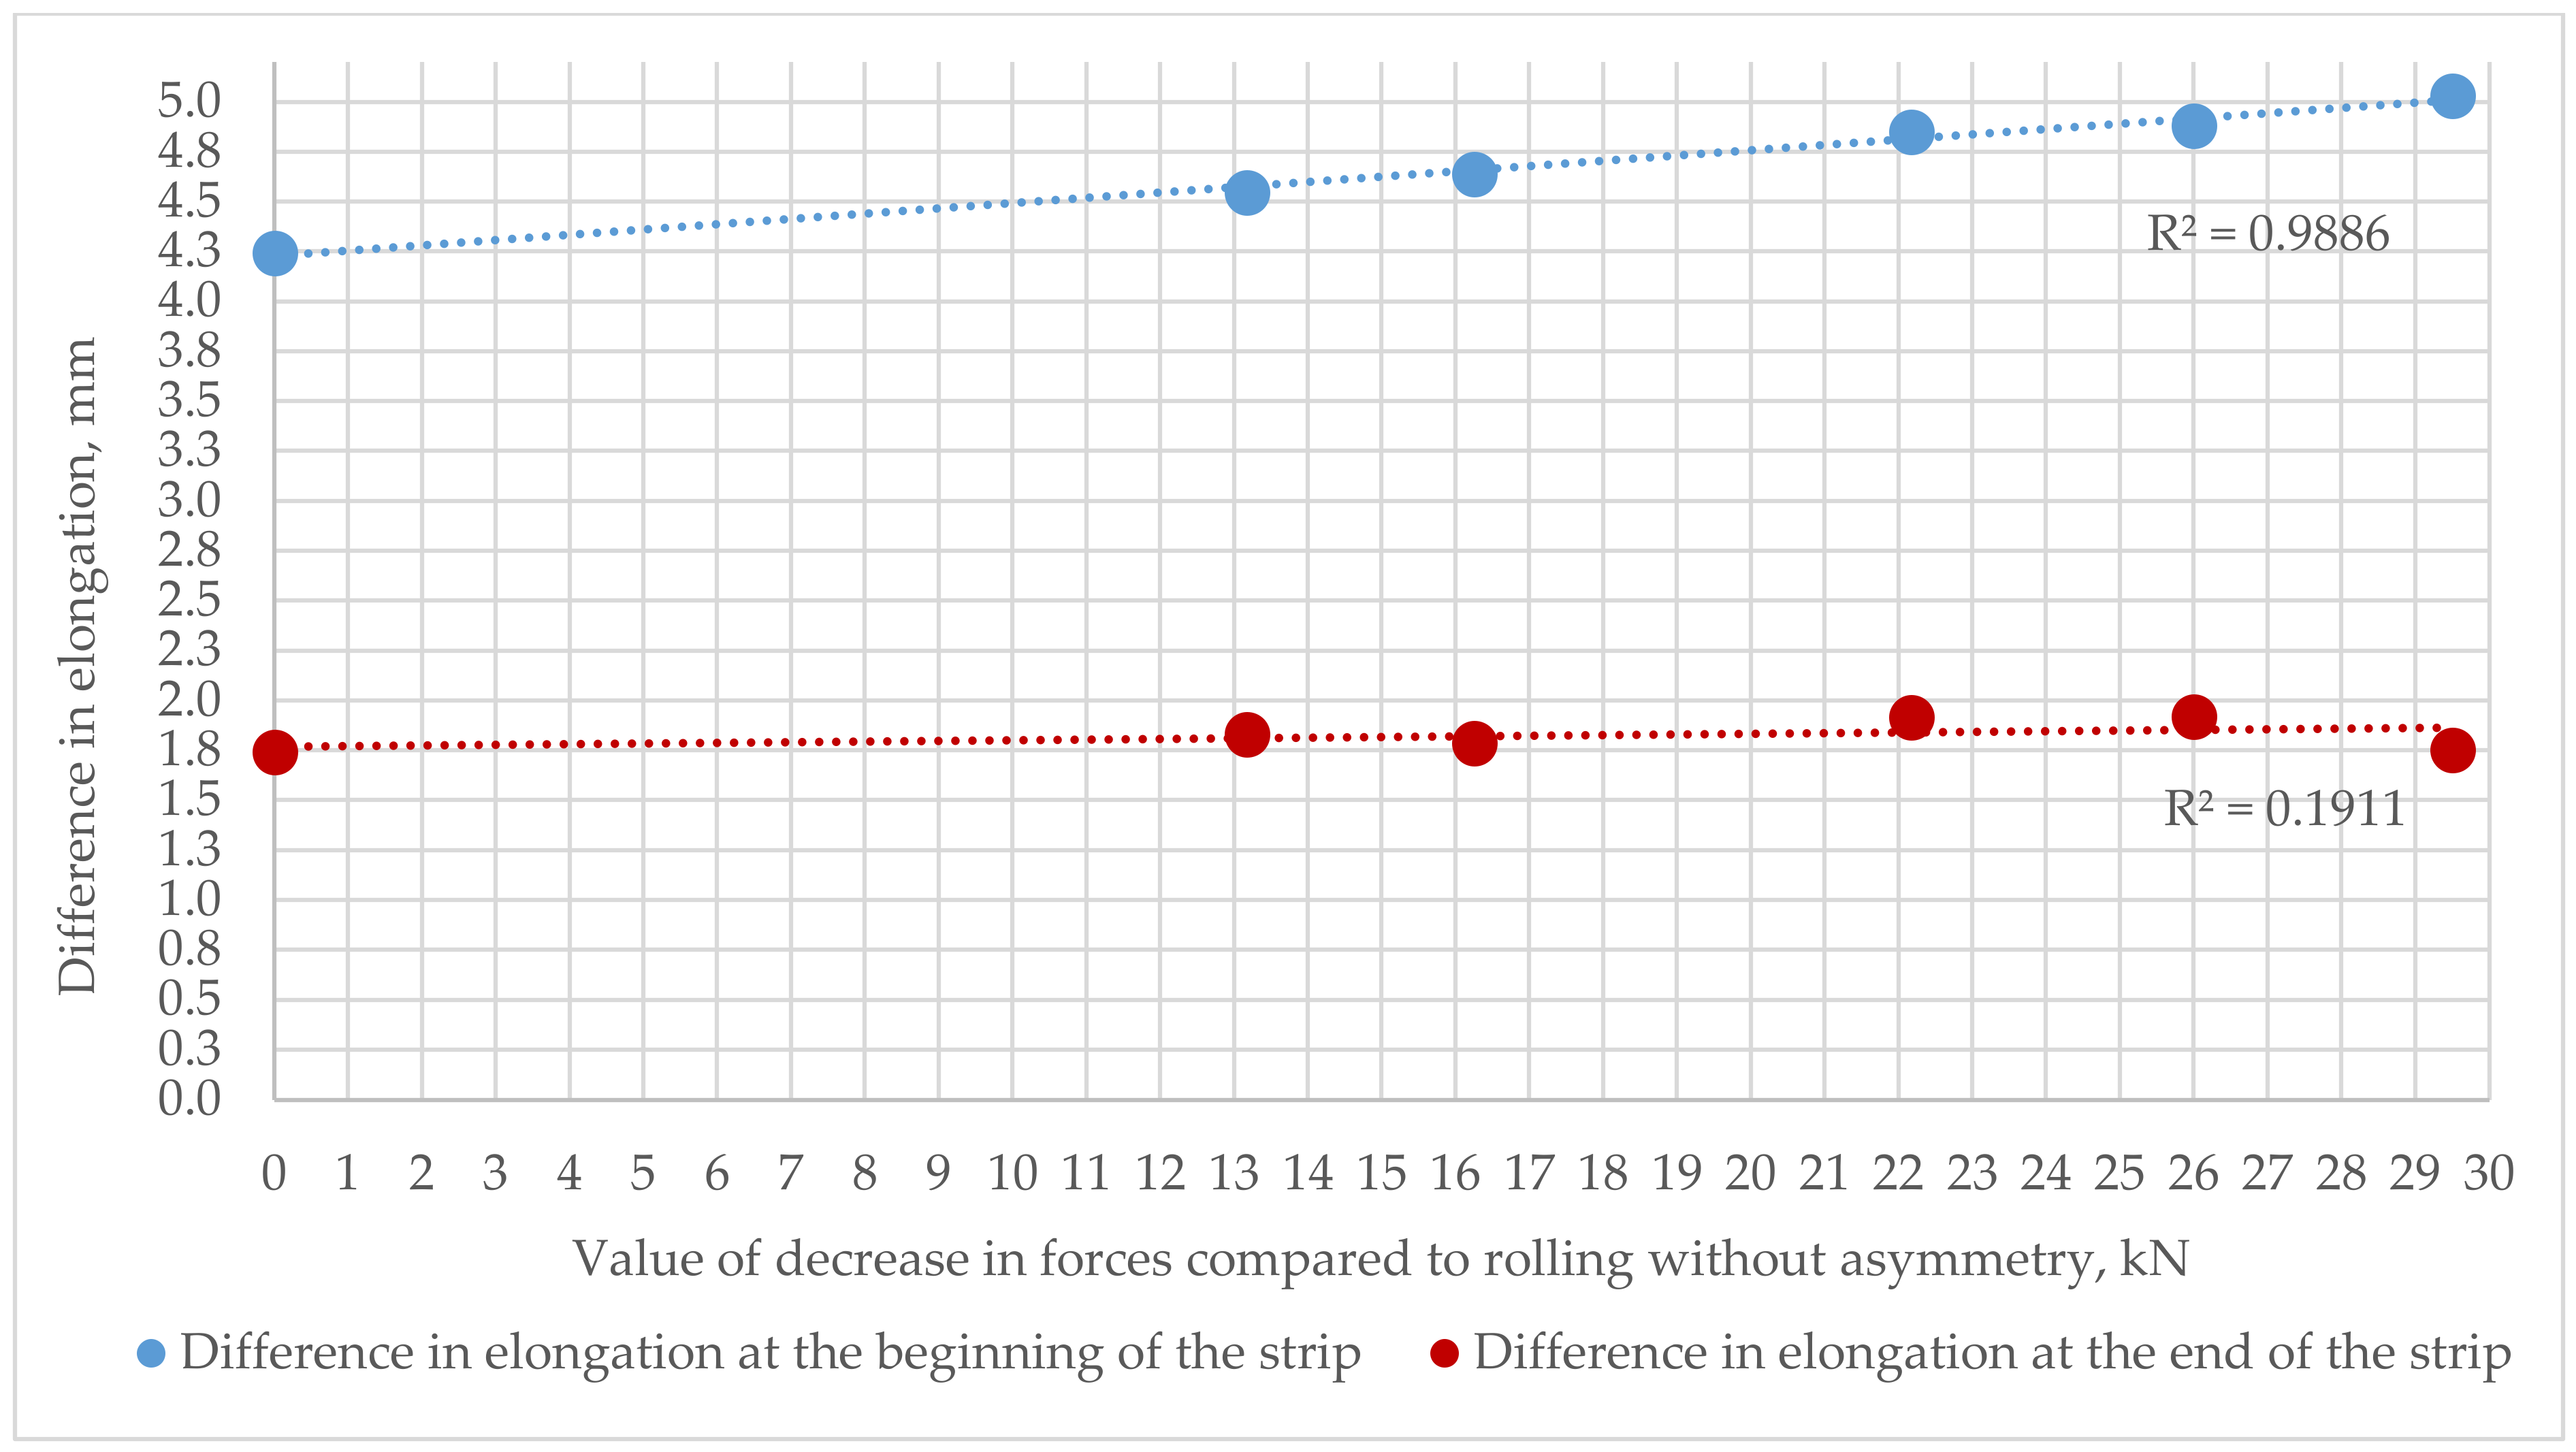
The effect of the increase in plastic strain due to the introduction of asymmetry during the rolling of TRB strips on the differences in elongation between differently deformed areas in the strips is shown in Figure 9.

Figure 9.
Effect of asymmetry magnitude on material elongation difference. Dashed lines represent linear trend estimation for different sides of tape.
Analyzing the diagram in Figure 9, it can be seen that the difference in elongation increases as the magnitude of asymmetry (measured by a decrease in forces during the process) increases. This effect is more noticeable at the ends of the strips than at the beginning. This is due to the hardening of the beginning of the strip due to contact with the rollers and the fact that at the entrance of the samples, the magnitude of the deformed material is smaller, while at the exit there is a cumulative flow of material from the entire length.
An analysis of the transverse shapes of the TRB strips showed that their deviation from the assumptions and the curvature of their lateral areas is visible (Figure 4). The magnitude of the curvature was expressed as the value of the radius. The smaller its value, the greater the lateral curvature of a given strip. The results of the measured radii are shown in Table 5.
Table 5.
Results of measurements of the radius of transverse curvature of the TRB strip.
An analysis of the results in Table 5 indicates that depending on the magnitude and type of asymmetry introduced, the values of the transverse curvature of the strip changed. The introduction of velocity asymmetry alone (B) caused a minor increase in the transverse curvature of the strip (a decrease in the radius of about 24 mm) compared to the case without asymmetry (A). In contrast, the use of only friction coefficient asymmetry (C and D), regardless of its magnitude, resulted in an increase in the radii of the transverse curvature of the strip. A better result was obtained in the case of the lubrication of the upper roll (C). In contrast, the use of combined asymmetry (E and F) had the greatest effect on the increase in the transverse curvature of the strips (a decrease in the value of the radius of curvature) and the results obtained were similar to each other.
In order to determine whether the lateral curvature of the strip is not caused by differences in material elongation (which can be a common cause of shape defects in TRB strips), the results of the measured radii were compared with the sum of differences in material elongation at the input and output of the strip. The analysis conducted on the measurement of the shapes of the strips of TRB and the decreases in forces due to the introduction of asymmetry suggests the formation of a very complex stress state in the material. In addition, in some cases and depending on the side of the strip under study (plain or grooved), different stress states (compressive and tensile) can counteract each other. In order to study the influence of these variables on the stress state of the material, measurements of the magnetoelastic parameter were carried out using the Barkhausen magnetic noise method for the obtained TRB strips.
3.4. Results of Barkhausen Magnetic Noise Measurements in Strips after Introduction of Variable Strain in Asymmetric Rolling Process
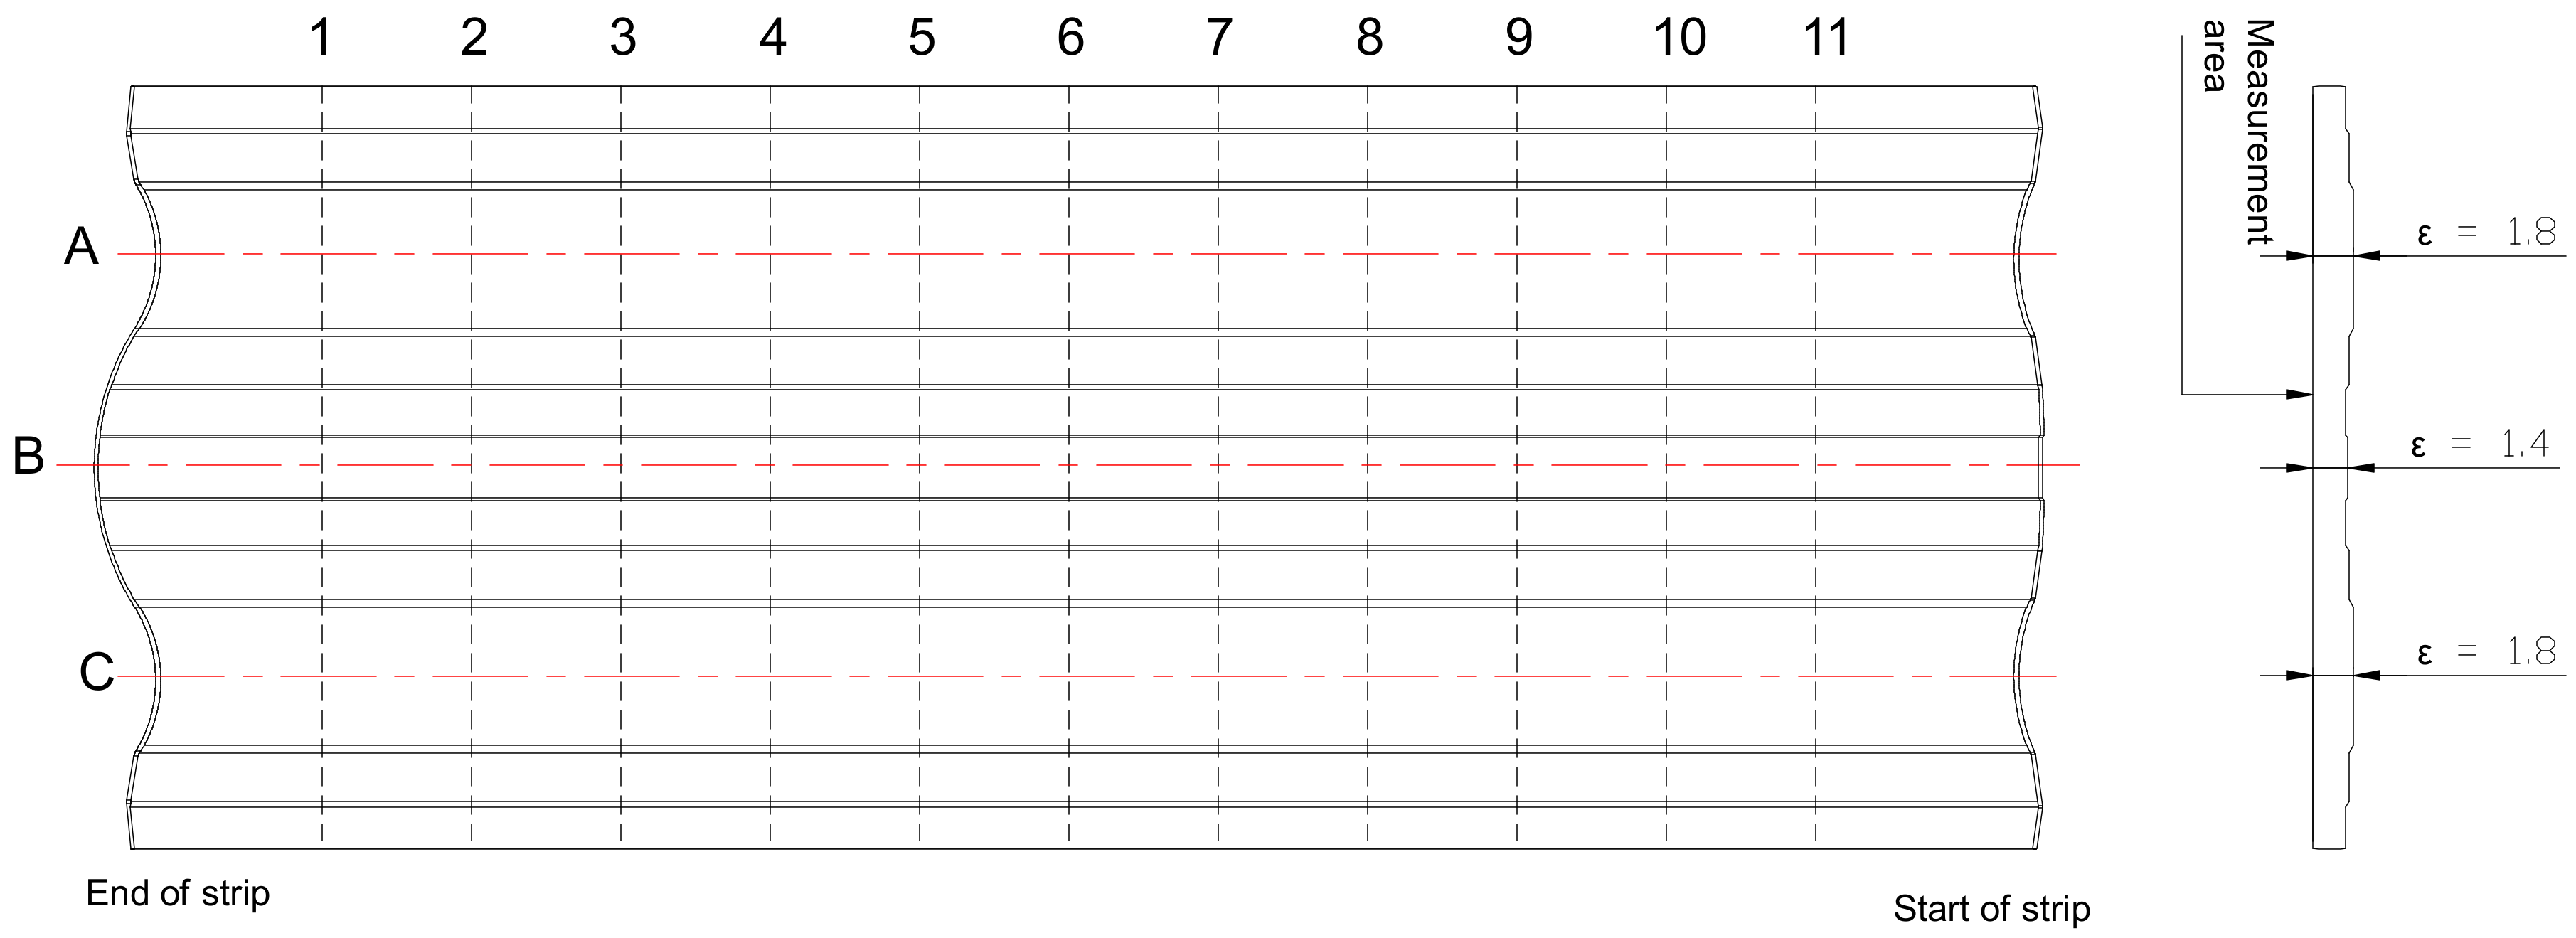
In the case of TRB strips, longitudinal lines A and C ran through areas in the strip where the magnitude of the relative strain was ε = 0.1, while at point B, the value was ε = 0.30 (Figure 10). The transverse lines were numbered from the side of the strip exit and were spaced every 10 mm so that line No. 6 was always in the center of the specimen.
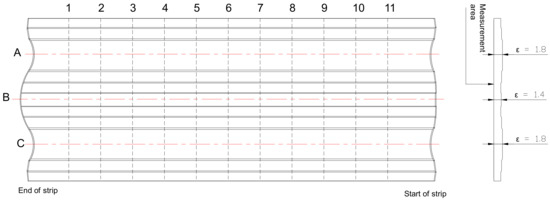
Figure 10.
Measurement grid for the tested tapes.
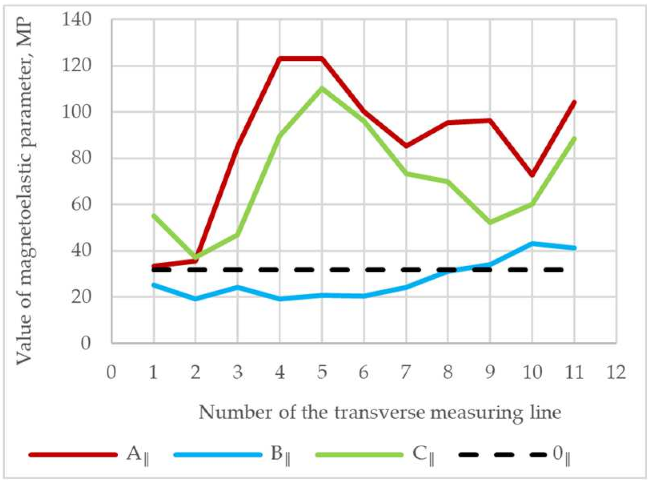
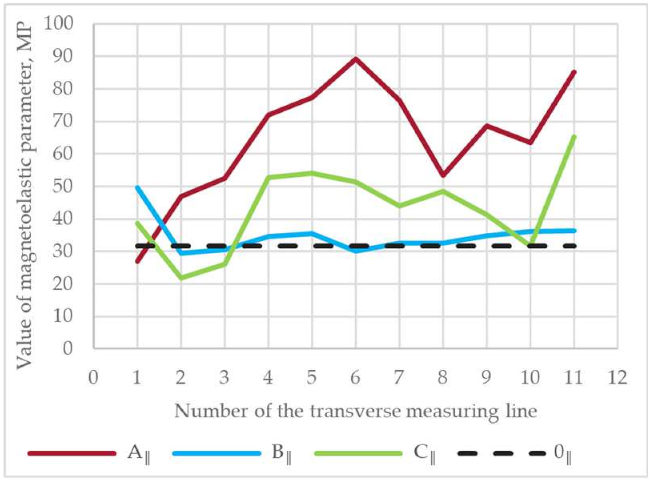
These tests were carried out on the plain side of the strips at each of the intersection points of the grid shown in Figure 10, in the direction parallel to lines A, B and C (MP║) as well as in the perpendicular direction (MPꓕ). The results obtained from the measurements were expressed in terms of the magnetoelastic parameter MP. In order to qualitatively evaluate the effect of the introduced strain variables and changes in the curvature (longitudinal and transverse) and elongation of the material on the stress state of the TRB strips, the values of the MP parameter before and after the process were compared with each other. An increase in the value of this parameter relative to the value in the initial material could indicate an increase in stress in the direction from compressive to tensile stress, while a decrease could indicate an increase in stress in the direction from tensile to compressive stress. Table 6 shows diagrams of the change in the magnetoelastic parameter separately for a given longitudinal measurement line.
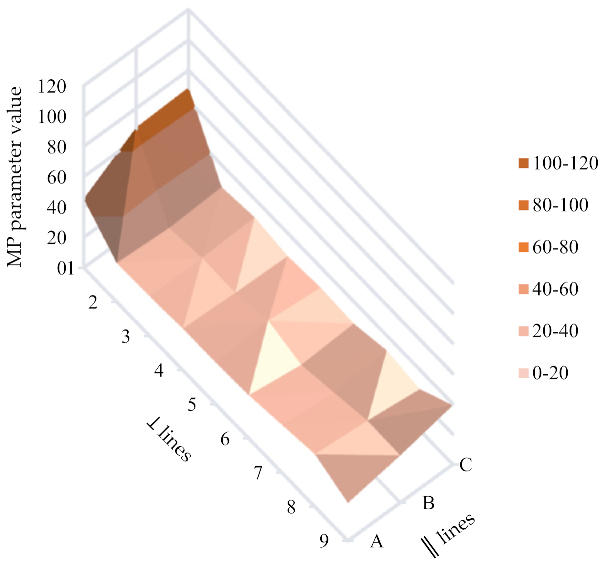
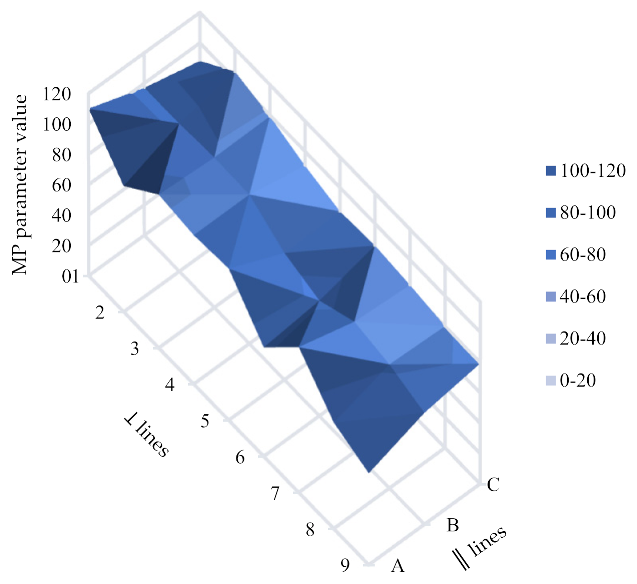
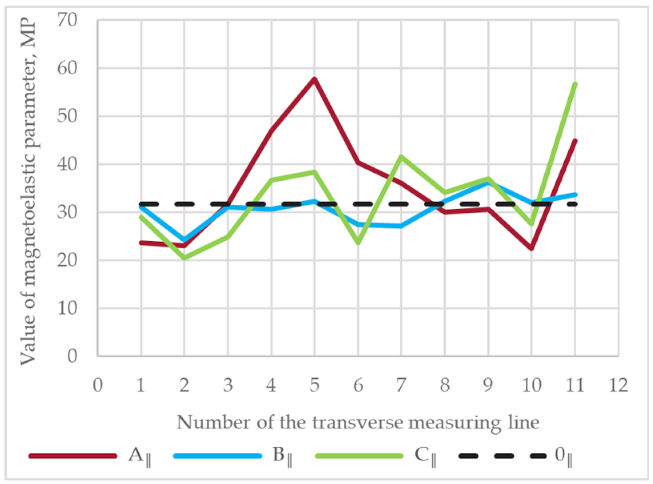
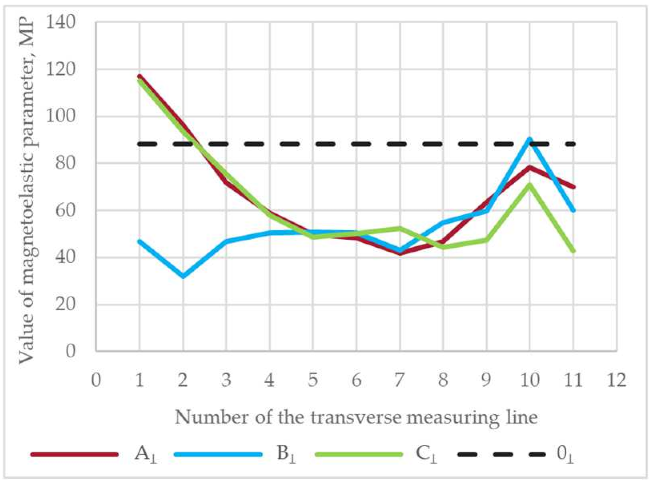
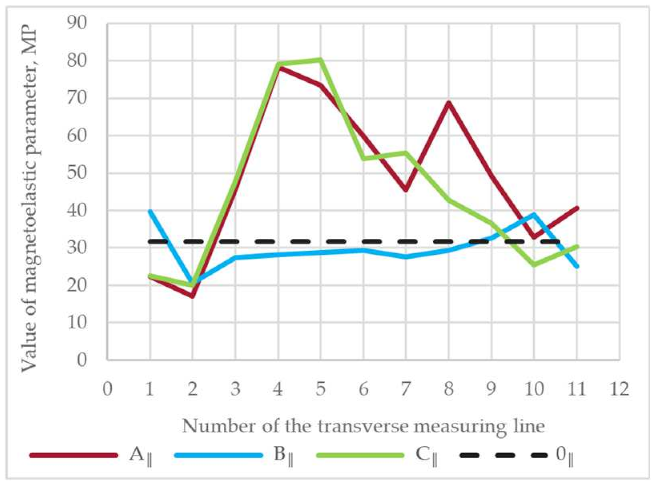
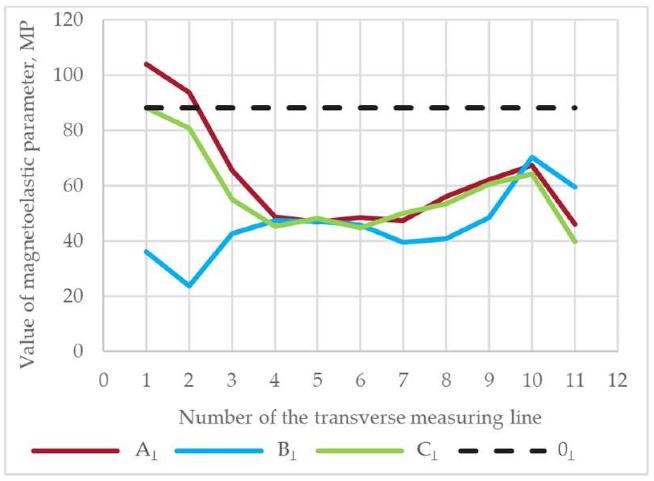
Table 6.
Summary of changes in the values of the longitudinal parameter MP (MP║) and transverse parameter MP (MPꓕ) along the tested samples. A║—measurement results of the longitudinal MP parameter along the measurement line A, B║—measurement results of the longitudinal MP parameter along the measurement line B, C║—measurement results of the longitudinal MP parameter along the measurement line C, 0║—measurement results of the longitudinal MP parameter for starting material, Aꓕ—measurement results of the transverse MP parameter along the measurement line A, Bꓕ—measurement results of the transverse MP parameter along the measurement line B, Cꓕ—measurement results of the transverse MP parameter along the measurement line C, 0ꓕ—measurement results of the transverse MP parameter for starting material.
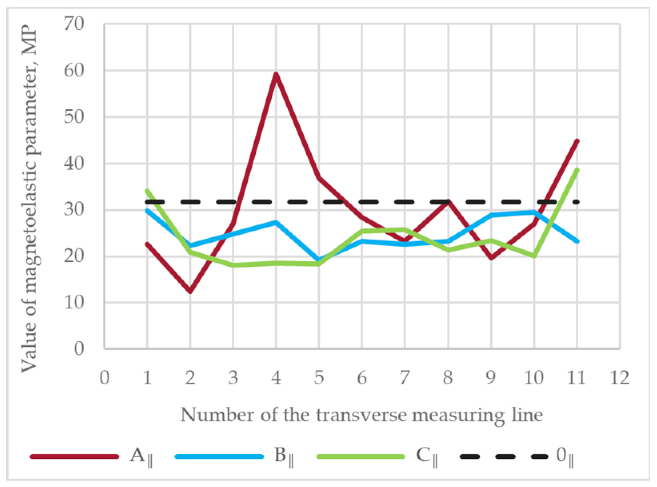
By analyzing the results of measurements of the MP parameter (Table 6), it can be seen that the introduced complex deformations in the material cause significant variation in the magnitude of the magnetoelastic parameter on the cross-section, as well as the length of the tested samples. There are apparent differences in the magnitude and nature of the changes in the MP║ and MPꓕ parameter between areas where less deformation was introduced (along measurement lines A and C) and more deformed areas (along measurement line B). In addition, the effect of the magnitude and type of asymmetry on the values and distribution of the MP parameter can be seen.
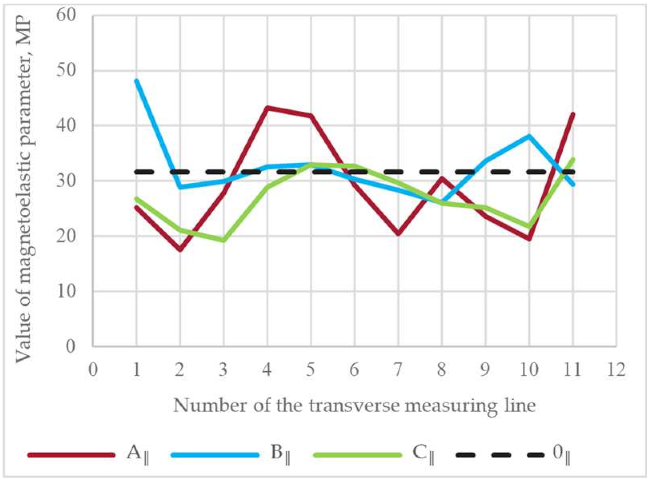
In the case of measurements of the magnetoelastic parameter in the longitudinal direction (MP║), it can be seen that visible changes from the initial value occur only in less deformed areas (ε = 0.10, along measurement lines A and C). There is an increase in the value of the MP parameter in these areas, which, however, was not constant and changed along the length of the samples. In these areas, a significant increase in the MP parameter was evident in the middle of the length of the strips (areas between the 4th and 8th transverse measuring lines) for most of the cases studied. Larger values of the MP parameter in these areas may be indicative of a change in the state of stress in the direction of tensile stress, which may be due to the strip’s longitudinal curvature. On the other hand, the apparent differences in the values of the MP parameter, which occur in some cases, between the areas along the measurement line A and C may be due to changes in the shape on the cross-section of the strips in these areas (Figure 8), as a result of which the two areas may have differed to some extent in thickness and thus in the magnitude of the deformations occurring in them.
In the case of the area in the strip with strain ε = 0.30 (the area along measuring line B), no clear changes were observed in the value of the magnetoelastic parameter in the longitudinal direction to the rolling direction (MP║). In this area, in addition to the higher strain (relative to the areas along measuring lines A and C), there was also the highest elongation of the material, which may have resulted in an alignment between the compressive and tensile stress states. In this case, there was also no large variation in the values of the MP║ parameter along the length of the test specimens, which may indicate a homogeneous stress distribution.
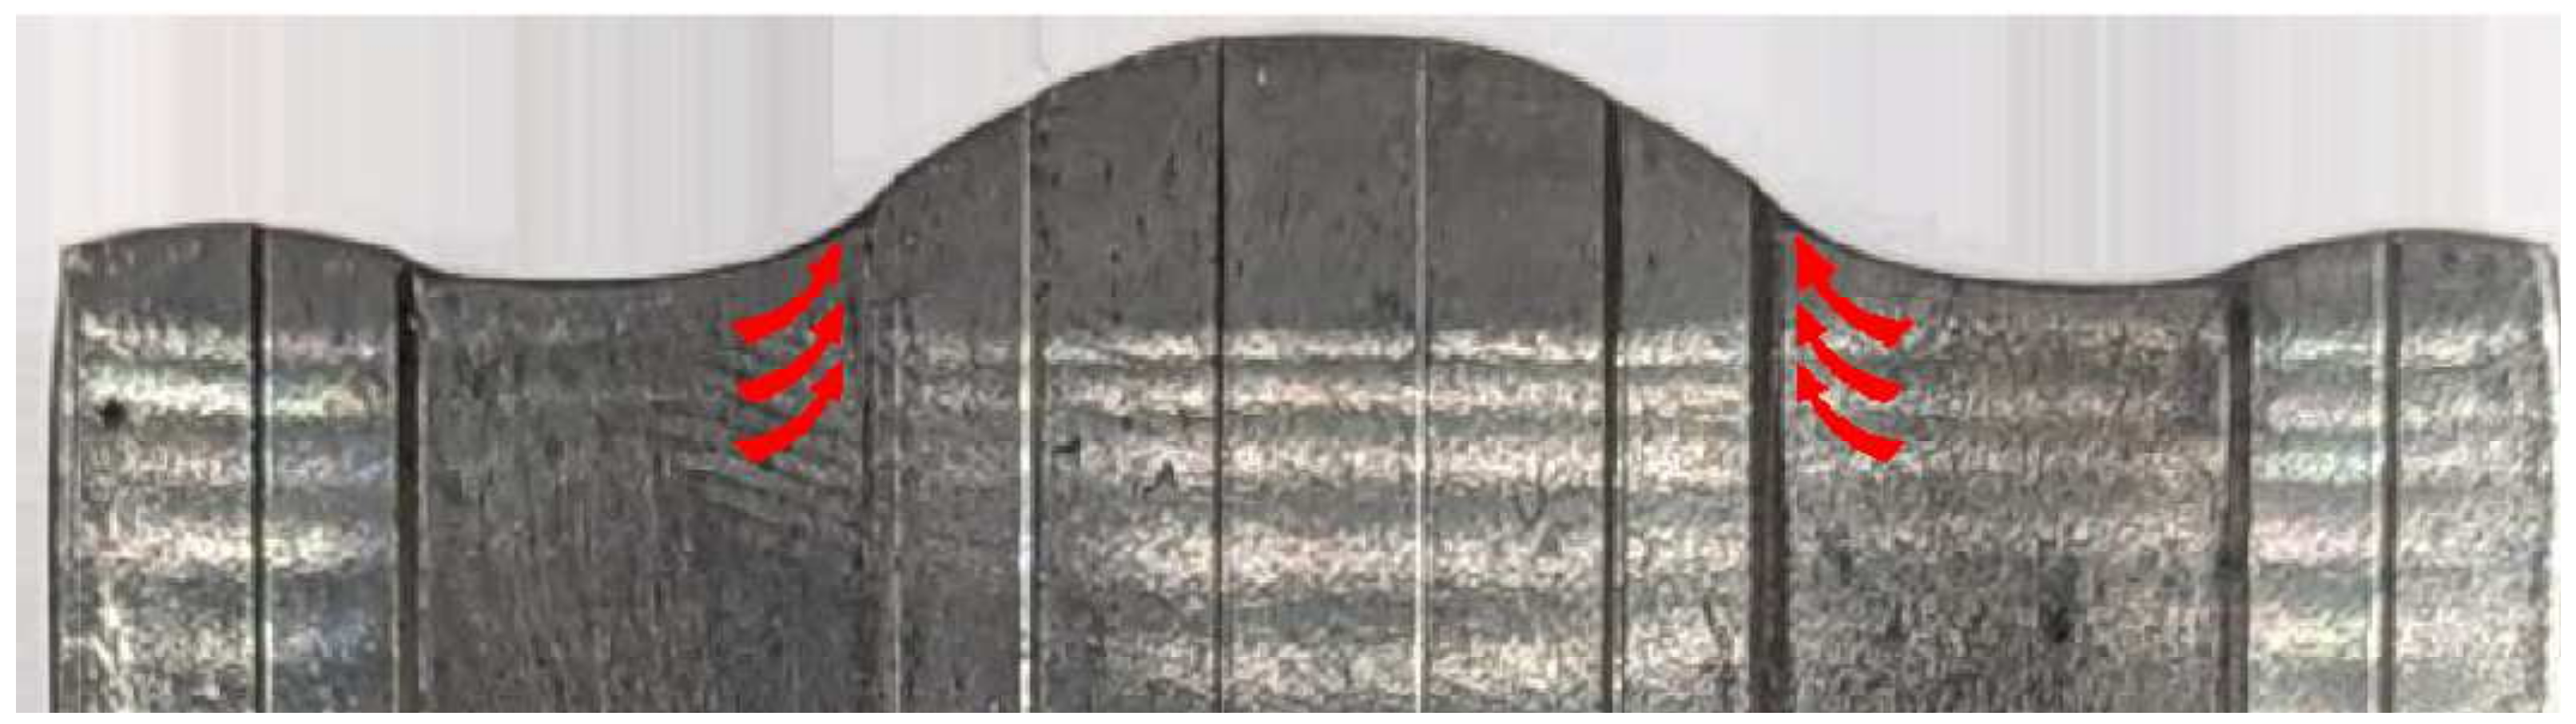
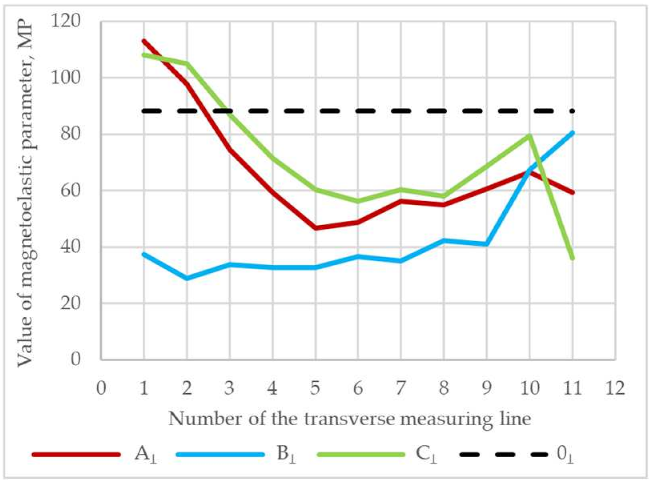
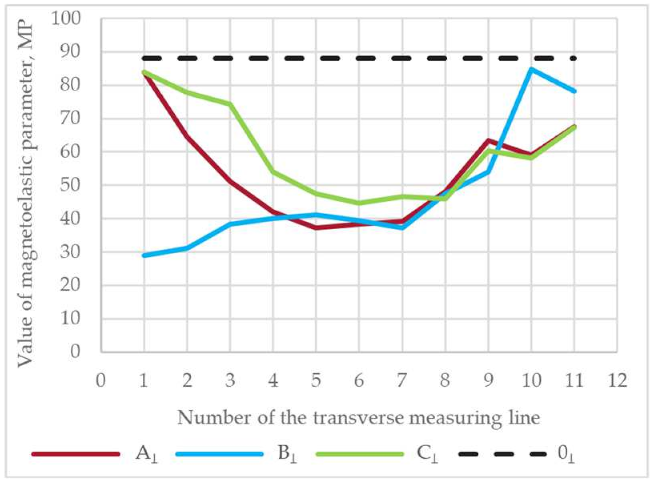
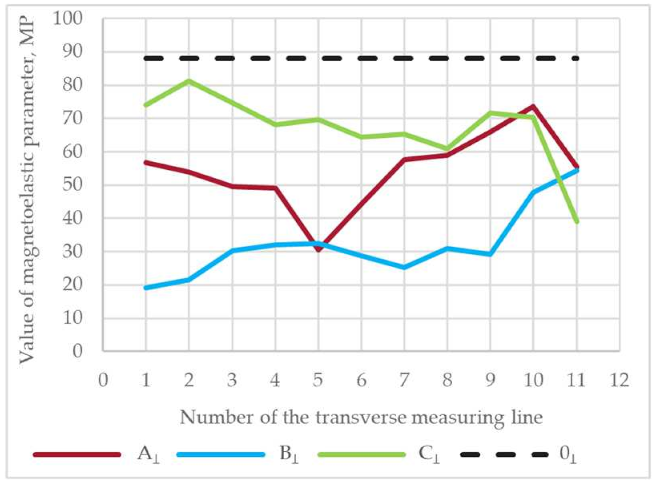
The values of the MP parameter in the direction transverse to the rolling direction (MPꓕ) changed significantly from the initial value for all the tested samples, regardless of the area tested. However, the nature and magnitudes of these changes vary along the length of the specimens, as well as according to the magnitude of the strain in the area. For areas where the strain was ε = 0.10, there was a decrease in the MP parameter, the greatest intensity of which was evident in the middle of the strip length (between the post-test measurement lines 5 and 7). The areas near the output of the band (along the transverse measurement line 1 and 2) had the highest values of the MPꓕ parameter, taking higher values than the output in some cases. On this basis, it can be concluded that for areas of magnitude of plastic deformation (ε = 0.10), as a result of TRB rolling, the distribution of the stress state in the direction transverse to the rolling direction (change in parameter MPꓕ) along the length of the specimen is not homogeneous. In the middle of the length of the test specimens in most of the cases studied, the stresses moved in the direction of compressive stresses, while at the ends of the strip, in the direction of tensile stresses. The difference is particularly noticeable for the areas at the exit of the strips. The reason for this may be the greater elongation of the material in the area with strain ε = 0.30 (along measuring line B), which resulted in the material from the areas with strain ε = 0.10 (along measuring lines A and C) being pulled in by the material with greater strain (Figure 11).
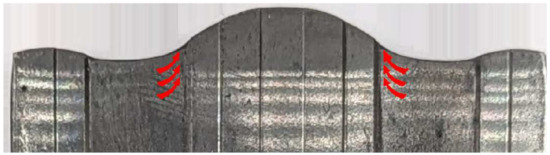
Figure 11.
Schematic of material flow at the end of the TRB strip from less to more deformed areas. The red arrows indicate the theoretical direction of flow of the material.
An analogous situation may have occurred at the beginning of the strip, but with less intensity due to smaller differences in elongation, between differently deformed areas.
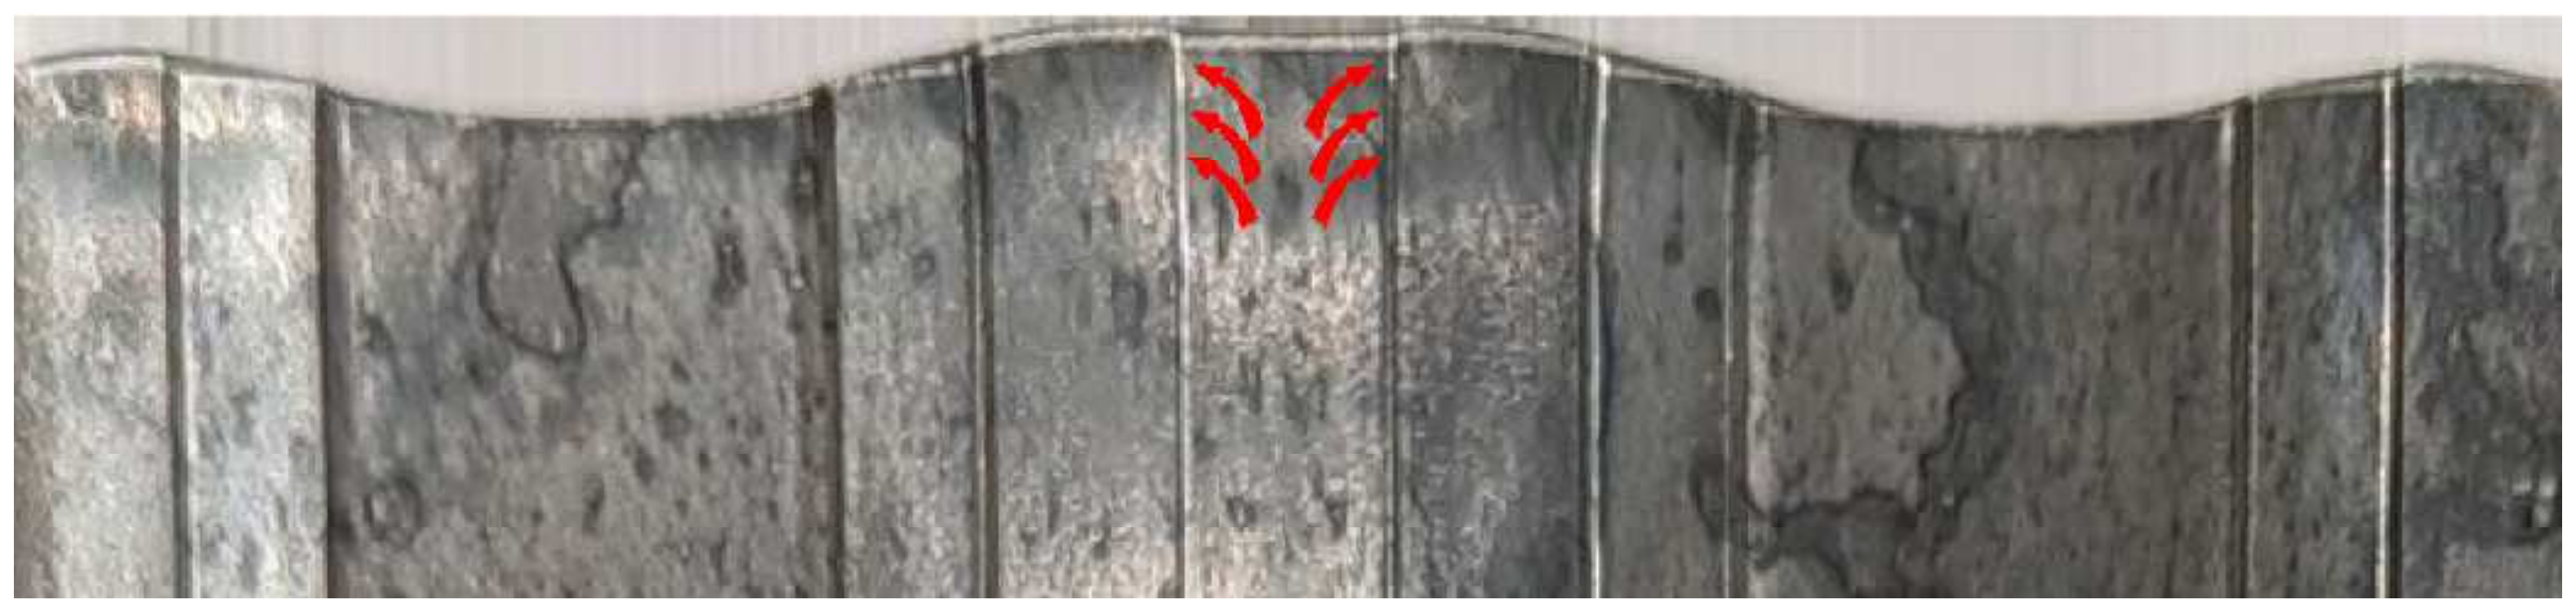
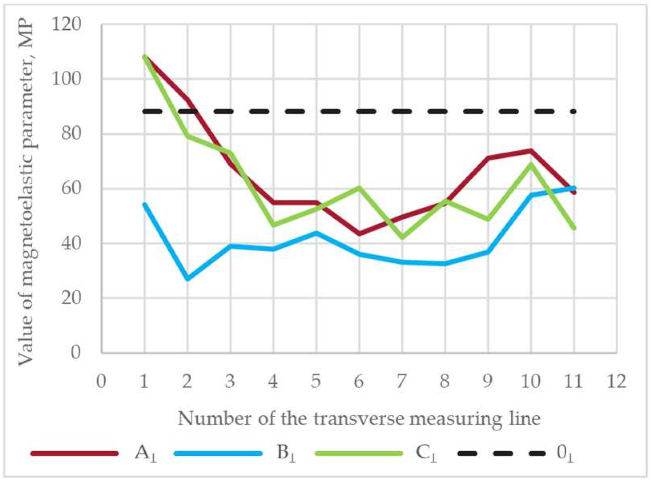
In areas where the deformation was ε = 0.30, there was also a decrease in the value of the MP parameter in the direction transverse to the rolling direction. In addition, differences along the length of the samples were also evident. However, in most of the cases studied, there was an inverse relationship for the less deformed areas—the highest values of the magnetoelastic parameter were observed at the beginnings of the strips studied. This may suggest that the stress state at the beginning of the strip, as a result of the introduced variable deformations, is directed towards tensile stresses. This phenomenon may have an analogous reason to that of the areas with a relative strain of ε = 0.10 and be related to the flow of material toward the more deformed and, therefore, more elongated areas. On the sides of the area with a relative strain of ε = 0.30 are areas of greater strain, equal to ε = 0.35 (Figure 4). For the end of the strip, this difference in strain does not affect the higher elongation, as can be seen in Figure 11. However, at the beginning of the strip, the higher elongation of the more deformed areas (0.35) can be observed. A photo of the beginning of the strip with the suggested material flow directions marked is shown in Figure 12.
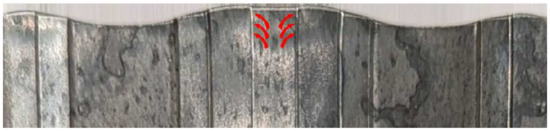
Figure 12.
Schematic of material flow at the beginning of the TRB strip from areas of strain ε = 0.30 to ε = 0.35. The red arrows indicate the theoretical direction of flow of the material.
The introduction of variable deformations on the cross-section into the rolling process as a result of a single groove roll significantly affects changes in the values of the magnetoelastic parameter both transverse to the rolling direction and in the longitudinal direction. Therefore, in order to further analyze the influence of other factors on the changes in the values and the MP parameter, the average values that were obtained over the entire lengths of the strips were taken. The obtained average values of the MP parameter in the longitudinal and transverse directions, together with deviations, are shown in Table 7.
Table 7.
Averaged results of MP parameter measurements with deviations for the tested TRB strips. MP║—value of MP parameter in longitudinal direction, MPꓕ—value of MP parameter in transverse direction.
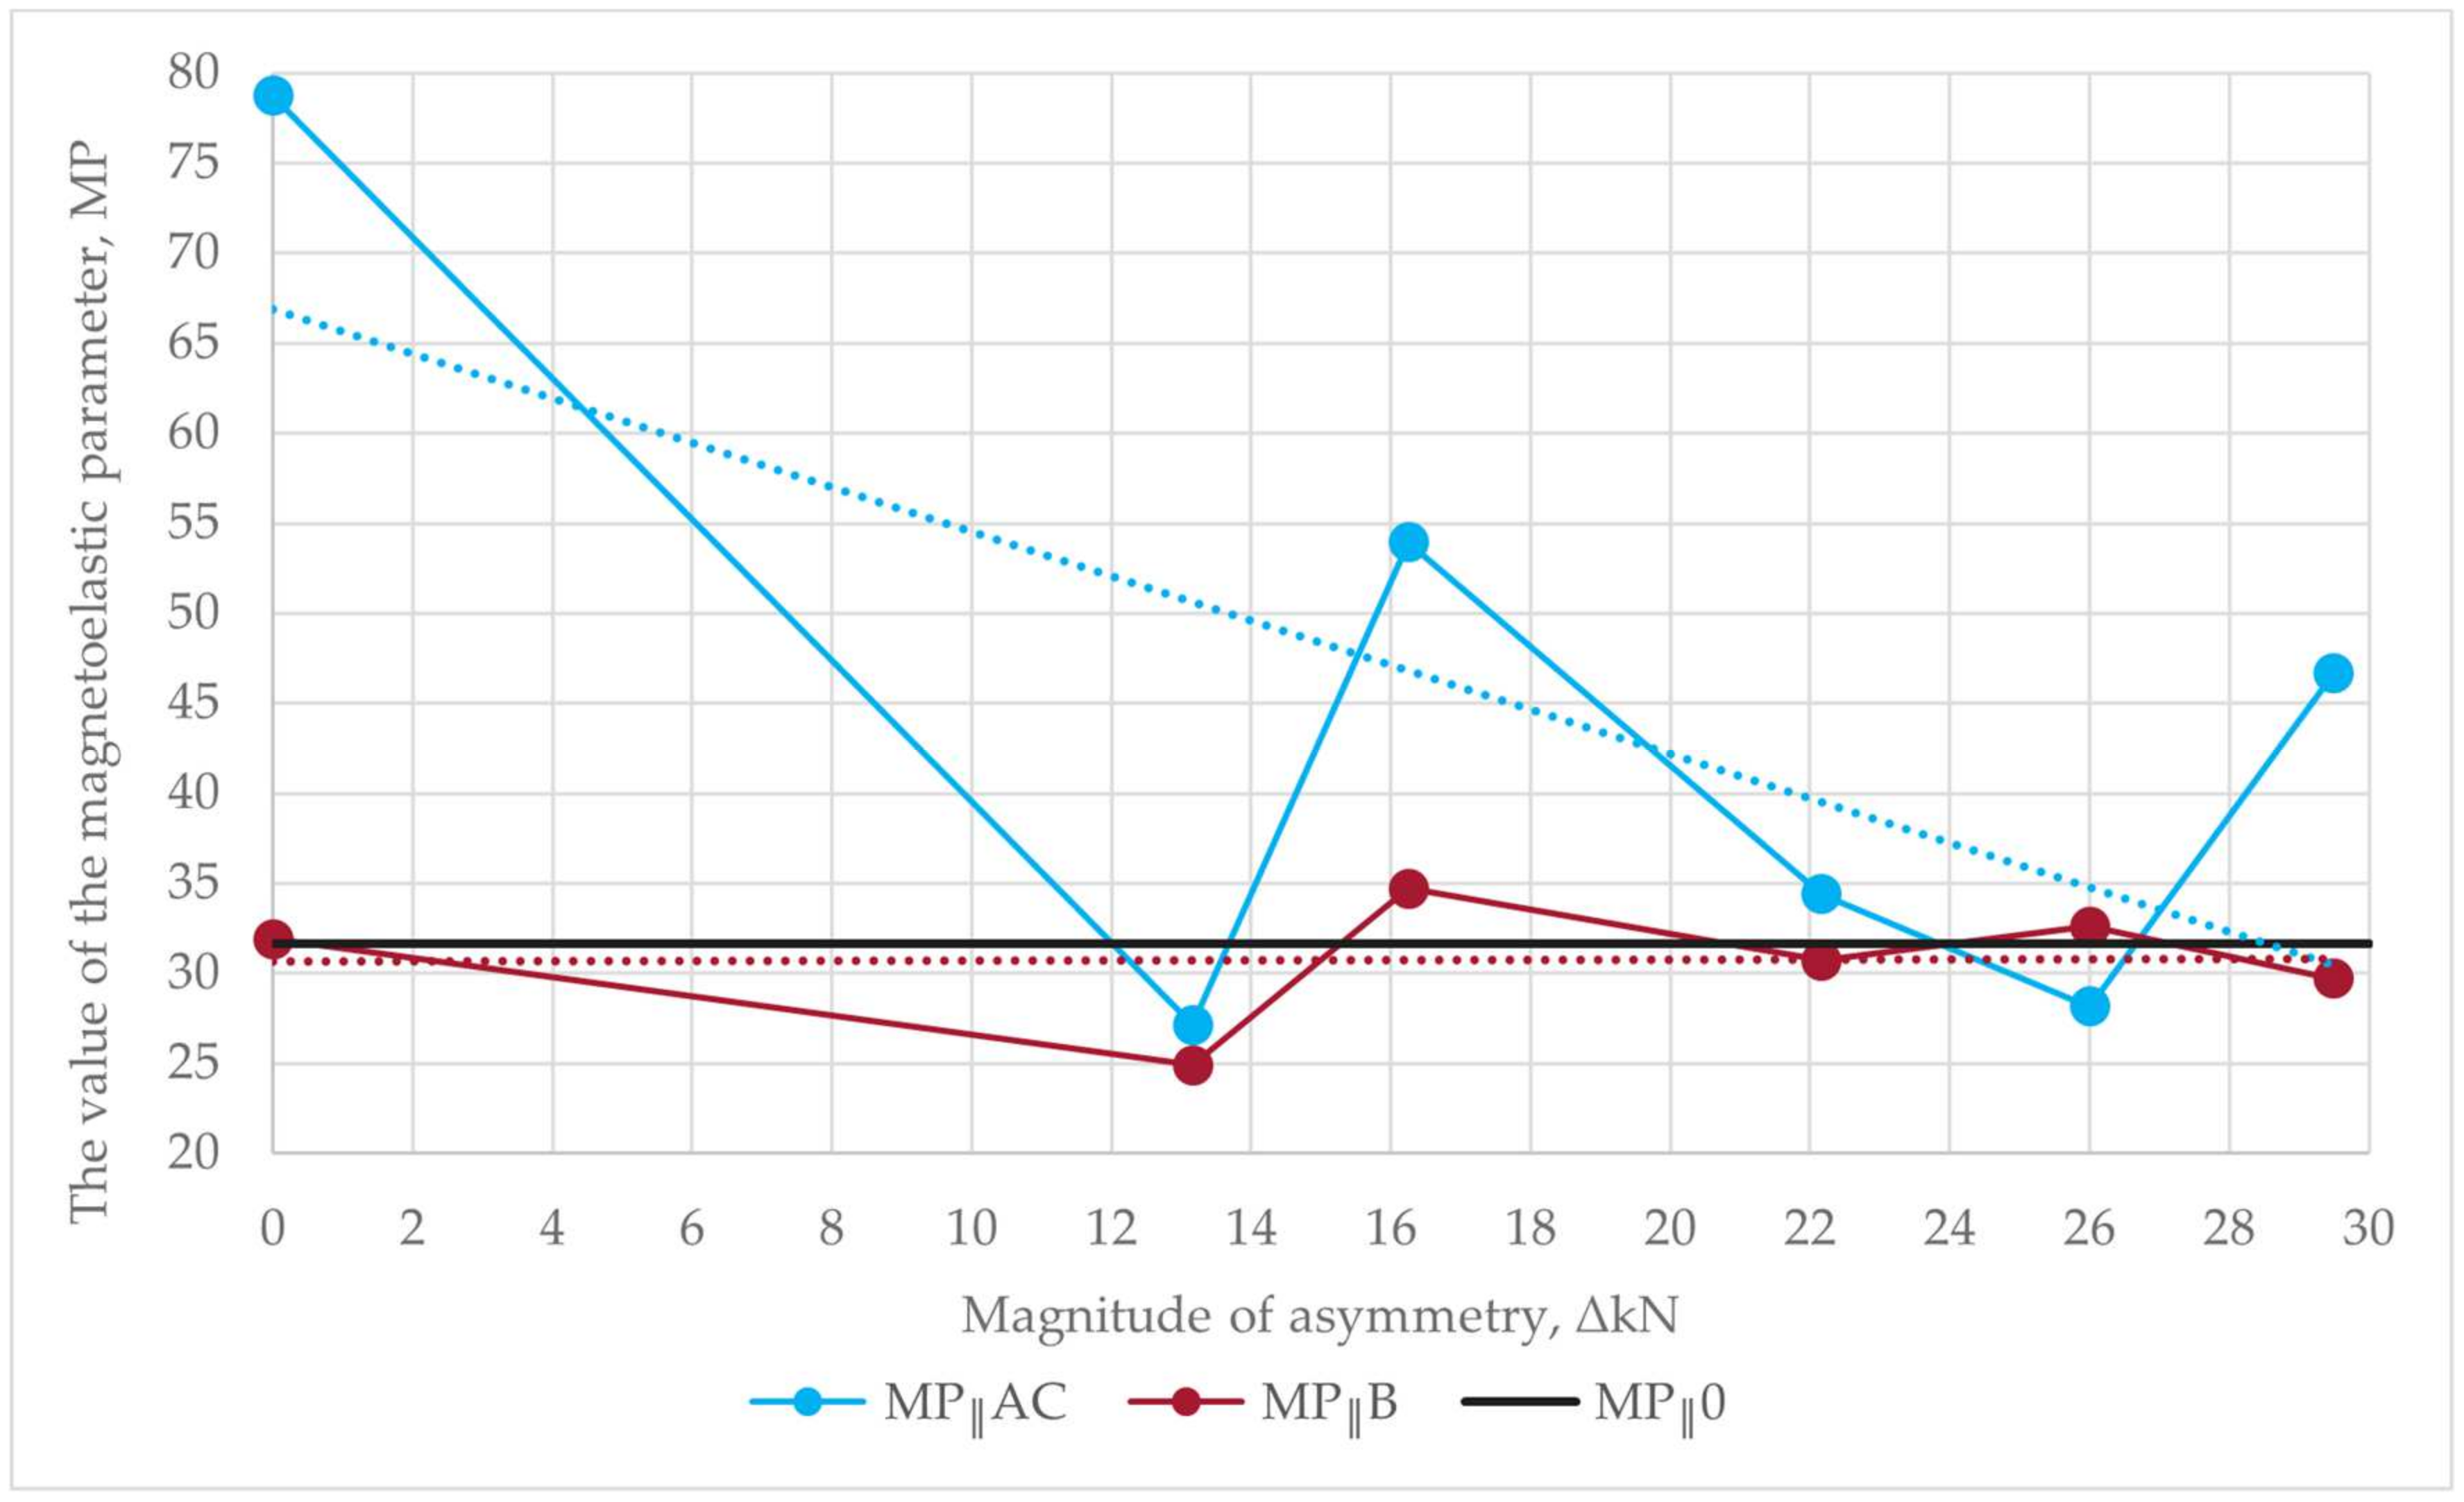
The effect of the magnitude of asymmetry on changes in the magnetoelastic parameter is shown in Figure 13 and Figure 14. The average values of the MP parameter in the longitudinal and transverse directions were used for the analysis and the magnitude of asymmetry, due to its different types and magnitudes, was expressed in terms of the value of force reduction compared to rolling without asymmetry. In addition, the measured values were averaged for areas where similar values of deformation were obtained (areas along the A and C measurement lines).
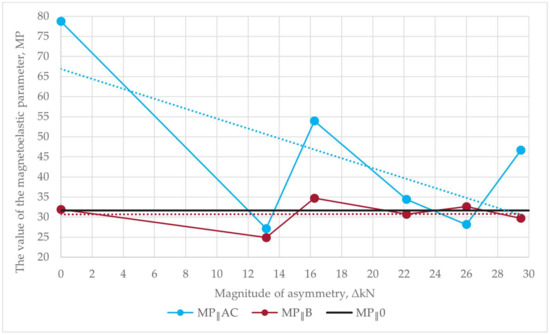
Figure 13.
Diagram of the relationship between the magnitude of the asymmetry and the value of the magnetoelastic parameter in the longitudinal direction. Dashed lines represent linear trend estimation for MP parameter values in given areas.
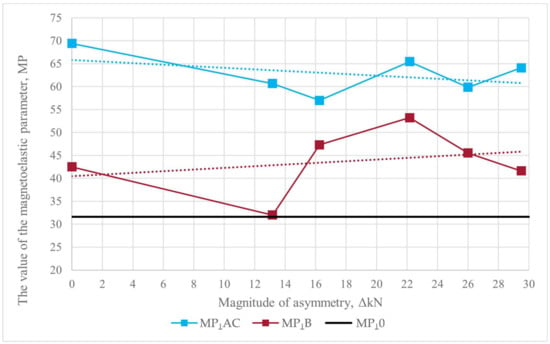
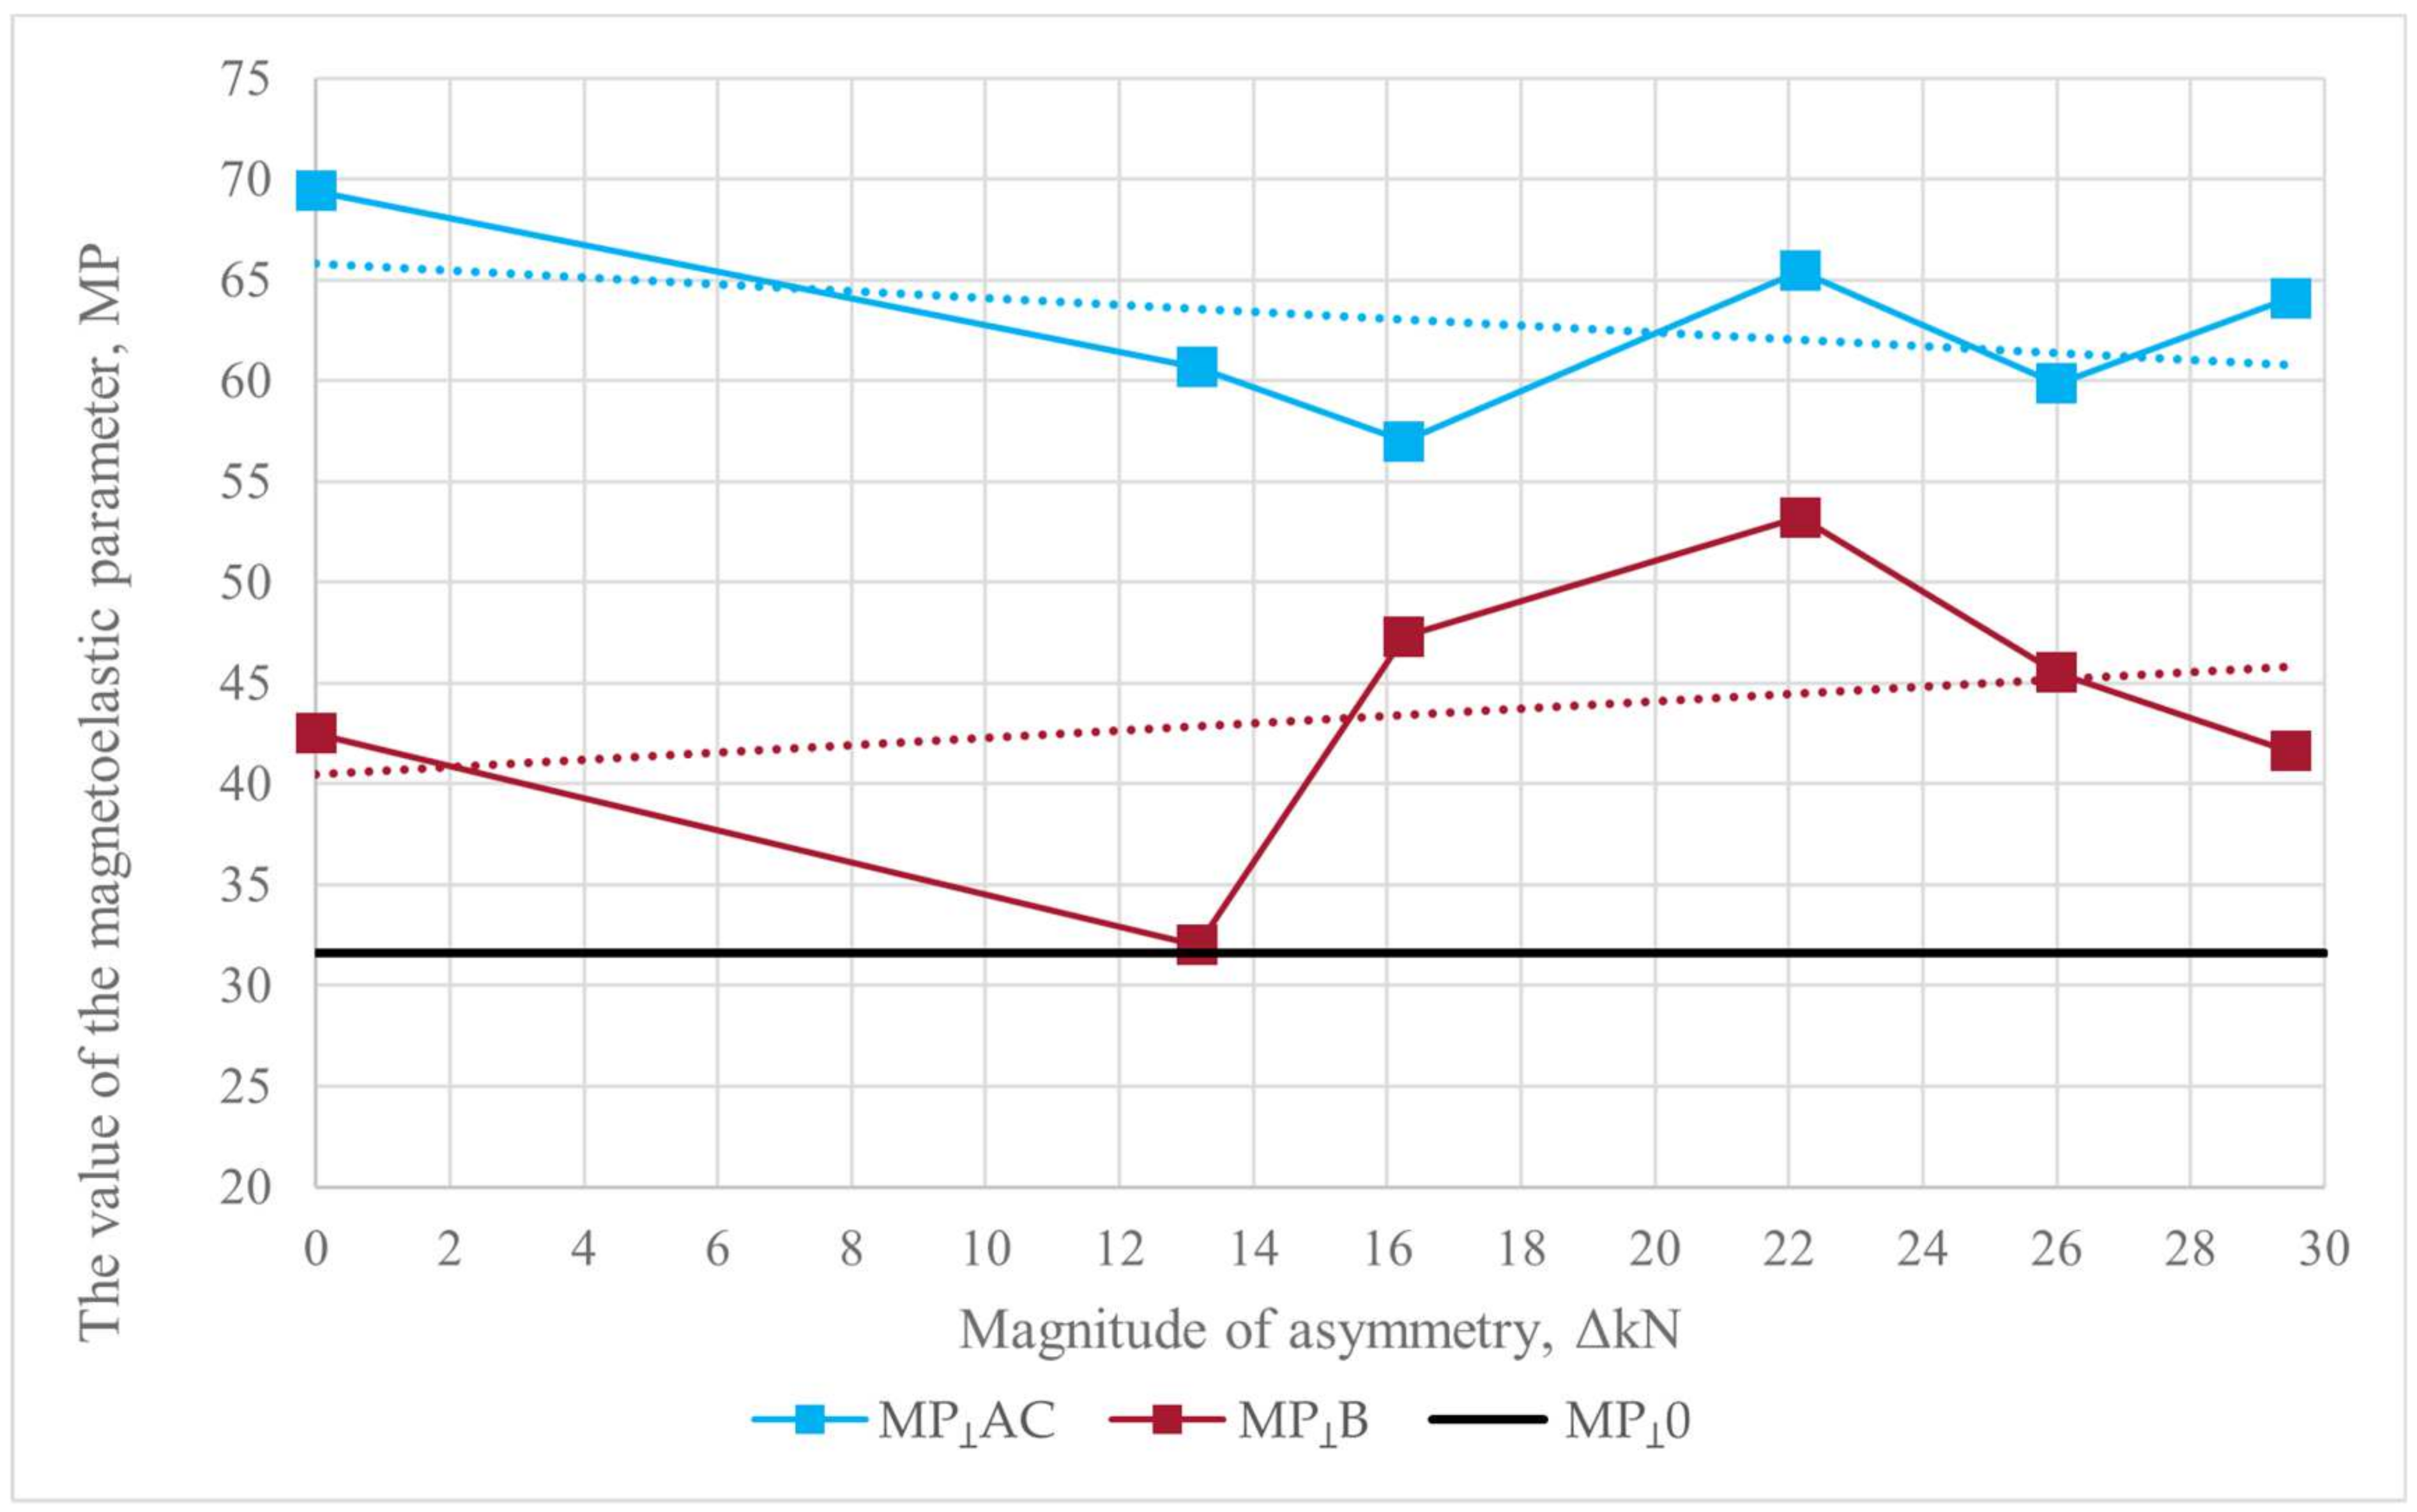
Figure 14.
Diagram of the relationship between the magnitude of the asymmetry and the value of the magnetoelastic parameter in the transverse direction. Dashed lines represent linear trend estimation for MP parameter values in given areas.
Based on an analysis of the diagram in Figure 13, there is a tendency for the value of the MP║ parameter to decrease as the magnitude of the asymmetry of the process increases in the areas along the measurement lines A and C, where the magnitude of deformation was the lowest. This means that as the asymmetry increases, the proportion of tensile stresses decreases. In contrast, in the area along measurement line B, there is no clear relationship between the magnitude of asymmetry and the MP║ parameter. Both cases can be associated with an increase in deformation (rolling reduction in one rolling pass) due to the introduction of asymmetry into the process. Accordingly, in areas A and C, there was a shift in stress toward compressive stress due to an increase in strain, while at the same time there was not much elongation in the material. In area B, on the other hand, there may have been the previously mentioned equalization between the state of tensile and compressive stresses.
Figure 14 shows the changes in the MP parameter in the direction transverse to the rolling direction (MPꓕ), depending on the magnitude of the asymmetry. In this case, the value of the MPꓕ parameter was also averaged for areas A and C.
Based on an analysis of the results shown in Figure 14, it can be seen that in the areas with less reduction (A and C), there is a tendency for the parameter MPꓕ to decrease as the asymmetry increases. This may suggest an increase in the proportion of compressive stresses in this direction. In contrast, the opposite tendency is evident for the area along line B where greater deformation occurred. In this case, the increase in asymmetry resulted in an increase in the proportion of tensile stresses. The changes in the stress state in the measured areas may have been related to changes in the transverse shape of the strips (Figure 8), causing them to curve in the transverse direction (Table 5). The relationships between the magnitudes of the transverse curvature radii of the strip and the values of the MPꓕ parameter are shown in Figure 15.
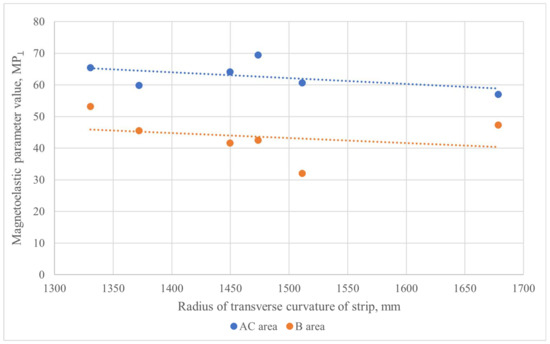
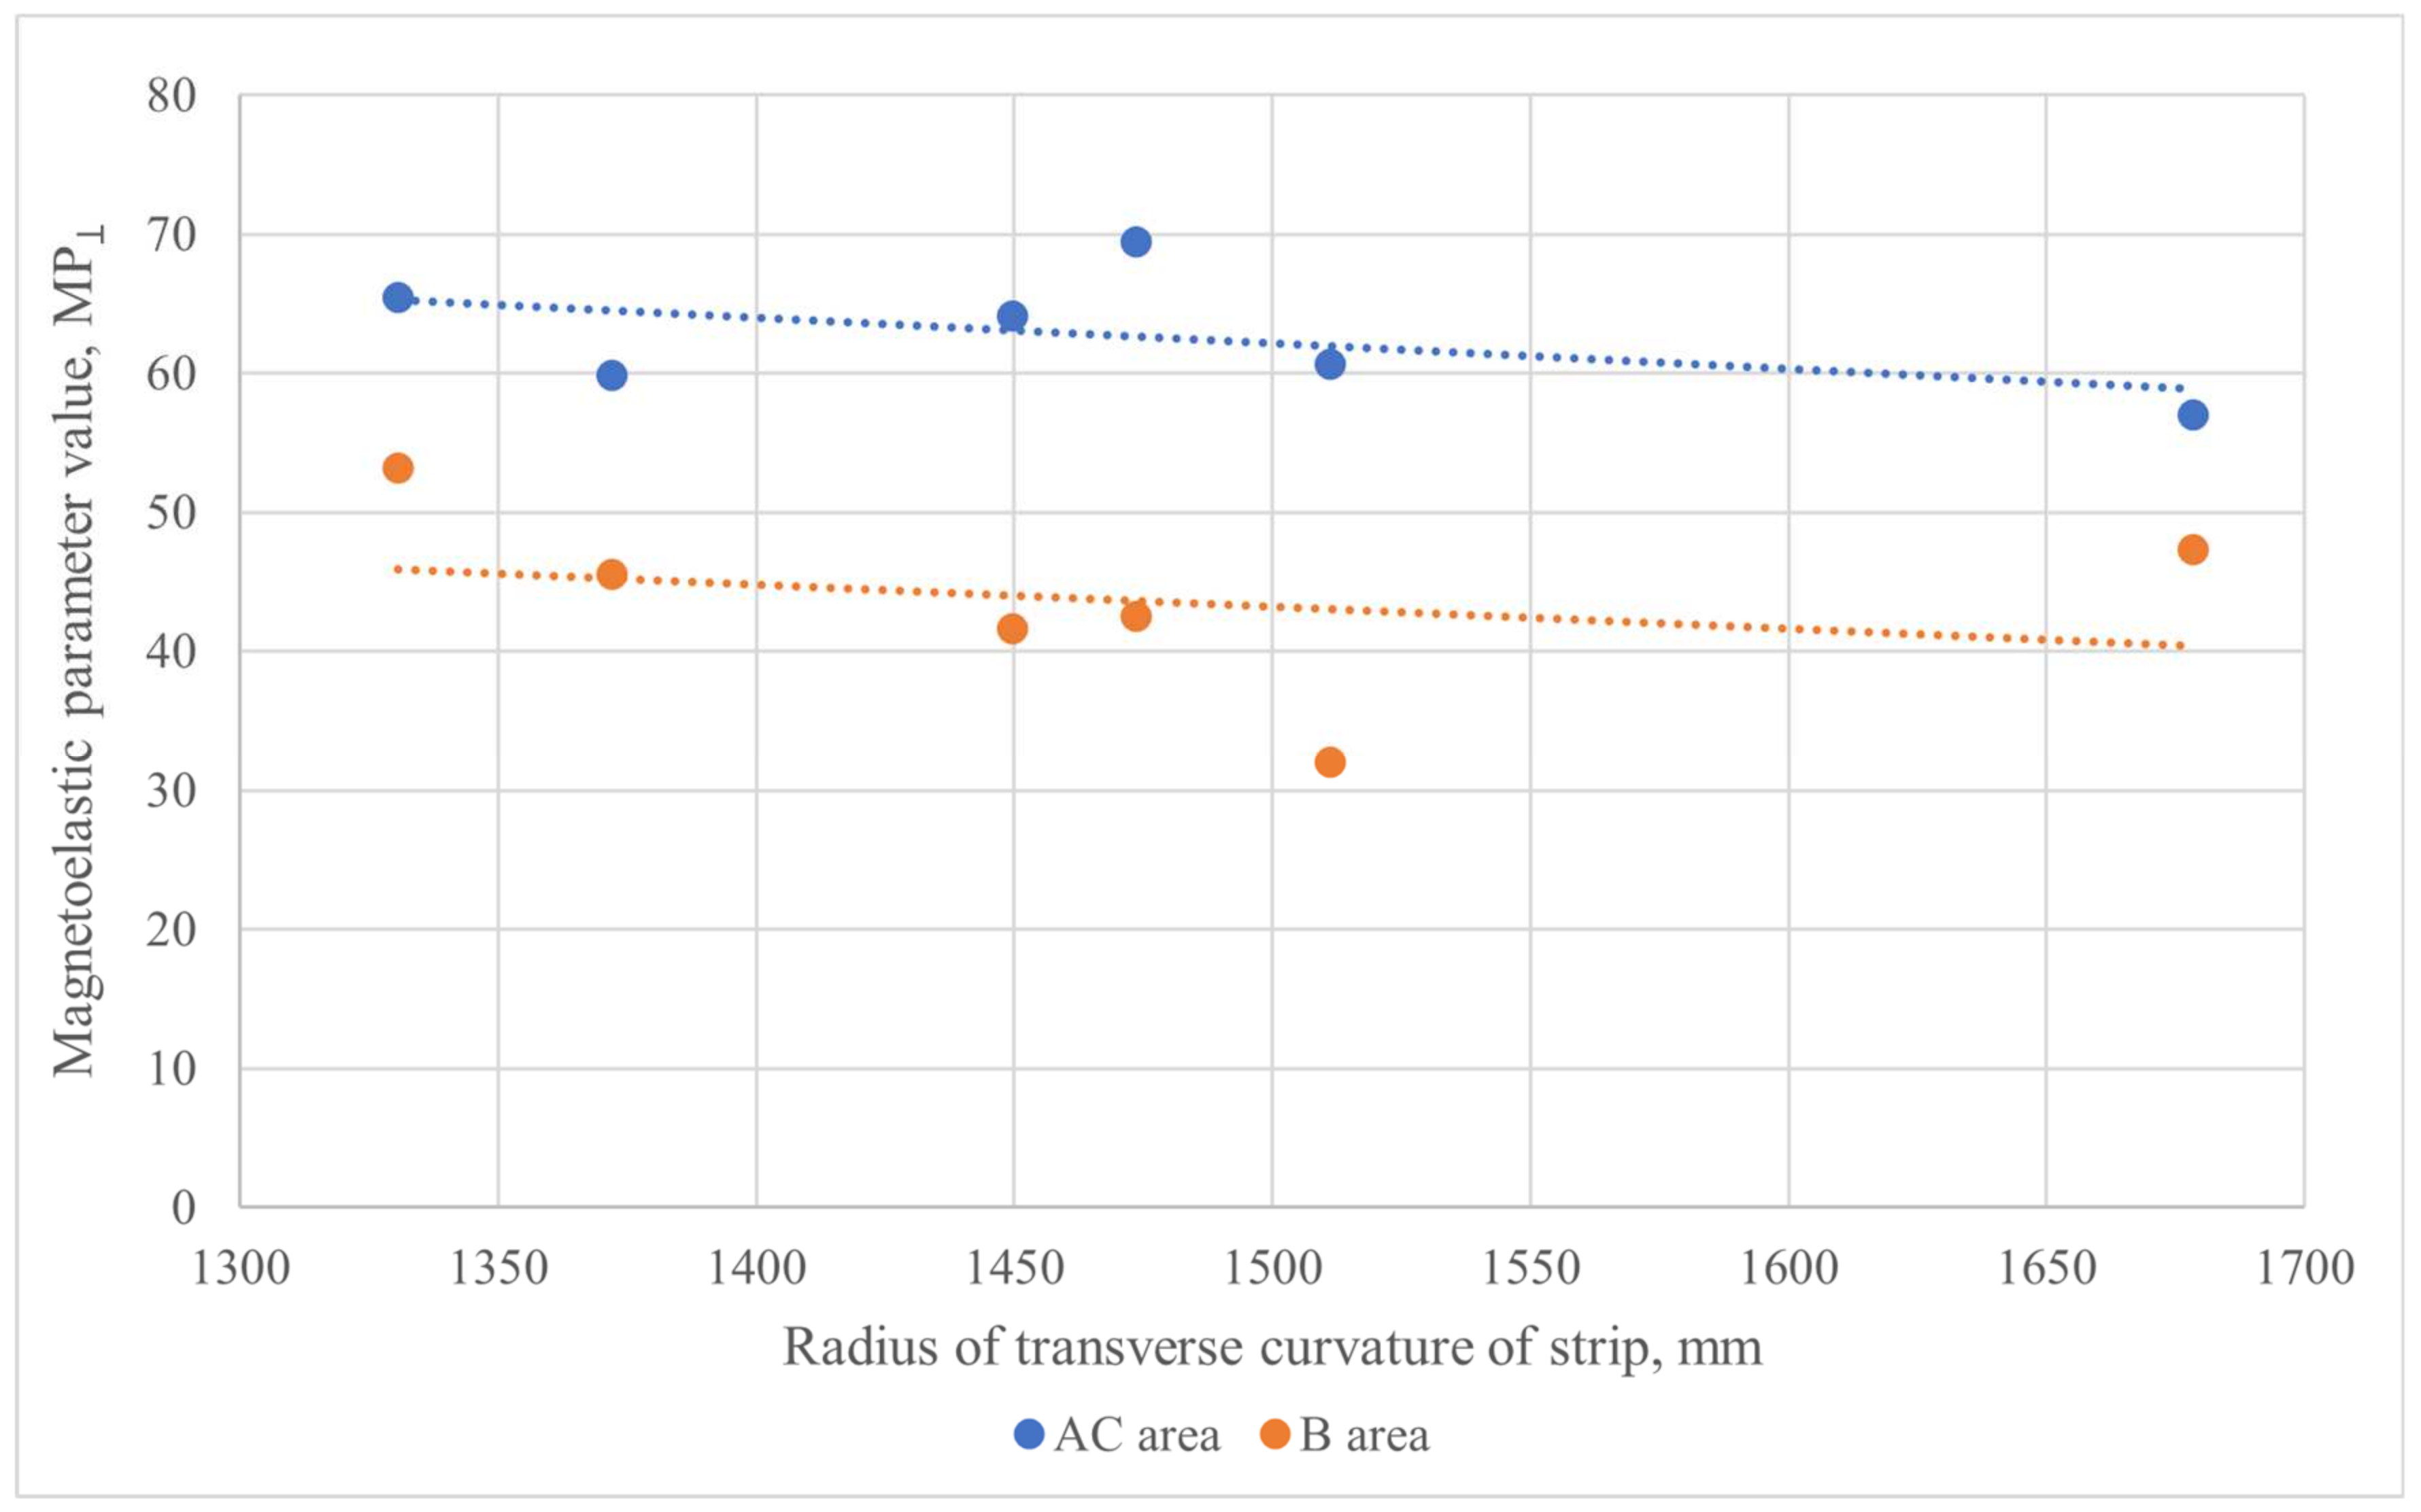
Figure 15.
Diagram of the relationship between the radius of transverse curvature of the strips and the MPꓕ parameter. Dashed lines represent linear trend estimation for MP parameter values in given areas.
An analysis of the obtained results indicates that there is some relationship between the magnitude of the transverse curvature of TRB strips and the magnitude of stresses in the transverse direction. An increase in the parameter MPꓕ may suggest an increase in the proportion of compressive stresses and a decrease in tensile stresses. A larger transverse curvature (smaller radius value) of the strip generates higher tensile stresses in this direction.
Next, the effect of the magnitude of the longitudinal curvature induced by varying strains and rolling asymmetry on changes in the magnitude of the MP parameter in the longitudinal direction was studied. The results obtained are shown in Figure 16.
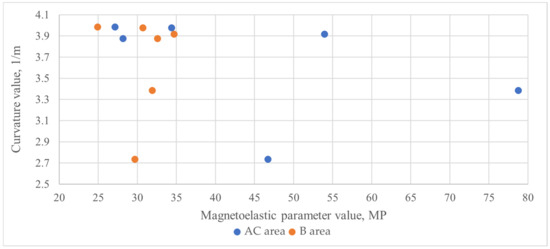
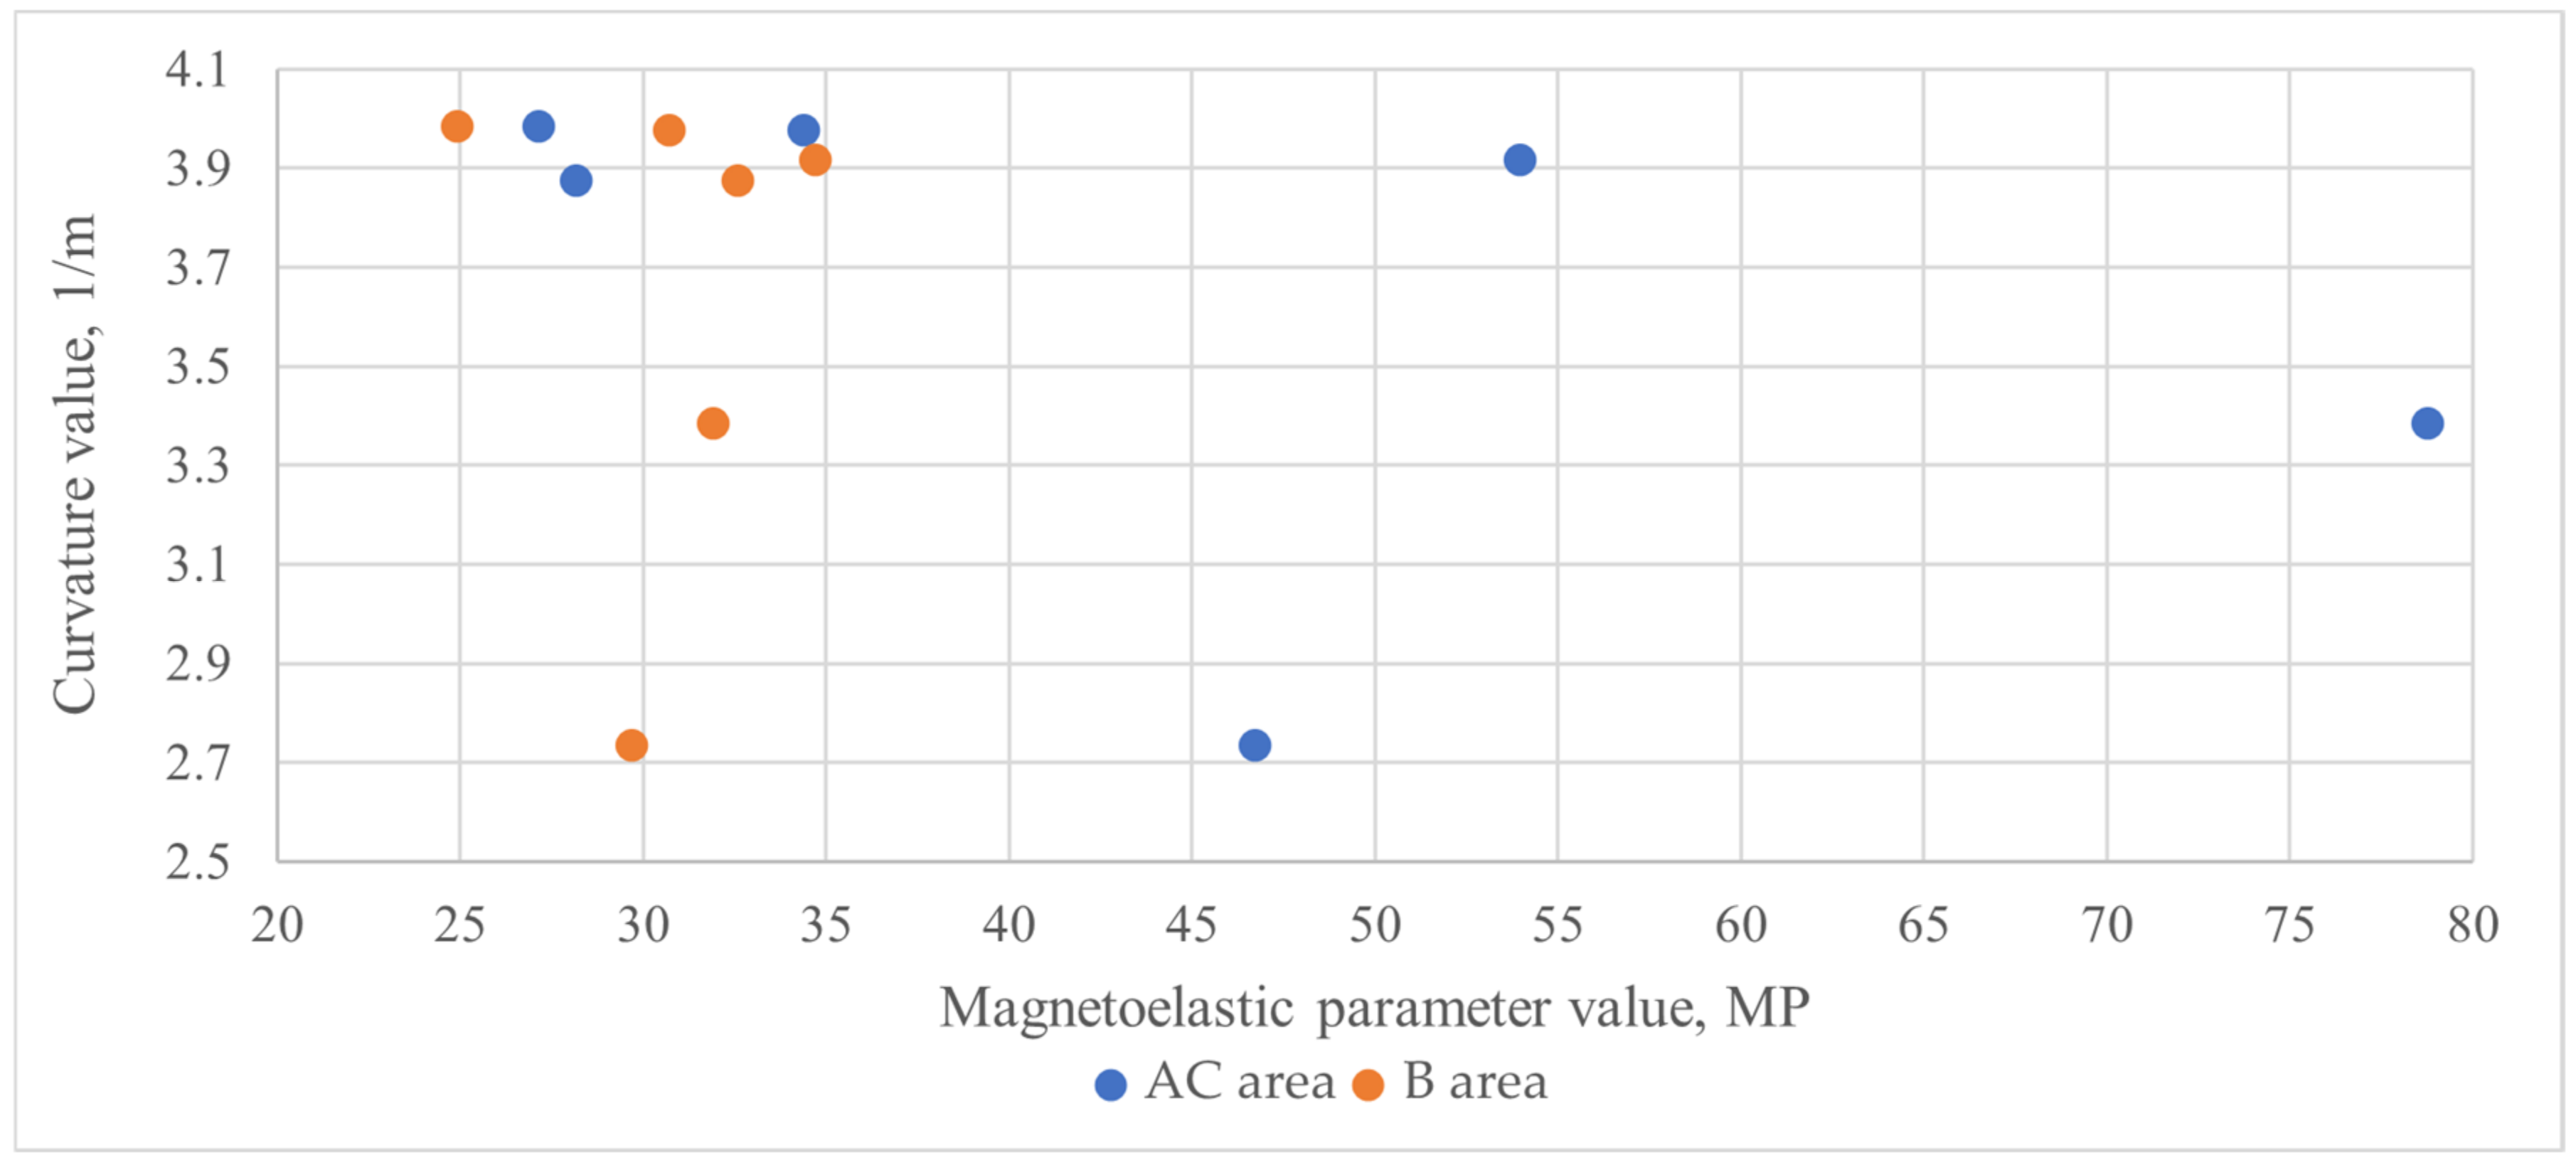
Figure 16.
Diagram of the magnitude of TRB strip curvature from the magnitude of the MP║ parameter.
Based on the results, there is no relationship between the magnitude of strip curvature and the magnitude of magnetoelastic parameters in the longitudinal direction, which is different from the assumption that they will be larger the larger the strip curvature. This may mean that the introduction of variable deformations and related changes in the shape of the specimens, as well as the asymmetry-induced elongation of the material, had a greater effect on the stress state of the material than the longitudinal curvature of the material itself.
4. Conclusions
- In order to correctly determine the changes in the magnetoelastic parameter resulting from the guided deformation state, it must first be shown that there is no texture in the material under study, which contributes to the formation of magneto-crystalline anisotropy in the material.
- The rolling process using only one groove roll induces a complex deformation state in the material, which ultimately translates into significant differences in the material’s stress state, both transverse to the rolling direction and longitudinally.
- The introduction of asymmetry into the rolling process, results in changes in the values of the material’s magnetoelastic parameter. These changes, however, are not due to the introduction of additional induced shear stresses themselves, but to changes in the magnitude of plastic strain in one pass caused by the increase in asymmetry.
- The effect of rolling asymmetry on changes in the MP parameter both longitudinally and transverse to the rolling direction is more pronounced for areas where less plastic deformation has occurred.
- The introduction of asymmetry into the TRB strip rolling process, regardless of the magnitude and type of asymmetry, affects the decrease in the forces of the process. At the same time, the asymmetry caused by variations in the speed of the rolls has a much greater effect on this decrease, compared to the asymmetry caused by differences in the values of the friction coefficient between the rolls. The use of a combination of both of these asymmetries (speed asymmetry and friction coefficient asymmetry), in every case studied, resulted in a greater decrease in forces compared to the case of using only friction coefficient asymmetry. Compared to velocity asymmetry, the decrease in forces was greater only in the case of combined asymmetry, in which the speed of the grooved roll was decreased and the value of the friction coefficient of the lower roll was reduced (through the use of a lubricant). This means that in this case, there was an overall increase in asymmetry and the associated shear stresses.
- The introduction of asymmetry into the rolling process of TRB strips, in most of the cases studied, caused an increase in strip curvature, regardless of the magnitude and type of asymmetry. Only in the case of combined asymmetry, during which the speed of the upper roll and the value of the friction coefficient of the lower roll were decreased, was a reduction in the value of curvature obtained. This was the same case in which the greatest decrease in forces during rolling was obtained. On this basis, it can be concluded that with appropriate values of the asymmetry parameters, it is possible to level the strip curvature.
- The magnitude and type of asymmetry introduced into the TRB rolling process, affects the transverse curvature of the resulting strips. Improvement in the transverse shape of the TRB strips was obtained only in cases where friction coefficient asymmetry alone was used. The remaining cases resulted in an increase in the transverse curvature of the strips, with the worst results obtained when combined asymmetry was introduced.
Author Contributions
Conceptualization, J.K. and B.S.; methodology, A.K. and N.K.; validation, M.L. and B.S.; formal analysis, J.K., A.K., M.L. and B.S.; investigation, M.G., N.K., A.K. and B.S.; writing—original draft preparation, J.K., B.S. and M.M.; visualization, M.M. All authors have read and agreed to the published version of the manuscript.
Funding
The Ministry of Science and Higher Education financed this work within the fifth edition of the Implementation PhD program. Number of project: 68.10.110.927 DWD/5/0112/2021.
Data Availability Statement
The original contributions presented in the study are included in the article material, further inquiries can be directed to the corresponding authors.
Conflicts of Interest
The authors declare no conflicts of interest.
References
- Miyazaki, Y.; Sakiyama, T.; Kodama, S. Welding Techniques for Tailored Blanks; Nippon Steel Technical Report No. 95; Nippon Steel: Tokyo, Japan, 2007; pp. 46–52. [Google Scholar]
- Zadpoor, A.; Sinke, J.; Benedictus, R. Mechanics of Tailor Welded Blanks: An Overview. Key Eng. Mater. 2007, 344, 373–382. [Google Scholar] [CrossRef]
- Kopp, R.; Wiedner, C.; Meyer, A. Flexibly rolled sheet metal and its use in sheet metal forming. Adv. Mater. Res. 2005, 6–8, 81–92. [Google Scholar] [CrossRef]
- Kopp, R.; Böhlke, P. A new rolling process for strips with a defined cross section. CIRP Ann. 2003, 52, 197–200. [Google Scholar] [CrossRef]
- Liu, X.H.; Zhi, Y. Transverse Variable Thickness Plate and Strip and Production Method. CHN 2014, 201410079260.2. [Google Scholar]
- Liu, X.H.; Wang, X.G.; Zhi, Y. A Roll System and a Flattening Rolling Method for Flattening Shape Products. CHN 2015, 201510813145.8. [Google Scholar]
- Han, S.W.; Hwang, T.A.; Oh, I.Y.; Choi, M.S.; Moon, Y.H. Manufacturing of tailor rolled blanks with thickness variations in both the longitudinal and latitudinal directions. J. Mater. Proc. Technol. 2018, 256, 172–182. [Google Scholar] [CrossRef]
- Wang, X.G.; Wang, S.; Liu, X.H. Variable thickness rolling of plates thick in the middle and thin on the sides. J. Mater. Process. Technol. 2020, 277, 116432. [Google Scholar] [CrossRef]
- Gautam, V.; Kumar, A. Experimental and numerical studies on formability of tailor welded blanks of high strength steel. Procedia Manuf. 2019, 29, 472–480. [Google Scholar] [CrossRef]
- Meyer, A.; Wietbrock, B.; Hirt, G. Increasing of the drawing depth using tailor rolled blanks—Numerical and experimental analysis. Int. J. Mach. Tools Manuf. 2008, 48, 522–531. [Google Scholar] [CrossRef]
- Kawałek, A.; Laber, K.; Ozhmegov, K. Analysis of changes in geometric and force-energy parameters in plate rolling process with various types of asymmetry. Met. Form. 2018, 29, 229–242. [Google Scholar]
- Kraner, J.; Smolar, T.; Volšak, D.; Cvahte, P.; Godec, M.; Paulin, I. A review of asymmetric rolling. Mater. Tehnol. 2020, 54, 731–743. [Google Scholar] [CrossRef]
- Zhang, S.H.; Zhao, D.W.; Gao, C.R.; Wang, G.D. Analysis of asymmetrical sheet rolling by slab method. Int. J. Mech. Sci. 2012, 65, 168–176. [Google Scholar] [CrossRef]
- Ji, Y.H.; Park, J.J. Development of severe plastic deformation by various asymmetric rolling processes. Mater. Sci. Eng. 2009, 499, 14–17. [Google Scholar] [CrossRef]
- Markowski, J.; Dyja, H.; Knapiński, M.; Kawałek, A. Theoretical analysis of the asymmetric rolling of sheets on leader and finishing stands. J. Mater. Process. Technol. 2003, 138, 183–188. [Google Scholar] [CrossRef]
- Fajfar, P.; Lah, A.Š.; Kraner, J.; Kugler, G. Asymmetric rolling process. RMZ—Mater. Geoenvironment 2017, 64, 151–160. [Google Scholar] [CrossRef]
- Polkowski, W.; Jóźwik, P. Wpływ współczynnika asymetrii prędkości walców na zmiany struktury i tekstury miedzi w procesie ASR. In Proceedings of the XL Szkoła Inżynierii Materiałowej, Kraków, Poland, 24–27 September 2012; pp. 380–385. [Google Scholar]
- Polkowski, W.; Zasada, D.; Jóźwik, P. Struktura i umocnienie żelaza Armco odkształconego metodą asymetrycznego walcowania (ASR). In Proceedings of the XLI Szkoła Inżynierii Materiałowej Kraków, Krynica, Poland, 24–27 September 2013; pp. 450–454. [Google Scholar]
- Cai, Z.; Wu, Z.; Ma, L.; Wang, Y.; Zhi, C.; Lei, J. Fabrication of Mg-Sn-Y/Al6061 Composite Plates by Asymmetrical Rolling with Differential Temperatures and their Microstructures and Mechanical Properties. J. Miner. Met. Mater. Soc. 2023, 75, 2924–2934. [Google Scholar] [CrossRef]
- Gudur, P.P.; Salunkhe, M.A.; Dixit, U.S. A theoretical study on the application of asymmetric rolling for the estimation of friction. Int. J. Mech. Sci. 2008, 50, 315–327. [Google Scholar] [CrossRef]
- Pesin, A.; Pustovoytov, D. Influence of process parameters on distribution of shear strain through sheet thickness in asymmetric rolling. Key Eng. Mater. 2014, 622–623, 929–935. [Google Scholar] [CrossRef]
- Neslušan, M.; Minárik, P.; Čep, R.; Ondruš, J.; Pitoňák, M.; Zgútová, K. Measurement of bearing capacity of steel road barrier flange via Barkhausen noise emission. Eng. Fail. Anal. 2024, 156, 107804. [Google Scholar] [CrossRef]
- Garstka, T. System pomiarowy do badań właściwości wyrobów stalowych z wykorzystaniem zjawiska Barkhausena. Pomiary Autom. Robot. 2008, 6, 58–61. [Google Scholar]
- Dong, H.; Liu, X.; Song, Y.; Wang, B.; Chen, S.; He, C. Quantitative evaluation of residual stress and surface hardness in deep drawn parts based on magnetic Barkhausen noise technology. Measurement 2021, 168, 108473. [Google Scholar] [CrossRef]
- Cullity, B.D.; Stock, S.R. Elements of X-ray Diffraction, 3rd ed.; Prentice-Hall: Hoboken, NJ, USA, 2001. [Google Scholar]
- Stylianou, R.; Tkadles, M.; Schalk, N.; Penoy, M.; Czettl, C. Effects of reference materials on texture coefficients determined for a CVD α-Al2O3 coating. Surf. Coat. Technol. 2019, 359, 314–322. [Google Scholar] [CrossRef]
- Kawałek, A.; Dyja, H.; Ozhmegov, K. Analysis of the process of plate rolling on the reversing mill. J. Chem. Technol. Metall. 2020, 55, 507–515. [Google Scholar]
- Kawałek, A. Forming of band curvature in asymmetrical rolling process. J. Mater. Process. Technol. 2004, 155–156, 2033–2038. [Google Scholar] [CrossRef]
- Akbari Mousavi, S.A.A.; Ebrhimi, S.M.; Madoliat, R. Three dimensional numerical analyses of asymmetric rolling. J. Mater. Process. Technol. 2007, 187–188, 725729. [Google Scholar]
- Su, H.; Hou, L.; Tian, Q.; Wang, Y.; Zhuang, L. Understanding the bending behavior and through thickness strain distribution during asymmetrical rolling of high strength aluminium alloy plates. J. Mater. Res. Technol. 2023, 22, 1462–1475. [Google Scholar] [CrossRef]


Disclaimer/Publisher’s Note: The statements, opinions and data contained in all publications are solely those of the individual author(s) and contributor(s) and not of MDPI and/or the editor(s). MDPI and/or the editor(s) disclaim responsibility for any injury to people or property resulting from any ideas, methods, instructions or products referred to in the content. |
© 2024 by the authors. Licensee MDPI, Basel, Switzerland. This article is an open access article distributed under the terms and conditions of the Creative Commons Attribution (CC BY) license (https://creativecommons.org/licenses/by/4.0/).