Article

Crystal Structures, Molecular Docking and In Vitro Investigations of Two 4-Substituted 2-(5,5-dimethyl-3-styrylcyclohex-2-enylidene)malononitrile Derivatives as Potential Topoisomerase II Inhibitors

1
Department of Biochemical Pharmacology & Drug Design, Institute of Molecular Biology “Roumen Tsanev”, Bulgarian Academy of Sciences (BAS), Acad. G. Bonchev Str., bl. 21, 1113 Sofia, Bulgaria
2
Department of Science, University of Basilicata, Via dell’Ateneo Lucano 10, 85100 Potenza, Italy
3
Department of Chemistry, University of Bielefeld, Universitätsstr. 25, 33615 Bielefeld, Germany
*
Author to whom correspondence should be addressed.
Crystals 2024, 14(6), 496; https://doi.org/10.3390/cryst14060496
Submission received: 3 May 2024 / Revised: 21 May 2024 / Accepted: 22 May 2024 / Published: 24 May 2024
(This article belongs to the Section Biomolecular Crystals)

Abstract

:
Type II topoisomerases (TOP2s) play a key role in altering the DNA topology by transiently cleaving both strands of a DNA duplex. Therefore, increased TOP2 activity is associated with many cancers. Herein, we present the synthesis, structural characterization, virtual screening, and structural exploration, as well as evaluation of the antiproliferative effects of two new 4-substituted 2-(5,5-dimethyl-3-styrylcyclohex-2-enylidene)malononitrile derivatives with potential application in the drug design of isoform-specific TOP2 inhibitors. Both compounds 1 and 2 were verified by ESI-TOF-MS, NMR, and single-crystal X-ray diffraction (SCXRD) analysis. Furthermore, we applied our recently proposed SCXRD/HYdrogen DEsolvation (HYDE) technology platform in order to perform molecular modeling, virtual screening, and structural exploration with 1 and 2. For this purpose, we used the crystal structure of human TOP2β complexed to DNA and the anticancer drug etoposide. Moreover, we further evaluated the antiproliferative activity of 1 and 2 on human hepatocarcinoma HepG2 cells and compared the observed effects with those of the reference hTOP2β inhibitor etoposide. Based on the obtained results, compounds 1 and 2 showed a virtually higher binding affinity (Ki HYDE values) over etoposide towards hTOP2β but lower antiproliferative activity compared to those of etoposide.

1. Introduction

Topoisomerases type II (TOP2s) are crucial enzymes in altering the DNA topology by cleaving both strands of a DNA duplex with the active participation of Mg2+ and energy from ATP hydrolysis [1,2,3,4]. Human TOP2s comprise two isoforms, topoisomerase IIA (TOP2α) and IIB (TOP2β) [1,2,3]. TOP2s play a key role in the formation of a TOP2–DNA cleavage complex through an enzyme-bridged “DNA-gate”, leading to enzyme-mediated DNA breakage and the ultimate death of cancer cells [1,2]. TOP2α is involved in DNA replication, recombination, and chromosome condensation and segregation, while the TOP2β isoform regulates DNA transcription [1,2,3]. Therefore, TOP2s are recognized as biological targets of several approved anticancer drugs [1,4,5]. Etoposide (brand name Vepesid®), for example, is a TOP2 poison targeting both TOP2 isoforms [1,5,6]. Etoposide leads to increased levels of TOP2–DNA covalent complexes via trapping and drug-induced stabilization, generating DNA strand breaks [4,5]. It is widely used in the treatment of different types of cancer, including prostate cancer, lymphoma, myelocytic leukemia, lung cancer, neuroblastoma, and others [4,5,6,7,8,9]. Other examples of chemotherapeutics able to fill up the spaces within the nucleotides in the double DNA helix include doxorubicin and idarubicin [10,11]. Teniposide, an analog of etoposide, was discovered and clinically tested for its anticancer activity before etoposide [4,12,13]. Teniposide has a similar mechanism of action to that of etoposide, causing DNA double-stranded breaks via the stabilization of the DNA–TOP2 complexes [4,14]. Although teniposide was approved by the FDA in 1992, nine years after the FDA approval of etoposide, the adverse effects caused in patients were the reason for its slower development as a drug [4,15].
In the present study, we aim (i) to estimate the potential of two new malononitrile derivatives (designated as compounds 1 and 2) as inhibitors of human TOP2β and (ii) to evaluate their antiproliferative effects on the human hepatocarcinoma HepG2 cell line in comparison with the anticancer drug etoposide (for structures, see Figure 1). For this purpose, we applied our recently proposed single-crystal X-ray diffraction (SCXRD)/HYdrogen DEsolvation (HYDE) technology platform to design new isoform-specific hTOP2-targeting agents [16]. Therefore, compounds 1 and 2 were synthesized and structurally characterized. The single-crystal X-ray structures of both compounds were further used to perform initial molecular docking and virtual screening of the generated conformers in order to predict their binding affinity (so called Ki HYDE values) towards hTOP2β and the thermodynamic profile of binding. In addition, the structural exploration of the basic scaffold of 1 and 2 was conducted with the aim of virtually generating a set of optimized hTOP2 inhibitors. Finally, we investigated the antiproliferative effects of 1 and 2 on HepG2 cells and compared them with those observed for the reference anticancer agent etoposide.

2. Materials and Methods

2.1. General Methods

Chemicals: All commercially available anhydrous solvents, reagents, and starting materials were used without purification and in accordance with the producer’s specifications. Etoposide (≥99%, CAS#: 33419-42-0) was obtained from Key Organics Ltd. (Camelford, UK). The starting building blocks were 2-(3,5,5-trimethylcyclohex-2-en-1-ylidene)malononitrile (3, >98%, CAS#: 23051-44-7) 4-cyanobenzaldehyde (4, ≥99%, CAS#: 105-07-7), and 4-methylbenzaldehyde (5, 95–98%, CAS#: 104-87-0) and were obtained from Merck/Sigma-Aldrich (St. Louis. MO, USA) and used directly for the synthesis of compounds 1 and 2 in the presence of piperidine (for synthesis, CAS#: 110-89-4, Sigma-Aldrich, St. Louis, MO, USA) (see Supporting Information, Figure S1). The solvent N,N-dimethyl sulfoxide (DMSO, anhydrous ≥ 99.9%, CAS#: 67-68-5, Sigma-Aldrich, St. Louis, MO, USA) was used for the preparation of stock and lysis solutions for the MTT assay.
General techniques: Reactions were monitored by thin-layer chromatography (TLC) using pre-coated silica gel plates and visualized with UV light (Merck 60 F254, 230–400 mesh). Preparative column chromatography was performed on a Supelco® silica gel 60 Å (63–200 µm, 70–230 mesh) (Sigma-Aldrich Chemie GmbH, Schnelldorf, Germany). Solvents were removed in vacuo on a LabTech EV400H rotary evaporator (Lab Tech Srl, Sorisole, Italy) equipped with an SC 920 G vacuum pump system (KNF Neuberger GmbH, Freiburg, Germany). Melting points are uncorrected and were measured on a Büchi B-535 apparatus (Büchi Labortechik AG, Flawil, Switzerland).
NMR measurements: 1H and 13C spectra were recorded on a Bruker Avance III HD Ascend 500 MHz spectrometer (Bruker Corp., Billerica, MA, USA). All NMR spectra were acquired at room temperature (298 K) in DMSO-d6 as a solvent. Chemical shifts (δ) were reported in parts per million (ppm) relative to the residual solvent peaks in the corresponding spectra: DMSO-d6 δ 2.50 (for 1H) and 39.51 (for 13C). The coupling constants J were given in Hertz (Hz), while the spin multiplicities were given as singlet (s), doublets (d), doublet of doublets (dd), triplet (t), doublet of triplets (dt), quartet (q), and multiplet (m).
ESI-TOF-MS: The mass spectra of compounds were obtained using electrospray ionization (ESI) time-of-flight (TOF) mass spectrometry (MS). The LC-ESI-MS spectra were measured on a micrOTOF-Q III instrument (Bruker Daltonics, Bremen, Germany) using α-cyano-4-hydroxycinnamic acid (HCCA) or sinapinic acid (SA) as a matrix (see Supporting Information). The spectra were analyzed using Bruker Compass DataAnalysis 4.4 software.

2.2. Synthesis

Compounds 1 and 2 were synthesized, as described in the literature [17]. The appropriate benzaldehyde (4 or 5) and 2-(3,5,5-trimethylcyclohex-2-en-1-ylidene)malononitrile (3) were dissolved in ethanol, treated with piperidine and stirred at 60 °C under argon atmosphere for 50 min (cf. Figure S1). The solvent was removed in vacuo, and the residue (colored sticky solid) was purified by column chromatography on silica gel.
Compound 1, (E)-2-(3-(4-cyanostyryl)-5,5-dimethylcyclohex-2-en-1-ylidene)malononitrile: A mixture of 4-cyanobenzaldehyde (4, 0.500 g, 3.81 mmol) and 3 (0.789 g, 4.23 mmol) in ethanol (10 mL) was treated with piperidine (0.42 mL, 4.23 mmol) to yield 0.64 g, 2.13 mmol, and 56% of a red crystalline solid (eluent: dichloromethane/methanol, 95/5, v/v, Rf = 0.82). Mp 239–240 °C. 1H NMR (500 MHz, DMSO-d6) δ 7.86 (s, 4H), 7.58 (d, J = 16.2 Hz, 1H), 7.31 (d, J = 16.2 Hz, 1H), 6.96 (s, 1H), 2.62 (s, 2H), 2.54 (s, 2H), 1.01 (s, 6H). 13C NMR (126 MHz, DMSO-d6) δ 170.66, 155.22, 141.05, 135.59, 133.39, 133.18 (2 × CH), 128.74 (2 × CH), 124.87, 119.25, 114.08, 113.27, 111.51, 78.30, 42.71, 38.52, 32.14, 27.87 (2 × Me). ESI-TOF-MS (m/z) was calcd. for C20H17N3: 299.377; 300.200 [M+H]+ and 322.213 [M+Na]+ were found. Crystals were grown by the slow evaporation of the dissolving solvent acetonitrile at room temperature.
Compound 2, (E)-2-(3-(5,5-dimethyl-3-(4-methylstyryl)cyclohex-2-en-1-ylidene)malononitrile: A mixture of 4-methylbenzaldehyde (5, 0.500 g, 4.16 mmol) and 3 (0.860 g, 4.62 mmol) in ethanol (10 mL) was treated with piperidine (0.46 mL, 4.62 mmol) to yield 0.79 g, 2.75 mmol, and 66% of a yellow crystalline solid (eluent: dichloromethane/methanol, 95/5, v/v, Rf = 0.94). Mp 152–153 °C. 1H NMR (500 MHz, DMSO-d6) δ 7.58 (d, J = 8.1 Hz, 2H), 7.34 (d, J = 16.2 Hz, 1H), 7.24 (d, J = 16.3 Hz, 1H), 7.23 (s, 2H), 6.85 (s, 1H), 2.59 (s, 2H), 2.53 (s, 2H), 2.32 (s, 3H), 1.00 (s, 6H). 13C NMR (126 MHz, DMSO-d6) δ 170.84, 156.51, 140.00, 138.09, 133.70, 130.03 (2 × CH), 129.03, 128.32 (2 × CH), 122.91, 114.38, 113.55, 76.48, 42.77, 38.60, 32.12, 27.88 (2 × Me), 21.48. ESI-TOF-MS (m/z) was calcd. for C20H20N2: 288.394; 289.179 [M+H]+ and 311.170 [M+Na]+ were found. Crystals were grown by the slow evaporation of the dissolving solvent acetonitrile at room temperature.

2.3. Single-Crystal X-ray Diffraction (SCXRD)

A single crystal of compound 1 or 2 was examined on a Rigaku Supernova diffractometer using Cu Kα (for 1) or Mo Kα (for 2) radiation, and data were collected at 100 or 95 K, respectively (Table 1). Data were processed using the Olex2 suite [18], and the structures were solved with the ShelXT structure solution program [19] using intrinsic phasing. The structure of compound 1 was subsequently refined as a racemic twin with the ShelXL [20] refinement package using Least Squares minimization. The disorder of the S and R enantiomers of the carbon atom C14 had a ratio of 82:18. Suitable restraints and constraints were applied. The structure of compound 2 was refined with the olex2.refine [21] refinement package using Gauss-Newton minimization. Hydrogen atoms were refined anisotropically. Subsequent refinement was performed using No-spherA2, which is the implementation of non-spherical atom-form factors in Olex2 [22].
The CCDC deposition numbers 2350475 and 2350476 contain the supplementary crystallographic data for both compounds in this paper and can be obtained on request from the Cambridge Crystallographic Data Centre (CCDC).

2.4. Molecular Modeling

2.4.1. Protein Preparation and Ligand-Protein Docking

All molecular modeling studies were performed using the SeeSAR software tool [23]. The preparation of the protein binding site and subsequent molecular docking were carried out by applying the respective integrated modules, as described previously [16]. The X-ray structure of human topoisomerase II beta (hTOP2β) in complex with DNA and the anticancer drug etoposide (PDB accession code: 3QX3) [2] was used as an input 3D structure for molecular docking experiments. Based on an initial HYDE visual assessment for the two crystallographically recorded ligand positions (EVP_A_1 vs. EVP_D_1) in the etoposide-hTOP2β–DNA complex, we chose hTOP2β chain β, containing DNA chains D, E and F and ligand EVP_D_1 for all further computations. The ligand (e.g., EVP_D_1) possesses better estimated binding affinity compared to chain α (EVP_A_1 vs. EVP_D_1, mM vs. µM range). The single X-ray structures (CCDC dep. no. 2350475 and 2350476) were used as 3D input ligands for docking experiments (e.g., the major occupied part of compound 1 and only one molecule of compound 2). The 3D structure of each ligand was processed using the integrated standard docking module in SeeSAR and the generated poses (max. 10) for each ligand–protein complex were then post-processed with the HYdrogen DEsolvation (HYDE) algorithm in SeeSAR. After the visual inspection and re-scoring assessment, the best-scored docking poses of each ligand were then selected for further discussions, e.g., estimation of binding affinities, binding modes, and thermodynamic profiling [16]. Further structural optimizations using the molecular editor module in SeeSAR and subsequent re-scoring were not required. The obtained ligand’s best-scored poses showed high quality in terms of torsion/bindings and intra- and intermolecular clashes (e.g., HYDE estimated green points).

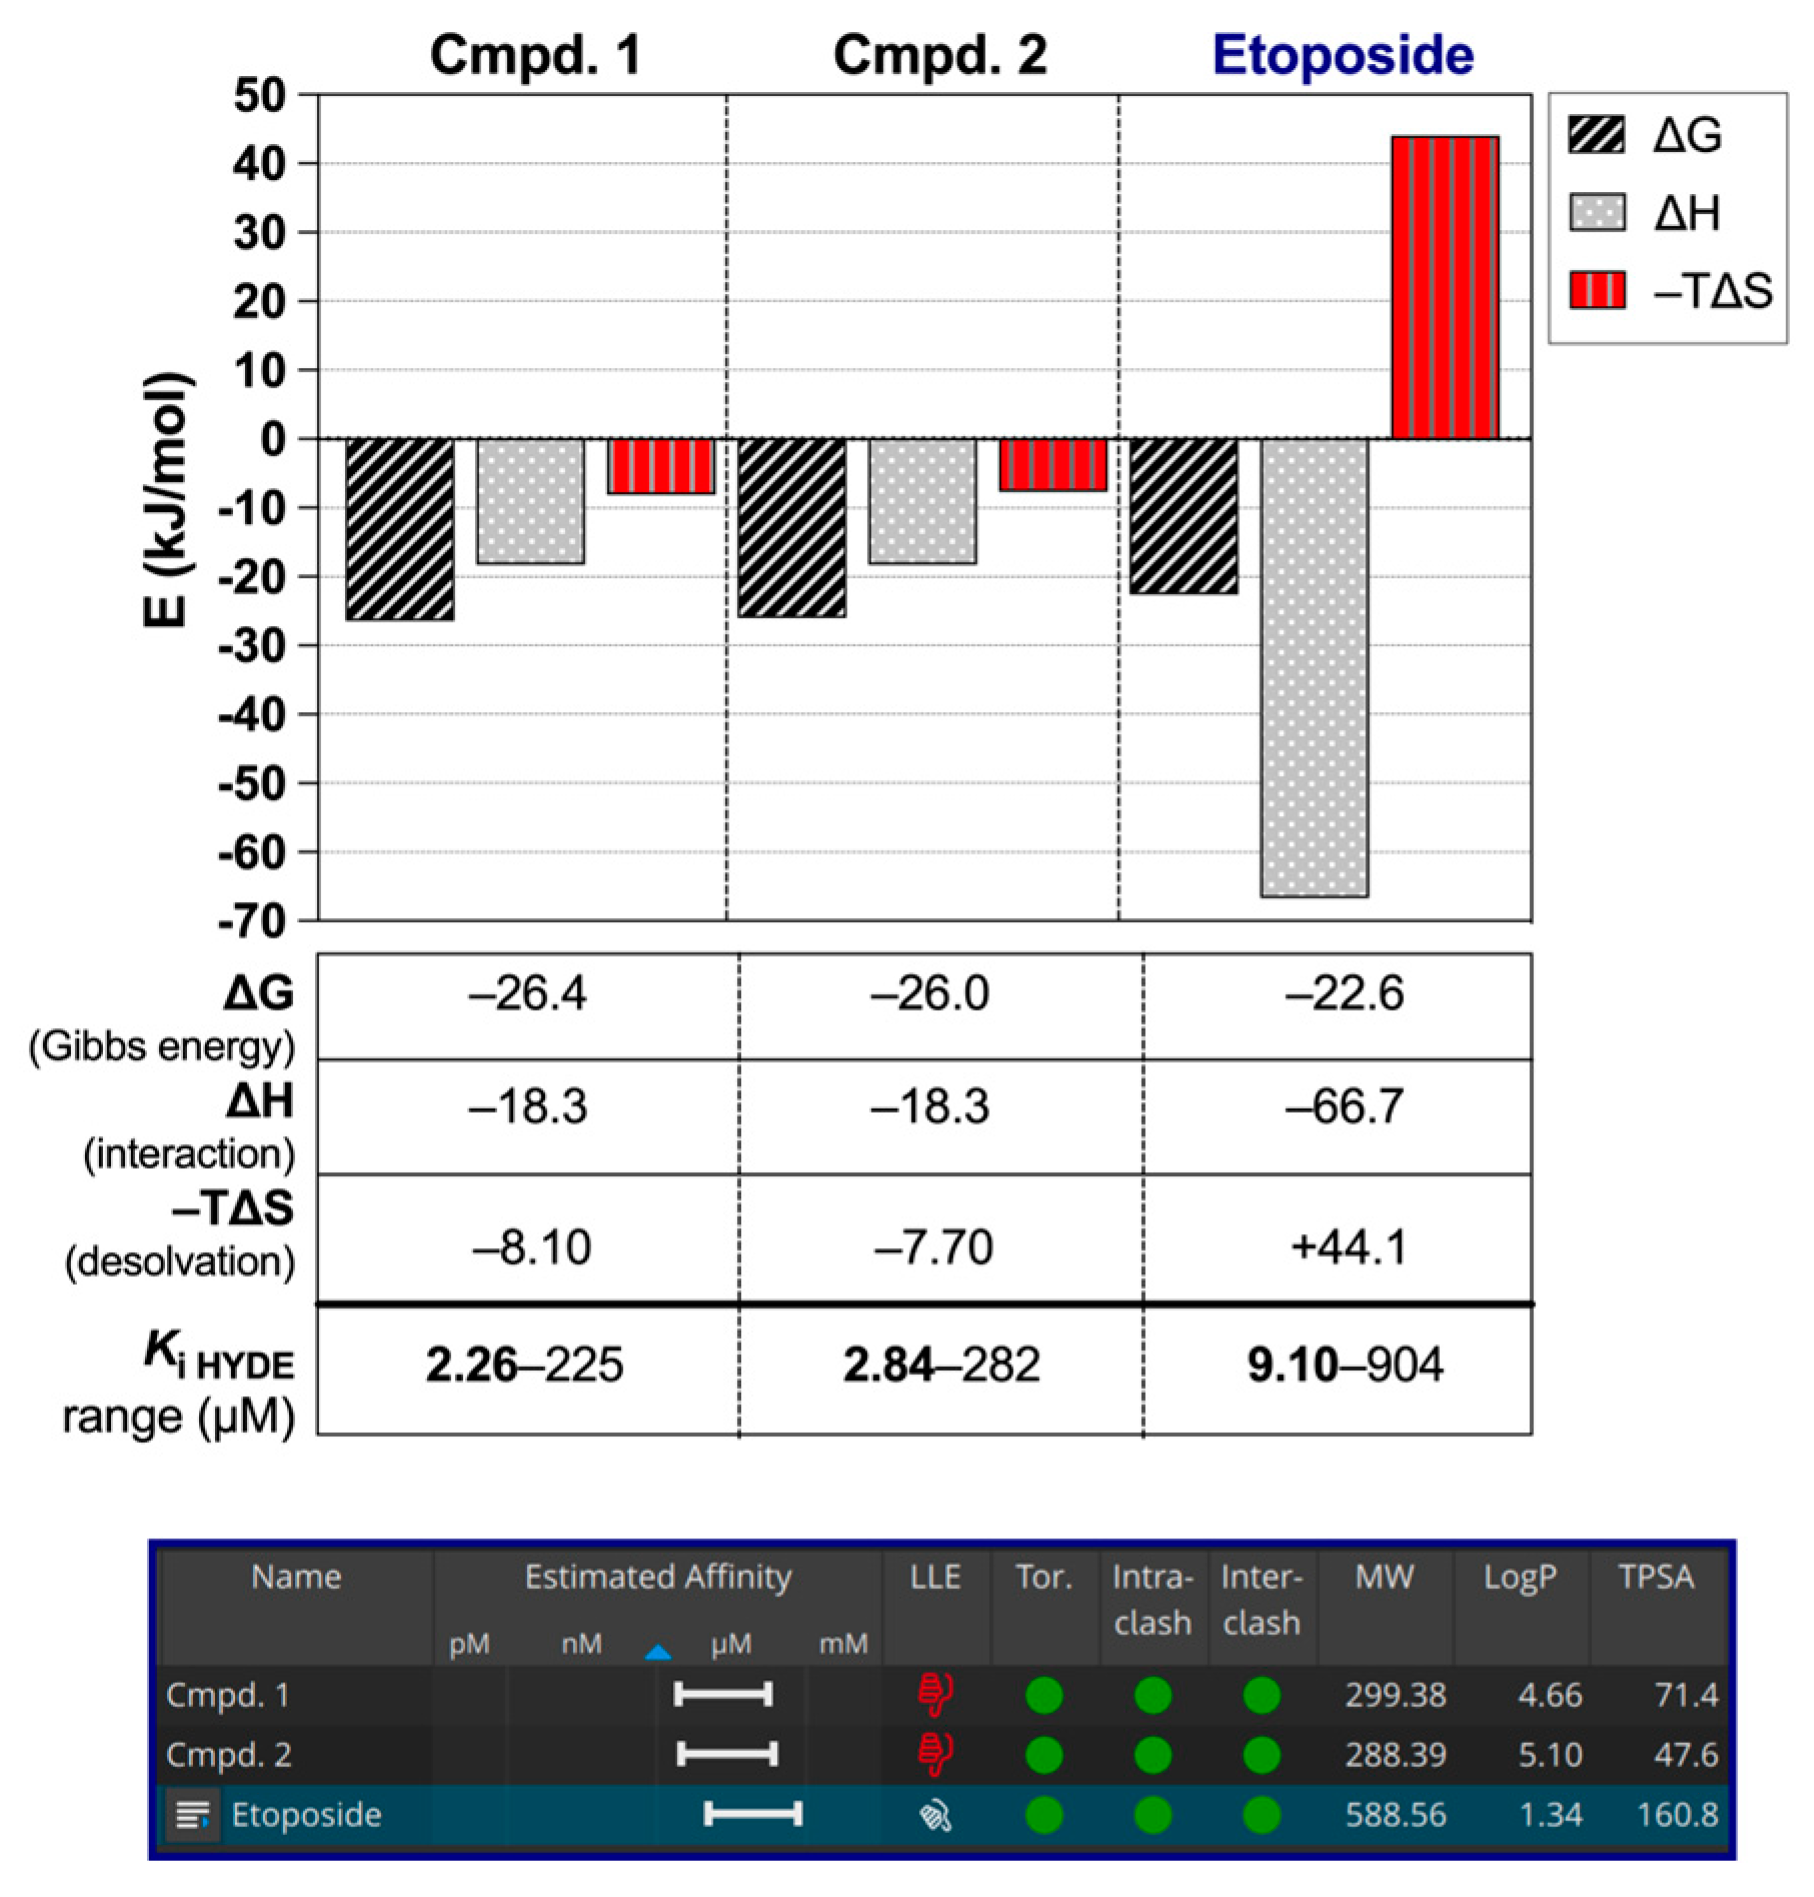
2.4.2. HYDE Scoring and Visual Assessment

The scoring function HYDE is used for the rapid prediction of binding affinities (ΔG, in kJ/mol), as implemented in SeeSAR [23]. Considering the hydrogen bonds/salt bridges (approximately interpreted as the hydrogen term ΔH) and dehydration terms (approximately interpreted as the desolvation term–TΔS), SeeSAR visualizes the (HYDE-)estimated free energy of binding ΔG, in kJ/mol) using translucent spheres (HYDE “coronas”) that are colored from deep red (very unfavorable) to dark green (very favorable for affinity [16,24,25,26,27]. As a result, SeeSAR estimates the binding affinity (represented as Ki HYDE ranges) and other relevant physicochemical parameters such as the approximate lipophilic ligand efficiency (LLEHYDE), ligand efficiency (LE), and others [16]. Therefore, based on the obtained HYDE score, the docked poses of ligands were ranked and visually inspected under consideration for their torsional quality and intra- and intermolecular clashes [25].

2.5. Evaluation of Cell Viability

The cytotoxicity and antiproliferation of the reference etoposide and the investigated compounds 1 and 2 (100 mM stock solutions in DMSO with final concentration ≤0.5% v/v) was evaluated on the human hepatocellular carcinoma (HepG2; ATCC, Manassas, VA, USA) cell line using a colorimetric MTT assay with slight modifications [28]. Cells in their exponential phase of growth were seeded into 96-well flat-bottom plates (0.5 × 10⁵ cells/mL) at a final volume of 100 µL/well and incubated overnight before treatment with the test substances. All compounds were tested in the concentration range of 1.0–500 µM and incubated for 24 or 72 h at 37 °C under a 5.0% CO2 atmosphere. After the incubation period, the medium was replaced with a freshly prepared one, the MTT solution (0.5 mg/mL) was added, and the cells were incubated for 180 min. Then, the medium was removed, and DMSO was added to each well, and the plates were placed on a shaker at room temperature until complete dissolution of the purple formazan product [28]. The measurements of formazans, which are produced from the biological sample by a reduction of MTT, were performed on a microplate ELISA reader VarioscanTM LUX (Thermo Fisher Scientific Inc., Waltham, MA, USA) at 550 and 570 nm. The cytotoxicity (for etoposide) and antiproliferation (all tested compounds) determined by the MTT assay were expressed as % cell viability using the following equation:
%Cell viability = (ODsample − ODblank)/(ODcontrol − ODblank) × 100,
where ODsample, ODblank and ODcontrol are the measured absorption of the respective test, blank, and control sample.
Statistical analysis and result graphs were performed and created using GraphPad Prism 9.0 (GraphPad Software, La Jolla, CA, USA). The IC50 values of etoposide and compound 2 at 72 h were obtained by non-linear regression analysis using the equation log(inhibitor) vs. normalized response–variable slope. The results are presented as the mean % of the untreated controls ± standard deviation (SD) from three independent experiments (n = 3). The data from the MTT tests were analyzed by one-way ANOVA followed by Dunnett’s multiple comparison tests vs. the untreated control group (Ctrl.), and p values ≤ 0.05 were considered statistically significant.

3. Results and Discussion

3.1. Synthesis

The target compounds 1 and 2 were synthesized following a standard procedure of Knoevenagel condensation reaction using commercially available 4-cyano- or 4-methylbenzaldehyde (4 or 5), respectively, and 2-(3,5,5-trimethylcyclohex-2-en-1-ylidene)malononitrile (3) as the starting materials [17] (Figure S1). The crude products were purified by column chromatography on silica gel, affording compounds 1 and 2 moderate overall yields as a red or yellow crystalline solid, respectively. The purity and structure of the compounds were verified by ESI-TOF-MS and NMR (1H and 13C) analysis (see Supporting Information, spectral data for 1 and 2). The chemical structures of 1 and 2 were later confirmed by full crystallographic characterization.

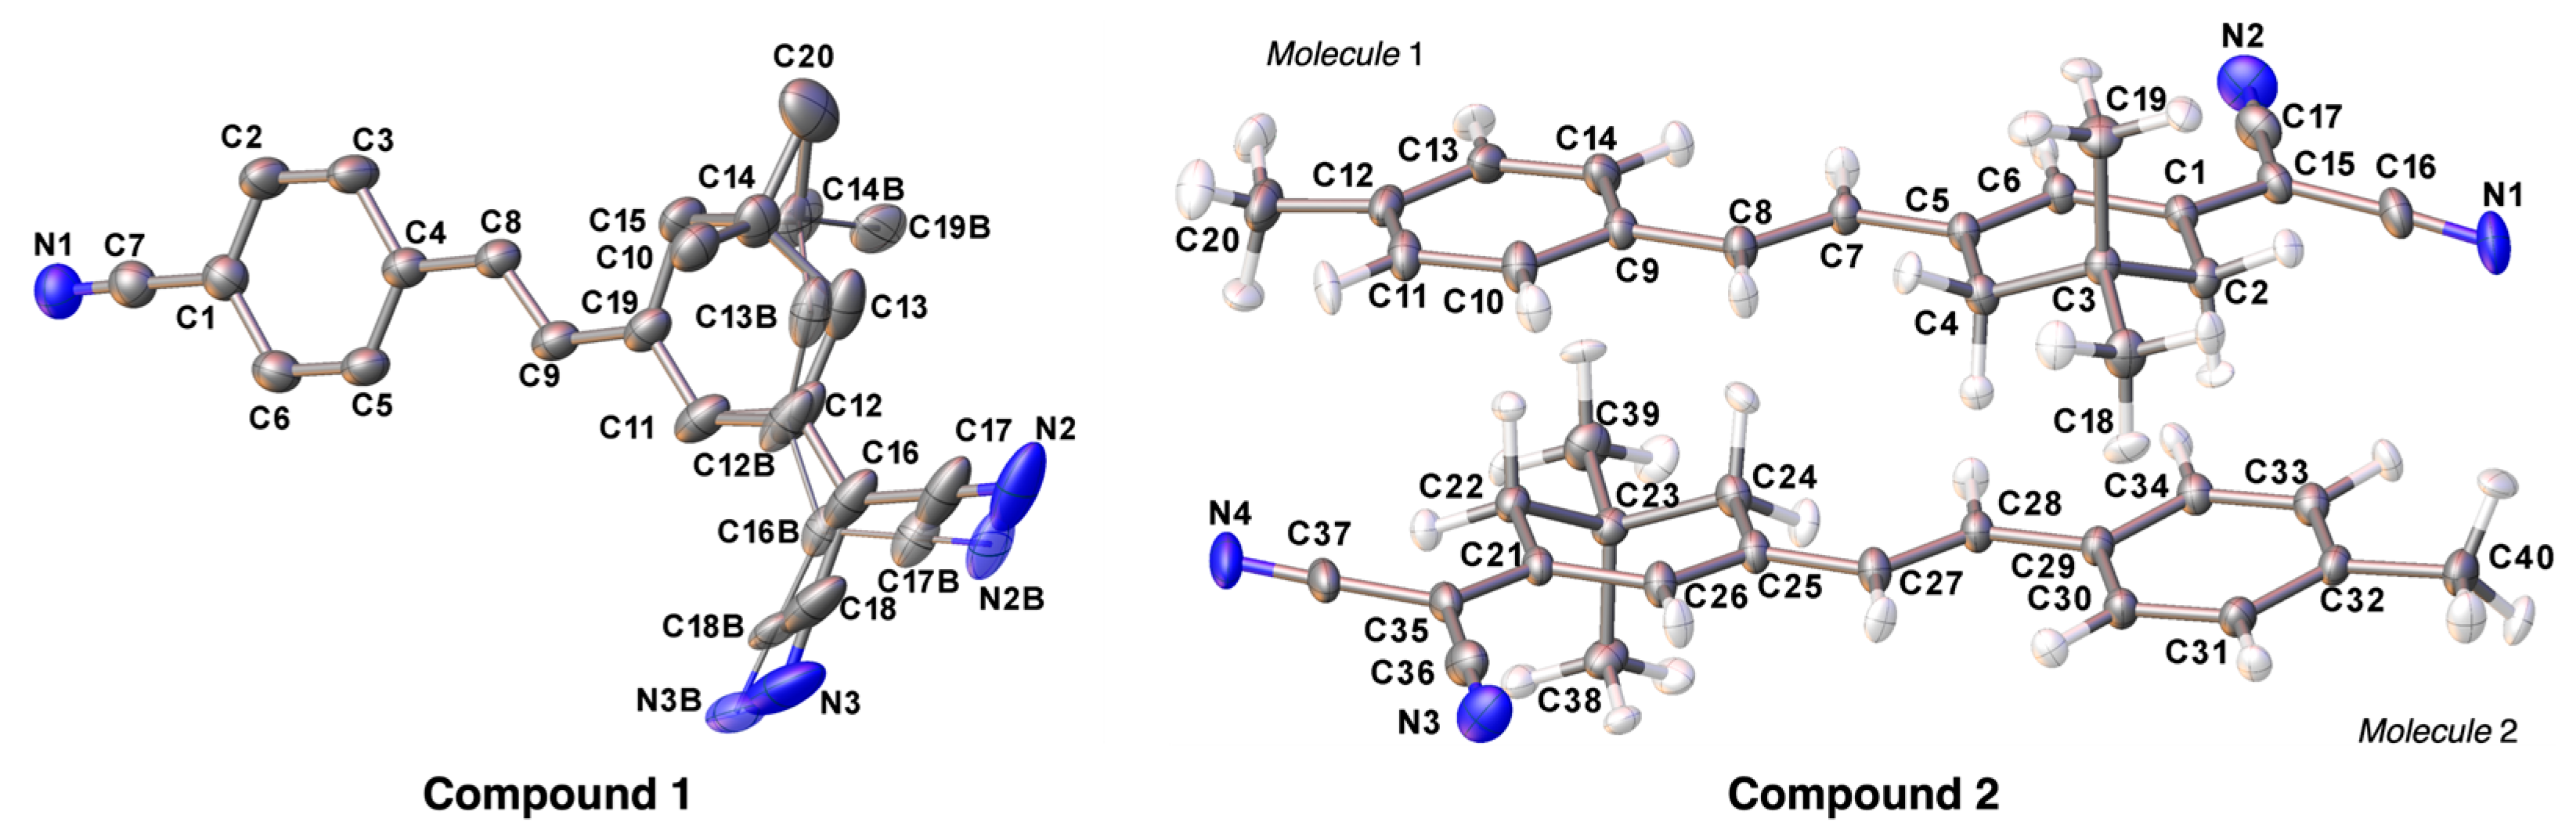
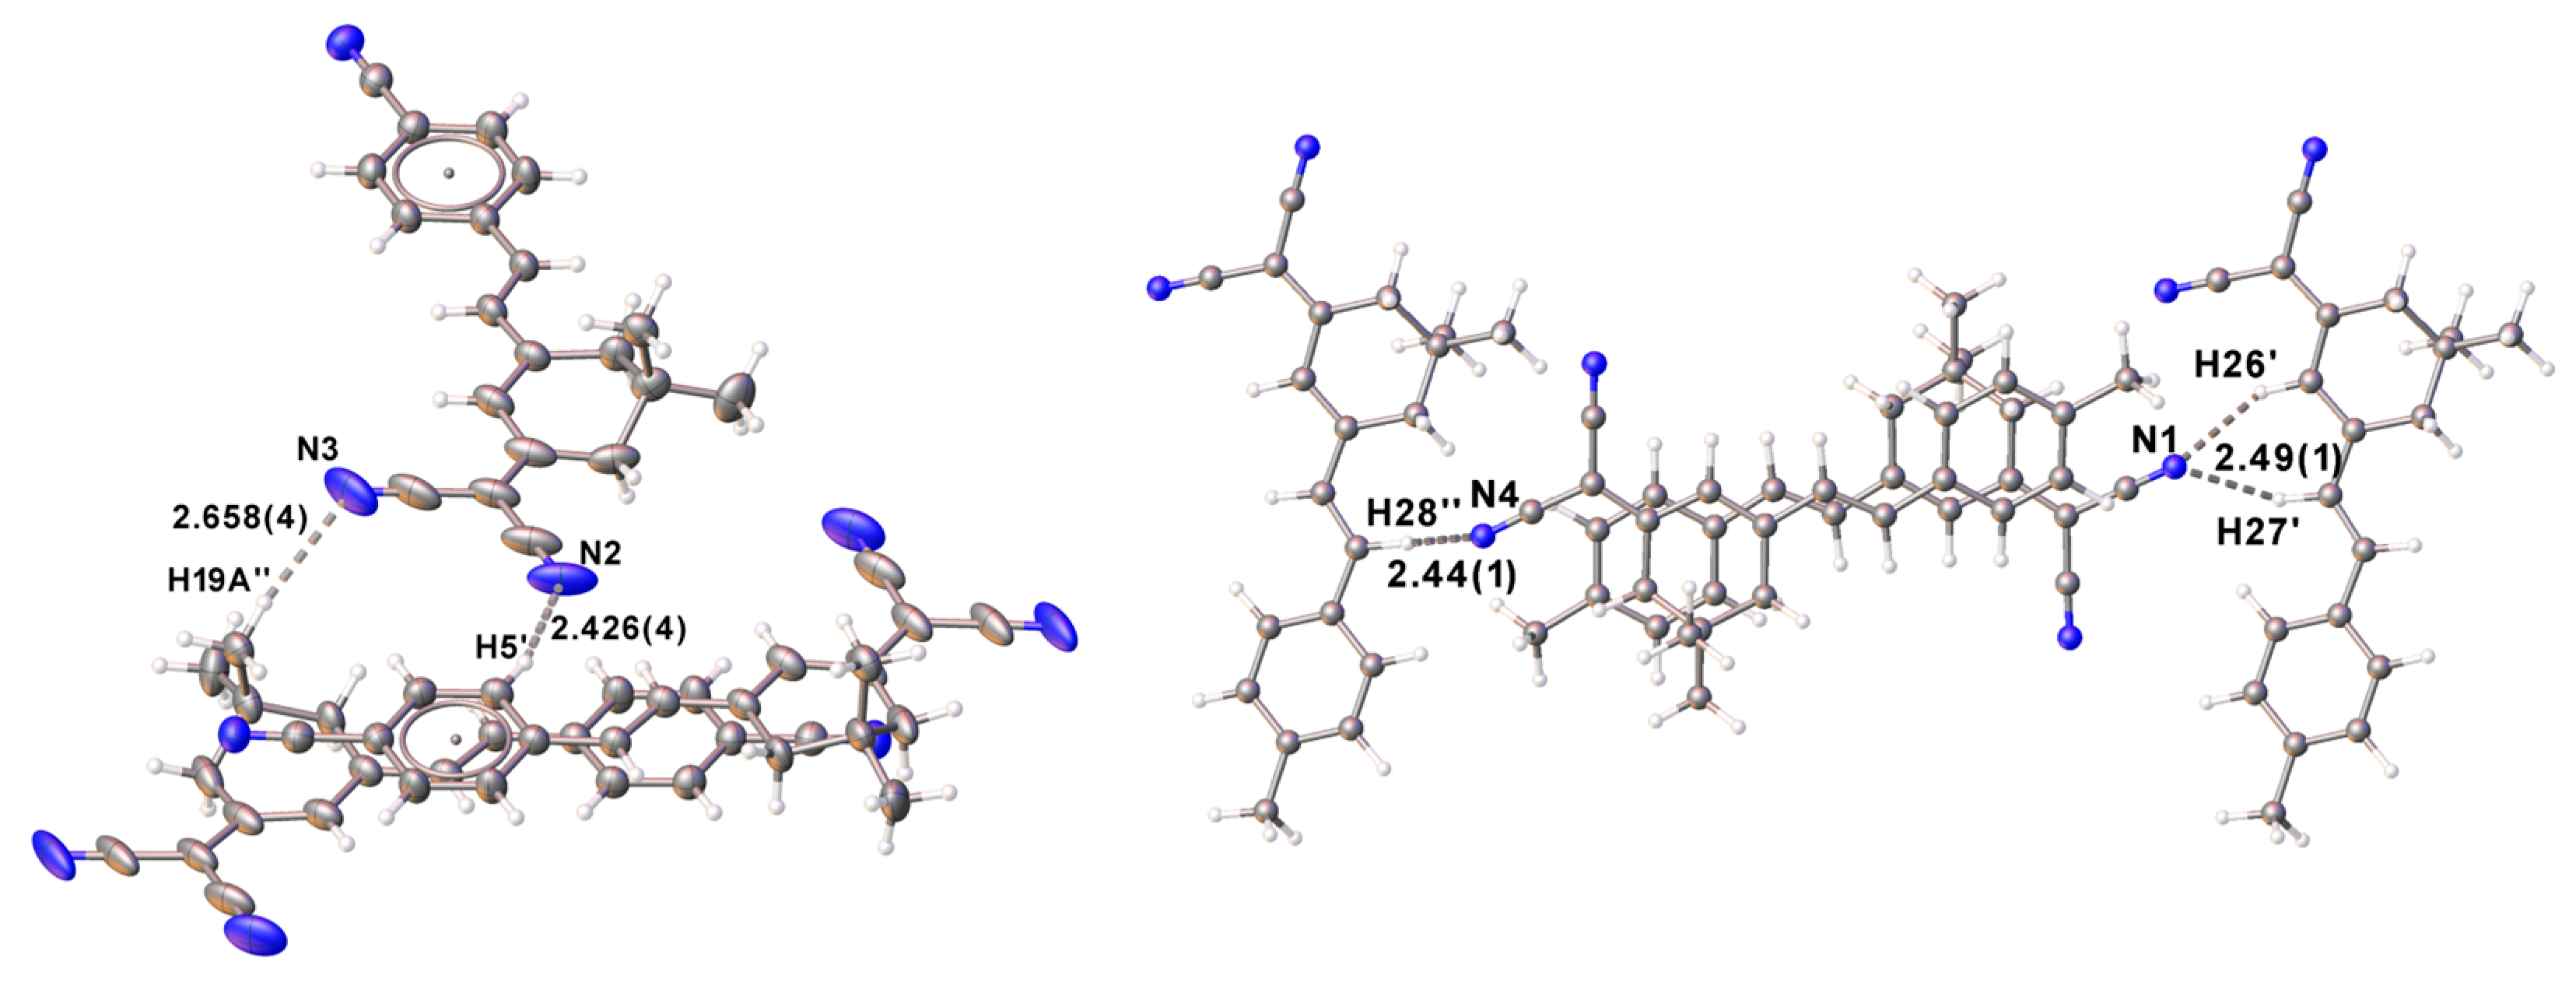
3.2. Crystal Structures of Compounds 1 and 2

The X-ray structures were obtained according to a modified protocol after recrystallization from acetonitrile and slow crystallization at room temperature (298–300 K) [29]. As expected, the single X-ray analysis showed that both compounds 1 and 2 crystallized in their more favorable E-isomers. Compound 1 crystallizes in the orthorhombic space group Pna21 with Z = 4 and shows partial disorder with a ratio of 82:18, while (E)-2-(3-(5,5-dimethyl-3-(4-methylstyryl)cyclohex-2-en-1-ylidene)malononitrile (2) crystallizes in the monoclinic space group P21/n with Z = 8 (Table 1 and Figure 2). The asymmetric unit of 2 shows an antiparallel orientation of two enantiomeric molecules with the positional disorder of both methyl groups at positions C3 and C23 in molecules 1 and 2, respectively (Figure 2, right).
There are σ-π (σ-N) interactions in the crystal packing of compound 1 with 3.239(4) Å (Figure S2A), but the double bond C8-C9 and C8’-C9’ shows short distances to the aromatic bonds C5’-C6’ and C5-C6 with 3.728(4) Å and 3.750(4) Å, respectively, as indicated in Figure 3 (left). The intermolecular interactions in the crystal packing of compound 2 are mainly characterized by σ-π interactions and non-classical C-H…N hydrogen bonds with 2.45(1) Å. The former leads to the dimerization of the two molecules 1 and 2 that form an asymmetric unit (Figure S2B). The shortest distances between the hydrogen atoms H2B and H22A and the centers of the benzene rings C9-C14 (for molecule 1) and C29-C34 (for molecule 2) are 2.391 Å and 2.41(1) Å, respectively (Figure 3, right).
The shortest C-H…N distances indicating non-classical hydrogen bonds from N2 to H5′ with 2.426(4) Å and N3 to H19″ with 2.658(4) Å for compound 1 are shown in Figure 4 (left), in which a rigid model for the hydrogen atoms was used. In the case of compound 2, the shortest hydrogen bonds below 3.5 Å are those from N1 to H26′ and H27′, both with 2.49(1) Å, and those from N4 to N28″ with 2.44(1) Å, as indicated in Figure 4 (right).

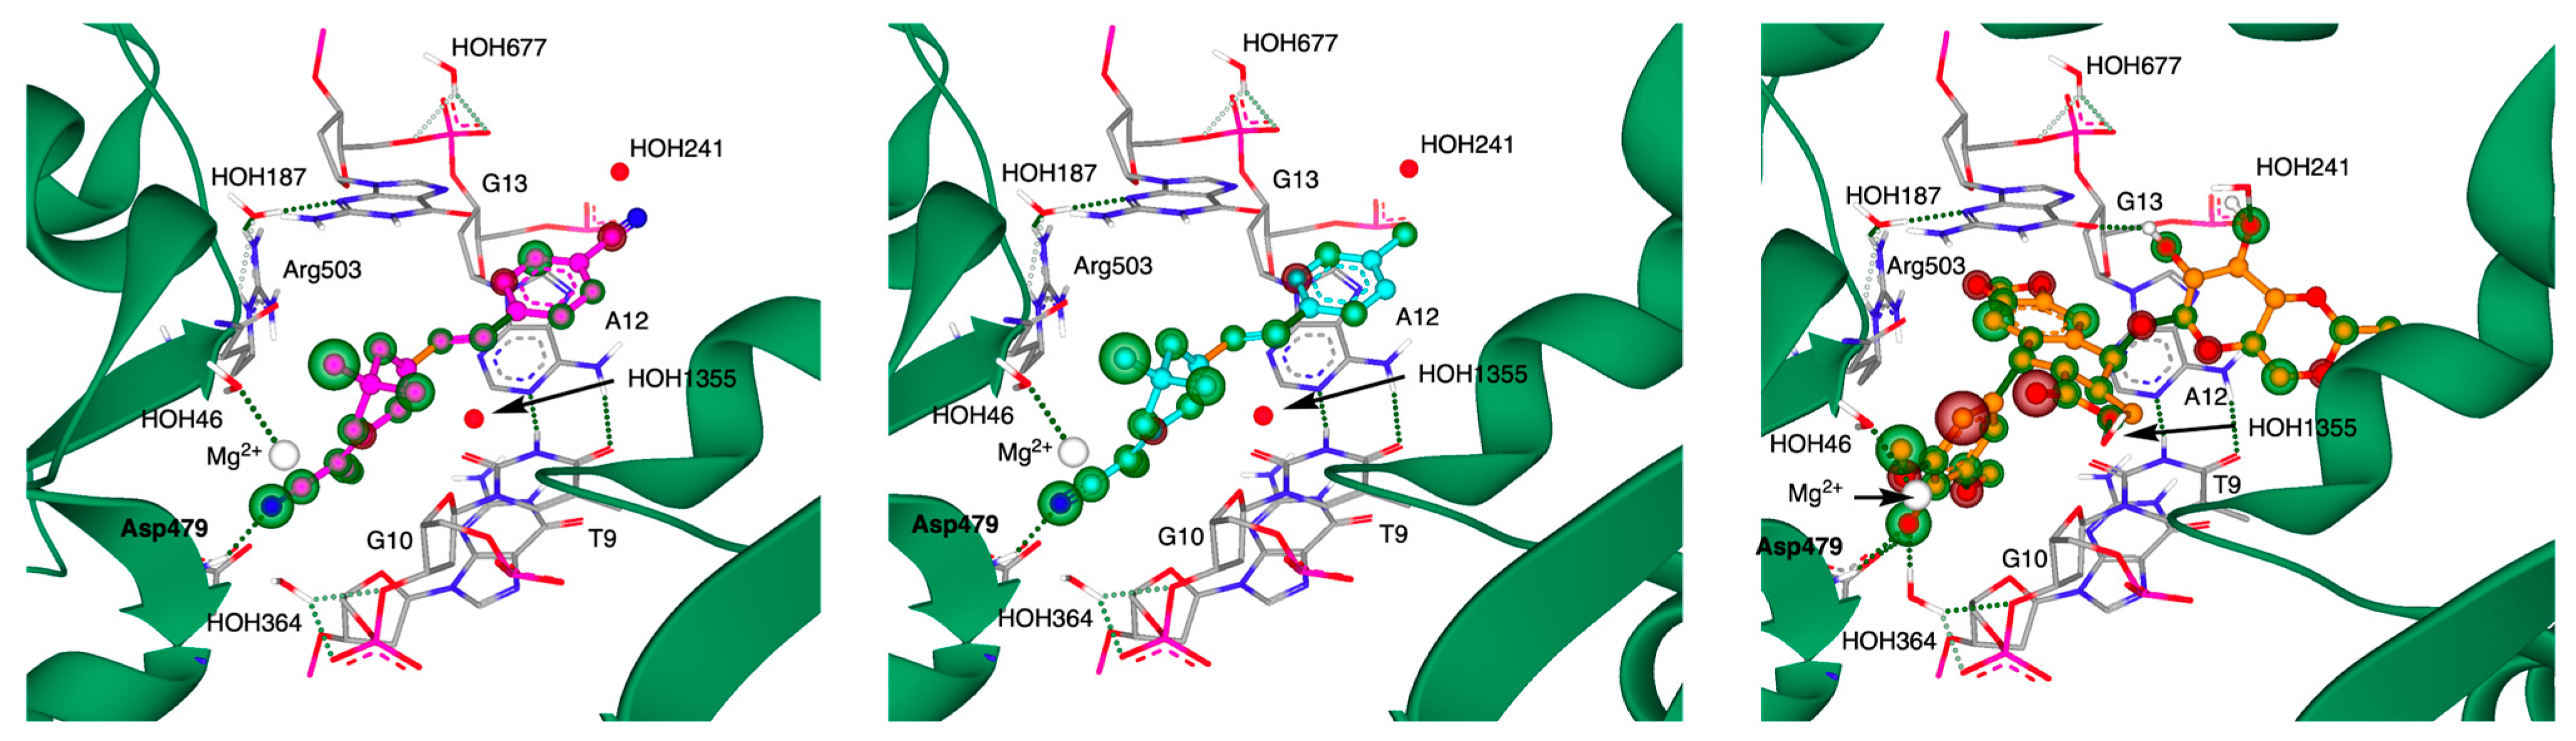
3.3. Molecular Modeling Experiments

In order to investigate whether compounds 1 and 2 are able to inhibit the activity of human TOP2 enzymes, we performed initial molecular docking studies with both proposed molecules for further structural exploration. Following our strategy, compounds 1 and 2 were originally designed within our extended research program of novel chromophores, consisting of a phenol donor (D), π-conjugated bridge (π), and dicyanomethylydiene acceptor (A) moieties, namely D-π-A structures with nonlinear optical properties (NLO) [17]. However, based on our experiences in rational drug design, we decided to evaluate the biological activity of both 1 and 2 due to their structural similarity to some drugs comprising a cyanomethyl functional group. Therefore, we used the single X-ray structures of 1 (the major occupied part of the disordered S and R enantiomers at C14, ratio 82:18) and 2 (molecule 1 of both enantiomeric molecules) without further 3D-optimization as input ligands to investigate their interactions within the binding pocket of the human TOP2 β isoform (cf. Section 2). The high-resolution X-ray structure of the cleavage core of hTOP2β (herein residues 452–1201, known as hTOP2βcore) in complex with DNA and the anticancer drug etoposide (PDB code: 3QX3, res. 2.16 Å) [2] was used as a structural basis for the implementation of our SCXRD/HYDE platform for structure-based drug design [7] (Figure S3 and Figure 5).
The performed docking and re-docking assessment procedure with monomer B (chain β) of the dimeric hTOP2β complexed to a 20-base pair DNA duplex (with chain D-F, containing a 5′-C-NNNNG-3’ cleavage site, DNA-gate) [2] and stabilized by the etoposide, resulted in a good overlap for the obtained docking poses with the almost identical conformation of both compounds 1 and 2 (Figure S3 and Figure 5). The proposed docking models of 1 and 2 suggest that both compounds occupy the same ligand-binding cavity of the active site of hTOP2β (composed of catalytic WHD and Mg2+-chelating TOPRIM domain) [2], sharing twelve amino acid residues and eight DNA bases (Table S1). Moreover, compounds 1 and 2 formed the same contacts within the binding site of hTOP2β, involving one hydrogen bond with residue Asp479 and hydrophobic interactions with five DNA bases and four amino acid residues (Table S1 and Figure S4). The binding modes of 1 and 2 did not show any additional stabilization by water molecules within the binding site of the hTOP2β–DNA complex (Figure 5). In contrast, the binding of the etoposide to the hTOP2β active site complexed to DNA strongly indicates the involvement of seven amino acid residues and the same DNA bases as 1 and 2 in the formation of hydrophobic contacts (Table S1 and Figure S4). The main differences between the binding modes of both compounds and etoposide are observed for the formed hydrogen bonds. While compounds 1 and 2 interact via one H-bond with Asp479, the etoposide establishes two with Asp479, three with water molecules (HOH241, 364, and 1355), and one H-bond with the DNA base G13 (cf. Table S1 and Figure 5). The binding of all ligands to the hTOP2β–DNA complex also suggests the formation of H-bonds between HOH187, Asp503, and HOH46 with the coordination of Mg2+ (Figure 5).
Using the obtained best-scored docking poses, we further assessed the thermodynamic binding profiles of 1, 2, and the complexed ligand etoposide, as well as estimated their binding affinities (the so-called Ki HYDE ranges) within the binding pocket of the hTOP2β–DNA complex (Figure 6). Based on the docking protocol and the (re-)scoring procedure described recently by us [16], we applied the implemented SeeSAR algorithm HYDE to compute the enthalpic (ΔH) and entropic effects (−TΔS) of all non-hydrogen atoms of the ligands to the overall energy of binding (ΔG, kJ/mol). The complete HYDE visual assessment of the ligands is shown in Figure S5. The results from the HYDE assessment proposed that the main binding activity of 1 and 2 was due to the enthalpic (ΔH) H-bond interaction between the ligand and the amino acid residue Asp479 with −18.3 kJ/mol for both compounds. The contribution of the hydrophobic contacts (−TΔS) within the hTOP2β–DNA complex to ΔG was more than two-fold lower with −8.10 and −7.70 kJ/mol for 1 and 2, respectively (Figure 6, top). As obtained from its best-docking pose, the binding affinity of etoposide is mainly driven by hydrogen bonds within the hTOP2β–DNA complex, but it is compensated by non-favorable hydrophobic interactions, e.g., an entropic part of ΔG of −TΔS = +44.1 kJ/mol (Figure 6, top). Considering the HYDE computed energy of binding (ΔG, kJ/mol), it can be summarized that there is a good agreement between ΔG and the predicted binding affinities (expressed as Ki HYDE ranges, from low to high µM) (Figure 6, bottom). Compounds 1 and 2, for example, showed almost equal ΔG of −26.4 and −26.0 kJ/mol, respectively, with Ki HYDE ranges of 2.26–225 (for 1) and 2.84–282 µM (for 2) (Figure 6). Based on its HYDE binding affinity, the etoposide seems to have lower predicted Ki HYDE ranges of 9.10–904 µM than 1 and 2; however, they are still in the low µM range.
Taking into account the obtained docking modes for 1 and 2 within the hTOP2β–DNA complex, we performed the virtual structural exploration of both molecules in order to generate optimized compounds with improved physicochemical properties. Using the Inspirator module in SeeSAR, a set of six (for 1) and seven (for 2) new structural analogs were designed, selected on the basis of their improved physchem characteristics, and virtually screened at the active site of the hTOP2β–DNA complex (Table S2). According to the obtained results, the introduction of a NH2 function at position meta in the phenyl ring of 1 or a fluorine atom instead of a methyl group in the dicyanomethylene moiety of 2 led to an increase in the estimated biological activity (Ki HYDE values) and physicochemical properties in the proposed structures 1_6 and 2_1 (cf. Table S2). Thus, these results suggest that the best docking poses of 1 and 2 within the active site of the hTOP2β–DNA cleavage complex can be useful for the further design of isoform-specific hTOP2 inhibitors.

3.4. Evaluation of Cytotoxicity and Antiproliferation

In order to examine the anticancer potential of compounds 1 and 2, we performed further investigation of their antiproliferative effects on hepatocarcinoma HepG2 cells. This cell line is commonly used to test cytotoxicity and the antiproliferation of investigated drugs and, in particular, for comparative studies with reference anticancer agents [28]. In addition, the HepG2 cell line is also used in the preclinical safety assessment in order to estimate the drug’s potential to provoke hepatotoxicity [30]. The experiments were carried out according to our previous protocols applying the MTT assay [28]. For all tested substances, the cell viability of HepG2 cells was evaluated after a 72 h incubation period in a concentration range of 1.0–500 µM (Figure 7). In the case of etoposide, the cytotoxic effect was determined after 24 h to examine its efficacy in a standard incubation period with HepG2 cells. In the tested concentration range, etoposide inhibits the growth of HepG2 cells after 24 h (about 50% inhibition at the two highest test concentrations of 250 and 500 µM) and 72 h of incubation (Figure 7a,b). Compared to etoposide, only compound 2 showed an antiproliferative effect (after 72 h treatment) against HepG2 cells at the highest-tested concentrations of 250 and 500 µM (Figure 7c,d).
Dose-dependent non-linear inhibitors curves were built to obtain the respective IC50 values for antiproliferative effects of etoposide and compound 2 on HepG2 cells (Figure 7g,h). The IC50 values for etoposide and compound 2 were determined to be 7.99 ± 2.43 and 387 ± 62.1 µM (50% inhibition of cell growth at 500 µM of 2), respectively. However, the obtained results can be considered as a good starting point for further experiments since starting from these malononitrile derivatives may be performed new optimized anticancer compounds with improved physicochemical parameters, such as an optimal hydrophilic–lipophilic balance.

4. Conclusions

Herein, we demonstrate that the implementation of a combined single-crystal X-ray diffraction (SCXRD)/molecular modeling approach can be successfully used for the design of new isoform-specific hTOP2-targeting agents. Following this strategy, two compounds (designated as 1 and 2) were used as model systems to perform molecular docking and virtual screening using their X-ray structures in order to predict their binding affinity (socalled Ki HYDE values) towards human TOP2 isoform β. Their thermodynamic profiles, Ki HYDE values, and antiproliferative effects against the hepatocarcinoma HepG2 cell line were investigated and compared with those observed for the anticancer agent etoposide. Despite their virtually higher binding affinity (Ki HYDE values) over etoposide towards hTOP2β, only compound 2 showed antiproliferative activity compared to those of etoposide. Future work will focus on developing structurally optimized hTOP2 inhibitors, in particular, targeting the α isoform of hTOP2 due to its importance for DNA replication and improved levels in fast-growing cancer cells.

Supplementary Materials

The following supporting information can be downloaded at https://www.mdpi.com/article/10.3390/cryst14060496/s1, Figure S1: General scheme for the synthesis of compounds 1 and 2; Figure S2: Selected intermolecular interactions in compounds 1 and 2; Figure S3: Representation of the hTOP2β–DNA cleavage complex bonded to the investigated ligands; Table S1: Hydrogen bonds and hydrophobic interaction of ligands with hTOP2β; Figure S4: Binding interactions within hTOP2β and HYDE assessment; Figure S5: Complete HYDE visual assessment; Table S2: Structural exploration of compounds 1 and 2 using Inspirator module in SeeSAR; ESI-TOF-MS spectra of compounds 1 and 2; 1H and 13C spectra of compounds 1 and 2.

Author Contributions

Conceptualization, N.T.T. and H.-G.S.; methodology, N.T.T.; software, H.-G.S. and M.P.; validation, M.I.P., M.G.G., A.A.B. and I.P.B.; formal analysis, M.I.P., M.G.G. and M.P.; investigation, M.I.P., M.G.G., A.A.B. and I.P.B.; resources, N.T.T. and H.-G.S.; data curation, T.K., H.-G.S. and N.T.T.; writing—original draft preparation, M.I.P., H.-G.S. and N.T.T.; writing—review and editing, N.T.T., L.M. and H.-G.S.; visualization, M.I.P., M.G.G., M.P., H.-G.S. and N.T.T.; supervision, N.T.T.; project administration, N.T.T.; funding acquisition, N.T.T. All authors have read and agreed to the published version of the manuscript.

Funding

This research was funded by the Bulgarian National Science Fund (BNSF), grant number KP-06-COST/14 (КП-06-КОСТ/14; СА22105).

Data Availability Statement

CCDC 2350475 and 23504076 contain the supplementary crystallographic data for this paper. These data can be obtained from the CCDC, 12 Union Road, Cambridge CB2 1EZ, UK; Fax: +44-1223-336033.

Acknowledgments

The authors would like to thank Diana Imhof and Toni Kühl from the University of Bonn for helpful discussions and obtaining the ESI-TOF-MS and NMR spectra.

Conflicts of Interest

The authors declare no conflicts of interest. The funders had no role in the design of the study; in the collection, analyses, or interpretation of the data; in the writing of the manuscript; or in the decision to publish the results.

Abbreviations

ANOVA, analysis of variance; ATP, adenosine triphosphate; DMSO, N,N-dimethyl sulfoxide; ESI-TOF-MS, electrospray ionization time-of-flight mass spectrometry; HCCA, α-cyano-4-hydroxycinnamic acid; HYDE, HYdrogen DEsolvation; IUPAC, International Union of Pure and Applied Chemistry; LLE, lipophilic ligand efficiency; LE, ligand efficiency; MTT, 3-(4,5-dimethylthiazol-2-yl)-2,5-diphenyltetrazolium bromide; NLO, nonlinear optical; NMR, nuclear magnetic resonance; SA, sinapinic acid; SCXRD, single-crystal X-ray diffraction; SD, standard deviation; TOPs, topoisomerases.

References

  1. Nitiss, J.L. Targeting DNA topoisomerase II in cancer chemotherapy. Nat. Rev. Cancer 2009, 9, 338–350. [Google Scholar] [CrossRef]
  2. Wu, C.-C.; Li, T.-K.; Farh, L.; Lin, L.-Y.; Lin, T.-S.; Yu, Y.-J.; Yen, T.-J.; Chiang, C.-W.; Chan, N.-L. Structural basis of type II topoisomerase inhibition by the anticancer drug etoposide. Science 2011, 333, 459–462. [Google Scholar] [CrossRef]
  3. Hassanin, H.M.; Serya, R.A.T.; Elmonean, W.R.A.; Mostafa, M.A. Synthesis and molecular docking studies of some novel Schiff bases incorporating 6-butylquinolinedione moiety as potential topoisomerase IIβ inhibitors. R. Soc. Open Sci. 2018, 5, 172407. [Google Scholar] [CrossRef] [PubMed]
  4. Buzun, K.; Bielawska, A.; Bielawski, K.; Gornowicz, A. DNA topoisomerases as molecular targets for anticancer drugs. J. Enz. Inh. Med. Chem. 2020, 35, 1781–1799. [Google Scholar] [CrossRef]
  5. Cattrini, C.; Capaia, M.; Boccardo, F.; Barboro, P. Etoposide and topoisomerase II inhibition for aggressive prostate cancer: Data from a translational study. Cancer Treat. Res. Commun. 2020, 25, 100221. [Google Scholar] [CrossRef] [PubMed]
  6. Pommier, Y.; Leo, E.; Zhang, H.L.; Marchand, C. DNA topoisomerases and their poisoning by anticancer and antibacterial drugs. Chem. Biol. 2010, 17, 421–433. [Google Scholar] [CrossRef] [PubMed]
  7. Bailly, C. Contemporary challenges in the design of topoisomerase II inhibitors for cancer chemotherapy. Chem. Rev. 2012, 112, 3611–3640. [Google Scholar] [CrossRef] [PubMed]
  8. Thakur, D. Topoisomerase II inhibitors in cancer treatment. Int. J. Pharm. Sci. Nanotechnol. 2011, 3, 1173–1181. [Google Scholar] [CrossRef]
  9. Najar, I.A.; Johri, R.K. Pharmaceutical and pharmacological approaches for bioavailability enhancement of etoposide. J. Biosci. 2014, 39, 139–144. [Google Scholar] [CrossRef]
  10. Arthur, D.E. Molecular docking studies of some topoisomerase II inhibitors: Implications in designing of novel anticancer drugs. Radiol. Infect. Dis. 2019, 6, 68–79. [Google Scholar] [CrossRef]
  11. Herrlich, P.; Morrison, H.; Sleeman, J.; Orian-Rousseau, V.; König, H.; Weg-Remers, S.; Ponta, H. CD44 acts as a growth- and invasiveness-promoting molecule and as a tumor-suppressing cofactor. Ann. N. Y. Acad. Sci. 2000, 910, 106–120. [Google Scholar] [CrossRef] [PubMed]
  12. Clark, P.I.; Slevin, M.L. The clinical pharmacology of etoposide and teniposide. Clin. Pharmacokinet. 1987, 12, 223–252. [Google Scholar] [CrossRef] [PubMed]
  13. Hande, K.R. Etoposide: Four decades of development of a topoisomerase II inhibitor. Eur. J. Cancer 1998, 34, 1514–1521. [Google Scholar] [CrossRef] [PubMed]
  14. Li, J.; Chen, W.; Zhang, P.; Li, N. Topoisomerase II trapping agent teniposide induces apoptosis and G2/M or S phase arrest of oral cell carcinoma. World J. Surg. Oncol. 2006, 4, 41. [Google Scholar] [CrossRef] [PubMed]
  15. Sun, J.; Wei, Q.; Zhou, Y.; Wang, J.; Liu, Q.; Xu, H. A systematic analysis of FDA-approved anticancer drugs. BMC Syst. Biol. 2017, 11 (Suppl. S5), 87. [Google Scholar] [CrossRef] [PubMed]
  16. Tzvetkov, N.T.; Peeva, M.I.; Georgieva, M.G.; Deneva, V.; Balacheva, A.A.; Bogdanov, I.P.; Ponticelli, M.; Milella, L.; Kirilov, K.; Matin, M.; et al. Favipiravir vs. deferiprone: Tautomeric, photophysical, in vitro biological studies, and binding interactions with SARS-CoV-2-Mpro/ACE2. Curr. Res. Biotechnol. 2024, 7, 100176. [Google Scholar] [CrossRef]
  17. Kosilkin, I.V.; Hillenbrand, E.A.; Tongwa, P.; Fonari, A.; Zazueta, J.; Fonari, M.S.; Antipin, M.; Dalton, L.R.; Timofeeva, T. Synthesis, structure, thermal and nonlinear optical properties of a series of novel D-π-A chromophores with varying alkoxy substituents. J. Mol. Struct. 2011, 1006, 356–365. [Google Scholar] [CrossRef]
  18. Dolomanov, O.V.; Bourhis, L.J.; Gildea, R.J.; Howard, J.A.K.; Puschmann, H. OLEX2: A complete structure solution, refinement and analysis program. J. Appl. Crystallogr. 2009, 42, 339–341. [Google Scholar] [CrossRef]
  19. Sheldrick, G.M. SHELXT-Integrated space-group and crystal-structure determination. Acta Cryst. A 2015, 71, 3–8. [Google Scholar] [CrossRef]
  20. Sheldrick, G.M. Crystal structure refinement with SHELXL. Acta Cryst. C 2015, 71, 3–8. [Google Scholar] [CrossRef]
  21. Bourhis, L.J.; Dolomanov, O.V.; Gildea, R.J.; Howard, J.A.K.; Puschmann, H. The anatomy of a comprehensive constrained, restrained refinement program for the modern computing environment—Olex2 dissected. Acta Cryst. A 2015, 71, 59–75. [Google Scholar] [CrossRef] [PubMed]
  22. Kleemiss, F.; Dolomanov, O.V.; Bodensteiner, M.; Peyerimhoff, N.; Lidgley, M.; Bourhis, L.J.; Genoni, A.; Malaspina, L.A.; Jayatilaka, D.; Spencer, J.L.; et al. Accurate crystal structures and chemical properties from NoSpherA2. Chem. Sci. 2021, 12, 1675–1692. [Google Scholar] [CrossRef] [PubMed]
  23. SeeSAR Package Version 13.1 from BioSolveIT GmbH, St. Augustin 2024, Germany. Available online: http://www.biosolveit.de/SeeSAR (accessed on 17 May 2023).
  24. Schneider, N.; Lange, G.; Hindle, S.; Klein, R.; Rarey, M. A consistent description of HYdrogen bond and DEhydration energies in protein-ligand complexes: Methods behind the HYDE scoring function. J. Comput. Aided Mol. Des. 2013, 27, 15–29. [Google Scholar] [CrossRef] [PubMed]
  25. Schärfer, C.; Schulz-Gasch, T.; Hert, J.; Heinzerling, L.; Schulz, B.; Inhester, T.; Stahl, M.; Rarey, M. CONFECT: Conformations from an expert collection of torsion patterns. ChemMedChem 2013, 8, 1690–1700. [Google Scholar] [CrossRef] [PubMed]
  26. Reulecke, I.; Lange, G.; Albrecht, J.; Klein, R.; Rarey, M. Towards an integrated description of hydrogen bonding and dehydration: Decreasing false positives in virtual screening with the HYDE scoring function. ChemMedChem 2008, 3, 885–897. [Google Scholar] [CrossRef]
  27. Schneider, N.; Hindle, S.; Lange, G.; Klein, R.; Albrecht, J.; Briem, H.; Beyer, K.; Claußen, H.; Gastreich, M.; Lemmen, C.; et al. Substantial improvements in large-scale redocking and screening using the novel HYDE scoring function. J. Comput. Aided Mol. Des. 2012, 26, 701–723. [Google Scholar] [CrossRef] [PubMed]
  28. Peeva, M.I.; Georgieva, M.G.; Balacheva, A.A.; Pavlov, A.; Tzvetkov, N.T. In vitro investigation of the cytotoxic and antiproliferative effects of Haberlea rhodopensis total extract: A comparative study. Cosmetics 2024, 11, 46. [Google Scholar] [CrossRef]
  29. Tzvetkov, N.T.; Peeva, M.I.; Tsakovska, I.; Milella, L.; Pajeva, I.; Stammler, H.-G. The crystal structure of (4SR)-7-(3,4-dichlorobenzyl)-4,8,8,-trimethyl-7,8-dihydroimidazo[5,1-c][1,2,4]triazine-3,6(2H,4H)-dione, C15H16Cl2N4O2. Z. Für Krist.-New Cryst. Struct. 2022, 237, 319–321. [Google Scholar] [CrossRef]
  30. Lin, Z.; Will, Y. Evaluation of drugs with specific organ toxicities in organ-specific cell lines. Toxicol. Sci. 2012, 126, 114–127. [Google Scholar] [CrossRef]
Figure 1. Chemical structures, IUPAC names, chemical formula, and molecular weight of etoposide (trade name Vepesid®) compounds 1 and 2. The images on the top show the colored crystals of both compounds.
Crystals 14 00496 g001
Figure 2. Molecular structure of compounds 1 and 2 in the solid state with atomic labeling. Anisotropic displacement ellipsoids are shown at the 50% level. The minor occupied part of compound 1 is translucent, and the hydrogen atoms are omitted for clarity.
Crystals 14 00496 g002
Figure 3. Short π-π and σ-π distances (in Å) in compounds 1 (left) and 2 (right). The minor occupied disordered part for 1 is omitted for clarity (symmetry code for C5’-C6’ and C8’-C9’: 1-X, 1-Y, −1/2 + Z).
Crystals 14 00496 g003
Figure 4. Short C-H…N distances (in Å) in compounds 1 (left) and 2 (right). The minor occupied disordered part for 1 is omitted for clarity. Symmetry codes used for 1: H5′: ½ + X, ½ − Y, +Z; H19A″: 3/2 − X, −1/2 + Y, −1/2 + Z, and for 2: H26’: ½ − X, −1/2 + Y, ½ − Z; H28”: −1/2 − X, ½ + Y, ½ − Z.
Crystals 14 00496 g004
Figure 5. Docking model of compound 1 (magenta, left), compound 2 (cyan, middle), and etoposide (orange, right) obtained from their best-scored docking pose into the active site of hTOP2β (β chain in green ribbons). All ligands are represented as balls and sticks with HYDE and torsional analysis, as generated in SeeSAR. The amino acid residues and DNA bases involved in H-bonding (dotted lines) and lipophilic interactions are shown as a wireframe and labeled. Mg2+ and some water molecules are represented as white and red spheres, as indicated, respectively. The water molecules forming H-bonds are shown as colored sticks. HYDE visual assessment scheme: green = favorable, red = unfavorable, and non-colored = not relevant for binding affinity.
Crystals 14 00496 g005
Figure 6. Approximate computed thermodynamic profiling of 1, 2, and the etoposide. (Top): Thermodynamic profile of compounds 1, 2 and the etoposide obtained from their best docking poses into hTOP2β (PDB: 3QX3), representing the semi-quantitative decomposition of the enthalpic (ΔH: sum of interactions; in grey bars) and entropic part (−TΔS: sum of dehydration terms; in red) for all non-hydrogen atoms of the Gibbs free energy (∆G = ∆H − T∆S, kJ/mol; in black). The respective values (in kJ/mol) and binding affinities (Ki HYDE ranges) are summarized below the diagram. (Bottom): Tabular representation of HYDE-estimated affinity ranges (white bars from µM to nM), lipophilic ligand efficiencies (LLE), torsions (Tor, green points), intra- and intermolecular clashes (green points), as well as molecular weight (MW), logP, and the topological polar surface area (TPSA) as the main physicochemical and drug-like characteristics.
Crystals 14 00496 g006
Figure 7. Cytotoxicity of etoposide (a) and antiproliferative effects of etoposide (b), compound 1 (c), and compound 2 (d) measured on human hepatocarcinoma HepG2 cells after 24 and 72 h of exposure to different concentrations of test substances (1.0 to 500 µM). Representative images of the HepG2 cell culture after 72 h of treatment with 100, 250, and 500 µM of etoposide (e) and compound 2 (f). The nonlinear regression curve of etoposide (g) and compound 2 (h) shows the inhibition of HepG2 cells after 72 h incubation with the respective test substance (the IC50 values are indicated). The results are expressed as the mean % of untreated controls ±SD (n = 3). Statistical analysis was performed by one-way ANOVA and Dunnett’s multiple comparison test. *, p < 0.1; **, p < 0.01; ***, p < 0.001; ****, p < 0.0001 vs. the untreated control group (Ctrl.).
Crystals 14 00496 g007
Table 1. Crystallographic data for compounds 1 and 2.
Compound 1Compound 2
CCDC dep. no.23504752350476
Empirical formulaC20H17N3C20H20N2
Formula weight (FW, g/mol)299.38288.39
Temperature (K)100.0 (1)95.0 (1)
Crystal systemOrthorhombicMonoclinic
Space groupPna21 (no.33)P21/n
a (Å)16.5791 (2)13.4133 (2)
b (Å)15.9039 (2)16.0132 (3)
c (Å)6.38900 (10)15.9997 (3)
β (°)90102.706 (2)
Volume (Å3)1684.60 (4)3352.42 (11)
Z48
Dcalc (g/cm3)1.1801.143
μ, mm−10.5530.067
F(000)632.01232.6
Crystal size (mm)0.17 × 0.14 × 0.120.35 × 0.29 × 0.13
Radiation (Å)Cu Kα (λ = 1.54184)Mo Kα (λ = 0.71073)
Crystal colorClear orangeClear yellow
2θ range for data collection, °7.7 to 152.74.5 to 60.1
Index ranges−20 ≤ h ≤ 20−21 ≤ h ≤ 22
−20 ≤ k ≤ 20−26 ≤ k ≤ 26
−8 ≤ l ≤ 8−26 ≤ l ≤ 26
Reflections collected61,297109,135
Independent reflections35199793
R(int)0.03000.0485
No. of parameters281757
No. of restraints4680
R indexes [I > 2σ(I)]R1 = 0.0401R1 = 0.0334
wR2 = 0.1141wR2 = 0.0757
R indexesR1 = 0.0410R1 = 0.0454
(all data)wR2 = 0.1155wR2 = 0.0810
Goodness-of-fit on F21.0771.083
Largest diff. peak/hole (eÅ−3)0.15/−0.160.39/−0.21
Flack parameter0.5
Disclaimer/Publisher’s Note: The statements, opinions and data contained in all publications are solely those of the individual author(s) and contributor(s) and not of MDPI and/or the editor(s). MDPI and/or the editor(s) disclaim responsibility for any injury to people or property resulting from any ideas, methods, instructions or products referred to in the content.

