Article

Mechanical Properties of Ti Grade 2 Manufactured Using Laser Beam Powder Bed Fusion (PBF-LB) with Checkerboard Laser Scanning and In Situ Oxygen Strengthening

by
Bartlomiej Adam Wysocki
1,*,
Agnieszka Chmielewska-Wysocka
1,2,
Piotr Maj
3,
Rafał Maksymilian Molak
3,
Barbara Romelczyk-Baishya
3,
Łukasz Żrodowski
3,4,
Michał Ziętala
1,
Wojciech Nowak
1,
Wojciech Święszkowski
3 and
Marek Muzyk
1
1
Multidisciplinary Research Center, Cardinal Stefan Wyszynski University in Warsaw, 05-092 Dziekanow Lesny, Poland
2
International Additive Manufacturing Group Ltd., 05-800 Pruszkow, Poland
3
Faculty of Materials Science and Engineering, Warsaw University of Technology, 02-507 Warsaw, Poland
4
Amazemet Sp. z o. o., Ltd., Al. Jana Pawła II 27, 00-867 Warsaw, Poland
*
Author to whom correspondence should be addressed.
Crystals 2024, 14(6), 574; https://doi.org/10.3390/cryst14060574
Submission received: 28 May 2024 / Revised: 13 June 2024 / Accepted: 16 June 2024 / Published: 20 June 2024
(This article belongs to the Special Issue Laser–Material Interaction: Principles, Phenomena, and Applications)

Abstract

:
Additive manufacturing (AM) technologies have advanced from rapid prototyping to becoming viable manufacturing solutions, offering users both design flexibility and mechanical properties that meet ISO/ASTM standards. Powder bed fusion using a laser beam (PBF-LB), a popular additive manufacturing process (aka 3D printing), is used for the cost-effective production of high-quality products for the medical, aviation, and automotive industries. Despite the growing variety of metallic powder materials available for the PBF-LB process, there is still a need for new materials and procedures to optimize the processing parameters before implementing them into the production stage. In this study, we explored the use of a checkerboard scanning strategy to create samples of various sizes (ranging from 130 mm3 to 8000 mm3 using parameters developed for a small 125 mm3 piece). During the PBF-LB process, all samples were fabricated using Ti grade 2 and were in situ alloyed with a precisely controlled amount of oxygen (0.1–0.4% vol.) to enhance their mechanical properties using a solid solution strengthening mechanism. The samples were fabricated in three sets: I. Different sizes and orientations, II. Different scanning strategies, and III. Rods for high-cycle fatigue (HCF). For the tensile tests, micro samples were cut using WEDM, while for the HCF tests, samples were machined to eliminate the influence of surface roughness on their mechanical performance. The amount of oxygen in the fabricated samples was at least 50% higher than in raw Ti grade 2 powder. The O2-enriched Ti produced in the PBF-LB process exhibited a tensile strength ranging from 399 ± 25 MPa to 752 ± 14 MPa, with outcomes varying based on the size of the object and the laser scanning strategy employed. The fatigue strength of PBF-LB fabricated Ti was 386 MPa, whereas the reference Ti grade 2 rod samples exhibited a fatigue strength of 312 MPa. Our study revealed that PBF-LB parameters optimized for small samples could be adapted to fabricate larger samples using checkerboard (“island”) scanning strategies. However, some additional process parameter changes are needed to reduce porosity.

Graphical Abstract

1. Introduction

Advancements in additive manufacturing (AM) are being driven by faster machines utilizing multiple lasers, new materials optimized for powder-bed fusion processes, and more intelligent software leveraging artificial intelligence/machine learning (AI/ML) [1,2,3]. These developments are making AM methods a viable solution for a wide range of real-world production applications. The increasing variety of new powder materials, designed with an optimized particle size, distribution, and chemical properties for powder-bed fusion processes, is providing numerous AM enthusiasts with the opportunity to apply the process to their industry applications [4,5,6]. Major players in the metal AM industry, such as EOS GmbH, GE, Nikon/SLM Solutions, Aconity GmbH, IAMG and Renishaw, are offering parameter sets for fabricating parts from commonly used metal materials (such as Ti grade 1–5, Co-Cr/Co-Cr-Mo, AlSi10Mg, various steels, nickel alloys, and copper alloys) with densities close to the theoretical values. While these parameter sets benefit beginners in the AM industry, they often require modifications for different part shapes, sizes, and support structures to meet end-user surface quality and mechanical strength requirements [7,8,9]. Additionally, the parameters provided by manufacturers typically need adjustments when switching to a new powder supplier or to powder with a slight difference in purity or particle size. Moreover, many AM metal machine producers sell machines without providing information on alloy PBF-LB processing parameters, even for the popular alloys mentioned above. Consequently, procedures that aid in optimizing the PBF-LB process parameters and reducing sample size and batches should continue to be explored and shared with a wider audience [10,11,12]. This is particularly crucial in an era characterized by shortened or interrupted supply chains, escalating energy costs, and the growing necessity to utilize recycled materials, even in the production of high-end and advanced products.
Titanium and its alloys are extensively utilized in AM processes across various industries, including medical, aviation, and automotive [13,14,15]. The predominant titanium alloy in the AM industry, Ti-6Al-4V (Ti64), is manufactured in powder form by multiple producers in numerous grades and with a wide range of particle sizes. Ti64 processed by PBF-LB demonstrates high fatigue resistance [16] and, when presented in the scaffold form, exhibits a Young’s modulus comparable to that of human bone [17]. Ti64 is the leading metallic material commercially employed for the custom and serial production of implants using AM technologies [18]. However, it is important to note that Ti64 contains aluminium, which may potentially cause allergies [19], and vanadium, which is toxic [20].
The mechanical properties of titanium alloys are extremely dependent on impurities such as oxygen, nitrogen, carbon, or hydrogen. During solid solution strengthening, oxygen and nitrogen alloying elements form solid interstitial solutions within the base metal crystal lattice, leading to increased stress due to cellular lattice deformation and hindering dislocation movement [21,22,23]. Consequently, the material’s ultimate tensile strength is enhanced, which was reported in our previous studies on the oxygen strengthening effect during PBF-LB processing of Ti64 [24] and CP Ti [25]. Carbon is less beneficial but is not harmful if carbide formation is avoided, while hydrogen is solely detrimental and should be limited as much as possible [26]. Given these findings, pure titanium strengthened with oxygen emerges as a promising material for musculoskeletal devices and other industrial applications where high strength/ductility materials should be applied.
Analysis of the literature data shows that the development of new additive manufacturing techniques implemented with the use of a new generation device should be associated with the creation of optimization procedures that maximize mechanical properties and part quality. One of the biggest advantages of the PBF-LB is geometric freedom when designing parts that will be processed using new materials [27,28]. Still, before the industry’s implementation, the PBF-LB process often required validation of the parameters provided by the manufacturer or their modifications before starting mass-scale production. One of the most important PBF-LB parameters is the laser scanning strategy, which was found to influence the chemical composition of the processed alloys and their homogeneity [29], residual stresses [30], or the balling effect [31]. In this study, we applied the PBF-LB process checkerboard scanning strategy as a successful tool for producing bigger objects using parameters optimized on small laboratory samples. This study showed for the first time that using a checkerboard scanning strategy with oxygen solid solution strengthening of titanium minimizes the anisotropy of the fabricated parts and maximizes their mechanical properties. Presented in our study, the PBF-LB fabrication protocol showed that the laser-processed Ti grade 2 had mechanical properties that were around two times higher than those of the conventionally fabricated Ti grade 2 rod.

2. Materials and Methods

2.1. Manufacturing

Powder bed fusion using a laser beam (PBF-LB) process, supported by in situ oxygen strengthening, was utilized to obtain titanium specimens of various sizes (130–8000 mm3) fabricated using parameters optimized on a cubic sample of 125 mm3 (5 × 5 × 5 mm). The detailed type and dimensions of the samples are listed in Table 1. For all fabricated samples, the layer thickness was 25 µm, the energy density used for powder consolidation was 120 J/mm3 (15 µm point distance and 40 µs exposure time resulting in a scanning speed of 375 mm/s, hatch distance of 40 µm and laser power 45 W). This set of parameters was optimized on 100 cubic samples of 125 mm3 (5 × 5 × 5 mm) according to the procedure described in our previously reported research [32]. In brief, from a set of 100 different laser powers, scanning speeds, distances between scanning vectors and distances between exposure points and exposure times, we have chosen one set of parameters where the theoretical density of the fabricated samples was an average of 99.9% of the theoretical density of Ti grade 2. In this study, some samples had a bigger cross-section surface area than 25 mm2 (5 × 5 mm), which is the sample’s size (cross-section area) used for the parameter’s optimization procedure (see Figure 1A,B). Samples with a cross-section surface area larger than 25 mm2 were fabricated using a checkerboard scanning strategy (see Figure 1B,C) to ensure that their melt pool behaviour was similar to that during parameters’ optimization. All samples were fabricated on support structures at least 3 mm thick. They were fabricated with the same process parameters as the main part but twice the laser power of 22.5 W. The solid part of the fabricated samples began from a first layer above a 3 mm thick support. The raw powder used in this study was Ti grade 2 spherical powder (TLS Technik/Eckart AM GmbH, Leipzig, Germany). The average grain size of the powder was around 15–45 µm, while its purity, according to the manufacturer’s data, was a minimum of 99.55 wt.%. (≤0.30% Fe, ≤0.25% O, ≤0.08% C, ≤0.03% N, ≤0.013% H, balance Ti). The samples were fabricated using a Realizer SLM50 machine (Realizer GmbH/DMG Mori, Borchen, Germany). An inert argon atmosphere with a slight addition of oxygen (Set I and Set III: 0.1–0.3 vol.% while for Set II: 0.2–0.4 vol.%) to improve the mechanical properties of the fabricated samples was used throughout the manufacturing process. The building platform was heated to 200 °C during fabrication to avoid thermal cracks and delamination. All laser scanning strategies implemented for fabrication are shown in Figure 1, while the fabricated samples are shown in Section 3, and the results are shown in Figure 3. The reference material was chosen as a conventionally fabricated Ti grade 2 rod (Bibus Metals Sp. z o.o., Dabrowa, Poland).

2.2. WEDM Cutting and Machining

Miniature specimens for tensile testing were cut from cuboid blocks, as depicted in Figure 1B,C and with sizes as depicted in Figure 2A. For samples fabricated in the second part of our study (Set II), we have analysed their tensile along the XZ plane from the bottom to the top of each 20 × 20 × 20 mm cube. Tensile samples in Set II were cut, arranged in rows, and later sliced to the desired thickness. They were obtained by cutting specimens in the XY plane (building/platform plane) in three different areas of the Set II samples—top, middle, and bottom. The first sample in the bottom area was cut 1 mm from the first sample layer, and the last one was cut 1 mm below the top surface. At each location, at least four specimens were tested, with a consistent distance of 0.25 units per sample. Precision cutting was facilitated by the Mitsubishi MV1200S (Mitsubishi, Tokyo, Japan), ensuring uniformity and accuracy throughout the process.
The HCF specimens were machined from rods fabricated at 30° to the plane of the building plate. The manufactured rods were heat treated in an argon atmosphere at 400 °C for 4 h to remove residual stresses in the material and prevent the specimens from bending. Subsequently, the rods were removed from the building plate and support structures and machined.

2.3. Mechanical Tests (Tensile, High Cycle Fatigue—HCF)

The tensile tests of the miniature specimens (Figure 2A) were conducted with the use of the electro-mechanical static tensile testing machine Zwick/Roell Z005 (Zwick GmbH & Co. KG, Ulm, Germany) equipped with a 5 kN load cell. The control variable was a time-constant displacement of the testing machine beam of 0.005 mm/s, which, with a gauge length of 5 mm (see Figure 2A), resulted in an initial tensile rate of 1 × 10⁻³ 1/s, which is a typical rate for static tensile tests. Due to the small size of the specimens, a non-contact optical method based on digital image correlation (DIC) Vic-2d (Correlated Solutions, Irmo, SC, USA) was used to measure the elongation. The strain of the miniature specimens was calculated during post-processing based on the images of the surface of the specimens collected at a 4 Hz frequency.
The high cycle fatigue (HCF) tests were performed at room temperature with the use of a uni-axial hydraulic testing machine, MTS 858 (MTS Systems Corporation, Eden Prairie, MN, USA), equipped with a 25 kN load cell. The cylindrical specimens (see Figure 2B) with a gauge length diameter of 6 mm and a total length of about 65 mm were machined from both the PBF-LB/Ti and commercial Ti rod. The HCF tests were conducted according to an ASTM E466 standard in a stress-controlled mode at a constant frequency of 20 Hz and a stress ratio of R = 0.1. Tests were conducted until the specimen failed or until it reached 5 million cycles, which in this case is considered the basis of unlimited fatigue life.

2.4. Microstructure Investigation (Light Microscopy—LM, Scanning Electron Microscopy—SEM, X-ray Microtomography—XRT)

A Keyence VHX-7000 (Keyence, Mechelen, Belgium) digital microscope system was used to capture the optical images of the microstructure of the PBF-LB/Ti and reference Ti grade 2 rod samples. Scanning electron microscopy (SEM) of fatigue fractures was conducted using a Hitachi S-3500N Scanning Electron Microscope (Hitachi, Tokyo, Japan) in secondary electrons (SE) mode with an acceleration of 10 kV and a working distance of 13 mm. The µCT scans were performed using a Nikon XT H 225 ST 2x (Nikon, Tokyo, Japan) scanner equipped with a multi-metal target (tungsten was used for our study) on three HCF samples for each state—three fabricated using Ti grade 2 powder in the PBF-LB process and three machined Ti grade 2 rods. The source voltage and source current were set to 160 kV and 34 µA, respectively. A 0.5 mm aluminium filter material was chosen to obtain the optimum greyscale value for the reconstruction. The scanning procedure was made by performing 1000 projections and 32 frames per projection, with an exposure time of 67 milliseconds. The reconstructed voxel size was set to 6.5 µm. The reconstruction data were prepared using Nikon CT Pro 3D XT 6.9.1 software, while data visualisation and porosity measurements were performed by using Volume Graphics Studio Max 2022.3 with an Additive Manufacturing set of plugins.

2.5. Light Elements (Oxygen—O, Nitrogen—N, Hydrogen—H) Analysis and Archimedes Density Measurements

The oxygen, nitrogen and hydrogen content in representative samples from each Set I, II and III and raw Ti grade 2 powder was determined using a TCHEN 600 Nitrogen/Oxygen/Hydrogen determinator (LECO, St. Joseph, MI, USA). The elements were converted to their oxidized form using the gas fusion method, and infrared absorption (IR) was used to measure the combustion gases within each metallic sample. This technique enables chemical examination with an accuracy of 0.01% wt.% for oxygen measurement. Archimedes’ method was used to determine the theoretical density of all samples using a RADWAG AS 520.X2 PLUS (Radwag, Radom, Poland) (d = 0.1 mg) balance. The density of 4.51 g/cm3 was used as the titanium grade 2 theoretical density for the calculations.

3. Results

3.1. Samples Fabricated via Powder Bed Fusion Using Laser Beam (PBF-LB) Process

Figure 3 shows samples from Sets I, II, and III successfully fabricated in the PBF-LB process using parameters optimized on a cubic sample with a size of 5 × 5 × 5 mm. The samples from Set I were successfully fabricated using the PBF-LB process parallel to the building platform (I.3) at varying sizes (I.1, I.2, and I.4), and at a 45° angle inclined to the building platform (I.5). Notably, the checkerboard strategy (often called “island scanning” [33]) with 5 × 5 mm fields had a discernible impact on the top surface of the samples with an area exceeding 25 mm2. The laser melting of the solid parts commenced from the 121st layer, and despite being produced with twice the laser power (45 W) compared to the support structures, a robust connection between the solid parts and the support structures was observed, even for objects inclined to the building platform. Although samples made parallel to the building platform (I.3) with a cross-sectional area exceeding 25 mm2 did not delaminate, their upper surface exhibited noticeably higher roughness than the other samples fabricated in Set I.
Moving on to Set II, the samples were created using three laser scanning strategies: II.1. checkerboard, II.2. bidirectional (zigzag), II.3. bidirectional (zigzag) + random points. Irrespective of the laser scanning strategy, the process succeeded, and no delamination was detected between the sample and the support structure. The upper surface of sample II.1 distinctly displayed the boundaries of the checkerboard fields. Furthermore, the objects manufactured for the fatigue tests (III.1), also using the checkerboard (“island”) laser scanning strategy, exhibited no delamination, discontinuities, or other visible structural defects.
The theoretical density of the manufactured objects was determined using the Archimedes method and is detailed in Table 2. For samples with a volume of 1300 mm3 (I.2. medium perpendicular and I.4. medium parallel), their density ranged from 99.4 ± 0.2% to 99.5 ± 0.1% of the theoretical density of Ti grade 2 (4.51 g/cm3), representing the highest values among all of the samples (Set I, Set II, and Set III) in this study. Conversely, the density of the smallest samples with a volume of 130–325 mm3 (I.1. small perpendicular, I.3 small parallel and I.5. small inclined) ranged from 98.6 ± 0.6% to 98.9 ± 0.4%. Notably, the theoretical density of the samples made in Set II with different scanning strategies is lower than that of Set I, which were produced with different sizes and orientations relative to the platform. The sample created with the checkerboard strategy (II.1. checkerboard—each square 5 × 5 mm) exhibited the highest theoretical density in this series, exceeding 98.1 ± 0.5%. On the other hand, the remaining samples (II.2. bidirectional (zigzag) and II.3. bidirectional (zigzag) + random points) demonstrated a high porosity of 3.9–3.1%. Prior to mechanical processing, the samples made in Set III (III.1. PBF-LB rod) possessed a theoretical density of 98.5 ± 0.7%, comparable to the samples produced in Set I. It is noteworthy that all manufactured objects exhibited a theoretical density lower than the reference Ti grade 2 rod, which has a determined density of 99.5 ± 0.4%.
To illustrate the porosity distribution and compare the obtained values with the density values obtained using the Archimedes method, we conducted a micro-computed tomography investigation on samples from Set III (III.1. PBF-LB rod and III.2. conventionally fabricated Ti grade 2 reference rod) prepared for high-cycle fatigue (HCF) tests. The porosity values averaged for three samples from each type of tested material and the visualization of the pore distribution for the selected samples from Set III.1 and Set III.2 are presented in Figure 4. The porosity values obtained by microtomography at a voxel of 6.5 µm were 0.45 ± 0.18% and 0.03 ± 0.05% for the machined sample produced by the PBF-LB method and the machined reference Ti grade 2 bar, respectively. In the case of Set III.1 samples made with the laser melting process, the accumulation of pores was always visible at one of the ends of the sample measurement area (red dashed line in Figure 4). The voids in the PBF-LB fabricated samples were not uniformly distributed, and their number increased with the sample height. We have observed this phenomenon in many laser-melted powder materials and reported it in our previous study [25]. For samples machined from a reference rod, porosity was usually absent, and where individual voids were present, their location was completely random.

3.2. Microstructure

The etched cross-sections of samples prepared for the high-cycle fatigue (HCF) tests were observed under a light microscope to analyse the microstructure, as shown in Figure 5. The microstructure of a conventionally produced Ti grade 2 rod (Figure 5A) consists of equiaxed α-phase grains. Some grains showed deformation twins typical of plastically deformed pure titanium wires [34]. No significant pores were observed on the etched surface of the conventionally fabricated Ti grade 2 rod, even at ×500 magnification. On the other hand, the microstructure of Ti grade 2 processed in the PBF-LB process consisted of α’ martensitic phase plates, typical for pure titanium powders processed by a laser beam. In the PBF-LB processed material, the α’ phase plates were visible within the boundaries of the primary β phase, which determines the area of heat influence during a single exposure with a laser beam (40 µs in this experiment). The diameter of the prior β phase in the building platform plane was around 50 µm. Additionally, in the PBF-LB processed rod, some keyhole pores, which are common defects for this powder metallurgy fabrication method, were observed.

3.3. Light Elements Analysis

The oxygen, nitrogen, and hydrogen content were analysed for samples from Sets I, II, and III, as well as for titanium powders—both fresh and those previously used in the PBF-LB process (see Table 3). The powder that had been used in the PBF-LB process had passed through the entire device system from the feeder through the screw to the working platform, and finally, after the laser melting process, it went into the container for sieving. In the tested Set I samples, the average oxygen content was 0.23 ± 0.02 wt.%, a value similar to our previous studies on the anisotropy of the mechanical properties of Ti grade 1 after the laser melting process in a powder bed [25]. We found that the oxygen content in Set III was comparable to that of Set I, with an average oxygen content of 0.20 ± 0.014 wt.% in the rod from Set III.1 after the PBF-LB process. Samples from Set I and Set III were fabricated when the volume of the oxygen in the chamber was measured at 0.1–0.3 vol.%. The conventionally produced Ti grade 2 reference rod had the lowest oxygen content in our study, at 0.07 ± 0.14 wt.%. The fresh Ti grade 2 powder purchased from TLS Technik had a higher oxygen content than the reference rod, with an oxygen content of 0.13 ± 0.017 wt.% determined for the fresh powder and 0.17 ± 0.014 wt.% after one pass through the device. Cubes with dimensions 20 × 20 × 20 mm from Set II, made with different scanning strategies, had a much higher oxygen content than the rest of the investigated samples, with an average oxygen content of 0.82 ± 0.05 wt.%. Samples from Set II were fabricated from reused powder and when the volume of the oxygen in the chamber was measured at 0.2–0.4 vol.%.

3.4. Mechanical Properties

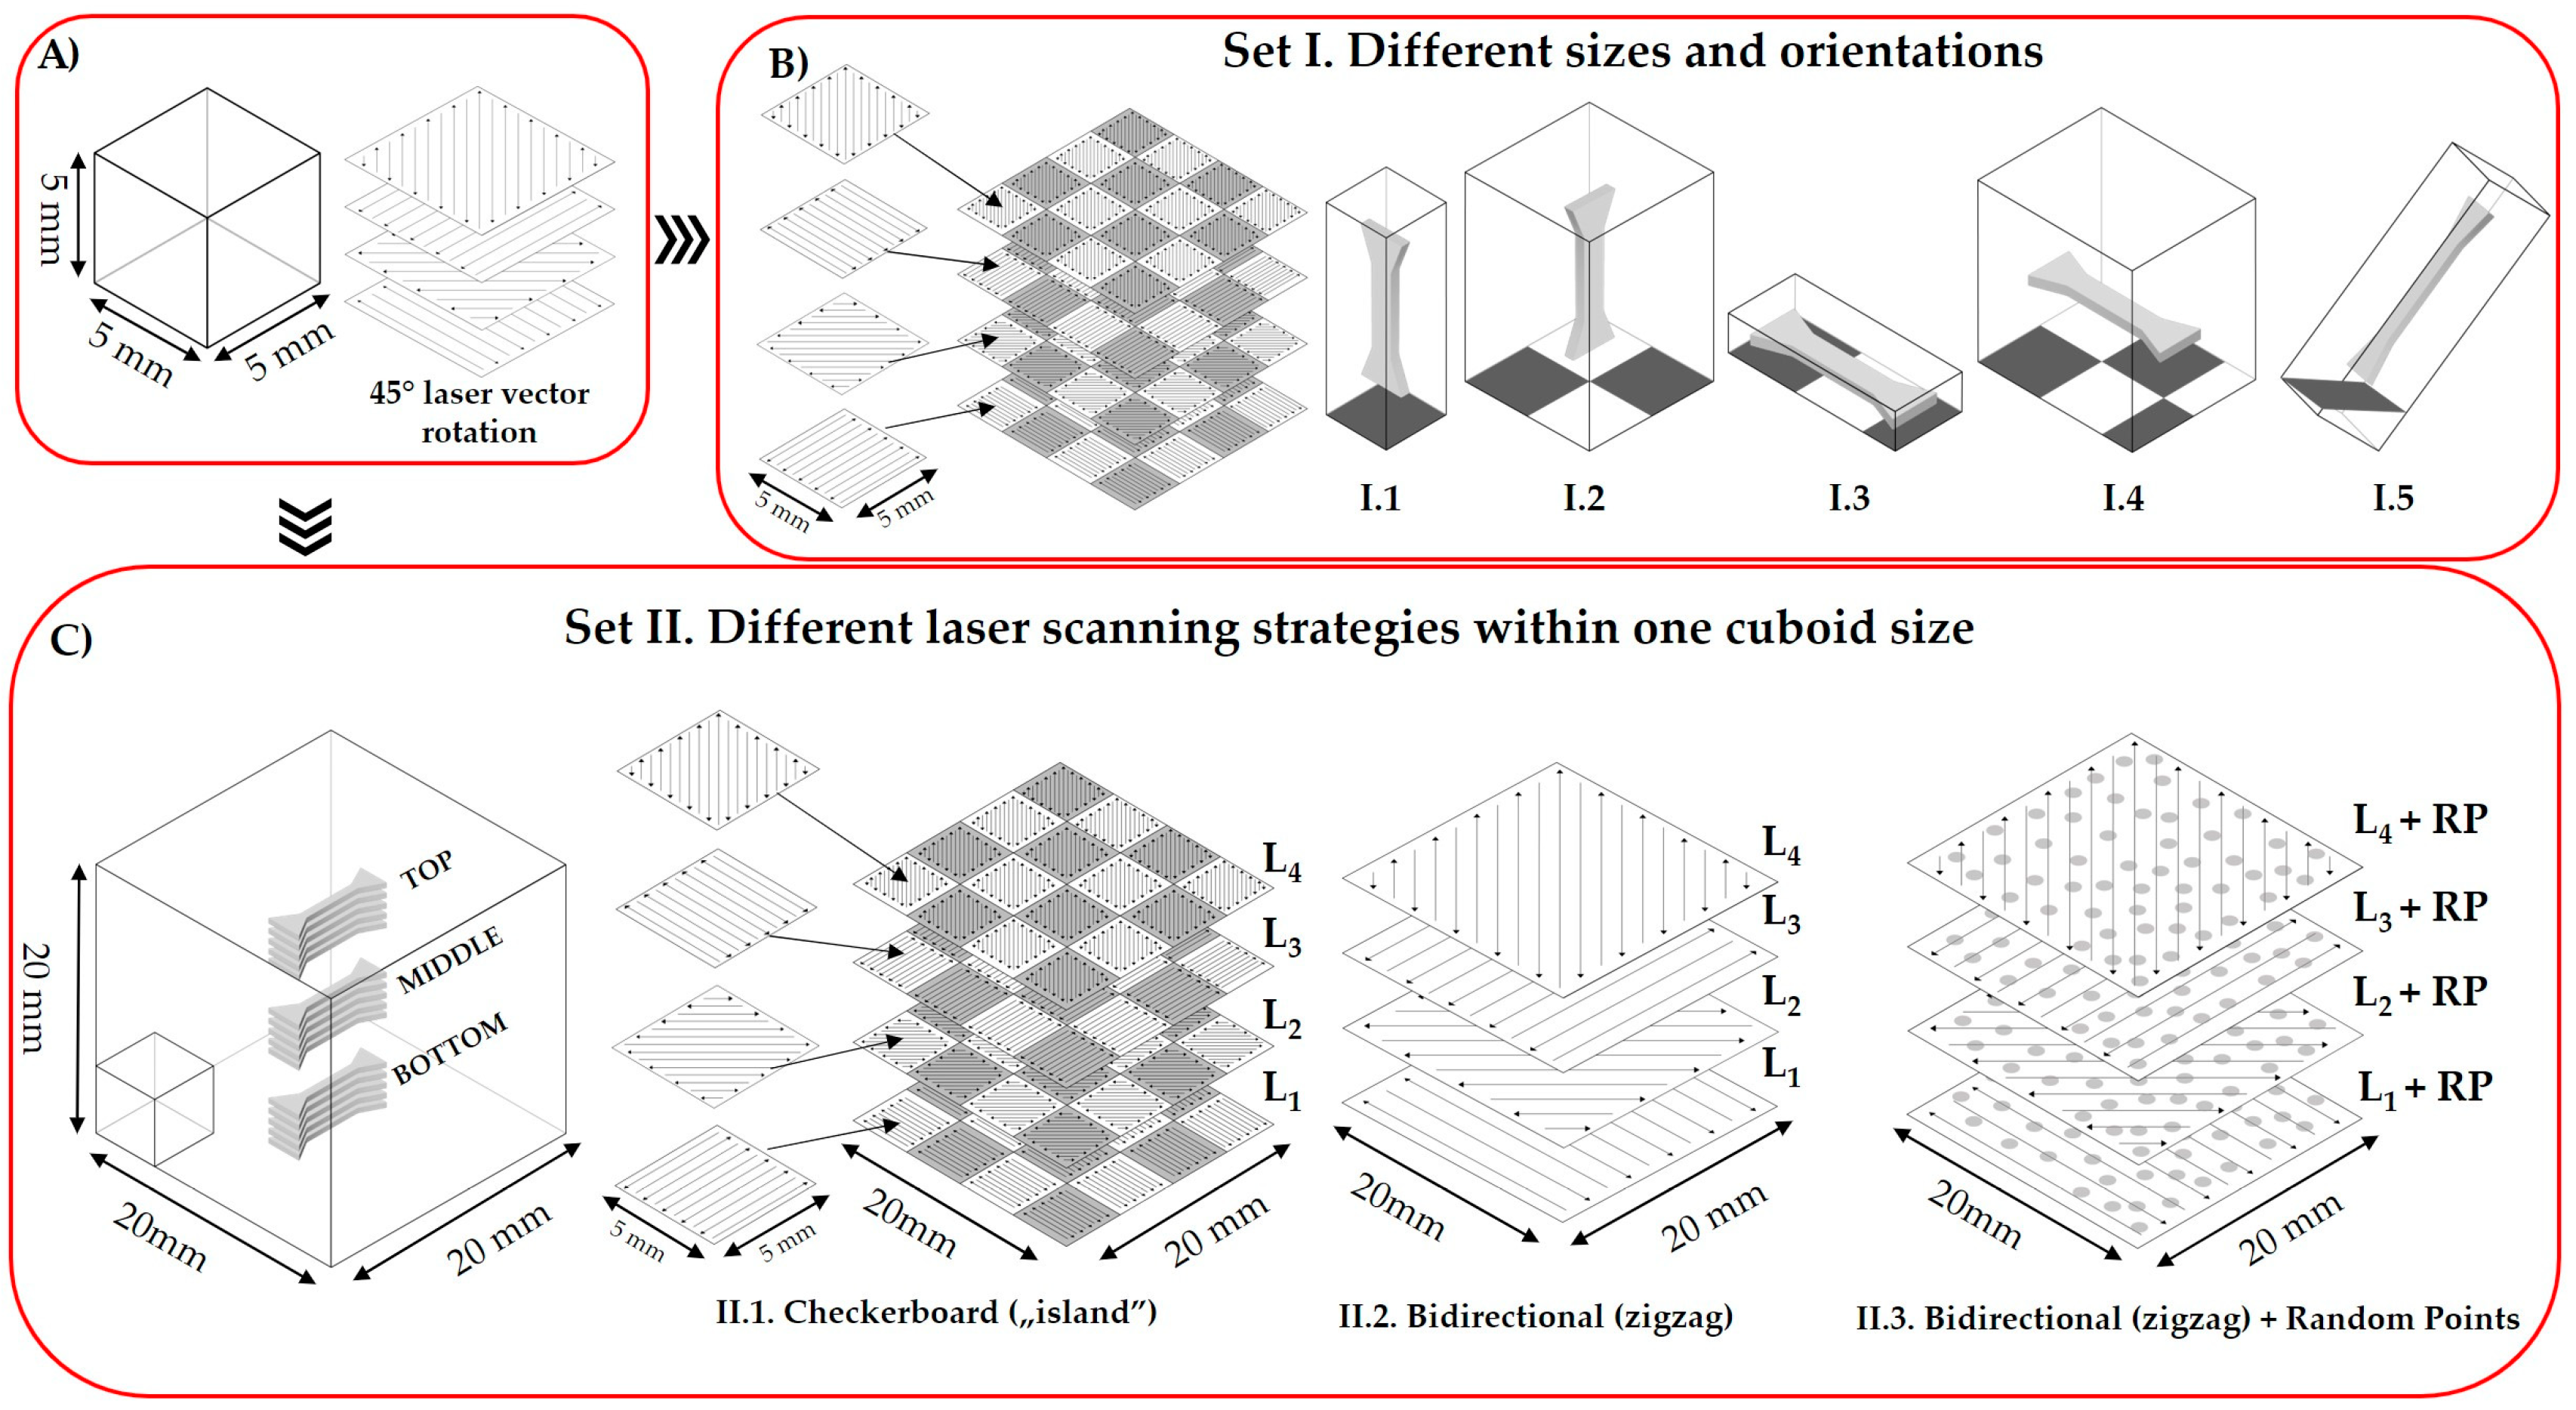
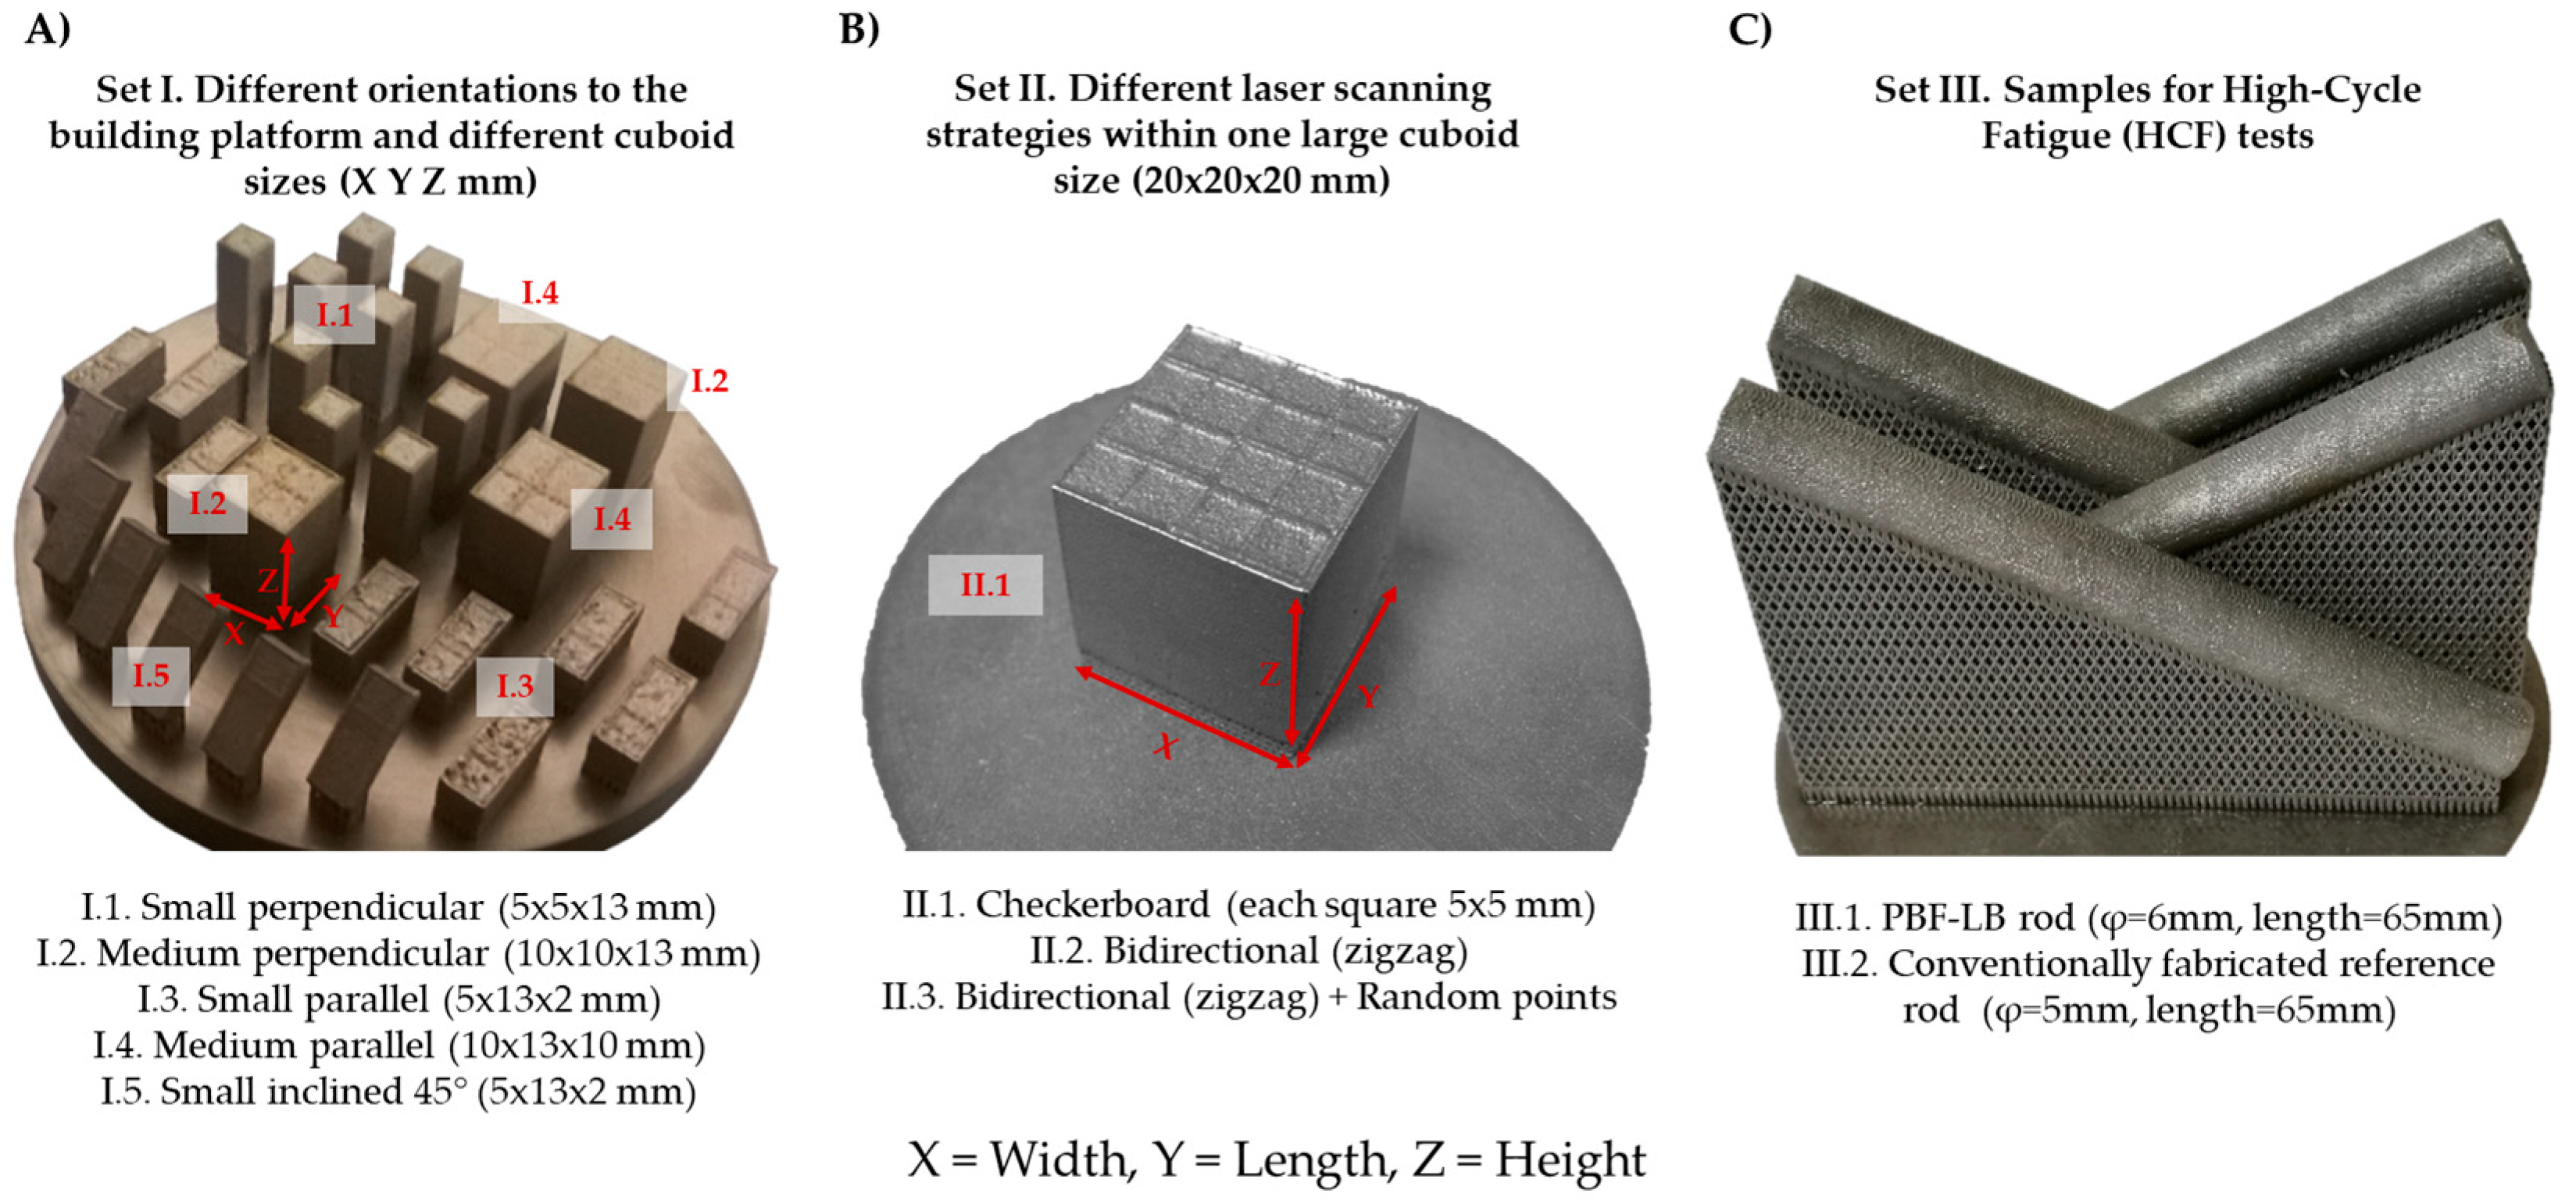
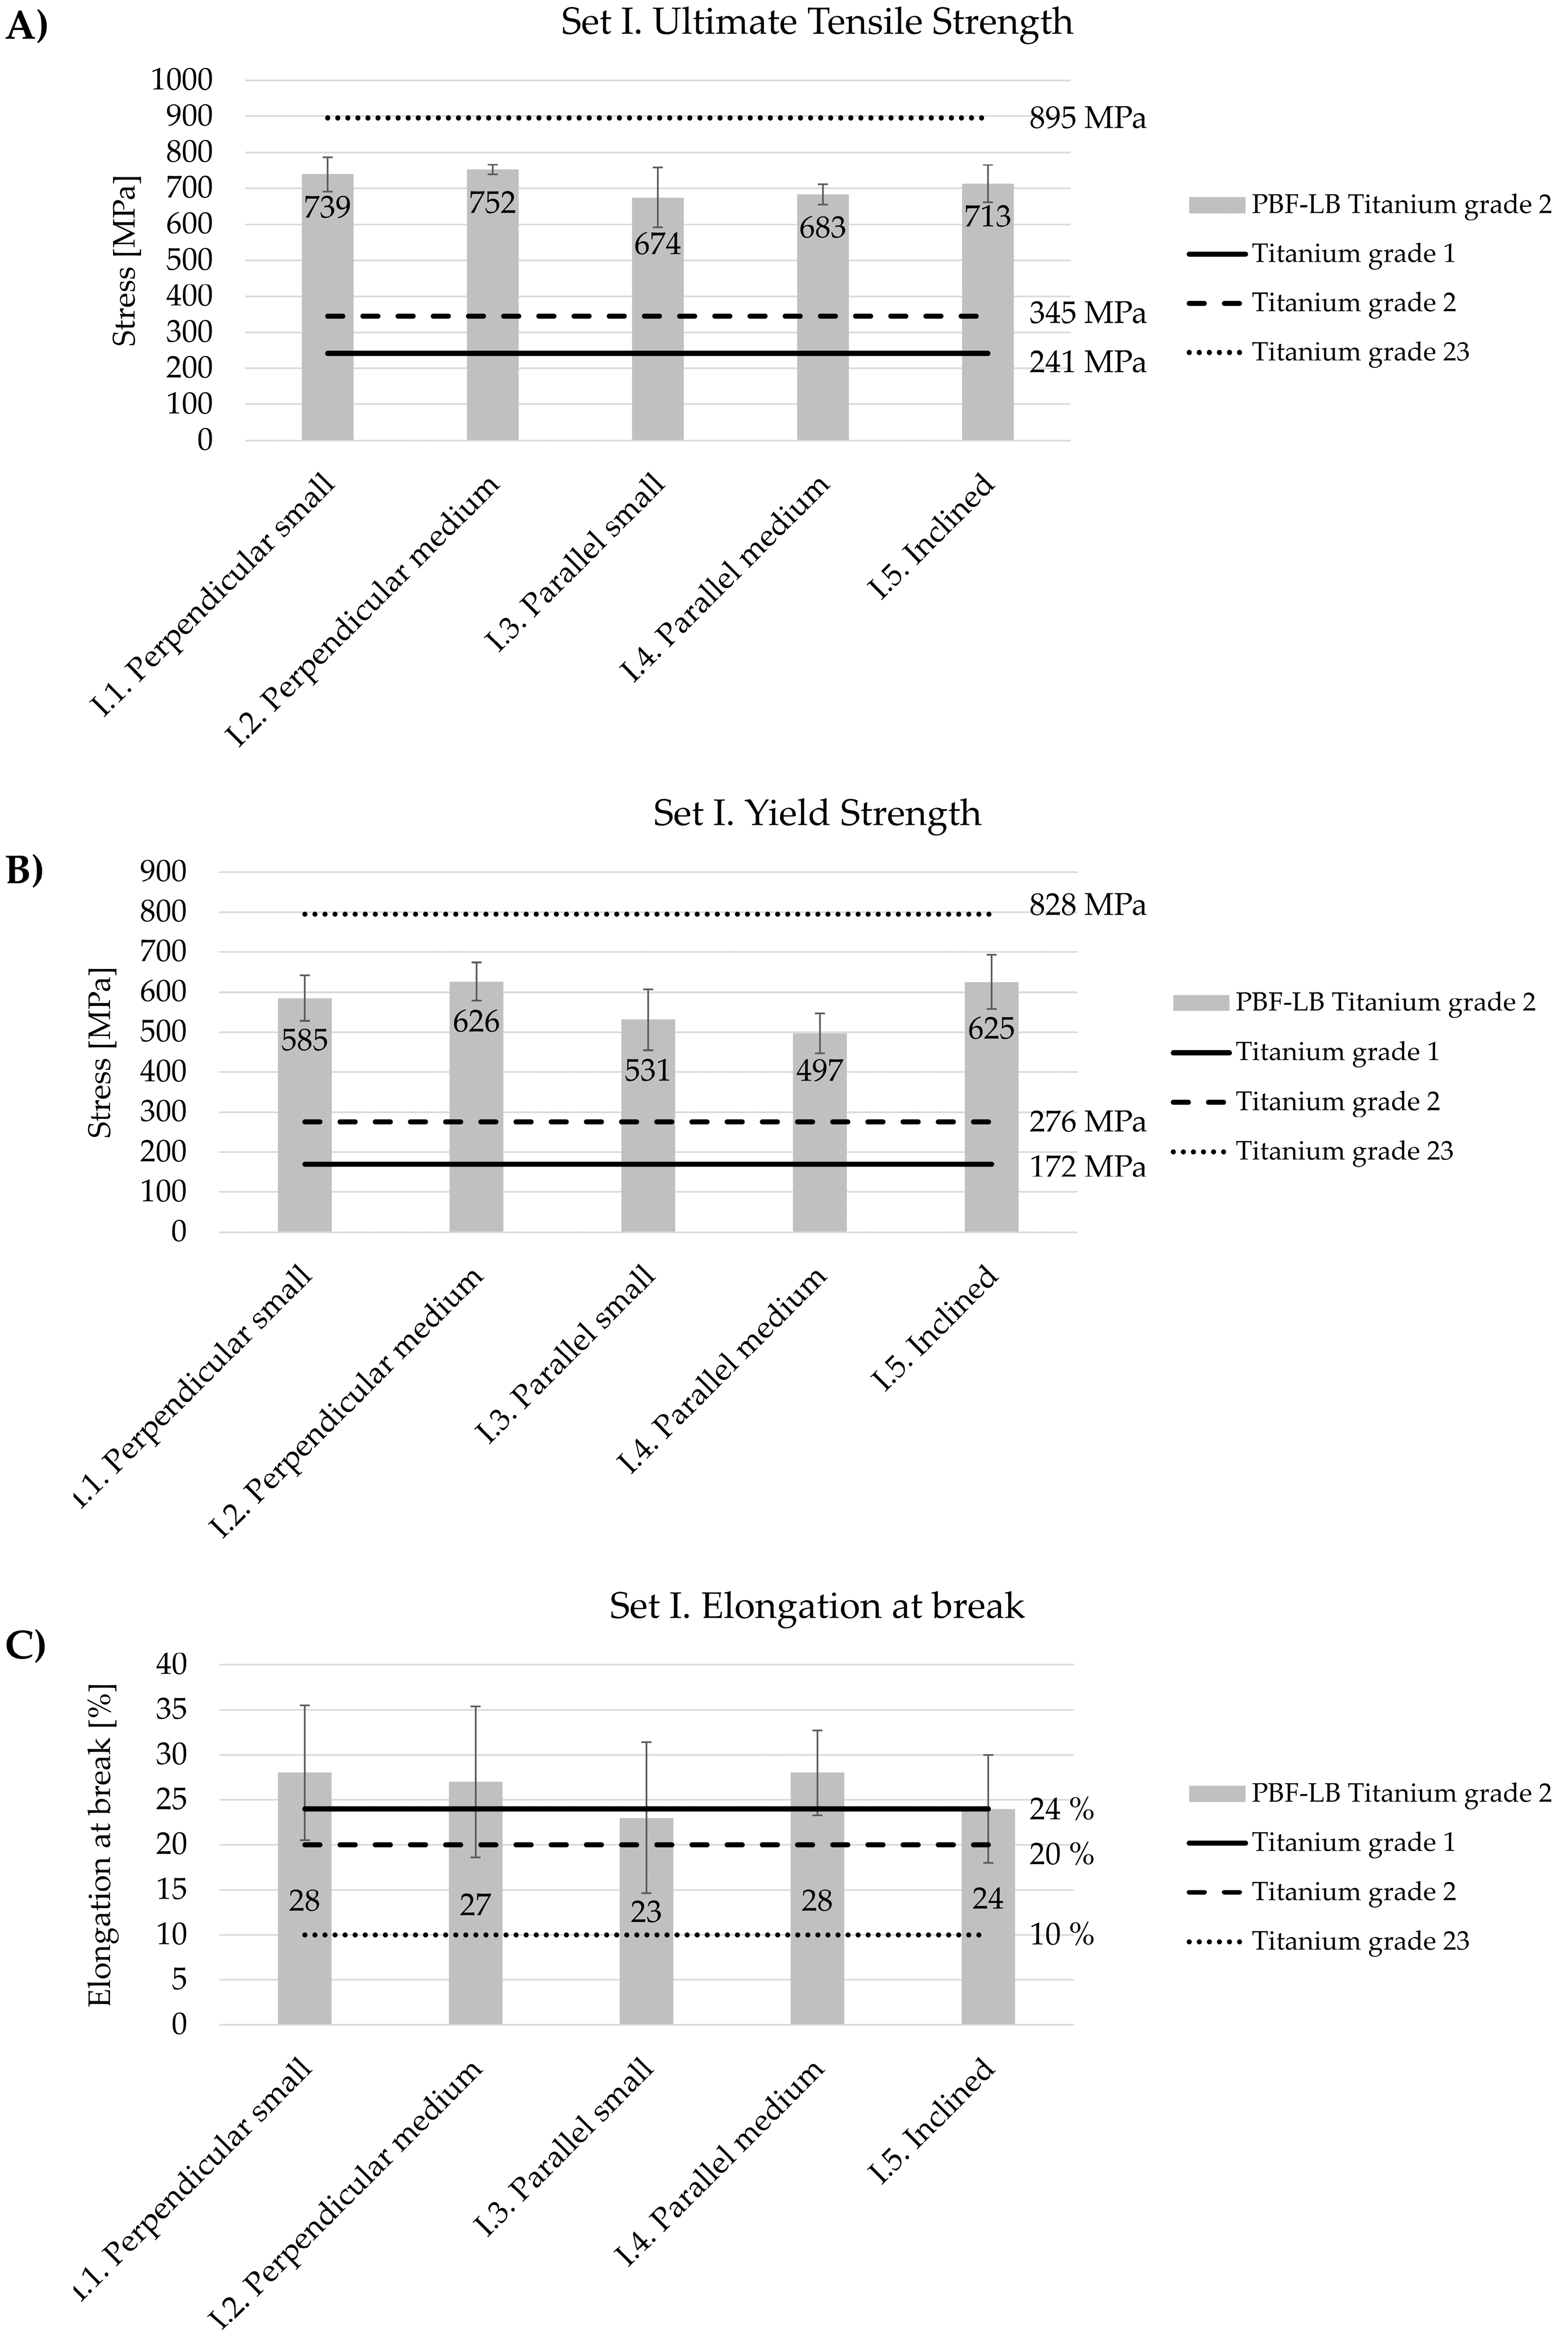
3.4.1. Set I. Different Orientations to the Building Platform and Different Cuboid Sizes

Figure 6 shows the tensile test results for the Set I samples fabricated with different sizes and orientations to the building platform compared to the conventionally fabricated titanium grade 1, titanium grade 2, and titanium grade 23 (Ti-6Al-4V). These results are also summarized in Table 4. The ultimate tensile strength (UTS) (Figure 6A) of all samples fabricated in Set I ranged from 674 ± 83 to 752 ± 14 MPa. The results obtained, regardless of the sample size and the orientation of the tensile specimens cut, show that the tensile strength is twice higher than the requirements for a conventionally processed titanium grade 2 (ASTM F67) alloy and only 10% lower than the requirements for the Ti-6Al-4V (ASTM F136-13) alloy for medical applications [35,36]. The UTS values for the Set I samples cut perpendicular to the building platform were only a maximum of 10% and 5% higher than the UTS values for the samples cut parallel and at an angle of 45°, respectively. Additionally, the yield strength (YS) values (Figure 6B) were also significantly higher than the requirements for the titanium grade 1 and titanium grade 2 and slightly below the requirements for the Ti-6Al-4V alloy. The elongation at break for all samples was in the range of 23 ± 8% to 28 ± 5%, regardless of the direction of fabrication or cutting of the tensile specimens for mechanical testing (Figure 6C).

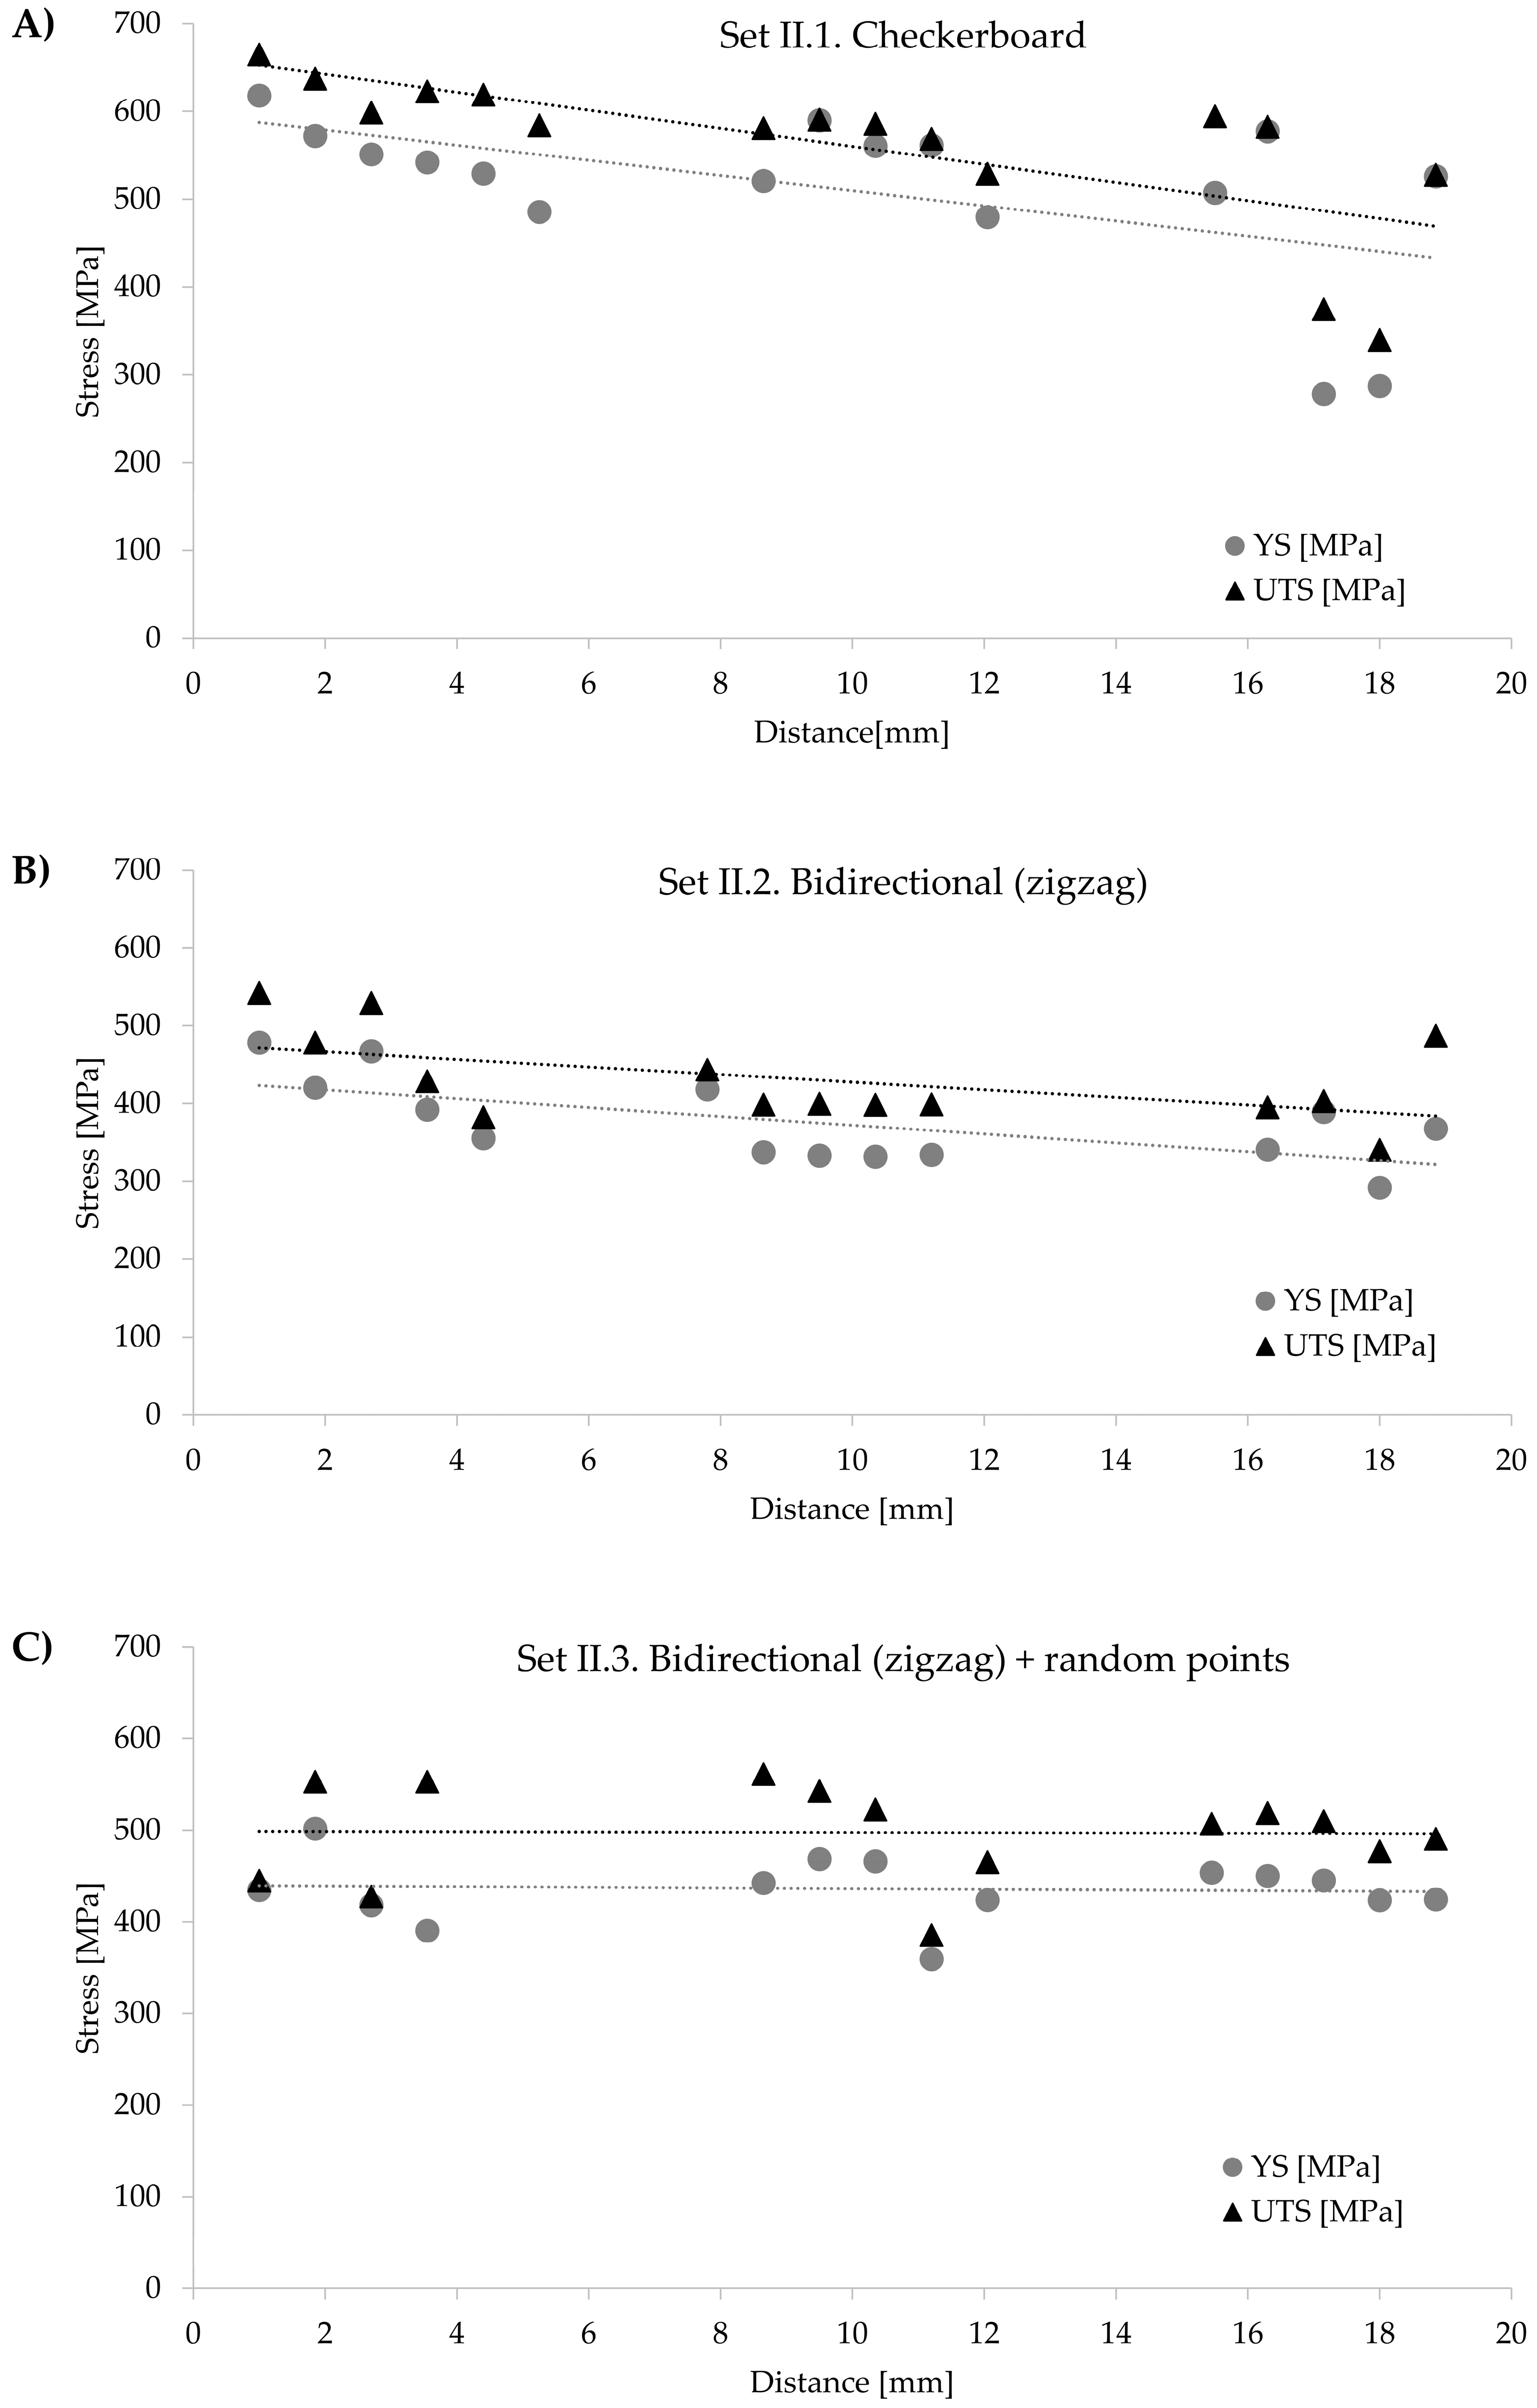
3.4.2. Set II. Different Laser Scanning Strategies within Large Cuboids (20 × 20 × 20 mm)

The mechanical properties, including ultimate tensile strength (UTS) and yield strength (YS) of large cuboids (20 × 20 × 20 mm) fabricated with different scanning strategies are summarized in three groups (bottom, middle, top) in Table 5 and are shown in Figure 7. Samples in Set II were cut along the Z direction (from bottom to top as depicted in Figure 1) to assess the influence of the sample height and scanning strategy on the mechanical properties. The samples in Set II.1 fabricated with a checkerboard (squares 5 × 5 mm) laser scanning strategy demonstrated the highest average UTS and YS but also exhibited the largest variations in strength between samples selected from the bottom and top areas. For the Set II.1 fabricated with a checkerboard laser scanning strategy, the UTS ranged from 612 ± 16 (bottom) to 456 ± 102 MPa (top). The UTS and YS values decreased with an increase in distance from the building platform for the samples from the Set II.1. checkerboard scanning strategy and the Set II.2. bidirectional (zigzag) strategy. However, the Set II.3. bidirectional (zigzag) + random points samples showcased the smallest material anisotropy, and they all had similar UTS and YS values in ranges 505 ± 52–501 ± 16 and 440 ± 12–437 ± 41, respectively. The obtained results of UTS and YS for Set II samples were around twice higher than the requirements for titanium grade 1 and grade 2 in ASTM F67 [35], but almost 40% lower than the Ti-6Al-4V requirements (795 MPa) in ASTM F136-13 [36].

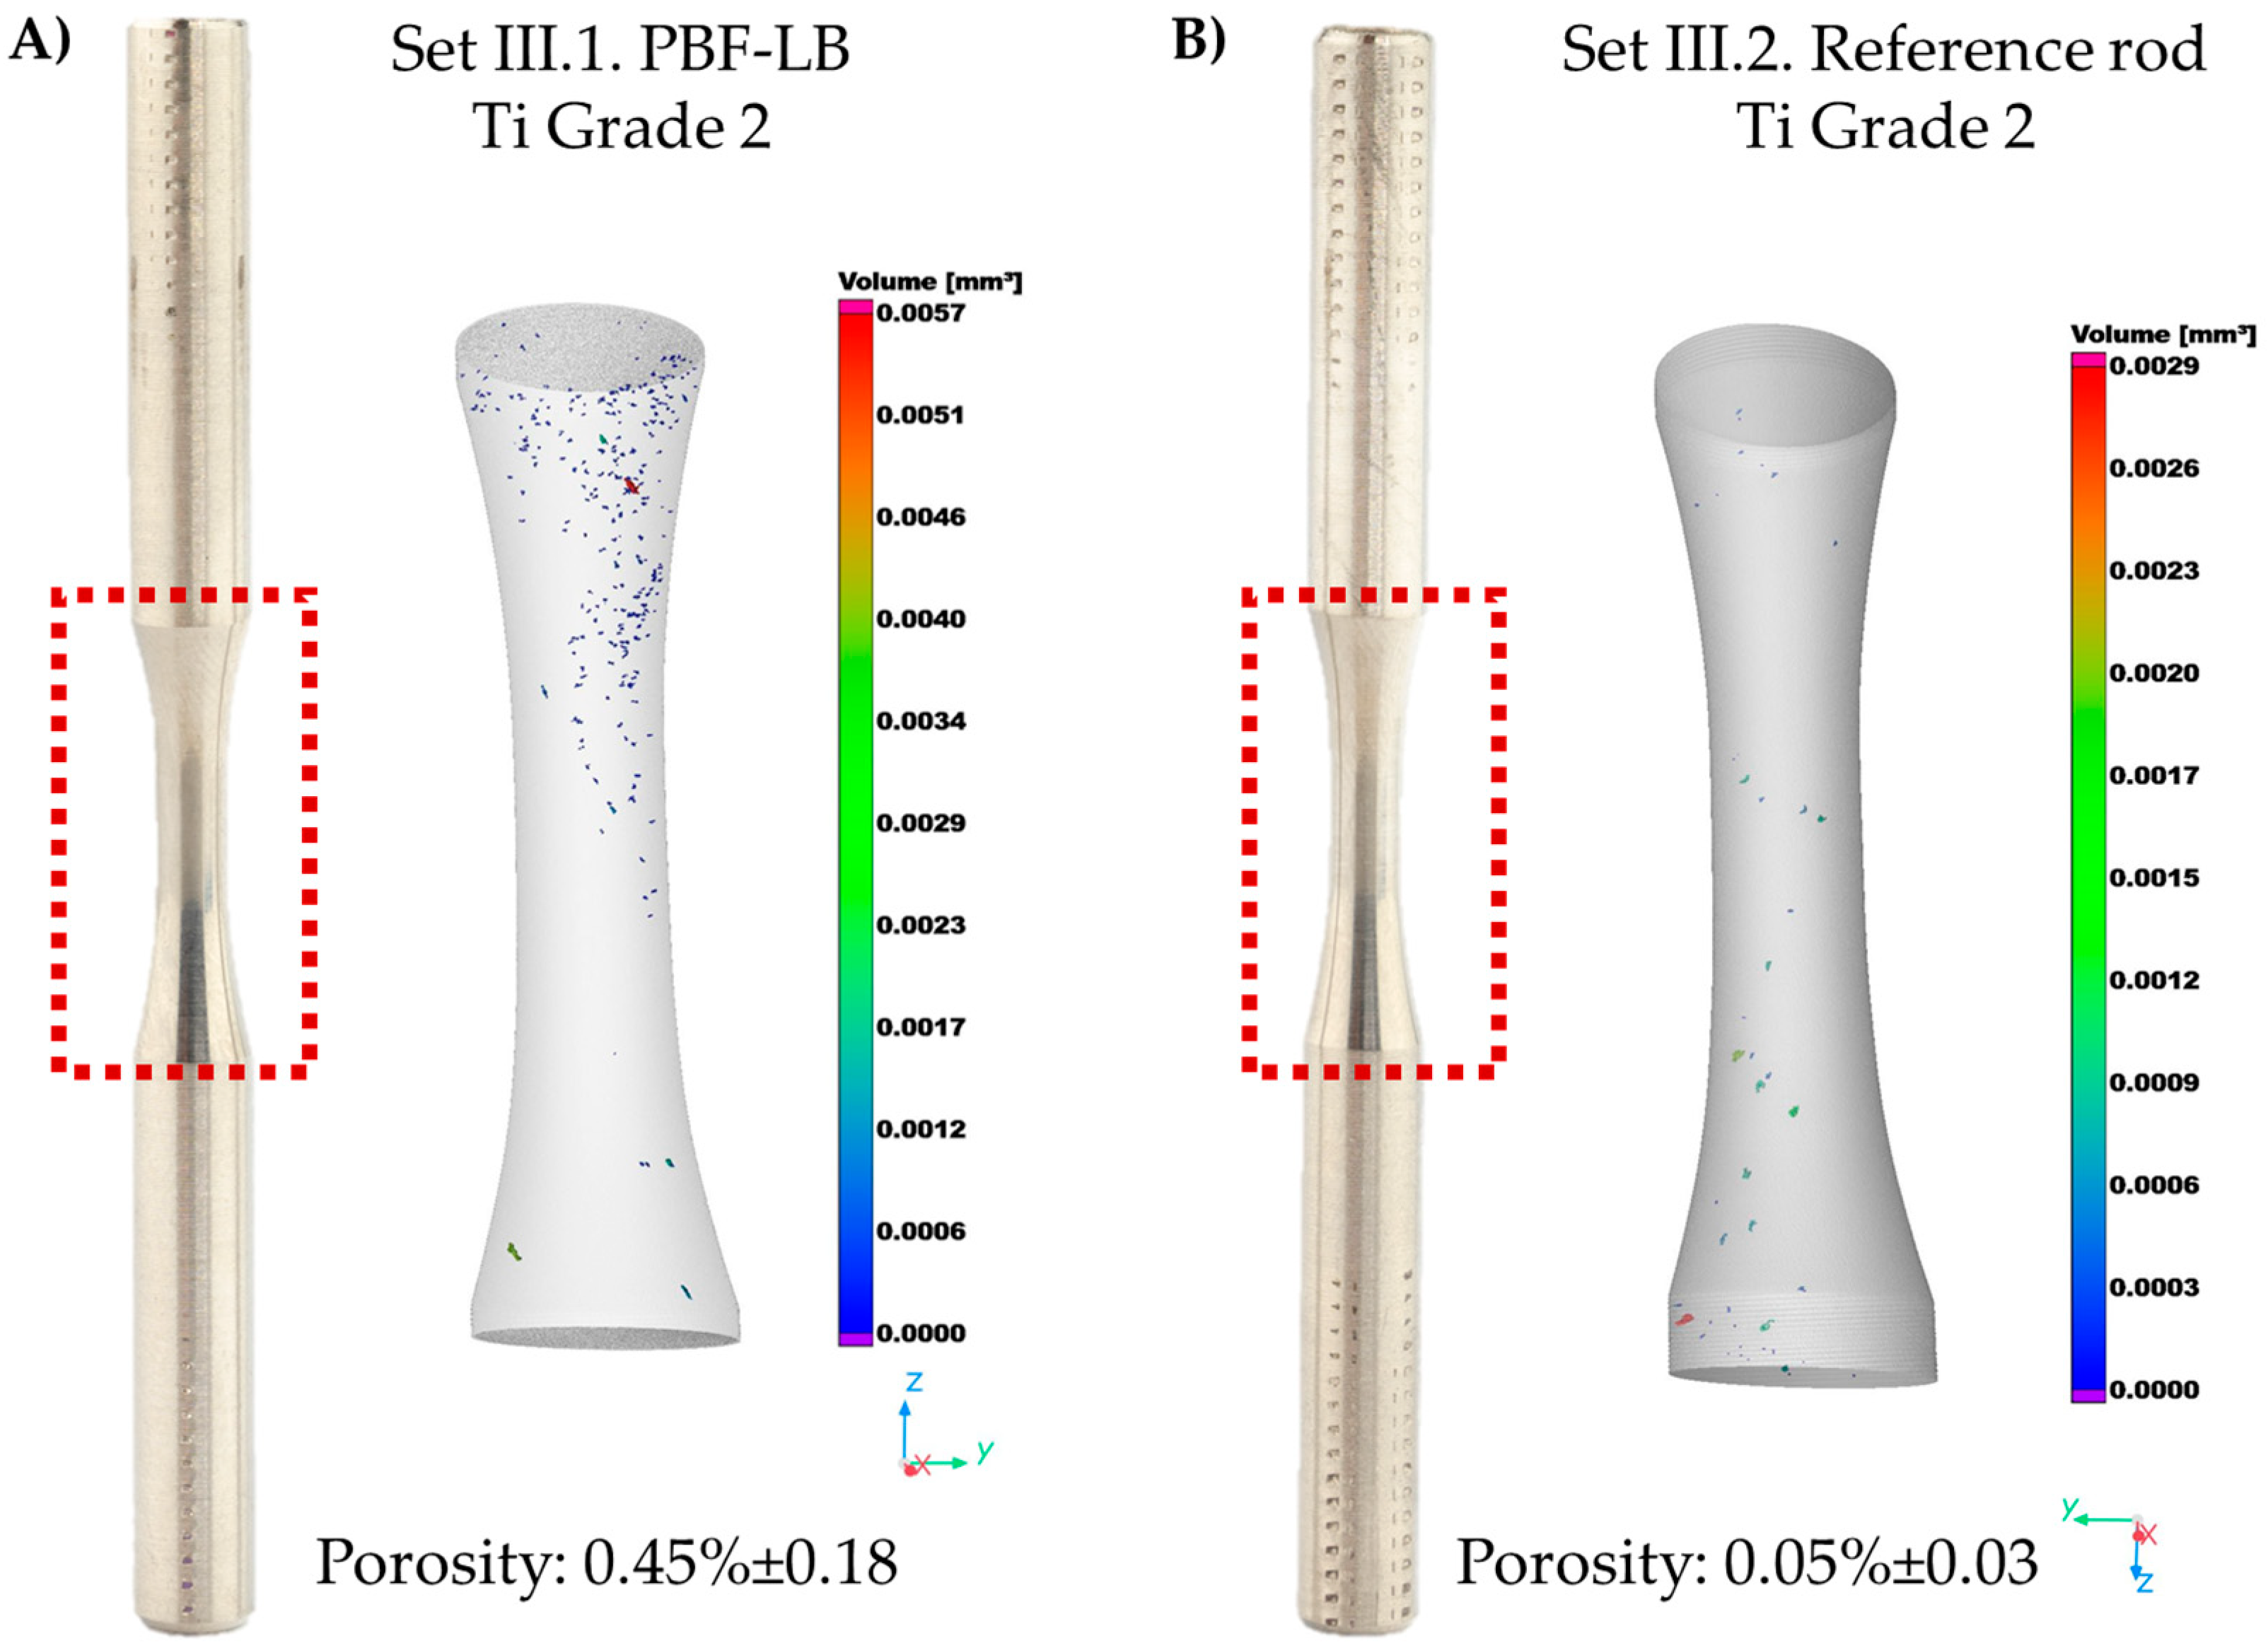
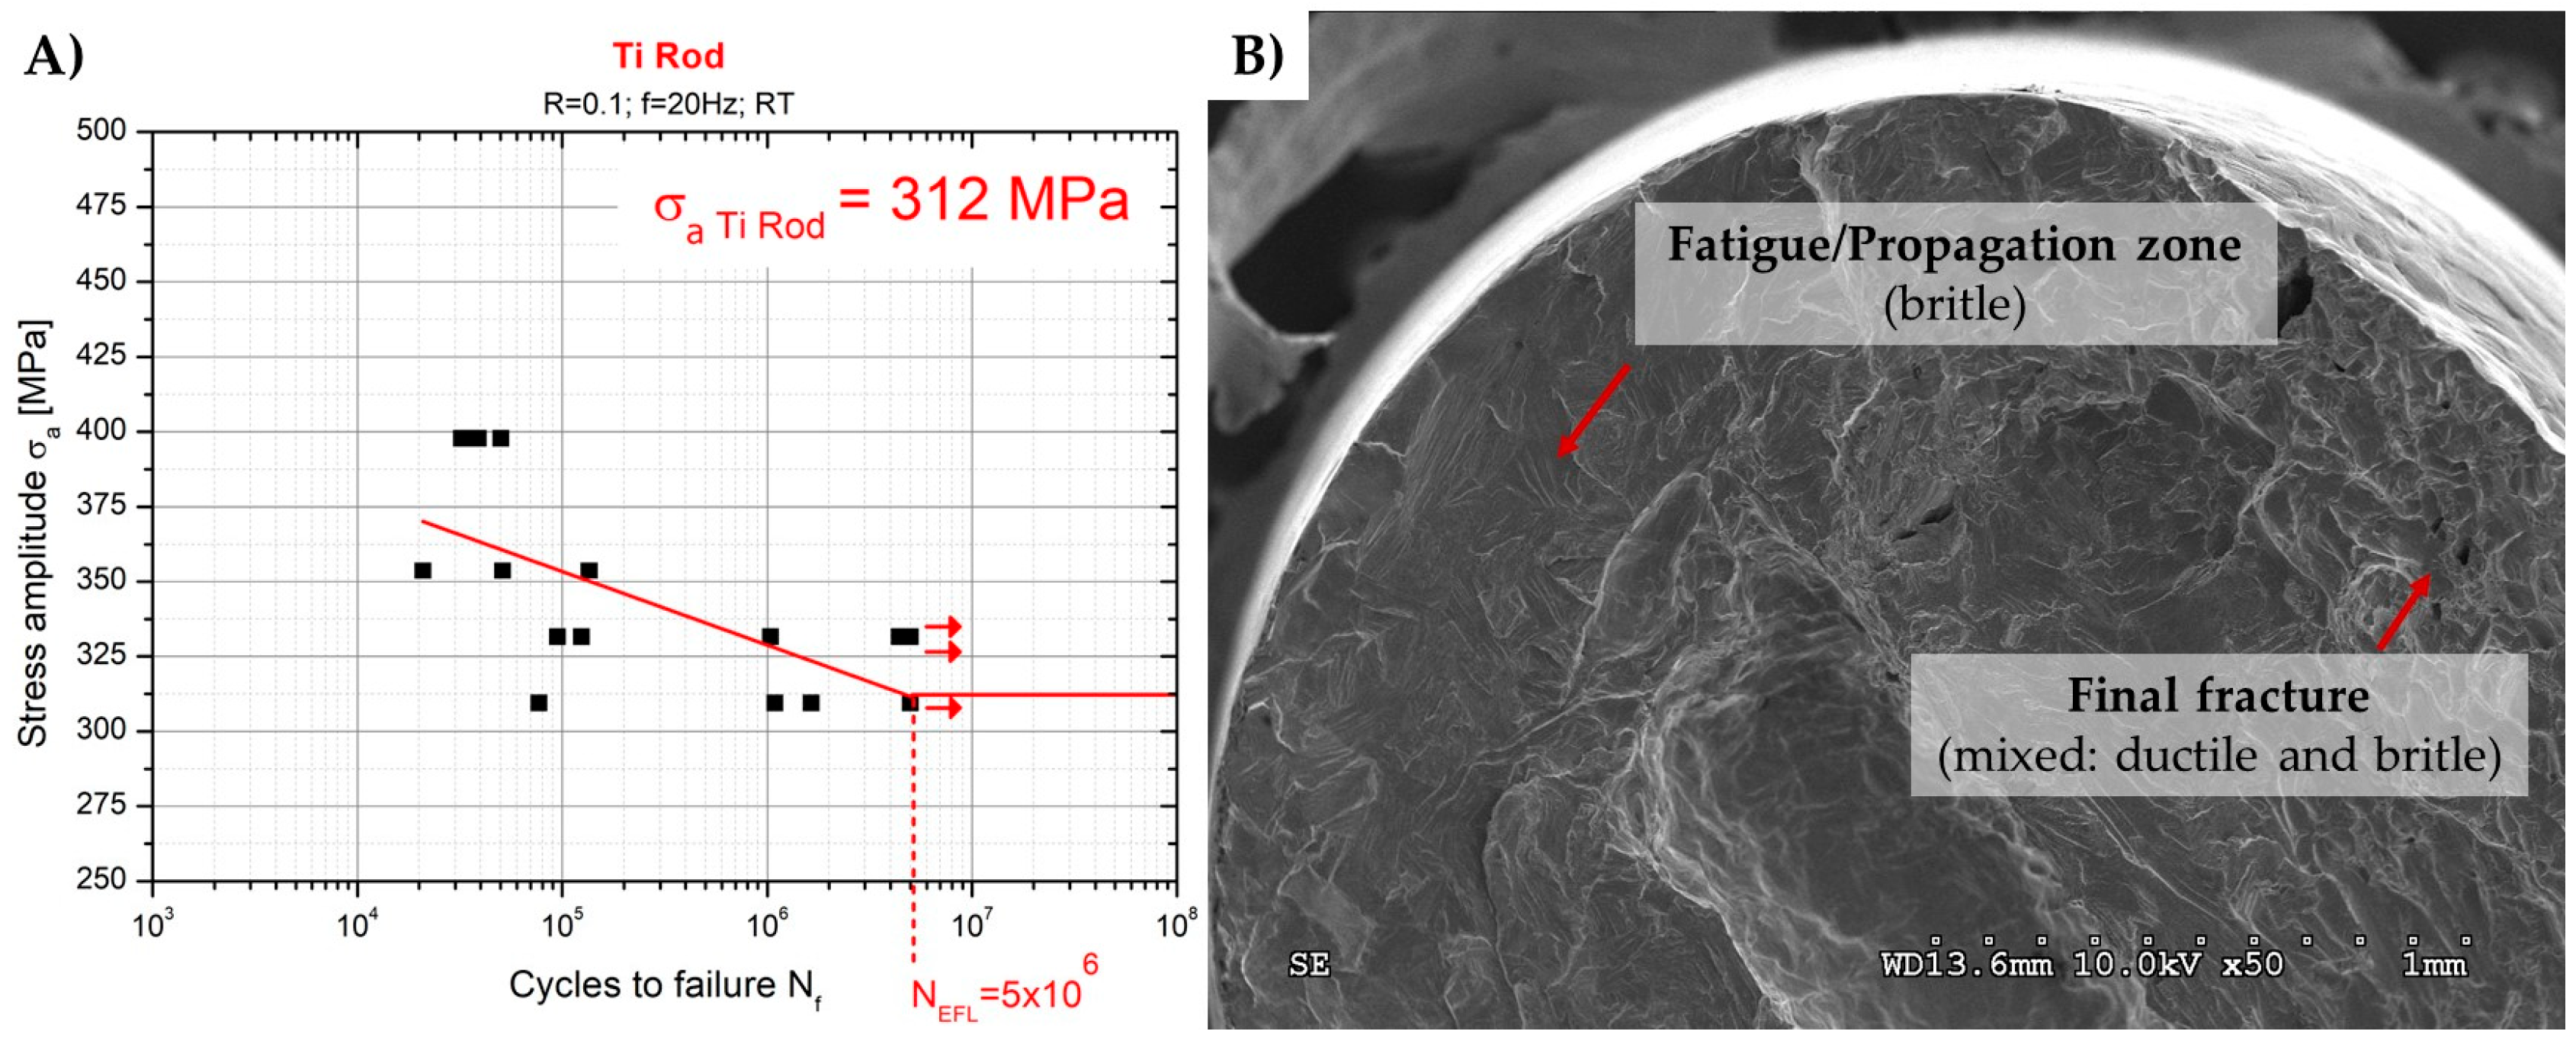
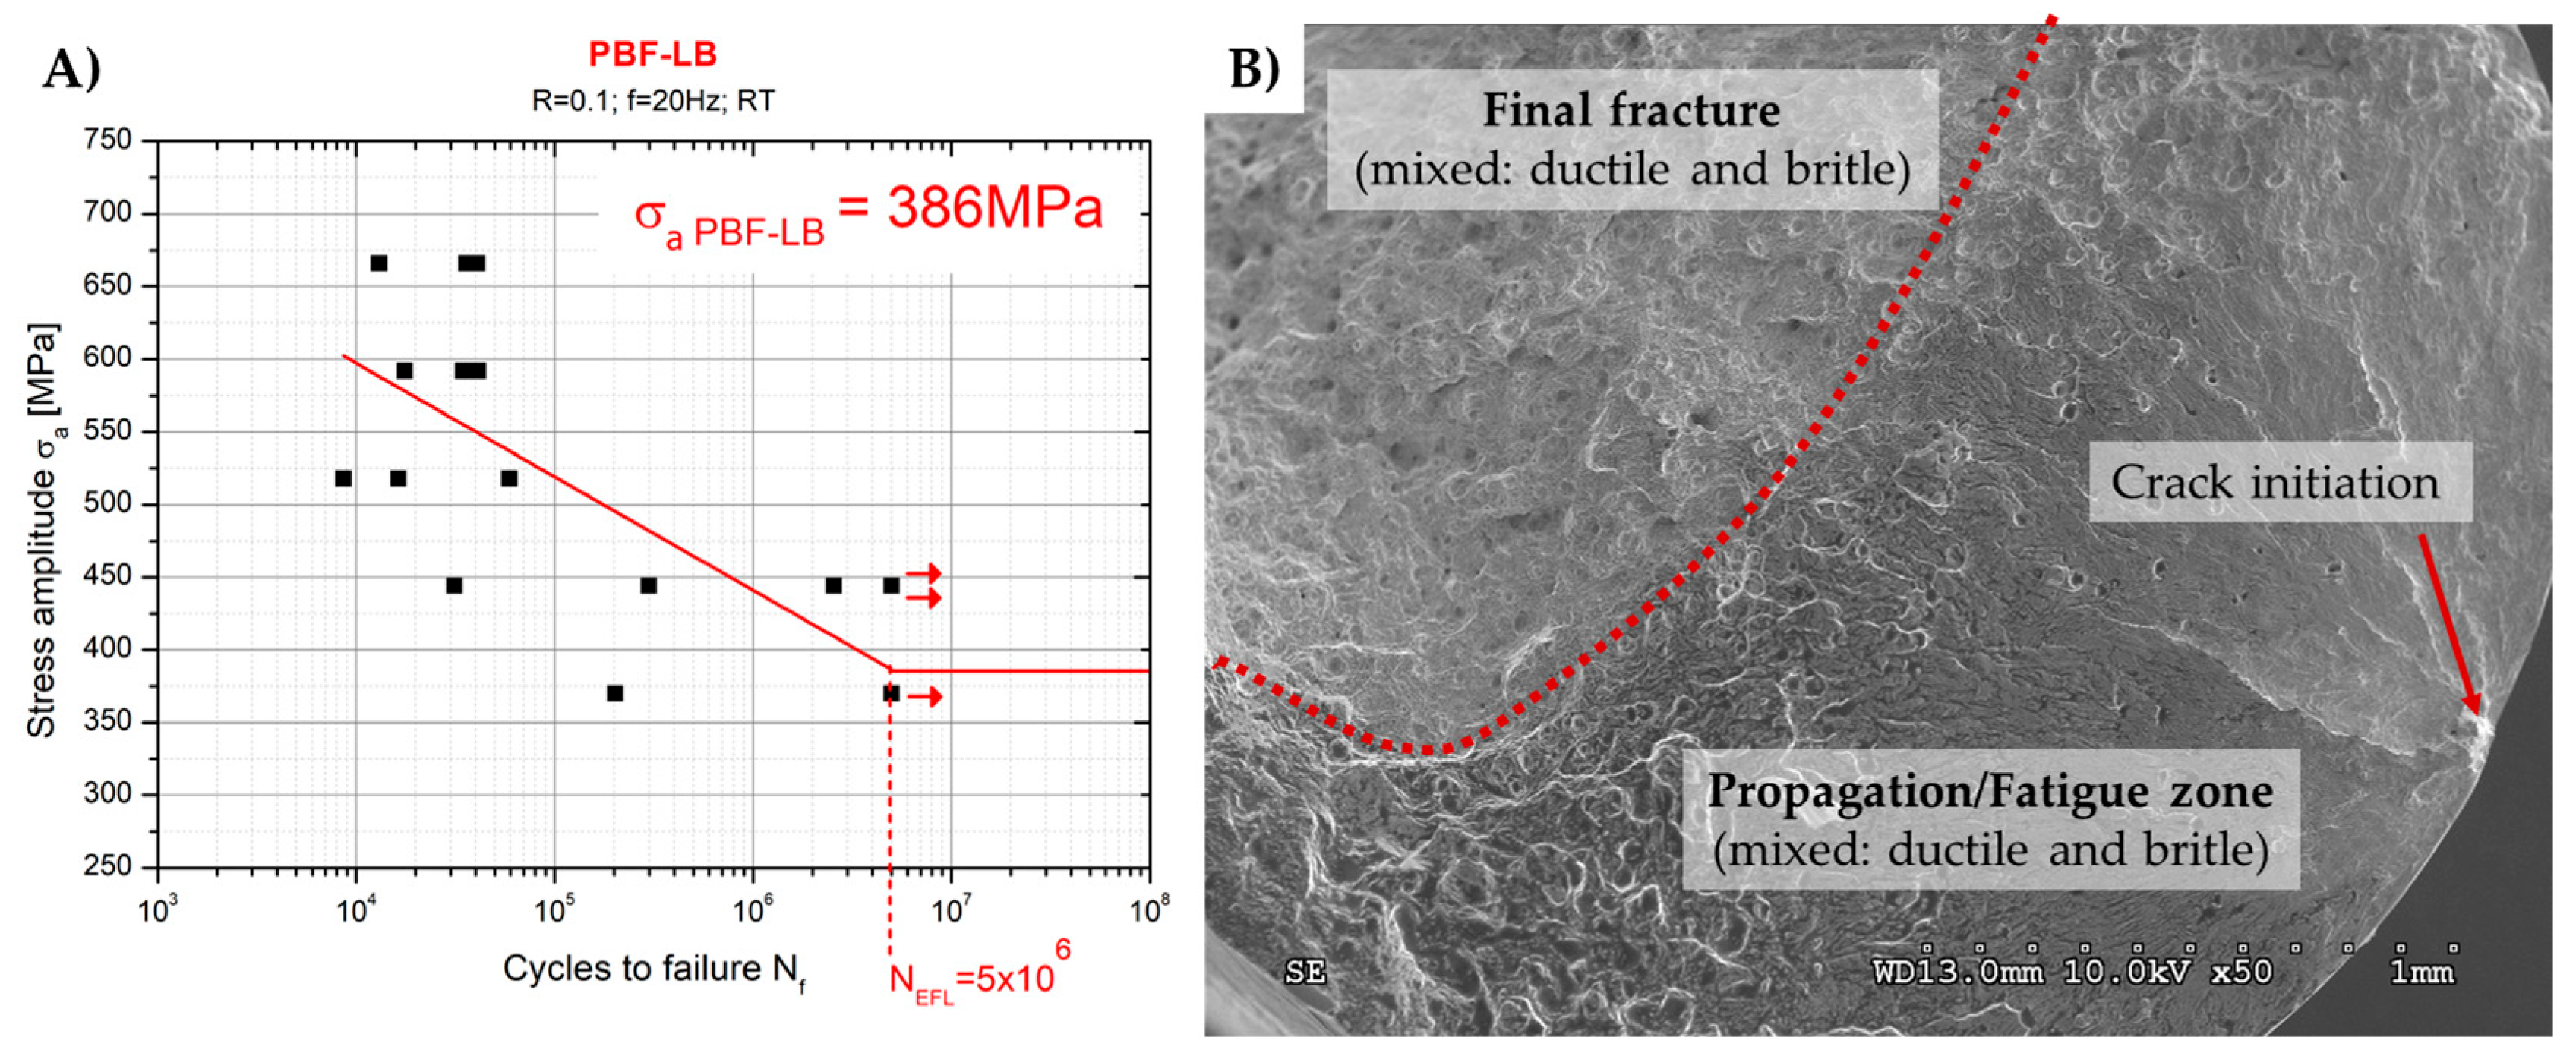
3.4.3. Set III. Samples for High-Cycle Fatigue (HCF) Tests

The high-cycle fatigue (HCF) performance of the Ti grade 2 reference rod and PBF-LB/Ti grade 2 is depicted in Figure 8A and Figure 9A, respectively, as a Wöhler plot (S-N curve), illustrating the stress amplitude (σa) versus the number of cycles to failure (Nf). The preliminary evaluation of the mechanical properties was conducted through a tensile test, employing a specimen geometry consistent with that utilized in the HCF study. This test revealed a yield strength (YS) of above 500 MPa for the majority of the PBF-LB fabricated samples with a checkerboard scanning strategy and 423 MPa for the Ti rod. Consequently, the higher fatigue strength limit for the printed material (σa PBF-LB = 386 MPa) was attributed to its higher YS. Conversely, the lower YS for the commercial rod resulted in its reduced fatigue strength limit (σa Ti Rod = 312 MPa).
The conventionally manufactured Ti grade 2 HCF specimens demonstrated mixed characteristics in the fracture. The fatigue zone exhibited a brittle river mode, indicating a cleavage fracture mode. Additionally, the break-in zone showed a mixed nature, encompassing features of both brittle (river) and ductile (dimples) fracture modes (Figure 8B). However, the PBF-LB Ti grade 2 HCF samples demonstrated a combination of brittle and ductile fracture modes in both the break-in and fatigue zones. Moreover, the crack initiation is clearly identifiable in Figure 9B.
To provide a more comprehensive comparison of the results, a factor showing the relative value of σa in relation to YS can be used—the x factor, which is defined as the quotient of σa and YS. This x-factor was 0.52 for PBF-LB and 0.71 for Ti rod. The x-factor indicates a much more substantial reduction in mechanical properties for the printed material compared to the commercial Ti rod. This is associated with the significant number of defects in the printed microstructure of PBF-LB, as revealed by a tomography analysis.

4. Discussion

The influence of PBF-LB processing parameters on AM-fabricated titanium alloys’ microstructure and mechanical properties has been extensively researched for different sets of parameters [37,38,39,40]. These studies have examined PBF-LB process parameters such as laser power, laser scanning speed, hatch distance, laser exposure time, different laser scanning strategies, layer thickness and many more, establishing strong correlations with the resulting microstructure and mechanical properties. However, there is a notable gap in the literature concerning the mechanical properties of Ti grade 2 when transferring process parameters optimized on small sample sizes to bigger ones, as well as limited research on anisotropy studies when relatively small tensile samples are WEDM cut within AM fabricated objects. It is important to develop the possibility of performing tensile strength tests on mechanical samples of several milimetres in length (the measurement section was only 5 mm in this study) when developing new materials for additive manufacturing, as finding the best PBF-LB parameters often requires significant time and resources. Additionally, it is especially justified to conduct such tests when working with new alloys, transition metals, or rare earth metals. Furthermore, additive manufacturing of titanium alloy grades 1–4 with the mechanical properties of Ti-6Al-4V would make it possible to reduce the cost of the final product by using less expensive materials and eliminating the need for heat treatments, which are commonly used for Ti-6Al-4V alloy processed by PBF-LB methods [41].
The production of large functional parts in the PBF-LB process may fail when using previously selected parameters based on small test samples due to the change in geometry and dimensions. This can result in increased stress on critical points of the object and a higher probability of pores occurring during the production of larger objects than small test samples, as we demonstrated in our previous studies [24,25]. Therefore, it is important to establish procedures that allow for the transfer of PBF-LB process parameters developed on laboratory samples to the industrial production of functional, complex geometries to which metal additive technologies are dedicated. In this study, we successfully adapted parameters of the PBF-LB/Ti process developed on small test samples (5 × 5 × 5 mm) to larger objects, such as cubes (20 × 20 × 20 mm) and rods (φ = 6 mm, length = 65 mm).
The first part of our work (Set I. Different sizes and orientations) yielded significant results. We obtained high-density materials close to the theoretical density of titanium, with a strength exceeding twice the requirements of the ASTM F67-13(2017) standard for Ti grade 2 [35]. The strength of the produced materials was 674–739 MPa, and the elongation at break was 24–28%. Notably, samples cut parallel to the construction plane had a slightly lower tensile strength (674–683 MPa) than those cut perpendicular to the construction plane (713–752 MPa), but still, its strength was a few times higher than for conventionally fabricated Ti grade 2 and close to the Ti-6Al-4V requirements. These significant improvements in the mechanical strength of the Set I samples made from Ti grade 2 were the effect of a coarsened microstructure and oxygen solid strengthening when 0.1–0.3% vol. of oxygen was in the machine chamber during PBF-LB fabrication. Similar results with quite the same oxygen wt.% were reported by Tarik et al. [42], who analysed the mechanical properties of PBF-LB processed Ti grade 2 and achieved a range of mechanical properties of UTS = 720 MPa and YS = 630 MPa in the as-built state with an elongation of 8% in the build direction and in the perpendicular direction YS = 520 MPa and UTS = 607 MPa with an elongation of 10%. The strengthening effect from oxygen in titanium alloys has previously been reported as partly due to the pinning of screw dislocation cores by the distortion of occupied interstitial sites [43]. This phenomenon was also corroborated by density functional theory (DFT) calculations, along with notable interactions of oxygen atoms with twin boundaries [44,45].
In the second part of our research (Set II. Different scanning strategies), we produced materials with a much larger size (8000 mm3) than the sample on which the parameters were developed (125 mm3) yet maintained a high density equal to 98.6–99.5% of the theoretical density of titanium grade 2. A checkerboard scanning strategy was used to transfer parameters from small laboratory samples to larger objects. Checkerboard areas with the same size as a small (5 × 5 mm) laboratory sample cross-section were used. To prove the influence of the employed scanning strategy for the possibility of transferring optimized parameters between objects of different sizes, we produced samples using the bidirectional (zigzag) laser beam scanning strategy commonly used for laser beam melting of titanium powders [46] and the random points scanning strategy, which is commonly used to produce metallic glasses [47]. Furthermore, we decided to increase the amount of oxygen in the building chamber to values between 0.2–0.4 vol.% and reuse the previously used in Set. I titanium powder to facilitate the solid solution strengthening mechanism. Unexpectedly, the UTS and YS of the Set II samples decreased from the values obtained in Set I by 20% for Set II.1 to almost 50% for Set II.2 and II.3. This was undoubtedly the effect of an excessive presence of oxygen (0.8 wt.%); the oxygen level to achieve the best mechanical properties in AM fabricated Ti was found difficult to determine [48]. Set II.2. bidirectional (zigzag) and Set II.3. bidirectional (zigzag) + random points laser scanning strategies resulted in a 1.5–2.0% increase in porosity compared to the checkerboard strategy, so the UTS and YS of these samples were the lowest for the current study. Although we had overcome such high porosity by implementing the checkerboard laser strategy (Set. II.1), the porosity of 1.5% must still be reduced in future works.
In the third part of our study (Set III. High-cycle fatigue tests), the HCF results indicated that the PBF-LB-fabricated samples using a checkerboard laser scanning strategy exhibited significantly higher fatigue strengths compared to the commercial Ti grade 2 rod despite the 0.45 and 1.5% higher porosity confirmed by microtomography and Archimedes measurements, respectively. The fatigue strength limit was 386 MPa for the PBF-LB samples and 312 MPa for the conventionally fabricated Ti grade 2 rod samples. The difference in the mechanical strength of the PBF-LB fabricated material and conventionally processed Ti grade 2 rod was mainly due to the increased oxygen content and refined plate microstructure. The PBF-LB process for HCF samples fabricated in Set III.1 was kept in 0.1–0.3 vol.% of oxygen in the building chamber, so the resulting part had 0.13 wt.% of oxygen measured in the high-temperature extraction method. Furthermore, a study on manufacturing defects in PBF-LB fabricated titanium grade 1, as reported by Majchrowicz et al. [49], indicated that a significantly lower endurance fatigue limit was observed while the yield strength was similar to the commercial material. Therefore, the fabrication method should be improved to eliminate the presence of porosity.
Our research has shown that it is possible to transfer PBF-LB process parameters from small samples to large objects using appropriate scanning strategies. However, our future work should focus on reducing the porosity and improving the control over the oxygen content in the final objects. Additionally, we are planning to perform research on transferring parameters to thin-walled samples and porous structures, as their fabrication using previously optimized PBF-LB process parameters on different-sized samples is also challenging [50,51,52].

5. Conclusions

This study aimed to investigate the effects of laser beam scanning strategy and oxygen volume on Ti grade 2 material properties. As part of the research, we investigated whether the PBF-LB/Ti process parameters optimized for samples with dimensions of 5 × 5 × 5 mm can be applied to samples of different sizes (up to 8000 mm3) and orientations on the building platform. Our findings revealed that the checkerboard laser scanning strategy, with the island size equal to the cross-section of the sample used for process parametrization, can be successfully employed to fabricate samples with several times larger volumes. The other tested laser scanning strategies, bidirectional (zigzag) and bidirectional (zigzag) + random points, significantly increased the porosity, thus lowering the UTS. Additionally, it was found that the amount of oxygen in the building chamber during the fabrication of Ti grade 2 should be maintained within the range of 0.1–0.3 vol.% to ensure that the ultimate tensile strength (UTS) and elongation remain similar to those of Ti grade 5. The results of our study highlight the importance of choosing a scanning strategy that replicates the nature of the melt pool when optimizing small samples and transferring parameters to larger ones. We noted that parameters optimized for small samples could not be directly applied without considering the appropriate scanning strategy. Furthermore, to achieve successful transfer, it is important to consider other PBF-LB process factors, such as the inert atmosphere (amount of oxygen in the building chamber). When proper parameters and scanning strategies are used, it is possible to strike a balance between achieving high strength and minimizing mechanical properties anisotropy. Understanding these relationships between process parameters and final properties is crucial for optimizing the manufacturing process of titanium alloys to meet specific application requirements and ensure both structural integrity and process performance.

Author Contributions

Research concept: B.A.W. and A.C.-W.; Data curation and formal analysis: B.A.W.; CAD design: B.A.W. and A.C.-W.; PBF-LB processing: B.A.W., A.C.-W. and Ł.Ż.; WEDM cutting: P.M.; static mechanical tests: P.M. and B.R.-B.; dynamic mechanical tests: R.M.M.; microtomography and visualization: W.N.; metallography: M.Z.; funding acquisition: P.M., W.Ś. and M.M.; writing (original draft preparation, review and editing): B.A.W., A.C.-W., P.M. and R.M.M. All authors have read and agreed to the published version of the manuscript.

Funding

The authors would like to thank the NCN (National Science Center) for providing financial support to the project “Synthesis and characterisation of novel biomaterials based on three-dimensional (3D) multifunctional titanium substrates” (Grant No. 2017/25/B/ST8/01599) in the framework of the OPUS 13 program. The Polish Ministry of Science and Higher Education financially supported this work with the grant “New Polish metallic materials for additive manufacturing technology (3D printing)” (Grant No. MEiN/2022/DPI/1064).

Data Availability Statement

The data presented in this study are available from the corresponding author by reasonable request due to the formal requirements of the institutions financing the research.

Acknowledgments

We would like to thank the technicians Rafał Mędza, Paweł Szewczyk and Maciej Fonder for their support in their daily work at the MCB UKSW 3D Printing Laboratory.

Conflicts of Interest

Author Agnieszka Chmielewska-Wysocka was employed by International Additive Manufacturing Group Ltd, Author Łukasz Żrodowski was employed by Amazemet Sp. z o. o., Ltd., The remaining authors declare that the research was conducted in the absence of any commercial or financial relationships that could be construed as a potential conflict of interest.

References

  1. Yadroitsev, I.; Yadroitsava, I.; Du Plessis, A.; MacDonald, E. Fundamentals of Laser Powder Bed Fusion of Metals; Elsevier: Amsterdam, The Netherlands, 2021; ISBN 0128240911. [Google Scholar]
  2. Kumar, G.R.; Sathishkumar, M.; Vignesh, M.; Manikandan, M.; Rajyalakshmi, G.; Ramanujam, R.; Arivazhagan, N. Metal Additive Manufacturing of Commercial Aerospace Components—A Comprehensive Review. Proc. Inst. Mech. Eng. Part E J. Process Mech. Eng. 2022, 237, 441–454. [Google Scholar] [CrossRef]
  3. Sing, S.L.; Kuo, C.N.; Shih, C.T.; Ho, C.C.; Chua, C.K. Perspectives of Using Machine Learning in Laser Powder Bed Fusion for Metal Additive Manufacturing. Virtual Phys. Prototyp. 2021, 16, 372–386. [Google Scholar] [CrossRef]
  4. Zavdoveev, A.; Zrodowski, Ł.; Vedel, D.; Cortes, P.; Choma, T.; Ostrysz, M.; Stasiuk, O.; Baudin, T.; Klapatyuk, A.; Gaivoronskiy, A. Atomization of the Fe-Rich MnNiCoCr High-Entropy Alloy for Spherical Powder Production. Mater. Lett. 2024, 363, 136240. [Google Scholar] [CrossRef]
  5. Monti, C.; Turani, M.; Papis, K.; Bambach, M. A New Al-Cu Alloy for LPBF Developed via Ultrasonic Atomization. Mater. Des. 2023, 229, 111907. [Google Scholar] [CrossRef]
  6. Żrodowski, Ł.; Wróblewski, R.; Choma, T.; Morończyk, B.; Ostrysz, M.; Leonowicz, M.; Łacisz, W.; Błyskun, P.; Wróbel, J.S.; Cieślak, G.; et al. Novel Cold Crucible Ultrasonic Atomization Powder Production Method for 3D Printing. Materials 2021, 14, 2541. [Google Scholar] [CrossRef] [PubMed]
  7. Panahizadeh, V.; Ghasemi, A.H.; Dadgar Asl, Y.; Davoudi, M. Optimization of LB-PBF Process Parameters to Achieve Best Relative Density and Surface Roughness for Ti6Al4V Samples: Using NSGA-II Algorithm. Rapid Prototyp. J. 2022, 28, 1821–1833. [Google Scholar] [CrossRef]
  8. Bergmueller, S.; Gerhold, L.; Fuchs, L.; Kaserer, L.; Leichtfried, G. Systematic Approach to Process Parameter Optimization for Laser Powder Bed Fusion of Low-Alloy Steel Based on Melting Modes. Int. J. Adv. Manuf. Technol. 2023, 126, 4385–4398. [Google Scholar] [CrossRef]
  9. Cao, L.; Li, J.; Hu, J.; Liu, H.; Wu, Y.; Zhou, Q. Optimization of Surface Roughness and Dimensional Accuracy in LPBF Additive Manufacturing. Opt. Laser Technol. 2021, 142, 107246. [Google Scholar] [CrossRef]
  10. Ali, M.H.; Sabyrov, N.; Shehab, E. Powder Bed Fusion–Laser Melting (PBF–LM) Process: Latest Review of Materials, Process Parameter Optimization, Application, and up-to-Date Innovative Technologies. Prog. Addit. Manuf. 2022, 7, 1395–1422. [Google Scholar] [CrossRef]
  11. Salandari-Rabori, A.; Wang, P.; Dong, Q.; Fallah, V. Enhancing As-Built Microstructural Integrity and Tensile Properties in Laser Powder Bed Fusion of AlSi10Mg Alloy Using a Comprehensive Parameter Optimization Procedure. Mater. Sci. Eng. A 2021, 805, 140620. [Google Scholar] [CrossRef]
  12. Huang, K.; Kain, C.; Diaz-Vallejo, N.; Sohn, Y.; Zhou, L. High Throughput Mechanical Testing Platform and Application in Metal Additive Manufacturing and Process Optimization. J. Manuf. Process. 2021, 66, 494–505. [Google Scholar] [CrossRef]
  13. Trevisan, F.; Calignano, F.; Aversa, A.; Marchese, G.; Lombardi, M.; Biamino, S.; Ugues, D.; Manfredi, D. Additive Manufacturing of Titanium Alloys in the Biomedical Field: Processes, Properties and Applications. J. Appl. Biomater. Funct. Mater. 2017, 16, 57–67. [Google Scholar] [CrossRef] [PubMed]
  14. Froes, F.H.; Boyer, R. Additive Manufacturing for the Aerospace Industry; Elsevier: Amsterdam, The Netherlands, 2019; ISBN 0128140631. [Google Scholar]
  15. Vasco, J.C. Chapter 16—Additive Manufacturing for the Automotive Industry. In Additive Manufacturing; Pou, J., Riveiro, A., Davim, J.P., Eds.; Elsevier: Amsterdam, The Netherlands, 2021; pp. 505–530. ISBN 978-0-12-818411-0. [Google Scholar]
  16. Jia, Y.; Fu, R.; Ling, C.; Shen, Z.; Zheng, L.; Zhong, Z.; Hong, Y. Fatigue Life Prediction Based on a Deep Learning Method for Ti-6Al-4V Fabricated by Laser Powder Bed Fusion up to Very-High-Cycle Fatigue Regime. Int. J. Fatigue 2023, 172, 107645. [Google Scholar] [CrossRef]
  17. Falkowska, A.; Seweryn, A.; Skrodzki, M. Strength Properties of a Porous Titanium Alloy Ti6al4v with Diamond Structure Obtained by Laser Power Bed Fusion (Lpbf). Materials 2020, 13, 5138. [Google Scholar] [CrossRef] [PubMed]
  18. Tamayo, J.A.; Riascos, M.; Vargas, C.A.; Baena, L.M. Additive Manufacturing of Ti6Al4V Alloy via Electron Beam Melting for the Development of Implants for the Biomedical Industry. Heliyon 2021, 7, e06892. [Google Scholar] [CrossRef] [PubMed]
  19. Bruze, M.; Netterlid, E.; Siemund, I. Aluminum—Allergen of the Year 2022. Dermatitis 2022, 33, 10–15. [Google Scholar] [CrossRef] [PubMed]
  20. Domingo, J.L. Vanadium: A Review of the Reproductive and Developmental Toxicity. Reprod. Toxicol. 1996, 10, 175–182. [Google Scholar] [CrossRef] [PubMed]
  21. Kwasniak, P.; Muzyk, M.; Garbacz, H.; Kurzydlowski, K.J. Influence of Oxygen Content on the Mechanical Properties of Hexagonal Ti—First Principles Calculations. Mater. Sci. Eng. A 2014, 590, 74–79. [Google Scholar] [CrossRef]
  22. Kwasniak, P.; Garbacz, H.; Kurzydlowski, K.J. Solid Solution Strengthening of Hexagonal Titanium Alloys: Restoring Forces and Stacking Faults Calculated from First Principles. Acta Mater. 2016, 102, 304–314. [Google Scholar] [CrossRef]
  23. Firstov, S.; Kulikovsky, V.; Rogul, T.; Ctvrtlik, R. Effect of Small Concentrations of Oxygen and Nitrogen on the Structure and Mechanical Properties of Sputtered Titanium Films. Surf. Coat. Technol. 2012, 206, 3580–3585. [Google Scholar] [CrossRef]
  24. Wysocki, B.; Maj, P.; Sitek, R.; Buhagiar, J.; Kurzydłowski, K.J.K.; Świeszkowski, W.; Święszkowski, W.; Świeszkowski, W.; Święszkowski, W.; Świeszkowski, W.; et al. Laser and Electron Beam Additive Manufacturing Methods of Fabricating Titanium Bone Implants. Appl. Sci. 2017, 7, 657. [Google Scholar] [CrossRef]
  25. Wysocki, B.; Maj, P.; Krawczyńska, A.; Rożniatowski, K.; Zdunek, J.; Kurzydłowski, K.J.K.J.; Święszkowski, W. Microstructure and Mechanical Properties Investigation of CP Titanium Processed by Selective Laser Melting (SLM). J. Mater. Process. Technol. 2017, 241, 13–23. [Google Scholar] [CrossRef]
  26. Weng, W.; Biesiekierski, A.; Li, Y.; Wen, C. Effects of Selected Metallic and Interstitial Elements on the Microstructure and Mechanical Properties of Beta Titanium Alloys for Orthopedic Applications. Matereials 2019, 6, 100323. [Google Scholar] [CrossRef]
  27. Gibson, I.; Rosen, D.; Stucker, B.; Khorasani, M. Design for Additive Manufacturing. Addit. Manuf. Technol. 2021, 555–607. [Google Scholar] [CrossRef] [PubMed]
  28. Wysocki, B.; Buhagiar, J.; Durejko, T. Design and Post Processing for Metal Additive Manufacturing; MDPI: Basel, Switzerland, 2024. [Google Scholar]
  29. Chmielewska, A.; Wysocki, B.; Buhagiar, J.; Michalski, B.; Adamczyk-Cieślak, B.; Gloc, M.; Święszkowski, W. In Situ Alloying of NiTi: Influence of Laser Powder Bed Fusion (LBPF) Scanning Strategy on Chemical Composition. Mater. Today Commun. 2022, 30, 103007. [Google Scholar] [CrossRef]
  30. Aboulkhair, N.T.; Everitt, N.M.; Ashcroft, I.; Tuck, C. Reducing Porosity in AlSi10Mg Parts Processed by Selective Laser Melting. Addit. Manuf. 2014, 1–4, 77–86. [Google Scholar] [CrossRef]
  31. Tolochko, N.K.; Mozzharov, S.E.; Yadroitsev, I.A.; Laoui, T.; Froyen, L.; Titov, V.I.; Ignatiev, M.B. Balling Processes during Selective Laser Treatment of Powders. Rapid Prototyp. J. 2004, 10, 78–87. [Google Scholar] [CrossRef]
  32. Chmielewska, A.; Wysocki, B.A.; Gadalińska, E.; MacDonald, E.; Adamczyk-Cieślak, B.; Dean, D.; Świeszkowski, W. Laser Powder Bed Fusion (LPBF) of NiTi Alloy Using Elemental Powders: The Influence of Remelting on Printability and Microstructure. Rapid Prototyp. J. 2022, 28, 1845–1868. [Google Scholar] [CrossRef]
  33. Jia, H.; Sun, H.; Wang, H.; Wu, Y.; Wang, H. Scanning Strategy in Selective Laser Melting (SLM): A Review. Int. J. Adv. Manuf. Technol. 2021, 113, 2413–2435. [Google Scholar] [CrossRef]
  34. Nemat-Nasser, S.; Guo, W.G.; Cheng, J.Y. Mechanical Properties and Deformation Mechanisms of a Commercially Pure Titanium. Acta Mater. 1999, 47, 3705–3720. [Google Scholar] [CrossRef]
  35. ASTM F67—13(2017); Standard Specification for Unalloyed Titanium, for Surgical Implant Applications (UNS R50250, UNS R50400, UNS R50550, UNS R50700). ASTM International: West Conshohocken, PA, USA, 2017.
  36. ASTM F136—13; Standard Specification for Wrought Titanium-6Aluminum-4Vanadium ELI (Extra Low Interstitial) Alloy for Surgical Implant Applications (UNS R56401). ASTM International: West Conshohocken, PA, USA, 2013.
  37. Song, B.; Dong, S.; Zhang, B.; Liao, H.; Coddet, C. Effects of Processing Parameters on Microstructure and Mechanical Property of Selective Laser Melted Ti6Al4V. Mater. Des. 2012, 35, 120–125. [Google Scholar] [CrossRef]
  38. Sing, S.L.; Wiria, F.E.; Yeong, W.Y. Selective Laser Melting of Titanium Alloy with 50 wt% Tantalum: Effect of Laser Process Parameters on Part Quality. Int. J. Refract. Met. Hard Mater. 2018, 77, 120–127. [Google Scholar] [CrossRef]
  39. Shipley, H.; McDonnell, D.; Culleton, M.; Coull, R.; Lupoi, R.; O’Donnell, G.; Trimble, D. Optimisation of Process Parameters to Address Fundamental Challenges during Selective Laser Melting of Ti-6Al-4V: A Review. Int. J. Mach. Tools Manuf. 2018, 128, 1–20. [Google Scholar] [CrossRef]
  40. Ahmadi, S.M.; Hedayati, R.; Ashok Kumar Jain, R.K.; Li, Y.; Leeflang, S.; Zadpoor, A.A. Effects of Laser Processing Parameters on the Mechanical Properties, Topology, and Microstructure of Additively Manufactured Porous Metallic Biomaterials: A Vector-Based Approach. Mater. Des. 2017, 134, 234–243. [Google Scholar] [CrossRef]
  41. Bartolomeu, F.; Gasik, M.; Silva, F.S.; Miranda, G. Mechanical Properties of Ti6Al4V Fabricated by Laser Powder Bed Fusion: A Review Focused on the Processing and Microstructural Parameters Influence on the Final Properties. Meterials 2022, 12, 986. [Google Scholar] [CrossRef]
  42. Hasib, M.T.; Ostergaard, H.E.; Liu, Q.; Li, X.; Kruzic, J.J. Tensile and Fatigue Crack Growth Behavior of Commercially Pure Titanium Produced by Laser Powder Bed Fusion Additive Manufacturing. Addit. Manuf. 2021, 45, 102027. [Google Scholar] [CrossRef]
  43. Yu, Q.; Qi, L.; Tsuru, T.; Traylor, R.; Rugg, D.; Morris, J.W.; Asta, M.; Chrzan, D.C.; Minor, A.M. Origin of Dramatic Oxygen Solute Strengthening Effect in Titanium. Science 2015, 347, 635–639. [Google Scholar] [CrossRef] [PubMed]
  44. Ghazisaeidi, M.; Trinkle, D.R. Interaction of Oxygen Interstitials with Lattice Faults in Ti. Acta Mater. 2014, 76, 82–86. [Google Scholar] [CrossRef]
  45. Joost, W.J.; Ankem, S.; Kuklja, M.M. Interaction between Oxygen Interstitials and Deformation Twins in Alpha-Titanium. Acta Mater. 2016, 105, 44–51. [Google Scholar] [CrossRef]
  46. Singh, N.; Hameed, P.; Ummethala, R.; Manivasagam, G.; Prashanth, K.G.; Eckert, J. Selective Laser Manufacturing of Ti-Based Alloys and Composites: Impact of Process Parameters, Application Trends, and Future Prospects. Mater. Today Adv. 2020, 8, 100097. [Google Scholar] [CrossRef]
  47. Żrodowski, Ł.; Wysocki, B.; Wróblewski, R.; Krawczyńska, A.; Adamczyk-Cieślak, B.; Zdunek, J.; Błyskun, P.; Ferenc, J.; Leonowicz, M.; Święszkowski, W. New Approach to Amorphization of Alloys with Low Glass Forming Ability via Selective Laser Melting. J. Alloys Compd. 2019, 771, 769–776. [Google Scholar] [CrossRef]
  48. Lindwall, G.; Wang, P.; Kattner, U.R.; Campbell, C.E. The Effect of Oxygen on Phase Equilibria in the Ti-V System: Impacts on the AM Processing of Ti Alloys. JOM 2018, 70, 1692–1705. [Google Scholar] [CrossRef] [PubMed]
  49. Majchrowicz, K.; Chmielewska, A.; Wysocki, B.; Przybysz-Gloc, S.; Kulczyk, M.; Garbacz, H.; Pakieła, Z. The Effect of Microstructural Defects on High-Cycle Fatigue of Ti Grade 2 Manufactured by PBF-LB and Hydrostatic Extrusion. Crystals 2023, 13, 1250. [Google Scholar] [CrossRef]
  50. Wysocki, B.; Idaszek, J.; Buhagiar, J.; Szlązak, K.; Brynk, T.; Kurzydłowski, K.J.; Święszkowski, W. The Influence of Chemical Polishing of Titanium Scaffolds on Their Mechanical Strength and In-Vitro Cell Response. Mater. Sci. Eng. C 2018, 95, 428–439. [Google Scholar] [CrossRef] [PubMed]
  51. Chmielewska, A.; Wysocki, B.; Żrodowski, Ł.; Święszkowski, W. Hybrid Solid-Porous Titanium Scaffolds. Trans. Addit. Manuf. Meets Med. 2019, 1, 2–3. [Google Scholar] [CrossRef]
  52. Cwieka, K.; Wysocki, B.; Skibinski, J.; Chmielewska, A.; Swieszkowski, W. Numerical Design of Open-Porous Titanium Scaffolds for Powder Bed Fusion Using Laser Beam (PBF-LB). J. Mech. Behav. Biomed. Mater. 2024, 151, 106359. [Google Scholar] [CrossRef]
Figure 1. Scheme of the PBF-LB manufactured samples, laser beam scanning strategies and placement of micro tensile sample cuts. Cubic sample (5 × 5 × 5 mm) used for parameters optimization using bidirectional (zigzag) laser beam scanning strategy (A); Orientations and laser beam scanning strategies for Set I samples (B). In Set I, all samples with cross sections bigger than 5 × 5 mm were fabricated using the checkerboard (“island”) scanning strategy. Different scanning strategies: II.1. Checkerboard (“island”), II.2. Bidirectional (zigzag) and II.3. Bidirectional (zigzag) + Random Points used for Set II samples (C). The laser vector rotation of 45° for each subsequent layer was applied for all fabricated samples within this study.
Crystals 14 00574 g001
Figure 2. Miniature specimens for tensile testing cut from samples Set 1 and Set 2 (A); high-fatigue specimens (HCF) cut from samples Set 3 (B).
Crystals 14 00574 g002
Figure 3. Samples fabricated in the PBF-LB process: different sizes and orientations (A), different scanning strategies (B), and rods for high-cycle fatigue (HCF) mechanical tests (C).
Crystals 14 00574 g003
Figure 4. Microtomography reconstruction of Ti grade 2 rods machined from PBF-LB fabricated sample (A), and conventionally manufactured rod (B).
Crystals 14 00574 g004
Figure 5. Microstructure of etched Ti grade 2 conventionally fabricated rod (A) and PBF-LB machined rod (B). Magnification ×100 (top) and ×500 (bottom).
Crystals 14 00574 g005
Figure 6. Mechanical properties of Set I samples fabricated with the PBF-LB process: ultimate tensile strength (A), yield strength (B) and elongation at break (C).
Crystals 14 00574 g006
Figure 7. Mechanical properties of Set II samples (20 × 20 × 20 mm) fabricated in the PBF-LB process as a function of the sample height (from bottom to top) for different printing strategies: checkerboard (A), bidirectional (zigzag) (B), and bidirectional (zigzag) + random points (C). The dotted line depicts the linear trendline of the UTS and YS results.
Crystals 14 00574 g007
Figure 8. Stress amplitude (σa) versus cycles to failure (Nf) (A) and fracture (B) for conventionally fabricated Ti grade 2 rod. Red arrows indicate samples that have reached the fatigue limit (Nf = 5 million cycles) without failure.
Crystals 14 00574 g008
Figure 9. Stress amplitude (σa) versus cycles to failure (Nf) (A) and fracture (B) for PBF-LB Ti grade 2 rod after machining. Red arrows indicate samples that have reached the fatigue limit (Nf = 5 million cycles) without failure.
Crystals 14 00574 g009
Table 1. Types of samples fabricated within the study.
Set I. Different Orientations to the Building Platform and Different Cuboid Sizes (X Y Z)Set II. Different Laser Scanning Strategies within One Large Cuboid Size (20 × 20 × 20 mm)Set III. Samples for High-Cycle Fatigue (HCF) Tests
I.1. Small perpendicular (5 × 5 × 13 mm)II.1. Checkerboard (each square 5 × 5 mm)III.1. PBF-LB rod (φ = 6 mm, length = 65 mm)
I.2. Medium perpendicular * (10 × 10 × 13 mm)II.2. Bidirectional (zigzag)III. 2. Conventionally fabricated reference rod (φ = 5 mm, length = 65 mm)
I.3. Small parallel (5 × 13 × 2 mm)II.3. Bidirectional (zigzag) + random points
I.4. Medium parallel * (10 × 13 × 10 mm)
I.5. Small inclined 45° (5 × 13 × 2 mm)
* I.2. “perpendicular” and I.4. “parallel” comes from the orientation of the micro samples cut from these blocks (see Figure 1).
Table 2. Archimedes’ theoretical densities of fabricated samples and reference Ti grade 2 rod.
Set I. Different orientations to the building platform and different cubical sizes (X Y Z mm)
I.1. Small perpendicular (5 × 5 × 13 mm)I.2. Medium perpendicular (10 × 10 × 13 mm)I.3. Small parallel (5 × 13 × 2 mm)I.4. Medium parallel (10 × 13 × 10 mm)I.5. Small inclined 45° (5 × 13 × 2 mm)
98.9 ± 0.499.4 ± 0.298.6 ± 0.699.5 ± 0.198.6 ± 0.9
Set II. Different laser scanning strategies within one large cuboid size (20 × 20 × 20 mm)
II.1. Checkerboard
(each square 5 × 5 mm)
II.2. Bidirectional (zigzag)II.3. Bidirectional (zigzag) + random points
98.1 ± 0.596.9 ± 0.896.1 ± 0.9
Set III. Samples for High-Cycle Fatigue (HCF) tests
III.1. PBF-LB rod *
(φ = 6 mm, length = 65 mm)
III.2. Conventionally fabricated reference rod
(φ = 5 mm, length = 65 mm)
98.5 ± 0.799.5 ± 0.4
* The theoretical density of the PBF-LB rod was measured before machining.
Table 3. Light elements content in fabricated samples, reference rod, fresh and used powders.
Set I. Different orientations to the building platform and different cuboid sizes
Oxygen [wt. %]Nitrogen [wt. %]Hydrogen [wt. %]
0.23 ± 0.020.07 ± 0.020.008 ± 0.001
Set II. Different laser scanning strategies within one large cuboid size (20 × 20 × 20 mm)
Oxygen [wt. %]Nitrogen [wt. %]Hydrogen [wt. %]
0.82 ± 0.050.05 ± 0.030.02 ± 0.002
Set III. Samples for High-Cycle Fatigue (HCF) tests
III.1. PBF-LB rod (φ = 6 mm, length = 65 mm)
Oxygen [wt. %]Nitrogen [wt. %]Hydrogen [wt. %]
0.20 ± 0.0140.05 ± 0.020.006 ± 0.001
III.2. Conventionally fabricated reference rod (φ = 5 mm, length = 65 mm)
Oxygen [wt. %]Nitrogen [wt. %]Hydrogen [wt. %]
0.07 ± 0.0140.012 ± 0.0040.003 ± 0.001
Titanium powders used within study
1. Fresh Ti grade 2 powder
Oxygen [wt. %]Nitrogen [wt. %]Hydrogen [wt. %]
0.13 ± 0.0170.013 ± 0.0050.005 ± 0.001
2. Used Ti grade 2 powder (1 process)
Oxygen [wt. %]Nitrogen [wt. %]Hydrogen [wt. %]
0.17 ± 0.0140.015 ± 0.0040.006 ± 0.002
Table 4. Mechanical properties of Set I samples fabricated with the PBF-LB process.
SampleSizeOrientationUTS [MPa]YS [MPa]A [%]
I.1.Smallperpendicular739 ± 48585 ± 5728% ± 8
I.2.Mediumperpendicular752 ± 14626 ± 4827% ± 8
I.3.Smallparallel674 ± 83531 ± 7623% ± 8
I.4.Mediumparallel683 ± 28497 ± 4928% ± 5
I.5.Smallinclined713 ± 52625 ± 6824% ± 6
Table 5. Mechanical properties of Set II samples fabricated in the PBF-LB process using different laser scanning strategies.
II.1. Checkerboard
(Each Square 5 × 5 mm)
II.2. Bidirectional (Zigzag)II.3. Bidirectional (Zigzag) + Random Points
HeightUTS [MPa]YS [MPa]UTS [MPa]YS [MPa]UTS [MPa]YS [MPa]
Top456 ± 102417 ± 136406 ± 52347 ± 36501 ± 16440 ± 12
Middle571 ± 8542 ± 25399 ± 15334 ± 10496 ± 61432 ± 44
Bottom612 ± 16536 ± 25472 ± 55423 ± 41505 ± 52437 ± 41
Disclaimer/Publisher’s Note: The statements, opinions and data contained in all publications are solely those of the individual author(s) and contributor(s) and not of MDPI and/or the editor(s). MDPI and/or the editor(s) disclaim responsibility for any injury to people or property resulting from any ideas, methods, instructions or products referred to in the content.

