Article

Photophysical Properties, Stability and Microstructures of Temperature-Dependent Evolution of Methylammonium Lead Bromide Perovskite

1
National Center for Materials Service Safety, University of Science and Technology, Beijing 100083, China
2
Institute of Microstructure and Property of Advanced Materials, College of Materials Science and Engineering, Beijing University of Technology, Beijing 100124, China
*
Authors to whom correspondence should be addressed.
Crystals 2024, 14(7), 589; https://doi.org/10.3390/cryst14070589
Submission received: 2 April 2024 / Revised: 15 June 2024 / Accepted: 21 June 2024 / Published: 27 June 2024
(This article belongs to the Special Issue Advances in Halide Perovskites)

Abstract

:
Organic/inorganic hybrid perovskite materials, such as CH3NH3PbX3 (X = I, Br), have attracted the attention of the scientific community due to their excellent properties such as a widely tunable bandgap, high optical absorption coefficient, excellent power conversion efficiency, etc. The exposure of perovskite solar cells and photovoltaic devices to heat can significantly degrade their performance. Therefore, elucidating their temperature-dependent optical properties is essential for performance optimization of perovskite solar cells. We synthesized CH3NH3PbBr3 (MAPbBr3) single crystals through the polymer-controlled nucleation route and investigated the optical properties and molecular structure evolution of them with temperature. Through temperature evolution photoluminescence (PL) spectroscopy, we found that the fluorescence intensity was greatly affected by increasing the temperature, with an asymmetric PL profile suggesting that more captured excitons undergo radiative complexation. The optical photographs showed that the color of MAPbBr3 single crystals faded. Raman spectroscopy revealed that during the heating process, the structure of MAPbBr3 was still preserved at 90 °C since all of the Raman bands were very clear. When the temperature increased to 120 °C, the Raman bands of the internal modes became very weak. On further heating, the inorganic framework on sample’s surface started to disintegrate above 210 °C. During the heating process, the PL spectra exhibited significant changes in spectral intensity, peak position and Full Width Half Maximum (FWHM). The PL spectral intensity decreased abruptly with increasing temperature. The peak position was blue shifted with increasing temperature, and the peak shape showed an obvious asymmetry. The FMWH of the PL spectra was gradually broadened with the increase in the temperature, and there was a sharp increase from 270 °C to 300 °C. These variations in the PL spectra with temperature indicate that the optical properties of MAPbBr3 are greatly affected by temperature, which in turn affects the application of MAPbBr3 in fields such as optical devices. These results may be instructive for the application of MAPbBr3.

1. Introduction

Organic/inorganic hybrid perovskite materials, such as CH3NH3PbX3 (X = I, Br), have attracted the attention of the scientific community due to their excellent properties such as a widely tunable bandgap, high optical absorption coefficient excellent power conversion efficiency [1,2,3]. Organic/inorganic hybrid perovskite materials have been widely applied in solar cells, light emitting diode and catalysts. CH3NH3PbX3 (X = I, Br) has a typical crystal structure with a CH3NH3+ cation located at the center in a cube octahedron with a coordination number of 12 formed by corner-shared PbX6 octahedra [4,5,6,7]. Since Miyasaka and his colleagues reported the first perovskite solar cells with a power conversion efficiency of 3.8% [8], the power conversion efficiency has been improved to a certified 23.7% with great efforts being made by the scientific community over several decades [9]. The power conversion efficiency of perovskite solar cells has been growing consistently since official certification [10,11], suggesting that it may only be a matter of time before it beats the world’s best conventional crystalline silicon cells (26.8%, silicon heterostructure) with the efforts of the scientific community. Despite their excellent photovoltaic properties, organic/inorganic hybrid perovskite materials suffer from an impaired performance due to thermal sensitivity [12,13], hygroscopic decomposition [14], ready oxidation and photo-degradation [15,16].
The exposure of perovskite solar cells and photovoltaic devices to heat can significantly degrade their performance. Therefore, elucidating their temperature-dependent optical properties is essential for optimizing the performance of perovskite solar cells. In conventional semiconductors, the charge carrier lifetime decreases with increasing temperature. Most studies have focused on the phase transition that occurs in organic/inorganic hybrid perovskite materials’ crystal structures from a low to room temperature, and many research groups have identified phase transitions in different organic/inorganic hybrid perovskite materials and found differences in the properties of the different phases [17]. Furukawa’s group investigated the Raman bands in the temperature ranges of 16.85 °C to −173.15 °C for CH3NH3PbBr3 and 66.85 °C to −163.15 °C for CH3NH3PbI3 [17]. Raman bands were assigned to the various vibration modes of MA–cage vibration and some bands associated with the NH3 group and confirmed that a phase transition occurred [18] CH3NH3PbX3 (X = I, Br) has a typical crystal structure with an inorganic octahedral framework of PbX6 that encloses an organic CH3NH3+ cation at the center of a cube octahedron formed by corner sharing [4,5,6,19]. Park et al. measured the optical properties [6], including optical reflectance spectra and PL spectra, of single-crystal CH3NH3PbBr3 and CH3NH3PbI3 in the temperature range from −173.15 °C to 26.85 °C and observed two phase transitions at −128.15 °C and −33.15 °C for single-crystal CH3NH3PbBr3, one phase transition at −143.15 °C to −123.15 °C for single-crystal CH3NH3PbI3. Liang et al. synthesized very crystalline MAPbI3 perovskite films via vacuum-assisted thermal treatment and spotted an obvious temperature-dependent phase transition and an increase in PL intensity in the temperature range from −263.15 °C to 76.85 °C [7]. Lidzey’s group explored (FAPbI3)0.85(MAPbBr3)0.15 in the temperature range between −269.15 °C and 76.85 °C. The optical and structural properties of (FAPbI3)0.85(MAPbBr3)0.15 suggested that (FAPbI3)0.85(MAPbBr3)0.15 revealed a pseudo cubic perovskite α phase at room temperature, with a transition to a pseudo tetragonal β phase occurring at around −13.15 °C [20]. Bermu’dez-Garcı´a et al. synthesized a new [TPrA]Cd[dca]3 cadmium–dicyanamide perovskite and reported its orthorhombic to tetragonal first-order phase transition at a transition temperature of 111.85 °C [21]. Li et al. induced a high-pressure and high-temperature environment to treat MAPbBr3 perovskites [22]. They found that a monoclinic P2/m structure with layered edge-shared Pb–Br via multiple-stage transformation of the traditional corner-shared three-dimensional perovskites at 8.7 GPa, 380.9 °C conditions.
Here, we reported the variation of optical properties of MAPbBr3 (MA = CH3NH3+) from ambient-temperature to high-temperature conditions. Firstly, single crystals of MAPbBr3 were synthesized by the polymer-controlled nucleation route. The crystal structure of MAPbBr3 single crystals was confirmed by X-ray diffraction. Subsequently, we examined the variation in the optical properties of cubic MAPbBr3 single crystals with in situ high-temperature PL spectroscopy. In order to analyze the molecular structure changes of MAPbBr3 single crystals during the heating process, we further investigated the microscopic molecular structure changes in MAPbBr3 using in situ high-temperature Raman spectroscopy.

2. Materials and Methods

2.1. Materials

All chemical reagents were of analytical grade and used as purchased, including lead (II) acetate trihydrate (Pb(Ac)2·3H2O, ≥99.5%, Fuchen chemical reagent, Tianjin, China), hydrobromic acid (40 wt% in water, Damao chemical reagent, Tianjin, China), methylamine (CH3NH2, 40 wt% in water, Fuchen chemical reagent, Tianjin, China), N, N-dimethylformamide (DMF, ≥99.9%, Aladdin, Shanghai, China) and Polypropylene glycol (PPG, Aladdin, Shanghai, China) with different molecular weights of 3000 Da.

2.2. The Growth of MAPbBr3 Single Crystals

The high-quality MAPbBr3 single crystals were synthesized by the polymer-controlled nucleation route [23]. First, the MAPbBr3 powders were prepared by reacting methylamine (CH3NH2, MA) (40 wt% in water), lead (II) acetate trihydrate (Pb(Ac)2·3H2O) and hydrobromic acid in a molar ratio of 1.1:1:6. A slight surplus of MA·xH2O was applied to avoid the production of lead (II) bromide. The Pb(Ac)2·3H2O was dissolved in hydrobromic acid (40 wt% in water) under stirring to obtain a clear solution in a flask at 80 °C. Next, methylamine was added to the clear solution. Then, an orange precipitate of MAPbBr3 was produced in the bottom after 1–2 h of stirring and heating at 80 °C. The MAPbBr3 powders were collected using the Büchner funnel filtration, washed with the anhydrous ethanol three times to remove residual reactants and subsequently dried at 80 °C for 24 h. Second, the obtained MAPbBr3 powders were dissolved in N, N-dimethylformamide (DMF) for 0.6 g/mL. The MAPbBr3 powder and DMF mixture were stirred for 3–4 h until MAPbBr3 powders completely dissolved in DMF. A certain amount (0.01 g/mL) of polypropylene glycol (PPG) was added. The precursor solution was filtered using a polytetrafluoroethylene filter with a 0.2 µm pore size (Whatman) and then placed on a hot plate at 62 °C for crystallization. Prepared MAPbBr3 single crystals were collected in hermetic container with self-indicating silica gel to diminish the impact of air and moisture.

2.3. In Situ High-Temperature Tests

MAPbBr3 single crystals with 3 mm size were put into alumina ceramic crucibles with 5 mm diameter and 25 μL volume to perform in situ high-temperature tests. Alumina ceramic crucibles with MAPbBr3 were used in the heating stage (Linkam, TS1500, Salfords, UK) with a temperature range from ambient to 300 °C. Raman spectroscopy and photoluminescence (PL) spectroscopy measurements were performed after every 30 °C increase from room temperature to 300 °C and we then waited until the entire heating stage was complete and the sample temperature had stabilized.

2.4. Raman Spectroscopy

Silicon wafer was utilized as a standard to calibrate Raman spectroscopy before measurements. In order to avoid the effect of fluorescence of the MAPbBr3 single crystals, 633 nm excitation laser (He-Ne laser) was incident from directly above the heating stage through a 50× long-working-distance objective lens for in situ high-temperature tests. Laser power of 10 mW and integration time for 3 s was applied to all Raman measurements in the temperature range from RT to 300 °C. No obvious change was observed in laser treated MAPbBr3 crystal optical images and Raman spectra of MAPbBr3 crystal remained unchanged, so we regarded 10 mW 633 nm laser treating for 3 s MAPbBr3 crystal was safe for MAPbBr3 crystal in heating stage with a transparent insulated window. We kept measuring the same spot for all in situ high-temperature tests. All Raman spectra at different temperatures were collected after the heating stage reached the specified temperature and distributed with commercial Raman spectroscopy (WITech, R300, Ulm, Germany).

2.5. X-ray Diffraction (XRD)

The crystal structure of MAPbBr3 was measured by X-ray diffraction (XRD) (Rigaku, smartlab, Tokyo, Japan). Since the pieces of MAPbBr3 single crystal samples were smaller than 2 mm, micro XRD were applied. Single-crystal MAPbBr3 samples were put onto a clean glass slide with playdough cover the sample. We then pressed the single-crystal MAPbBr3 samples into playdough to form a flat surface with single-crystal MAPbBr3 samples embedded into it. Then, we carefully removed glass slide and loaded the single-crystal MAPbBr3 samples embedded onto a playdough flat surface onto the XRD sample holder to investigate the crystallinity. We measured the room-temperature XRD profiles of MAPbBr3 after 5 min of incubation at various temperatures including ambient temperature, 120 °C, 150 °C, 180 °C, 210 °C, 240 °C, 270 °C, 300 °C and 350 °C. XRD measurement profile were collected on a Rigaku smart lab XRD instrument equipped with a Cu Kα X-ray tube operated at 45 kV and 200 mA using a step size of 0.01° 2θ from 10–70°. The XRD patterns of MAPbBr3 samples were labeled using Jade 6 software and were assigned following reports in the literatures.

2.6. Photoluminescence Spectroscopy
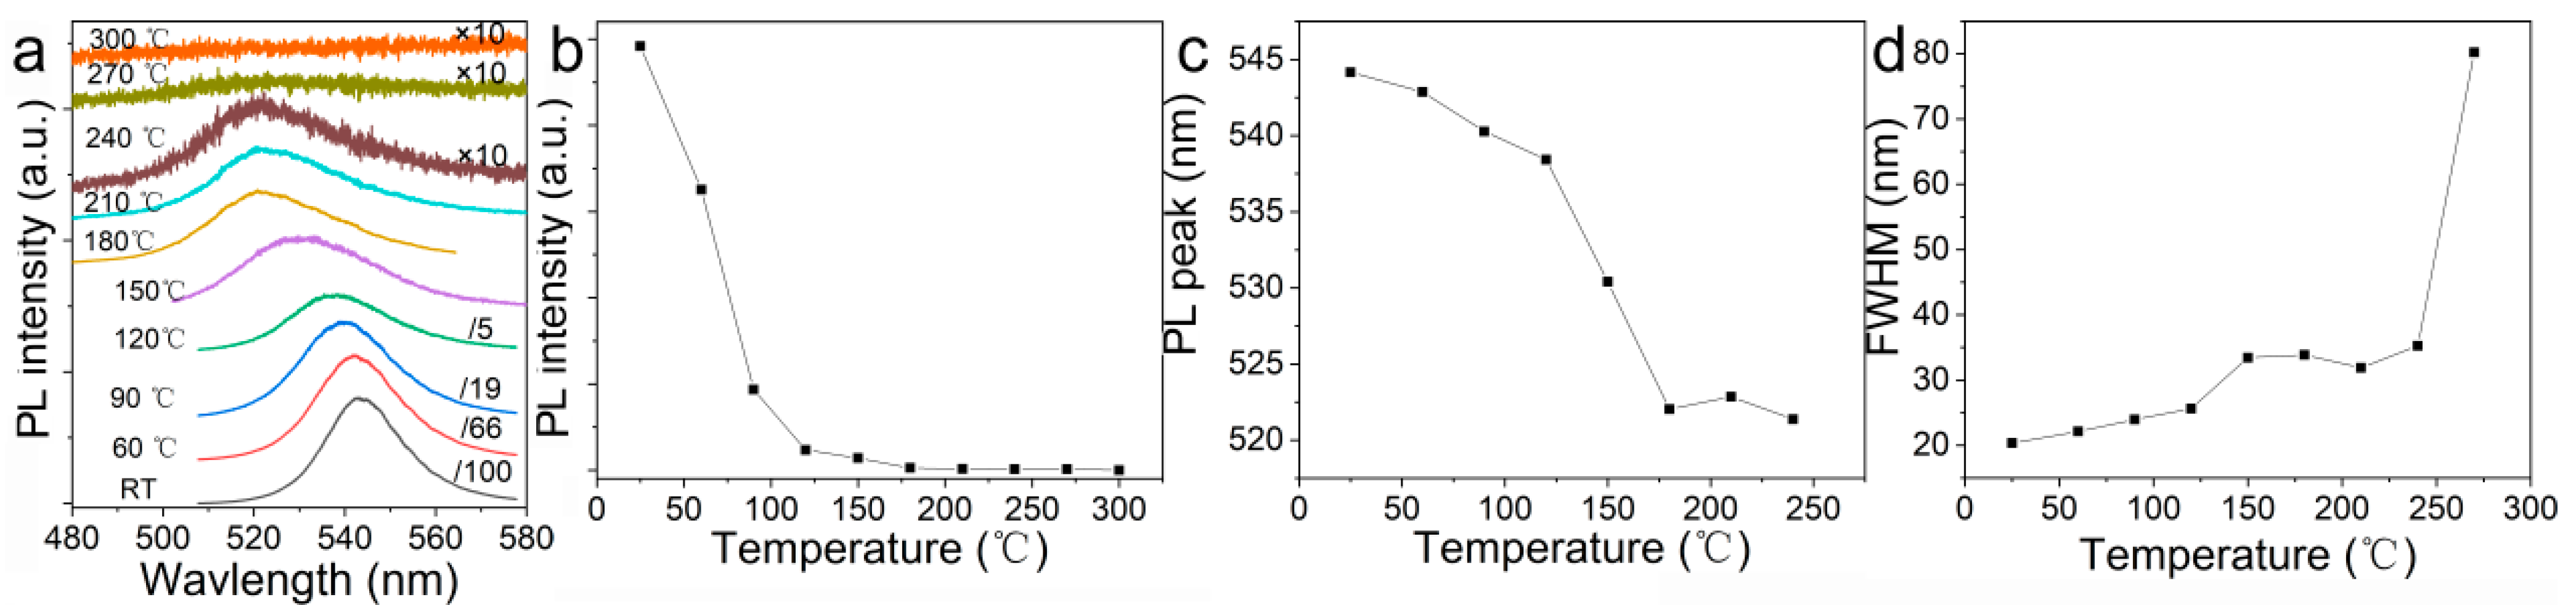
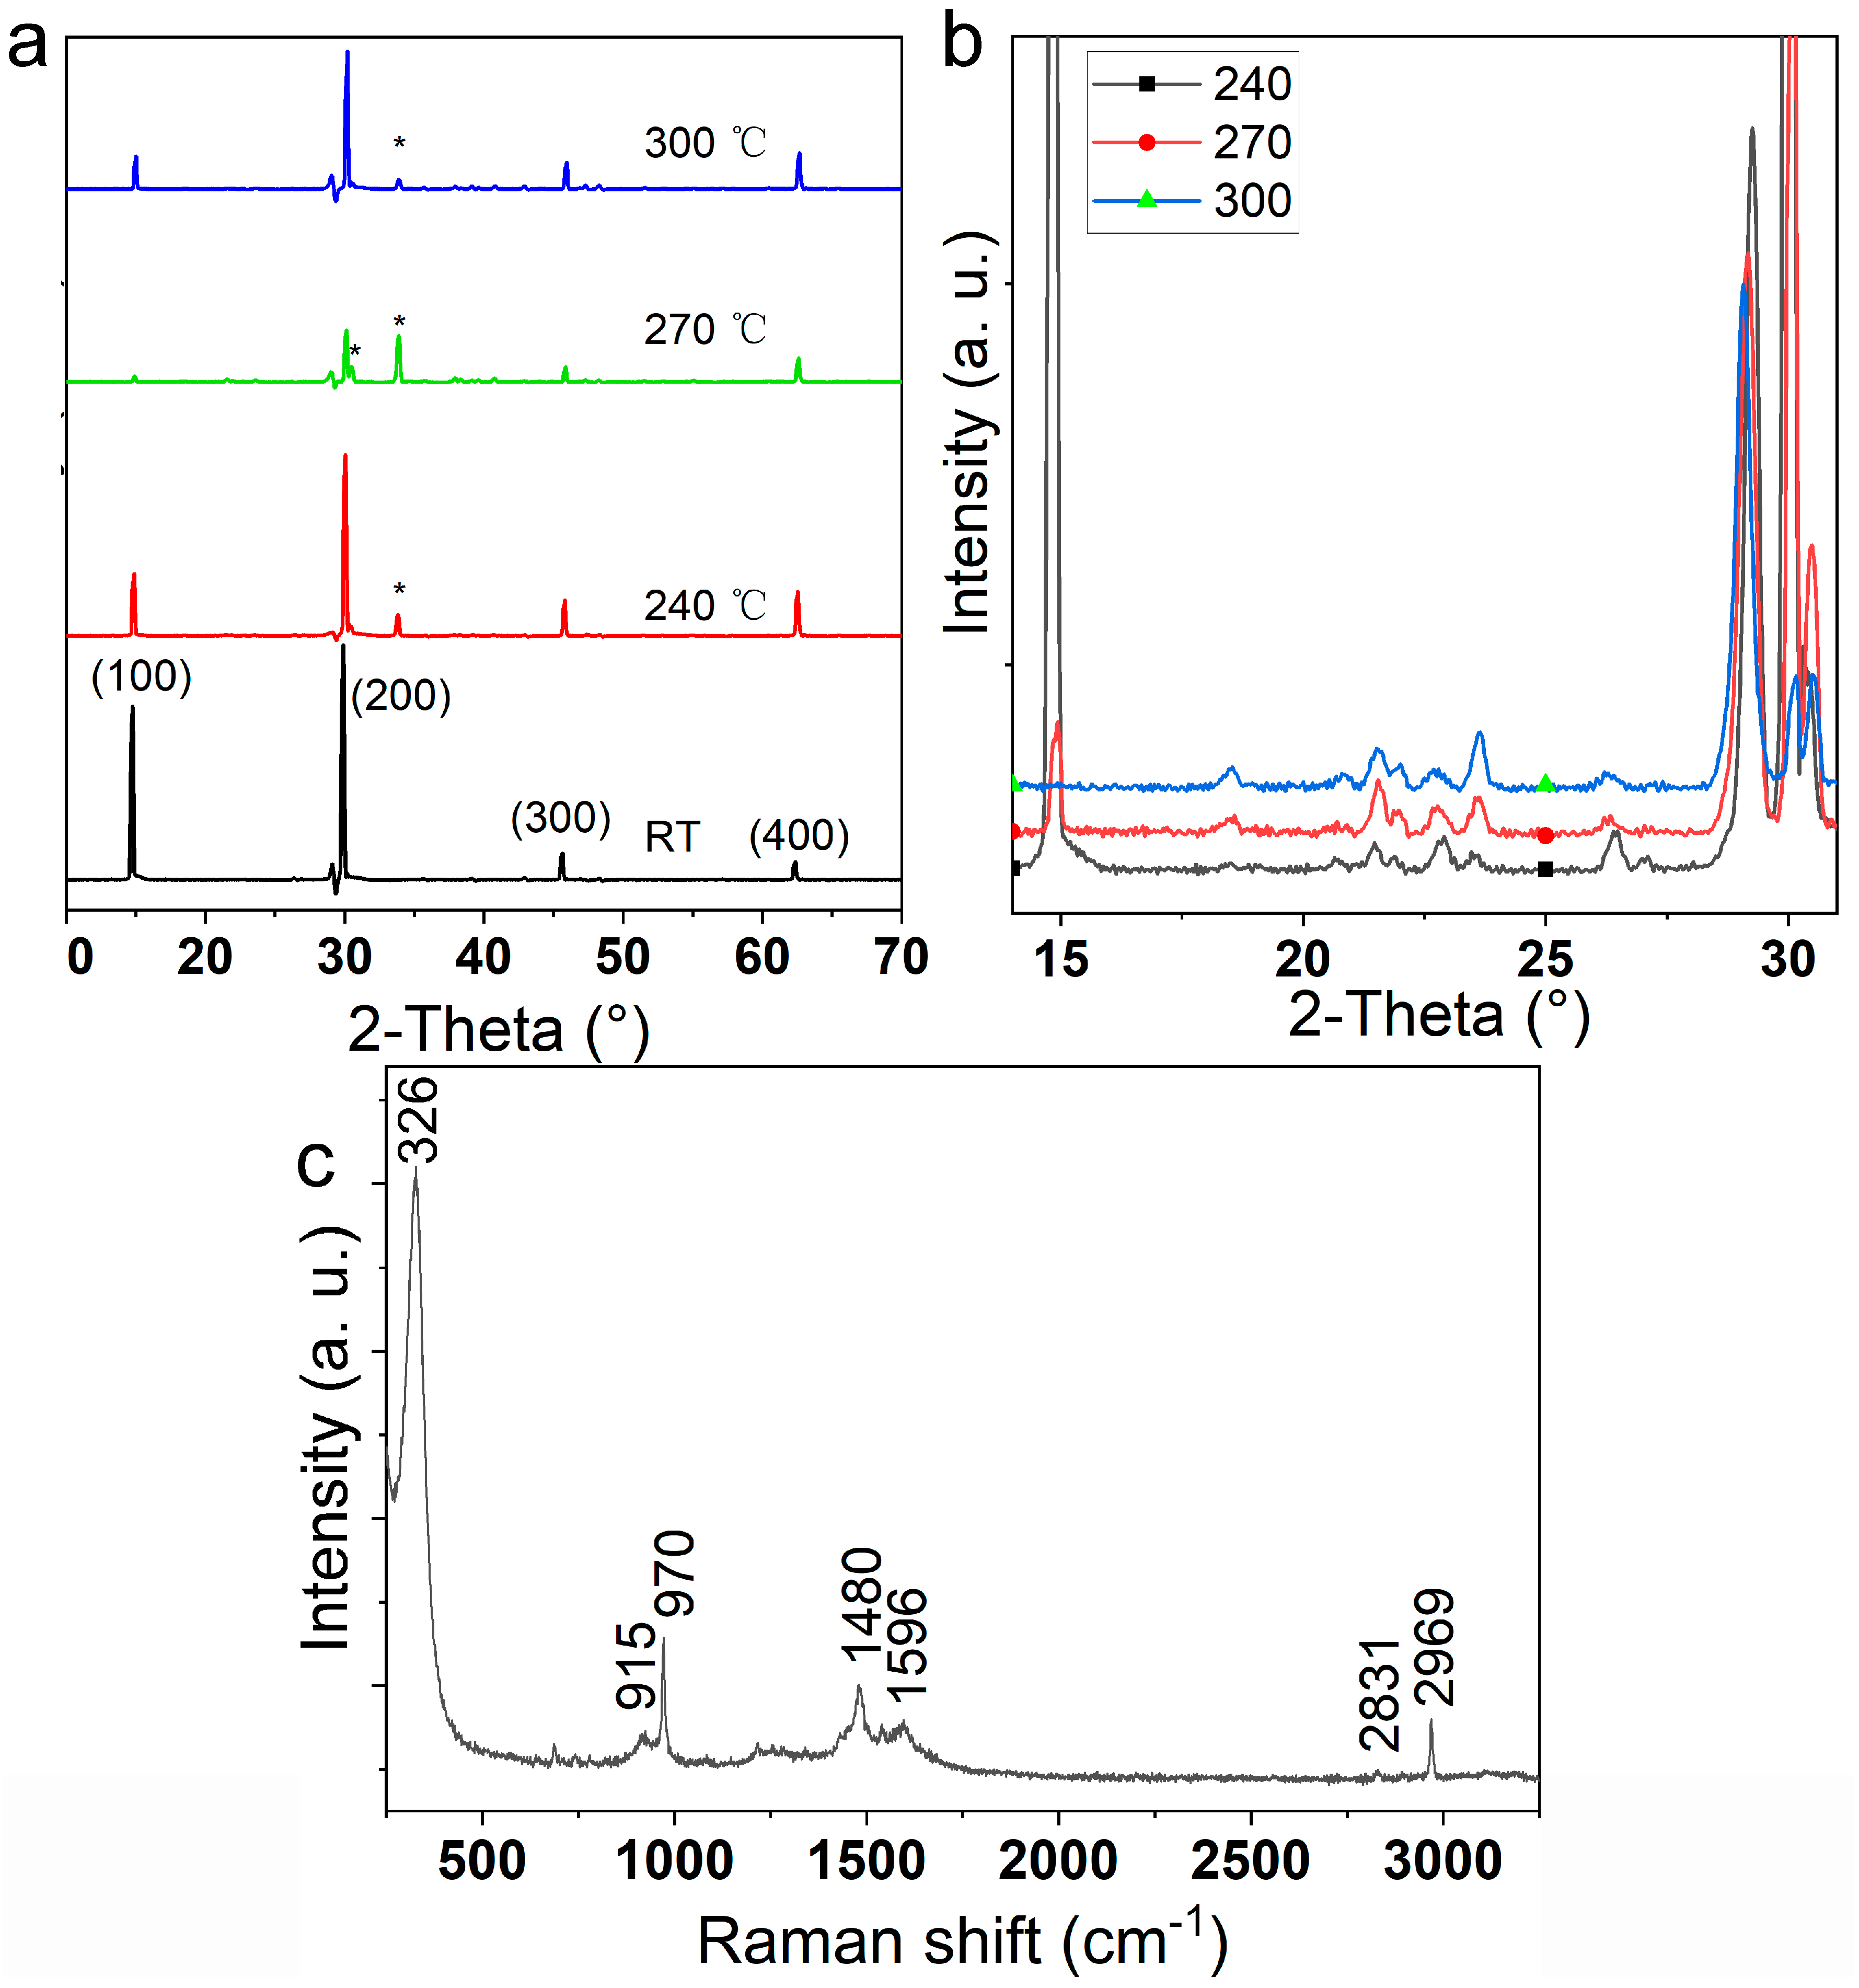
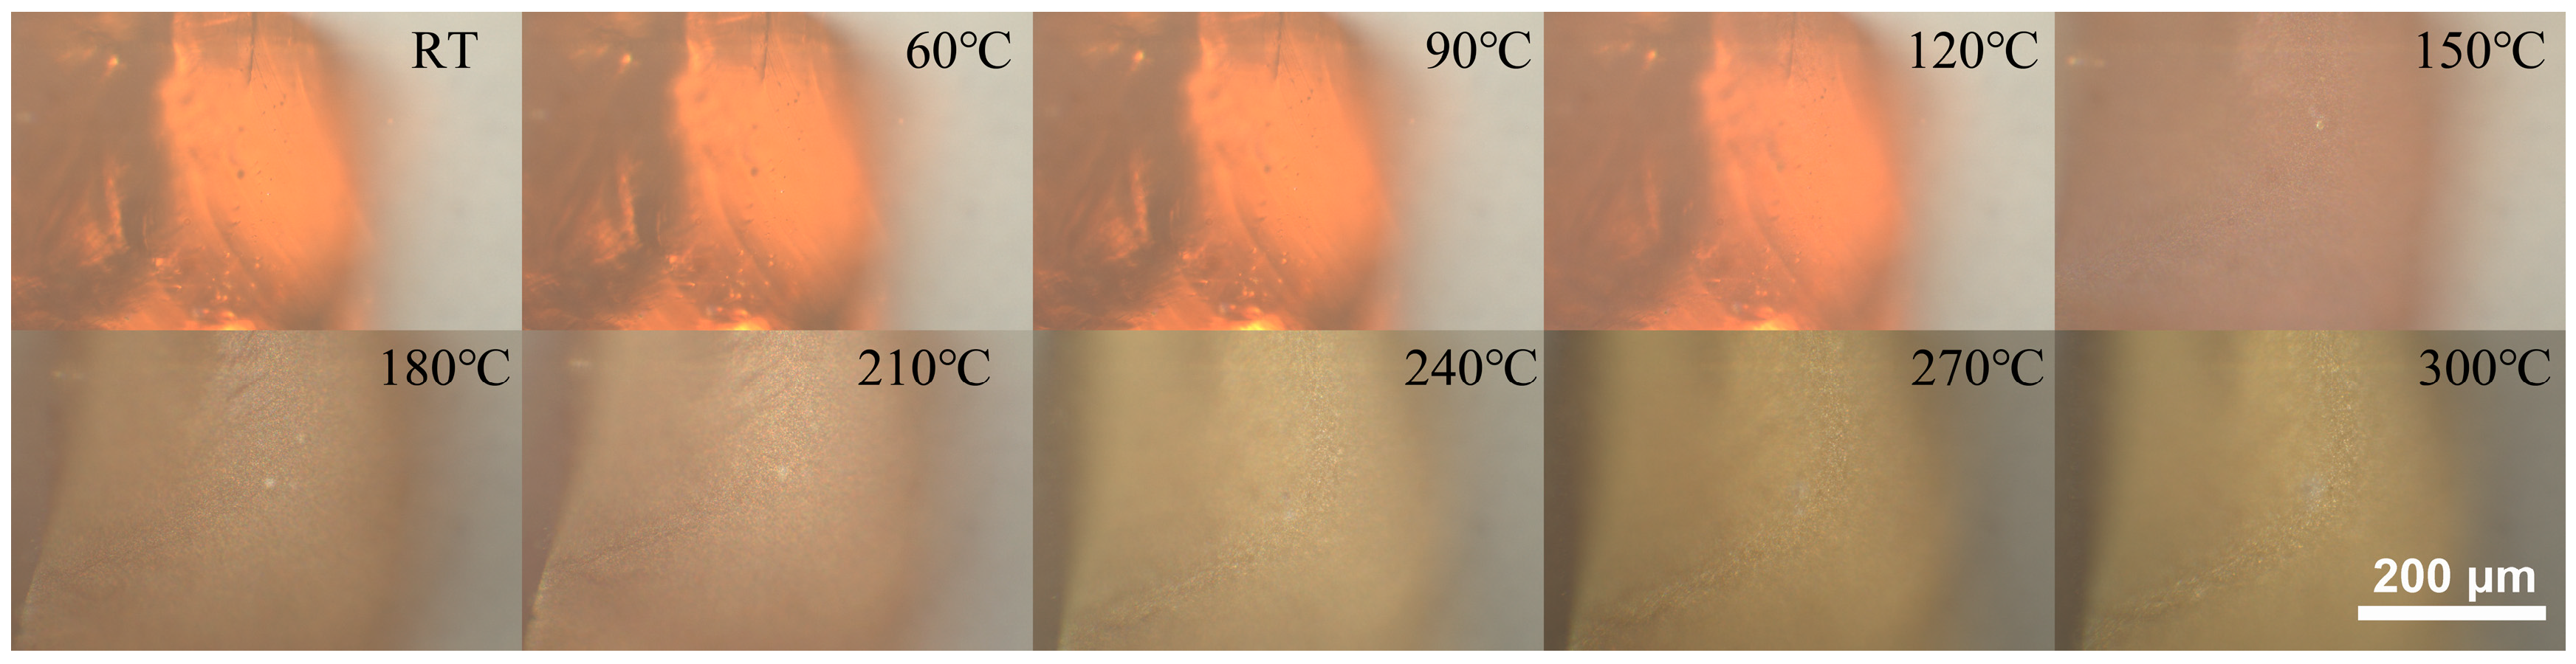
A 50× objective was utilized to focus the sample, laser incidence and acquisition of the signal channel in the PL test. Raman spectroscopy (WITech R300) with a 473 nm laser was employed to measure the PL spectrum. All PL spectra at different temperatures were also collected after the heating stage reached the specified temperature and distributed.

3. Results

Since the optical properties of MAPbBr3 are some of the most critical properties in assembling a device such as a solar cell, the in situ PL spectra of single crystals of MAPbBr3 from ambient temperature to high temperature were investigated. As shown in Figure 1, the PL spectra of MAPbBr3 were checked at 30 °C intervals. Under ambient conditions, MAPbBr3 showed a strong PL peak at 544 nm (Figure 1a), indicating that the newly synthesized single crystal has a favorable optical property. The peak PL position of MAPbBr3 matched those reported in the literature [23,24]. The strong PL peak intensity suggested that single-crystal MAPbBr3 has a high PL quantum yield which is related to its optical properties. As shown by the relationship of PL intensity with increasing temperature (Figure 1b), the PL peak intensity decreased sharply with increasing temperature. The PL peak intensity decreased to 66%, 19% and 5% of the fluorescence intensity at ambient temperature for each increase of 30 °C up to 120 °C, respectively. The complete spectra are shown in Figure S1. As the temperature continued to be raised to 150 °C and 180 °C, the fluorescence peak intensity decreased to 0.5% to 0.2% of the fluorescence intensity at ambient temperature and stayed low until it disappeared after further heating. The PL peak intensity gradually decreased until it vanished under temperatures from ambient to 300 °C, indicating that MAPbBr3 started to disintegrate since its long-range order was lost due to a partial chemical decomposition. The structure disorder of MAPbBr3 after 300 °C treating was also observed in XRD results (Figure 2a,b).
As shown in Figure 1c, the PL peak of MAPbBr3 undergoes a slight blue shift as the temperature increases from ambient to 120 °C, with the peak position being blue shifted by 2 nm for each 30 °C increase. Peak PL profile trailing was observed on the lower energy side, which was mainly attributed to the radiative complexation of the captured exciton [25]. When the temperature increased from 120 °C to 180 °C, the PL peaks shifted more toward the short-wave direction with a more obvious asymmetry in the fluorescence peaks on the lower energy side. The blue shift increased to 8 nm per 30 °C in the range of 120 °C to 180 °C, which is more significant compared to the 2 nm blue shift that occurred at a relatively low temperature. The PL peak profile trailing on the lower energy side was also more obvious, suggesting that more captured excitons underwent radiative complexation. When the temperature reached 180 °C, the PL peak was blue shifted to about 522nm and no longer continued to blue shift with the raise of temperature. Blue shifts in the organic/inorganic hybrid perovskite materials from low temperatures to RT were observed, which have been discussed in the literature, but no agreement has been reached [20,21,26,27,28]. Kim et al. [26] considered that blue shifts during heating from −88.15 °C to 26.85 °C in the tetragonal phase of CH3NH3PbI3 is associated with the population of Pb-I-Pb bending vibration modes. Dar et al. [27] attributed the blue shift of thin-film HOIP samples to a stabilization of the valence band maximum. Singh et al. [28] suggested that the blue shift of CH3NH3PbI3 is related to a large temperature coefficient of lattice expansion in the material, i.e., the lattice expansion plays a much more significant role than electron–phonon interactions. PL peak shift is normally related to the electronic state change which was induced by crystal structure. The blue shifts in the PL peak indicate that the exciton–phonon coupling is affected by out-of-plane octahedral tilting. With increasing temperature, the ordered MA cations in single-crystal MAPbBr3 became disordered, leading to the gradual distortion of the octahedra framework. This leads to a smaller out-of-plane octahedral tilting angle and thus a decrease in the bandgap with increasing temperature [29]. The PL peak position obtained at 270 °C is not much different from that obtained at 180 °C, but the asymmetry of the PL peak is severe. The PL peak completely disappeared when the temperature reached 300 °C, indicating a vast amount of disorder in the crystal structures.
The variation in the Full Width Half Maximum (FWHM) of the MAPbBr3 PL peak with increasing temperature is shown in Figure 1d. In the range of ambient temperatures up to 120 °C, the FWHM essentially increases linearly, which indicates that the increases in the FWHM of the PL spectra come from the accumulation of charges during photoexcitation which increases the inherent bandgap of the MAPbBr3 [25,26,27,28]. The FWHM of the PL spectra in the temperature range higher than 150 °C did not show similar trends to that in the previous temperature stage. When the temperature reached 150 °C, the FWHM increased more significantly. The FWHM fluctuated around 35 nm in the temperature range of 150–250 °C, while the FWHM abruptly grew to 80 nm when the temperature reached 270 °C. The increasing FWHM with increasing temperature also indicates that the structure of MAPbBr3 may have started to change since long-range order is lost due to a partial chemical decomposition [30], which is consistent with the change in the fluorescence intensity with the temperature.
Optical photographs of MAPbBr3 crystals were captured at various temperatures to observe the morphological changes of MAPbBr3, as shown in Figure 3. Optical micrographs of single crystals of MAPbBr3 in the range of ambient temperature to 300 °C are shown in Figure 3. Solution-grown MAPbBr3 single crystal perovskites appear to be a vivid orange between ambient temperature to 120 °C. While the color of MAPbBr3 single-crystal perovskites started to fade when it was placed in 150 °C. At around 240 °C, it displayed an ashen-like color instead of any other vivid color. The color changes in the optical photographs were consistent with the PL spectra.
For the purpose of observing the changes in the crystal structure of MAPbBr3 before, during and after heating, X-ray diffraction (XRD) was applied to characterize the crystal structure. Since the size of our MAPbBr3 crystals was small and thin, the signals from the playdough surrounding the fixed MAPbBr3 crystals were still collected during the micro region XRD scanning process. As shown in Figure S2, the XRD results for the MAPbBr3 and playdough were acquired simultaneously at each temperature. Then, the XRD results of the playdough were deducted from the XRD results of the MAPbBr3 to obtain the XRD results of the MAPbBr3 excluding the effect of playdough. As presented in Figure 2a, the XRD peaks were observed at 15.01°, 30.18°, 45.93° and 62.69°, which were assigned to (100), (200), (300) and (400) of cubic MAPbBr3 [25,31]. These typical XRD patterns confirmed that the crystals had a highly crystalline structure and can be well indexed to a cubic structure with the space group Pm 3 ¯ m [32]. The XRD patterns of MAPbBr3 at 120 °C, 150 °C, 180 °C and 210 °C were similar with small only intensity differences (Figure S3), i.e., the XRD peak intensities at 120 °C, 150 °C, 180 °C, and 210 °C were stronger than the XRD peak intensities at room temperature. When the temperature reached 240 °C, new patterns appeared at 21.55°, 30.49°, 33.88°, 37.94° and 48.2° 2θ. XRD results on the 14° to 31° region show weaker new peaks at 18.50°, 20.91°, 21.55°, 21.96°, 23.62°, 29.26°and 30.46° 2θ (Figure 2b). When the temperature increased to 350 °C, MAPbBr3 crystals began to decompose and left a small amount of power which was not enough for a micro-region XRD measurement. Thus, we did not obtain the XRD result for 350 °C incubated MAPbBr3 crystal.
Raman spectroscopy allows for a better study of organic cation changes in addition to verifying the crystal structure of the material. The Raman spectrum of MAPbBr3 at ambient temperature is presented in Figure 2c. The evolution of the structure with the temperature of the MA+ cation and the [PbBr6]4− octahedral framework in single crystal of MAPbBr3 was also investigated using Raman spectroscopy. As discussed in previous studies [18,25,33], the low-frequency Raman vibrational modes (40–200 cm−1) are related to the lattice vibrations in the [PbBr6]4− inorganic octahedral framework [33]. The vibrational Raman spectra in the range of 200–3000 cm−1 were assigned to the molecular vibrational modes of MA+ organic cations. Figure 4 shows the temperature evolution of the Raman spectra from a single crystal of MAPbBr3. Since the Raman spectral bands at wave numbers below 200 cm−1 were severely affected by diffuse scattering, we shifted through the intensity axis to be in the range of 100–250 cm−1 using the origin software. To better see the broad bands, we show the spectra in the logarithmic scale in the range between 100 cm−1 and 250 cm−1. Raman spectra in the range of 200–3000 cm−1 shifted through the intensity axis to make each spectrum clear. The Raman peak at 328 cm−1 is attributed to the MA cage mode. The Raman peak at 970 cm−1 comes from C-N stretching. The 1477 cm−1 Raman peak is related to the asymmetric bending of NH3+. The Raman signal peak at 2962 cm−1 is assigned to CH3 symmetric stretching [18].
In the intermediate- and higher-frequency peak interval, we can observe a significant increase in peak intensity at 60 °C and 90 °C with increasing temperature. However, this enhancement at 60 °C and 90 °C in low-frequency Raman band was not observed. The difference between the low- and intermediate–high-frequency Raman bands at 60 °C and 90 °C indicates that the [PbBr6]4− inorganic octahedral framework was not affected, while the vibrations in the MA cations in the inorganic octahedron are greatly enhanced. As discussed in temperature evolution PL spectra, PL peak intensity decreased to 66%, 19% of the fluorescence intensity at ambient temperature. Therefore, the more active vibrations in the MA cage mode at 60 °C and 90 °C may increase, thereby affecting the optical properties of MAPbBr3. As shown in Figure 4a, the Raman peaks around 150 cm−1 persist when the temperature is not higher than 120 °C, which indicates that the inorganic octahedral framework structure is still maintained at 120 °C. Lim et al. applied differential thermal analysis (DTA) and nuclear magnetic resonance (NMR) to observed CH3NH3PbBr3 hybrid perovskite in the temperature range from 26.85 to 434.85 °C and found that the surface of CH3NH3PbBr3 started to decompose from surface at 257 °C [34]. Few studies have discussed the decomposition product of CH3NH3PbBr3, we refer to the decomposition process of CH3NH3PbI3. As discussed by Juarez-Perez et al., the common feature is that the gases released during the thermal decomposition of CH3NH3PbI3 are ammonia and methyl iodide which were verified by simultaneous thermogravimetry (TG) and differential thermal analysis (DTA) coupled with mass spectrometry (TG-DTA/MS) [35]. The possible reason that the Raman spectroscopy measured a lower decomposition temperature than in the literature is that Raman spectroscopy measured the surface that started to decompose first. Also, the surface of the sample may have already undergone partial disintegration. When it reached 150 °C, the Raman band at 150 cm−1 disappeared, suggesting that the [PbBr6]4− octahedral structure near to the surface was affected [35]. The MA cage mode in Figure 4b remains observable until it reached 210 °C, while Raman bands of 970 cm−1 (C-N stretching), 1477 cm−1 (symmetric bending of NH3+), and 2962 cm−1 (symmetric stretching of CH3 group) started to disappear at 120 °C. As can be seen from all of the Raman bands in Figure 4, there is no significant shift in the Raman peak positions during the heating process, indicating that there is no phase transition in the lattice structure.

4. Discussion

The room-temperature XRD results for MAPbBr3 after 5 min of incubation at ambient temperature, 120 °C, 150 °C, 180 °C, 210 °C, 240 °C, 270 °C, 300 °C and 350 °C show that new peaks at 21.55°, 30.49°, 33.88°, 37.94° and 48.2° 2θ appeared in the XRD results for 240 °C, 270 °C, 300 °C. The new peaks at 21.55°, 30.49°, 33.88°, 37.94° and 48.2° 2θ corresponded to the reflections from the planes (011), (002), (021), (211) and (310) of MAPbBr3’s powers or polycrystalline form, respectively [36]. The new planes detected in the XRD spectra suggest that when the temperature reached 240 °C, the single-crystal MAPbBr3 started to break into small crystals and turned into a polycrystalline due to the effect of thermal expansion and contraction. Himchan Cho et al. investigated the thermal stability of MAPbBr3 polycrystalline films and identified XRD patterns of PbBr2 at positions at 18.5°, 21.0°, 21.7°, 22.0°, 23.7°, 23.7°, 29.2° and 30.7° following 30 min of incubation of MAPbBr3 polycrystalline films at 230 °C. We also observed XRD patterns of PbBr2 as shown in Figure 2b which indicate that a partial decomposition of MAPbBr3 began to occur when the temperature reached 240 °C. The XRD results indicate that the MAPbBr3 crystal started to become polycrystalline and decompose at 240 °C.
According to the Raman spectra of temperature evolution, when the temperature increased to 90 °C, the structure of MAPbBr3 was still preserved since all Raman bands including 150 cm−1 ([PbBr6]4− framework), 328 cm−1 (MA cage mode), 970 cm−1 (C-N stretching), 1477 cm−1 (asymmetric NH3+ stretching) and 2962 cm−1 (symmetric CH3 stretching) are very clear at 90 °C. When the temperature increased to 120 °C, the Raman bands of the internal modes (including MA-cage mode at 328 cm−1) became very weak. The Raman bands of the MA cages were observed at temperatures up to 210 °C, indicating that the MAPbBr3 crystal structure was still preserved. The difference in the temperature transition points to whether or not the MAPbBr3 crystal structure has changed in the Raman spectra (210 °C) and the XRD results (240 °C) may be due to the fact that Raman spectroscopy focuses on the surface of the sample, while XRD studies the entire crystal. The surface of the MAPbBr3 crystals is more susceptible to decomposition due to the presence of defects that are more susceptible to the effects of temperature. Both the Raman spectroscopy and XRD patterns show that the intensity of the spectrum and patterns increases with increasing temperature. The Raman spectra showed this phenomenon at 60 °C and 90 °C. The XRD results showed that the intensity increase occurred at 120 °C, 150 °C, 180 °C and 210 °C. This may be a heat treatment process that favors the crystal structure and their surfaces.
The energy (PL peak position) and the FWHM essentially increase linearly with increasing temperature in the range from RT to 120 °C which suggests that this may be due to a change in the temperature. When the temperature exceeded 120 °C, the PL peak position began to show an obvious blue shift, and the FWHM also began to increase abruptly above 120 °C, with insignificant changes in the PL peak intensities (Figure 1b–d), which may be related to the structural effects. The optical photo showed discoloration beyond 120 °C. During the heating process, the shape of the peaks in the PL spectra developed an obvious asymmetry. These variations in the PL spectra with temperature indicate that the optical properties of MAPbBr3 are greatly affected by temperature, which in turn affects the application of MAPbBr3 in fields such as optical devices.
In summary, according to the results of Raman spectroscopy and PL spectroscopy, the surface of a MAPbBr3 crystal starts to change when the temperature is higher than 120 °C. When the temperature reached 210 °C to 240 °C, the crystal structure of MAPbBr3 crystal began to be affected, as evidenced by poly-crystallization and partial decomposition. At the temperature of 350 °C, the MAPbBr3 crystal began to decompose completely.

5. Conclusions

We synthesized single crystals of MAPbBr3 using the polymer-controlled nucleation route and investigated the optical properties and molecular structure evolution of it with temperature. Using temperature evolution PL spectroscopy, we found that the fluorescence intensity was greatly affected by increasing temperature, with an asymmetric PL profile suggesting that more captured excitons undergo radiative complexation. The optical photographs showed that the color of MAPbBr3 single crystals faded above 120 °C. Raman spectroscopy revealed that during the heating process, structure of MAPbBr3 was still preserved at 90 °C since all Raman bands are very clear. When the temperature increased to 120 °C, the Raman bands of the internal modes became very weak. Upon further heating, the inorganic framework on the sample’s surface started to disintegrate above 210 °C. The XRD results indicated that the MAPbBr3 crystal underwent polycrystalline and decomposition at 240 °C. The MAPbBr3 crystals were decomposed into PbBr2 products. The PL spectra were greatly affected during the heating process. These results may be instructive for the application of MAPbBr3.

Supplementary Materials

The following supporting information can be downloaded at: https://www.mdpi.com/article/10.3390/cryst14070589/s1, Figure S1: The complete PL spectra of MAPbBr3 in the temperature range from ambient temperature to 300 ℃. Figure S2: The XRD patterns with and substrate background of MAPbBr3 after 5 minutes incubating at various temperatures at ambient temperature, 120 °C, 150 °C, 180 °C, 210 °C, 240 °C, 270 °C and 300 °C. The figures on the right show the XRD patterns of MAPbBr3 with background signal from playdough and XRD patterns of playdough. The figures on the left show the XRD patterns of MAPbBr3 after subtracting the playdough background. Figure S3: The XRD patterns of MAPbBr3 after 5 min incubating at various temperature at ambient temperature, 120 °C, 150 °C, 180 °C, 210 °C, 240 °C, 270 °C and 300 °C.

Author Contributions

Conceptualization, Y.L. and X.L.; Data curation, S.Z. and S.C.; Funding acquisition, L.M., Y.L. and H.C.; Investigation, S.Z. and S.C.; Provision of study materials, L.M.; Writing—original draft, Y.L. and L.M.; Writing—review and editing, Y.L. and H.C. All authors have read and agreed to the published version of the manuscript.

Funding

This research was funded by the National Natural Science Foundation of China, grant number U23B2078; Beijing Postdoctoral Research Foundation, grant number Q6009A03202301 and Fundamental Research Funds for the Central Universities, grant number FRF-DF-22-17.

Data Availability Statement

The datasets presented in this article are not readily available because the data are part of an ongoing study or due to technical and time limitations. Requests to access the datasets should be directed to the corresponding author.

Conflicts of Interest

The authors declare no conflicts of interest.

References

  1. Wang, K.; Ecker, B.R.; Ghosh, M.; Li, M.; Karasiev, V.V.; Hu, S.X.; Huang, J.; Gao, Y. Light-enhanced oxygen degradation of MAPbBr3 single crystal. Phys. Chem. Chem. Phys. 2024, 26, 5027–5037. [Google Scholar] [CrossRef] [PubMed]
  2. Choi, J.I.J.; Ono, L.K.; Cho, H.; Kim, K.; Kang, H.; Qi, Y.; Park, J.Y. Pathways of water-induced lead-halide perovskite surface degradation: Insights from in situ atomic-scale analysis. ACS Nano 2023, 17, 25679–25688. [Google Scholar] [CrossRef] [PubMed]
  3. Parida, S.; Kumar, S.; Cherf, S.; Aharon, S.; Cahen, D.; Eren, B. Self-healing and -repair of nanomechanical damages in lead halide perovskites. Adv. Funct. Mater. 2023, 33, 2304278. [Google Scholar] [CrossRef]
  4. Capitani, F.; Marini, C.; Caramazza, S.; Dore, P.; Pisanu, A.; Malavasi, L.; Nataf, L.; Baudelet, F.; Brubach, J.B.; Roy, P.; et al. Locking of methylammonium by pressure-enhanced H-bonding in (CH3NH3)PbBr3 hybrid perovskite. J. Phys. Chem. C 2017, 121, 28125–28131. [Google Scholar] [CrossRef]
  5. Ma, L.; Li, W.; Yang, K.; Bi, J.; Feng, J.; Zhang, J.; Yan, Z.; Zhou, X.; Liu, C.; Ji, Y.; et al. A- or x-site mixture on mechanical properties of APbX3 perovskite single crystals. APL Mater. 2021, 9, 041112. [Google Scholar] [CrossRef]
  6. Qin, Z.; Dai, S.; Gajjela, C.C.; Wang, C.; Hadjiev, V.G.; Yang, G.; Li, J.; Zhong, X.; Tang, Z.; Yao, Y.; et al. Spontaneous formation of 2D/3D heterostructures on the edges of 2D Ruddlesden-popper hybrid perovskite crystals. Chem. Mat. 2020, 32, 5009–5015. [Google Scholar] [CrossRef]
  7. Tan, M.; Wang, S.; Rao, F. First-principles study on the modulation of the electronic structure of organic-inorganic hybrid perovskite (MAPbBr3) under pressure. J. Synth. Cryst. 2018, 47, 1589–1595. [Google Scholar]
  8. Kojima, A.; Teshima, K.; Shirai, Y.; Miyasaka, T. Organometal halide perovskites as visible-light sensitizers for photovoltaic cells. J. Am. Chem. Soc. 2009, 131, 6050–6051. [Google Scholar] [CrossRef]
  9. Degani, M.; An, Q.; Albaladejo-Siguan, M.; Hofstetter, Y.J.; Cho, C.; Paulus, F.; Grancini, G.; Vaynzof, Y. 23.7% efficient inverted perovskite solar cells by dual interfacial modification. Sci. Adv. 2021, 7, eabj7930. [Google Scholar] [CrossRef]
  10. Shen, Z.; Han, Q.; Luo, X.; Shen, Y.; Wang, Y.; Yuan, Y.; Zhang, Y.; Yang, Y.; Han, L. Efficient and stable perovskite solar cells with regulated depletion region. Nat. Photonics 2024, 18, 450–457. [Google Scholar] [CrossRef]
  11. Burschka, J.; Pellet, N.; Moon, S.; Humphry-Baker, R.; Gao, P.; Nazeeruddin, M.K.; Graetzel, M. Sequential deposition as a route to high-performance perovskite-sensitized solar cells. Nature 2013, 499, 316. [Google Scholar] [CrossRef] [PubMed]
  12. Ahn, N.; Choi, M. Towards long-term stable perovskite solar cells: Degradation mechanisms and stabilization techniques. Adv. Sci. 2024, 11, e2306110. [Google Scholar] [CrossRef]
  13. Boyd, C.C.; Cheacharoen, R.; Leijtens, T.; Mcgehee, M.D. Understanding degradation mechanisms and improving stability of perovskite photovoltaics. Chem. Rev. 2019, 119, 3418–3451. [Google Scholar] [CrossRef] [PubMed]
  14. Zhang, D.; Li, D.; Hu, Y.; Mei, A.; Han, H. Degradation pathways in perovskite solar cells and how to meet international standards. Commun. Mater. 2022, 3, 58. [Google Scholar] [CrossRef]
  15. Kim, T.; Park, S.; Iyer, V.; Shaheen, B.; Choudhry, U.; Jiang, Q.; Eichman, G.; Gnabasik, R.; Kelley, K.; Lawrie, B.; et al. Mapping the pathways of photo-induced ion migration in organic-inorganic hybrid halide perovskites. Nat. Commun. 2023, 14, 1846. [Google Scholar] [CrossRef] [PubMed]
  16. Kitazawa, N.; Aono, M.; Watanabe, Y. Temperature-dependent time-resolved photoluminescence of (C6H5C2H4NH3)2PBX4 (X=Br and I). Mater. Chem. Phys. 2012, 134, 875–880. [Google Scholar] [CrossRef]
  17. Shi, R.; Fang, Q.; Vasenko, A.S.; Long, R.; Fang, W.; Prezhdo, O.V. Structural disorder in higher-temperature phases increases charge carrier lifetimes in metal halide perovskites. J. Am. Chem. Soc. 2022, 144, 19137–19149. [Google Scholar] [CrossRef] [PubMed]
  18. Nakada, K.; Matsumoto, Y.; Shimoi, Y.; Yamada, K.; Furukawa, Y. Temperature-dependent evolution of raman spectra of methylammonium lead halide perovskites, CH3NH3PbX3 (X = I, Br). Molecules 2019, 24, 626. [Google Scholar] [CrossRef] [PubMed]
  19. Tan, M.; Wang, S.; Rao, F.; Yang, S.; Wang, F. Pressures tuning the band gap of organic-inorganic trihalide perovskites (mapbbr3): A first-principles study. J. Electron. Mater. 2018, 47, 7204–7211. [Google Scholar] [CrossRef]
  20. Park, S.; Seo, Y.; Ahn, C.W.; Woo, W.S.; Kyhm, J.; Lee, S.A.; Kim, I.W.; Hwang, J. Temperature-dependent optical properties of hybrid organic-inorganic perovskite single crystals (CH3NH3PbI3 and CH3NH3PbBr3). J. Phys. D Appl. Phys. 2019, 52, 335302. [Google Scholar] [CrossRef]
  21. Bermúdez-García, J.M.; Yáñez-Vilar, S.; García-Fernández, A.; Sánchez-Andújar, M.; Castro-García, S.; López-Beceiro, J.; Artiaga, R.; Dilshad, M.; Moya, X.; Señarís-Rodríguez, M.A. Giant barocaloric tunability in [(CH3CH2CH2)4N]Cd[N(CN)2]3 hybrid perovskite. J. Mater. Chem. C 2018, 6, 9867–9874. [Google Scholar] [CrossRef]
  22. Greenland, C.; Shnier, A.; Rajendran, S.K.; Smith, J.A.; Game, O.S.; Wamwangi, D.; Turnbull, G.A.; Samuel, I.D.W.; Billing, D.G.; Lidzey, D.G. Correlating phase behavior with photophysical properties in mixed-cation mixed-halide perovskite thin films. Adv. Energy Mater. 2020, 10, 1901350. [Google Scholar] [CrossRef]
  23. Ma, L.; Yan, Z.; Zhou, X.; Pi, Y.; Du, Y.; Huang, J.; Wang, K.; Wu, K.; Zhuang, C.; Han, X. A polymer controlled nucleation route towards the generalized growth of organic-inorganic perovskite single crystals. Nat. Commun. 2021, 12, 2023. [Google Scholar] [CrossRef] [PubMed]
  24. Li, M.; Bu, K.; Li, J.; Wang, H.; Xu, Y.; Guo, S.; Luo, H.; Liu, B.; Yang, D.; Gong, Y.; et al. Synthesis of edge-shared octahedral MAPbBr3 via pressure- and temperature-induced multiple-stage processes. Chem. Mat. 2023, 35, 1177–1185. [Google Scholar] [CrossRef]
  25. Wang, K.; Li, L.; Shellaiah, M.; Wen Sun, K. Structural and photophysical properties of methylammonium lead tribromide (MAPbBr3) single crystals. Sci. Rep. 2017, 7, 13643. [Google Scholar] [CrossRef] [PubMed]
  26. Kim, H.; Hunger, J.; Cánovas, E.; Karakus, M.; Mics, Z.; Grechko, M.; Turchinovich, D.; Parekh, S.H.; Bonn, M. Direct observation of mode-specific phonon-band gap coupling in methylammonium lead halide perovskites. Nat. Commun. 2017, 8, 687. [Google Scholar] [CrossRef] [PubMed]
  27. Dar, M.I.; Jacopin, G.; Meloni, S.; Mattoni, A.; Arora, N.; Boziki, A.; Zakeeruddin, S.M.; Rothlisberger, U.; Grätzel, M. Origin of unusual bandgap shift and dual emission in organic-inorganic lead halide perovskites. Sci. Adv. 2016, 2, e1601156. [Google Scholar] [CrossRef] [PubMed]
  28. Singh, S.; Li, C.; Panzer, F.; Narasimhan, K.L.; Graeser, A.; Gujar, T.P.; Köhler, A.; Thelakkat, M.; Huettner, S.; Kabra, D. Effect of thermal and structural disorder on the electronic structure of hybrid perovskite semiconductor CH3NH3PbI3. J. Phys. Chem. Lett. 2016, 7, 3014–3021. [Google Scholar] [CrossRef] [PubMed]
  29. Hong, H.; Guo, S.; Jin, L.; Mao, Y.; Chen, Y.; Gu, J.; Chen, S.; Huang, X.; Guan, Y.; Li, X.; et al. Two-dimensional lead halide perovskite lateral homojunctions enabled by phase pinning. Nat. Commun. 2024, 15, 3164. [Google Scholar] [CrossRef] [PubMed]
  30. Gao, X.; Wang, Q.; Zhang, Y.; Cui, C.; Sui, N.; Chi, X.; Zhang, H.; Zhou, Q.; Bao, Y.; Wang, Y. Pressure effects on optoelectronic properties of CsPbBr3 nanocrystals. J. Phys. Chem. C 2020, 124, 11239–11247. [Google Scholar] [CrossRef]
  31. Wang, C.; Ecker, B.R.; Wei, H.; Huang, J.; Gao, Y. Environmental surface stability of the MAPbBr3 single crystal. J. Phys. Chem. C 2018, 122, 3513–3522. [Google Scholar] [CrossRef]
  32. Samanta, D.; Saha, P.; Ghosh, B.; Chaudhary, S.P.; Bhattacharyya, S.; Chatterjee, S.; Mukherjee, G.D. Pressure-induced emergence of visible luminescence in lead free halide perovskite Cs3Bi2Br9: Effect of structural distortion. J. Phys. Chem. C 2021, 125, 3432–3440. [Google Scholar] [CrossRef]
  33. Wang, L.; Wang, K.; Zou, B. Pressure-induced structural and optical properties of organometal halide perovskite-based formamidinium lead bromide. J. Phys. Chem. Lett. 2016, 7, 2556–2562. [Google Scholar] [CrossRef] [PubMed]
  34. Lim, A.R.; Kim, S.H.; Joo, Y.L. Structural dynamics of CH3NH3+ and PbBr3 in tetragonal and cubic phases of CH3NH3PbBr3 hybrid perovskite by nuclear magnetic resonance. Sci. Rep. 2020, 10, 13140. [Google Scholar] [CrossRef] [PubMed]
  35. Juarez-Perez, E.J.; Hawash, Z.; Raga, S.R.; Ono, L.K.; Qi, Y. Thermal degradation of CH3NH3PbI3 perovskite into NH3 and CH3I gases observed by coupled thermogravimetry-mass spectrometry analysis. Energy Environ. Sci. 2016, 9, 3406–3410. [Google Scholar] [CrossRef]
  36. Li, F.; Lu, J.; Zhang, Q.; Peng, D.; Yang, Z.; Xu, Q.; Pan, C.; Pan, A.; Li, T.; Wang, R. Controlled fabrication, lasing behavior and excitonic recombination dynamics in single crystal CH3NH3PbBr3 perovskite cuboids. Sci. Bull. 2019, 64, 698–704. [Google Scholar] [CrossRef]
Figure 1. Temperature evolution of (a) photoluminescence pattern of MAPbBr3 in the range of ambient temperature to 300 °C. (b) Intensity of PL peaks, (c) PL peak positions and (d) FWHM of PL peaks.
Crystals 14 00589 g001
Figure 2. (a) XRD patterns of MAPbBr3 at ambient temperature after 5 min of incubation at ambient temperature, 240 °C, 270 °C and 300 °C. (b) XRD patterns in the range from 14° to 31° of MAPbBr3 at 240 °C, 270 °C and 300 °C. All XRD results were shifted through the intensity axis to make each pattern clear. (c) Raman spectrum of MAPbBr3 at ambient temperature. * Indicates a new peak.
Crystals 14 00589 g002
Figure 3. Optical micrographs of MAPbBr3 singles crystal in the range of ambient temperature to 300 °C.
Crystals 14 00589 g003
Figure 4. Temperature evolution of selected Raman spectra of MAPbBr3 within (a) 100–250 cm–1, (b) 200–500 cm–1, (c) 850–1150 cm–1, (d) 1450–1650 cm–1 and (e) 2850–3050 cm–1.
Crystals 14 00589 g004
Disclaimer/Publisher’s Note: The statements, opinions and data contained in all publications are solely those of the individual author(s) and contributor(s) and not of MDPI and/or the editor(s). MDPI and/or the editor(s) disclaim responsibility for any injury to people or property resulting from any ideas, methods, instructions or products referred to in the content.

