Article

A Multi-Objective Genetic Algorithm-Based Predictive Model and Parameter Optimization for Forming Quality of SLM Aluminum Anodes

1
School of Automation, Wuxi University, Wuxi 214105, China
2
School of Automation, Nanjing University of Information Science and Technology, Nanjing 210044, China
3
Hongyuan Green Energy Co., Ltd., Wuxi 214026, China
4
Additive Manufacturing Products Supervision and Inspection Center of China, Wuxi Institution of Supervision & Testing on Product Quality, Wuxi 214125, China
*
Author to whom correspondence should be addressed.
Crystals 2024, 14(7), 608; https://doi.org/10.3390/cryst14070608
Submission received: 13 June 2024 / Revised: 28 June 2024 / Accepted: 29 June 2024 / Published: 30 June 2024
(This article belongs to the Section Crystalline Metals and Alloys)

Abstract

:
Aluminum–air batteries are characterized as “green energy for the 21st century” due to their clear advantages in terms of high current discharge, high specific energy, low cost, and easy-to-obtain electrode materials. This study develops the SLM aluminum anode quality prediction model and evaluates its learning and training results using the BP neural network architecture. By altering the network topology of the SLM aluminum anode quality prediction model, we create a process parameter backpropagation model that takes advantage of the extremely adaptable capabilities of artificial neural networks. The quick and exact selection of process parameters meets the goals of density, self-corrosion current, and anode usage, hence improving the forming quality and processing efficiency of SLM aluminum anodes. The experimental results show that the process parameter backpropagation model’s parameter configurations match to the real densities and self-corrosion currents, which are somewhat higher than the specified target values. The maximum error rate for the aluminum anode forming quality prediction model is 8.23%. Furthermore, the actual anode utilization rate is somewhat lower than the projected target value, indicating that the backpropagation model can satisfy actual production needs.

1. Introduction

With the global progress in science, technology, and industry, there is an increasing demand for energy in human activities. This has resulted in an increase in visible environmental problems caused by the excessive usage of petrochemical resources [1,2,3,4]. The aluminum–air battery is an innovative electrochemical energy conversion device that employs aluminum as the anode (negative electrode) and oxygen as the oxidant (positive electrode) [5]. Aluminum–air batteries offer various benefits compared to conventional lithium-ion batteries, such as lower cost, higher energy density, and enhanced safety performance. Consequently, they possess a diverse array of possible uses in electric vehicles and various other sectors [6,7,8,9,10].
During the selective laser melting (SLM) forming process, aluminum alloys can undergo many types of faults, such as thermal cracks, porosity, residual stresses, and others [11,12,13]. The microstructure of aluminum alloy experiences significant alterations when exposed to laser action. The microstructure, density, and other quantitative characteristics of aluminum alloy SLM samples greatly affect their discharge qualities and electrochemical properties when used as anodes. Therefore, it is crucial to further investigate the influence of laser process parameters on the electrochemical properties and discharge capacity of produced components. Prashanth and his colleagues [14] performed a study to examine the influence of process variables on the formation of aluminum alloy. The researchers discovered that the selection of scanning spacing and profile parameters significantly affected the structure and mechanical properties of AlSi12 components manufactured using selective laser melting (SLM). The results demonstrated that the use of contour parameters negatively affected the ductility of the components, mostly because of the existence of residual stresses on the surface. This investigation did not reveal the influence of SLM parameters on the microstructure of the components in relation to the optimization of process parameters. Li et al. [15] found that high-speed cooling of AlSi10Mg during selective laser melting (SLM) led to a significant decrease in the grain structure, resulting in enhanced mechanical properties compared to cast products made from the same alloy. Akram and his colleagues [16] built a simulation model to analyze the evolution of grain structure during the multilayer deposition in the SLM process, using the pre-established SLM settings. The results suggested that different cooling rates had specific effects on the microstructure of the alloy, and the changes in grain size and orientation were controlled by the process parameters. Hamrouni et al. [17] proposed a new generation of intelligent decision support systems for a business model having the ability to provide explanations to increase confidence in the proposed solutions. The previously described research focuses on enhancing the efficiency of producing aluminum alloy with SLM technology. Therefore, it is essential to carefully manage the process parameters when using selective laser melting (SLM) to manufacture aluminum alloy anodes. This is a critical measure for improving the performance of aluminum–air batteries.
As the overall performance of the Al–air battery is highly affected by the properties of the aluminum anode, a BP neural network was used in this work to propose a prediction model for the laser melting of TiB2/6061 aluminum anodes. The model utilizes indications like density, corrosion resistance, and discharge performance. The data sample set is utilized for training network learning, employing MATLAB and the Levenberg–Marquardt (trainlm) algorithm. The construction of the prediction model involves the utilization of a BP network and the calculation of the absolute error of the relative error between the predicted and experimental values and the absolute value of the relative error in the measured values. In the end, the neural network’s remarkable adaptability is employed to enter the predetermined indicator criteria as parameters. The BP neural network prediction model was used to project the intended process parameter combinations as experimental parameters. Following that, experiments were carried out and the indicators were measured. Therefore, it is crucial to further investigate the influence of laser process parameters on the electrochemical properties and discharge capacity of the manufactured components.

2. Experimental Work

This research specifically examines the process of laser melting of TiB2/6061 aluminum matrix composite aluminum anode specimens. The prediction model in the study incorporates densification, corrosion resistance, and discharge performance as the selected criteria. A prediction model using a BP network is created for the laser melting process of TiB2/6061 aluminum anodes. This study employs the BP neural network architecture to create the SLM single-objective prediction model, considering the constraints of a few experimental samples. Once the neural network prediction model’s dependability is confirmed, the study next proceeds to build a multi-objective prediction model.

2.1. Experimental Materials

The experiment employed 6061 aluminum alloy powder provided by Youyan Additive Technology Co. (Beijing, China). The powder particles had an almost perfectly spherical shape, with an average particle size ranging from 20 to 63 μm. Table 1 presents the exact chemical makeup of the powder, whereas Figure 1a depicts its microscopic form. The TiB2 powder used as the reinforcing phase particles was produced by Shaanxi Youyan New Material Technology Co. (Weinan, China). Figure 1b illustrates the morphology of the particles. In order to enhance the quality and electrochemical characteristics of the composite material utilizing Al6061 as the base material, a reinforcing phase powder of TiB2 (0.5 wt.%) was combined with Al6061 powder. The mixture of these two powders was then subjected to ball milling using the QM-3SP2 planetary ball mill manufactured by Nanjing Nanda Instrumentation Co. (Nanjing, China) to increase the performance of the printed parts. Figure 1d illustrates the ball milling device. This decision was made due to the exceptional chemical stability and thermal conductivity of TiB2. Figure 1c depicts the particle arrangement of TiB2/6061 composite powder after undergoing ball milling. In order to preserve the smoothness of the composite powder following ball milling, the aluminum matrix composite powder underwent vacuum drying and high-temperature drying at 100 °C for a duration of 5 h. Prior to executing the SLM forming test, the DZF6050 vacuum drying oven from Nanjing Tianhuang Machinery Co. (Nanjing, China) was used.

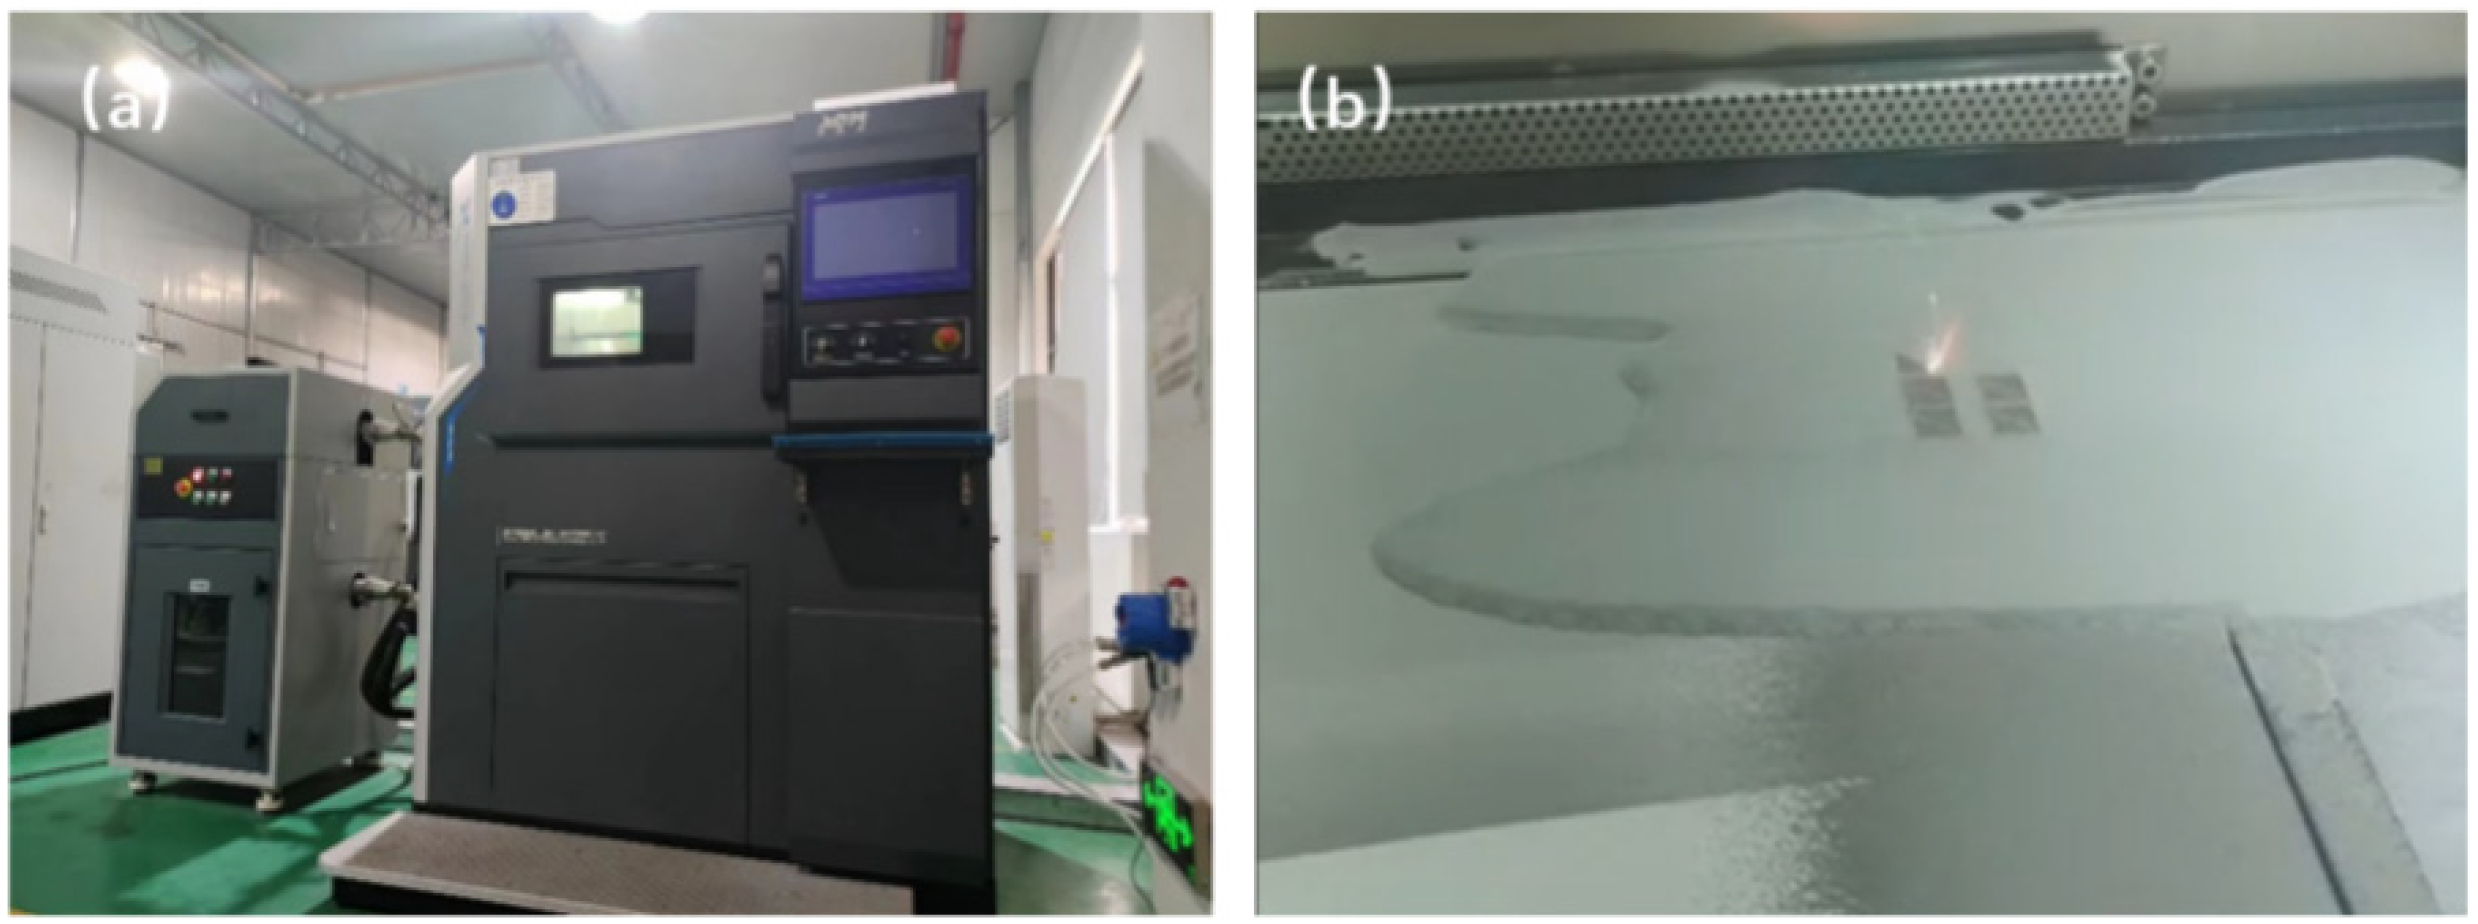
2.2. Experimental Equipment

The SLM forming test of TiB2/6061 composite was conducted using the XDM250 down-feed laser selective melting equipment made by Xidimo 3D Printing Technology. Figure 2a illustrates the visual representation of the equipment, while Table 2 provides a detailed summary of its properties. It is crucial to note that aluminum and titanium elements exhibit a strong affinity for oxygen, leading to the creation of oxide impurities in the SLM high-temperature forming test environment. The presence of these contaminants greatly hampers the quality of the forming process [18]. In order to tackle this problem, argon gas is employed to fill the forming chamber as a safeguard throughout the SLM forming process. This guarantees that the concentration of oxygen in the forming chamber remains below 100 parts per million (ppm). Figure 2b depicts the process of formation.

2.3. Experimental Programme

The BP neural network employs a supervised learning process to identify and preserve the patterns present in the data acquired from the given sample data. Consequently, the training and learning of the BP neural network model relies largely on a significant amount of experimental data [19,20,21]. Moreover, it is essential for this data to exhibit balance and inclusivity to ensure that the neural network can derive rules that are both representative and precise, hence reducing the likelihood of major errors. This section explores the construction of a neural network predictive model. Nevertheless, the lack of a comprehensive database impedes its advancement. Hence, it is imperative to generate a meticulously curated and inclusive assortment of sample data. Orthogonal experimental design is a method employed to examine the variability of many variables and levels. The process entails choosing well-balanced, widely spread, and inclusive data points from every conceivable combination of tests, guided by the principle of orthogonality. This guarantees that the experimental outcomes are both equitable and comprehensive. Therefore, the orthogonal test strategy was utilized to obtain the essential sample data required for training the neural network model.
The study specifically examined a restricted set of parameters, which included the mass percent of TiB2, laser power, scanning speed, and scanning spacing. The primary process parameters were selected based on these variables. The study employed the densities of the aluminum matrix composite anodes, the corrosion current density of 0.3 mol/L NaOH + 4 mol/L NaCl electrolyte, and the anode discharge utilization rate as the parameters for evaluating the density, corrosion resistance, and discharge performance of the TiB2/6061 aluminum anodes. The density, corrosion resistance, and discharge performance tests were conducted utilizing orthogonal tests to collect essential data for the prediction model based on the BP neural network. Table 3 displays the levels of the factors, whereas Table 4 shows the results of the tests.
The development of a BP neural network involves three primary components: determining the number of network layers, specifying the number of nodes in each layer, and selecting the transfer function based on the structural parameters of the network.
a. Configuring the number of network layers
The architecture of a BP neural network consists of an input layer, one or more hidden layers, and an output layer. Typically, a single-layer BP neural network is already rather powerful, and its efficacy can be enhanced by altering the number of nodes, either by increasing or decreasing them. Therefore, it is common practice to incorporate a concealed layer in the network architecture, and the consideration of further concealed layers only arises when a solitary concealed layer proves inadequate in achieving the desired result. According to this methodology, the BP neural network is first structured with a solitary hidden layer to forecast a singular goal, and the network is designed to incorporate three layers.
b. Calculating the number of nodes in each layer
This study investigated the input parameters of TiB2 powder mass fraction, laser power, scanning speed, and scanning spacing. The experiments were evaluated according to densification, corrosion resistance, and discharge performance. The assessment of corrosion resistance was conducted by measuring the corrosion current density, while the evaluation of discharge performance was based on the utilization of anode discharge. Therefore, in the single-objective prediction model, the network was set up with four nodes in the input layer and one node in the output layer. The artificial neural network reveals the complex correlation within the data by exploiting the nodes in the hidden layer. The network’s ability to represent this relationship is mostly demonstrated by the connection weights of the nodes in the hidden layer. A deficient quantity of nodes in the hidden layer indicates a limited ability of the neural network to extract information, which makes it difficult to catch the essential patterns of the data samples. On the other hand, having too many nodes can improve the thoroughness of extracting information, but it can also lengthen the training period and add unnecessary information, which can undermine the network’s capacity to accurately summarize the data. This study is based on empirical formulas that have been previously documented by other authors. Equation (1) is a commonly employed empirical formula cited in the literature [22,23]:
m = n + l + α
where m is the number of implicit layer nodes;
n is the number of input layer nodes;
l is the number of output layer nodes;
α is a constant, α∈[1,10].
Equation (1) implies that the optimal number of nodes in the hidden layer is between the range of 3 to 13. The midpoint of this range may be selected as the appropriate number of nodes in the hidden layer. This refers to a neural network model for predicting a single objective, where the hidden layer has eight nodes.
c. Selecting the transfer function
Transfer functions in neural network systems enable the translation of multidimensional nonlinear data, hence enhancing the computational capacity of the network and expanding the range of outputs produced by the model. Moreover, transfer functions ensure that input values, which may be infinite, are transformed into predetermined finite output intervals. This effectively mitigates any potential data overflow problems. The transfer functions employed in neural networks are listed in Table 5. During the error backpropagation process, the neural network is required to compute the transfer function. The research investigated the nonlinear mapping features of the BP neural network. Hence, an S-type function with nonlinearity was utilized in the implicit layer, whilst a linear function was selected for the output layer to ensure the output’s smoothness and adaptability. The architecture of the BP neural network was designed using the analyses and settings, as depicted in Figure 3. The network had four nodes in the input layer, eight nodes in the hidden layer, and one node in the output layer. The implicit layer employed the S-type function, whereas the output layer utilized the linear function.

2.4. Parameter Selection for SLM-Based Anode Quality Prediction Model

Several manufacturing parameters directly influence the quality of the anode. Hence, the choice of process parameters is contingent upon the particular processing conditions, machinery, and processing requirements. The anode quality of different materials in SLM is determined by specific process parameters, whereas the anode quality of the same material is impacted by varied process factors. From a scientific research standpoint, increasing the number of parameters results in a larger amount of experimental data and improves the precision of the prediction model. Nevertheless, this also leads to a rise in the intricacy of the analysis. In the realm of actual manufacturing, it is advantageous to reduce the number of process variables in order to meet processing needs and maintain high quality. This strategy has the potential to reduce both the duration and cost. Therefore, it is crucial to carefully select the combination of process parameters according to the unique needs before each machining operation.
Processors must have a high level of on-site experience in order to effectively set process parameters. Alternatively, the most effective set of process parameters may have to be identified by iterative testing and errors before each processing, leading to unnecessary depletion of human labor and material resources. The previous study developed a prediction model for anode quality in solid oxide fuel cells, known as SLM. This model demonstrates high accuracy in its quality predictions. The researcher modifies the parameter combinations according to the principles that control the impact of process parameters on anode quality, with the aim of identifying the most favorable range of process parameters shown in Figure 4. Although this strategy does save resources to some extent, it is undoubtedly categorized as trial-and-error and cannot directly determine the process parameters based on the intended performance.

3. Results and Discussion

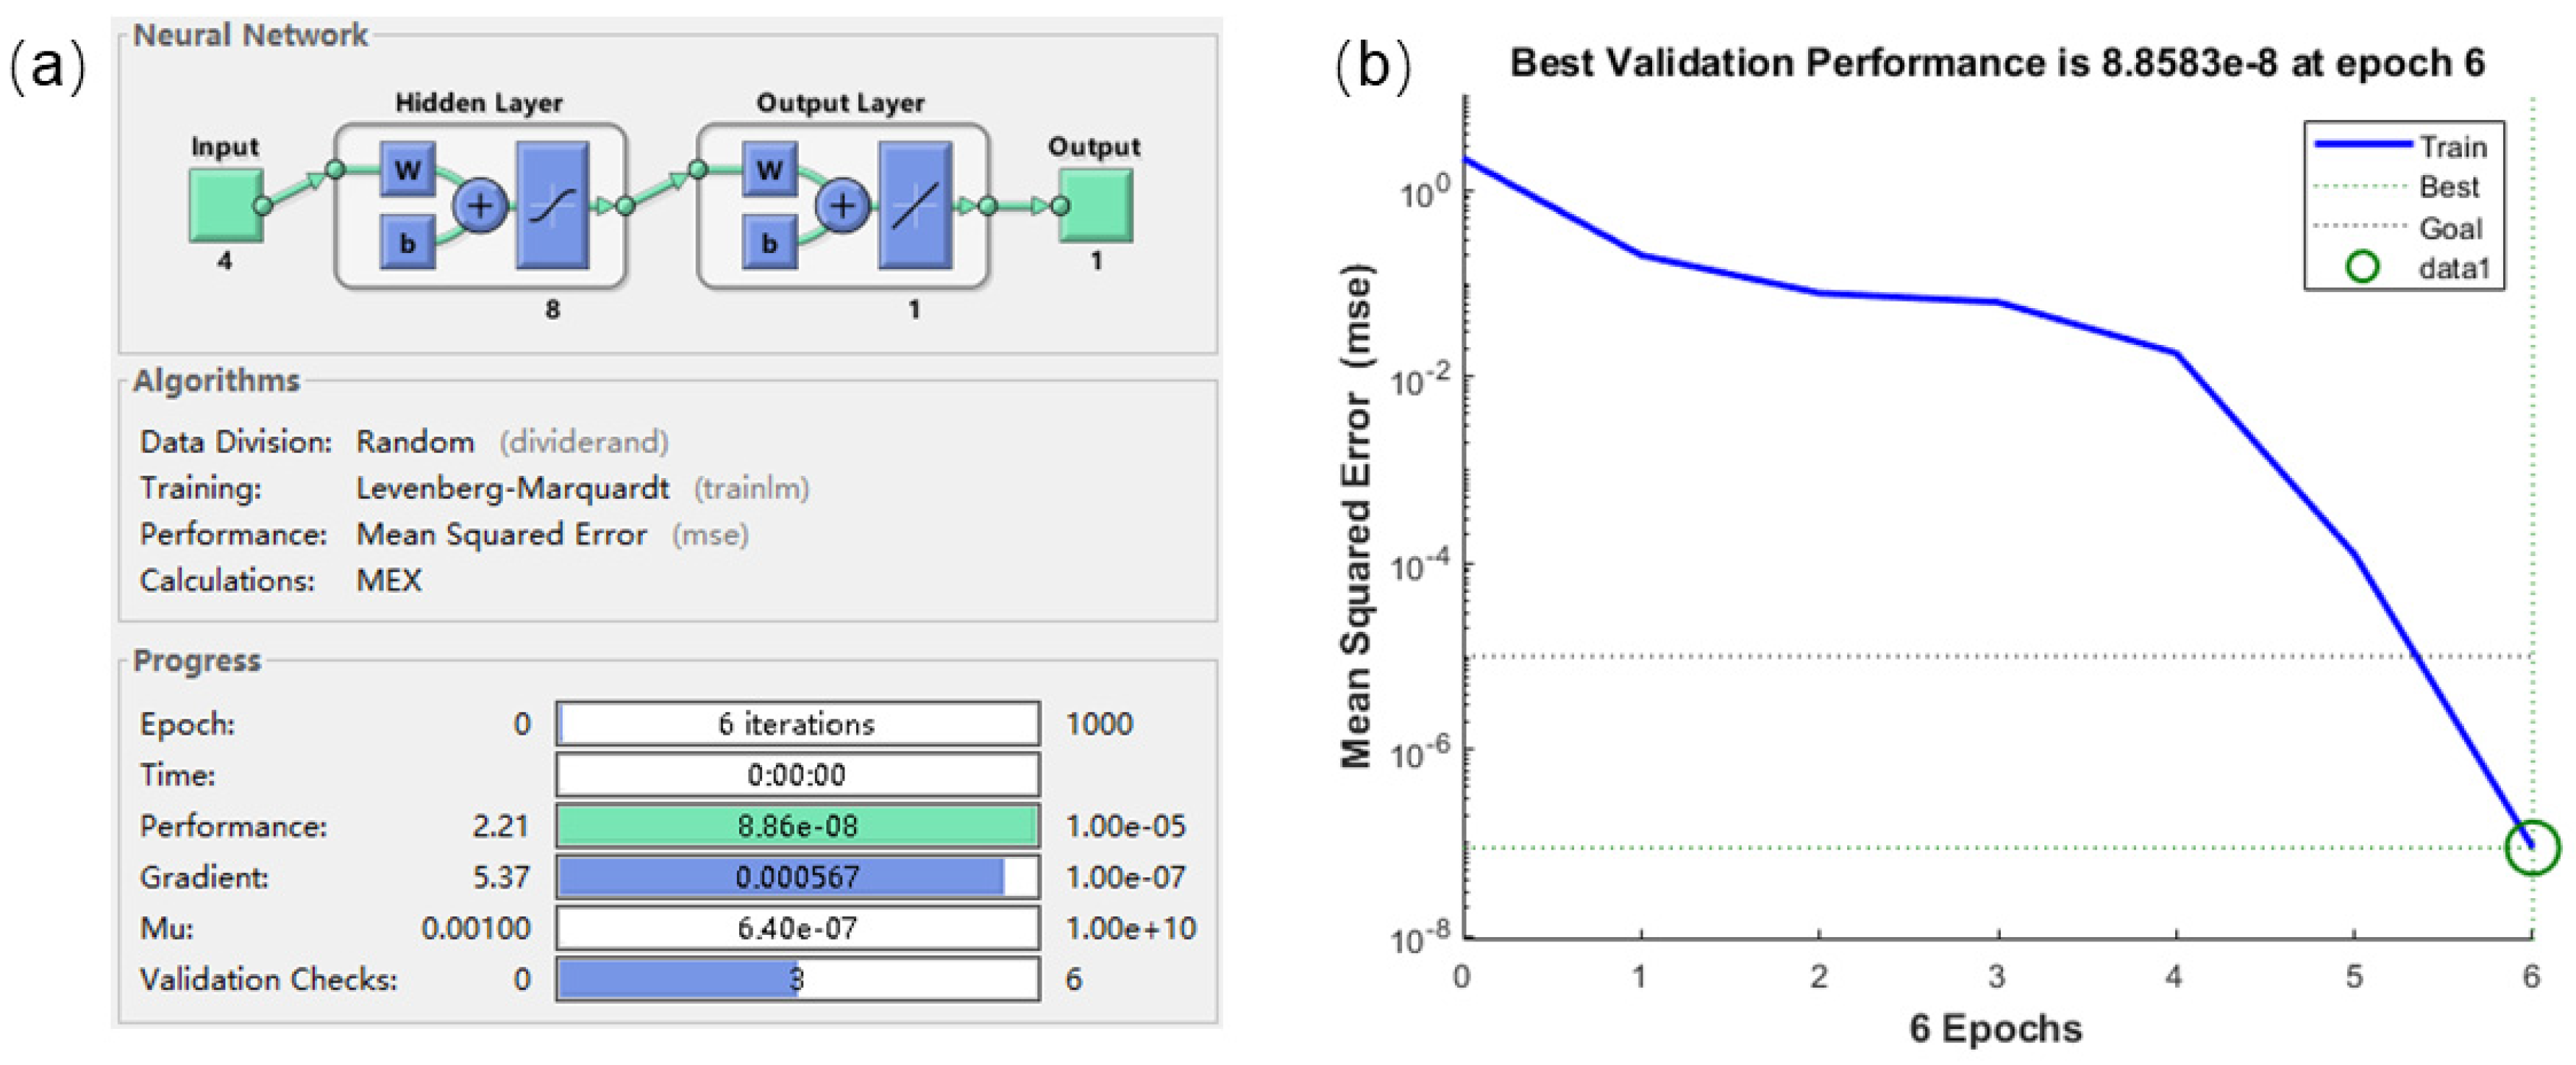
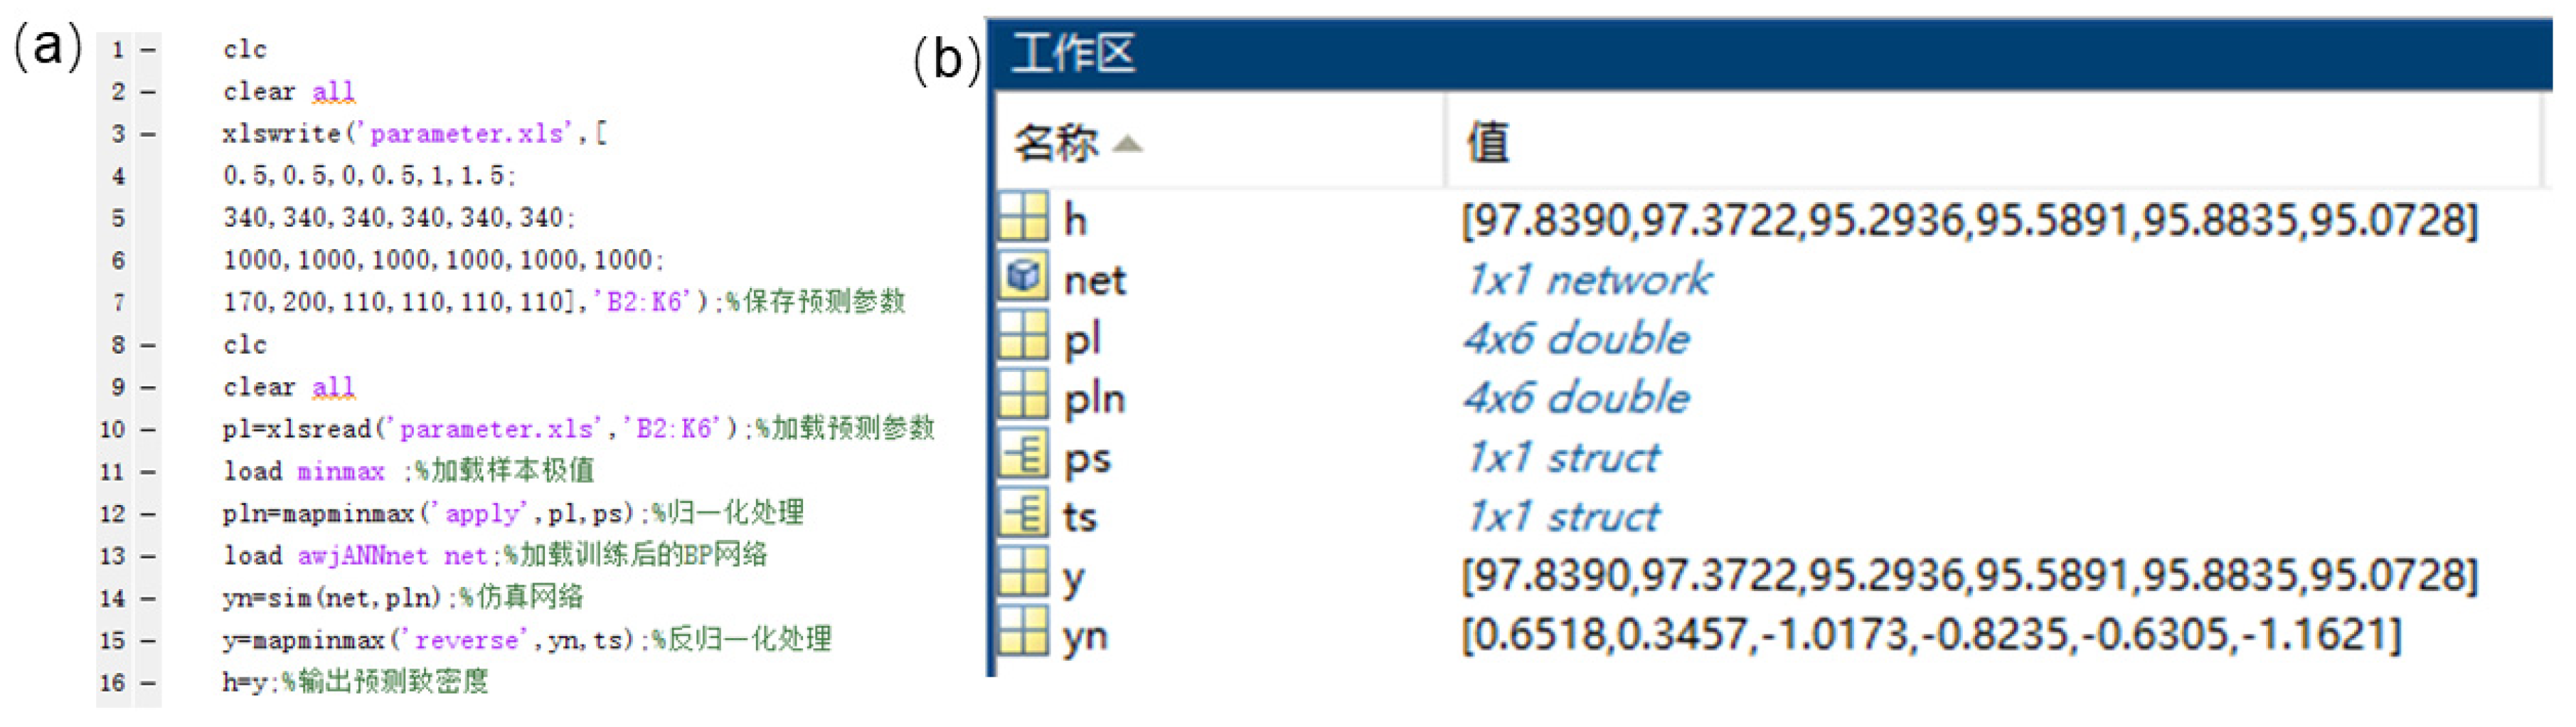
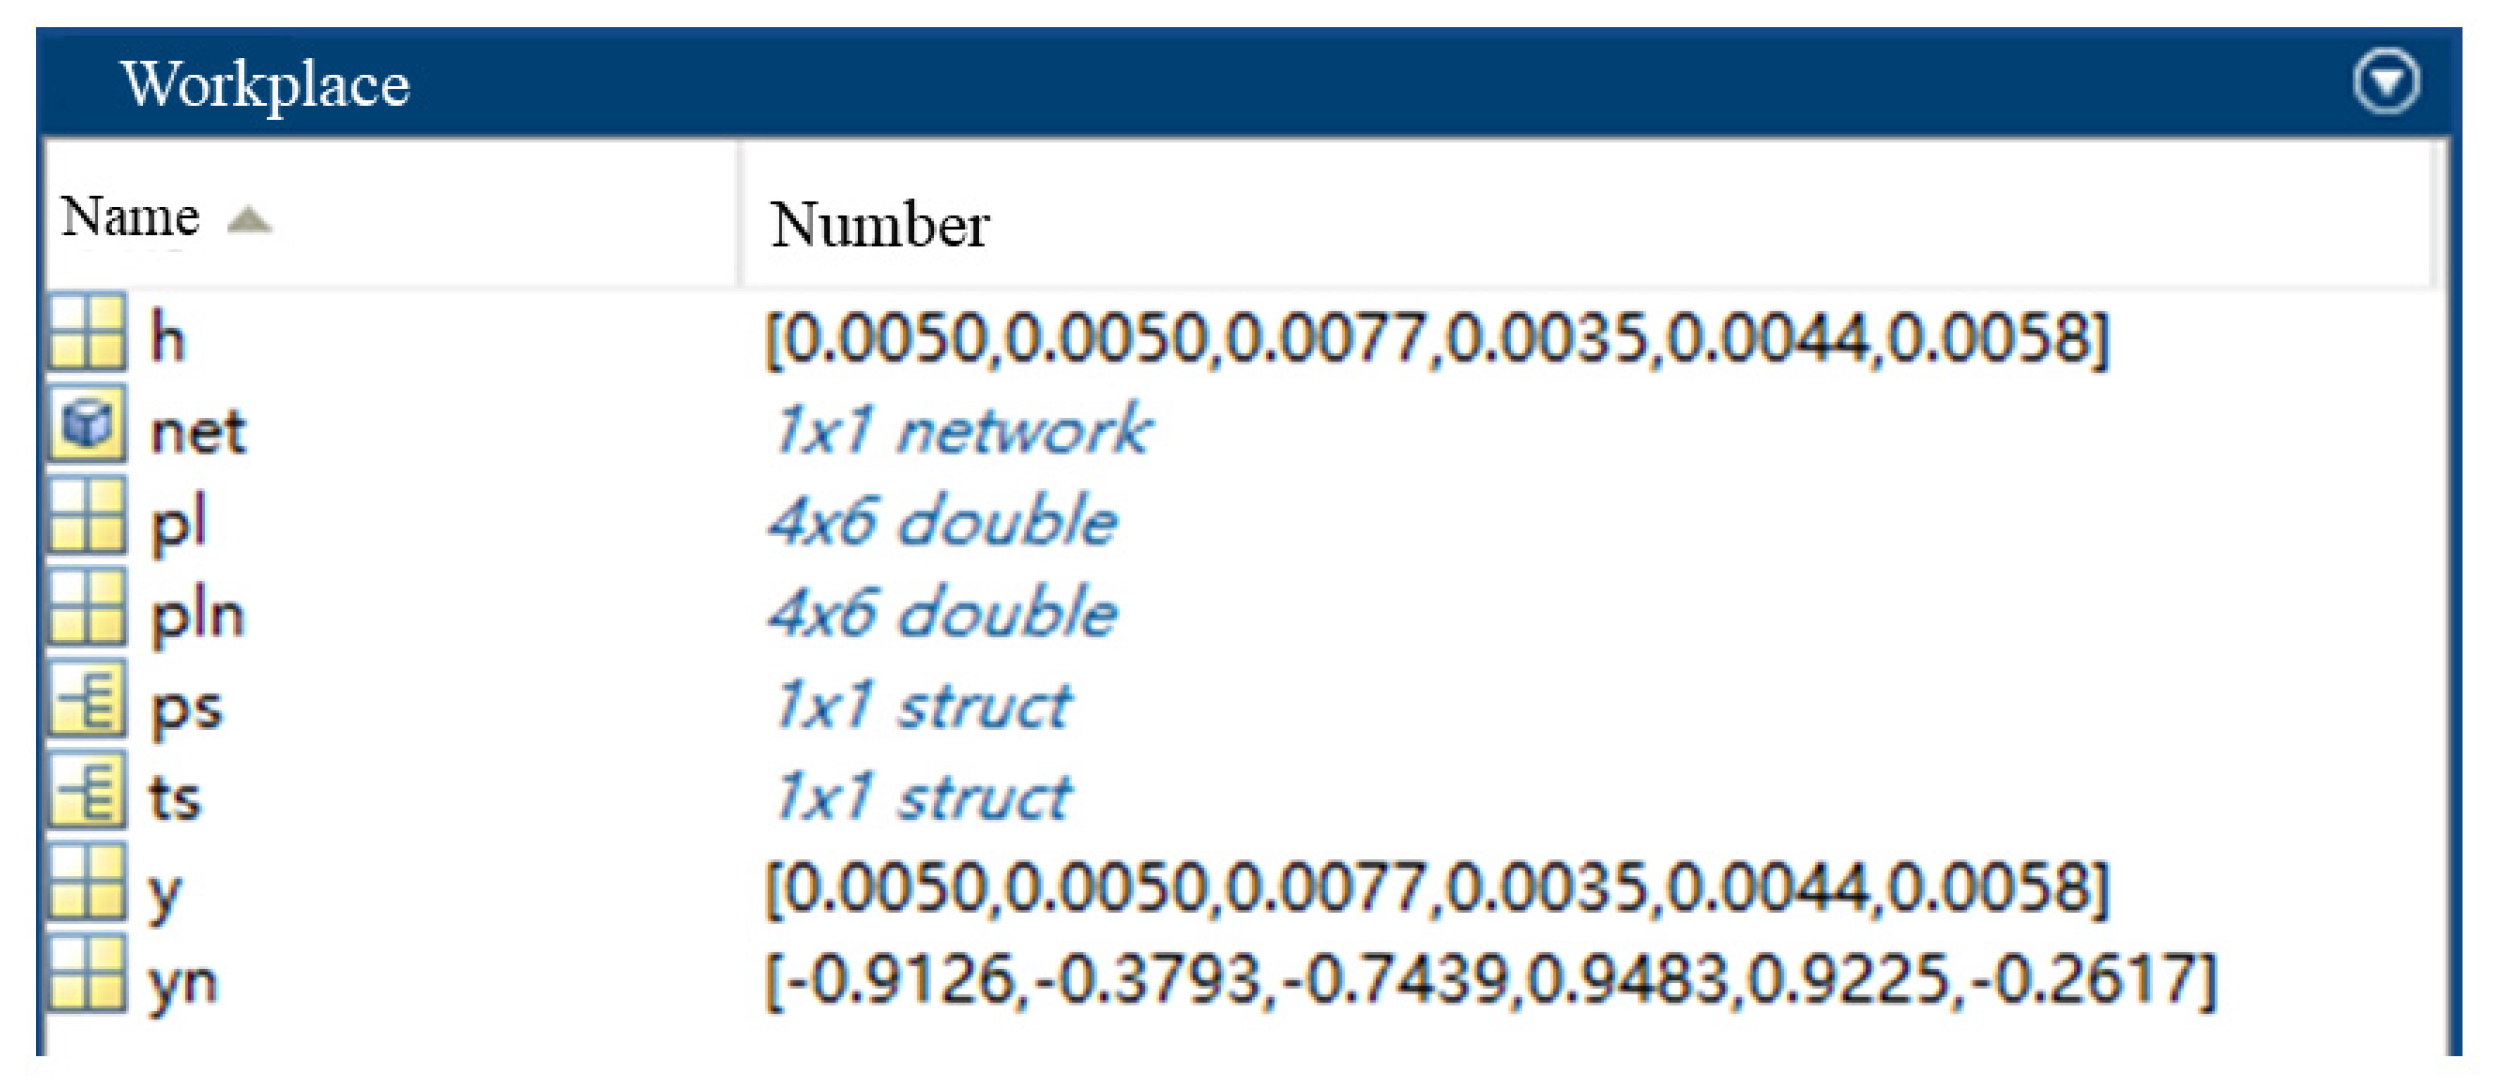
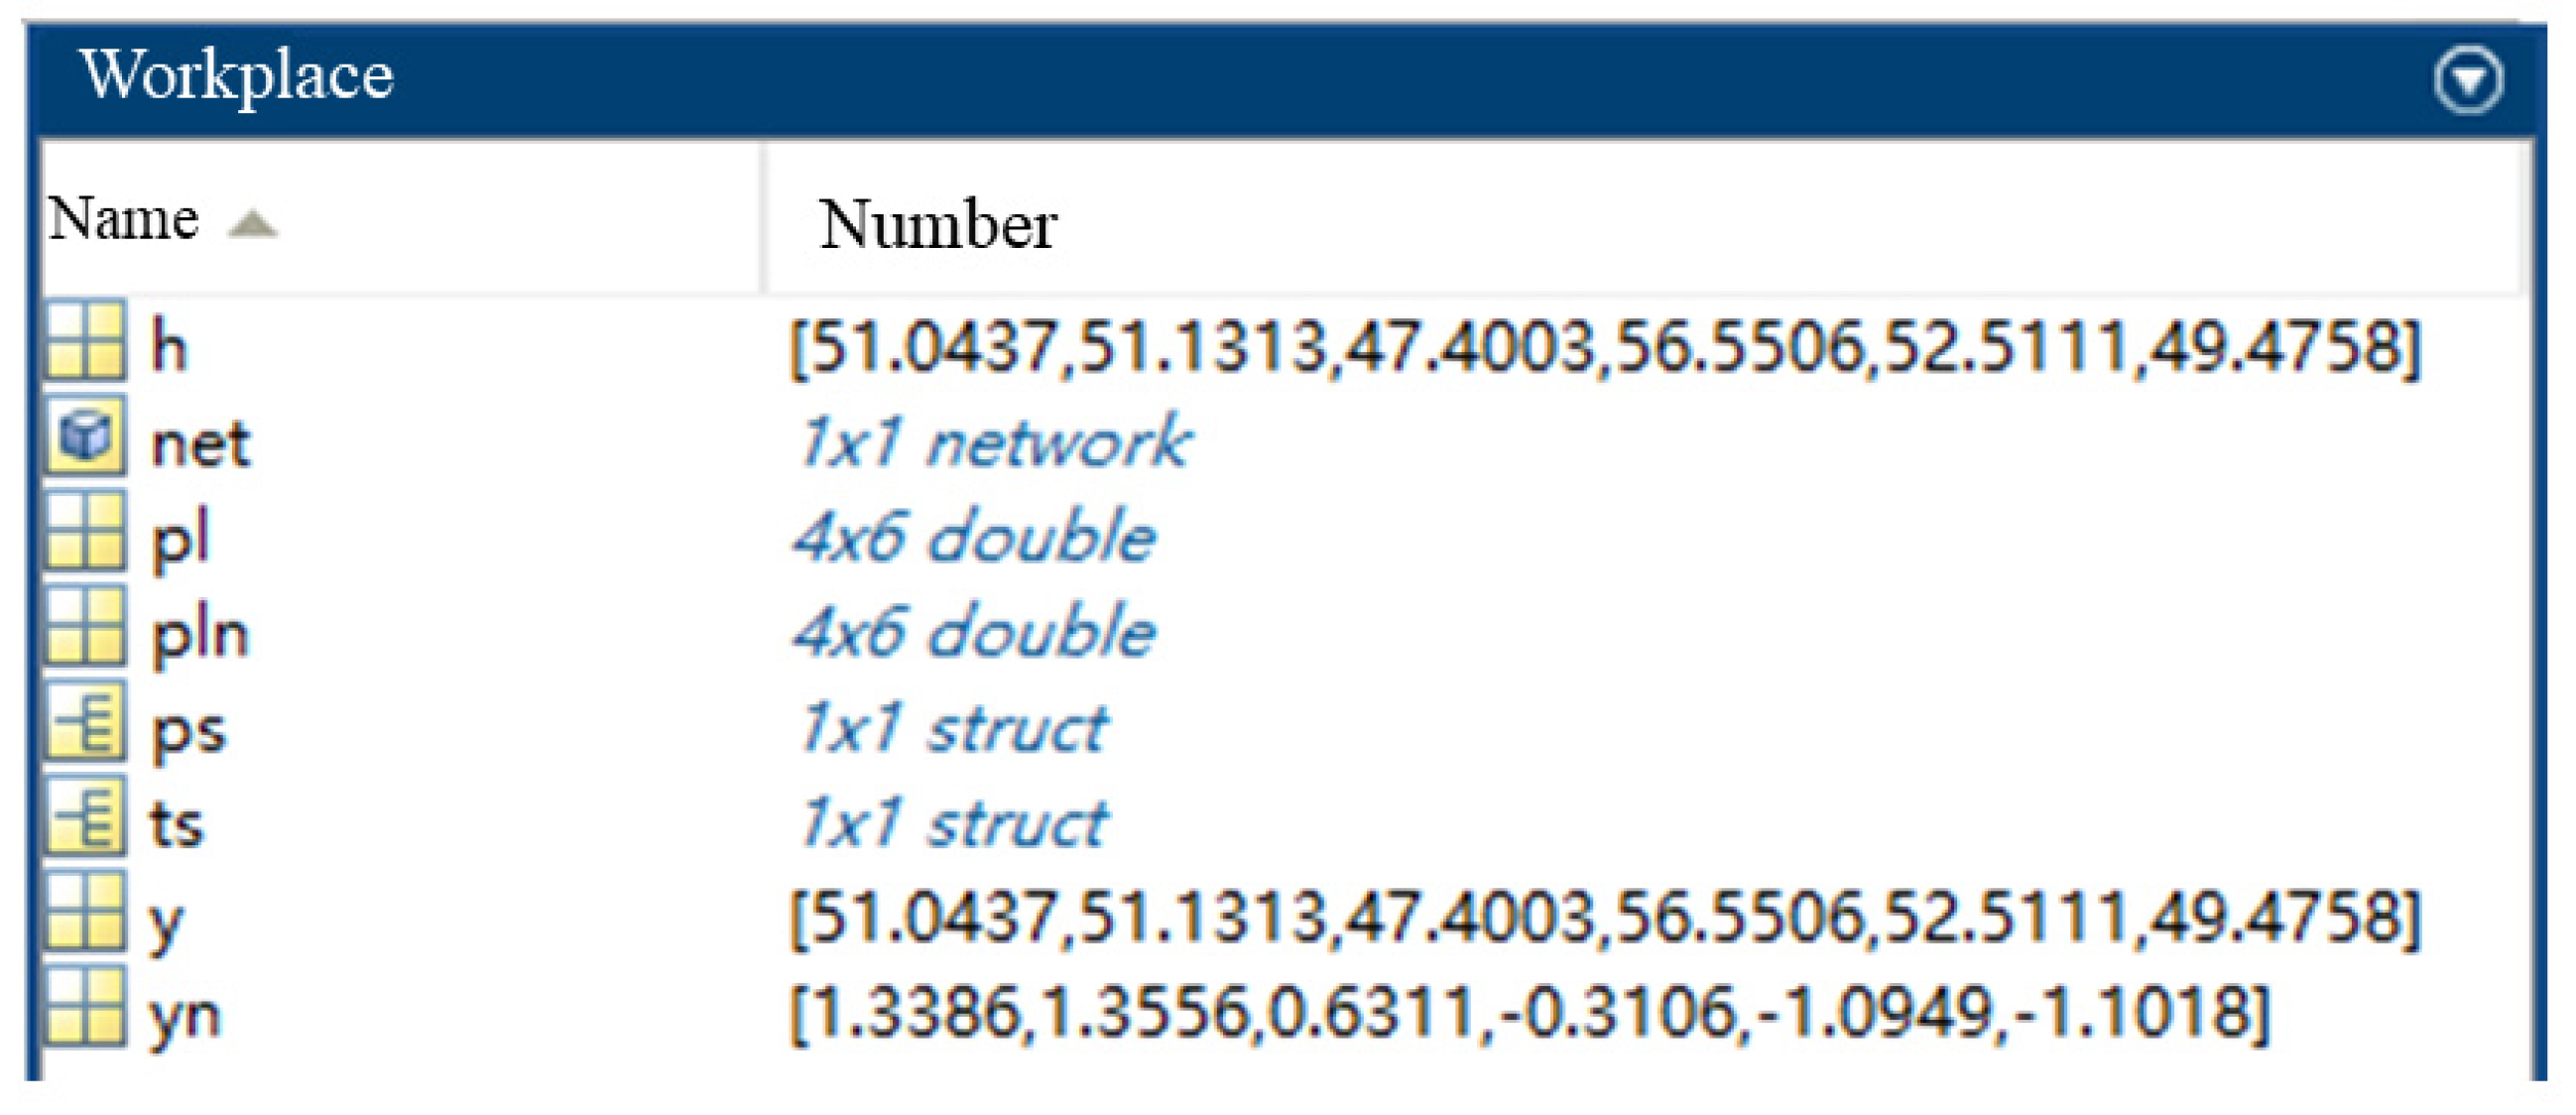
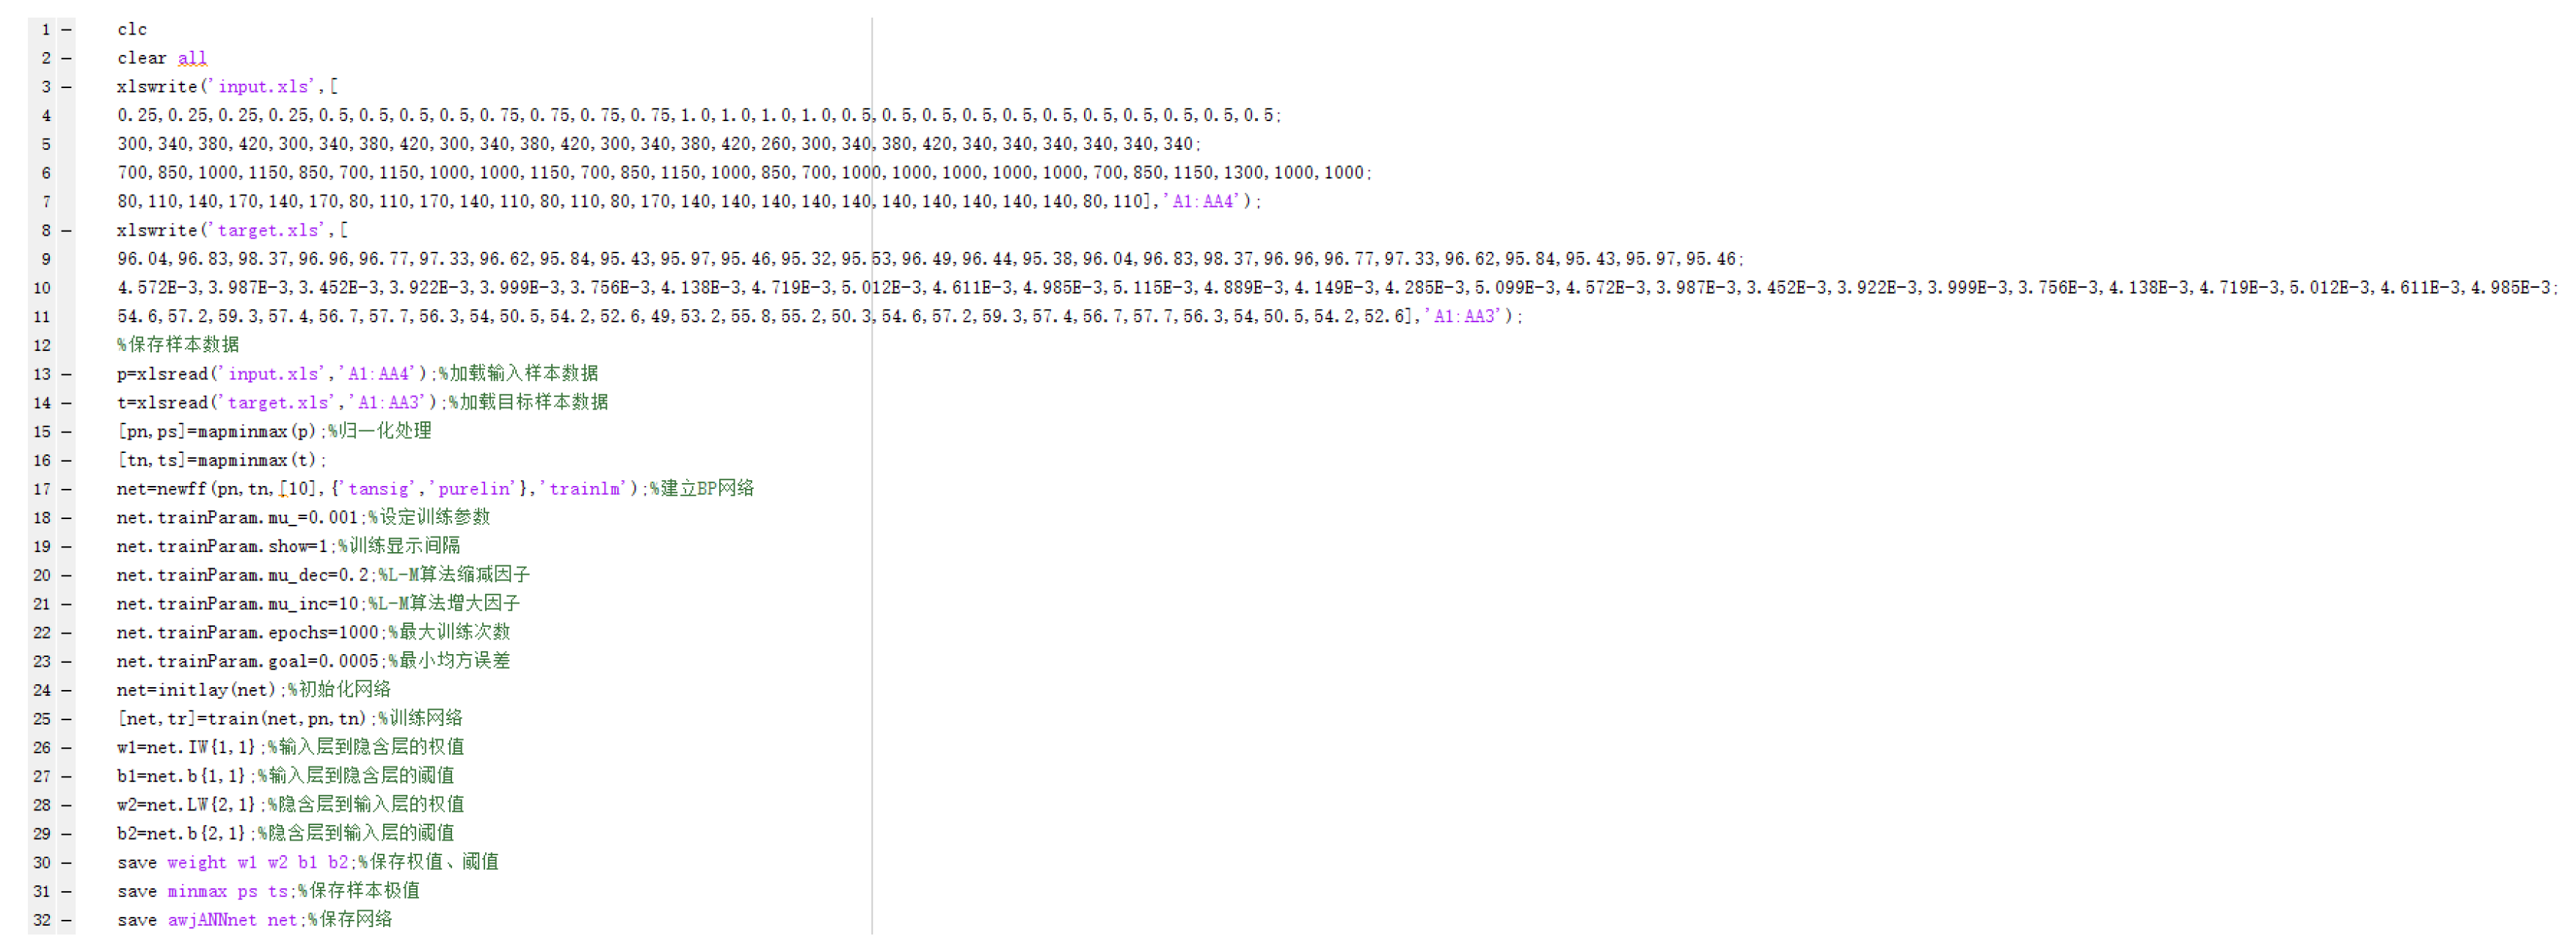
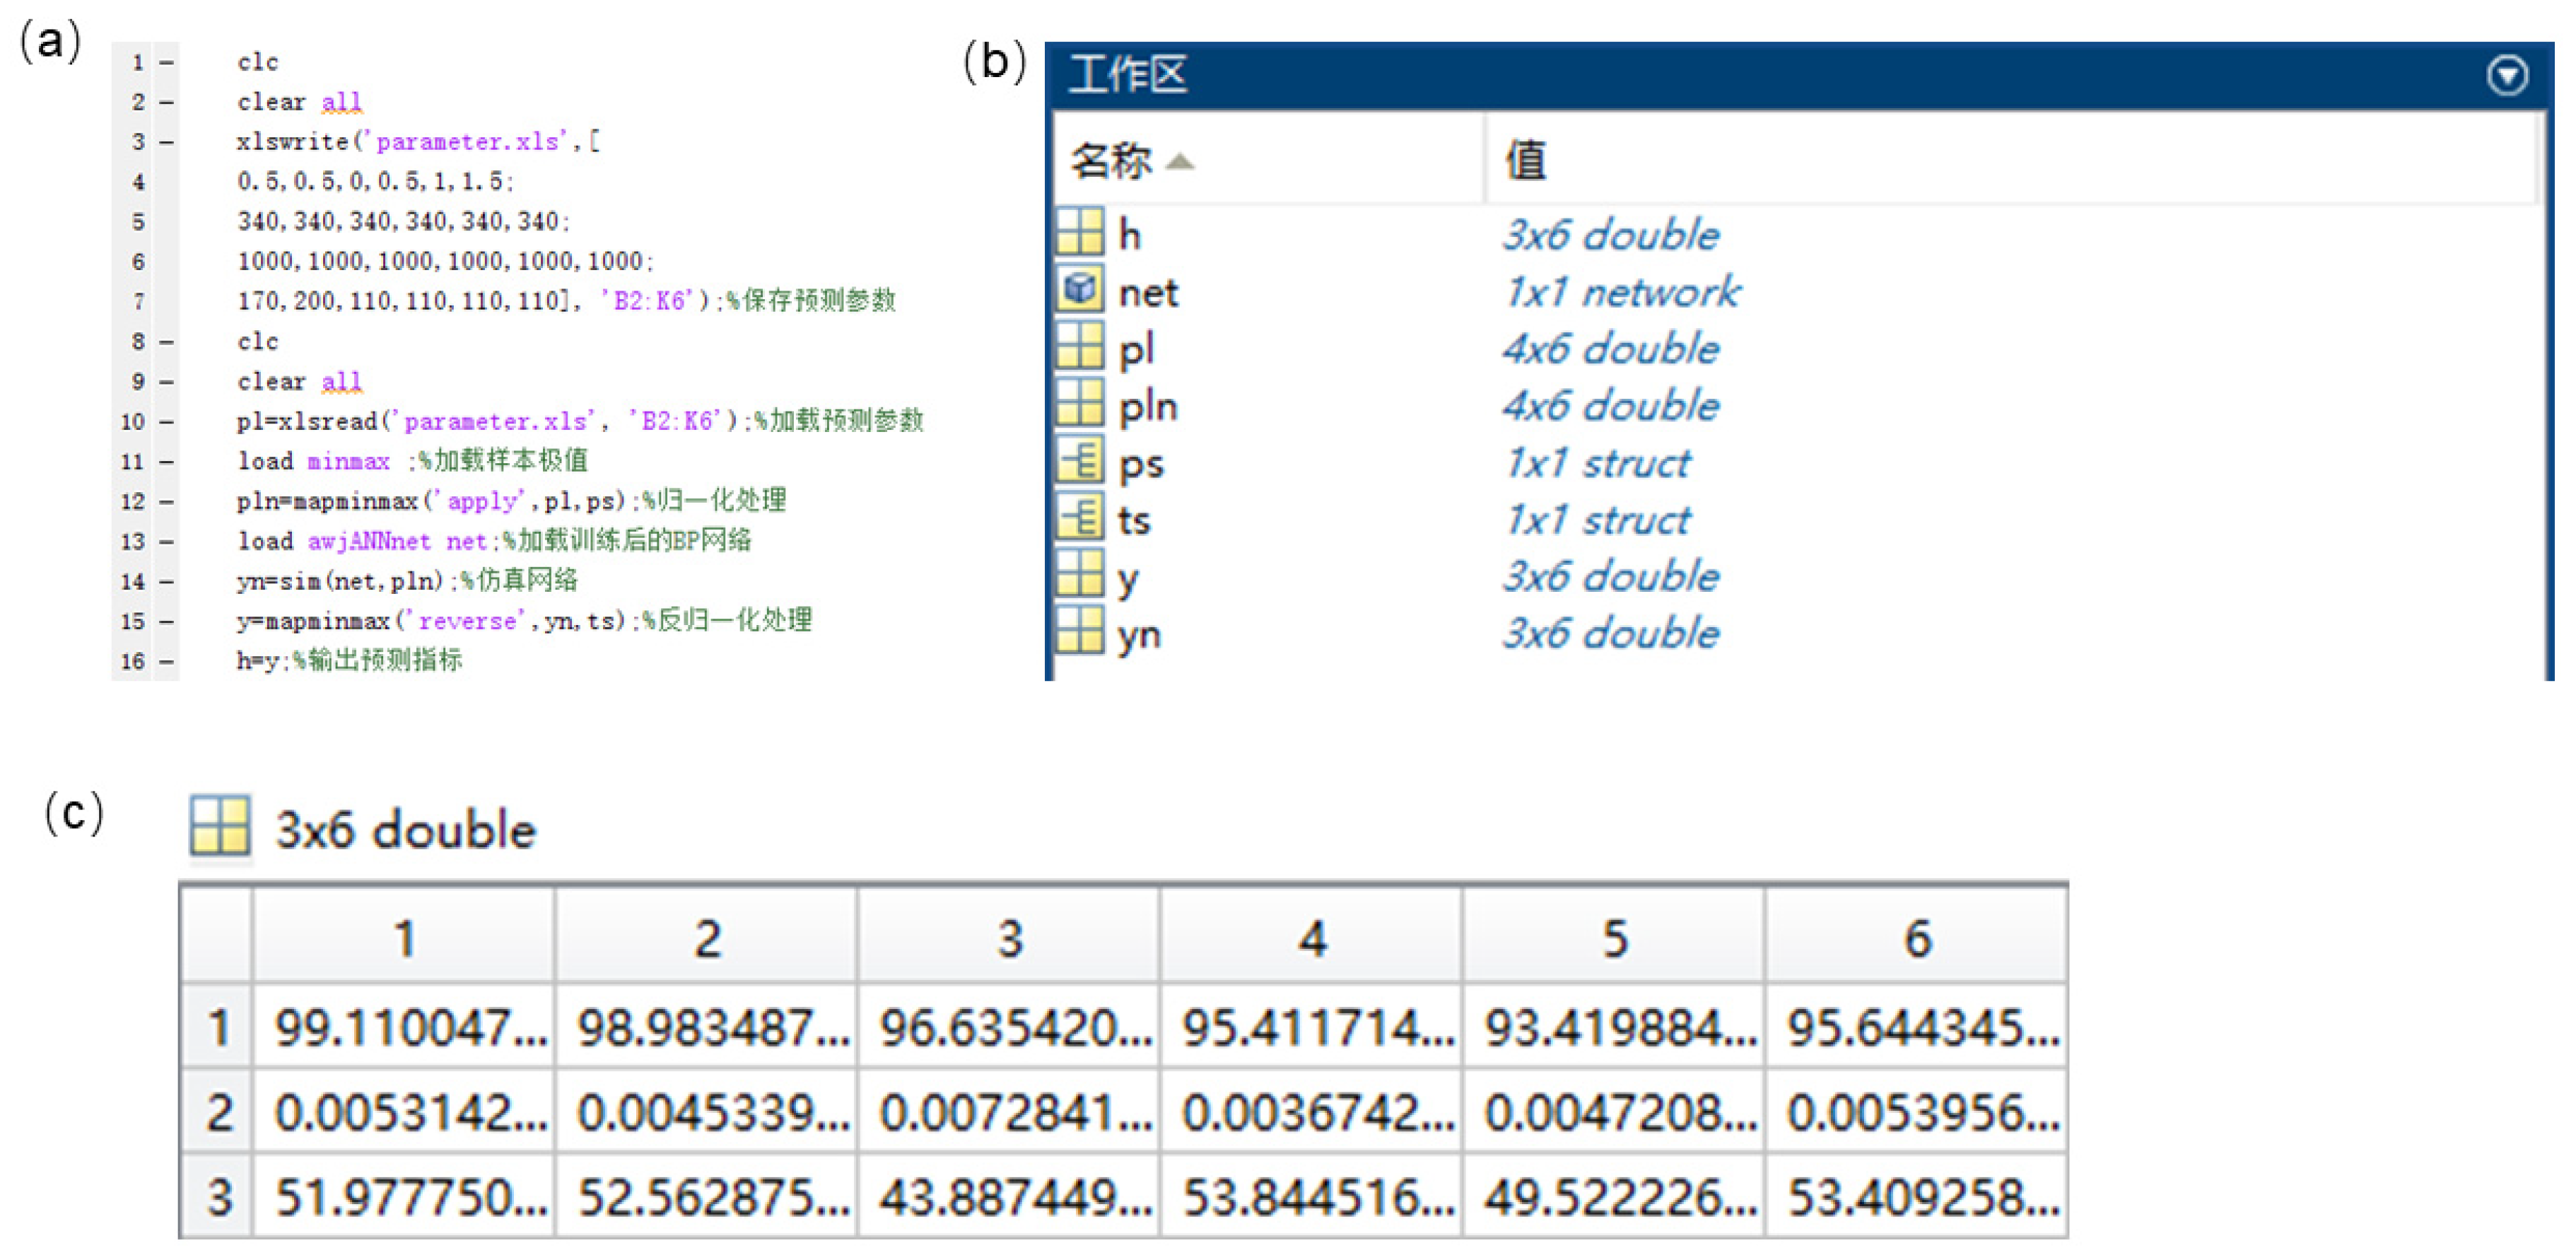
3.1. MATLAB Implementation of Network Models

MATLAB 2016 is a robust scientific computer software renowned for its proficiency in data processing. It is widely used in multiple fields, such as algorithm creation, data analysis, and numerical calculation. MATLAB is highly effective for constructing, training, and simulating neural networks. It provides an incredibly efficient implementation strategy.
When choosing training algorithms for BP neural networks, various improved algorithms have been created to meet specific requirements and characteristics of different application scenarios, in addition to the frequently employed and fundamental steepest descent strategy. The Levenberg–Marquardt (trainlm) technique is used as the training algorithm for this network since it can circumvent the need for direct computation of the Hessian matrix. This algorithm exhibits rapid convergence and superior computational precision, rendering it well suited for the design characteristics and requirements of this network model. Setting the initial weights in a suitable manner can decrease the time required for training, accelerate the pace of training, and improve the sensitivity of the network. Generally, it is recommended to apply smaller values for the connection weights of the hidden layer, whereas the connection weights of the output layer should be evenly distributed between positive and negative weights. MATLAB offers the initlay function to initialize the weights.
a. Density-causing network training results and model validation
Based on the previous analysis, the first 27 sets of process parameters and their corresponding densification data in Table 3 were used as samples for training, and the network learning training procedure designed and executed using MATLAB shown in Figure 5.
Figure 6 illustrates the outcomes of the densitometric network training. By examining the training process in Figure 6a, it is evident that the training error was measured using the mean square error and the training technique employed was the trainlm algorithm. After undergoing six rounds, the neural network’s error was decreased to 8.86 × 10⁻⁸, a value far lower than the predetermined goal error level of 0.00001. This clearly showcased the algorithm’s impressive iterative capabilities. The error curve of the neural network across six iterations is depicted in Figure 6b, illustrating a progressive decrease in error as the iterations proceeded.
In order to test the reliability of the above densification prediction model, the last six sets of process parameters and the corresponding densification data in Table 3 were selected as the validation dataset. Figure 7a shows the MATLAB validation procedure, and Figure 7b shows the model prediction output.
The results of the BP neural network densification prediction model were compared with the last four sets of densification experimental data in Table 4 to obtain Table 6:
The data analysis of the table above revealed that the BP neural network model developed in this study accurately predicted the densities of aluminum anodes created by laser melting in a specific region. The model achieved a relative error of less than 3% when comparing the projected values to the experimental values. Given the scarcity of experimental data, the restricted scope of chosen processing parameters, and the potential for mistakes in the operation and measurement procedures, a margin of error of 3% was deemed acceptable. In other words, the model could be relied upon to accurately forecast density. Furthermore, the subsequent sections focus on predicting and analyzing the material’s corrosion resistance and discharge performance.
b. Network training results and model validation for corrosion resistance performance
The corrosion resistance of samples produced through laser melting of components is assessed by measuring the corrosion potential, self-corrosion current, and the magnitude of the polarization resistance value. This study employed the self-corrosion current to assess the corrosion resistance of a particular zone of the laser-melted aluminum matrix composite aluminum anodes. Based on the preceding analysis, we chose the initial 27 sets of process parameters and their related self-corrosion current data from Table 3 as the sample dataset for training the neural network. The neural network design and the MATLAB learning and training techniques were identical to those outlined in the prior paper; hence, they will not be repeated here.
Figure 7 depicts the results of the corrosion resistance prediction network’s learning and training. The inaccuracy during the training process was quantified using the mean square deviation, and the trainlm method was used for training. Upon analyzing the training process illustrated in Figure 8a, it is clear that the error of the neural network decreased to 3.52 × 10⁻¹⁰ after seven iterations. The number was much below the intended aim error of 0.00001. Figure 8b depicts the decreasing trend of the error curve of the neural network throughout seven iterations.
To validate the reliability of the corrosion resistance prediction model mentioned earlier, the last four sets of process parameters and their corresponding self-corrosion current data from Table 3 were utilized. The prediction model, developed using MATLAB, yielded the following results as shown in Figure 9.
The results of the BP neural network prediction model were compared with the last six sets of experimental results of self-corrosion currents in Table 4 to obtain Table 7.
The data analysis of the table above indicates that the BP neural network model created in this study effectively forecasted the self-corrosion current in selective laser melting and forming of aluminum matrix composite anodes. The maximum relative error between the predicted and experimental values was 4%. In light of the limitations imposed by the restricted trials and the possibility of errors in the operation and measurement technique, a tolerance of 4% was considered acceptable in this particular situation. Thus, the model could be considered reliable for estimating the self-corrosion current.
c. Network training results and model validation for discharge performance
This study employed anode utilization as a method to evaluate the discharge efficiency of anodes for specific laser-melted aluminum matrix composites. The preliminary study resulted in the selection of the first 27 sets of process parameters and their related anode utilization statistics from Table 4 as the sample dataset for training the neural network. The architecture of the neural network and the training methodology in MATLAB were analogous to the technique depicted in Figure 5.
Figure 10 depicts the comprehensive training procedure of the discharge performance network model. Figure 10a shows that the model reached the target error level after six iterations of the trainlm procedure. Figure 10b illustrates the declining pattern of the neural network in acquiring knowledge of the training error.
To validate the discharge performance prediction model discussed earlier, the final four sets of process parameters in Table 3 and their related anode use data were utilized. The MATLAB output results are presented in Figure 11.
The results of the BP neural network discharge performance prediction model were compared with the last six sets of experimental results in Table 4 to obtain Table 8:
The analysis of the data in the table above reveals that the BP neural network model, developed in this study for selective laser melting of aluminum anodes, had a relative error of less than 5% between its predicted and experimental values for predicting anode usage. Given the scarcity of experimental data and the potential for mistakes in the operation and measurement procedures, a 5% error range was deemed to be acceptably modest. This suggested that the model was dependable in its ability to forecast discharge performance.

3.2. SLM Multi-Performance Indicator Prediction Model Construction and Validation

The preceding section built a prediction model that relates SLM process parameters to a single performance indicator. By comparing the prediction results with experimental data, it was demonstrated that the prediction model constructed using a BP neural network is trustworthy. The performance of aluminum anodes in selective laser melting technology is mostly determined by their microstructure. There is a strong link between the densities of the anodes and their resistance to corrosion. Put simply, the microstructure of aluminum anodes is the fundamental factor that determines their performance. Density, corrosion resistance, and discharge performance are the observable characteristics that stem from the microstructure. Thus, when a single performance indicator is analyzed in isolation to create a prediction model, it might result in a significant margin of error, and the BP neural network does not equally comprehend many performance indicators. Hence, this work takes into account the three crucial performance indicators in a comprehensive manner to develop a prediction model for laser cladding, considering the impact of numerous parameters.

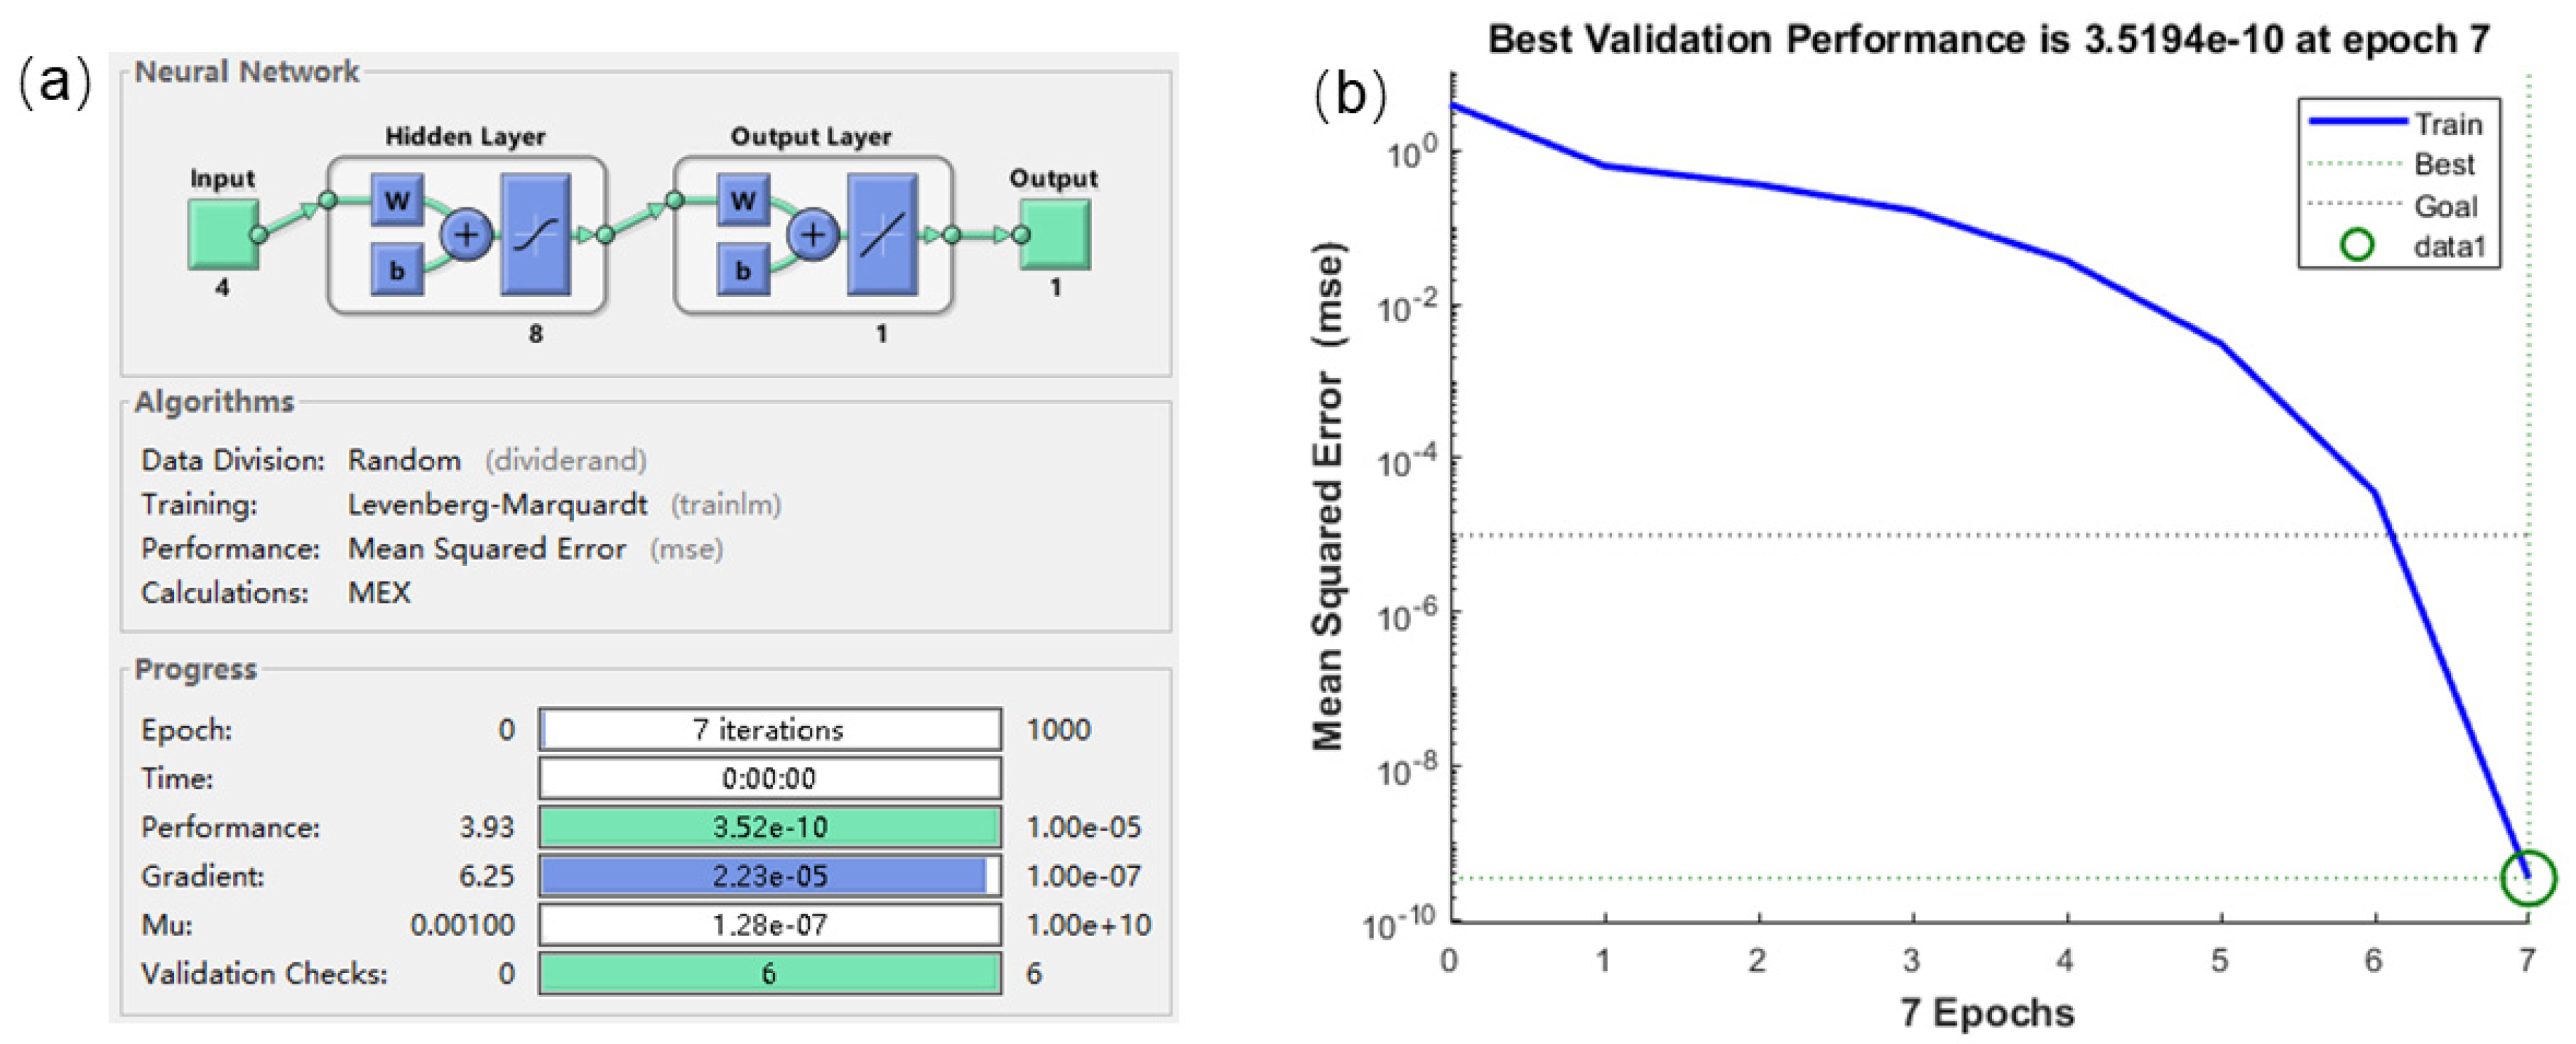
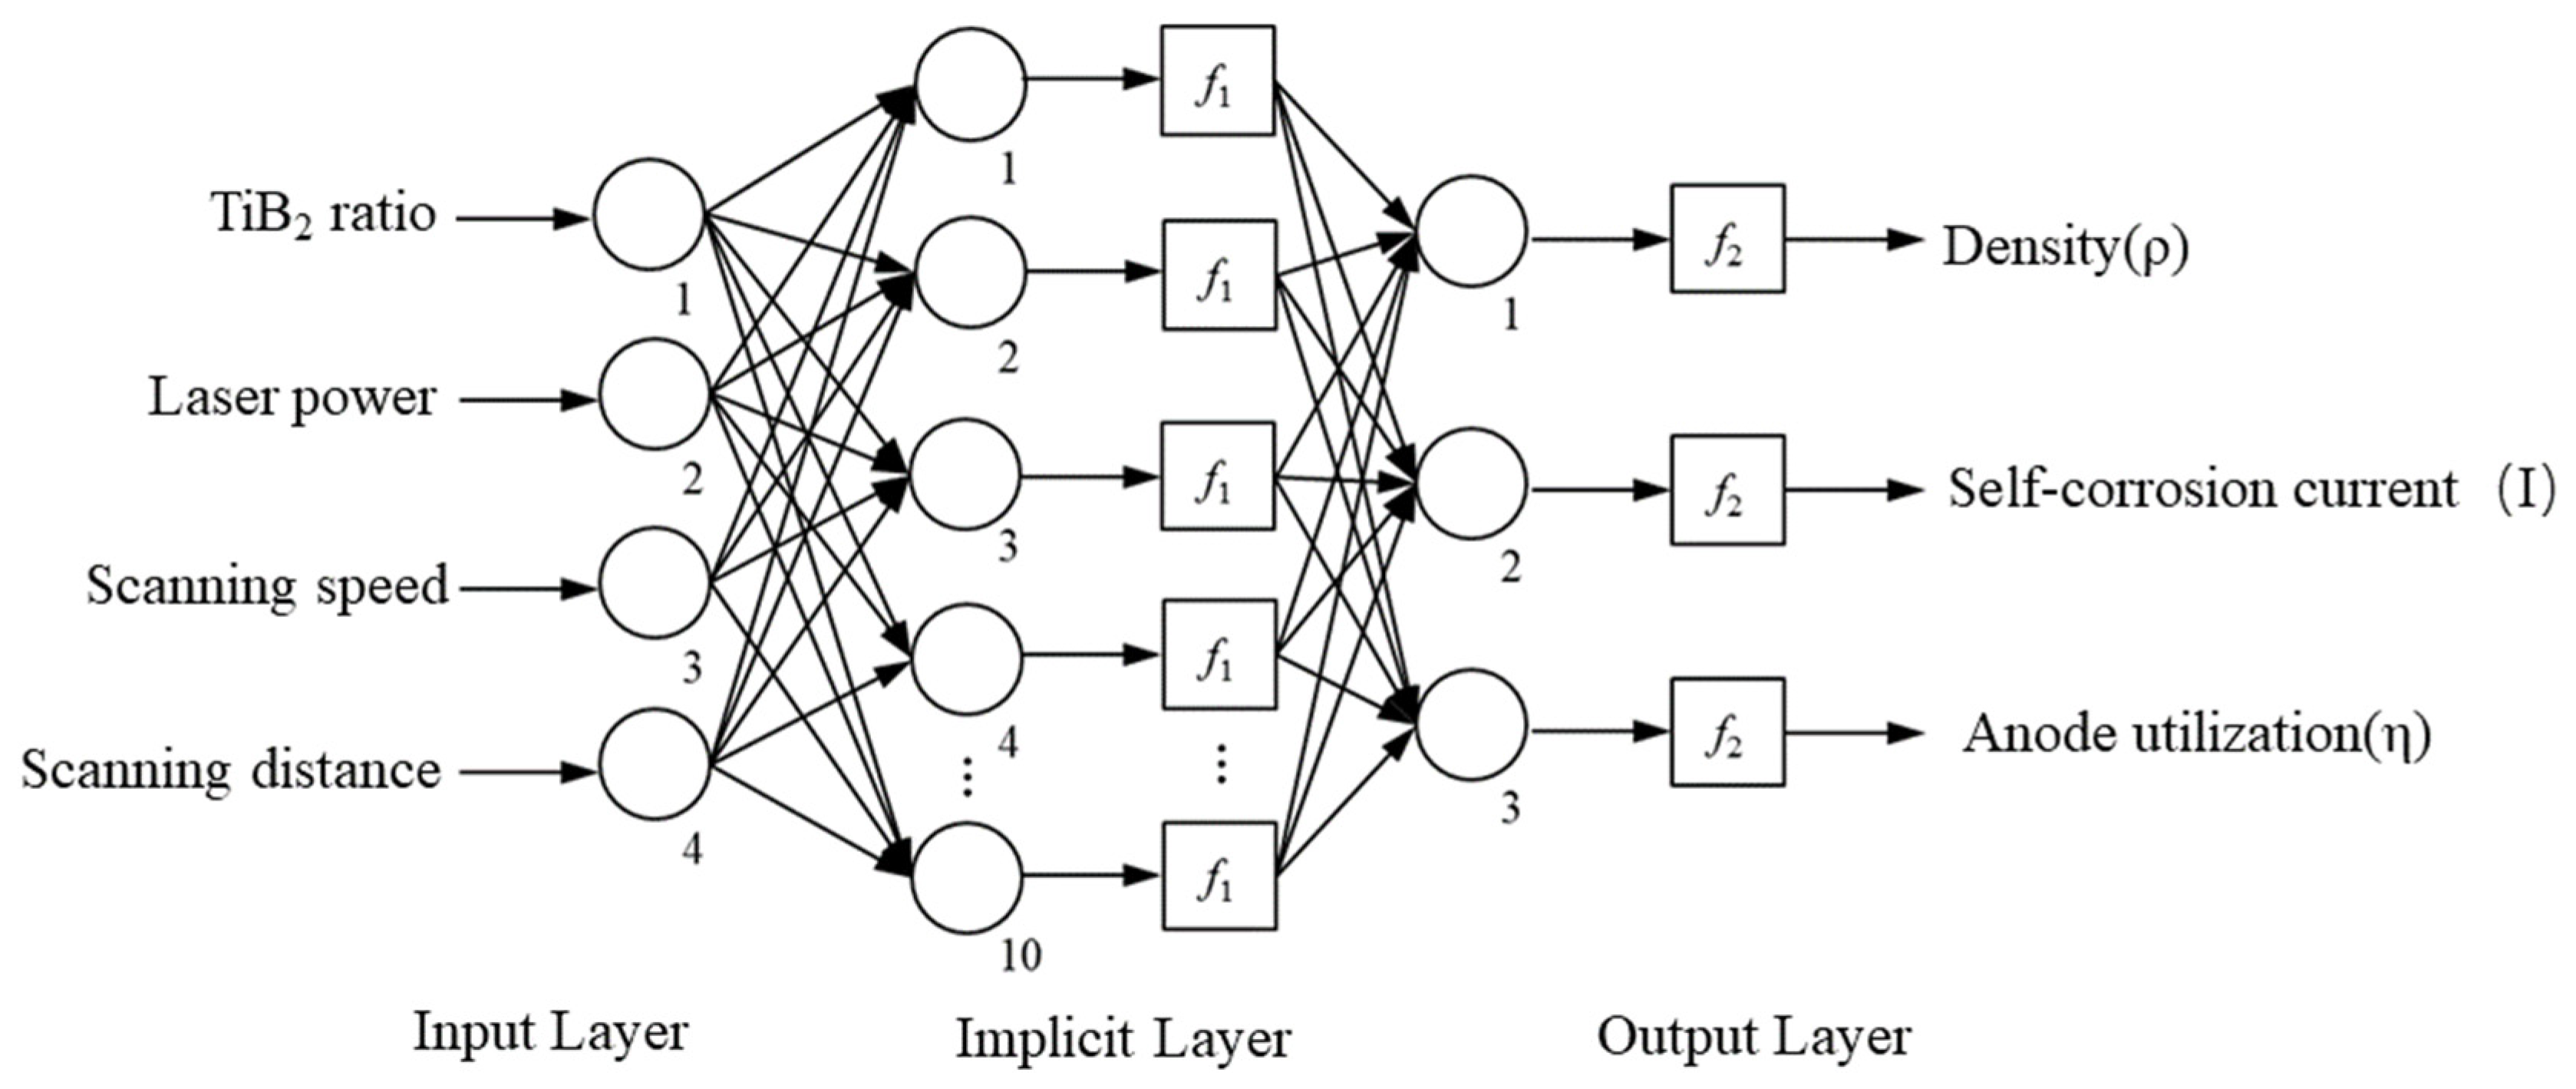
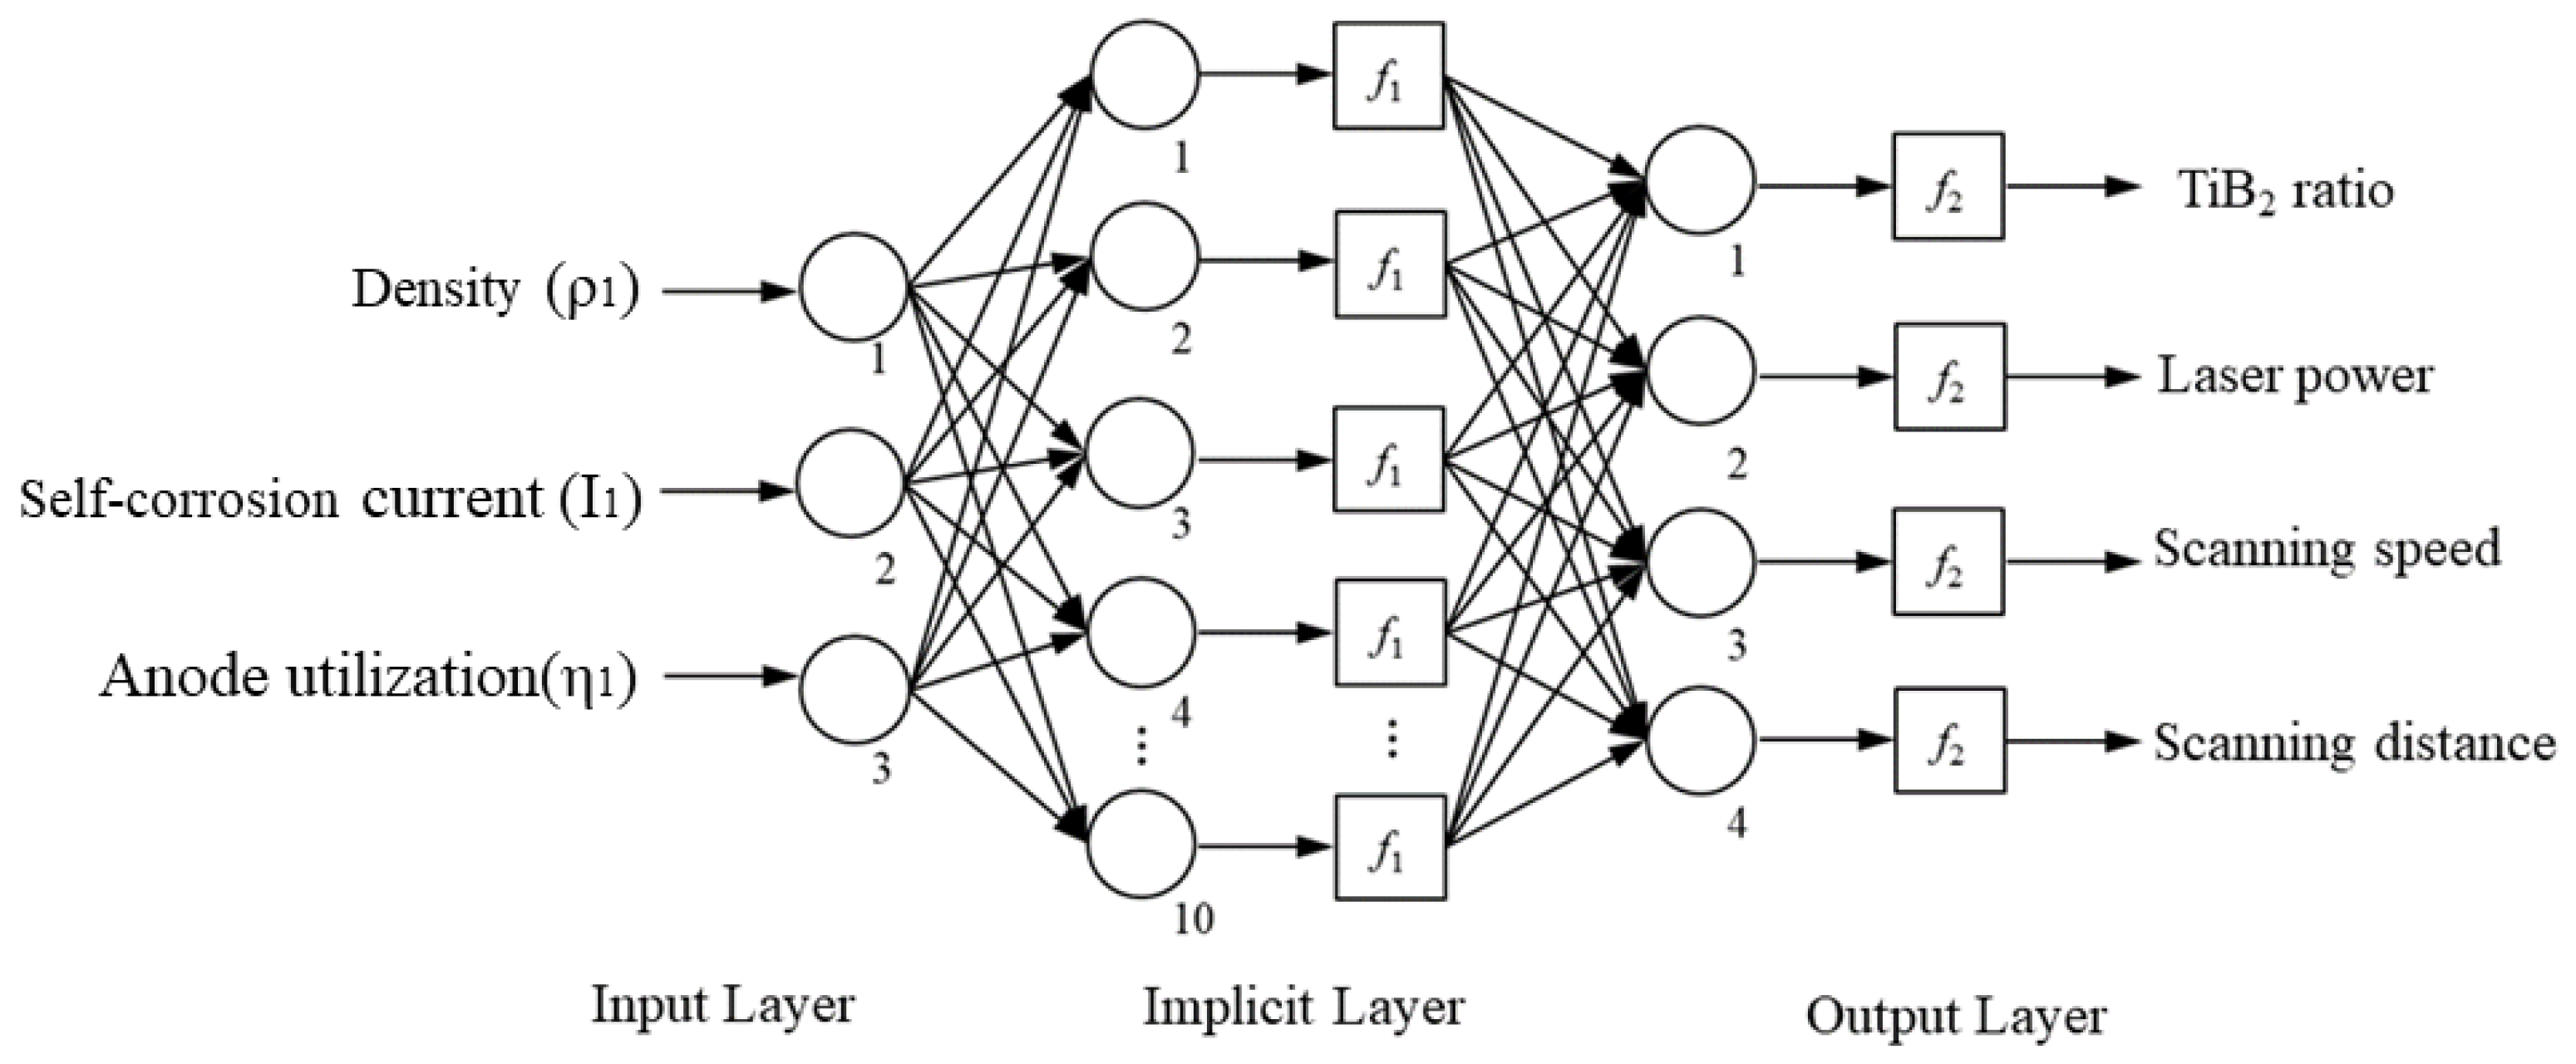
3.3. Construction of Neural Network Multi-Performance Indicator Prediction Model

Just like the analysis in Section 2, we considered four process parameters and three performance measures. According to Equation (1), we may deduce that the number of assumed layer nodes lay approximately within the range of 4 to 14. A value within the given range was chosen as the number of inferred layer nodes, specifically 10.

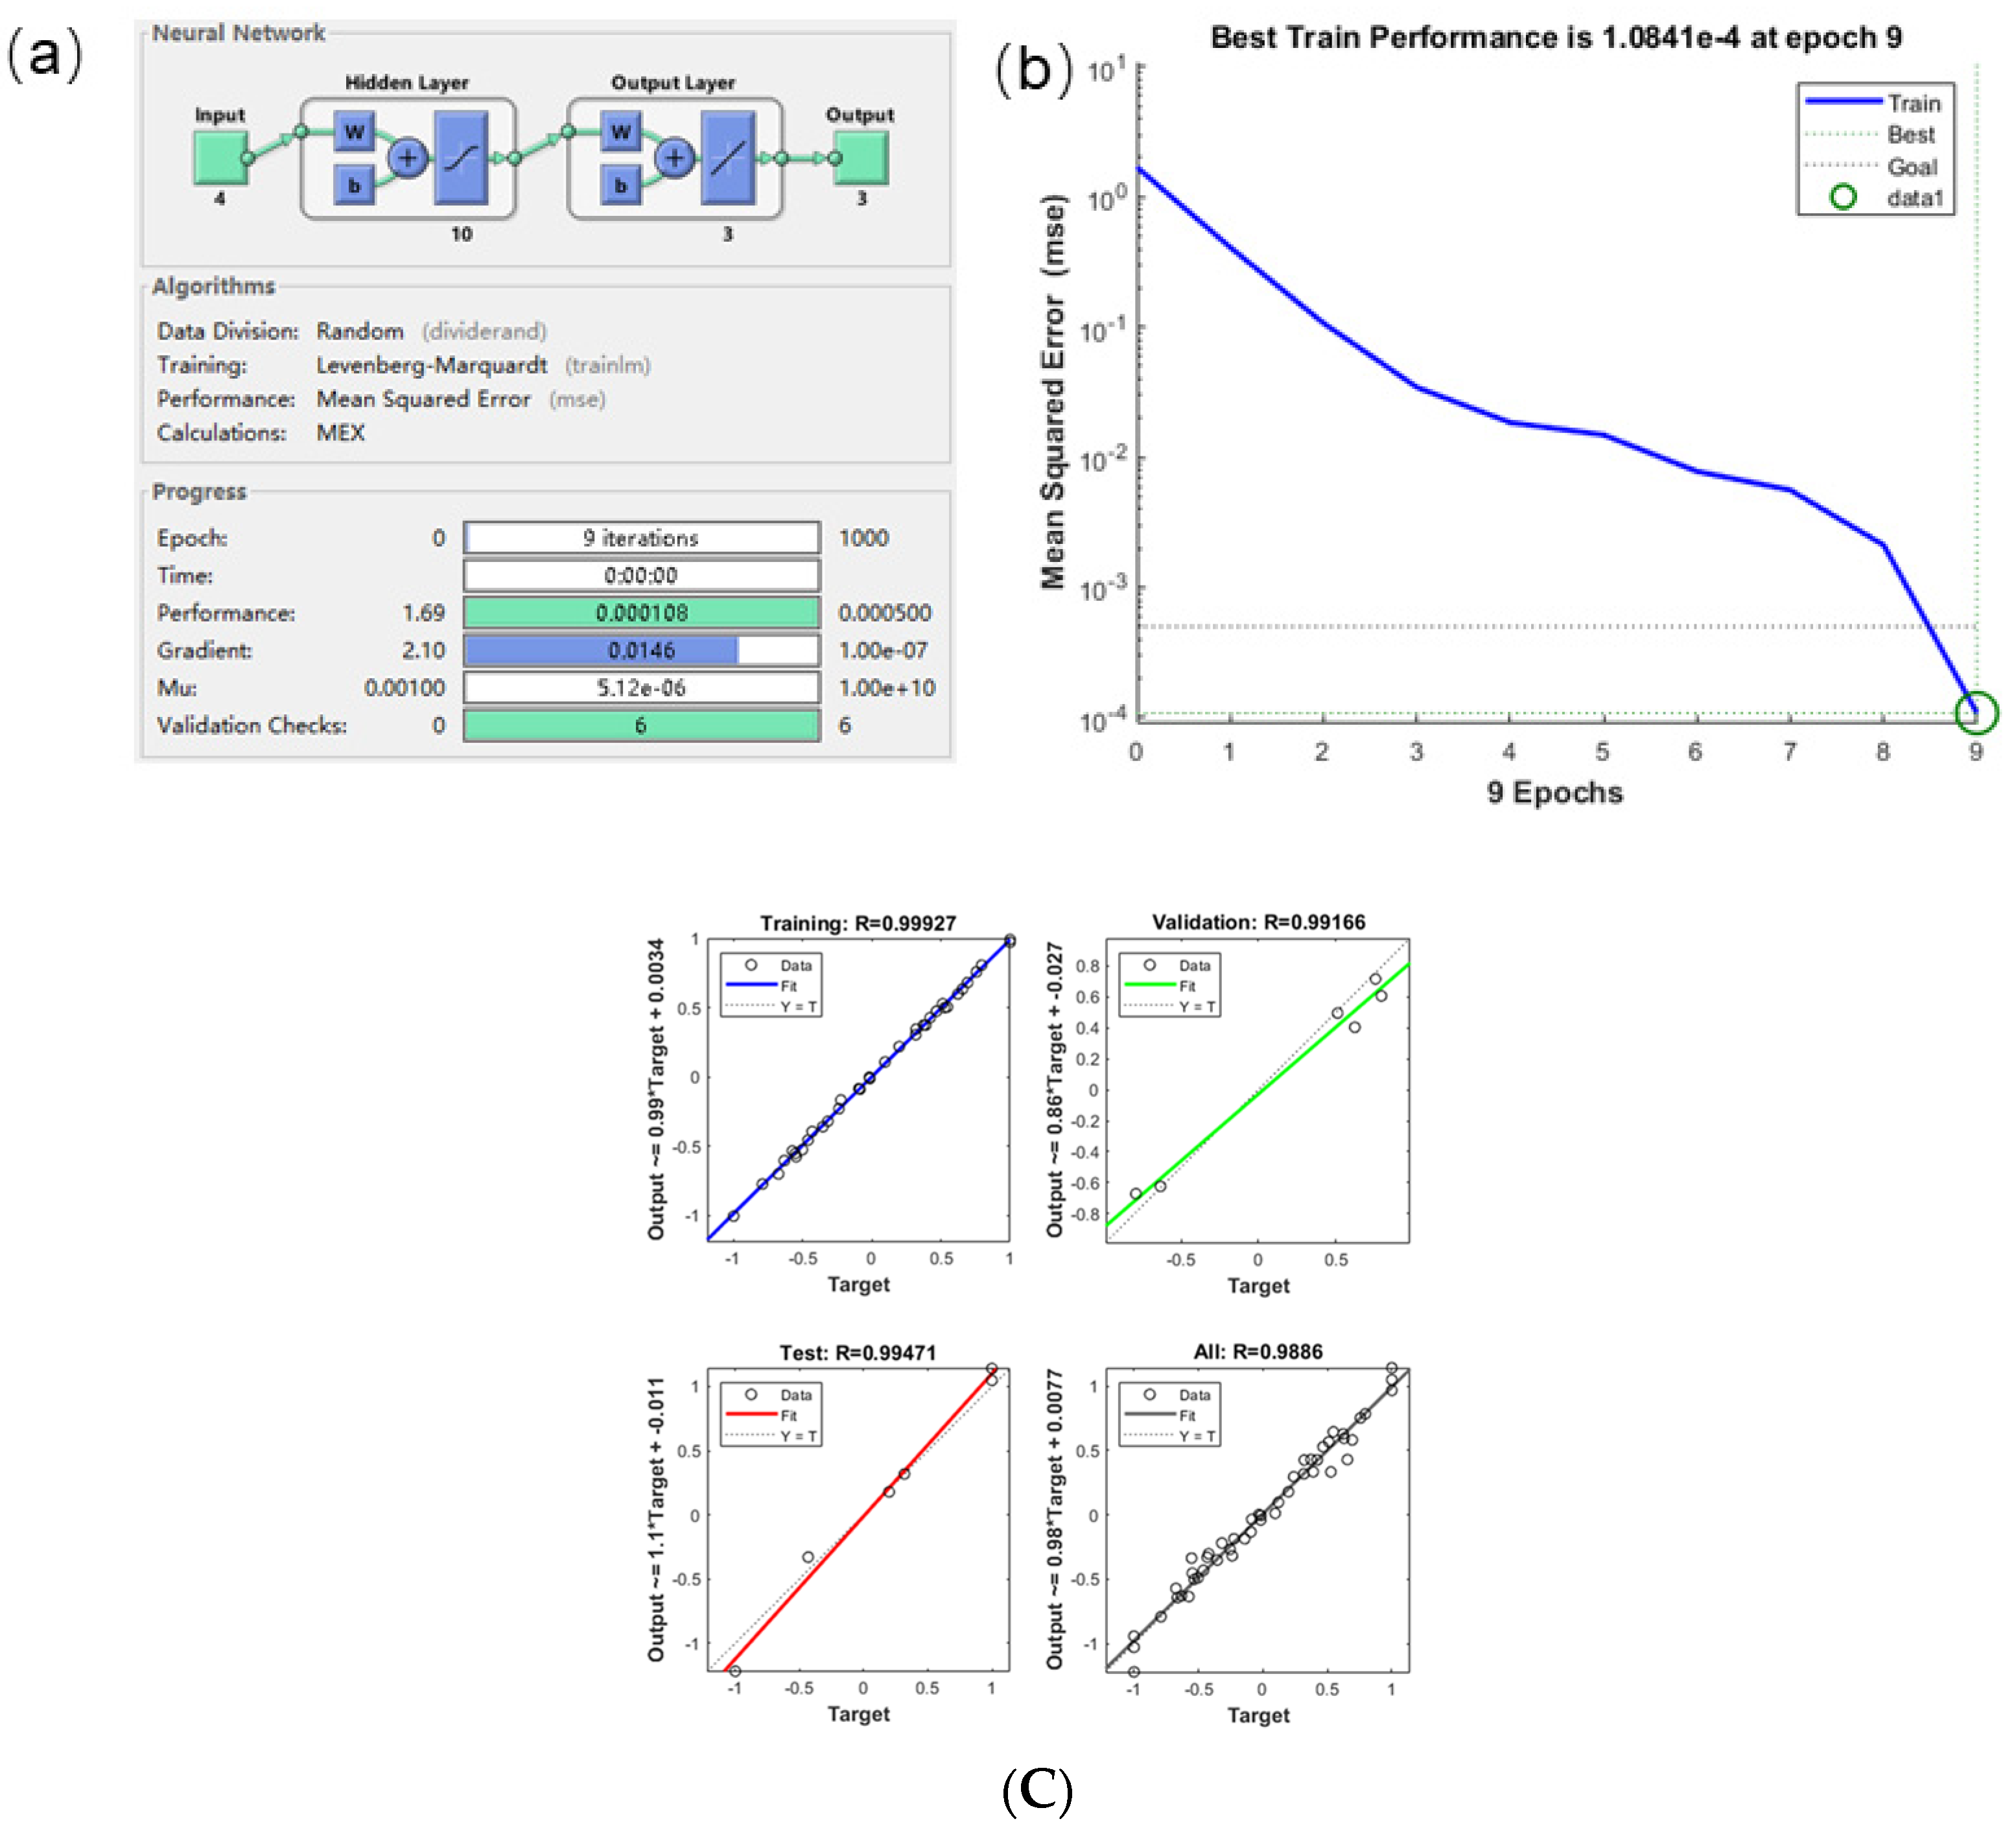
3.4. MATLAB Learning and Validation of the Prediction Model

As the prediction model for multi-performance indicators has to take into account additional performance characteristics, there is a possibility of an increase in prediction error and a corresponding rise in the complexity of the developed BP neural network. Thus, taking into account these factors, the algorithm outlined in the previous section was modified to include an increase in the number of performance indicators from 1 to 3. Additionally, the number of nodes in the implicit layer was increased to 10 as shown in Figure 12, and the minimum mean square error was set at 0.0005. Specifically, when the goal error of 0.0005 was reached, the multi-performance indicator prediction model was considered trustworthy, taking into account practical needs.
a. E-learning and training
The training samples for the MATLAB learning and training technique for the BP neural network were selected from the first 27 sets of parameters and the associated three performance index data in Table 4, based on the prior study. The procedure is illustrated in Figure 13.
Figure 14a illustrates the whole training process of the BP neural network model. It is evident that the model achieved the desired goal error of 0.0005 after nine rounds of the Levenberg–Marquardt method. Figure 14b illustrates the error curve that represents the steady reduction of the error as the training iterations progress in the network learning training process. The graph in Figure 14c displays the regression analysis results, indicating a high R-value of around 0.99. This suggested that the multi-performance indicator prediction model was very reliable.
b. Forecasting model validation
To confirm the accuracy of the SLM anode quality prediction model mentioned earlier, the validation process used the last four sets of experimental parameters and the corresponding data on density, self-corrosion current, and anode utilization from Table 4. The MATLAB validation procedure was designed and the resulting output is presented below shown in Figure 15.
The predictors of the model were compared with the experimental results, as shown in Table 9.
Based on the data presented in the figure, it is evident that the multi-performance indicator prediction model had a slightly larger error than the single performance prediction model discussed earlier. The maximum absolute value of the relative error was 8.23%, while the minimum was 0.66%. The majority of the errors fell within the range of ± 10%. The restricted availability of experimental data, coupled with the inevitable faults in operation and measurement, as well as the complex nature of multi-objective prediction, made this particular component of the study intrinsically challenging. The presence of errors within a range of ±10% was adequate evidence to establish the dependability of this BP neural network prediction model.

3.5. SLM Process Parameter Backcasting

The current processing method typically requires the ability to directly adjust the mix of process parameters based on the desired outcome or need. This paper utilized the exceptional adaptability of artificial neural networks, specifically the BP neural network SLM anode quality prediction model. By modifying the network structure and creating a process parameter backpropagation model, it achieved rapid and precise selection of process parameters.
The BP neural network prediction model can precisely forecast the anode quality given a certain combination of process parameters. If the process is considered as forward projection, it is preferable to reverse project the process parameters based on the attained anode quality standards during the actual processing. Artificial neural networks are advantageous because they can disregard the causal relationship between parameters and indicators. This means that parameters can be treated as indicators and vice versa, highlighting the exceptional flexibility of neural networks. Thus, the existing indicator requirements can serve as input parameters, and the necessary combinations of process parameters can be inferred in reverse using the BP neural network prediction model. This model offers guidance for the rational configuration of parameters, making it highly valuable in practical applications shown in Figure 16.
Nevertheless, as previously mentioned, BP neural networks require a sample database of exceptional quality, and a high-quality BP neural network model necessitates a substantial amount of data for support. The current database is insufficiently accurate, but by continuously expanding and optimizing the dataset, the prediction accuracy of BP neural network models will be significantly enhanced. Clearly, given the current data circumstances, there is still room for improvement in the prediction accuracy of BP neural network prediction models. Given that the process parameter backpropagation model is derived from the existing BP neural network prediction model through adjustments to the network topology, it is expected that the process parameter backpropagation model will exhibit some degree of inaccuracy. In this work, a correction coefficient was presented to address the issue of anticipated process parameter combinations not meeting the actual goal requirement owing to model inaccuracy.
During the processing phase, it is common to establish a minimum standard for the desired quality of processing. In this study, this standard was defined as the minimum densification, the maximum self-corrosion current, and the minimum anode usage rate. By utilizing the minimum standards and the maximum error of the BP neural network prediction model from the previous section, a correction coefficient was established to adjust the minimum standard value and obtain the corrected target value. By utilizing the adjusted target value as input, the model inversion introduced a set of process parameters that guarantee the processing indexes surpass the minimal standard value, so fulfilling the real processing needs. To be specific:
ρ 1 = ( 1 + σ 1 ) ρ
I 1 = ( 1 σ 2 ) I
η 1 = ( 1 + σ 3 ) η
ρ 1 is the corrected densification value;
I 1 is the corrected self-corrosion current value;
η 1 is the corrected anode utilization value;
σ 1 , σ 2 , and σ 3 are correction factors. Their values depend on the quality of network training, in this paper, σ 1 = 3.82 % , σ 2 = 7.83 % , and σ 3 = 8.23 % .
Therefore, the modified inverse model for the process parameters is shown in Figure 17.
To assess the dependability of the process parameter backpropagation model, the model was trained using pre-experimental data as a representative sample. The trained model was then used to backpropagate the process parameters. The resulting combination of process parameters derived from the backpropagation model was utilized as the experimental parameters for conducting measurements and evaluating various indicators. Ultimately, the measured indicators were compared and assessed against the predetermined target values, and the outcomes of this comparison are shown in Table 10.
Upon analyzing the data in the table, it is evident that the actual densification and anode utilization data for the process parameter combinations obtained through the backpropagation model were slightly higher than the preset target values. Conversely, the data for the actual self-corrosion current were slightly lower than the target values. This suggested that the process parameter combinations predicted by the backpropagation model were capable of meeting the requirements of real-world processing and achieving a prompt selection of process parameters.

4. Conclusions

The construction of a multi-objective model for the prediction of the quality of aluminum anode formation and the rapid selection of process parameters is described. Selecting densification, corrosion resistance, and discharge performance as the indicators of the prediction model, the BP network prediction model for selective laser melting of TiB2/6061 aluminum anodes is constructed using MATLAB and Levenberg–Marquardt (trainlm) as the training algorithm for network learning training of the data sample set, which proves the reliability of this BP network prediction model for selective laser melting of TiB2/6061 aluminum anodes. In the case of the 6061 aluminum anode BP network prediction model, the absolute values of the relative error between the computed prediction value and the experimental value are 8.23% at its highest point and 0.66% at its lowest point. This demonstrates that the BP neural network prediction model is reliable. Utilizing the ultra-high flexibility of a neural network and the established index demand as input parameters through the BP neural network prediction model, the reverse extrapolation of the required process parameter combinations as experimental parameters, and experiments and measurements of the indicators, the comparison found that the experimental measured values were better than the index demand, indicating that the combinations of the process parameters predicted by the backpropagation model could satisfy the needs of the actual processing and realize the rapid selection of process parameters.

Author Contributions

Conceptualization, Q.X. and J.H.; methodology, P.L.; software, Z.S.; formal analysis, S.T.; investigation, Q.X.; resources, N.S.; data curation, K.Z.; writing—original draft preparation, Y.L.; writing—review and editing, Q.X.; visualization, K.Z.; supervision, J.H.; project administration, J.G.; funding acquisition, Q.X. All authors have read and agreed to the published version of the manuscript.

Funding

This study was supported by the Qing Lan Project of Jiangsu Province.

Data Availability Statement

Data used in this work was included in the manuscript.

Acknowledgments

This study was supported by the Qing Lan Project of Jiangsu Province, to which we would like to express our heartfelt thanks.

Conflicts of Interest

Author Jiahui Guan was employed by the company Hongyuan Green Energy Co., Ltd. The remaining authors declare that the research was conducted in the absence of any commercial or financial relationships that could be construed as a potential conflict of interest.

References

  1. Chen, Y.; Liu, Y.; Du, W.; Li, Q.; Wang, H.; Li, Q.; Wu, Q.; Qin, G. Identification of the parameters of the aluminum-air battery with regard to temperature. J. Energy Storage 2024, 88, 111397. [Google Scholar] [CrossRef]
  2. Liu, X.; Xue, J.; Cao, J.; Wang, Z.; Li, X. High performance Al anode for Al-air battery enabled by coordinating In and Sb additions with discharge parameters. J. Energy Storage 2024, 87, 111503. [Google Scholar] [CrossRef]
  3. Chang, Y.; Li, J.; Zhang, T.; Wang, J.; Wang, D.; Liu, Y.; Yang, M.; Xing, R.; Zhang, G. Correlating oxygen reduction activity of N, S-co-doped carbon with the structures of dopant molecules. J. Alloys Compd. 2024, 986, 174165. [Google Scholar] [CrossRef]
  4. Tong, F.; Zhuang, W.; Song, M.; Kim, J.; Gao, W.; Wei, S. Micro-alloyed aluminium alloys as anodes for aluminium-air batteries with a neutral electrolyte. Mater. Today Commun. 2024, 39, 108518. [Google Scholar] [CrossRef]
  5. Vijayalakshmi, A.K.; Karthikeyan, N. Excellent Diffusive Performance of Cold-Plasma-Exposed Activated Peanut Shell Carbon as an Electrode in Al-Air Batteries. ECS J. Solid State Sci. Technol. 2024, 13, 031001. [Google Scholar] [CrossRef]
  6. Zhu, C.; Yan, L.; Han, Y.; Luo, L.; Guo, J.; Xiang, B.; Zhou, Y.; Zou, X.; Guo, L.; Bai, Y. Synergistic modulation of alkaline aluminum-air battery based on localized water-in-salt electrolyte towards anodic self-corrosion. Chem. Eng. J. 2024, 485, 149600. [Google Scholar] [CrossRef]
  7. Tian, Z.; Liang, Y.; Chen, K.; Gao, J.; Lu, Z.; Hu, X.; Ding, Y.; Wen, Z. Advanced Hollow Cubic FeCo-N-C Cathode Electrocatalyst for Ultrahigh-Power Aluminum-Air Battery. Small 2024. [Google Scholar] [CrossRef]
  8. Guo, L.; Zhu, L.; Huang, Y.; Tan, Y.; Ritacca, A.G.; Zheng, X.; Leng, S.; Wang, B. Self-assembly of an amino acid derivative as an anode interface layer for advanced alkaline Al-air batteries. Phys. Chem. Chem. Phys. 2024, 26, 10892–10903. [Google Scholar] [CrossRef]
  9. Wu, T.; Zhao, T.; Xie, G.; Shen, Q.; Yu, X.; Zhu, Y. Effect of cerium dioxide on the anode performance of aluminum-air batteries. Mater. Lett. 2024, 362, 136142. [Google Scholar] [CrossRef]
  10. Annalisa, A.; Alessandro, M.; Tullio, M. Low-Environmental Impact Surface Treatment on SLM-Produced AlSi10Mg Aluminium Alloy. Key Eng. Mater. 2023, 964, 73–78. [Google Scholar]
  11. Song, X.; Fu, B.; Chen, X.; Zhang, J.; Liu, T.; Yang, C.; Ye, Y. Effect of internal defects on tensile strength in SLM additively-manufactured aluminum alloys by simulation. Chin. J. Aeronaut. 2023, 36, 485–497. [Google Scholar] [CrossRef]
  12. Artem, V.I.; Alexandr, M.P.; Elena, M.S.; Tatyana, V.T. Tensile and torsion tests of cylindrical specimens of aluminum alloy ASP35 obtained by the SLM method. Procedia Struct. Integr. 2023, 50, 113–118. [Google Scholar] [CrossRef]
  13. Anoop, J.; Suyamburajan, V.; Pendyala, S.B.; Addis, S. Analysis and Experimental Investigation of A356 Aluminium Alloy Hybrid Composites Reinforced with Gr-FE3O4-B4C Nanoparticles Synthesised by Selective Laser Melting (SLM). J. Nanomater. 2022, 2022, 1–8. [Google Scholar] [CrossRef]
  14. Prashanth, K.G.; Scudino, S.; Eckert, J. Defining the tensile properties of Al-12Si parts produced by selective laser melting. Acta Mater. 2017, 126, 25–35. [Google Scholar] [CrossRef]
  15. Li, W.; Li, S.; Liu, J.; Zhang, A.; Zhou, Y.; Wei, Q.; Yan, C.; Shi, Y. Effect of heat treatment on AlSi10Mg alloy fabricated by selective laser melting: Microstructure evolution, mechanical properties and fracture mechanism. Mater. Sci. Eng. A 2016, 663, 116–125. [Google Scholar] [CrossRef]
  16. Akram, J.; Chalavadi, P.; Pal, D.; Stucker, B. Understanding grain evolution in additive manufacturing through modeling. Addit. Manuf. 2018, 21, 255–268. [Google Scholar] [CrossRef]
  17. Hamrouni, B.; Bourouis, A.; Koricho, A.; Brahmi, M. Explainable Ontology-Based Intelligent Decision Support System for Business Model Design and Sustainability. Sustainability 2021, 13, 9819. [Google Scholar] [CrossRef]
  18. Xi, L.; Gu, D.; Guo, S.; Wang, R.; Ding, K.; Prashanth, K.G. Grain refinement in laser manufactured Al-based composites with TiB2 ceramic. J. Mater. Res. Technol. 2020, 9, 2611–2622. [Google Scholar] [CrossRef]
  19. Haouam, M.; Abdullahi, Z.Y.; Zanat, K.; Ersan, S. Boron phosphide (BP) biphenylene and graphenylene networks as anode and anchoring materials for Li/Na-ion and Li/Na–S batteries. Appl. Surf. Sci. 2024, 662, 160096. [Google Scholar] [CrossRef]
  20. Djebablia, I.; Abdullahi, Z.Y.; Zanat, K.; Ersan, S. Metal-decorated boron phosphide (BP) biphenylene and graphenylene networks for ultrahigh hydrogen storage. Int. J. Hydrog. Energy 2024, 66, 33–39. [Google Scholar] [CrossRef]
  21. Ma, W.; Feng, T.; Su, C.; Ahmed, S.F.; Liu, G. Performance optimization of phase change energy storage combined cooling, heating and power system based on GA + BP neural network algorithm. J. Energy Storage 2024, 88, 111653. [Google Scholar] [CrossRef]
  22. Uzair, M.; Jamil, N. Effects of hidden layers on the efficiency of neural networks. In Proceedings of the 2020 IEEE 23rd International Multitopic Conference (INMIC), Bahawalpur, Pakistan, 5–7 November 2020; IEEE: New York, NY, USA, 2020; pp. 1–6. [Google Scholar]
  23. Han, F.; Jiang, J.; Ling, Q.H.; Su, B. A survey on metaheuristic optimization for random single-hidden layer feedforward neural network. Neurocomputing 2019, 335, 261–273. [Google Scholar] [CrossRef]
Figure 1. Microscopic morphology of TiB2/6061 powder and physical view of ball milling device: (a) 6061 powder; (b) TiB2 powder; (c) 0.5 wt.% TiB26061; (d) internal and external physical view of ball milling device.
Crystals 14 00608 g001
Figure 2. Laser selective melting equipment and printing process: (a) XDM250 type equipment; (b) laser forming process.
Crystals 14 00608 g002
Figure 3. BP neural network single target prediction model.
Crystals 14 00608 g003
Figure 4. Parameter selection for SLM-based anode quality prediction model.
Crystals 14 00608 g004
Figure 5. MATLAB implementation of BP neural network based densification prediction model.
Crystals 14 00608 g005
Figure 6. Density-dependent network training results: (a) total training process; (b) error drop curve.
Crystals 14 00608 g006
Figure 7. Validation of the densification prediction model: (a) validation procedure; (b) prediction results.
Crystals 14 00608 g007
Figure 8. Network training results for corrosion resistance: (a) total training process; (b) error drop curve.
Crystals 14 00608 g008
Figure 9. Validation results of the corrosion resistance prediction model.
Crystals 14 00608 g009
Figure 10. Network training results for discharge performance: (a) total training process; (b) error drop curve.
Crystals 14 00608 g010
Figure 11. Validation results of the discharge performance prediction model.
Crystals 14 00608 g011
Figure 12. BP neural network multi-performance index prediction model for laser cladding of TC4.
Crystals 14 00608 g012
Figure 13. MATLAB implementation of BP neural network based prediction model for multiple performance indicators.
Crystals 14 00608 g013
Figure 14. Network training results of the multi-performance indicator prediction model: (a) total training process; (b) error decline curve; (c) regression analysis.
Crystals 14 00608 g014
Figure 15. Validation of SLM anode quality prediction model: (a) validation procedure; (b) output results; (c) output results in detail.
Crystals 14 00608 g015
Figure 16. Inverse model of process parameters.
Crystals 14 00608 g016
Figure 17. Inverse model of the modified process parameters.
Crystals 14 00608 g017
Table 1. Chemical composition of 6061 powder.
ElementSiCuMgCrMnFeZnAl
wt%0.550.241.130.16<0.03<0.700.035Bal.
Table 2. Corresponding parameters of 3D printing equipment.
ModelXDM250
Machine size
Forming space
Layer thickness
Laser configuration
Laser wavelength
Software system
Powder supply method
1670 mm × 1140 mm × 2160 mm
250 mm × 250 mm × 410 mm
Min. 20 μm
IPG Fibre Laser 500 W
1070 nm
XDM IntelliProc®, XDM IntelliMake®
bottom feed
Table 3. Level of factors.
Serial NumberNameUnitLevel 1Level 2Level 3Level 4
ATiB2 contentwt%0.250.50.751.0
BLaser powerW300340380420
CScanning speedmm/s70085010001150
DScanning distanceμm80110140170
Table 4. BP neural network data samples.
Serial NumberTiB2 Content (wt%)Laser Power (W)Scanning Speed (mm/s)Scanning Distance (μm)Density (%)Corrosion Current Density (A·cm−2)Anode Utilization (%)
Z10.253007008096.044.572 × 10−354.6
Z20.2534085011096.833.987 × 10−357.2
Z30.25380100014098.373.452 × 10−359.3
Z40.25420115017096.963.922 × 10−357.4
Z50.530085014096.773.999 × 10−356.7
Z60.534070017097.333.756 × 10−357.7
Z70.538011508096.624.138 × 10−356.3
Z80.5420100011095.844.719 × 10−354.0
Z90.75300100017095.435.012 × 10−350.5
Z100.75340115014095.974.611 × 10−354.2
Z110.7538070011095.464.985 × 10−352.6
Z120.754208508095.325.115 × 10−349.0
Z131.0300115011095.534.889 × 10−353.2
Z141.034010008096.494.149 × 10−355.8
Z151.038085017096.444.285 × 10−355.2
Z161.042070014095.385.099 × 10−350.3
Z170.5260100014096.044.572 × 10−354.6
Z180.5300100014096.833.987 × 10−357.2
Z190.5340100014098.373.452 × 10−359.3
Z200.5380100014096.963.922 ×10−357.4
Z210.5420100014096.773.999 × 10−356.7
Z220.534070014097.333.756 × 10−357.7
Z230.534085014096.624.138 × 10−356.3
Z240.5340115014095.844.719 × 10−354.0
Z250.5340130014095.435.012 × 10−350.5
Z260.534010008095.974.611 × 10−354.2
Z270.5340100011095.464.985 × 10−352.6
Z280.5340100017095.325.115 × 10−349.0
Z290.5340100020095.534.889 × 10−353.2
Z300340100011094.47.569 × 10−346.7
Z310.5340100011097.73.397 × 10−358.2
Z321.0340100011096.914.481 × 10−353.6
Z331.5340100011096.285.552 × 10−351.3
Table 5. Common transfer functions for neural networks.
CategoryImportationExportsSpecificities
Binary functionArbitrary value0 or 1The output is simple but not microscopic
Sigmoid typeArbitrary value0~1Nonlinear monotonic, infinitely differentiable
Linear functionArbitrary valueArbitrary valueLinear monotonic, micro
Table 6. Comparison of densitometric predictions with experimental results.
Serial NumberDensity Prediction Results/%Densification Results/%Relative Error
Z2897.8495.322.64%
Z2997.3795.531.93%
Z3095.2994.40.95%
Z3195.5997.72.16%
Z3295.8896.911.06%
Z3395.0796.281.25%
Table 7. Comparison of predicted and experimental results of self-corrosion current.
Serial NumberPredicted Results/A cm−2Experimental Results/A cm−2Relative Error
Z280.0050250.005115 1.76%
Z290.0049680.004889 1.62%
Z300.0076650.007569 1.27%
Z310.0034720.003397 2.21%
Z320.0043510.004481 2.90%
Z330.0057660.005552 3.85%
Table 8. Comparison of predicted and experimental results of anode utilization rate.
Serial NumberPredicted Results/%Experimental Results/%Relative Error
Z2851.049.04.17%
Z2951.153.23.89%
Z3047.446.71.50%
Z3156.658.22.83%
Z3252.553.62.03%
Z3349.551.33.56%
Table 9. Comparison of predicted and experimental results of SLM anode quality.
NormDensity (ρ)/
(%)
Self-Corrosion Current (A)/
(A/cm2)
Anode Utilization (η)/
(%)
Serial Number ExperimentPredictionRelative errorExperimentPredictionRelative ErrorExperimentPredictionRelative Error
Z2895.3299.113.82%5.115 × 10−35.314 × 10−33.75%49.051.985.73%
Z2995.5398.983.49%4.889 × 10−34.534 × 10−3−7.83%53.252.56−1.21%
Z3094.496.642.31%7.569 × 10−37.284 × 10−3−3.91%46.743.89−6.41%
Z3197.795.41−2.40%3.397 × 10−33.674 × 10−37.55%58.253.84−8.09%
Z3296.9193.42−3.74%4.481 × 10−34.721 × 10−35.08%53.649.52−8.23%
Z3396.2895.64−0.66%5.552 × 10−35.396 × 10−3−2.90%51.353.413.95%
Table 10. Validation of the backpropagation model.
Density/
(%)
Self-Corrosion Current/(A/cm2)Anode Utilization/
(%)
TiB2 Rate/(%)Laser Power/(W)Scanning Speed/(mm/s)Scanning Distance/(μm)
ObjectiveExperimentObjectiveExperimentObjectiveExperimentExperimentExperimentExperimentExperiment
9495.73.4 × 10−33.328 × 10−346.249.50.23328.91128.6112.1
94.596.94.2 × 10−34.083 × 10−354.658.70.46383.2793.5151.6
9597.85.0 × 10−34.895 × 10−360.462.20.76344.11095.8190.2
Disclaimer/Publisher’s Note: The statements, opinions and data contained in all publications are solely those of the individual author(s) and contributor(s) and not of MDPI and/or the editor(s). MDPI and/or the editor(s) disclaim responsibility for any injury to people or property resulting from any ideas, methods, instructions or products referred to in the content.

