Article

Pre-Critical and Giant Post-Freezing and Pre-Melting Effects for Dielectric Properties in a Binary Mixture of Limited Miscibility

by
Jakub Kalabiński
1,
Aleksandra Drozd-Rzoska
1,*,
Szymon Starzonek
2 and
Sylwester J. Rzoska
1
1
Institute of High Pressure Physics Polish Academy of Sciences, Sokołowska 29/37, 01-142 Warsaw, Poland
2
Laboratory of Physics, Faculty of Electrical Engineering, University of Ljubljana, Tržaška 25, 1000 Ljubljana, Slovenia
*
Author to whom correspondence should be addressed.
Crystals 2024, 14(7), 612; https://doi.org/10.3390/cryst14070612
Submission received: 7 June 2024 / Revised: 25 June 2024 / Accepted: 27 June 2024 / Published: 30 June 2024
(This article belongs to the Special Issue Phase Transitions and Dynamics Studies of Nanocomposite Materials)

Abstract

:
This report presents the results of dielectric studies in a nitrobenzene–decane critical mixture in the homogeneous liquid, biphasic mesophase, and the solid crystal phase. It focuses on detecting critical effects in the broad surrounding of the critical consolute temperature and pre-melting and post-freezing effects in the solid crystal phase. The strong manifestation of the diameter critical anomaly in the biphasic domain and the Mossotti catastrophe type pre-melting and post-freezing effects in the solid phase are evidenced. Studies include the puzzling low-frequency (LF) domain related to translational processes. The real part of electric conductivity, in LF limit, is well portrayed by the super-Arrhenius-type equation in the homogenous liquid and solid phases. The obtained experimental evidence can be significant for the cognitive progress of the still puzzling melting/freezing canonic discontinuous transition.

1. Introduction

Phase transitions are associated with qualitative changes in physical states related to temperature or pressure shifts, leading to subsequent phases with essentially different physical properties [1,2,3]. It is one of the essential phenomena in nature and is widely used in various applications [4,5,6,7]. In the early 20th century, Ehrenfest built his fundamental basis, distinguishing continuous and discontinuous phase transitions [1,8,9]. Studies on continuous phase transitions led to one of the grand universalistic successes in 20th century physics, and maybe of all science, culminating in the formation of critical phenomena physics [1,10,11,12].
However, discontinuous phase transition has remained a fundamental challenge. For the canonical case of g a s l i q u i d c r y s t a l ,   the sequence of discontinuous phase transitions in one-component systems starts from the impact of the gas–liquid coexistence curve. Its branches are related to discontinuous transitions, and the top is for the only continuous (critical) phase transition point. The system-specific pair of critical temperature ( T C ) and pressure ( P C ) describe its coordinates [1,13,14,15,16]. In this report, the exceptional case of a liquid–liquid critical point appearing in some one-component systems, still puzzling for its origins, is not considered [17,18,19,20].
For binary mixtures of limited miscibility, a liquid–liquid coexistence curve with the critical consolute point (continuous phase transition) exists [21,22,23]. Critical phenomena physics showed that the broad surroundings of the gas–liquid critical point in one-component systems and the critical consolute point in binary mixtures are isomorphic. They are linked in the same universality class [21]. However, in binary mixtures of limited miscibility, a line of critical consolute points in the pressure–temperature plane exists, so it can also be observed under atmospheric pressure [22]. It opens a unique experimental possibility of testing the behavior regarding the critical point (continuous phase transition) and melting/freezing (canonic discontinuous phase transition) in a single temperature scan.
This report presents a dielectric spectroscopy scan to show the first results of such investigations in a nitrobenzene–decane critical mixture. The presented results are focused on the pre-transitional/pre-critical effects near the critical consolute point, particularly, the still puzzling pre-melting/post-freezing effects in the solid state [24,25,26], for which surprising hallmarks of critical-like behavior have been revealed. The tests include the low-frequency domain, which has hardly been discussed in similar studies so far. The target of this report is the coherent insight into the impact of all phase transitions occurring in a mixture of limited miscibility on its properties via dielectric monitoring, which seems to be particularly suitable for such tests.

2. Materials and Methods

This report focuses on dielectric studies in the critical concentration of the homogeneous liquid, biphasic, and crystalline states in a nitrobenzene–decane mixture of limited miscibility. The values of the critical parameters were determined using the recently proposed visual method based on the registration of volumes occupied by coexisting phases, whose changes with temperature were photo registered. The system and the implementation protocol are described in Ref. [23]. It yielded the following parameters: x C = 0.575   mole fraction of nitrobenzene and T C = 296.1 K.
The tested compounds were purchased from Sigma. The decane was used as delivered, and the nitrobenzene was additionally 3x distilled under a vacuum prior to sample preparation and measurements. The samples were placed in a flat-parallel capacitor with a diameter of 2 r = 15   m m and a distance of d = 0.2   m m . It was made from Invar with a quartz ring and supported by thin Teflon washers. The tested sample was transferred to the capacitor in the homogeneous liquid phase using a syringe. Special caps isolated the sample from the surroundings. The capacitor with the tested sample was placed within a Quattro Novocontrol temperature control unit, enabling ± 0.02   K precision. The sample temperature was monitored via a Pt100 probe placed within the capacitor plate.
Dielectric measurements were carried out using an Alpha Novocontrol impedance analyzer, supported by the dedicated software that controls the measurement process. The analyzer enabled 6-digit resolution. Broadband dielectric spectroscopy [27] scan for frequencies 1   H z < f < 10   M H z was used for determining values of the real part of the dielectric permittivity in the static and low-frequency domains and the electric conductivity.
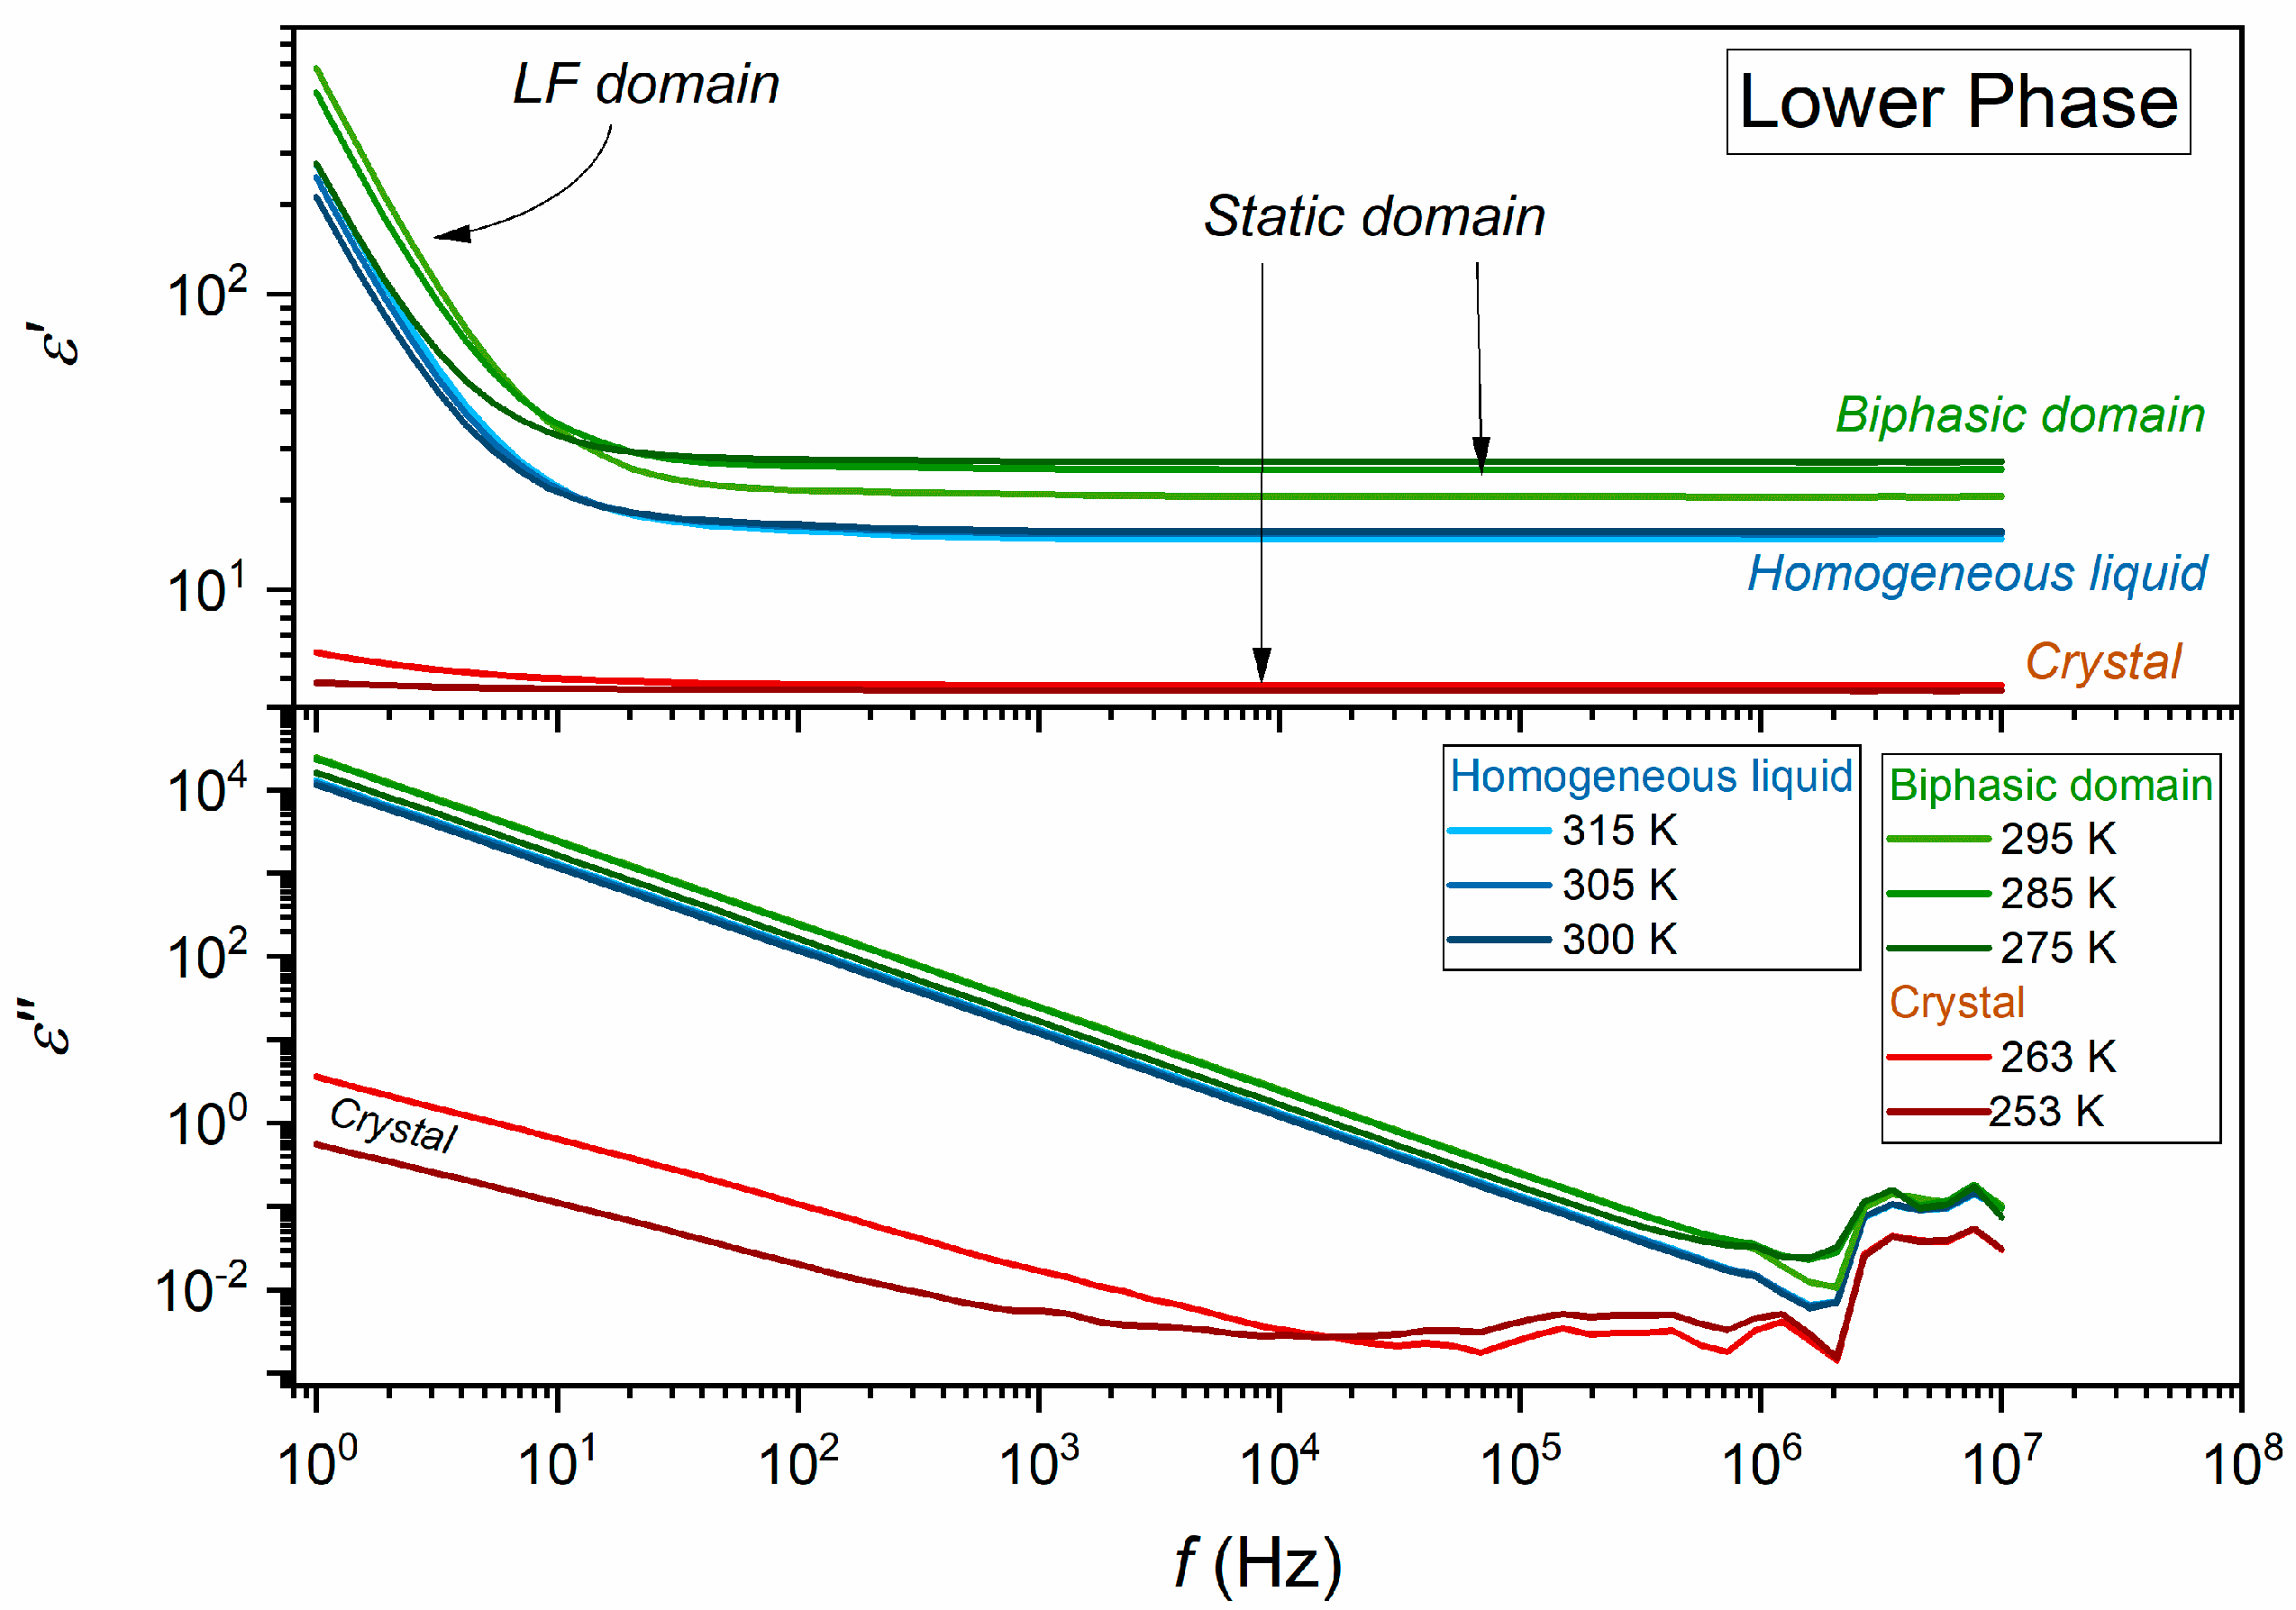
Figure 1 and Figure 2 show the complex dielectric permittivity spectra for the scans using capacitors. The figures are for scans covering the upper and lower coexisting phases in the two-phase domain, respectively. The plots are for the selected representative isotherms. The complete set of data contains ~200 tested temperatures in 3 tested phases. The plots show phase transitions hallmarks and characteristic features of the detected spectra. The horizontal part of ε f is related to the static (frequency-independent) domain-defining dielectric constant, namely, ε f = ε . In the given report for the dielectric constant, the representative frequency f = 100   k H z was taken in agreement with standards developed in earlier studies of mixtures of limited miscibility.
It is notable that the static domain extends from ca. 10 MHz to frequencies well below 100 Hz. Usually, the terminal of the static domain and the onset of the low-frequency (LF) region in similar mixtures is for frequencies in the range of 1   k H z 10   k H z . In Figure 1 and Figure 2, the static domain extends even well below 100   H z frequency. It indicates the success of supplementary cleaning of nitrobenzene, namely, it was 3x time distilled under reduced pressure immediately prior to the samples’ preparation and measurements. The measurement capacitor guaranteed the lack of parasitic contaminations from the surrounding environment.
The results presented below focus mainly on the real part of dielectric permittivity. The final insight into the evolution of the imaginary part of dielectric permittivity is carried via the test of the temperature evolution of the real part of electric conductivity, namely, σ f = ε 0 ω ε f , ω = 2 π f .
Formally, the Alpha impedance analyzer producer declares 40 MHz as the upper-frequency terminal. However, in practice, frequencies 1–10 MHz are the terminal frequency, which is clearly visible in numerous reports regarding glass-forming systems, where this type of equipment is the standard apparatus. Shifting measurements towards 40 MHz require an essential change of the measurement capacitor, which can introduce a parasitic shift in the detected parameters not allowed when testing temperature dependence in a large temperature range. The factor that definitely prevented shifting the frequency limit in the terminal declared direction for the Alpha analyzer was the need to scan with exactly the same capacitor in the lower and upper phases in the biphasic area. The upper phase is dominated by decane, with a low dielectric constant and very low electrical conductivity. The lower phase is dominated by nitrobenzene, which is characterized by much higher electrical conductivity and a very high dielectric constant. Together, this creates a set of parameters ( C , R ) impossible to meet in the Alpha spectrometer’s application map for higher frequencies. Figure 2, related to the frequency scans covering the lower phase, shows for the imaginary part of the dielectric permittivity onset of the relaxation processes for f > 2 3   M H z , distorted by a scatter related to the mentioned problems of the analyzer.
Note that tests in the relaxation domain, requiring measurements reaching multi-GHz domain, were not the focus of the presented research, but rather the target was properties in static and low-frequency (LF) domains.

3. Remarks on Continuous and Discontinuous Phase Transitions

The sequence of    g a s l i q u i d c r y s t a l   phase transitions is a common phenomenon experienced every day. In the 19th century, it was noticed that in some materials, under a small pressure, a ‘milky’ cloudiness instead of a discontinuous transition g a s l i q u i d transition can appear [1]. This phenomenon, called critical opalescence, was crucial for understanding that phase transitions split into discontinuous and continuous types. Studies of the latter led to the grand universalistic successes of physics and maybe even general science: the physics of critical phenomena. Critical opalescence was a visual manifestation of a continuous phase transition: the supercritical region dominated by fluctuations of the adjacent phase [1,11,12]. Their size (correlation length, ξ) and lifetime τ increase infinitely when approaching the critical temperature T C , via the following critical dependencies [11]:
ξ T 1 T T C ν
τ T 1 T T C z ν
where z is the so-called dynamic exponent, z = 2 for the nonconserved, and z = 3 for the conserved order parameter. For the gas–liquid critical point, the critical exponent ν 0.62 .
The pre-transitional/pre-critical changes of various physical properties for T T C are described by critical, power-type dependences with respect to the distance from T C . It appears to be the crucial inspiration for solving the mystery and forming critical phenomena physics [10,11,12]. Critical exponents matched to different physical properties play the unique role of universal phenomenal constants. Their values depend on the space dimension ( d ) and the order parameter ( n ), but not on the microscopic properties of a system. Critical exponents are linked by scaling equations so that only two are independent [11,12]. The order parameter concept introduced by Lev D. Landau is essential as a metric of symmetry elements that disappear or appear when passing a critical point. Landau also noted that for continuous (critical) phase transition symmetries in neighboring phase matches, as opposed to discontinuous phase transition, a step-change of the order parameter and coupled properties takes place [28,29]. Landau used this fact for the heuristic paradigm that a solid–liquid critical point terminating the line of discontinuous ‘melting transition’ cannot exist because it requires matching a huge number of order parameters/elements of symmetry in neighboring phases, which is highly improbable [29]. Nevertheless, very recently, a continuous phase transition was created for the inherently discontinuous phase of isotropic liquid–nematic (liquid crystal) using an endogenic frustration by the slight addition of nanoparticles and pressure-related tuning [30]. The generic feature of the melting/freezing phase transition, considered as the canonic example of a discontinuous phase transition, is the lack of pre-transitional effects [24,31,32,33,34,35,36,37,38]. It also means the lack of basic empirical inspiration for developing a model to understand the phenomenon. Nevertheless, a common agreement appeared that the melting/freezing discontinuous transition is essentially a different phenomenon than continuous/critical transition [24]. For melting, the phenomenological approach was introduced by Lindemann, and it remains significant today [39,40]. Another path constitutes the semi-microscopic approach, assuming the formation of crystalline grains covered by quasi-liquid layers, finally leading to fragmentation and melting upon heating from the solid crystalline phase. This picture correlates with the experimental evidence showing weak and range-limited pre-melting effects in the solid phase and the lack of such a phenomenon when cooling the liquid phase. Unfortunately, experimental studies showed the existence of pre-melting effects but did not lead to a better description. On the other hand, grain-model-based theoretical considerations generally described the phenomenon, but did not lead to any check-point relation for describing pre-melting effects [24,31,32,33]. Exceptional insight can be gained by implementing the model approach developed by Lipovsky [41,42]. He considered a constrained melting case for a liquid layer between crystalline solid plates and noted that liquid layers could be characterized by a specific symmetry described by the order parameter M , impacted by constraints introduced by the solid crystal surface. It led to the quasi-liquid order parameter ( M S ), in which temperature changes are described as follows [41,42]:
M S T T β S
where the order parameter exponent 1 / 2 < β S 1 for the mean-field critical point. For the tricritical point (TCP), one can expect the value 1 / 4 for the lower limit.
In this model, the continuous phase transition in quasi-liquid layers occurs at the singular (critical) temperature T , only slightly shifted from the reference melting temperature T m for discontinuous transition in the bulk sample. The critical-like divergence of the quasi-liquid layer thickness l and the order parameter-related susceptibility χ T was also considered. These properties should change the following dependencies [41,42]:
l T T β l
χ T T T γ s
where the order parameter exponents β l 0 , and β l = 0 correspond to a 3-dimensional case associated with short-range forces; for the susceptibility exponent γ S 1 , in some cases, the layer thickness is γ S = 1 2 β l .
Equation (3) can mean that the width of quasi-liquid layers between solid grains singularly increases on heating towards T and is associated with the rise of susceptibility, which can be almost infinite at T m , located in the immediate vicinity of T . It means that even a slight disturbance can have an extreme influence on the quasi-liquid layer. Such features may lead to final fragmentation at T m and the melting–liquidation. Such a model image creates a frame for linking continuous and canonic discontinuous phase transitions.
However, reliable experimental verification of Equations (2)–(4) encounters a fundamental problem: the volume occupied by quasi-liquid nanolayers is tiny compared to solid crystalline grains. Basically, physical methods record the response from solid grains and quasi-liquid nanolayers, which means that the latter’s contribution is almost negligible, and the detection of related temperature changes is impossible.
Recently, the authors of this work pointed out that dielectric research, in particular, the real part of dielectric permittivity, provides a chance for an experimental solution to the problem. Namely, the dielectric response from a liquid is qualitatively larger than from solid-state crystal [43,44]. Moreover, in the temperature range of the pre-melting effect, one should expect an almost constant value of the contribution from solid grains, whereas a decisive temperature dependence should be expected for the contribution from liquid nanolayers. This means that scans of dielectric properties can extract the contribution from quasi-liquid nanolayers, which is essential for the analysis of the pre-melting effect via the Lipovsky model [41,42]. These beneficial features of dielectric studies for studying the pre-melting effect were confirmed in recent studies of nitrobenzene [25] and linseed oil [26].

4. Results and Discussion

For decades, determining the pre-transitional anomaly in the homogeneous liquid phase when approaching the critical consolute point has been challenging. The first studies carried out by Arkadiusz Piekara in the 1930s showed a minimal ‘bending down’ from the visually detected linear behavior in the immediate vicinity of the critical consolute temperature T C [45]. From the 1960s until the late 1980s, some studies confirmed the result by Piekara, but most often, the linear changes with a pre-critical anomaly or a strong ‘bending up’ was observed, particularly in critical mixtures containing a dipolar component, which is the most convenient for experiments [46,47,48,49,50,51,52,53,54,55,56,57,58,59,60,61,62,63,64,65,66,67,68,69,70,71,72,73,74,75,76,77,78,79,80,81,82].
The Nobel Prize for Kenneth G. Wilson in 1980 can be considered the formal establishment of the physics of critical phenomena [10]. Critical-type changes of various physical magnitudes had already been observed and described in models for almost all basic physical properties. A surprising exception and problem constituted pre-critical changes of a dielectric constant on approaching the critical consolute point, i.e., the most basic dielectric property, introduced by Michel Faraday in the mid-19th century [83]. From the modeling and theoretical point of view, the works of Goulon et al. turned out to be a breakthrough (1979, [84]) and (Sengers et al., 1980 [85]), which led to the following equation:
ε T = ε C + A × T T C φ + B × T T C φ + Δ + C × T T C
where the critical exponent φ = 1 α and exponent α is the standard heat capacity critical behavior for T T C .
The report mentioned above also includes a term related to the so-called correction-to-scaling, which later research showed is necessary when describing pre-critical changes, taking into account not only the immediate vicinity of T C , but also its relation to the correction-to-scaling exponent Δ = 0.50 [86].
The model changes described by Equation (5) suggest a pre-transitional effect, as observed in Piekara’s first experiment, which was rarely obtained in the following decades. Visible in Equation (5) is the connection with the critical anomaly of specific heat, and indeed of internal energy, as indicated by Mistura (1973, [87]): d ε T / d T   C V   T T C α . For d = 3 , n = 1 universality class of critical phenomena, to which belongs one component systems with the gas–liquid critical point and binary mixture of limited miscibility with the critical consolute point: α 0.115 [11].
The problem with the experimental evidence of ε ( T ) changes in critical mixtures was solved in 1989 by Thoen [67], who pointed out the fundamental importance of the measurement frequency. When increasing it above f = 100   k H z , one could avoid the polarizing influence of the Maxwell–Wagner effect, leading to the anomalous pre-transitional increase and an apparent/virtual lack of a dielectric constant critical effect. The second experimental factor was the new sampling technique related to balancing the measurement device every few milliseconds implemented in the 1980s. Such experimental conditions were difficult, if not impossible, to implement with the previously used manual, or later semi-automatic, Wheatstone bridge-based devices. Notably, Piekara used a device developed to study the nonlinear dielectric effect (NDE), i.e., changes in the dielectric constant in a strong electric field E, to measure the dielectric constant. He used a resonant circuit with a frequency of ~500 kHz, manually switched for the shortest possible time.
In the 1970s and 1980s, there was a growing problem related to another primary characteristic of the systems discussed here: the so-called diameter of the phase coexistence curve characterizing the biphasic domain. In 1886, Cailletet and Mathias proposed the so-called rectilinear diameter law [88,89]:
d T = ρ u p p e r + ρ l o w e r 2 = ρ C + a T C T
where ρ u p p e r and ρ l o w e r are densities in the lower and upper coexisting phases.
The Cailletet–Mathias ‘law’ was implemented for phase equilibria below the gas–liquid critical point and below the critical consolute temperature in binary mixtures. In the latter case, the concentration of one of the components in coexisting phases was considered. The equation above was also commonly applied when monitoring changes in physical properties, such as the refractive index, in the coexisting phases. Until the end of the 1970s, the Cailletet–Mathias ‘law’ constituted a basic tool in chemical physics and related material engineering and phase equilibria tests for estimating critical point parameters, particularly critical density, concentrations, and refractive index.
However, at the end of the 1970s, theoretical model considerations indicated that the diameter of the coexistence curve in the biphasic or mesophase domain in the equation above should contain an additional critical term, namely, d T A × T C T 1 α [90,91]. It presented the challenge for a new, simple, precise method for estimating critical point parameters related to the coexistence curve, which has been solved only recently. However, one more problem appeared: insufficient convincing experimental evidence proving theoretical predictions. At that time, the belief about the ‘weakness’ of the critical diameter anomaly became widespread, which led to the need for experimental research of extraordinary accuracy and resolution. Jungst’s research [92] on electrical conductivity in mercury and rubidium below the liquid–gas critical point turned out to be groundbreaking, which led Rowlinson, one of the classics in the study of phase equilibria, to declare the end of one of the classical laws of physics, i.e., the rectilinear diameter law [90].
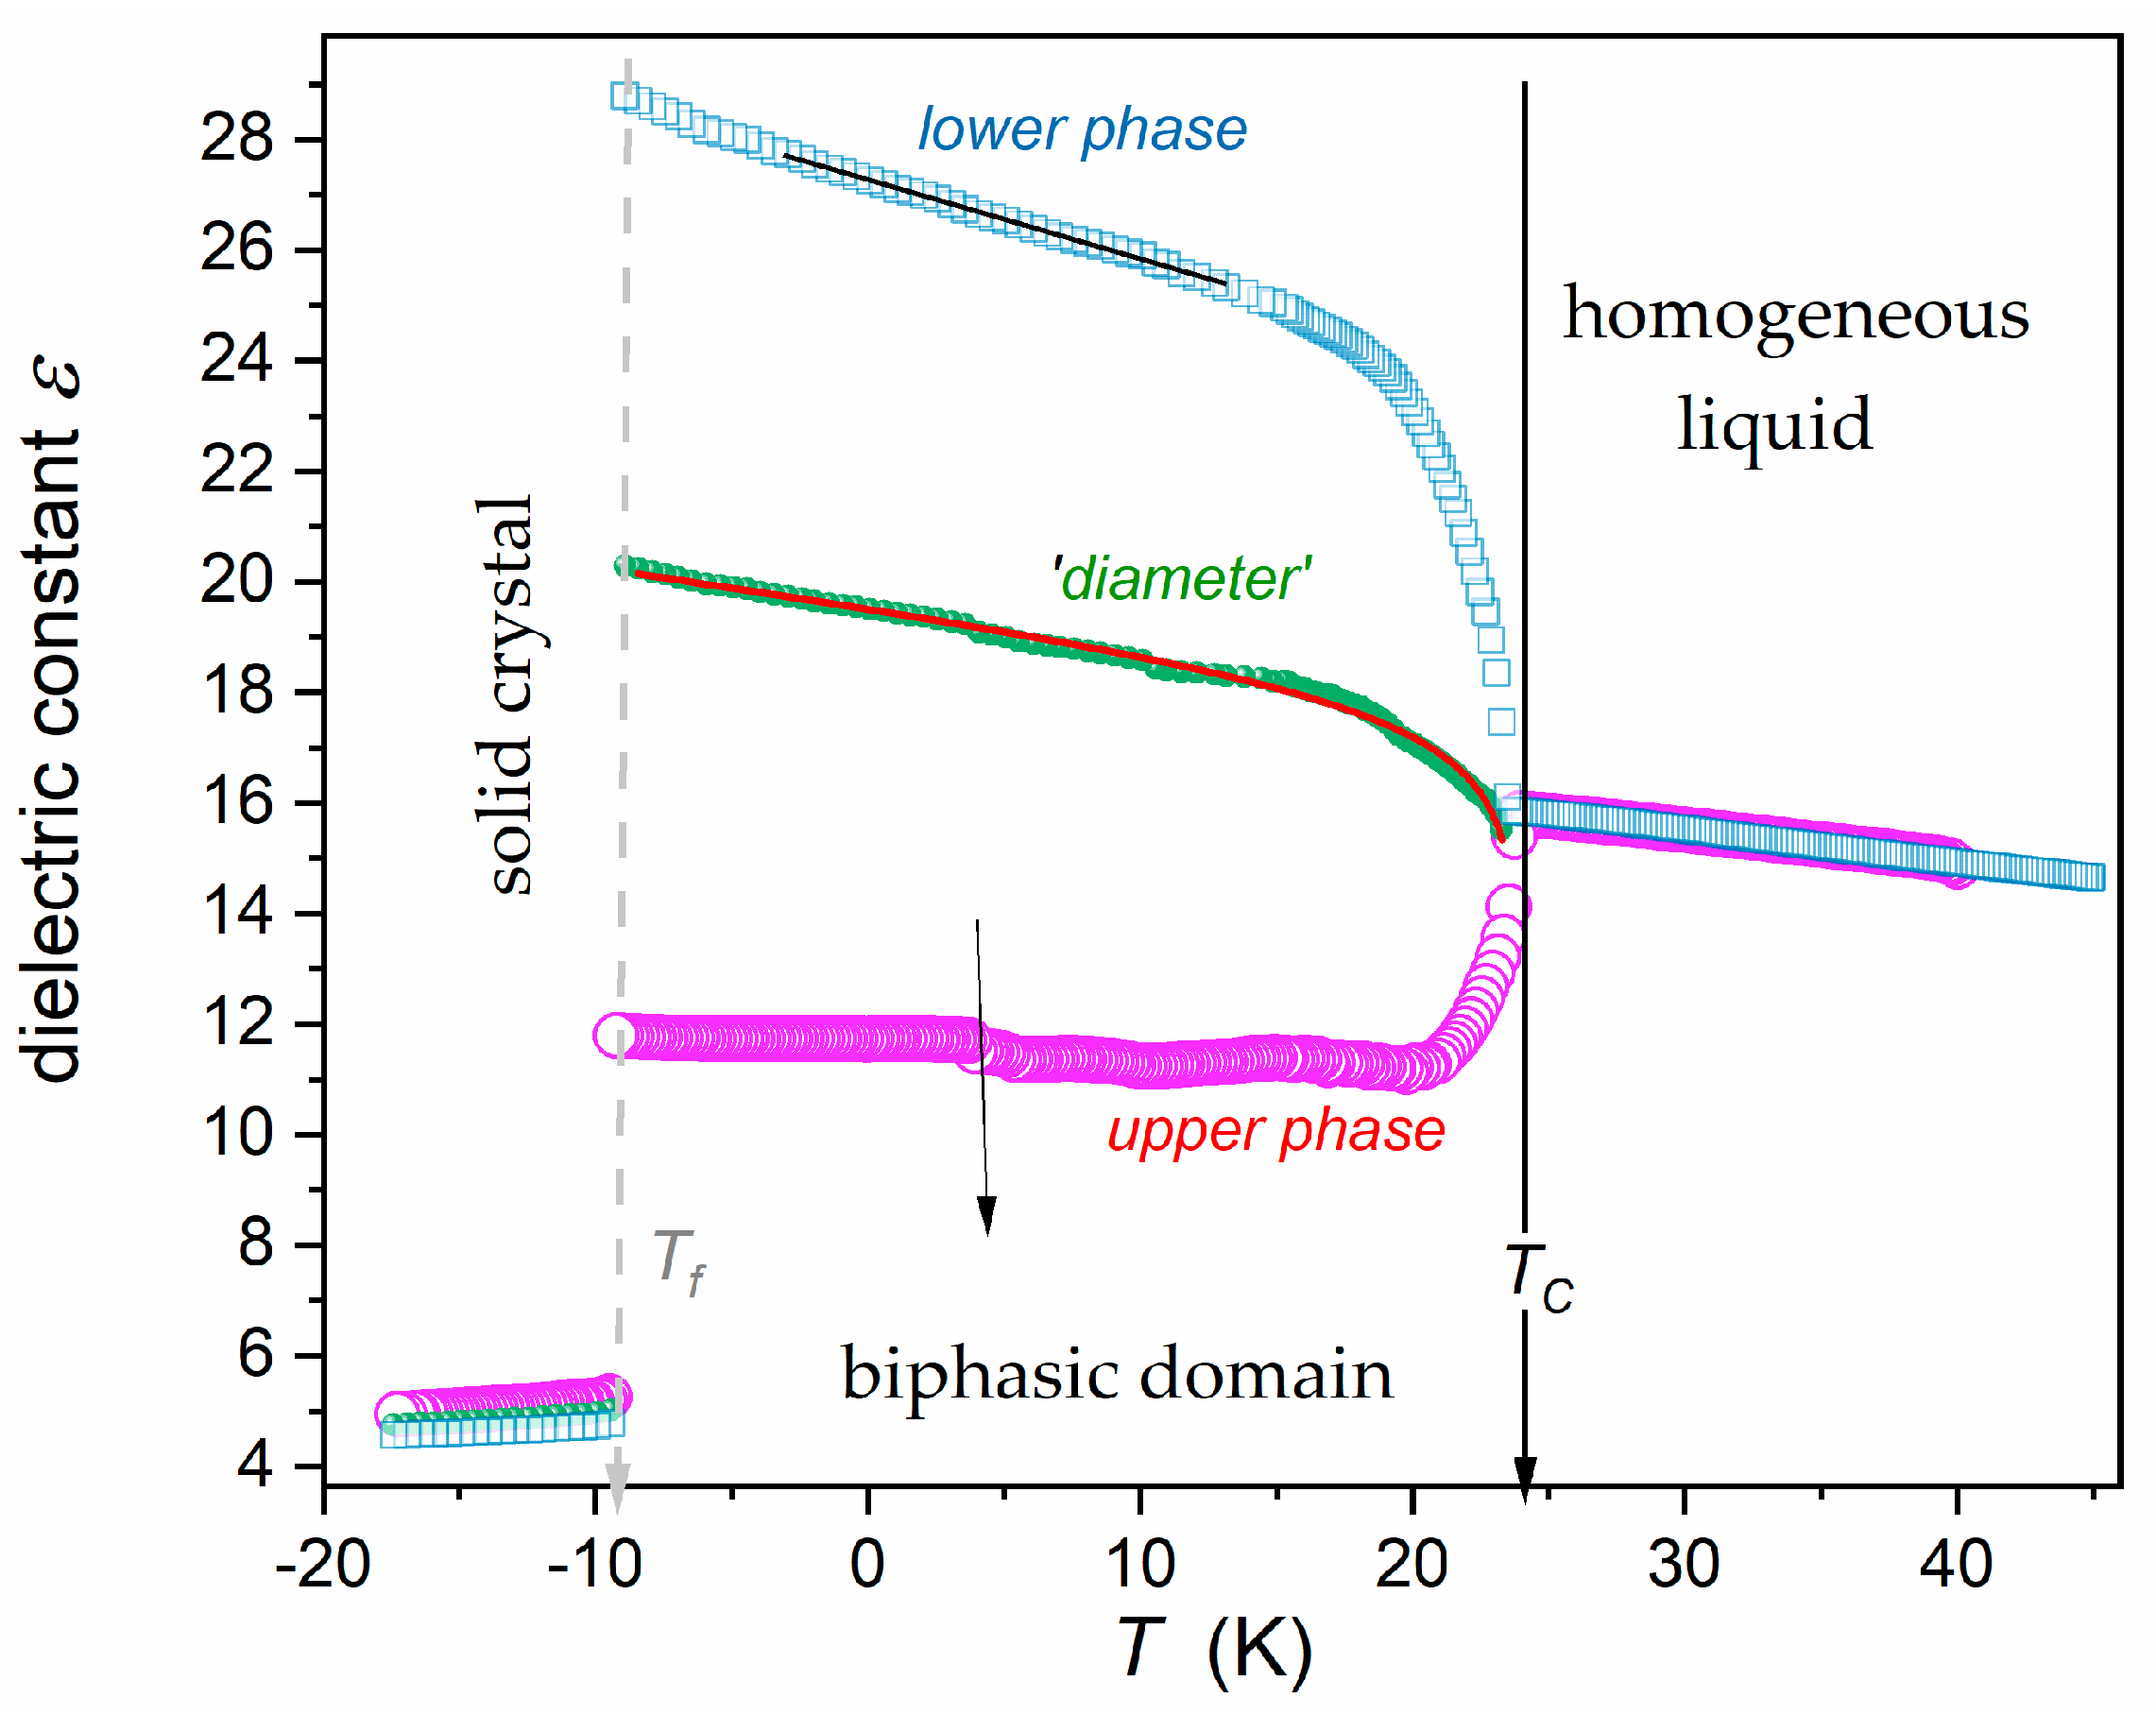
Figure 3 shows the results of dielectric constant changes, which were taken as ε = ε f = 1   M H z , i.e., in the static frequency domain where the impact of ionic effects is negligible, and the notable shift of dielectric permittivity does not change the value of ε f . The presented results are for the homogeneous liquid and coexisting phases, and the solid crystal phase on cooling. In the homogeneous liquid phase, the pre-transitional effect seems to be absent, but this is only a matter of the scale used in Figure 3. However, a very strong pre-critical anomaly for the coexistence curve diameter is visible, perfectly reproducing the relationship in complete agreement with the model predictions:
ε d i a m . T = ε u p p e r + ε l o w e r 2 = ε C d + A d × T C T φ + B d × T C T φ + Δ + C d × T C T
This result shows that a strong and relatively easy-to-parametrize coexistence curve diameter anomaly is easy to obtain if the tested binary liquid mixture is based on components with qualitatively different reference values of the monitored property. In this case, the critical solution is decane–nitrobenzene. Decane is a non-polar n-alkane with a reference dielectric constant ε = 2.0 [43], and nitrobenzene is a canonical dipolar compound with a dielectric constant ε = 35.6 . The values are given for room temperature.
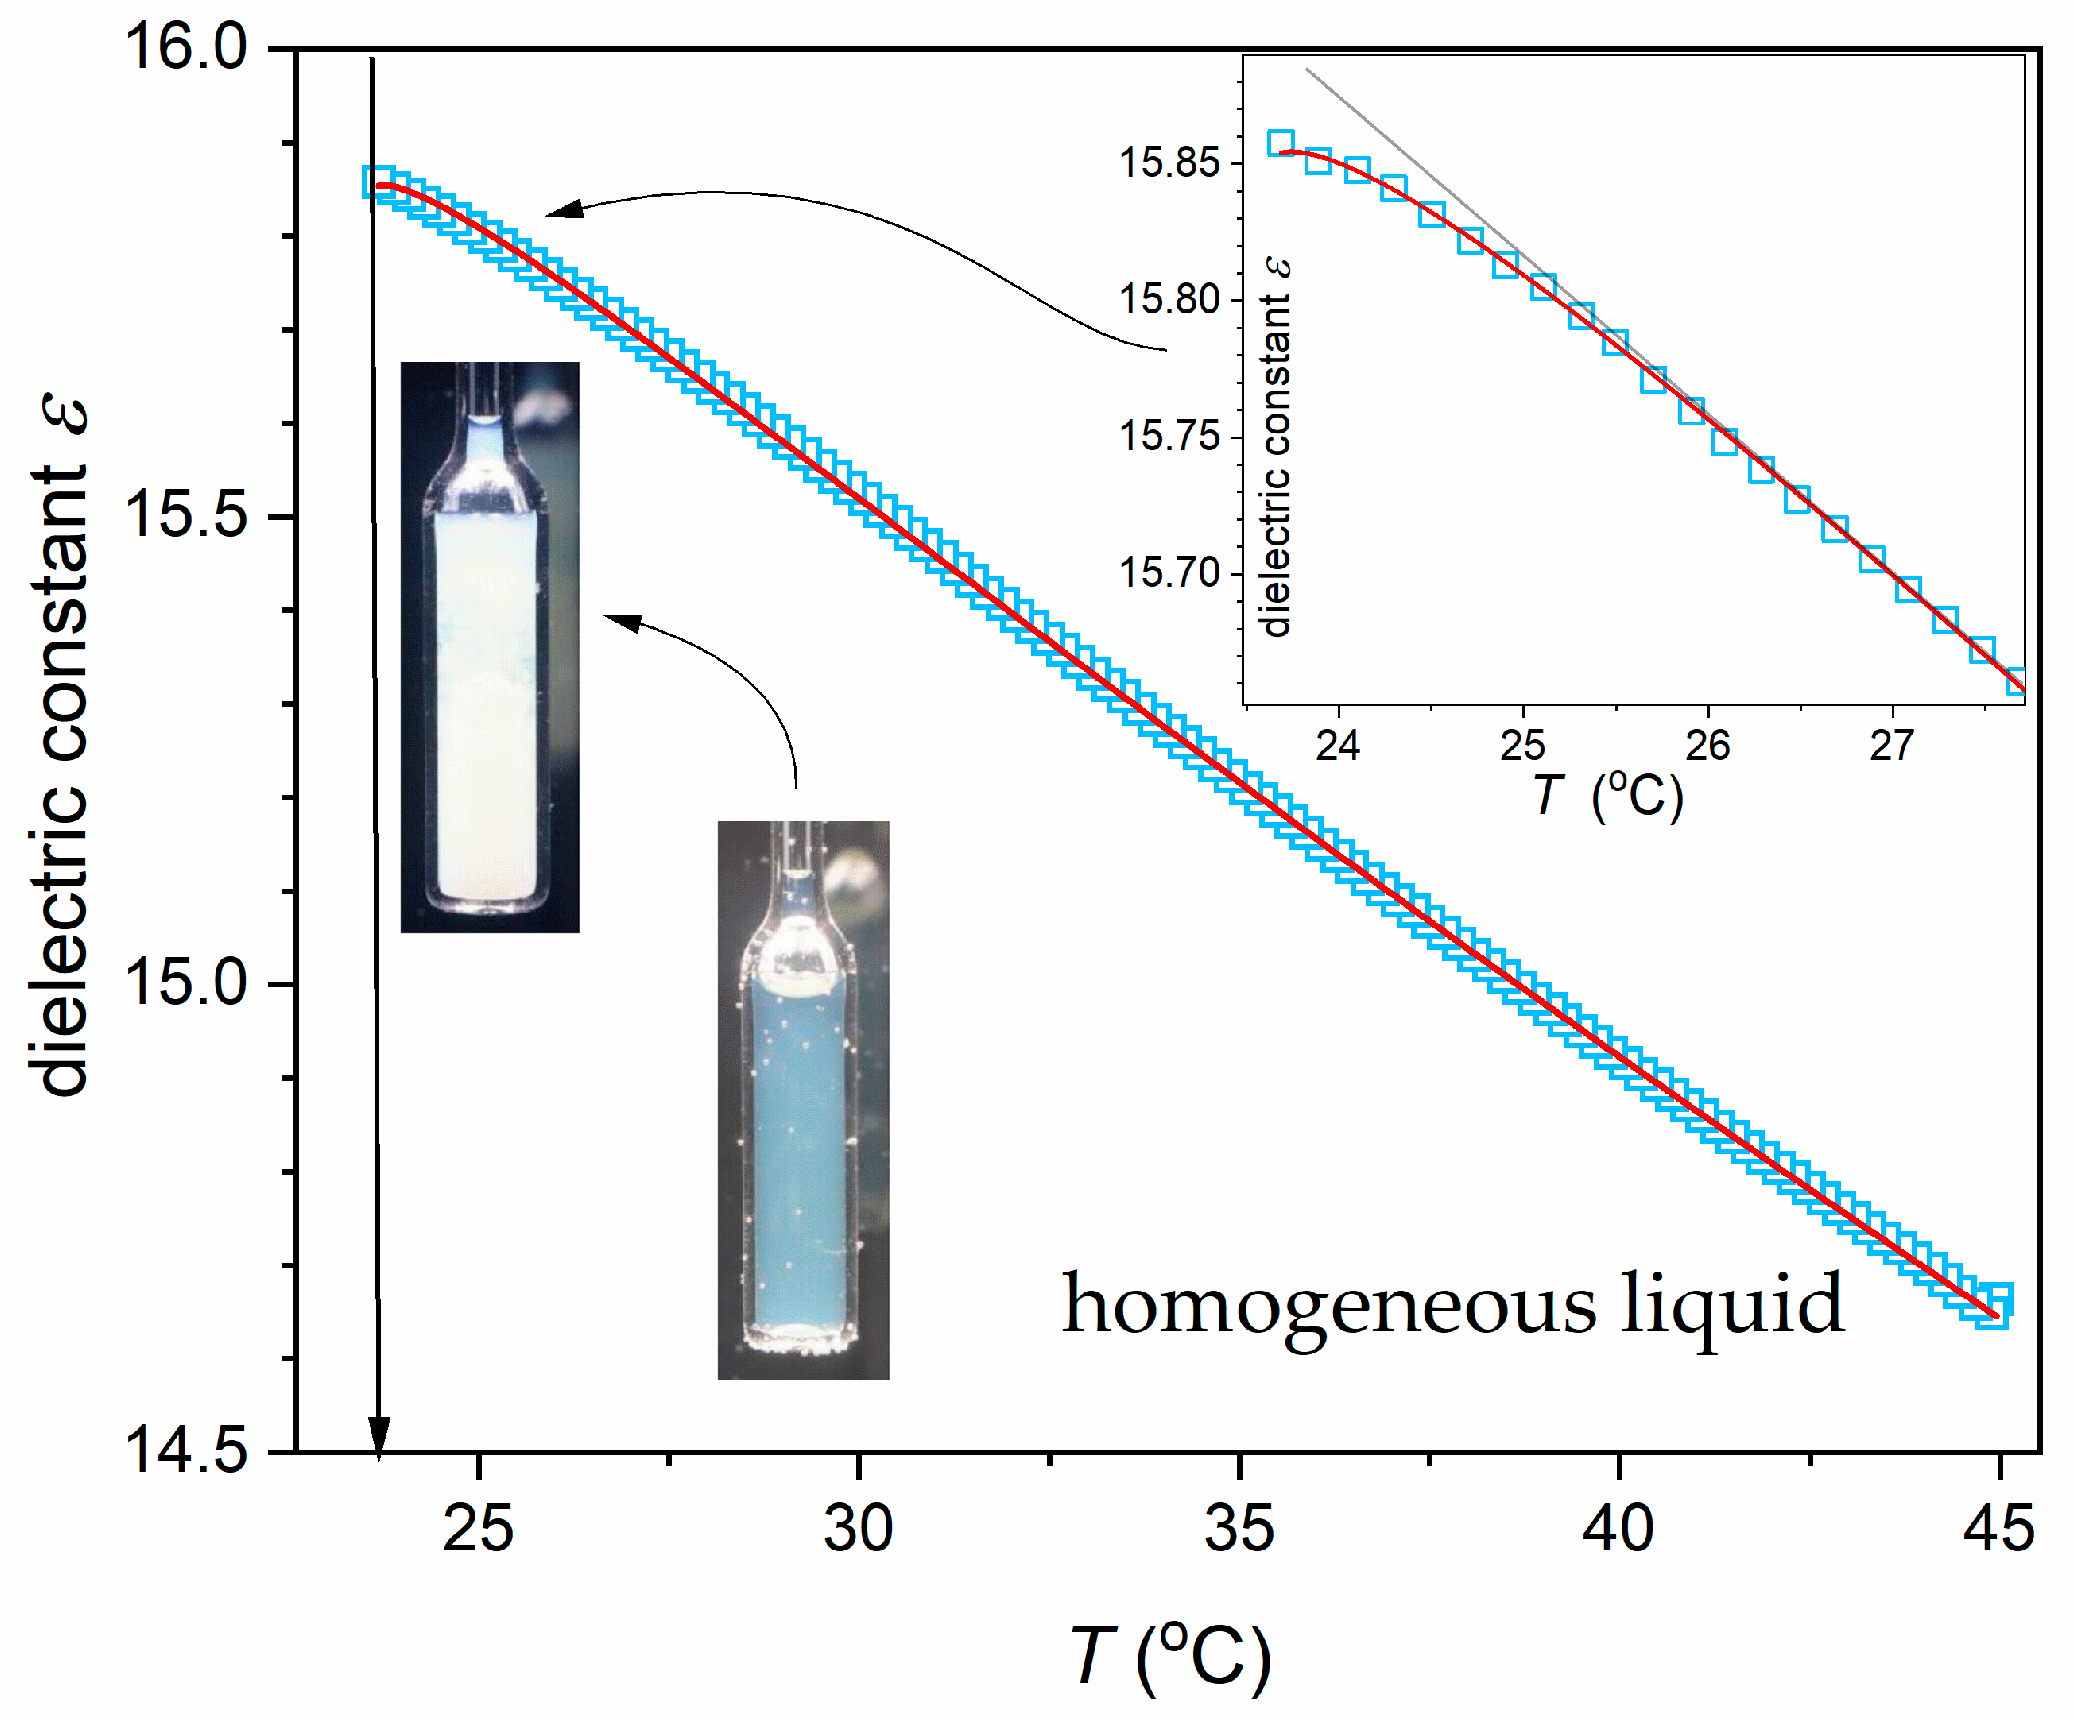
The focused insight for the homogeneous liquid phase is presented in Figure 4. It illustrates the typical pattern observed for pre-critical changes in the dielectric constant and includes the superior portrayal by Equation (5). Table 1 presents fitted parameter values. It also contains results related to the diameter, portrayed by Equation (7) for the biphasic domain. Equations (5) and (7) can be considered specific counterparts for both sides of the critical consolute temperature.
Considering the strength of the pre-transitional effect, the difference between the real value of the dielectric constant ε T C and the value obtained by the extrapolation from the apparent linear behavior remote from the critical temperature ε e x t . T C , one obtains Δ ε = ε e x t . T C ε T C 0.04 in the homogeneous liquid phase and Δ ε 1.60 . The latter value is 40x larger than that of the homogeneous phase.
It is worth stressing that the linear terms in Equations (5) and (7) do not describe the behavior remote from the singular temperature, where all the terms included in these dependencies remain relevant. It is the functional features of the pre-transitional behavior associated with the positive leading critical exponent φ term.
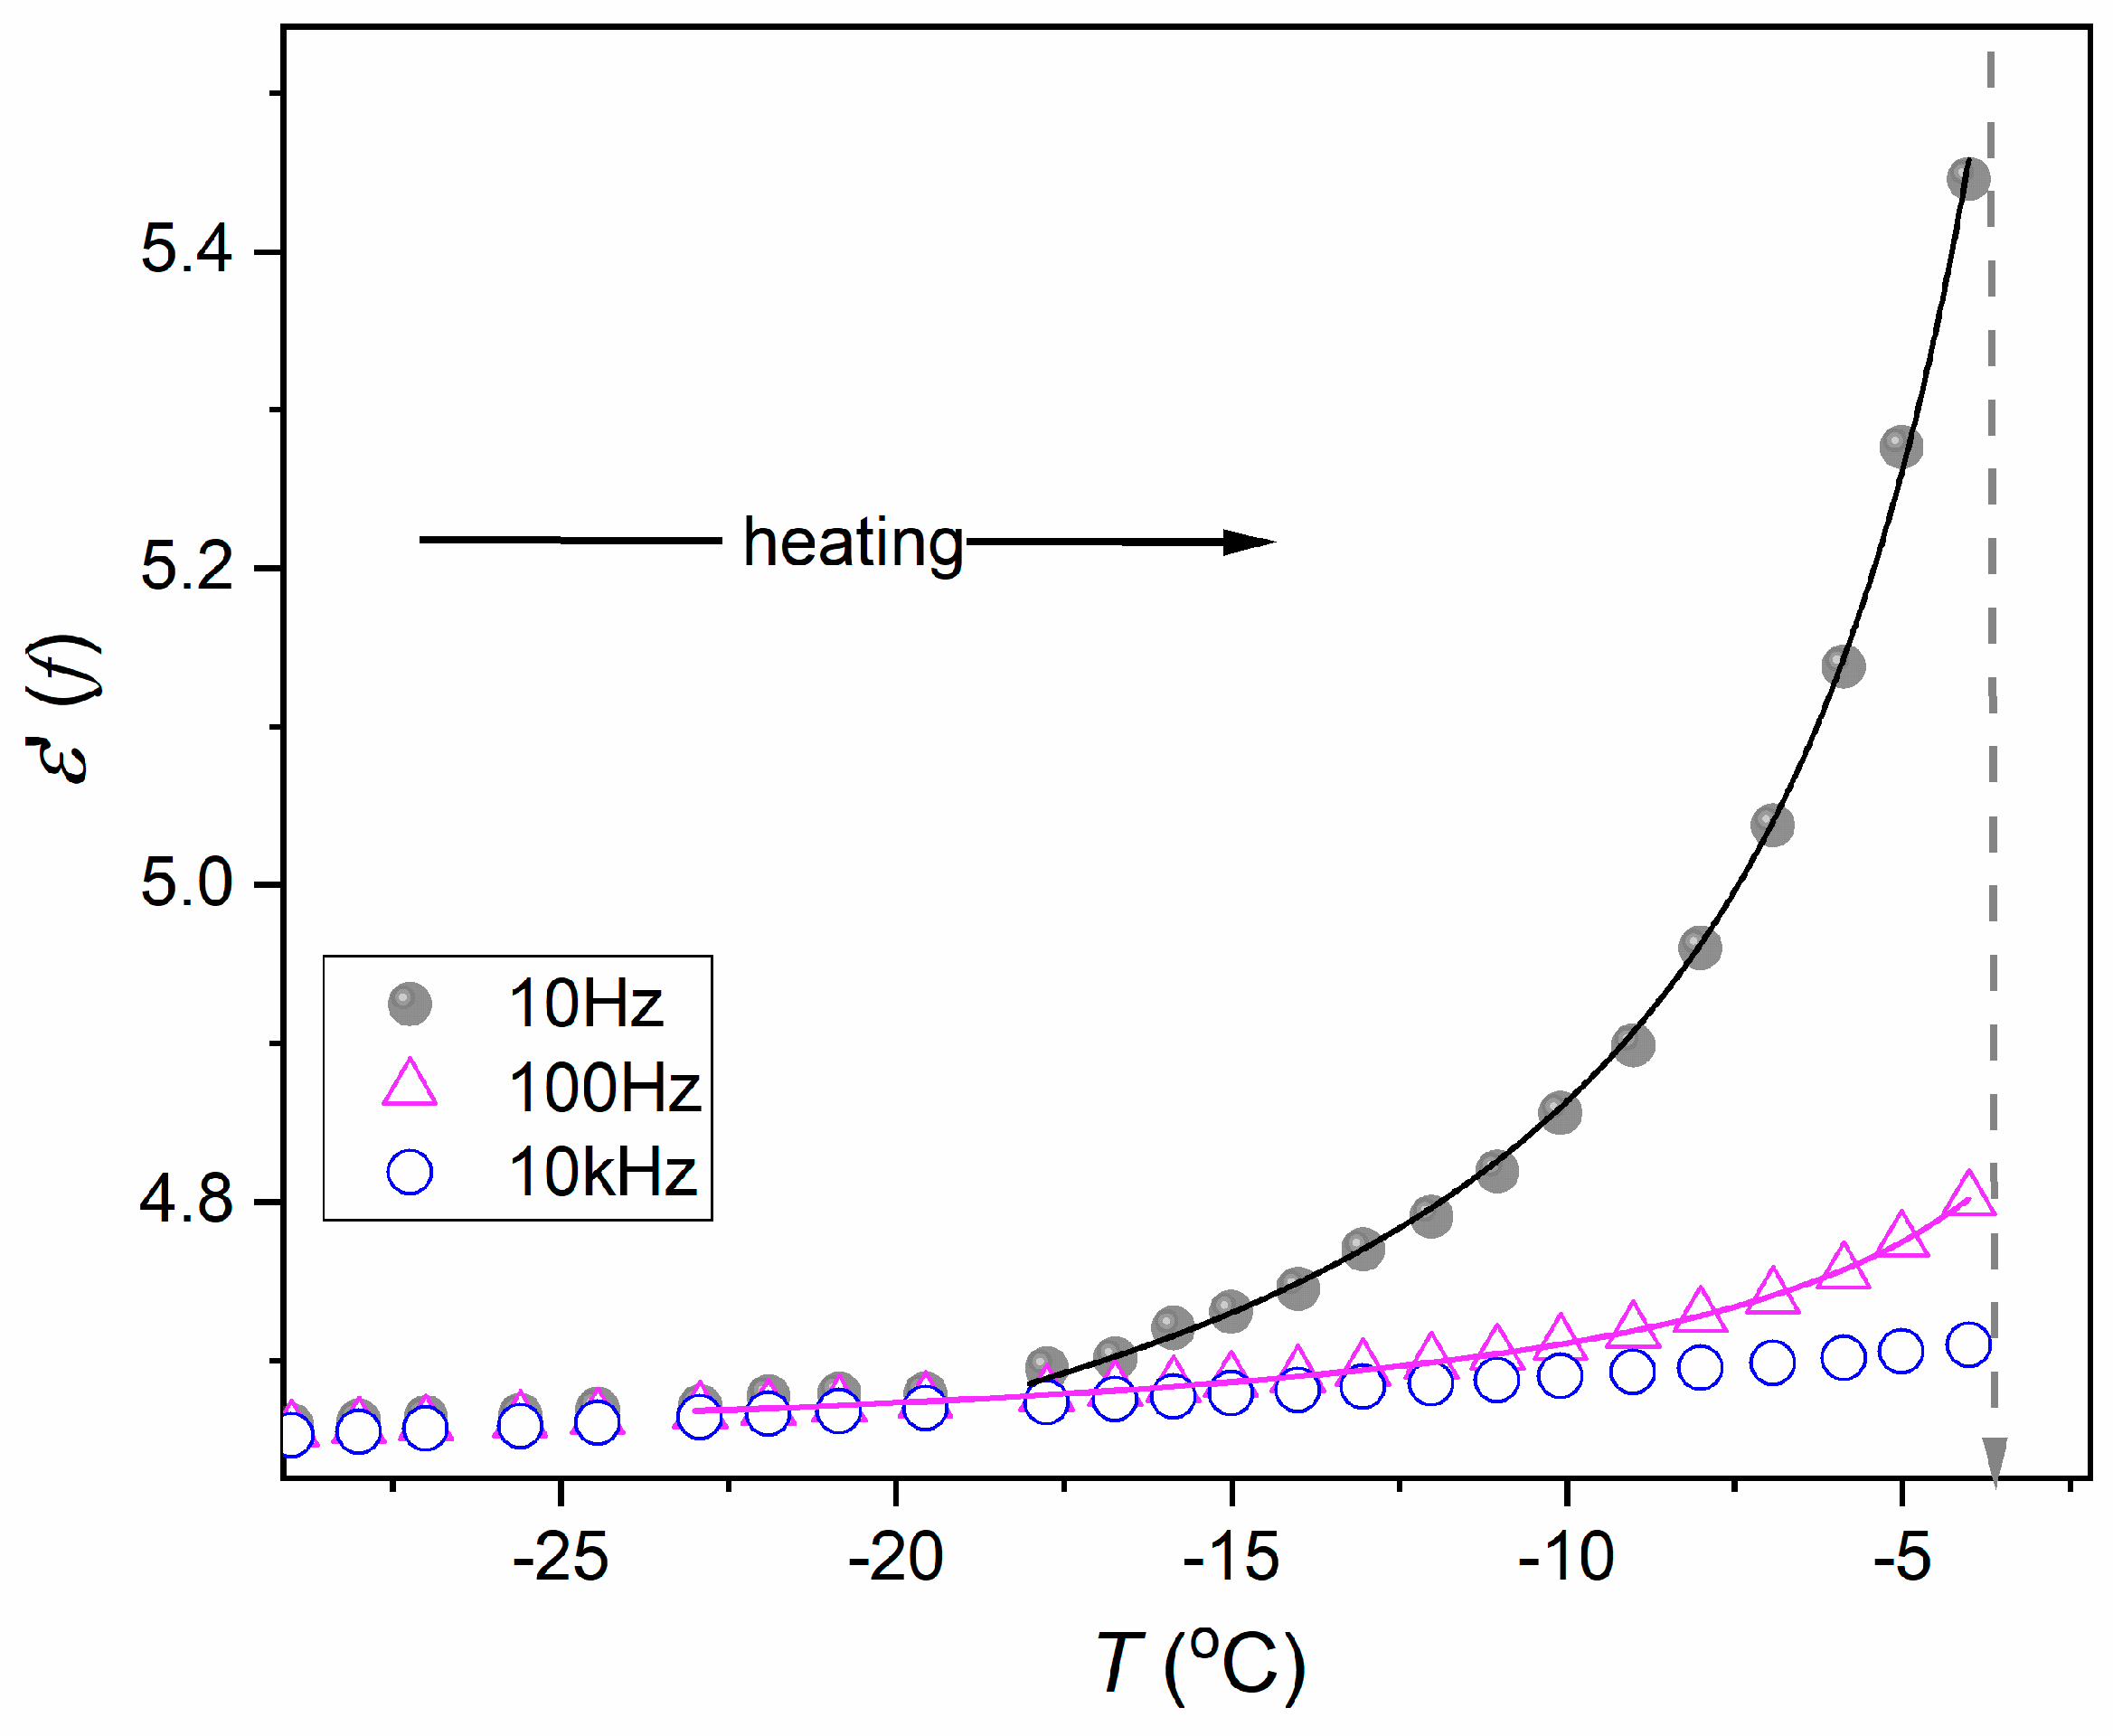
Figure 5 presents the behavior of the real part of dielectric permittivity for a few selected frequencies in all the tested phases in the nitrobenzene–decane mixture on cooling from the homogeneous liquid phase. The semi-log scale enables a better insight into pre-transitional changes, particularly in the solid crystal domain, which is related to small values of dielectric constants.
The following equation can well portray the post-freezing pre-transitional effects in the solid crystal phase:
ε T = C + A T T
where parameters C , A = c o n s t and T = T f are the extrapolated singular temperature.
The solid-state post-freezing effect appears for the static domain frequencies, which manifest by overlapping ε T changes for f = 100   H z , 10   k H z , 1   M H z . Equation (8) also portrays strong pre-transitional–post-freezing changes for the low-frequency domains, namely, f = 10   H z . It is notable that for the latter, the singular temperature T f is located close to the discontinuous freezing phase transition temperature. In Figure 3, the pre-critical changes in the homogeneous liquid phase are not visible because of the applied scale. Interestingly, except in the vicinity of T C , changes for the biphasic domain in Figure 3 are well approximated by a simple exponential pattern ε T e x p c / T , as shown by the solid line.
Figure 6 shows the case of the ‘classic’ pre-melting effect appearing on heating from the solid crystal phase near the melting temperature. It is notably lesser than the post-freezing effect shown in Figure 5, but the experimental resolution enabled its parameterization shown by solid curves in Figure 6. They are also related to Equation (8), with the singular temperature T = T m . Notably, such portrayal also occurs for the low-frequency domain, and it is particularly pronounced for the measurement f = 10   H z .
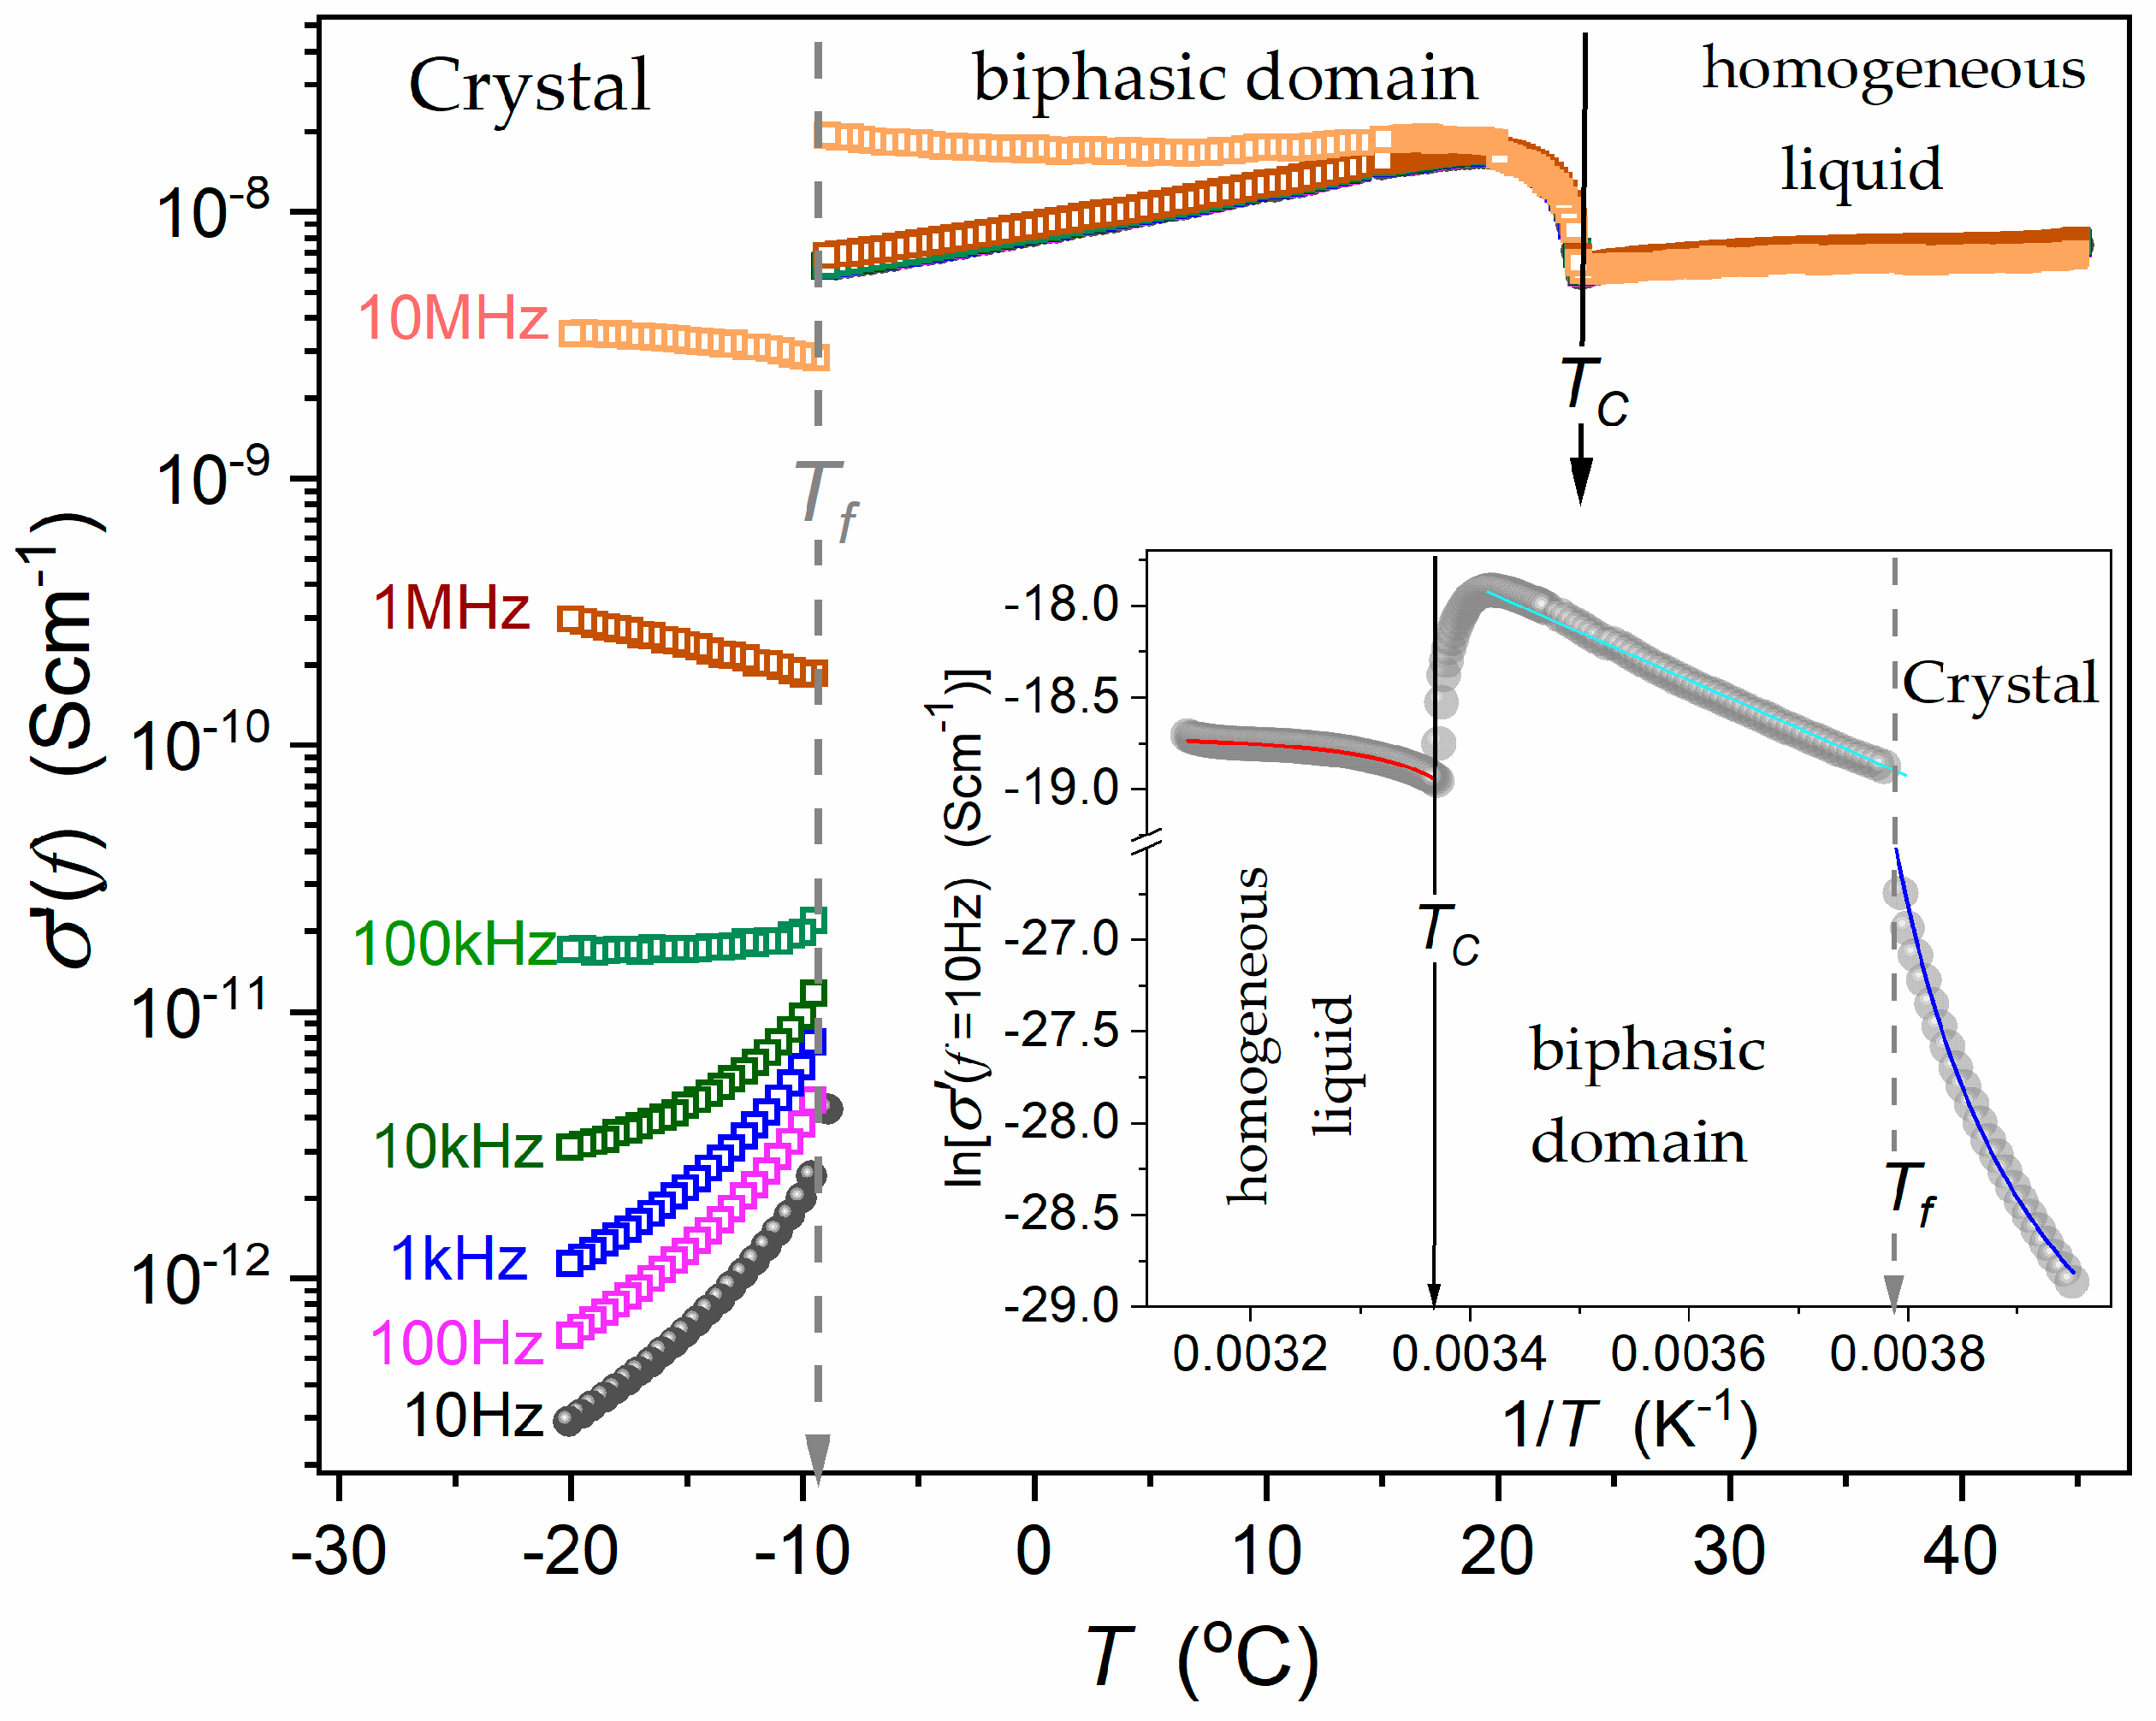
Figure 7 presents changes in the real part of electric conductivity reflecting translational shifts of ionic species/contaminations or, alternatively, translational shifts of components (nitrobenzene, decane). In the homogeneous liquid phase and in the lower (nitrobenzene-rich) phase in the biphasic domain, changes of σ f , T for frequencies f 1   M H z explicitly overlap, which suggests that it can be treated as the DC electric conductivity σ f , T . This is not the case in the solid phase.
The plot uses the log scale for electric conductivity to visualize changes of σ f covering 5 decades in values. The inset presents temperature changes for the lowest tested frequency ( f = 10   H z ) in a way that facilitates detailed insight.
The solid curves in the inset in Figure 7, offering a fair portrayal of the experimental data, are portrayed by parallel equations:
σ T = σ e x p D T T 0
with the following parameters: T 0 = 274   K , D = 45.2   K , σ = 2.3 × 10 20 in the homogeneous liquid and T 0 = 290   K , D = 1.9   K , σ = 6.8 × 10 9 in the solid phase. The equation above resembles the Vogel–Fulcher–Tammann (VFT) equation [27]. Nevertheless, such recalling cannot be proper since it is linked to the glass transition, which is absent in the discussed phenomena. In the opinion of the authors, it can be considered rather a simple extension of the basic Arrhenius equation σ T = σ e x p E a / R T , where E a = c o n s t is the activation energy by a single parameter, i.e., the singular temperature T C 0 , T f 0 . It yields the ‘functional flexibility’ for portraying results presented in the inset in Figure 7. describing changes of DC electric conductivity in the homogeneous phase, the relation resembling Equation (5), and associated with six adjustable parameters. Equation (9) requires only three adjustable parameters.
A comparison of Equation (9) and the basic Arrhenius dependence extended to the super-Arrhenius (SA) [27] form with the apparent temperature-dependent activation energy yields the following: E a T = R T D / T T = R D / T T / T = D t , where D = D R = c o n s t and t = T T / T is the relative distance from the extrapolated singular temperature. All these yield the simple form (SA) of Equation (9): σ T = σ e x p D t 1 .

5. Conclusions

5.1. The Surrounding of the Critical Consolute Point

The results presented above show a consistent view of pre-transitional properties in a critical binary mixture from the homogeneous liquid via the coexisting phases of the mesophase to the solid phase, obtained in a single high-resolution broadband dielectric spectroscopy scan. Studies have been carried out on a nitrobenzene–decane mixture composed of a non-dipolar and a dipolar component. Such systems are considered the most effective for dielectric studies of pre-transitional effects, at least in the homogeneous liquid phase. In the homogeneous phase, the superior portrayal by Equation (5) in agreement with basic reference models by Goulon et al. [84] and Sengers et al. [85] has been shown. For the biphasic mesophase domain, the counterpart of Equation (5), namely, Equation (7), with the same critical exponent φ = 1 α fairly well portrays the diameter—the average of dielectric permittivity in coexisting phases. It is worth stressing that the strength of the anomaly present, estimated by the value of Δ ε , is 40x larger than in the homogeneous liquid phase.

5.2. The Surrounding of the Liquid–Solid Discontinuous Transition

The pre-transitional effect also appears in the solid phase, namely, the pre-melting effect on heating from the solid phase and the post-freezing effect on cooling from the liquid phase. The latter is generally not expected for the discontinuous liquid–solid transition. Formally, the pre-melting effect is expected only on heating from the solid crystalline/solid phase and is associated with the granulation appearing for T T m . It was indicated in Ref. [25] that quasi-liquid layers between grains can lead to a quasi-negative pressure, leading to weakness of the intermolecular interactions and creating the conditions for the Clausius–Mossotti local field, for which the Mossotti catastrophe behavior [43,44] in agreement with Equation (8) may appear. On the other hand, the dielectric susceptibility χ = ε 1 emerging under such conditions is directly related to the order parameter-related susceptibility and to the susceptibility used by Lipovski when deriving Equation (4). Such a mechanism can explain the pre-melting effect shown in Figure 7 for near-static frequencies f = 10   k H z or f = 100   k H z . However, a much stronger pre-melting effect described by Mossotti catastrophe-type Equation (8) appears for f = 10   H z in the low-frequency domain, where translational processes dominate. An even stronger post-freezing effect for f = 10   H z , also described by Equation (8), is visible in Figure 5 on cooling from the liquid phase. In the given case, the situation is unique because nitrobenzene’s melting temperature is equal to T m 4 6   ° C . For carefully cleaned nitrobenzene, it can be supercooled to T f 10   ° C , which agrees with the solidification temperature in Figure 3 and Figure 4. Regarding decane, its melting temperature is equal to T m 29   ° C . Hence, one can expect the post-freezing effect to be associated with fast-growing nitrobenzene solid/crystalline grains submerged in decane. Such conditions can explain why the post-freezing effect (Figure 4) is notably stronger than the pre-melting effect in Figure 6.
Notwithstanding, the question arises as to why the catastrophe Mossotti-type (Equation (8)) that appears for the real part of dielectric permittivity in the low-frequency domain remains. In the authors’ opinion, the domination of translational processes in the LF domain for the liquid dielectric in nanolayers between solid grains can lead to the temporal separation of positive and negative charges. It can create a sequence of weakly interacting quasi-dipoles. All these can yield conditions formally required for the Clausius–Mossotti local field, thus leading to Equation (8).
The fair portrayal of electric conductivity by SA-type Equation (9) is worth stressing, requiring only three adjustable parameters, which can constitute a base for modeling pre-transitional properties of this magnitude.
This report presents a wide temperature range scan of dielectric properties covering the static and low-frequency domains in a nitrobenzene–decane critical mixture. Notably, the LF domain, characterized by the strong rise of both components of dielectric permittivity, remains a challenge for origins and data analysis. Recently, it was indicated that at least a part of this unique behavior can be explained by the translational shift of basic molecules in the given dielectric system [93]. The dominant explanations link the LF domain to the translations of hypothetical ionic contaminations, finally leading to the ‘parasitic’ polarization of electrodes. This issue is extensively discussed in a very recent report [94]. The authors stress that the behavior discussed in this report is related to pre-transitional effects, and it is beyond the discussion related to a hypothetical ‘parasitic’ polarization.

Author Contributions

J.K. is responsible for the measurements, analysis, and report preparation; A.D.-R. is responsible for the conceptualization, methodology, analysis, validation, report preparation, and supervision; S.J.R. is responsible for the conceptualization, methodology, analysis, report preparation, and resources; S.S. supported the measurements and discussions. All authors have read and agreed to the published version of the manuscript.

Funding

This study was supported by the National Science Center (NCN, Poland), OPUS grant, ref. 2022/45/B/ST5/04005, headed by S.J. Rzoska.

Data Availability Statement

The raw data supporting the conclusions of this article will be made available by the authors on request.

Acknowledgments

The authors thank the National Centre for Science (NCN, Poland) for the support of the grant.

Conflicts of Interest

The authors declare no conflicts of interest.

References

  1. Stanley, H.E. Introduction to Phase Transitions and Critical Phenomena; Oxford University Press: New York, NY, USA, 1971. [Google Scholar]
  2. Skripov, V.P.; Faizulin, M.Z. Crystal-Liquid-Gas Phase Transitions and Thermodynamic Similarity; Wiley-VCH: Berlin, Germany, 2006. [Google Scholar]
  3. Atkins, P.; de Paula, J. Atkin’s Physical Chemistry; Oxford University Press: New York, NY, USA, 2010. [Google Scholar]
  4. Khabibullaev, P.K.; Saidov, A.A. Phase Separation in Soft Matter Physics; Springer: Berlin/Heidelberg, Germany, 2003. [Google Scholar]
  5. Arkenbout, G.F. Melt Crystallization Technology; Technomic Pub. Co.: Lancaster, UK, 1995. [Google Scholar]
  6. Rzoska, S.J.; Drozd-Rzoska, A. Criticality-related fundamental bases for new generations of gas–liquid, liquid–liquid, and liquid (LE) extraction technologies. Eur. Phys. J. E 2022, 45, 67. [Google Scholar] [CrossRef] [PubMed]
  7. Poole, C.F. Liquid Phase Extraction; Elsevier Science: Amsterdam, The Netherlands, 2019. [Google Scholar]
  8. Ehrenfest, P. Phasenumwandlungen im ueblichen und erweiterten Sinn, classifiziert nach dem entsprechenden Singularitaeten des thermodynamischen Potentiales. Verhandlingen der Koninklijke Akademie van Wetenschappen (Amsterdam). In Communications from the Physical Laboratory of the University of Leiden; Springer Nature: Berlin/Heidelberg, Germany, 1933; Volume 36, pp. 153–157. [Google Scholar]
  9. Jaeger, G. The Ehrenfest Classification of Phase Transitions: Introduction and Evolution. Arch. Hist. Exact Sci. 1998, 53, 51–81. [Google Scholar] [CrossRef]
  10. Wilson, K.G.; The Renormalization Group and Critical Phenomena. Nobel Prize Lecture. Available online: https://www.nobelprize.org/prizes/physics/1982/wilson/lecture/ (accessed on 4 June 2024).
  11. Anisimov, M.A. Critical Phenomena in Liquid and Liquid Crystals; Gordon and Breach Science Publishers: Philadelphia, PA, USA, 1991. [Google Scholar]
  12. Honig, J.; Spalek, J. A Primer to the Theory of Critical Phenomena; Elsevier: Amsterdam, The Netherlands, 2018. [Google Scholar]
  13. Andrews, T. The Bakerian Lecture—On the continuity of the gaseous and liquid states of matter. Phil. Trans. R. Soc. 1869, 159, 575–590. [Google Scholar]
  14. Gibbs, J.W. Method of Geometrical Representation of the Thermodynamical Properties of Substances by Means of Surfaces. Trans. Conn. Acad. Sci. 1873, 2, 382–404. [Google Scholar]
  15. Van der Waals, J.D. Over de Continuiteit van den Gasen Vloeistoftoestand (On the Continuity of the Gas and Liquid State). Ph.D. Thesis, University of Leiden, Leiden, The Netherlands, 1873. [Google Scholar]
  16. Geiger, H.; Scheel, K. Handbuch der Physik Vol. 10; Springer: Berlin/Heidelberg, Germany, 1926. [Google Scholar]
  17. Mierzwa, M.; Paluch, M.; Rzoska, S.J.; Zioło, J. The liquid−glass and liquid−liquid transitions of TPP at elevated pressure. J. Phys. Chem. B 2008, 112, 10383–10385. [Google Scholar] [CrossRef] [PubMed]
  18. Hsu, C.W.; Largo, J.; Sciortino, F.; Starr, F.W. Hierarchies of networked phases induced by multiple liquid-liquid critical points. Proc. Natl. Acad. Sci. USA 2008, 105, 13711–13715. [Google Scholar] [CrossRef] [PubMed]
  19. Tanaka, H. Liquid–liquid transition and polyamorphism. J. Chem. Phys. 2020, 153, 130901. [Google Scholar] [CrossRef] [PubMed]
  20. Neophytou, A.; Chakrabarti, D.; Sciortino, F. Topological nature of the liquid–liquid phase transition in tetrahedral liquids. Nat. Phys. 2022, 18, 1248–1253. [Google Scholar] [CrossRef]
  21. Kumar, A.; Krishnamurthy, H.R.; Gopal, E.S.R. Equilibrium critical phenomena in binary liquid mixtures. Phys. Rep. 1983, 98, 57–143. [Google Scholar] [CrossRef]
  22. Drozd-Rzoska, A.; Rzoska, S.J.; Kalabiński, J. The impact of pressure on low molecular weight near critical mixtures of limited miscibility. ACS Omega 2020, 5, 20141–20152. [Google Scholar] [CrossRef] [PubMed]
  23. Rzoska, S.J.; Drozd-Rzoska, A.; Kalabiński, J. Critical concentration in binary mixtures of limited miscibility. Fluid Phase Equilib. 2021, 540, 112979. [Google Scholar] [CrossRef]
  24. Mei, Q.S.; Lu, K. Melting and superheating of crystalline solids: From bulk to nanocrystals. Prog. Mater. Sci. 2007, 5, 1175–1262. [Google Scholar] [CrossRef]
  25. Kalabiński, J.; Drozd-Rzoska, A.; Rzoska, S.J. Giant premelting effects for solid-liquid discontinuous transition in nitrobenzene under compression. Crystals 2023, 13, 247. [Google Scholar] [CrossRef]
  26. Drozd-Rzoska, A.; Rzoska, S.J.; Łoś, J. Supercriticality, glassy dynamics, and the new insight into melting/freezing discontinuous transition in linseed oil. Biophysica 2024, 4, 34–57. [Google Scholar] [CrossRef]
  27. Kremer, F.; Schonhals, A. Broadband Dielectric Spectroscopy; Springer: Berlin/Heidelberg, Germany, 2002. [Google Scholar]
  28. Landau, L. Zur Theorie der Phasenumwandlungen. Phys. Z. Sowjetunion 1937, 11, 26–47. [Google Scholar]
  29. Landau, L.; Lifshitz, E. Statistical Physics; Pergamon: London, UK, 1938. [Google Scholar]
  30. Łoś, J.; Drozd-Rzoska, A.; Rzoska, S.J.; Starzonek, S.; Czupryński, K.; Mukherjee, P. Near-continuous isotropic—Nematic transition in compressed rod-like liquid crystal based nanocolloid. J. Mol. Liq. 2023, 382, 121884. [Google Scholar] [CrossRef]
  31. Rzoska, S.J. Kerr effect and nonlinear dielectric effect on approaching the critical consolute point. Phys. Rev. 1993, 48, 1136–1143. [Google Scholar] [CrossRef] [PubMed]
  32. Yang, Y.; Asta, M.; Laird, B.B. Solid-liquid interfacial premelting. Phys. Rev. Lett. 2013, 110, 096102. [Google Scholar] [CrossRef] [PubMed]
  33. Samanta, A.; Tuckerman, M.E.; Yu, T.Q.; Ee, W. Microscopic mechanisms of equilibrium melting of a solid. Science 2014, 346, 729–732. [Google Scholar] [CrossRef] [PubMed]
  34. Pogatscher, S.; Leutenegger, D.; Schawe, J.E.K.; Uggowitzer, P.J.; Löffler, J.F. Solid—Solid phase transitions via melting in metals. Nat. Commun. 2016, 7, 11113. [Google Scholar] [CrossRef] [PubMed]
  35. Toledano, Ó.; Pancorbo, M.; Alvarellos, J.E.; Gálvez, Ó. Melting in two-dimensional systems: Characterizing continuous and first-order transition. Phys. Rev. B 2021, 103, 094107. [Google Scholar] [CrossRef]
  36. Kryuchkov, N.P.; Dmitryuk, N.A.; Li, W.; Ovcharov, P.V.; Han, Y.; Sapelkin, A.V.; Yurchenko, S.O. Mean-field model of melting in superheated crystals based on a single experimentally measurable order parameter. Sci. Rep. 2021, 11, 1796. [Google Scholar] [CrossRef] [PubMed]
  37. Pocheć, M.; Niu, H.; Ren, L.; Bai, S.; Orzechowski, K. Premelting phenomena in n-alcohols from nonanol to dodecanol. J. Phys. Chem. C 2020, 124, 21013–21017. [Google Scholar] [CrossRef]
  38. Pocheć, M.; Orzechowski, K.; Rutkowski, K. Indicators of premelting in 1-decanol and 1-nonanol studied by FTIR spectroscopy. Surf. Interfaces 2022, 28, 101676. [Google Scholar] [CrossRef]
  39. Lindemann, F.A. Über die berechning molekularer eigenfrequenzen. Phys. Z 1910, 11, 609–615. [Google Scholar]
  40. Lawson, A.C. Physics of the Lindemann rule. Phil. Mag. 2009, 89, 1757–1770. [Google Scholar] [CrossRef]
  41. Lipowsky, R. Critical surface phenomena at first-order bulk transitions. Phys. Rev. Lett. 1982, 49, 1575–1578. [Google Scholar] [CrossRef]
  42. Lipowsky, R. Surface critical phenomena at first-order phase transitions. Ferroelectrics 1987, 73, 69–81. [Google Scholar] [CrossRef]
  43. Chełkowski, A. Dielectric Physics; PWN-Elsevier: Warsaw, Poland, 1990. [Google Scholar]
  44. von Hippel, A. Dielectrics and Waves; Artech House: New York, NY, USA, 1954. [Google Scholar]
  45. Piekara, A. The Dielectric Constant and Electric Polarization of Mixtures in the Neighborhood of the Critical Point. Phys. Rev. 1932, 42, 448–449. [Google Scholar] [CrossRef]
  46. Semenchenko, V.K.; Azimov, M. Zh. Fiz. Khim; MAIK Nauka/Interperiodica Publishers: Moscow, Russia, 1955; Volume 80–81, pp. 1343–1345. [Google Scholar]
  47. Semenchenko, V.K.; Azimov, M. Dielectric constants of binary systems in the critical region. Zh. Fiz. Khim. 1956, 30, 2228–2235. [Google Scholar]
  48. Semenchenko, V.K.; Azimov, M. Second-order phase transitions and critical phenomena. VII. Dielectric permeability of the nitrobenzene-hexane system in the critical region. Zh. Fiz. Khim. 1956, 30, 1821–1829. (In Russian) [Google Scholar]
  49. Shakhparov, M.I. The dependence of the dielectric constant on temperature in the critical region. Vestn. Mosk. Univ. Ser. Khim. 1961, I6, 25–30. [Google Scholar]
  50. Semenchenko, V.K. Thermodynamics of critical and hyper-critical phenomena in solutions. Zh. Fiz. Khim. 1961, 35, 1210–1215. [Google Scholar]
  51. Zamkov, V.A. The measurement of dielectric constants in the vicinity of the critical point. Zh. Fiz. Khim. 1962, 36, 1060–1061. [Google Scholar]
  52. Semenchenko, V.K.; Akhrarov, S. Dielectric constant of binary systems in the critical region. Vopr. Sovrem. Fiz. i. Mat. Akad. Nauk Uz. SSR 1962, 9–14. (In Russian) [Google Scholar]
  53. Arkhangeiskii, K.V. Fluctuations and thermodynamic stability of systems in the critical and post-critical regions. Fiz. Tverd. Tela. 1964, 27–34. (In Russian) [Google Scholar]
  54. Arkhangeskii, K.V.; Semenchenko, V.K. Methods and results of measurements of the dielectric parameters of binary liquid mixtures near the critical solution temperature. Zh. Fiz. Khim 1967, 41, 1303–1309. (In Russian) [Google Scholar]
  55. Givon, M.; Pelah, I.; Efron, U. Behaviour of the dielectric constant of a binary liquid mixture near the critical point. Phys. Lett. A 1974, 48, 121–122. [Google Scholar] [CrossRef]
  56. Hollecker, M.; Goulon, J.; Thiebaut, J.-M.; Rivail, J.-L. Dielectric behaviour of a molecular liquid mixture in the one-phase precritical region. Chem. Phys. 1975, 11, 99–103. [Google Scholar] [CrossRef]
  57. Ziejewska, Z.; Piotrowska-Szczepaniak, J.; Zioło, J. Dielectric permittivity of nitrobenzene-hexane solutions in two-phase region. Acta Phys. Pol. A 1979, 56, 347–349. [Google Scholar]
  58. Hollecker, M.; Goulon, J.; Brondeau, J.; Afsar, M.N.; Chantry, G.W. High frequency dielectric behaviour of critical binary solutions of benzonitrile-isooctane. Chem. Phys. 1977, 26, 267–277. [Google Scholar] [CrossRef]
  59. Thoen, J.; Kindt, R.; Van Dael, W. Measurements of the temperature and frequency dependence of the dielectric constant near the consolute point of benzonitrile-isooctane. Phys. Lett. A 1980, 76, 445–448. [Google Scholar] [CrossRef]
  60. Thijsse, B.J. The dielectric constant of SF6 near the critical point. J. Chem. Phys. 1981, 74, 4678–4692. [Google Scholar] [CrossRef]
  61. Thoen, J.; Kindt, R.; Van Dael, W. The dielectric constant anomaly of nitroethane-cyclohexane near the critical solution point. Phys. Lett. A 1981, 87, 73. [Google Scholar] [CrossRef]
  62. Jacobs, D.T.; Greer, S.C. Dielectric-constant anomaly near the critical solution point in polystyrene + cyclohexane. Phys. Rev. A 1981, 24, 2075–2083. [Google Scholar] [CrossRef]
  63. Pestak, M.W.; Chan, M.H.W. Dielectric constant anomaly of CO near its liquid-vapor critical point. Phys. Rev. Lett. 1981, 46, 943–946. [Google Scholar] [CrossRef]
  64. Kaatze, U.; Woermann, D. Dielectrical relaxation measurements in binary liquid mixtures with an upper critical point. Ber. Bunsen. Phys. Chem. 1982, 86, 81–87. [Google Scholar] [CrossRef]
  65. Balakrishnan, J.; Gunasekaran, M.K.; Gopal, E.S.R. Low-frequency dielectric constant measurements in the critical polar + non-polar binary liquid system: Methanol + n-heptane. Chem. Phys. Lett. 1982, 88, 305–308. [Google Scholar] [CrossRef]
  66. Shetty, C.; Gunasekaran, M.K.; Vani, V.; Gopal, E.S.R. Electrical resistance and dielectric constant anomaly in the critical liquid mixture methanol + cyclohexane. Pramana-J Phys 1983, 21, 71–78. [Google Scholar] [CrossRef]
  67. Thoen, J.; Kindt, R.; van Dael, W.; Merabet, M.; Bose, T.K. Low-frequency dielectric dispersion and electric conductivity near the consolute point in some binary liquid mixtures. Phys. A 1989, 156, 92–113. [Google Scholar] [CrossRef]
  68. Early, M.D. Dielectric constant measurements near the critical point of cyclohexane-aniline. J. Chem. Phys. 1992, 96, 641–647. [Google Scholar] [CrossRef]
  69. Chatterjee, A.K.; Lahiri, D.L.; Ghosh, R. Electrical conductivity anomaly in binary liquid mixtures near the critical point. Jpn. J. Appl. Phys. 1992, 31, 2151–2156. [Google Scholar] [CrossRef]
  70. Orzechowski, K. Electrical properties of an ethanol–dodecane mixture near the upper critical solution point. J. Chem. Soc. Faraday Trans. 1994, 90, 2757–2763. [Google Scholar] [CrossRef]
  71. Hamelin, J.; Bose, T.K.; Thoen, J. Critical behavior of the dielectric constant in the triethylamine-water binary liquid mixture: Evidence of an intrinsic effect. Phys. Rev. E 1996, 53, 779–784. [Google Scholar] [CrossRef]
  72. Orzechowski, K. Dielectric properties of methanol+hexane critical mixtures without and with ionic additives. J. Mol. Liq. 1997, 73–74, 291. [Google Scholar] [CrossRef]
  73. Rzoska, S.J.; Urbanowicz, P.; Drozd-Rzoska, A.; Paluch, M.; Habdas, P. Pressure behaviour of dielectric permittivity on approaching the critical consolute point. Europhys. Lett. 1999, 45, 334–340. [Google Scholar] [CrossRef]
  74. Rzoska, S.J.; Drozd-Rzoska, A.; Zioło, J.; Habdas, P.; Jadżyn, J. Critical anomaly of dielectric permittivity for the temperature and pressure paths on approaching the critical consolute point. Phys. Rev. E 2001, 64, 061104. [Google Scholar] [CrossRef] [PubMed]
  75. Malik, P.; Rzoska, S.J.; Drozd-Rzoska, A.; Jadzyn, J. Dielectric permittivity and electric conductivity studies in the one and in the two-phase region of nitrobenzene– dodecane critical point. J. Chem. Phys. 2003, 118, 9357–9363. [Google Scholar] [CrossRef]
  76. Leys, J.; Losada-Pérez, P.; Cordoyiannis, G.; Cerdeiriña, C.A.; Glorieux, C.; Thoen, J. Temperature, concentration, and frequency dependence of the dielectric constant near the critical point of the binary liquid mixture nitrobenzene-tetradecane. J. Chem. Phys. 2010, 132, 014508. [Google Scholar] [CrossRef] [PubMed]
  77. Losada-Perez, P.; Perez-Sanchez, G.; Cerdeirina, C.A.; Thoen, J. Dielectric constant of fluids and fluid mixtures at criticality. Phys. Rev. E 2010, 81, 041121. [Google Scholar] [CrossRef] [PubMed]
  78. Orzechowski, K.; Kosmowska, M.; Adamczyk, M. Electric Permittivity Anomaly Close to the Critical Consolute Point of a Nitrobenzene + Octane Liquid Mixture. J. Phys. Chem. B 2012, 116, 2492–2497. [Google Scholar] [CrossRef] [PubMed]
  79. Drozd-Rzoska, A.; Rzoska, S.J. The super- and subcritical effects for dielectric constant in diethyl ether. J. Chem. Phys. 2016, 144, 224506. [Google Scholar] [CrossRef] [PubMed]
  80. Orzechowski, K.; Kosmowska, M. Dielectric Properties of Critical Conducting Mixtures. In Nonlinear Dielectric Phenomena in Complex Liquids. NATO Science Series II: Mathematics, Physics and Chemistry; Rzoska, S.J., Zhelezny, V.P., Eds.; Springer: Dordrecht, The Netherlands, 2005; Volume 157. [Google Scholar]
  81. Losada-Pérez, P. Liquid-liquid criticality in the dielectric constant and refractive index: A perspective. Eur. Phys. J. E 2019, 42, 110. [Google Scholar] [CrossRef] [PubMed]
  82. Drozd-Rzoska, A.; Rzoska, S.J. High-pressure behavior of dielectric constant in a binary critical mixture. Phys. Rev. E 2020, 102, 042610. [Google Scholar] [CrossRef]
  83. Fisher, H.J. Faraday’s Experimental Researches in Electricity: Guide to a First Reading; Green Lion Press: London, UK, 2001. [Google Scholar]
  84. Goulon, S.; Greffe, J.-L.; Oxtoby, D.W. Droplet model for the analysis of the dielectric properties of critical binary mixtures. J. Chem. Phys. 1979, 70, 4742–4750. [Google Scholar] [CrossRef]
  85. Sengers, J.V.; Bedeaux, D.; Mazur, P.; Greer, S.C. Behavior of the dielectric constant of fluids near a critical point. Phys. A 1980, 104, 573–594. [Google Scholar] [CrossRef]
  86. Aharony, A.; Fisher, M.E. Nonlinear scaling fields and corrections to scaling near criticality. Phys. Rev. B 1983, 27, 4394–4400. [Google Scholar] [CrossRef]
  87. Mistura, L. Behaviour of the dielectric constant near a critical point in fluid systems. J. Chem. Phys. 1974, 59, 4563. [Google Scholar] [CrossRef]
  88. Cailletet, L.; Mathias, E. Recherches sur les densités de gaz liquéfies et de leurs vapeurs saturées. Compt. Acad. Sci. 1886, 102, 1202–1207. [Google Scholar]
  89. Reif-Acherman, S. The history of the rectilinear diameter law. Quim. Nova 2010, 33, 2003–2010. [Google Scholar] [CrossRef]
  90. Rowlinson, J.S. Physics of liquds: Are diameters rectilinear? Nature 1986, 319, 362. [Google Scholar] [CrossRef]
  91. Anisimov, M.A.; Wang, J. The nature of asymmetry in fluid criticality. Phys. Rev. Lett. 2006, 97, 025703. [Google Scholar] [CrossRef]
  92. Jüngst, S.; Knuth, B.; Hensel, F. Observation of singular diameters in the coexistence curves of metals. Phys. Rev. Lett. 1985, 55, 2160–2163. [Google Scholar] [CrossRef] [PubMed]
  93. Drozd-Rzoska, A.; Łoś, J.; Rzoska, S.J. The dominance of pretransitional effects in the liquid crystal based nanocolloids: Nematogenic MBBA with the transverse permanent dipole moment and BaTiO3 nanoparticles. Nanomaterials 2024, 14, 655. [Google Scholar] [CrossRef] [PubMed]
  94. Dhar, R.; Chirra, S.K.; Iqbal, A. Correction of the Electrode Polarization and Ionic Conductance Effects in the Measurements of Permittivity and Loss of the Dielectric Material. Available online: https://ssrn.com/abstract=4861077 (accessed on 24 June 2024).
Figure 1. Frequency scans of the real and imaginary parts of dielectric permittivity in the homogeneous liquid, upper (decane-rich) coexisting phase in the biphasic domain, and the solid phase for selected temperatures. The horizontal part of ε f is related to the dielectric constant, i.e., ε f = ε . The low-frequency (LF) region below the static domain is also indicated.
Crystals 14 00612 g001
Figure 2. Frequency scans of the real and imaginary parts of dielectric permittivity in the homogeneous liquid, lower (nitrobenzene-rich) coexisting phase in the biphasic domain, and the solid phase for selected temperatures. The horizontal part of ε f is related to the dielectric constant, i.e., ε f = ε . The low-frequency (LF) region below the static domain is also indicated.
Crystals 14 00612 g002
Figure 3. Dielectric constant changes in three phases of nitrobenzene–decane mixture of critical concentration. The arrows indicate the critical temperature T C and the freezing temperature T f . The thin arrow in the biphasic domain indicates a slight change in the dielectric constant, which can be correlated with nitrobenzene’s melting temperature. The solid curve for the diameter is related to Equation (7) and Table 1.
Crystals 14 00612 g003
Figure 4. Pre-transitional changes of dielectric constant in nitrobenzene–decane critical mixture in the homogeneous liquid phase. The inset focuses on the behavior in the immediate vicinity of the critical temperature. The red curve presents the parameterization of the pre-critical behavior, related to Equation (5). The values of the fitted parameters are given in Table 1. In the inset, the discrepancy from the ‘apparent linear’ behavior remote from T C (gray line) is shown. The photos present the visual view of the critical mixture at T C + 6 K , and T C + 0.2 K , where the critical opalescence dominates.
Crystals 14 00612 g004
Figure 5. The real part of dielectric permittivity for selected frequencies in the static and low-frequency (LF) domains for the lower phase (nitrobenzene-rich) of the nitrobenzene–decane critical mixture. The curve portraying experimental data in the solid phase is related to Equation (8).
Crystals 14 00612 g005
Figure 6. The pre-melting effect for the real part of dielectric permittivity for selected frequencies is indicated in the figure. The solid curves portraying the effect are related to Equation (8), with the melting temperature associated with the singular temperature T = T m . Heating from the solid state at T = 200   K   ( 70   ° C ). In the equation above, the term C describes the behavior remote from the singular temperature, where the pre-transitional contribution is absent. The curves are related to the parameterization by Equation (8).
Crystals 14 00612 g006
Figure 7. The behavior of the real part of electric conductivity in the liquid, biphasic, and solid domains of nitrobenzene–decane critical mixture. The inset shows the focused behavior in the semi-log scale, enabling the view of pre-transitional changes in the homogeneous liquid and solid crystal phases.
Crystals 14 00612 g007
Table 1. Related to Equations (5) and (7), parameters for dielectric constant pre-transitional effect in the homogeneous phase of nitrobenzene–decane critical mixtures and the related diameter of the coexistence curve in the biphasic domain. Graphically, the fitting results are shown by solid, red curves in Figure 3 and Figure 4.
PhaseCritical Point ParametersExponentAmplitudes
ε C T c (°C) φ = 1 α ABC
Homogeneous   liquid ,   T > T C 15.530 23.61 0.88 ± 0.01 0.238 ± 0.005 0.017 ± 0.001 0.270 ± 0.005
Biphasic   domain ,   T < T C 15.530 23.61 0.88 ± 0.01 0.225 ± 0.02 1.02 ± 0.05 0.12 ± 0.01
Disclaimer/Publisher’s Note: The statements, opinions and data contained in all publications are solely those of the individual author(s) and contributor(s) and not of MDPI and/or the editor(s). MDPI and/or the editor(s) disclaim responsibility for any injury to people or property resulting from any ideas, methods, instructions or products referred to in the content.