Article

A Portable Miniature Cryogenic Environment for In Situ Neutron Diffraction

Neutron Scattering Division, Oak Ridge National Laboratory, Oak Ridge, TN 37831, USA
*
Author to whom correspondence should be addressed.
Crystals 2024, 14(7), 640; https://doi.org/10.3390/cryst14070640
Submission received: 10 June 2024 / Revised: 3 July 2024 / Accepted: 7 July 2024 / Published: 11 July 2024
(This article belongs to the Section Crystal Engineering)

Abstract

:
Neutron diffraction instruments offer a platform for materials science and engineering studies at extended temperature ranges far from ambient. As one of the widely used neutron sample environment types, cryogenic furnaces are usually bulky and complex, and they may need hours of beamtime overhead for installation, configuration, cooling, and sample change, etc. To reduce the overhead time and expedite experiments at the state-of-the-art high-flux neutron source, we developed a low-cost, miniature, and easy-to-use cryogenic environment (77–473 K) for in situ neutron diffraction. A travel-size mug serves for the environment where the samples sit inside. Immediate cooling and an isothermal dwell at 77 K are realized on the sample by direct contact with liquid N2 in the mug. The designed Al inserts serve as the holder of samples and heating elements, alleviate the thermal gradient, and clear neutron pathways. Both a single-sample continuous measurement and multi-sample high-throughput measurements are demonstrated in this environment. High-quality and refinable in situ neutron diffraction patterns are acquired on model materials. The results quantify the orthorhombic-to-cubic phase transformation process in LiMn2O4 and differentiate the anisotropic lattice thermal expansions and bond length evolutions between rhombohedral perovskite oxides with composition variation.

1. Introduction

Neutrons possess a unique capability to penetrate many materials deeply and non-destructively [1]. This advantage facilitates various kinds of sample environments at the neutron scattering instruments, enabling studies of materials’ structures and their evolutions under static or dynamic physical, chemical, and mechanical fields. This expands the use of neutrons in materials research from fundamental science to applied engineering. The cryogenic furnace is one of the important sample environments that are widely deployed in neutron scattering instruments for condense matter physics, chemistry, and materials engineering, etc. [2]. While most condense physics studies push the temperature closer to 0 K, the cryogenic environment above that is often required for research in materials science and engineering. For example, it includes the determination of the crystal structure, magnetic ordering transitions, and the thermodynamics at cryogenic temperatures [3]; the collection of the neutron diffraction pattern with reduced atoms’ thermal vibration; and understandings of the performance of functional, energy, and engineering materials under a cryogenic operations condition [4,5].
Although complex cryogenic furnaces are developed and deployed at many instruments of neutron scattering, setting up them and running cryogenic experiments usually cost a significant overhead of neutron beamtime, in addition to the time of neutron data acquisition. Firstly, many cryogenic furnaces are bulky, and the installation including the configuration and removal of the furnace at the beamline may take hours. Secondly, the furnace chamber has a large space for large-size samples in neutron scattering while the heat exchange by using a cold head, for example, has a relative low efficiency. As a result, the sample cooling time is another overhead, which may also take hours, depending on the furnace performance. Moreover, the heating rate may be restricted when considering protecting the furnace from thermal shock. Thirdly, only one sample can be measured in one experiment (cooling–heating cycle), but the sample change process is usually not simple. Coupled with the slow ramp rate, the time of sample change can be remarkable when multiple samples are needed to measure [6]. Last but not least, the costly and fragile furnaces leash the opportunities of studying materials for extreme applications such as high radiation that may raise risks to discard the equipment. Therefore, such slow-pace and high-cost cryogenic environments leave a large gap in matching the fashion in the state-of-the-art high-flux neutron source that facilitates high-speed and high-throughput measurements for broad materials science and engineering studies.
A concept is developed to design a low-cost, portable, and easy-to-use cryogenic environment which realizes certain specifications to meet some highly demanding requirements. A direct contact of liquid N2 (LN2) makes the sample instantly cooled down, and a stable LN2 temperature (77 K) is offered when the sample is immersed in LN2. This environment can warm up naturally to the room temperature or ramp to higher temperatures with portable heating elements. Using a low-cost and small-size container for LN2, the miniature size and portability can be realized. However, the strong incoherent scattering when neutrons penetrate in LN2 will overwhelm the coherent scattering signal, which makes the LN2 environment not directly adaptable to neutron diffraction. To mitigate the incoherent scattering, a thermally conductive insert using “neutron transparent” material is a solution to repel LN2 from the neutron pathway. Coupled with neutron incident slits and receiving collimators, the unwanted backgrounds from the sample environment can be further excluded from the acquired neutron diffraction patterns.
In this paper, we design and demonstrate this miniature cryogenic sample environment with low cost for in situ neutron diffraction. It enables a quick cooling, sufficient dwell at 77 K, and controllable heating to the room temperature (RT) and elevated temperatures up to 473 K. The different inner structure designs provide options to tune the dwell time and temperature profile. Moreover, the inserts successfully clear the neutron paths from the surrounding LN2. The continuous measurement of neutron diffraction and high-throughput measurements of multiple samples are demonstrated by using this environment. Both produce refinable data for phase and structure analysis. Two case studies are given in this paper: (1) visualizing the orthorhombic-to-cubic phase transition in a cathode material LiMn2O4 for lithium-ion batteries [7]; (2) revealing the differences of anisotropic lattice distortions and bond length evolutions between two perovskite-type cathode materials La0.8Sr0.2MnO3 (LSM) [8,9] and La0.6Sr0.4Co0.2Fe0.8O3 (LSCF) [10,11] for solid oxide fuel cells. In addition, in situ neutron diffraction using this cryogenic environment has also been carried out to understand the anisotropic atom displacement and ion transport pathways in the Na3SbS4 solid electrolyte for sodium-ion batteries [4].

2. Materials and Methods

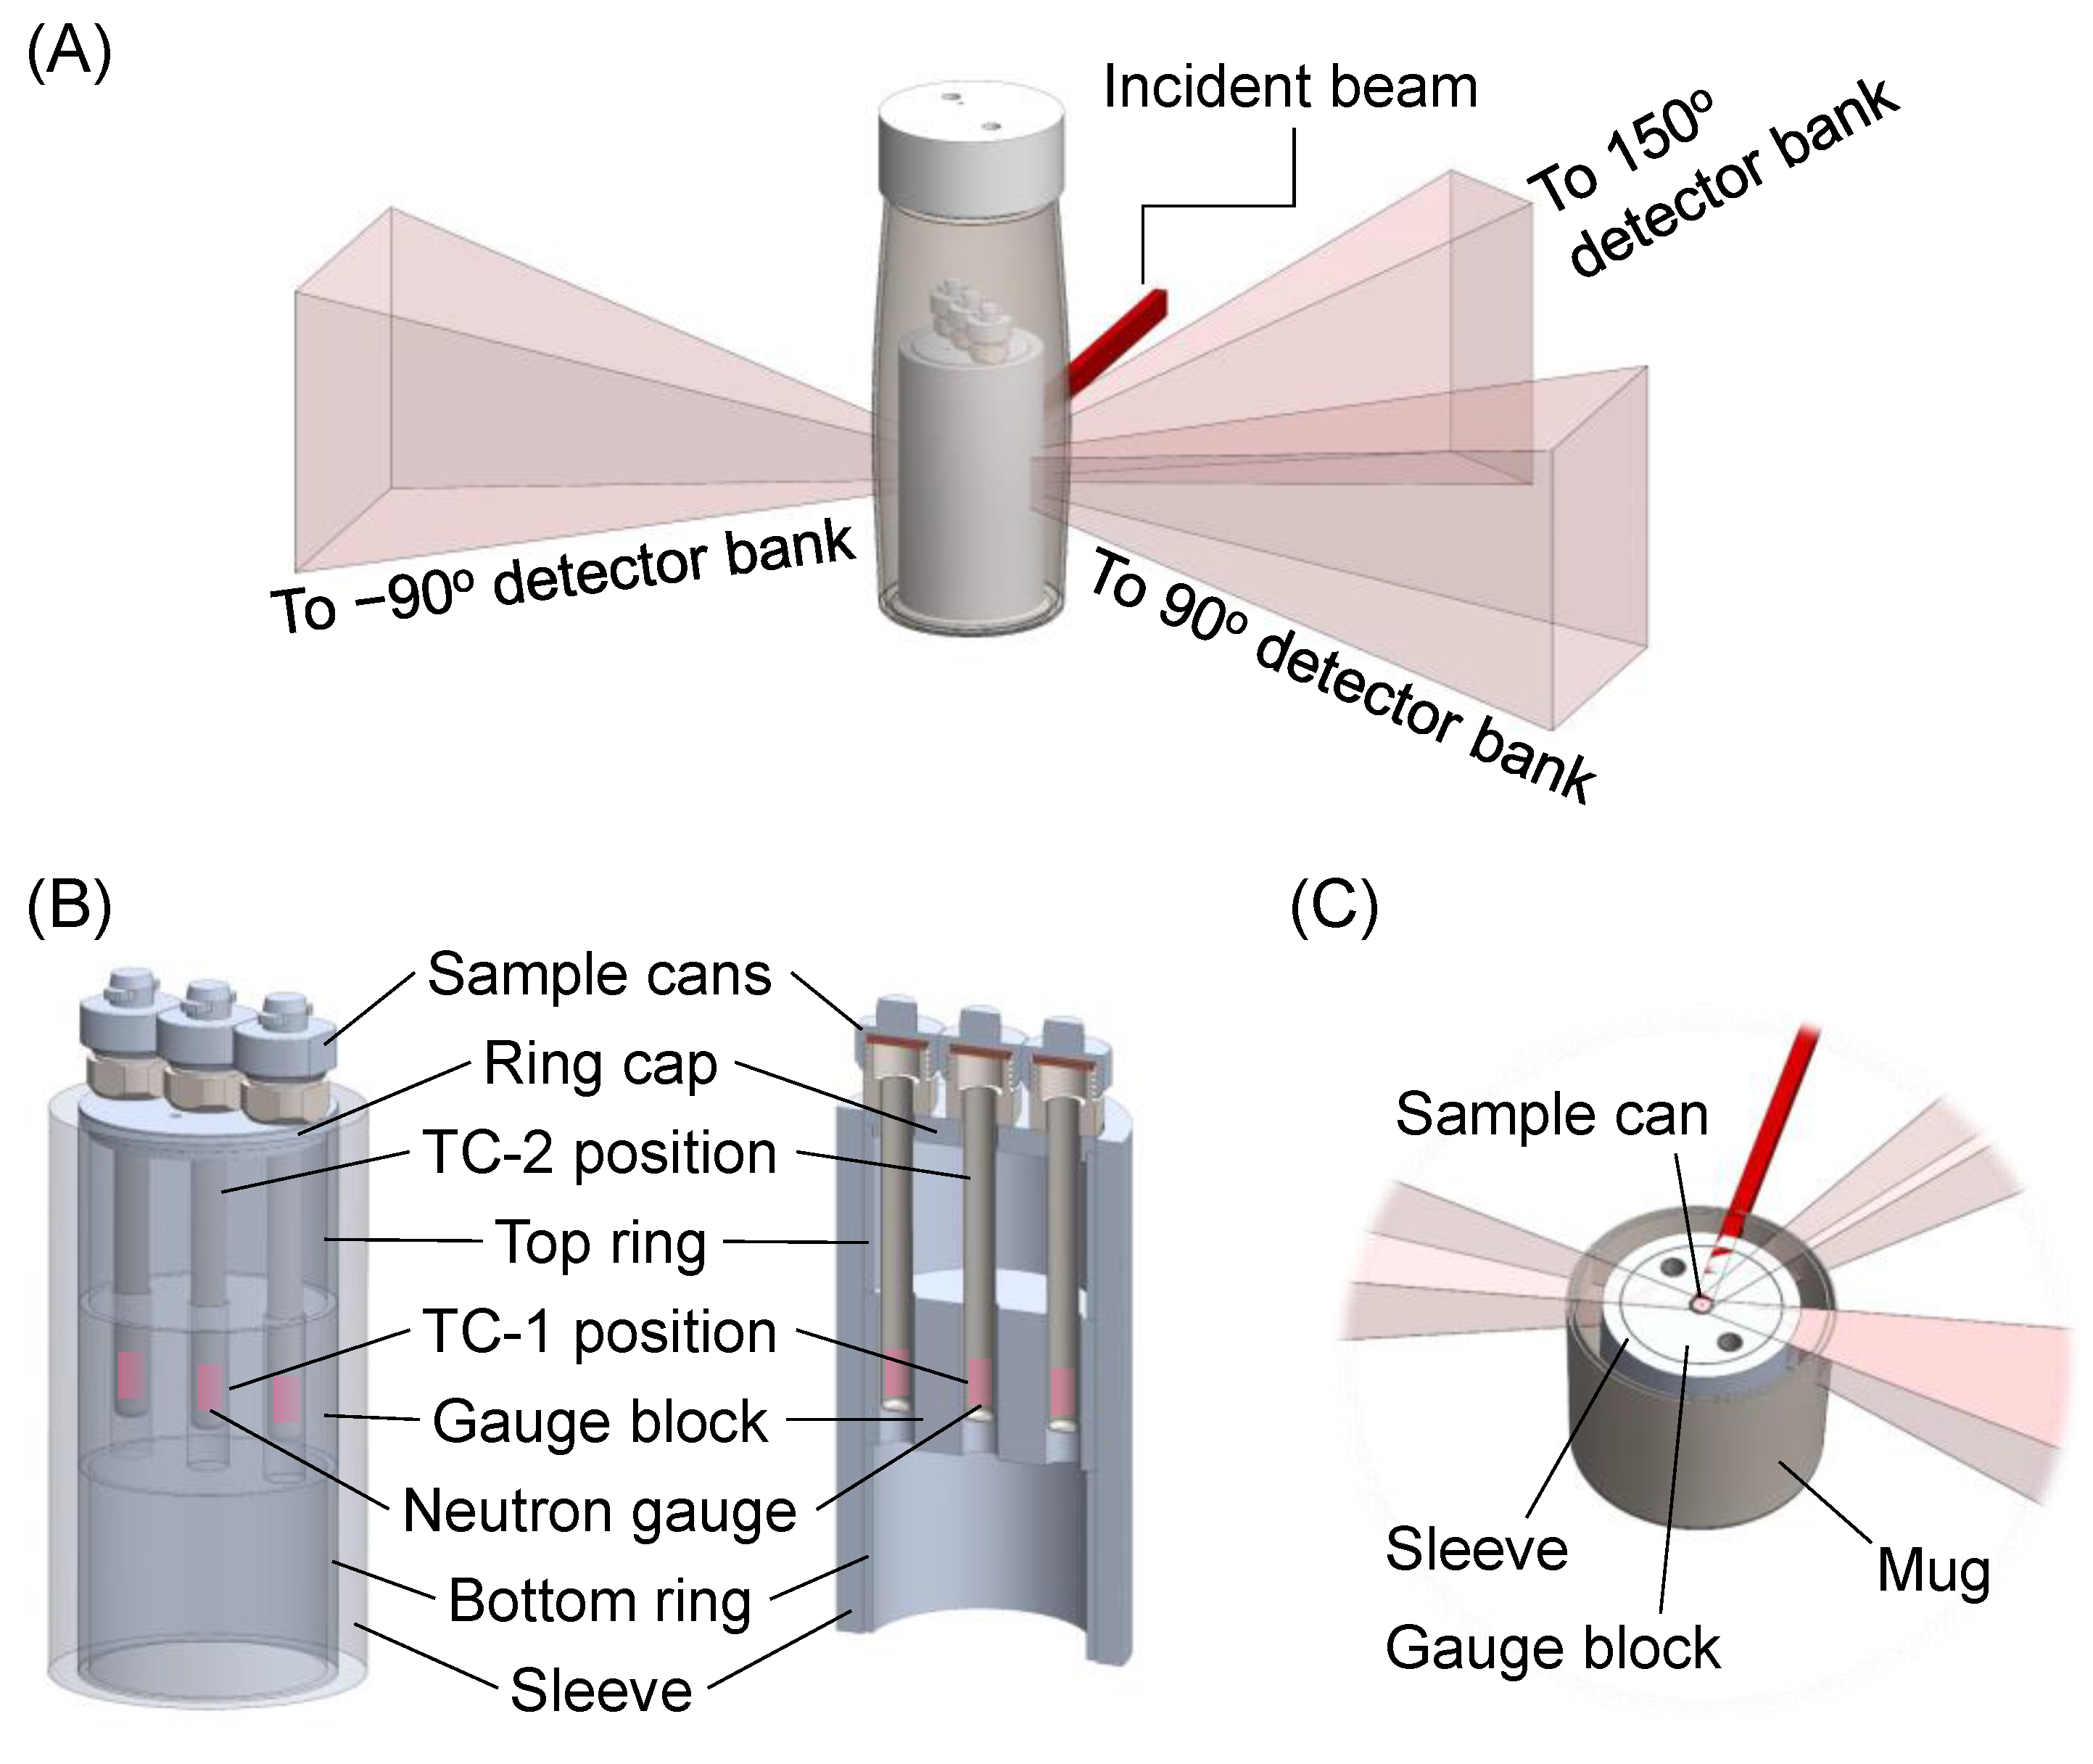
2.1. Design and Material Selection

The design enables fast cooling by LN2, a stable dwell at the LN2 temperature, and a steady ramp to RT or elevated temperatures. It also provides a clean neutron pathway throughout the cryogenic environment, so that the neutron attenuation is minimized.
The design view of the portable cryogenic environment is shown in Figure 1. A commercial vacuum-insulated travel mug with a stainless-steel double wall was employed as the container. A polytetrafluoroethylene cap was customized with feedthrough holes for thermocouple and heating element cables. The cap covers the mug opening without sealing the gap in between. This container defines the small footprint of this sample environment (75 mm in diameter and 200 mm in height), and it realizes the cryogenic temperatures which may last for hours up to one day.
Inside the mug, the insert structures are designed to host samples while providing the least neutron absorption. The demonstration here is a sample holder for the vanadium powder sample cans that are widely used at neutron diffractometers. This sample holder is composed of five parts as illustrated in Figure 1B. The core part is the gauge block where samples reside for neutron scattering. The solid round block facilitates a neutron pathway with a reduced volume of LN2 that severely and incoherently scatters the neutrons and weakens the effective diffraction signal. It also provides a decent surrounding that maintains the temperature homogeneity and alleviates the thermal gradient. The three holes can hold up to three sample cans or accommodate with heating rods for the ramp control. The ring cap is where the sample can head sits on. The bottom and top rings are designed to support the gauge block and the ring cap, respectively, while providing storage space for LN2. A set of bottom rings was fabricated with different heights (5 mm, 30 mm, and 55 mm) for changing the sample position in the bottle so that the dwell at the LN2 temperature can be adjusted (the lower the sample position, the longer the dwell at LN2 temperatures). The outer sleeve is to embrace the rings and block together for integrity and stability. All those parts are made of aluminum as Al has a rather small cross-section of neutron scattering and absorption [13], and it appears to be nearly transparent when neutrons travel through. Moreover, Al has a thermal conductivity of 237 Wm−1K−1 [14], which is one of the highest among those of the metals that are commonly seen, just lower than gold, silver, and copper. Al also has a good thermal capacity (0.9 Jg−1K−1 at room temperature) [15]. Those properties benefit the temperature homogeneity inside the Al gauge block.
While the sample cans can sit on the sample holder when immersed in the LN2, they can also be top mounted by using an adapting stick to attach to the bottle cap, as shown in Figures S1 and S2. Top mounting is a widely used method in furnaces for a neutron instrument. When the cap covers the bottle, the sample can is inserted inside the gauge block. As the sample is fixed with the cap, it potentially enables a quick sample removal or sample change at cryogenic temperatures without operating the bottle and the inserts or clearing LN2. It should be noted that having a long metal stick to the top of the bottle may alter the thermal distribution as well as temperature profile of sample warming.

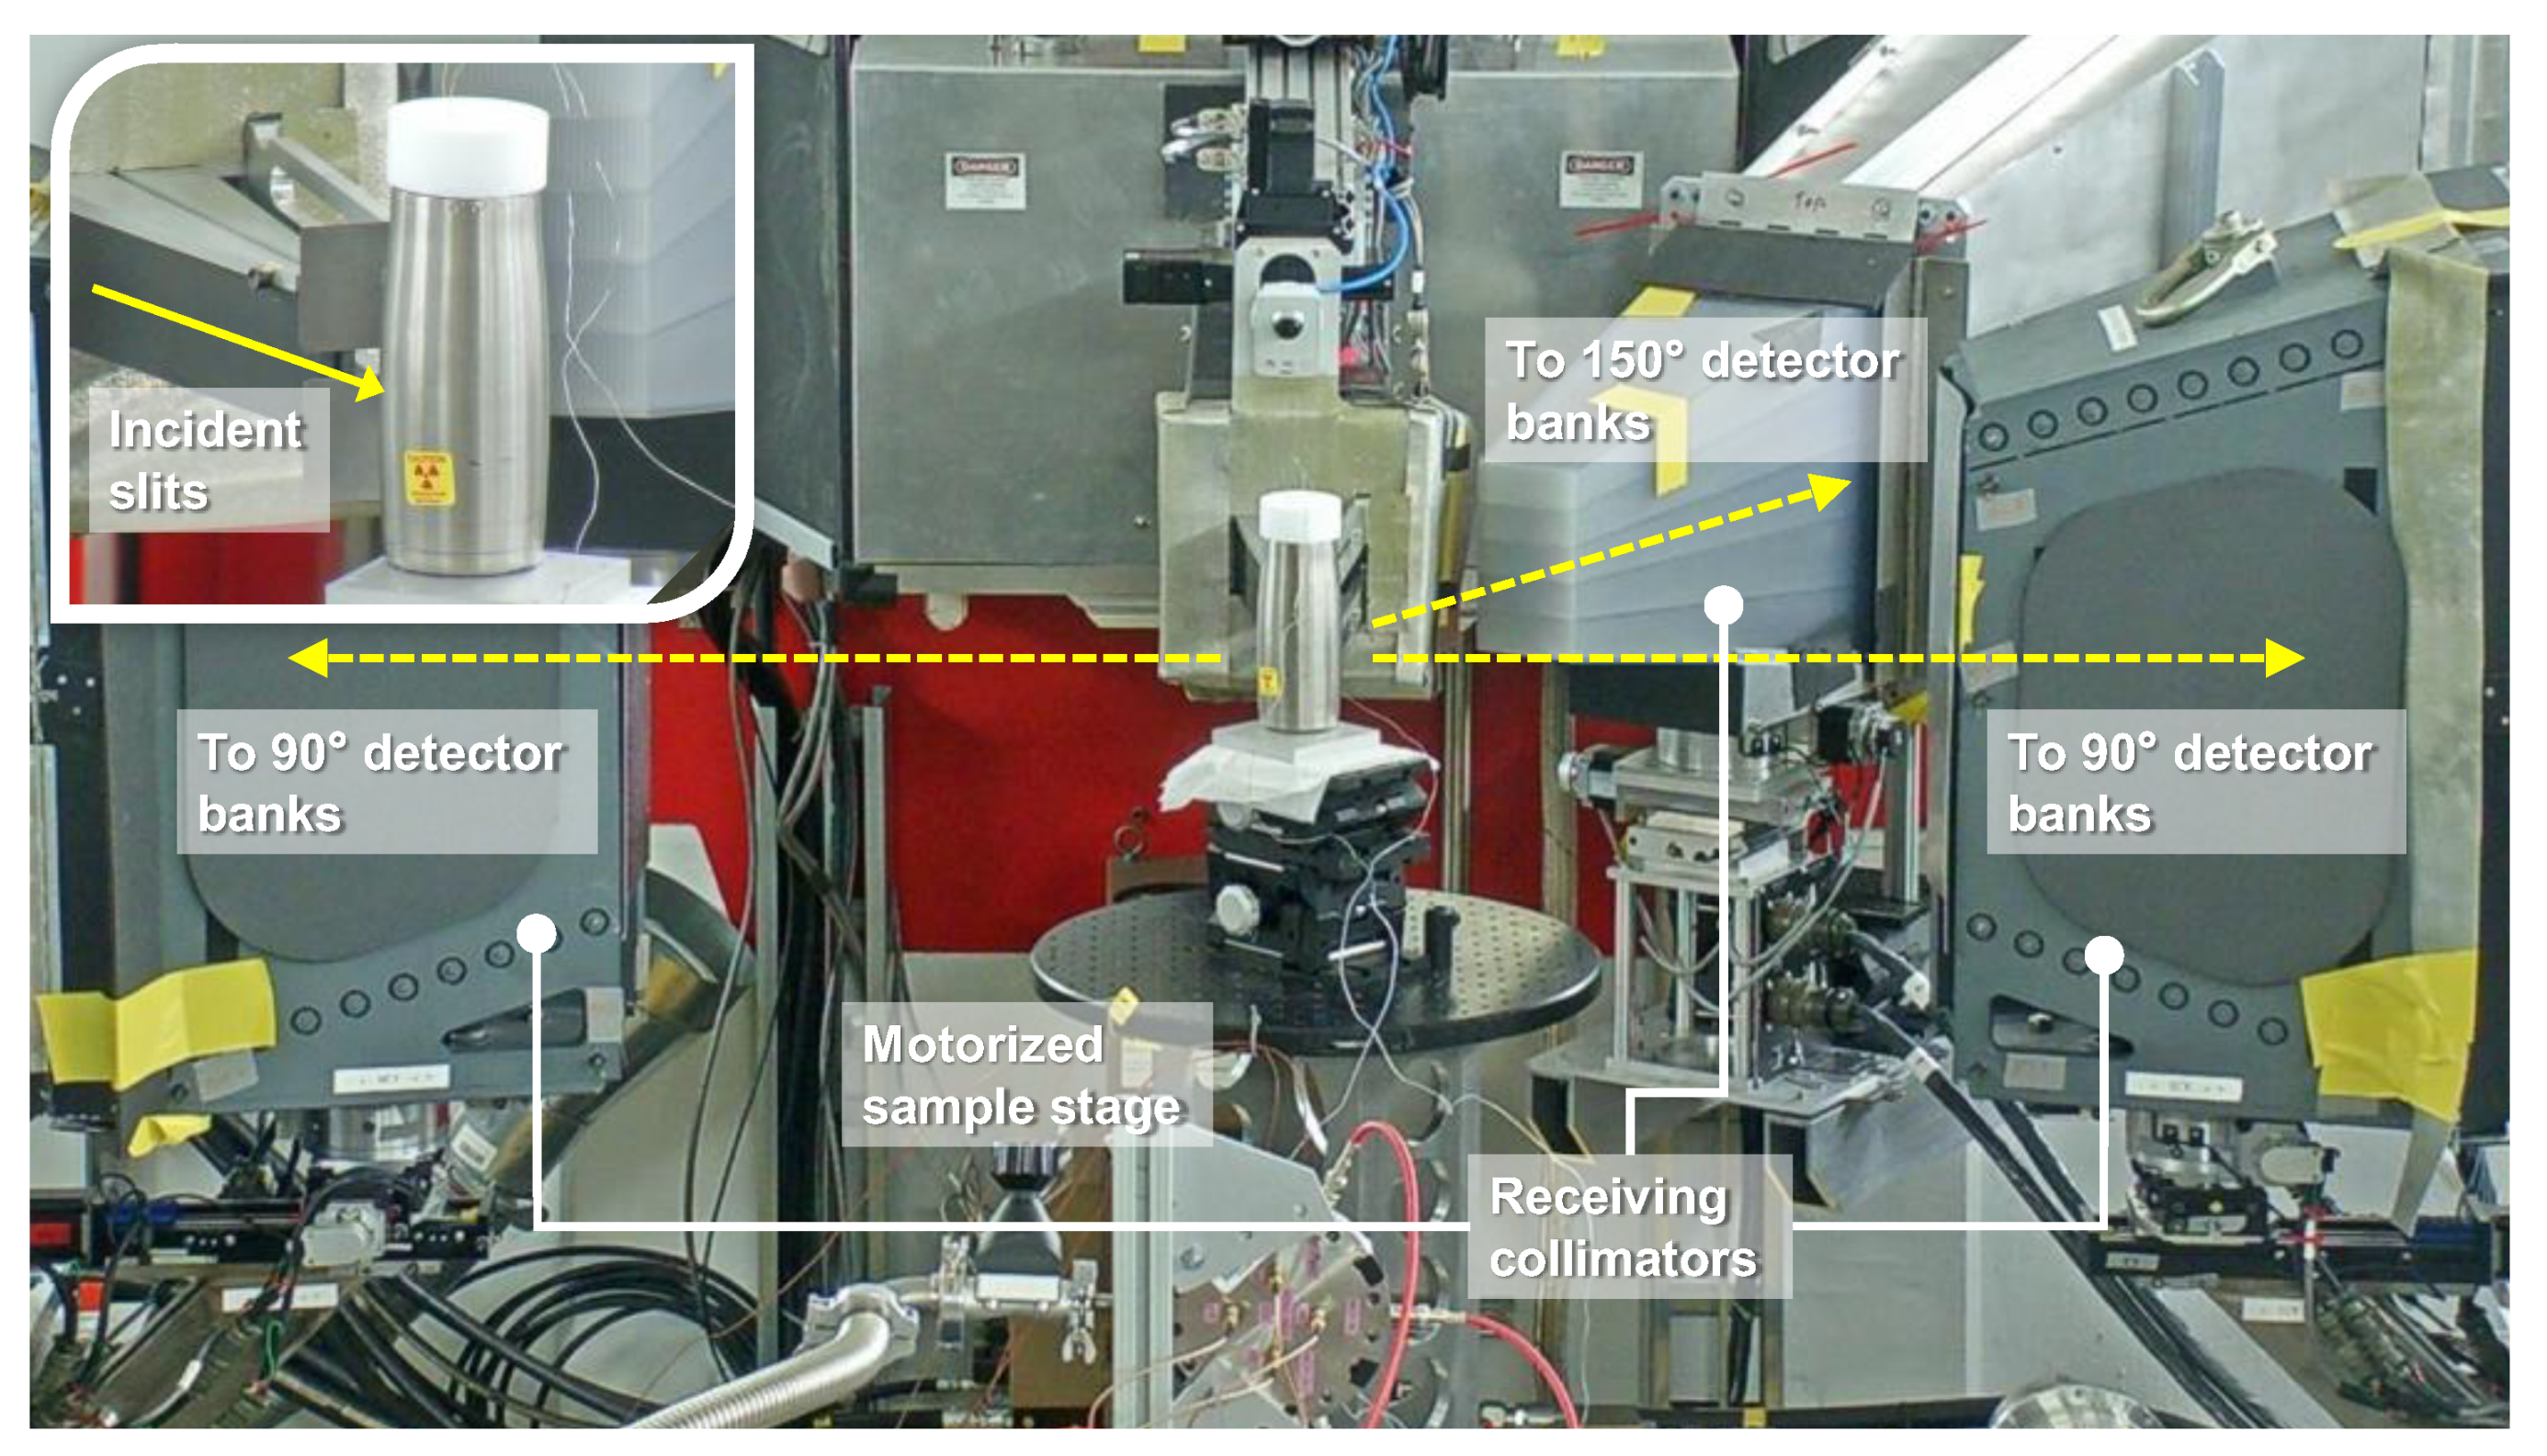
2.2. Experimental Setups

First, the warming and heating profiles were measured for this cryogenic environment with different configurations of inserts. An empty standard 6 mm vanadium can for regular neutron powder diffraction measurement was used as the sample. Two K-type thermocouples were stuck to the outside surface of the can, fixed by Kapton tapes: one was at the sample position (named as “TC-1”), characterizing the sample temperature, and the other one at the upper position of the can (named as “TC-2”), measuring the temperature gradient along the height of the can. The LN2 was poured into the bottle until fully filled, and then the cap covered the bottle. The temperature data were continuously acquired until all LN2 evaporated and the sample temperature was raised to about the room temperature.
In addition to the natural warming up, the faster heating with a controlled constant rate was also carried out. In the test, the bottom ring with a 30 mm height was used. Two resistance heating rods (6 mm diameter, 250 V-120 W, TUTCO) were inserted into the two side sample slots. The heating rods were controlled by a Lakeshore Model 336 temperature controller with tuned proportional−integral−derivative control parameters. Heating was manually turned on when the sample started to warm up after a certain amount of LN2 had evaporated. The sample was heated with a set ramp rate (2 K/min and 5 K/min) to 473 K, followed by an isothermal dwell. The temperature readings of the two thermocouples were recorded.
Then, this cryogenic environment was further commissioned with the neutron beam. In situ neutron diffraction studies were demonstrated using the 30 mm high bottom ring with natural warming. The demonstration was carried out at the VULCAN diffractometer [12] at the Spallation Neutron Source (SNS) at the Oak Ridge National Laboratory (Figure 2). The instrument layout and optics are introduced in Reference [12]. The configuration of the high-intensity neutron guide and 30 Hz chopper setting (wavelength center: 2.0 Å; wavelength band width: 2.88 Å) was employed. Thanks to this time-of-flight neutron diffraction, all the detector banks were measuring diffraction patterns with specific d-spacing ranges at the same time. The neutron gauge volume in Figure 1B was defined by the neutron incident slits and the receiving collimator. By moving the sample stage, the neutron gauge center was aligned to the sample position which would be measured. The neutron incident slits were 5 mm × 12 mm. Using the 5 mm receiving collimators, the −90° and 90° detector banks measured clean diffraction patterns by excluding most of the background and minimizing the neutrons scattered from the Al insert. The 150° detector bank that measures high-resolution diffraction patterns was equipped with a 12 mm collimator to reduce the background, and significant signals of the Al insert were still received.
In the demonstration of the continuous measurement, the LiMn2O4 powders (Sigma-Aldrich, Burlington, MA, USA, electrochemical grade) were filled and sealed in the vanadium can as the model sample. The can was placed into the center slot, using the 30 mm high bottom ring. The thermocouple setup and the cooling and warming process were the same as in the offline tests above. Neutron scan alignments were carried out to determine the sample position. The neutron diffraction pattern was continuously collected during the dwell at the LN2 temperature and warming up.
In the demonstration of the high-throughput measurement, three powder samples LiMn2O4, LSCF, and LSM (Sigma-Aldrich, Burlington, MA, USA, >99%) were filled in the cans and placed in the three sample slots of the insert. The process was similar to the continuous measurement. The three sample positions were determined by the neutron scan alignment. During the dwell at the LN2 temperature and natural warming, the three samples were repeatedly looped to the neutron beam center for measurement, and each measurement took 1 min.
Although the neutron diffraction patterns were collected at all the detector banks simultaneously, the data from the −90° bank that had the minimal background were used for the structure comparison between LSCF and LSM while the high-resolution patterns from the 150° bank were used to differentiate the orthorhombic distortion from the cubic lattice in LiMn2O4. For the continuous measurement of LiMn2O4, the diffraction data were chopped based on the temperature (2 K per pattern). For the high-throughput measurement, the 1 min measurements were sorted for each sample, and every 5 patterns were summed to achieve better statistics. The data processing, visualization, and batch Rietveld refinement of neutron diffraction patterns were carried out using VDRIVE [16] and GSAS EXPGUI [17,18].

3. Results and Discussion

3.1. Temperature Profiles

First of all, the temperatures were measured under different configurations. As designed, the Al bottom rings with different heights can be used to adjust the sample dwell time at (or near) the LN2 temperature (Figure S3) and to tune the warming profile (Figure 3A). The dwell time is about 6 h, 5 h, and 4 h for the 5 mm, 30 mm, and 55 mm Al bottom rings, respectively, starting with full LN2 in the bottle. The temperature gradient along the vanadium sample can is more significant at the end of the dwell, as indicated by the difference of TC-1 and TC-2 (Figure 3A,B and Figure S3). At this moment, the LN2 surface position goes lower than TC-2. Therefore, the atmosphere at TC-2 starts to warm up while the TC-1 is still close to 77 K from the help with the Al gauge block. The temperature gradient is larger when the sample position is higher and closer to the bottle opening—using the 55 mm ring (15–20 K difference). At the lower positions (using 30 mm and 5 mm rings), only small temperature differences (5–10 K) were measured. During warming up, this difference quickly reduced, indicating a very slight temperature gradient along the sample can in the cryogenic environment. It is noted that the neutron gauge volume is at the TC-1 position with a ±6 mm expanse along height while the TC-2 is located about 30 mm higher than TC-1. Therefore, the sample temperature is thought to be uniform in the neutron gauge volume.
The temperature homogeneity inside the Al gauge block is further evidenced by the comparison between the configurations with and without the Al insert (Figures S1 and S2). Without the insert, the temperature difference between TC-1 and TC-2 can reach 85 K. Applying an insert effectively mitigates the temperature gradient. When both TC-1 and TC-2 are inside the Al gauge block, the temperature gradient is negligible (Figure S2).
The heating profiles are slightly different when the Al insert is placed at different locations. Compared to 5 mm and 55 mm, the 30 mm height is optimal, which achieves the minimal temperature gradient and the least curvature of the temperature ramp via natural warming (Figure 3A,C). In addition, the warming profile can be changed with the inserts in the bottle. For example, Figures S1 and S2 show a configuration for a top-mounted sample. In the cryogenic bottle, the metal part that hangs the sample to the cap affects the temperature gradient and evolution. As a result, the temperature profile exhibits steps and kinks at the end of the dwell and at the beginning of warming, even equipped with an Al gauge block (Figure S2).
The temperature ramp rate can be controlled in this cryogenic environment, adapted to continuous temperature scans with in situ neutron diffraction. It can meet different requirements for the measurement of the samples that have different neutron scattering powers. Natural warming with all vents closed except some gaps between the cap and the mug offers a very slow ramp (Figure 3C). It is about 1 K/min at the beginning of warming. The rate is not a constant, and it becomes slower when the temperature approaches the room temperature. It fits for the continuous measurement of a weakly scattering sample or multiple samples via a high-throughput approach. With heating elements, the heating can be sped up with a controlled constant ramp rate. The ramps of sample temperature (TC-1) under 2 K/min and 5 K/min to 473 K were commissioned and illustrated in Figure 3D, in comparison to natural warming. The temperature control is successful after a routine PID tuning. It is worth noting that there is nearly no overshoot at 2 K/min and a negligible (<2 K) overshoot at 5 K/min. The small overshoot under fast heating is due to the good thermal insulation of this cryogenic environment.

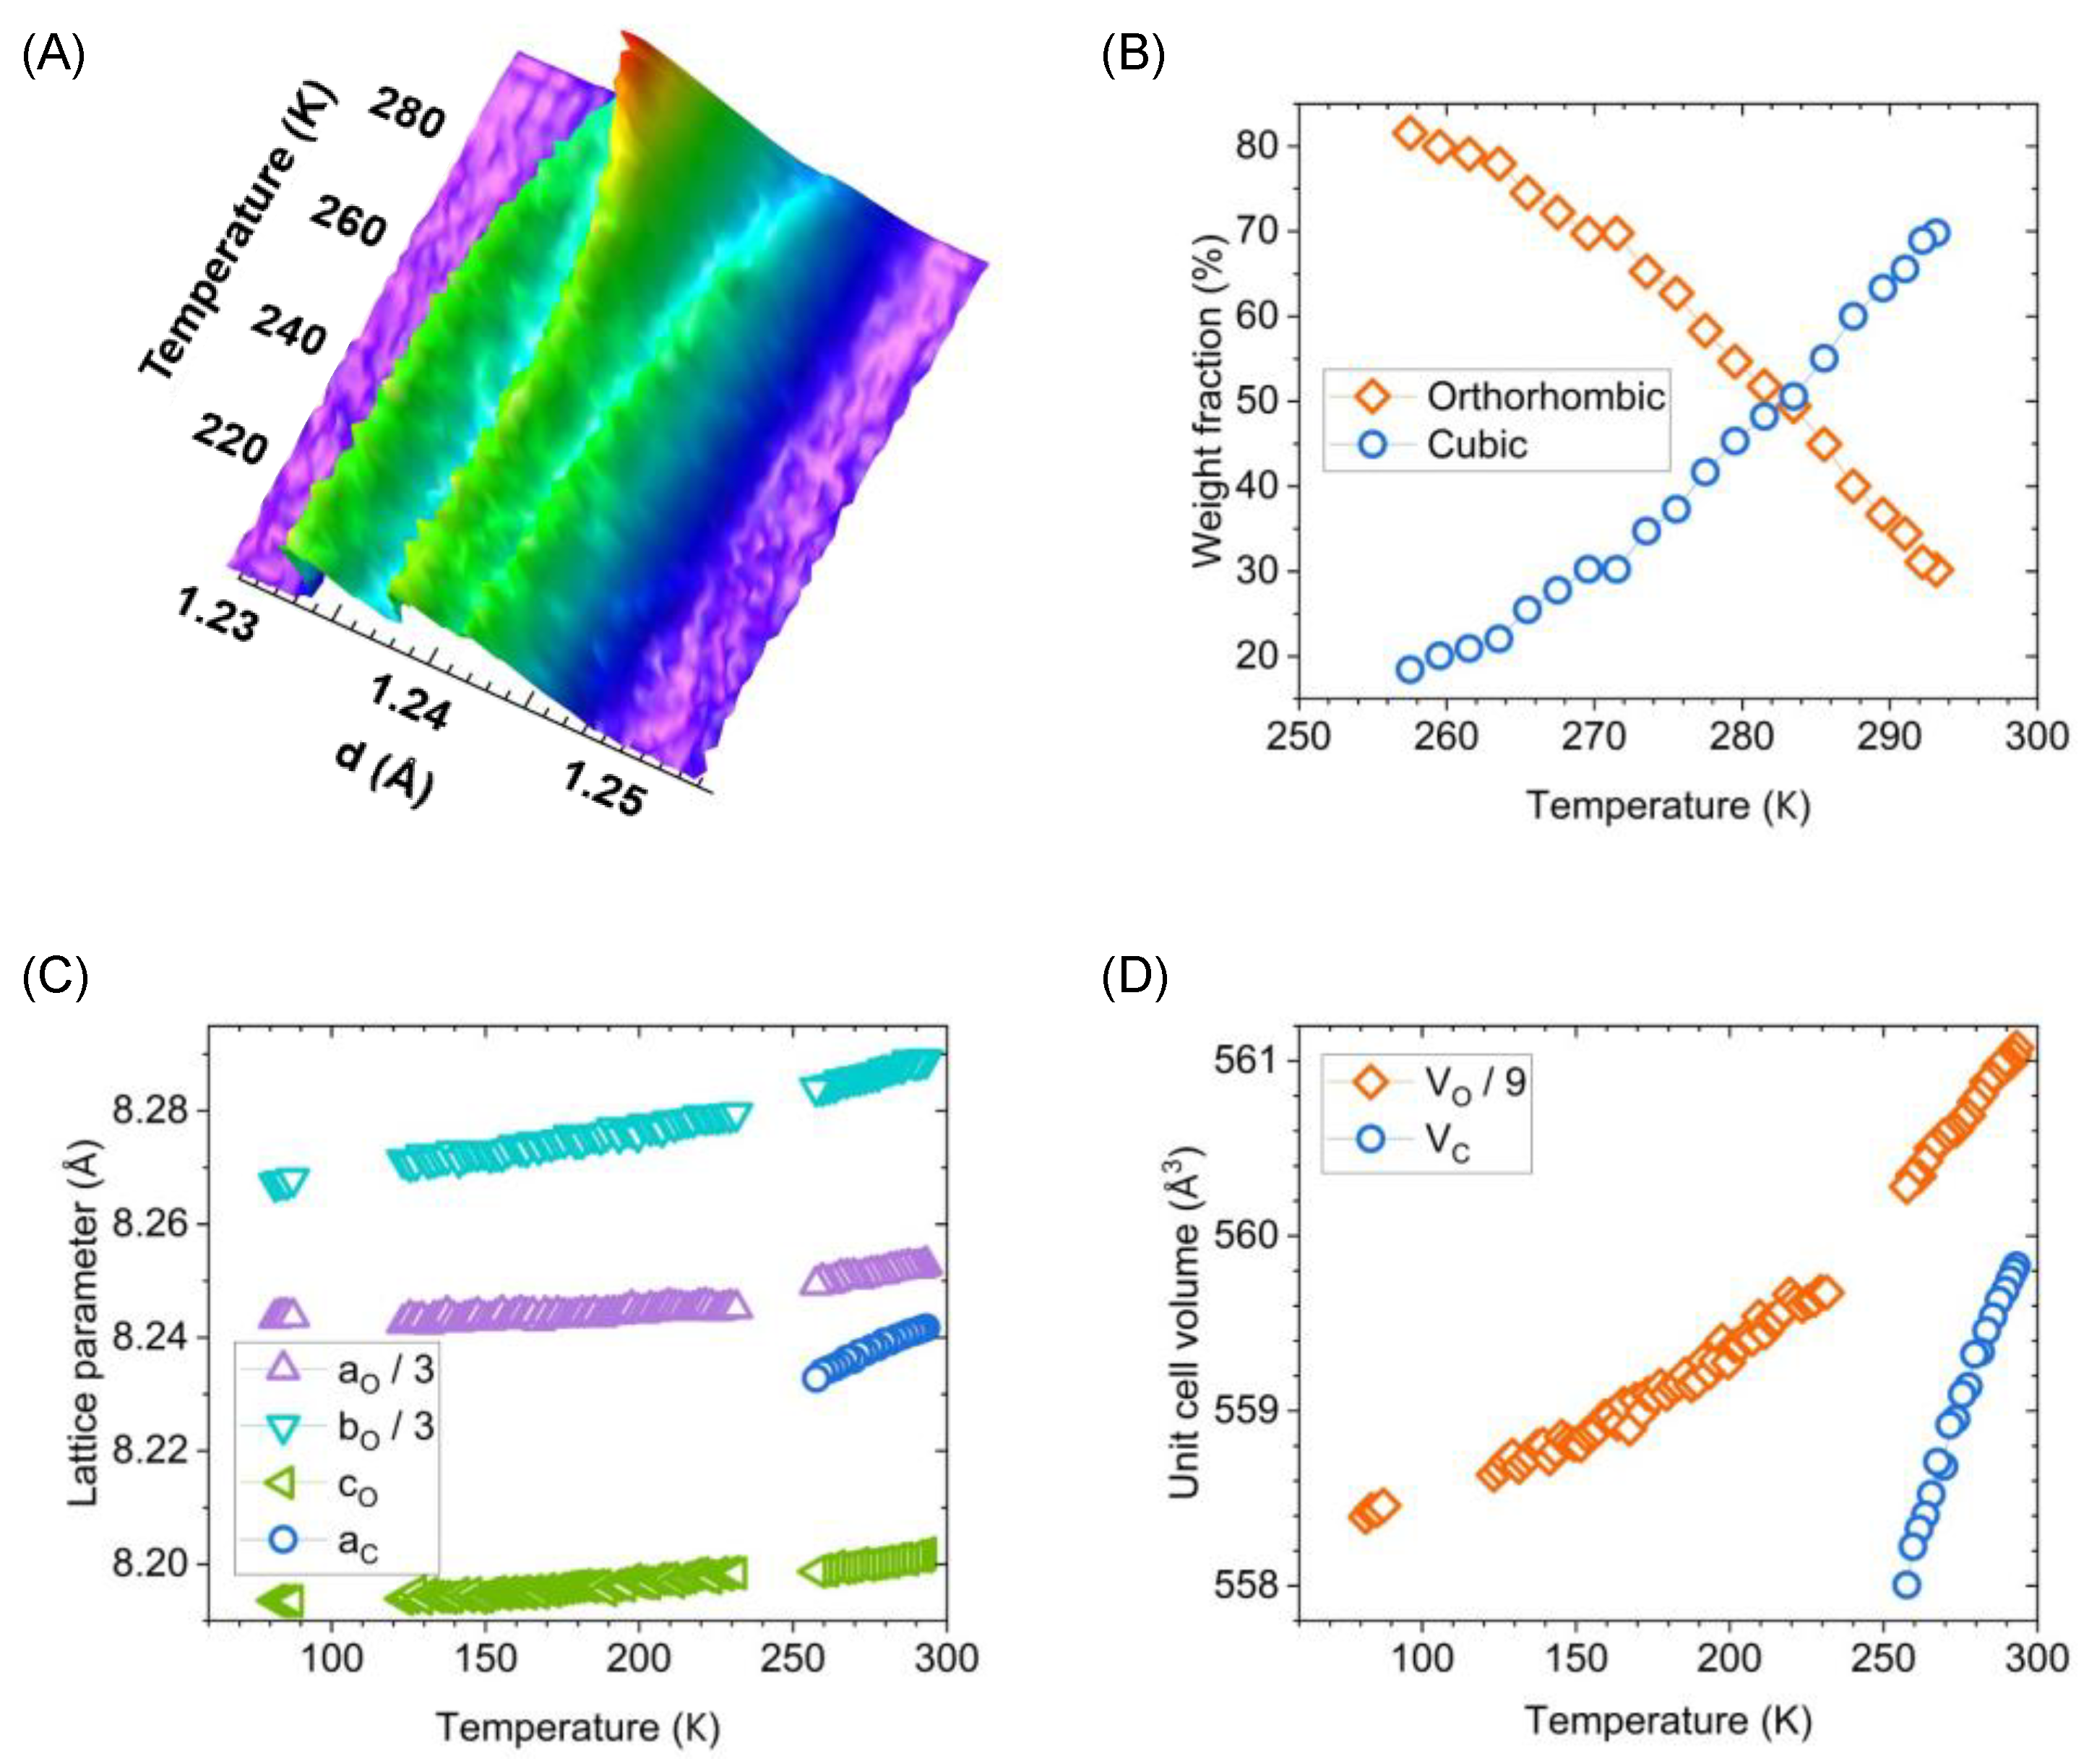
3.2. Cryogenic In Situ Neutron Diffraction of LiMn2O4

This cryogenic environment enables the continuous structure characterization of samples. Monitoring the continuous phase transition in an LiMn2O4 powder sample is employed for demonstration. It is noted that LiMn2O4 does not give a very strong diffraction signal due to the relative weak coherent scattering power and strong neutron absorption. The refinable in situ neutron diffraction patterns were acquired via this cryogenic sample environment. The pattern visualization via a 3D contour plot shows the occurrence of the orthorhombic-to-cubic transition (Figure 4A). The initial triplets are from the orthorhombic phase, and the rapid increase in single peak intensity indicates the cubic phase formation. The refinement quantified the phase fraction evolution (Figure 4B) and the lattice expansion (Figure 4C,D) before the completion of the transition. The two-phase coexistence status and the continuous transition process under this status are revealed, which was usually lacking in the literature [19,20,21]. During the transition, the orthorhombic lattice is not degenerated toward cubic. The discontinuity of the lattice parameters and the cell volume between the orthorhombic and cubic phases indicates that the transition is the first-order one. The cell volumes of the two phases are not the same. The newly formed cubic phase has a smaller volume than the orthorhombic phase, related to the change in the charge ordering of Mn ions [22,23]; however, the coefficient of the thermal expansion (CTE) of cubic is larger at the subsequent warming to RT. Therefore, the in situ neutron diffraction using this cryogenic environment captured the continuous fraction and unit cell evolution during the orthorhombic-to-cubic transition of LiMn2O4. It is noted that the gap near 100 K in Figure 4 is due to the temporary neutron power being off. The data are not solvable at 235 K–255 K because the peaks of the cubic phase are too weak and buried in the strong peaks of the orthorhombic phase at the beginning of the phase transition.

3.3. High-Throughput Measurements across Multiple Samples

3.3.1. Feasibility

The multiple slots in the gauge block accommodate multiple samples, which will thus enable high-throughput temperature scans across multiple samples in one measurement. To demonstrate the feasibility in terms of the temperature profile and neutron data quality, three powder samples LSM, LSCF, and LiMn2O4 were measured in the same batch. The LSCF sat at the center slot with the thermocouple monitoring the temperature, and the LSM and LiMn2O4 sat at the two side slots, respectively.
The temperature homogeneity between the center and side slots was characterized via the thermal expansion of the Al gauge block. This Al signal from the Al block surrounding the sample was smeared into the neutron gauge volume. The position of the Al reflections may not indicate the correct lattice parameter of Al due to its offset from the center of the neutron gauge, but the measured lattice strains reflect the thermal expansion thanks to the stationary setup. Figure 5A plots and compares the Al lattice strains at the center slot (with LSCF) and at a side slot (with LSM). The discrete measurements across the different slots well agree with the same lattice thermal expansion. This indicates the homogenous temperature distribution among the slots, thanks to the Al block that possesses high thermal conductivity. Moreover, the Al lattice strain may serve as an internal thermometer to calibrate the temperature at a particular sample slot. Plotted with the temperature reading via the thermocouple, the Al lattice strain exhibits non-linearity at the lower temperature region while showing a linear behavior or a constant CTE at 175 K–300 K.
The discrete multiple-sample scans at warming preserve the fidelity of continuous structure evolution. The LiMn2O4 at the high-throughput scans is taken as the example to compare to the continuous measurement. It took 1 min for the data acquisition on each sample plus an average 8 s of sample stage movement. To achieve better neutron statistics, there is a flexibility to sum up, for example, five measurements in this case when processing the data. After such data reorganization, the structure evolution is revealed in the diffraction contour plot and the subsequent batch data analysis through all the measurements. Figure 5B shows the zoom-in of the contour plot near the cubic 311 reflection, using the high-resolution data from the high-angle detector. It clearly indicates the gradual phase transformation from the orthorhombic structure to the cubic structure, as well as the anisotropic lattice thermal expansion in the orthorhombic phase prior to the transformation. The observations via the in situ continuous measurement in Figure 4 were not lost in the high-throughput scans.

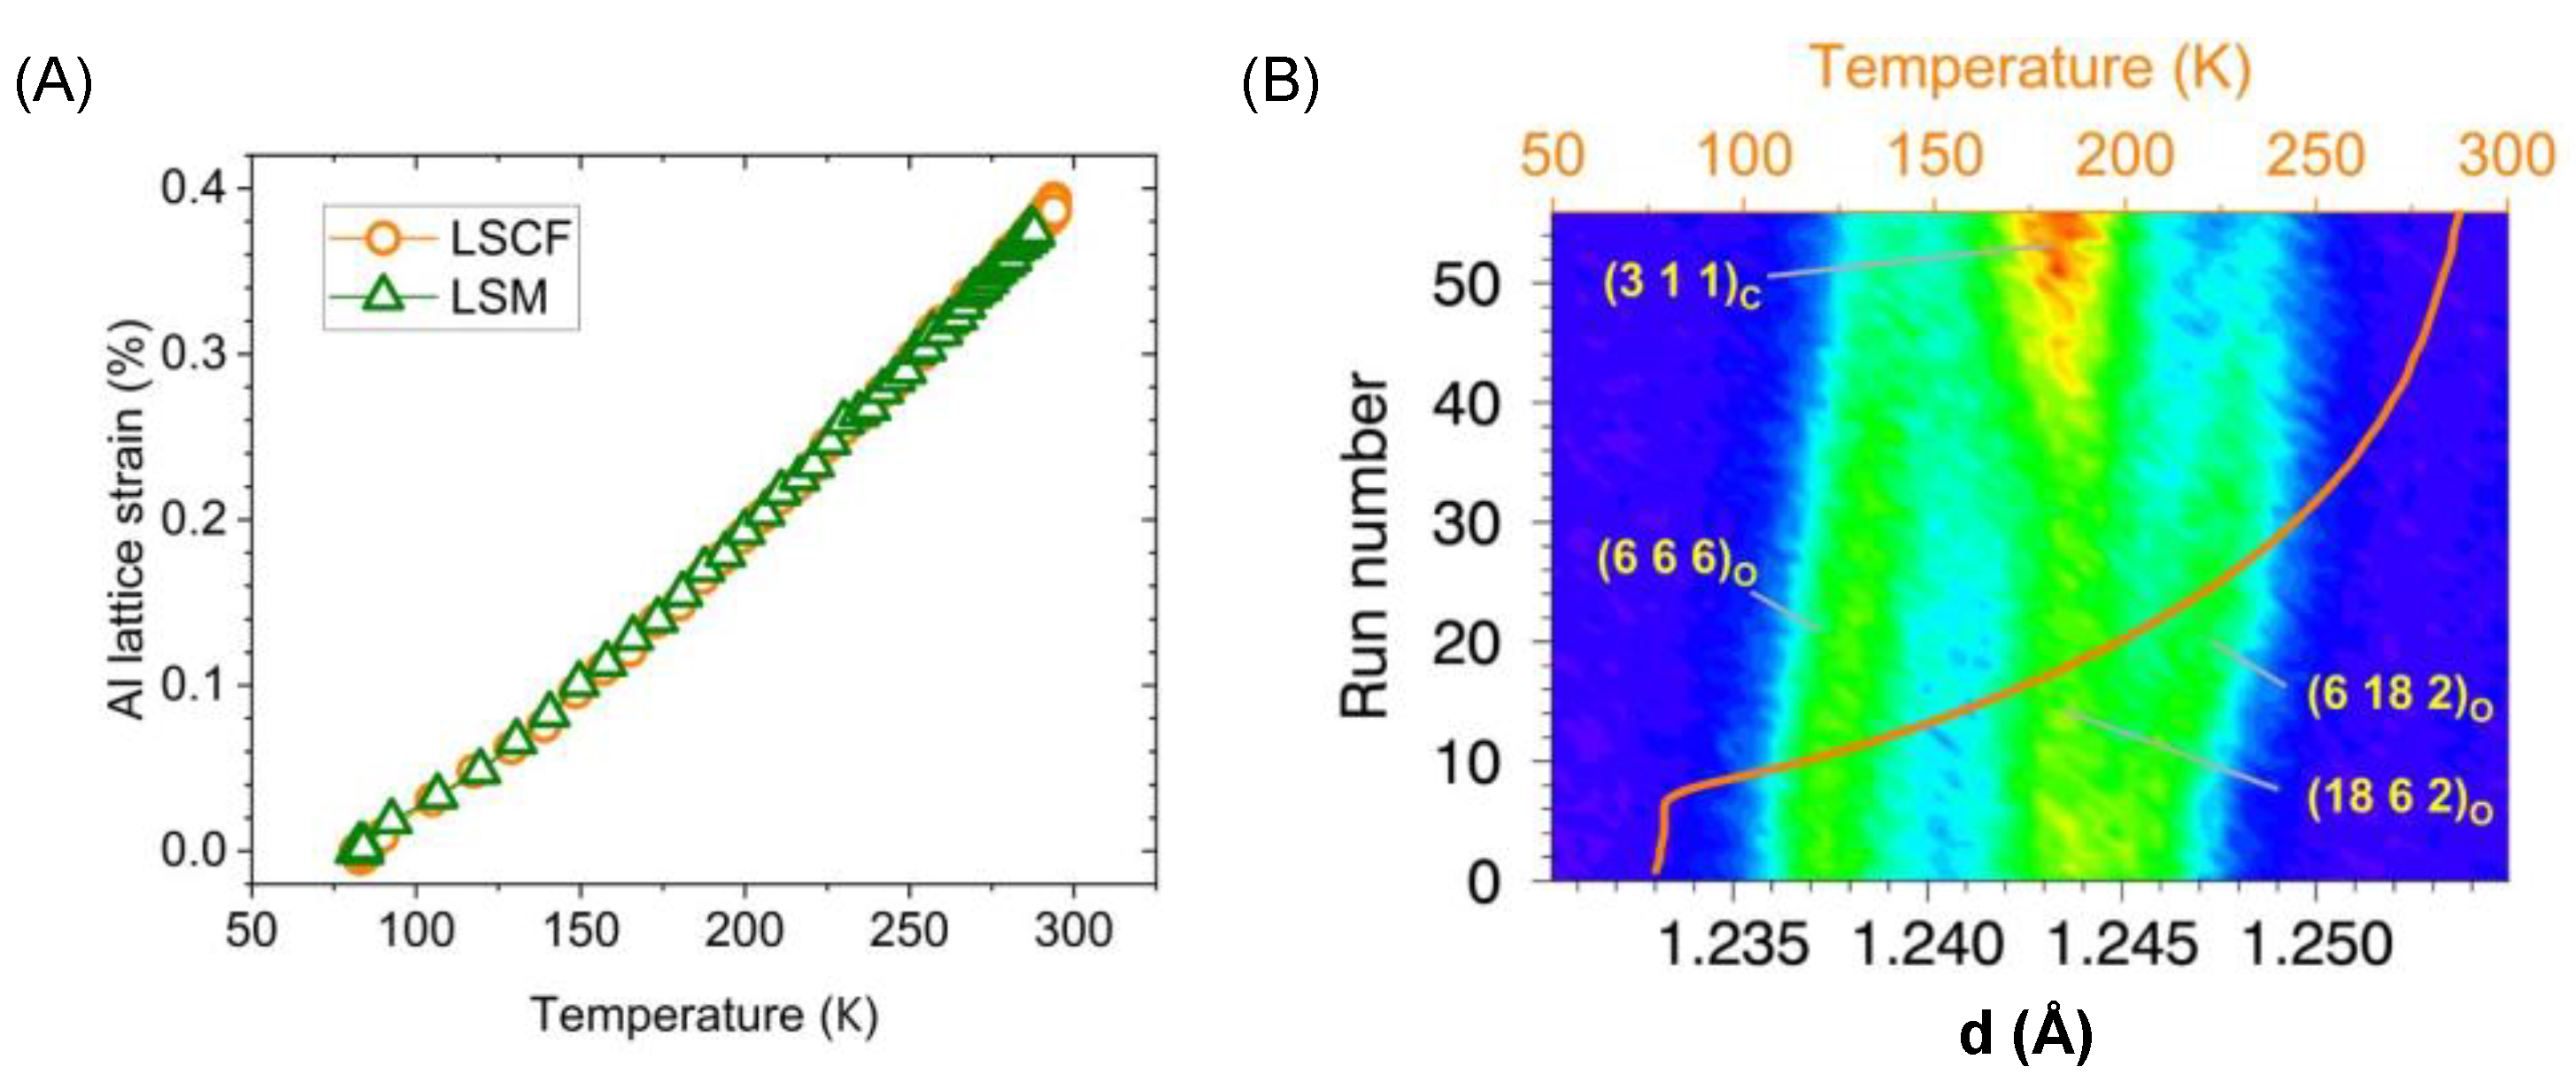
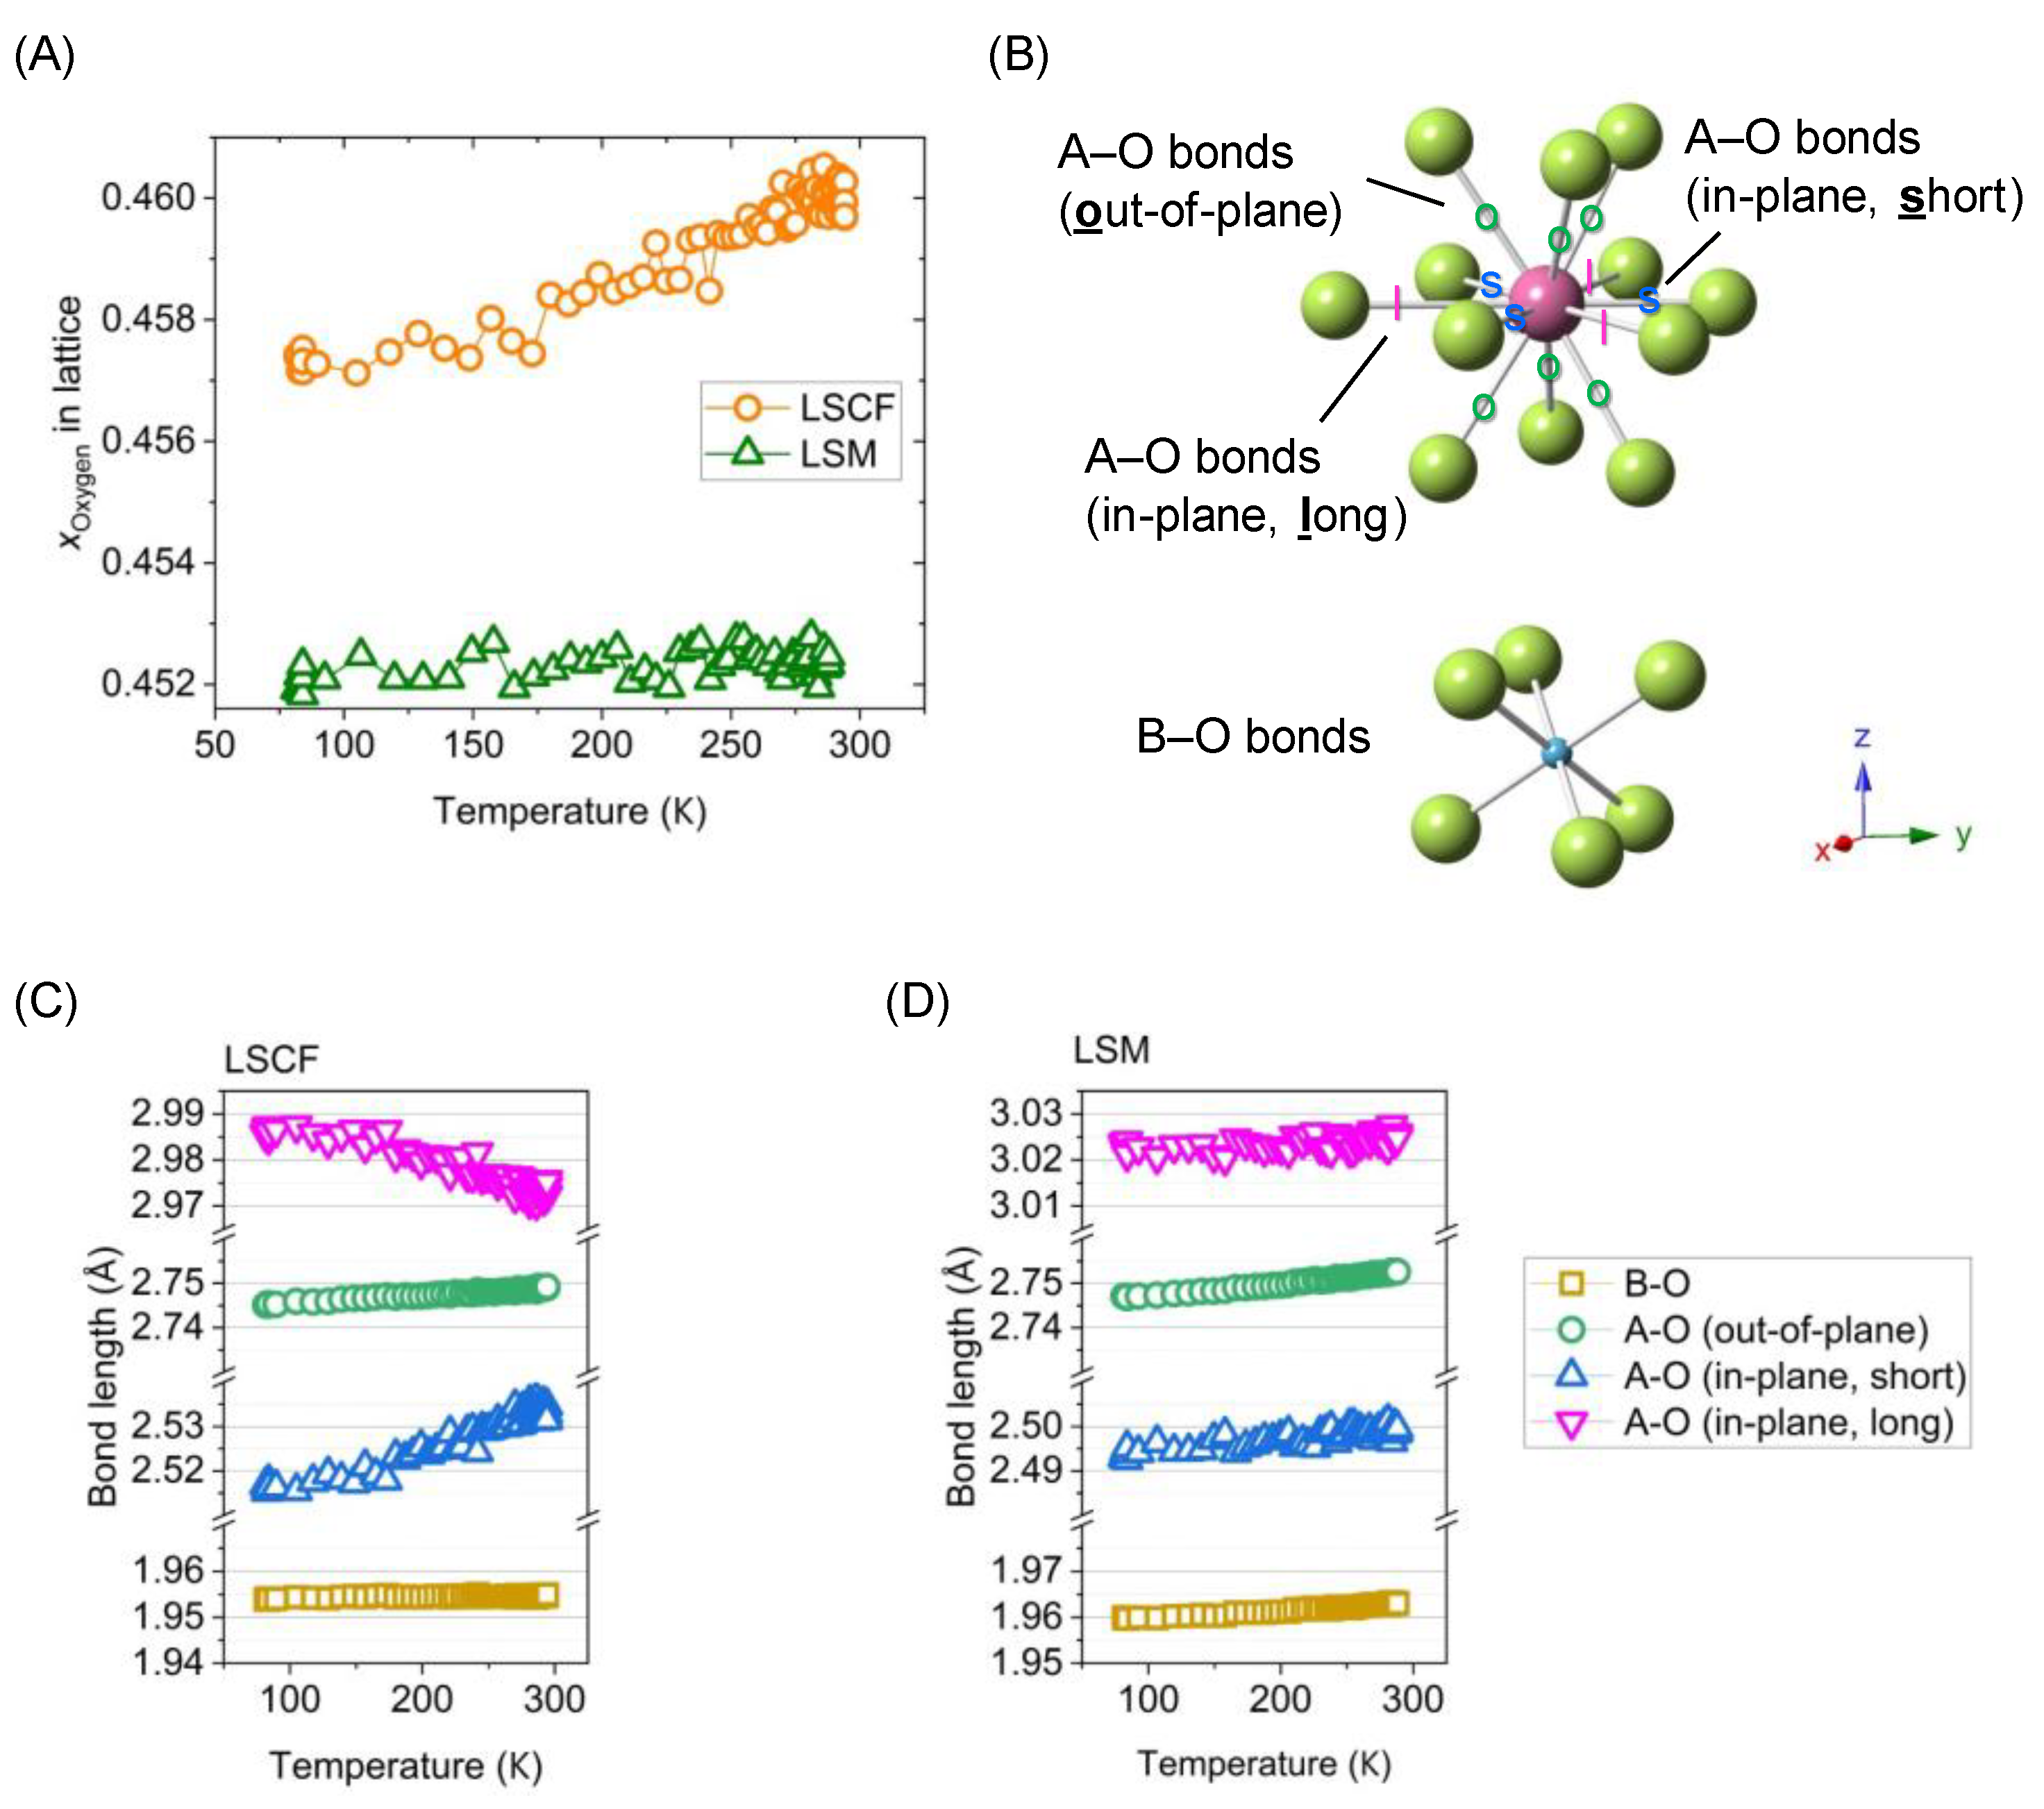
3.3.2. Anisotropic Thermal Expansion in Rhombohedral Perovskites

The high-throughput capability enables the comparison of similar materials in the same measurement. The neutron diffraction patterns with this cryogenic environment are delivered with high quality. The data are refinable to reveal the evolution of the unit cell and the fine structure changes inside the lattice. In the following, the two rhombohedral perovskites LSCF and LSM are taken as examples. In the ABO3 perovskite lattice of LSCF and LSM, the A-site element is similar (0.6La + 0.4Sr for LSCF and 0.8La + 0.2Sr for LSM) but the B-site element is completely different (0.2Co + 0.8Fe for LSCF and Mn for LSM). The rhombohedral perovskite structure is thought to be sensitive to the chemistry, resulting in discrepant behaviors in lattice expansion and distortion, and the stretching of A–O and B–O bonds at low temperatures. The high-throughput temperature scans provide a direct comparison of the thermal behavior of this group of materials.
Rietveld refinement on the pseudo-5-min data (Figure 6A,B) extracts the lattice thermal expansions of LSCF and LSM. Although both samples have a rhombohedral lattice with the R 3 ¯ c (167) space group (Figure 6C), the linearities of the lattice strains are different and distinguished in this test. In LSCF (Figure 6D), the lattice strains’ evolution is linear from the LN2 temperature to nearly RT in both axes. The CTE is larger along the c-axis than that along the a-axis, which indicates the significant anisotropy of CTE in the rhombohedral lattice of LSCF. In contrast, the non-linear lattice strains’ evolution is observed in the rhombohedral lattice of LSM (Figure 6E). The curvature at lower temperatures is obvious while the tendency to be more linear is seen at higher temperatures. This non-linear behavior of the LSM thermal expansion agrees with the literature [24]. Furthermore, the anisotropy of CTE in LSM, although observed, is not as large as in LSCF. The ratios of the two lattice parameters ( c   /   6 a ) indicates the rhombohedral distortion evolution (Figure 6F). This ratio is closer to 1 in LSCF than in LSM, which indicate the weaker rhombohedral distortion from cubic in the LSCF. At warming, this ratio increases, showing a further reduction in the distortion. Therefore, the anisotropic CTE results in the trend of restoring cubic symmetry at warming. Accordingly, the LSCF having larger anisotropy makes its trend faster than LSM. Those differences of the unit cell evolution are thought to be related to the B-site elements (Co and Fe in LSCF; Mn in LSM), which results in the different B–O bonds and temperature dependences of the bond length.
The neutron data have high quality to reveal the fine structure evolution in the lattice (Tables S1 and S2). In this rhombohedral-distorted perovskite lattice, while the coordinates of the A and B atoms are fixed, the x-coordinate of oxygen (xOxygen) has a freedom. The value of xOxygen was calculated via the Rietveld refinement, thanks to the sensitivity of neutron scattering to probe the lightweight oxygen. The temperature dependences in LSCF and LSM at warming are compared in Figure 7A. The oxygen position is nearly unchanged in LSM in the full temperature range. In contrast, the xOxygen in LSCF is larger than in LSM, and it further increases upon the temperature ramp. The oxygen position change and the lattice thermal expansion are correlated with the evolution of the bond lengths in the lattice (Figure 7B–D). Here, the bond length is calculated via the distance of the atoms’ average position in the lattice, which is differed from the possible bond length fluctuation due the atom’s local structure. With the R 3 ¯ c space group, the six B–O bonds have the same length in the BO6 octahedron. The twelve A–O bonds have three lengths. Among the six bonds in the xy-plane, there are three long A–O bonds and three short ones, which are arranged with the 6-fold symmetry. Out of the xy-plane, the rest of the six A–O bonds have the same length.
In LSCF (Figure 7C), the B–O bond is rigid and not much responsive upon heating. Therefore, the lattice expansion and distortion are correlated to the oxygen atom shifts as well as the changes in the A–O bonds. It is revealed that the in-plane A–O bond lengths significantly change at warming. The lengths of the long and short bonds exhibit a tendency to converge to the out-of-plane A–O bond length. This bond length evolution is also an indication of the trend toward a higher symmetry, such as a cubic structure, where the twelve A–O bonds have the same length. In LSM (Figure 7D), the B–O bond is not as rigid as that in LSCF. The bond length also elongated at warming. Unlike the convergence in LSCF, the A–O bonds in LSM maintain the three distinguished lengths and they are all slightly elongated consistently. Therefore, inside the expanding LSM lattice, all bond lengths are scaled accordingly, and it does not introduce the significant relative displacement of oxygen atoms.

4. Conclusions

A portable miniature cryogenic environment has been developed for in situ neutron diffraction experiments. This low-cost environment is easy to set up at the neutron diffractometer, which enables fast cooling, a stable dwell at the LN2 temperature, and a controlled temperature ramp to 473 K. The designed Al inserts highly improve the temperature homogeneity and provide a clear neutron pathway to produce high-quality neutron diffraction patterns. In addition, the high-throughput temperature scans across multiple samples are realized with this portable environment. Scientific demonstrations have been carried out. The high-resolution in situ neutron diffraction tracks the process of the orthorhombic-to-cubic phase transition in LiMn2O4. For two rhombohedral perovskite-type oxides, the different temperature-dependent lattice evolutions are revealed. The Rietveld refinements of the diffraction patterns conclude the anisotropic lattice distortion changes and the displacements of the lightweight oxygen element as well as the bond lengths’ evolution upon warming up. This sample environment will significantly improve the efficiency of cryogenic neutron diffraction experiments, and the high-throughput capability will enable batch experimental measurements of both composition screening and temperature scans, for needed theory validation or simulation inputs.

Supplementary Materials

The following supporting information can be downloaded at: https://www.mdpi.com/article/10.3390/cryst14070640/s1, Figure S1: (A) Top-mount design without an Al insert. (B) Temperature profile of warming up; Figure S2: (A) Top-mount design with an Al insert. (B) Temperature profile of warming up; Figure S3: Comparisons for the temperature homogeneity during warming, when the bottom rings with different heights were used; Figure S4: Lattice parameters of LSM and LSCF during warming via the high-throughput in situ neutron diffraction measurement; Figure S5: Neutron diffraction patterns (at 150° Bank) and Rietveld refinement of LiMn2O4 at 220 K (before the phase transition) and at 280 K (at the phase transition); Figure S6: Neutron diffraction patterns (at −90° Bank) and Rietveld refinement of LiMn2O4 at 220 K (before the phase transition) and at 280 K (at the phase transition); Table S1: Refined crystal structure of LSCF at 77 K by neutron diffraction; Table S2: Refined crystal structure of LSM at 77 K by neutron diffraction.

Author Contributions

Conceptualization, Y.C., D.Y. and K.A.; methodology, Y.C., D.Y. and K.A.; formal analysis, Y.C.; writing—original draft preparation, Y.C.; writing—review and editing, D.Y. and K.A.; visualization, Y.C. and D.Y. All authors have read and agreed to the published version of the manuscript.

Funding

This research received no external funding.

Data Availability Statement

The original contributions presented in the study are included in the article/Supplementary Material, further inquiries can be directed to the corresponding author.

Acknowledgments

This research used resources at the Spallation Neutron Source, a DOE Office of Science User Facility operated by the Oak Ridge National Laboratory. The beam time was allocated to VULCAN on proposal number IPTS-26946.

Conflicts of Interest

The authors declare no conflicts of interest.

References

  1. Börner, H.; Brown, J.; Carlile, C.J.; Cubitt, R.; Currat, R.; Dianoux, A.J.; Farago, B.; Hewat, A.W.; Kulda, J.; Lelièvre-Berna, E.; et al. Neutron Data Booklet, 2nd ed.; Dianoux, A., Lander, G., Eds.; OCP Science: Philadelphia, PA, USA, 2003. [Google Scholar]
  2. Ishikado, M.; Takahashi, R.; Yamauchi, Y.; Nakamura, M.; Ishimaru, S.; Yamauchi, S.; Ohira-Kawamura, S.; Kira, H.; Sakaguchi, Y.; Watanabe, M.; et al. Recent Status of the Cryogenic Sample Environment at the MLF, J-PARC. JPS Conf. Proc. 2024, 41, 011010. [Google Scholar] [CrossRef]
  3. Koehler, W.C.; Wollan, E.O. Neutron-diffraction study of the magnetic properties of perovskite-like compounds LaBO3. J. Phys. Chem. Solids 1957, 2, 100–106. [Google Scholar] [CrossRef]
  4. Wang, H.; Chen, Y.; Hood, Z.D.; Keum, J.K.; Pandian, A.S.; Chi, M.; An, K.; Liang, C.; Sunkara, M.K. Revealing the Structural Stability and Na-Ion Mobility of 3D Superionic Conductor Na3SbS4 at Extremely Low Temperatures. ACS Appl. Energy Mater. 2018, 1, 7028–7034. [Google Scholar] [CrossRef]
  5. Zhao, Y.; Zhang, S.; Zhao, H.; Sun, G.; Yao, X. Development of a variable temperature mechanical loading device for in situ neutron scattering measurements. J. Mech. Sci. Technol. 2022, 36, 3939–3947. [Google Scholar] [CrossRef]
  6. Hu, H.; Dou, M.; Zhang, C.; Cheng, H.; He, C.; Ke, Y.; Yuan, B.; Bai, B.; Sun, Y.; Huang, Z.; et al. Development of an automatic sample changer with variable temperature for small-angle neutron scattering at China Spallation Neutron Source. Rev. Sci. Instrum. 2023, 94, 074903. [Google Scholar] [CrossRef]
  7. Thackeray, M.M.; Lee, E.; Shi, B.; Croy, J.R. Review—From LiMn2O4 to Partially-Disordered Li2MnNiO4: The Evolution of Lithiated-Spinel Cathodes for Li-Ion Batteries. J. Electrochem. Soc. 2022, 169, 020535. [Google Scholar] [CrossRef]
  8. Lin, Q.; Bian, L.; Liu, C.; Ting, T.; Liu, Z.; Wei, P.; Han, S.; Xu, Y.; Peng, J.; An, S. Improved La0.8Sr0.2MnO3-δ oxygen electrode activity by introducing high oxygen ion conductor oxide for solid oxide steam electrolysis. Int. J. Hydrogen Energy 2024, 49, 616–624. [Google Scholar] [CrossRef]
  9. Rendón, R.C.; Udayabhaskar, R.; Salvo, C.; Sepúlveda, E.; Rodríguez, J.J.; Camurri, C.P.; Viswanathan, M.R. Evaluation of La0.8Sr0.2MnO3 perovskite prepared by fast solution combustion. Ceram. Int. 2022, 48, 35100–35107. [Google Scholar] [CrossRef]
  10. Araki, W.; Ikeda, K.; Otomo, N.; Nakazato, Y.; Yokoyama, S.; Arai, Y. Effect of Oxygen Deficiency on Mechanical and Thermomechanical Properties of Ferroic La0.6Sr0.4Co0.2Fe0.8O3−δ. Adv. Eng. Mater. 2022, 24, 2101204. [Google Scholar] [CrossRef]
  11. Daga, M.; Sanna, C.; Bais, G.; Polentarutti, M.; Massardo, S.; Carnasciali, M.; Holtappels, P.; Costamagna, P.; Pani, M.; Artini, C. Impact of the electrospinning synthesis route on the structural and electrocatalytic features of the LSCF (La0.6Sr0.4Co0.2Fe0.8O3–δ) perovskite for application in solid oxide fuel cells. Solid State Ionics 2024, 413, 116620. [Google Scholar] [CrossRef]
  12. An, K.; Chen, Y.; Stoica, A.D. VULCAN: A “hammer” for high-temperature materials research. MRS Bull. 2019, 44, 878–885. [Google Scholar] [CrossRef]
  13. Sears, V.F. Neutron scattering lengths and cross sections. Neutron News 1992, 3, 26–37. [Google Scholar] [CrossRef]
  14. Zhang, A.; Li, Y. Thermal Conductivity of Aluminum Alloys—A Review. Materials 2023, 16, 2972. [Google Scholar] [CrossRef] [PubMed]
  15. Chase, M.W., Jr. NIST-JANAF Thermochemical Tables, Monograph 9, 4th ed.; American Chemical Society: Washington, DC, USA, 1998. [Google Scholar]
  16. An, K. Data reduction and interactive visualization software for event mode neutron diffraction. In ORNL Report, ORNL-TM-2012; Oak Ridge National Laboratory: Oak Ridge, TN, USA, 2012; p. 621. Available online: https://neutrons.ornl.gov/sites/default/files/VDRIVE%20manual_1.pdf (accessed on 1 July 2024).
  17. Larson, A.C.; Von Dreele, R.B. General structure analysis system (GSAS). In Los Alamos National Laboratory Report LAUR; Los Alamos National Laboratory: Los Alamos, NM, USA, 2004; pp. 86–748. Available online: http://www.ccp14.ac.uk/ccp/ccp14/ftp-mirror/gsas/public/gsas/manual/GSASManual.pdf. (accessed on 1 July 2024).
  18. Toby, B.H. EXPGUI, a graphical user interface for GSAS. J. Appl. Crystallogr. 2001, 34, 210–213. [Google Scholar] [CrossRef]
  19. Rousse, G.; Masquelier, C.; Rodríguez-Carvajal, J.; Elkaim, E.; Lauriat, J.P.; Martínez, J.L. X-ray Study of the Spinel LiMn2O4 at Low Temperatures. Chem. Mater. 1999, 11, 3629–3635. [Google Scholar] [CrossRef]
  20. Piszora, P. Temperature dependence of the order and distribution of Mn3+ and Mn4+ cations in orthorhombic LiMn2O4. J. Alloys Compd. 2004, 382, 112–118. [Google Scholar] [CrossRef]
  21. Chen, Y.; Yu, D.; An, K. Stress-induced charge-ordering process in LiMn2O4. Mater. Res. Lett. 2017, 5, 89–94. [Google Scholar] [CrossRef]
  22. Wills, A.S.; Raju, N.P.; Greedan, J.E. Low-Temperature Structure and Magnetic Properties of the Spinel LiMn2O4:  A Frustrated Antiferromagnet and Cathode Material. Chem. Mater. 1999, 11, 1510–1518. [Google Scholar] [CrossRef]
  23. Rodríguez-Carvajal, J.; Rousse, G.; Masquelier, C.; Hervieu, M. Electronic Crystallization in a Lithium Battery Material: Columnar Ordering of Electrons and Holes in the Spinel LiMn2O4. Phys. Rev. Lett. 1998, 81, 4660–4663. [Google Scholar] [CrossRef]
  24. Gaviko, V.S.; Korolev, A.V.; Arkhipov, V.E.; Bebenin, N.G.; Mukovskii, Y.M. X-ray studies of the (La,Sr)MnO3 perovskite manganite structure. Phys. Solid State 2005, 47, 1299–1305. [Google Scholar] [CrossRef]
Figure 1. Design view of the portable cryogenic environment. (A) Holistic view with schematic neutron beam path (see next section and Reference [12] for the details of neutron optics). (B) Vertical section view of the insert structure with sample cans. (C) Horizontal section view at the level of measurement position.
Crystals 14 00640 g001
Figure 2. The experiment setup of in situ neutron diffraction using the miniature cryogenic environment at VULCAN diffractometer at SNS. The inset zooms in to the show the incident slits and a close view of the bottle.
Crystals 14 00640 g002
Figure 3. Temperature ramp profile. With different height of bottom ring during the natural warming, the TC-1 reading (A), the TC-2 reading (B), and the warming rate via TC-1 (C). Natural warming and controlled heating profiles (D). The zero of time is shifted to the beginning of warming for each configuration.
Crystals 14 00640 g003
Figure 4. Phase transition in LiMn2O4. (A) A selected region of the d-temperature-intensity 3D contour plot of in situ neutron diffraction patterns during warming up. (B) The phase fractions as function of temperature in LiMn2O4. (C) The lattice parameters evolution of the cubic and rhombohedral phases. (D) The unit cell volume changes in the two phases. The parameters and volume of the orthorhombic phase are divided by a factor for comparison because the orthorhombic unit cell is a 3 × 3 × 1 supercell of the cubic unit cell.
Crystals 14 00640 g004
Figure 5. (A) Comparison of lattice strains of Al from the gauge block at the different sample slots. (B) Pseudo-continuous scans of LiMn2O4 during warming revealing the phase transformation and the anisotropic lattice thermal expansion.
Crystals 14 00640 g005
Figure 6. Lattice evolution in LSM and LSCF during warming, measured by the high-throughput in situ neutron diffraction. (A,B) Neutron diffraction patterns (five 1 min scans summed up) and the results of Rietveld refinement. Data were measured at 77 K by the 90° detector bank with a fine receiving collimator (5 mm gauge) equipped. Dots, red solid line, green dash–dot line, and blue dash lines are the measured pattern, refined pattern, fitted background, and fitting residual, respectively. (C) Crystal structure of rhombohedral perovskite-type lattice. (D,E) Anisotropic lattice thermal expansion in strain. (F) Rhombohedral distortion evolution.
Crystals 14 00640 g006
Figure 7. Fine structure evolution in LSM and LSCF during warming, measured by the high-throughput in situ neutron diffraction. (A) Oxygen x-coordinate in the lattice. (B) Illustration of the B–O and A–O bonds. Bonds are marked with a letter that is underlined in the description. (C,D) Average bond lengths.
Crystals 14 00640 g007
Disclaimer/Publisher’s Note: The statements, opinions and data contained in all publications are solely those of the individual author(s) and contributor(s) and not of MDPI and/or the editor(s). MDPI and/or the editor(s) disclaim responsibility for any injury to people or property resulting from any ideas, methods, instructions or products referred to in the content.

