
Computational Study of Molecular Interactions in ZnCl2(urea)2 Crystals as Precursors for Deep Eutectic Solvents


Abstract
:1. Introduction
2. Computational Methods
3. Results and Discussion
4. Conclusions
- In ZnCl2–urea systems, the N−H···Cl− hydrogen bonds may compete with the possibly stronger N−H···O hydrogen bonds, leading to the formation of the ‘urea sub-network’ in the structure of the liquid and poorer compatibility of the components. The appearance of cyclic urea dimers is a strong possibility.
- The N−H···Cl− hydrogen bonds are expected to be bidentate, with a single urea molecule donating two such bonds to a chloride simultaneously. Such bonds are necessarily strained and far from linear and the urea–Cl− interaction will be labile.
- The tetrahedral Zn(II) solvation complex with mixed coordination type, as seen in the crystal structure, is also possibly formed in the liquid DES, acting as a linker between the urea hydrogen bond network and the ZnCl2 subsystem. The existence of other complex stoichiometries, such as ZnCl+(urea)3 and ZnCl3−(urea) cannot be ruled out, however.
- The partially covalent character of the Zn−Cl bonds is probably responsible for the experimentally observed low conductivity of the ZnCl2–urea DES, along with the possibly dominating character of the electrically neutral coordination complexes, as found in the studied crystal.
- The comparison of the ZnCl2(urea)2 and pure urea crystal structures reveals that ZnCl2 acts a a disruptor in the long-range hydrogen bond network formed by urea molecules, thus providing a natural explanation for the deep eutectic character of the system expressed via the significant lowering of the melting point.
Author Contributions
Funding
Data Availability Statement
Acknowledgments
Conflicts of Interest
References
- Smith, E.L.; Abbott, A.P.; Ryder, K.S. Deep Eutectic Solvents (DESs) and Their Applications. Chem. Rev. 2014, 114, 11060–11082. [Google Scholar] [CrossRef] [PubMed]
- Abbott, A.P.; Capper, G.; Davies, D.L.; Rasheed, R.K.; Tambyrajah, V. Novel solvent properties of choline chloride/urea mixtures. Chem. Commun. 2003, 70–71. [Google Scholar] [CrossRef] [PubMed]
- Gilmore, M.; Swadzba-Kwasny, M.; Holbrey, J.D. Thermal Properties of Choline Chloride/Urea System Studied under Moisture-Free Atmosphere. J. Chem. Eng. Data 2019, 64, 5248–5255. [Google Scholar] [CrossRef]
- van den Bruinhorst, A.; Avila, J.; Rosenthal, M.; Pellegrino, A.; Burghammer, M.; Costa Gomes, M. Defying decomposition: The curious case of choline chloride. Nat. Commun. 2023, 14, 6684. [Google Scholar] [CrossRef] [PubMed]
- Chen, Y.; Yu, D.; Chen, W.; Fu, L.; Mu, T. Water absorption by deep eutectic solvents. Phys. Chem. Chem. Phys. 2019, 21, 2601–2610. [Google Scholar] [CrossRef] [PubMed]
- Palmelund, H.; Rantanen, J.; Löbmann, K. Deliquescence Behavior of Deep Eutectic Solvents. Appl. Sci. 2021, 11, 1601. [Google Scholar] [CrossRef]
- Hansen, B.B.; Spittle, S.; Chen, B.; Poe, D.; Zhang, Y.; Klein, J.M.; Horton, A.; Adhikari, L.; Zelovich, T.; Doherty, B.W.; et al. Deep Eutectic Solvents: A Review of Fundamentals and Applications. Chem. Rev. 2021, 121, 1232–1285. [Google Scholar] [CrossRef]
- Abranches, D.O.; Martins, M.A.R.; Silva, L.P.; Schaeffer, N.; Pinho, S.P.; Coutinho, J.A.P. Phenolic hydrogen bond donors in the formation of non-ionic deep eutectic solvents: The quest for type V DES. Chem. Commun. 2019, 55, 10253–10256. [Google Scholar] [CrossRef]
- Ünlü, A.E.; Arıkaya, A.; Takaç, S. Use of deep eutectic solvents as catalyst: A mini-review. Green Process. Synth. 2019, 8, 355–372. [Google Scholar] [CrossRef]
- Yu, D.; Xue, Z.; Mu, T. Deep eutectic solvents as a green toolbox for synthesis. Cell Rep. Phys. Sci. 2022, 3, 100809. [Google Scholar] [CrossRef]
- Rodríguez-Llorente, D.; Cañada-Barcala, A.; Álvarez Torrellas, S.; Águeda, V.I.; García, J.; Larriba, M. A Review of the Use of Eutectic Solvents, Terpenes and Terpenoids in Liquid–liquid Extraction Processes. Processes 2020, 8, 1220. [Google Scholar] [CrossRef]
- Shishov, A.; Bulatov, A.; Locatelli, M.; Carradori, S.; Andruch, V. Application of deep eutectic solvents in analytical chemistry. A review. Microchem. J. 2017, 135, 33–38. [Google Scholar] [CrossRef]
- Płotka-Wasylka, J.; De La Guardia, M.; Andruch, V.; Vilková, M. Deep eutectic solvents vs. ionic liquids: Similarities and differences. Microchem. J. 2020, 159, 105539. [Google Scholar] [CrossRef]
- Abo-Hamad, A.; Hayyan, M.; AlSaadi, M.A.; Hashim, M.A. Potential applications of deep eutectic solvents in nanotechnology. Chem. Eng. J. 2015, 273, 551–567. [Google Scholar] [CrossRef]
- Chakrabarti, M.H.; Mjalli, F.S.; AlNashef, I.M.; Hashim, M.A.; Hussain, M.A.; Bahadori, L.; Low, C.T.J. Prospects of applying ionic liquids and deep eutectic solvents for renewable energy storage by means of redox flow batteries. Renew. Sustain. Energy Rev. 2014, 30, 254–270. [Google Scholar] [CrossRef]
- Zhang, Q.; De Oliveira Vigier, K.; Royer, S.; Jérôme, F. Deep eutectic solvents: Syntheses, properties and applications. Chem. Soc. Rev. 2012, 41, 7108. [Google Scholar] [CrossRef] [PubMed]
- Morozova, O.V.; Vasil’eva, I.S.; Shumakovich, G.P.; Zaitseva, E.A.; Yaropolov, A.I. Deep Eutectic Solvents for Biotechnology Applications. Biochemistry 2023, 88, S150–S175. [Google Scholar] [CrossRef] [PubMed]
- Khalid, A.; Tahir, S.; Khalid, A.R.; Hanif, M.A.; Abbas, Q.; Zahid, M. Breaking new grounds: Metal salts based-deep eutectic solvents and their applications- a comprehensive review. Green Chem. 2024, 26, 2421–2453. [Google Scholar] [CrossRef]
- Abbott, A.P.; Barron, J.C.; Ryder, K.S.; Wilson, D. Eutectic-Based Ionic Liquids with Metal-Containing Anions and Cations. Chem. Eur. J. 2007, 13, 6495–6501. [Google Scholar] [CrossRef]
- Lian, H.; Hong, S.; Carranza, A.; Mota-Morales, J.D.; Pojman, J.A. Processing of lignin in urea–zinc chloride deep-eutectic solvent and its use as a filler in a phenol-formaldehyde resin. RSC Adv. 2015, 5, 28778–28785. [Google Scholar] [CrossRef]
- Gao, J.; Lin, H.; Wen, A.; Chen, J.; Yang, W.; Li, R. Zinc Complex Derived from ZnCl2-Urea Ionic Liquid for Improving Mildew Property of Bamboo. Coatings 2020, 10, 1233. [Google Scholar] [CrossRef]
- Li, X.; Xiao, J.; Wei, W.; Yan, M.; Guo, D.; Lian, H. Preparation mechanism and performance evaluation of deep eutectic solvent-lignin/ZnO composites by one-pot. Int. J. Biol. Macromol. 2023, 225, 1405–1414. [Google Scholar] [CrossRef]
- Ochoa-Puentes, C.; Higuera, N.; Peña-Solórzano, D. Urea–Zinc Chloride Eutectic Mixture-Mediated One-Pot Synthesis of Imidazoles: Efficient and Ecofriendly Access to Trifenagrel. Synlett 2018, 30, 225–229. [Google Scholar] [CrossRef]
- Nishtala, V.B.; Basavoju, S. ZnCl2 + Urea, the deep eutectic solvent promoted synthesis of the spirooxindolopyrans and xanthenes through a pseudo-three-component approach. Synth. Commun. 2019, 49, 2342–2349. [Google Scholar] [CrossRef]
- Aghapoor, K.; Mohsenzadeh, F.; Darabi, H.R.; Sayahi, H.; Jalali, M.R. ZnCl2/Urea Eutectic Solvent as Stable Carbonylation Source for Benign Synthesis of 2–Benzimidazolones and 2–Imidazolones: An Effective Strategy for Preventing NH3 Gas Evolution. ChemistrySelect 2019, 4, 11093–11097. [Google Scholar] [CrossRef]
- Peña-Solórzano, D.; Kouznetsov, V.V.; Ochoa-Puentes, C. Physicochemical properties of a urea/zinc chloride eutectic mixture and its improved effect on the fast and high yield synthesis of indeno[2,1-C]quinolines. New J. Chem. 2020, 44, 7987–7997. [Google Scholar] [CrossRef]
- Walvekar, R.; Kunju, K.; Saputra, R.; Siddiqui, K.; Ramarad, S. Parametric Study for Devulcanization of Waste Tire Rubber Utilizing Deep Eutectic Solvent (DES). MATEC Web Conf. 2018, 152, 01005. [Google Scholar] [CrossRef]
- Wang, Q.; Yao, X.; Geng, Y.; Zhou, Q.; Lu, X.; Zhang, S. Deep eutectic solvents as highly active catalysts for the fast and mild glycolysis of poly(ethylene terephthalate)(PET). Green Chem. 2015, 17, 2473–2479. [Google Scholar] [CrossRef]
- Gontrani, L.; Donia, D.T.; Maria Bauer, E.; Tagliatesta, P.; Carbone, M. Novel Synthesis of Zinc Oxide Nanoparticles from Type IV Deep Eutectic Solvents. Inorg. Chim. Acta 2023, 545, 121268. [Google Scholar] [CrossRef]
- Rong, K.; Huang, L.; Zhang, H.; Zhai, J.; Fang, Y.; Dong, S. Electrochemical fabrication of nanoporous gold electrodes in a deep eutectic solvent for electrochemical detections. Chem. Commun. 2018, 54, 8853–8856. [Google Scholar] [CrossRef]
- Wang, L.; Deng, Y.; Yan, L. Low-Cost “Water-in-Deep Eutectic Solvent” Electrolyte for High-Performance Zinc Ion Hybrid Supercapacitors. ACS Appl. Energy Mater. 2023, 6, 10585–10592. [Google Scholar] [CrossRef]
- Tolmachev, D.; Lukasheva, N.; Ramazanov, R.; Nazarychev, V.; Borzdun, N.; Volgin, I.; Andreeva, M.; Glova, A.; Melnikova, S.; Dobrovskiy, A.; et al. Computer Simulations of Deep Eutectic Solvents: Challenges, Solutions, and Perspectives. Int. J. Mol. Sci. 2022, 23, 645. [Google Scholar] [CrossRef] [PubMed]
- Velez, C.; Acevedo, O. Simulation of deep eutectic solvents: Progress to promises. Wiley Interdiscip. Rev. Comput. Mol. Sci. 2022, 12, e1598. [Google Scholar] [CrossRef]
- Zahn, S.; Kirchner, B.; Mollenhauer, D. Charge Spreading in Deep Eutectic Solvents. ChemPhysChem 2016, 17, 3354–3358. [Google Scholar] [CrossRef]
- Alizadeh, V.; Malberg, F.; Pádua, A.A.H.; Kirchner, B. Are There Magic Compositions in Deep Eutectic Solvents? Effects of Composition and Water Content in Choline Chloride/Ethylene Glycol from Ab Initio Molecular Dynamics. J. Phys. Chem. B 2020, 124, 7433–7443. [Google Scholar] [CrossRef]
- Abranches, D.O.; Coutinho, J.A. Everything You Wanted to Know about Deep Eutectic Solvents but Were Afraid to Be Told. Annu. Rev. Chem. Biomol. Eng. 2023, 14, 141–163. [Google Scholar] [CrossRef] [PubMed]
- Agieienko, V.; Buchner, R. Is ethaline a deep eutectic solvent? Phys. Chem. Chem. Phys. 2022, 24, 5265–5268. [Google Scholar] [CrossRef] [PubMed]
- Mishra, D.K.; Gopakumar, G.; Pugazhenthi, G.; Siva Brahmmananda Rao, C.V.; Nagarajan, S.; Banerjee, T. Molecular and Spectroscopic Insights into a Metal Salt-Based Deep Eutectic Solvent: A Combined Quantum Theory of Atoms in Molecules, Noncovalent Interaction, and Density Functional Theory Study. J. Phys. Chem. A 2021, 125, 9680–9690. [Google Scholar] [CrossRef]
- Singh, M.B.; Kumar, A.; Jain, P.; Singh, P.; Kumari, K. An insight of novel eutectic mixture between thiazolidine-2,4-dione and zinc chloride: Temperature-dependent density functional theory approach. J. Phys. Org. Chem. 2021, 35, e4305. [Google Scholar] [CrossRef]
- Furmanova, N.G.; Resnyanski, V.F.; Sulaimankulov, K.S.; Sulaimankulova, D.K.; Zhorobekova, S.Z. Crystal structure of the zinc chloride complex with carbamide, ZnCl2·2CO(NH2)2. Crystallogr. Rep. 1998, 43, 234–236. [Google Scholar]
- Furmanova, N.G.; Resnyanski, V.F.; Sulaimankulov, K.S.; Zhorobekova, S.Z.; Sulaimankulova, D.K. Crystal structure of the zinc iodide complex with carbamide, ZnI2·2CO(NH2)2. Crystallogr. Rep. 2001, 46, 51–55. [Google Scholar] [CrossRef]
- Erkasov, R.S.; Nesmeyanova, R.M.; Orazbaeva, R.S.; Bolysbekova, S.M. Solubility in the ZnCl2−CO(NH2)2−HCl−H2O system at 25 °C. Russ. J. Inorg. Chem. 2013, 58, 213–215. [Google Scholar] [CrossRef]
- Groom, C.R.; Bruno, I.J.; Lightfoot, M.P.; Ward, S.C. The Cambridge Structural Database. Acta Crystallogr. B 2016, 72, 171–179. [Google Scholar] [CrossRef] [PubMed]
- Clark, S.J.; Segall, M.D.; Pickard, C.J.; Hasnip, P.J.; Probert, M.J.; Refson, K.; Payne, M. First principles methods using CASTEP. Z. Kristall. 2005, 220, 567–570. [Google Scholar] [CrossRef]
- Perdew, J.P.; Burke, K.; Ernzerhof, M. Generalized Gradient Approximation Made Simple. Phys. Rev. Lett. 1996, 77, 3865–3868. [Google Scholar] [CrossRef] [PubMed]
- Grimme, S.; Antony, J.; Ehrlich, S.; Krieg, H. A consistent and accurate ab initio parametrization of density functional dispersion correction (DFT-D) for the 94 elements H-Pu. J. Chem. Phys. 2010, 132, 154104. [Google Scholar] [CrossRef] [PubMed]
- Grimme, S.; Ehrlich, S.; Goerigk, L. Effect of the damping function in dispersion corrected density functional theory. J. Comput. Chem. 2011, 32, 1456–1465. [Google Scholar] [CrossRef] [PubMed]
- Hamann, D.R.; Schluter, M.; Chiang, C. Norm-Conserving Pseudopotentials. Phys. Rev. Lett. 1979, 43, 1494–1497. [Google Scholar] [CrossRef]
- Monkhorst, H.J.; Pack, J.D. Special points for Brillouin-zone integrations. Phys. Rev. B 1976, 13, 5188–5192. [Google Scholar] [CrossRef]
- Björkman, T. CIF2Cell: Generating geometries for electronic structure programs. Comput. Phys. Commun. 2011, 182, 1183–1186. [Google Scholar] [CrossRef]
- Bader, R.F.W. A quantum theory of molecular structure and its applications. Chem. Rev. 1991, 91, 893–928. [Google Scholar] [CrossRef]
- Johnson, E.R.; Keinan, S.; Mori-Sánchez, P.; Contreras-García, J.; Cohen, A.J.; Yang, W. Revealing Noncovalent Interactions. J. Am. Chem. Soc. 2010, 132, 6498–6506. [Google Scholar] [CrossRef] [PubMed]
- Otero-de-la-Roza, A.; Johnson, E.R.; Luaña, V. Critic2: A program for real-space analysis of quantum chemical interactions in solids. Comput. Phys. Commun. 2014, 185, 1007–1018. [Google Scholar] [CrossRef]
- Otero-de-la-Roza, A.; Blanco, M.A.; Pendás, A.M.; Luaña, V. Critic: A new program for the topological analysis of solid-state electron densities. Comput. Phys. Commun. 2009, 180, 157–166. [Google Scholar] [CrossRef]
- Rutter, M.J. C2x: A tool for visualisation and input preparation for Castep and other electronic structure codes. Comput. Phys. Commun. 2018, 225, 174–179. [Google Scholar] [CrossRef]
- Humphrey, W.; Dalke, A.; Schulten, K. VMD—Visual Molecular Dynamics. J. Mol. Graph. 1996, 14, 33–38. [Google Scholar] [CrossRef] [PubMed]
- Emamian, S.; Lu, T.; Kruse, H.; Emamian, H. Exploring Nature and Predicting Strength of Hydrogen Bonds: A Correlation Analysis Between Atoms-in-Molecules Descriptors, Binding Energies, and Energy Components of Symmetry-Adapted Perturbation Theory. J. Comput. Chem. 2019, 40, 2868–2881. [Google Scholar] [CrossRef] [PubMed]
- Zavodnik, V.; Stash, A.; Tsirelson, V.; de Vries, R.; Feil, D. Electron density study of urea using TDS-corrected X-ray diffraction data: Quantitative comparison of experimental and theoretical results. Acta Crystallogr. B 1999, 55, 45–54. [Google Scholar] [CrossRef]
- Yakel, H.L.; Brynestad, J. Refinement of the crystal structure of orthorhombic zinc chloride. Inorg. Chem. 1978, 17, 3294–3296. [Google Scholar] [CrossRef]
- Emel’yanenko, V.N.; Kabo, G.J.; Verevkin, S.P. Measurement and Prediction of Thermochemical Properties: Improved Increments for the Estimation of Enthalpies of Sublimation and Standard Enthalpies of Formation of Alkyl Derivatives of Urea. J. Chem. Eng. Data 2006, 51, 79–87. [Google Scholar] [CrossRef]
- Haynes, W.M. (Ed.) CRC Handbook of Chemistry and Physics, 95th ed.; CRC Press: Boca Raton, FL, USA, 2014. [Google Scholar]
- McCreary, J.R.; Thorn, R.J. Enthalpy of Sublimation of Zinc and Cadmium; Correlation of ΔH∘ vs. ΔS∘; Comparison of Torsional and Knudsen Vapor Pressures. J. Chem. Phys. 1969, 50, 3725–3733. [Google Scholar]
- Timón, V.; Maté, B.; Herrero, V.J.; Tanarro, I. Infrared spectra of amorphous and crystalline urea ices. Phys. Chem. Chem. Phys. 2021, 23, 22344–22351. [Google Scholar] [CrossRef] [PubMed]
- Angell, C.; Wegdam, G.; van der Elsken, J. FIR spectra of liquid, glass and crystalline states of ZnCl2: Order and temperature effects on band shape. Spectrochim. Acta A 1974, 30, 665–672. [Google Scholar] [CrossRef]


| Parameter | Experiment [40] | PBE (This Work) |
|---|---|---|
| a/Å | 6.275 | 6.161 |
| b/Å | 6.835 | 6.756 |
| c/Å | 11.862 | 11.913 |
| /° | 79.19 | 79.91 |
| /° | 72.31 | 72.04 |
| /° | 67.21 | 67.19 |
| V/Å3 | 445.444 | 433.903 |
| d/kg·m−3 | 1911.6 | 1962.5 |
| r(Zn···Cl(1))/Å | 2.218 | 2.231 |
| r(Zn···Cl(2))/Å | 2.238 | 2.250 |
| r(Zn···O(1))/Å | 1.947 | 1.964 |
| r(Zn···O(2))/Å | 1.986 | 2.012 |
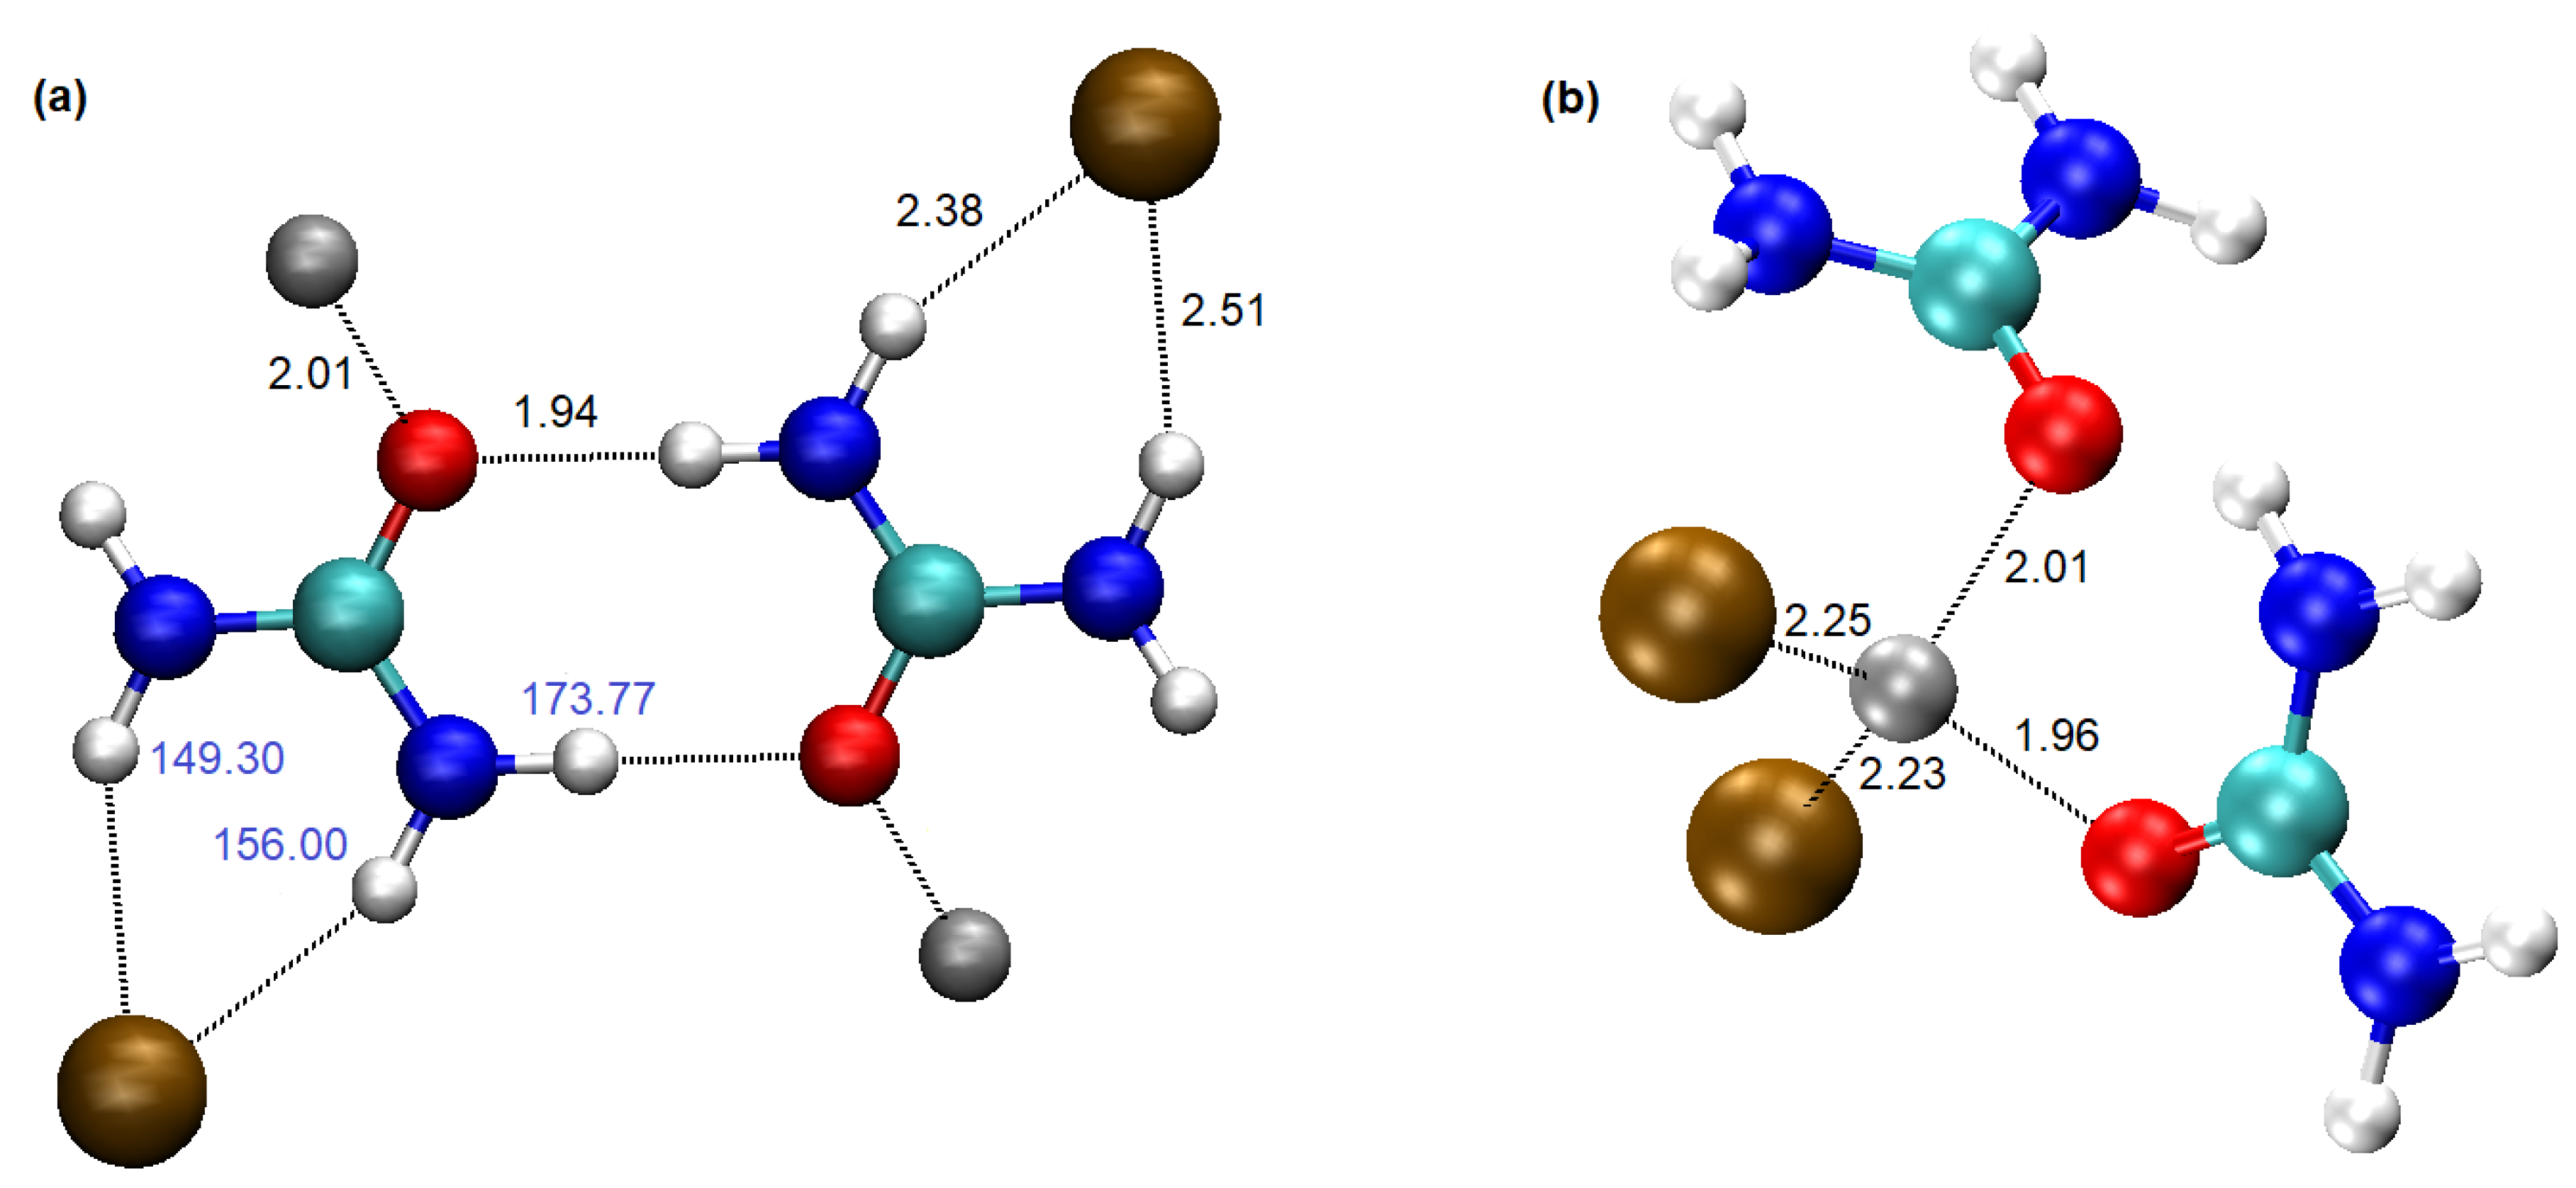
| Interaction | H···X Distance/Å | Electron Density/Å−3 | Energy/kJ·mol−1 |
|---|---|---|---|
| O···H | 1.94 | 3.45 × 10⁻² | −27.0 |
| Cl···H(1) | 2.38 | 2.23 × 10⁻² | −35.5 |
| Cl···H(2) | 2.51 | 1.76 × 10⁻² | −29.0 |
| Atom | ZnCl2·2CO(NH2)2 | ZnCl2 | CO(NH2)2 |
|---|---|---|---|
| Zn | 1.337 | 0.974 | |
| Cl(1) | −0.547 | −0.487 | |
| Cl(2) | −0.542 | −0.487 | |
| O(1) | −0.678 | −0.633 | |
| O(2) | −0.672 | −0.633 | |
| C(1) | 0.616 | 0.706 | |
| C(2) | 0.613 | 0.706 | |
| N(1.1) | −0.777 | −0.941 | |
| N(1.2) | −0.756 | −0.941 | |
| N(2.1) | −0.785 | −0.941 | |
| N(2.2) | −0.761 | −0.941 |
Disclaimer/Publisher’s Note: The statements, opinions and data contained in all publications are solely those of the individual author(s) and contributor(s) and not of MDPI and/or the editor(s). MDPI and/or the editor(s) disclaim responsibility for any injury to people or property resulting from any ideas, methods, instructions or products referred to in the content. |
© 2024 by the authors. Licensee MDPI, Basel, Switzerland. This article is an open access article distributed under the terms and conditions of the Creative Commons Attribution (CC BY) license (https://creativecommons.org/licenses/by/4.0/).
Share and Cite
Malinowski, A.; Śmiechowski, M. Computational Study of Molecular Interactions in ZnCl2(urea)2 Crystals as Precursors for Deep Eutectic Solvents. Crystals 2024, 14, 641. https://doi.org/10.3390/cryst14070641
Malinowski A, Śmiechowski M. Computational Study of Molecular Interactions in ZnCl2(urea)2 Crystals as Precursors for Deep Eutectic Solvents. Crystals. 2024; 14(7):641. https://doi.org/10.3390/cryst14070641
Chicago/Turabian StyleMalinowski, Adrian, and Maciej Śmiechowski. 2024. "Computational Study of Molecular Interactions in ZnCl2(urea)2 Crystals as Precursors for Deep Eutectic Solvents" Crystals 14, no. 7: 641. https://doi.org/10.3390/cryst14070641
APA StyleMalinowski, A., & Śmiechowski, M. (2024). Computational Study of Molecular Interactions in ZnCl2(urea)2 Crystals as Precursors for Deep Eutectic Solvents. Crystals, 14(7), 641. https://doi.org/10.3390/cryst14070641