
Thermal Behavior of Clinoptilolite

 , , , and
Abstract
:1. Introduction
2. Materials and Methods
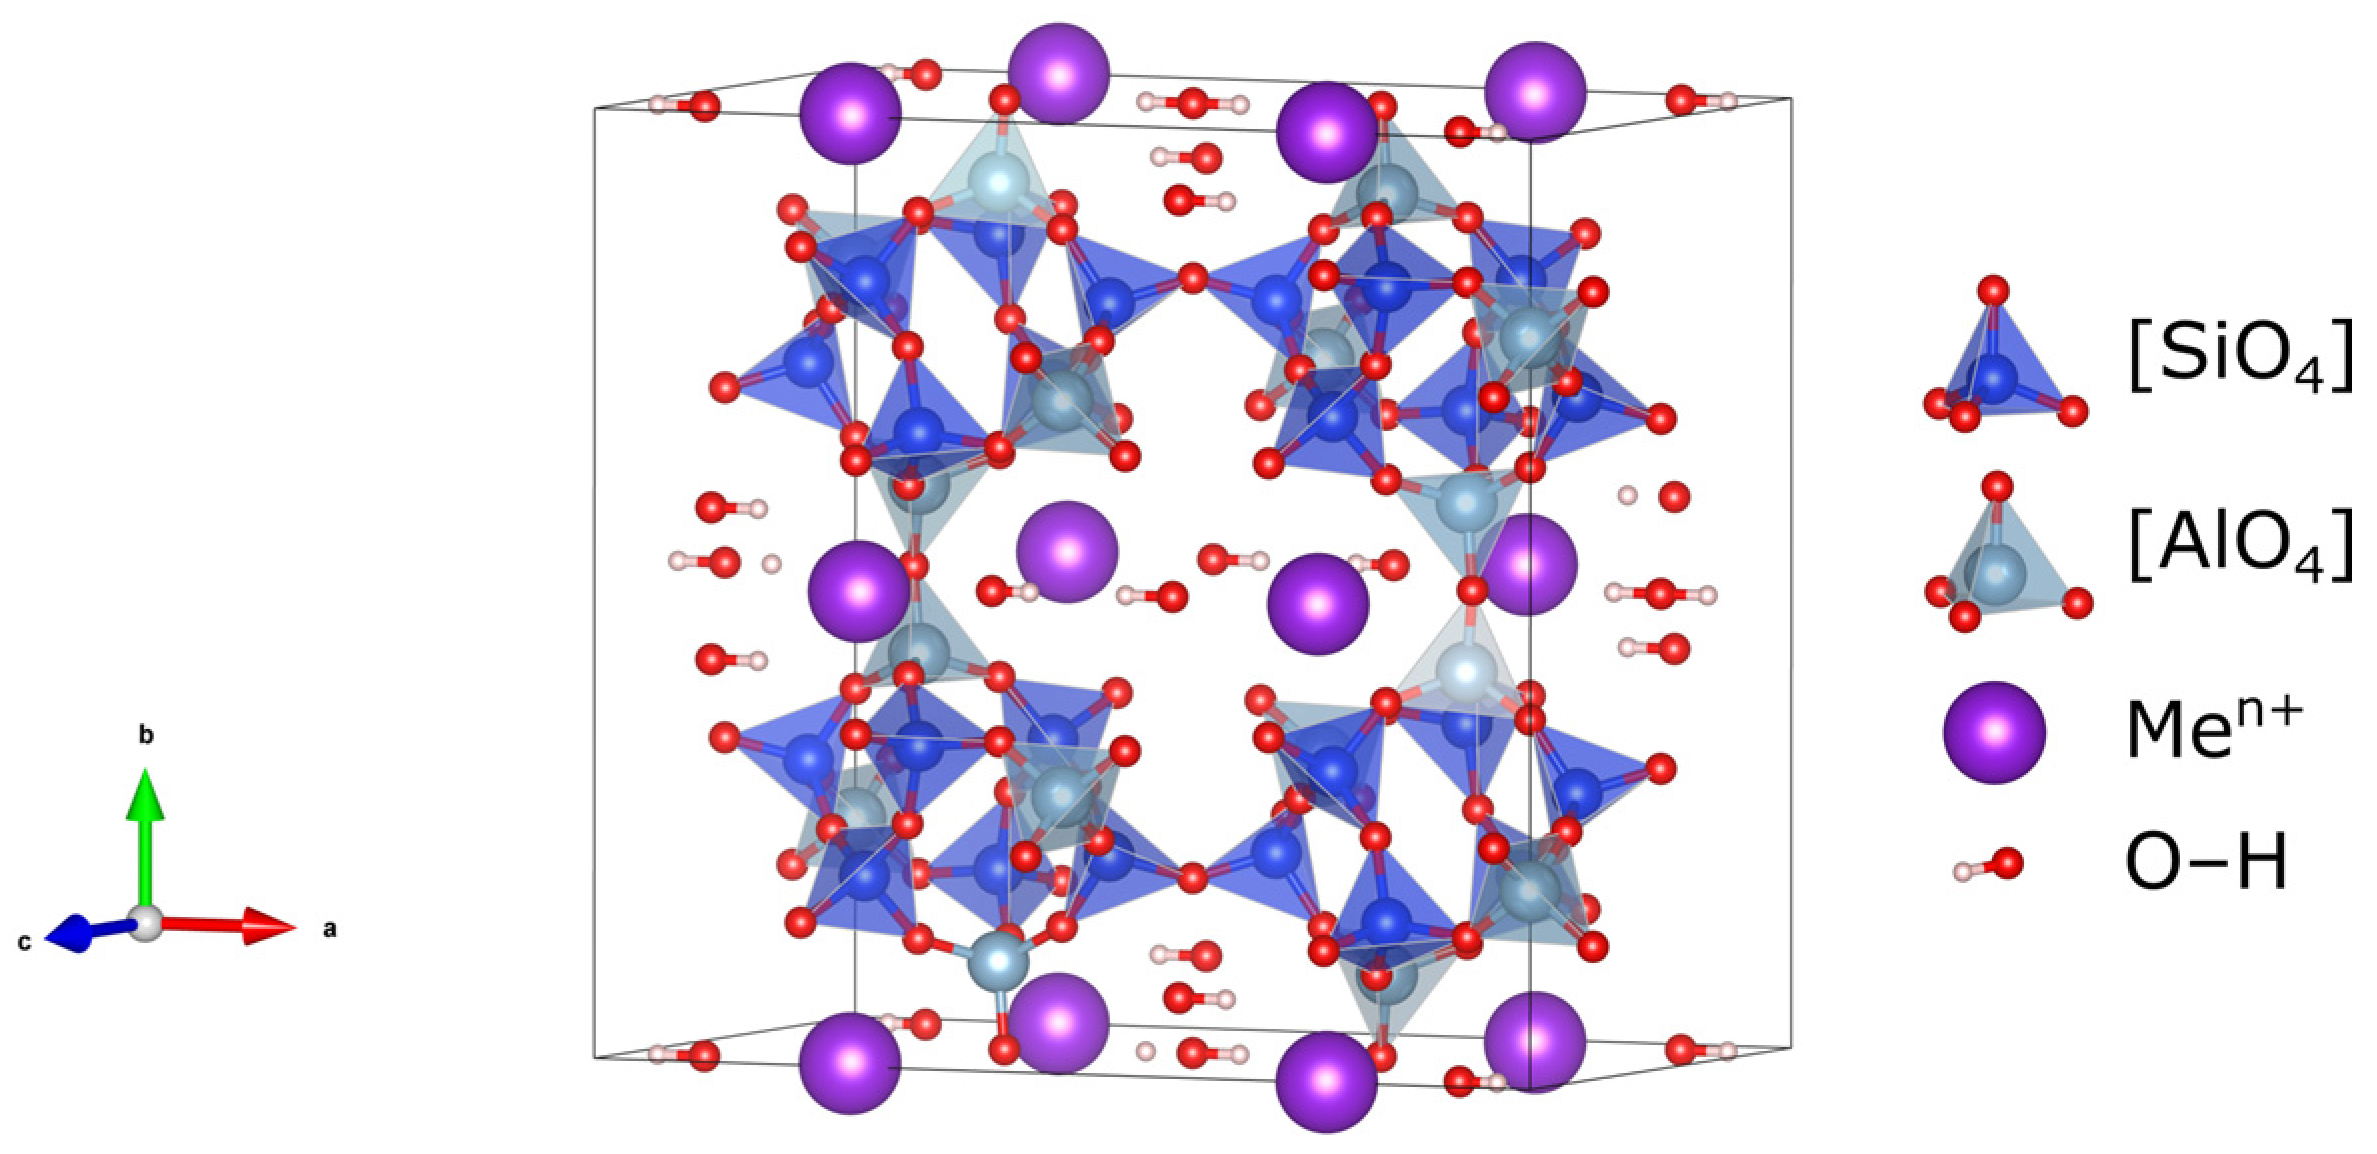
2.1. Starting Material—Natural Clinoptilolite
2.2. Instrumentation
3. Results and Discussion
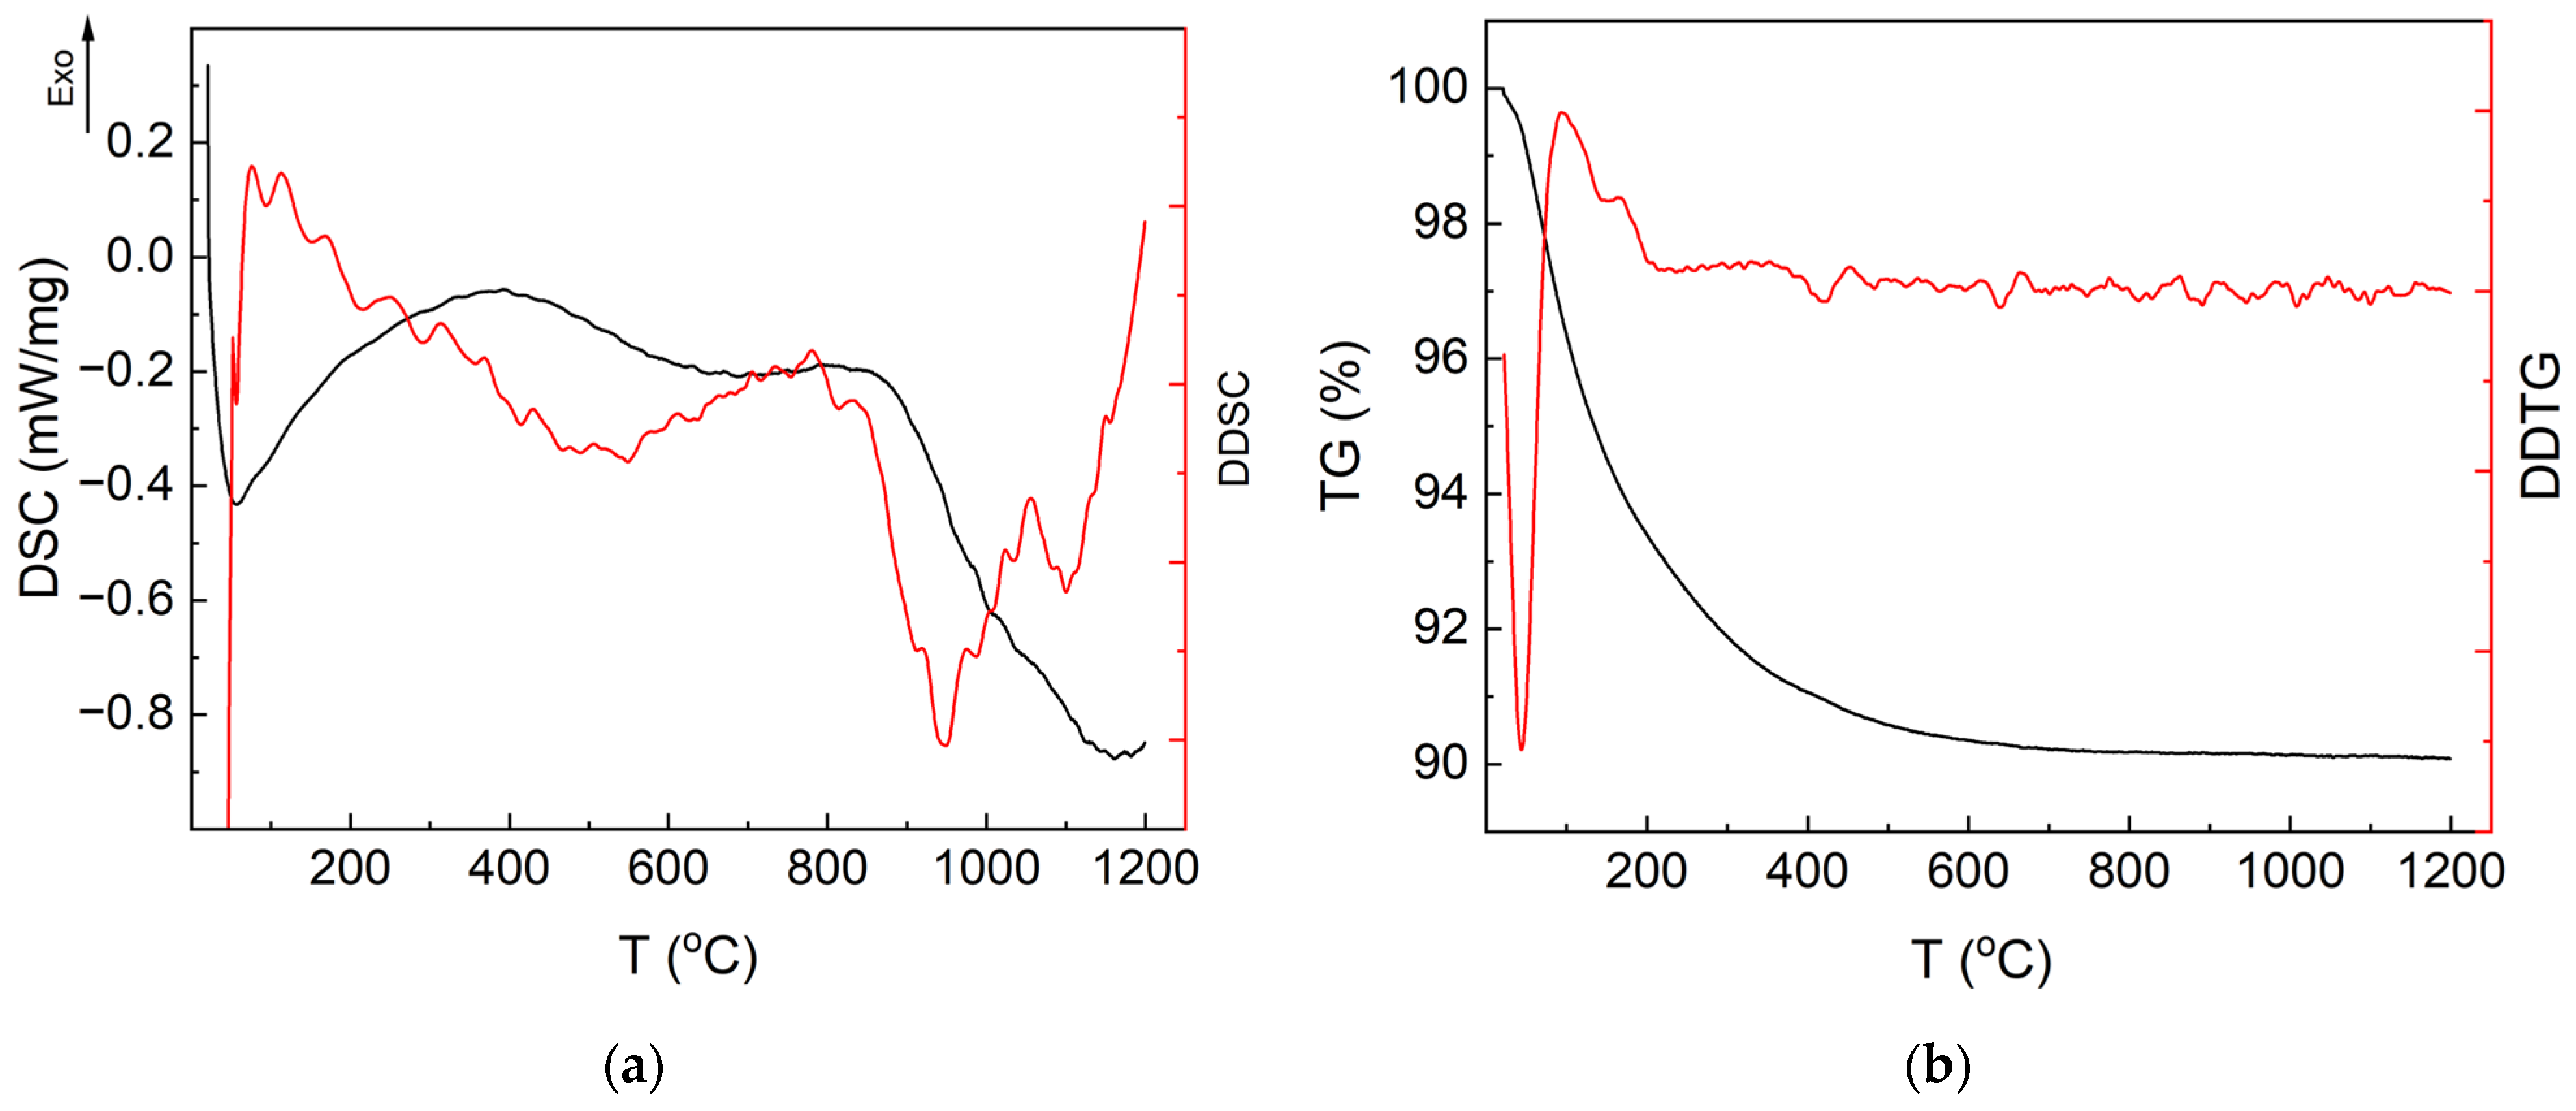
3.1. Thermal Analysis
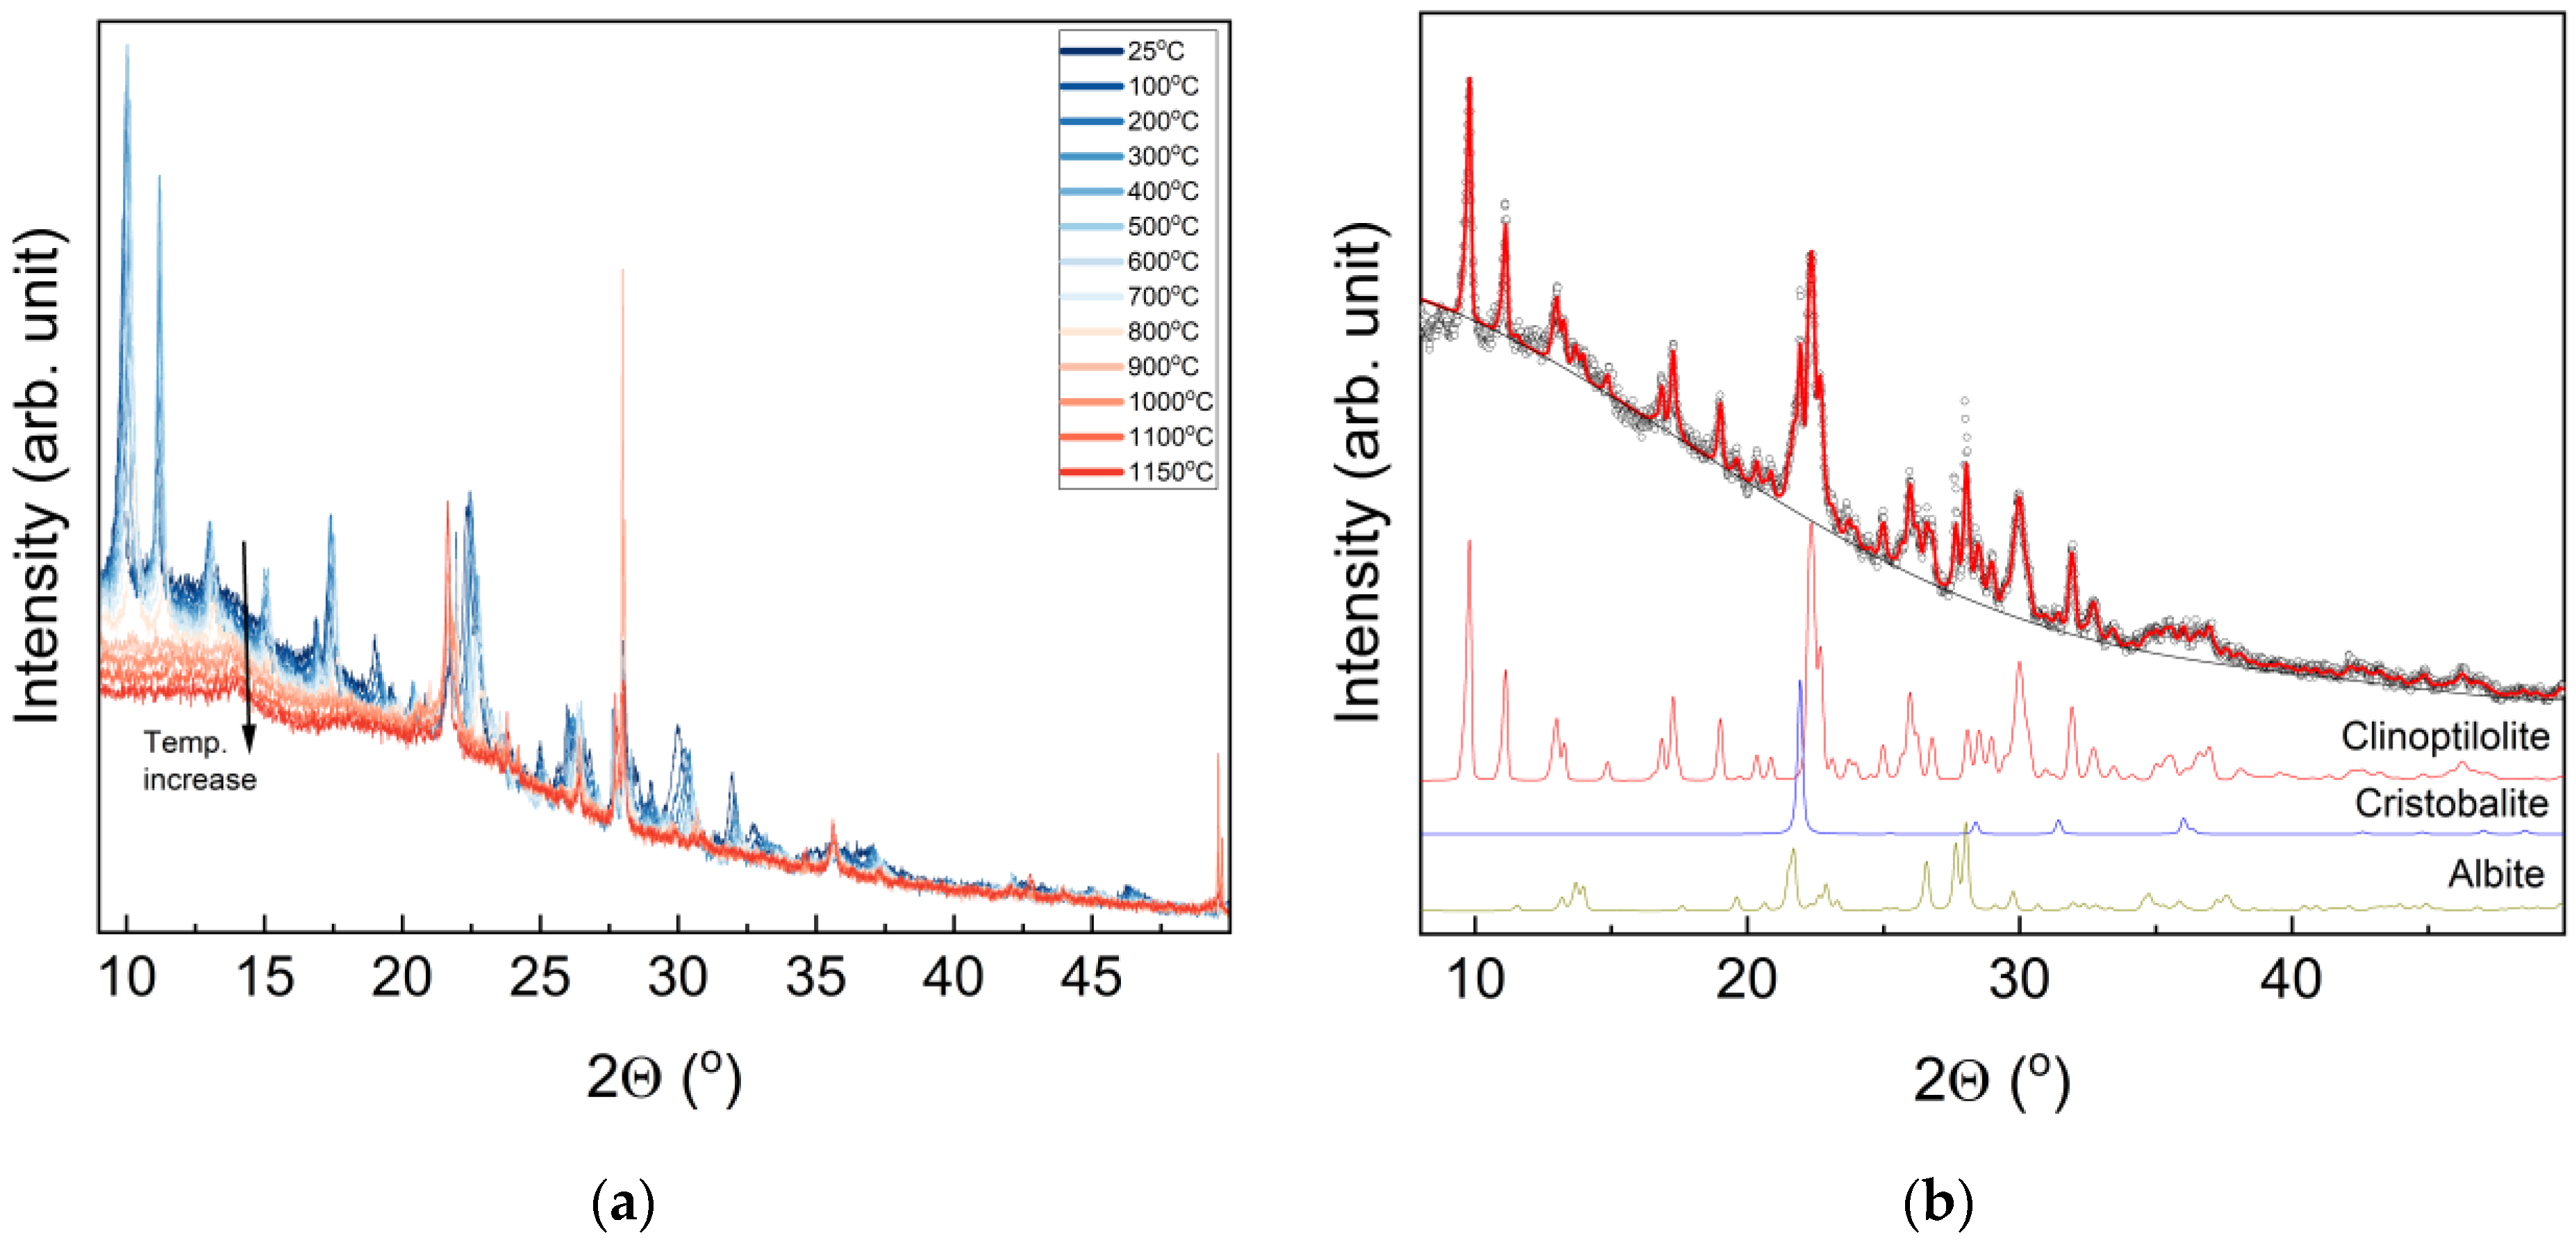
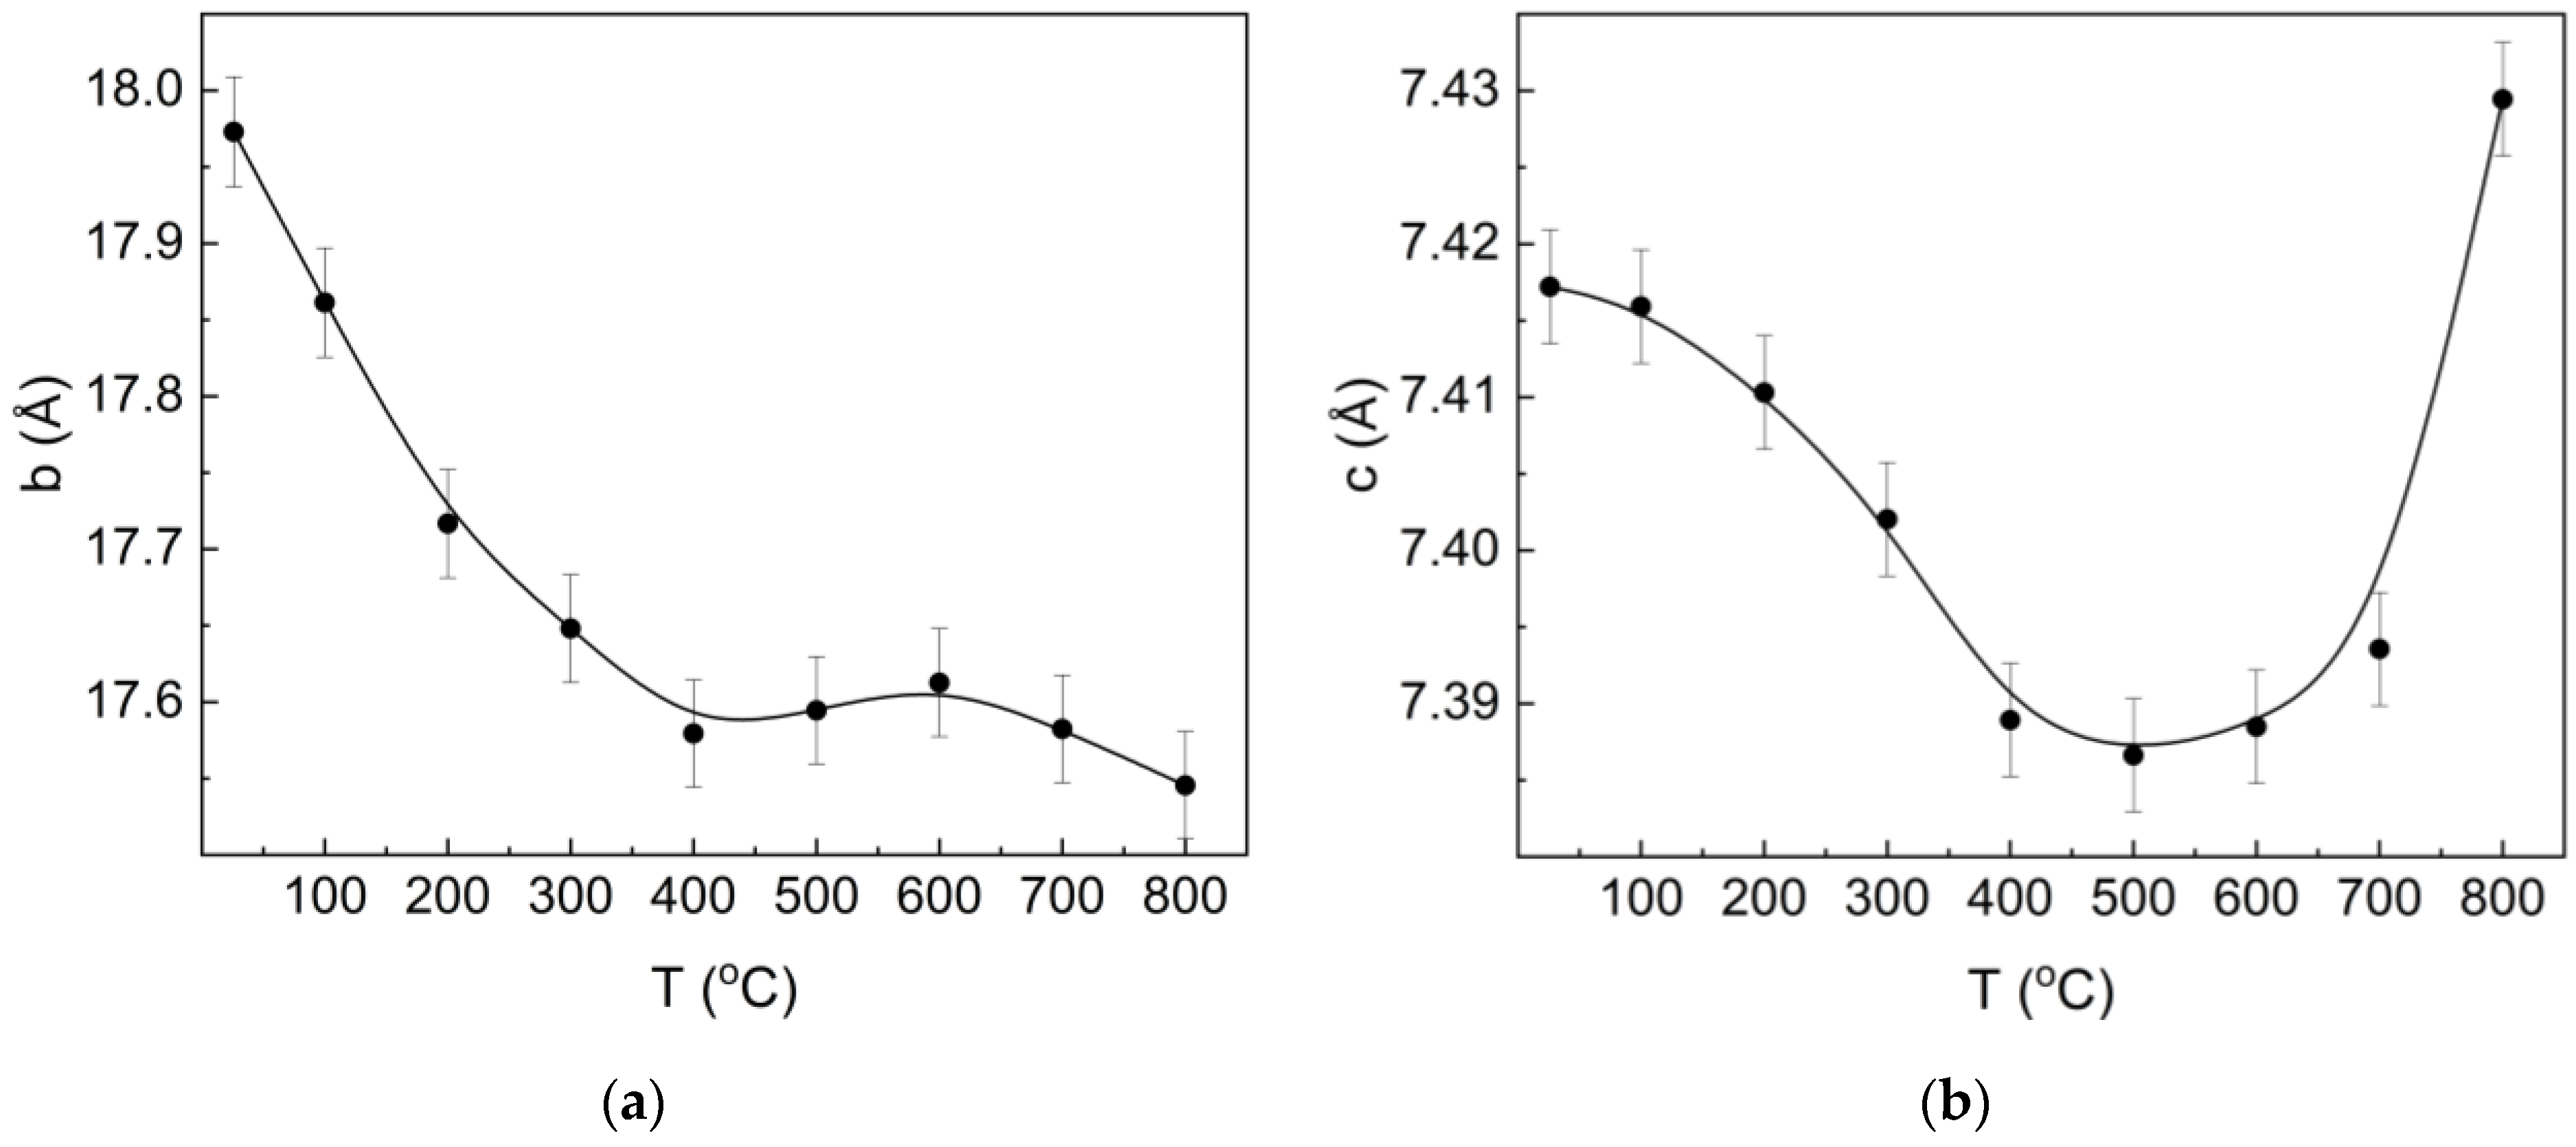
3.2. XRD Studies
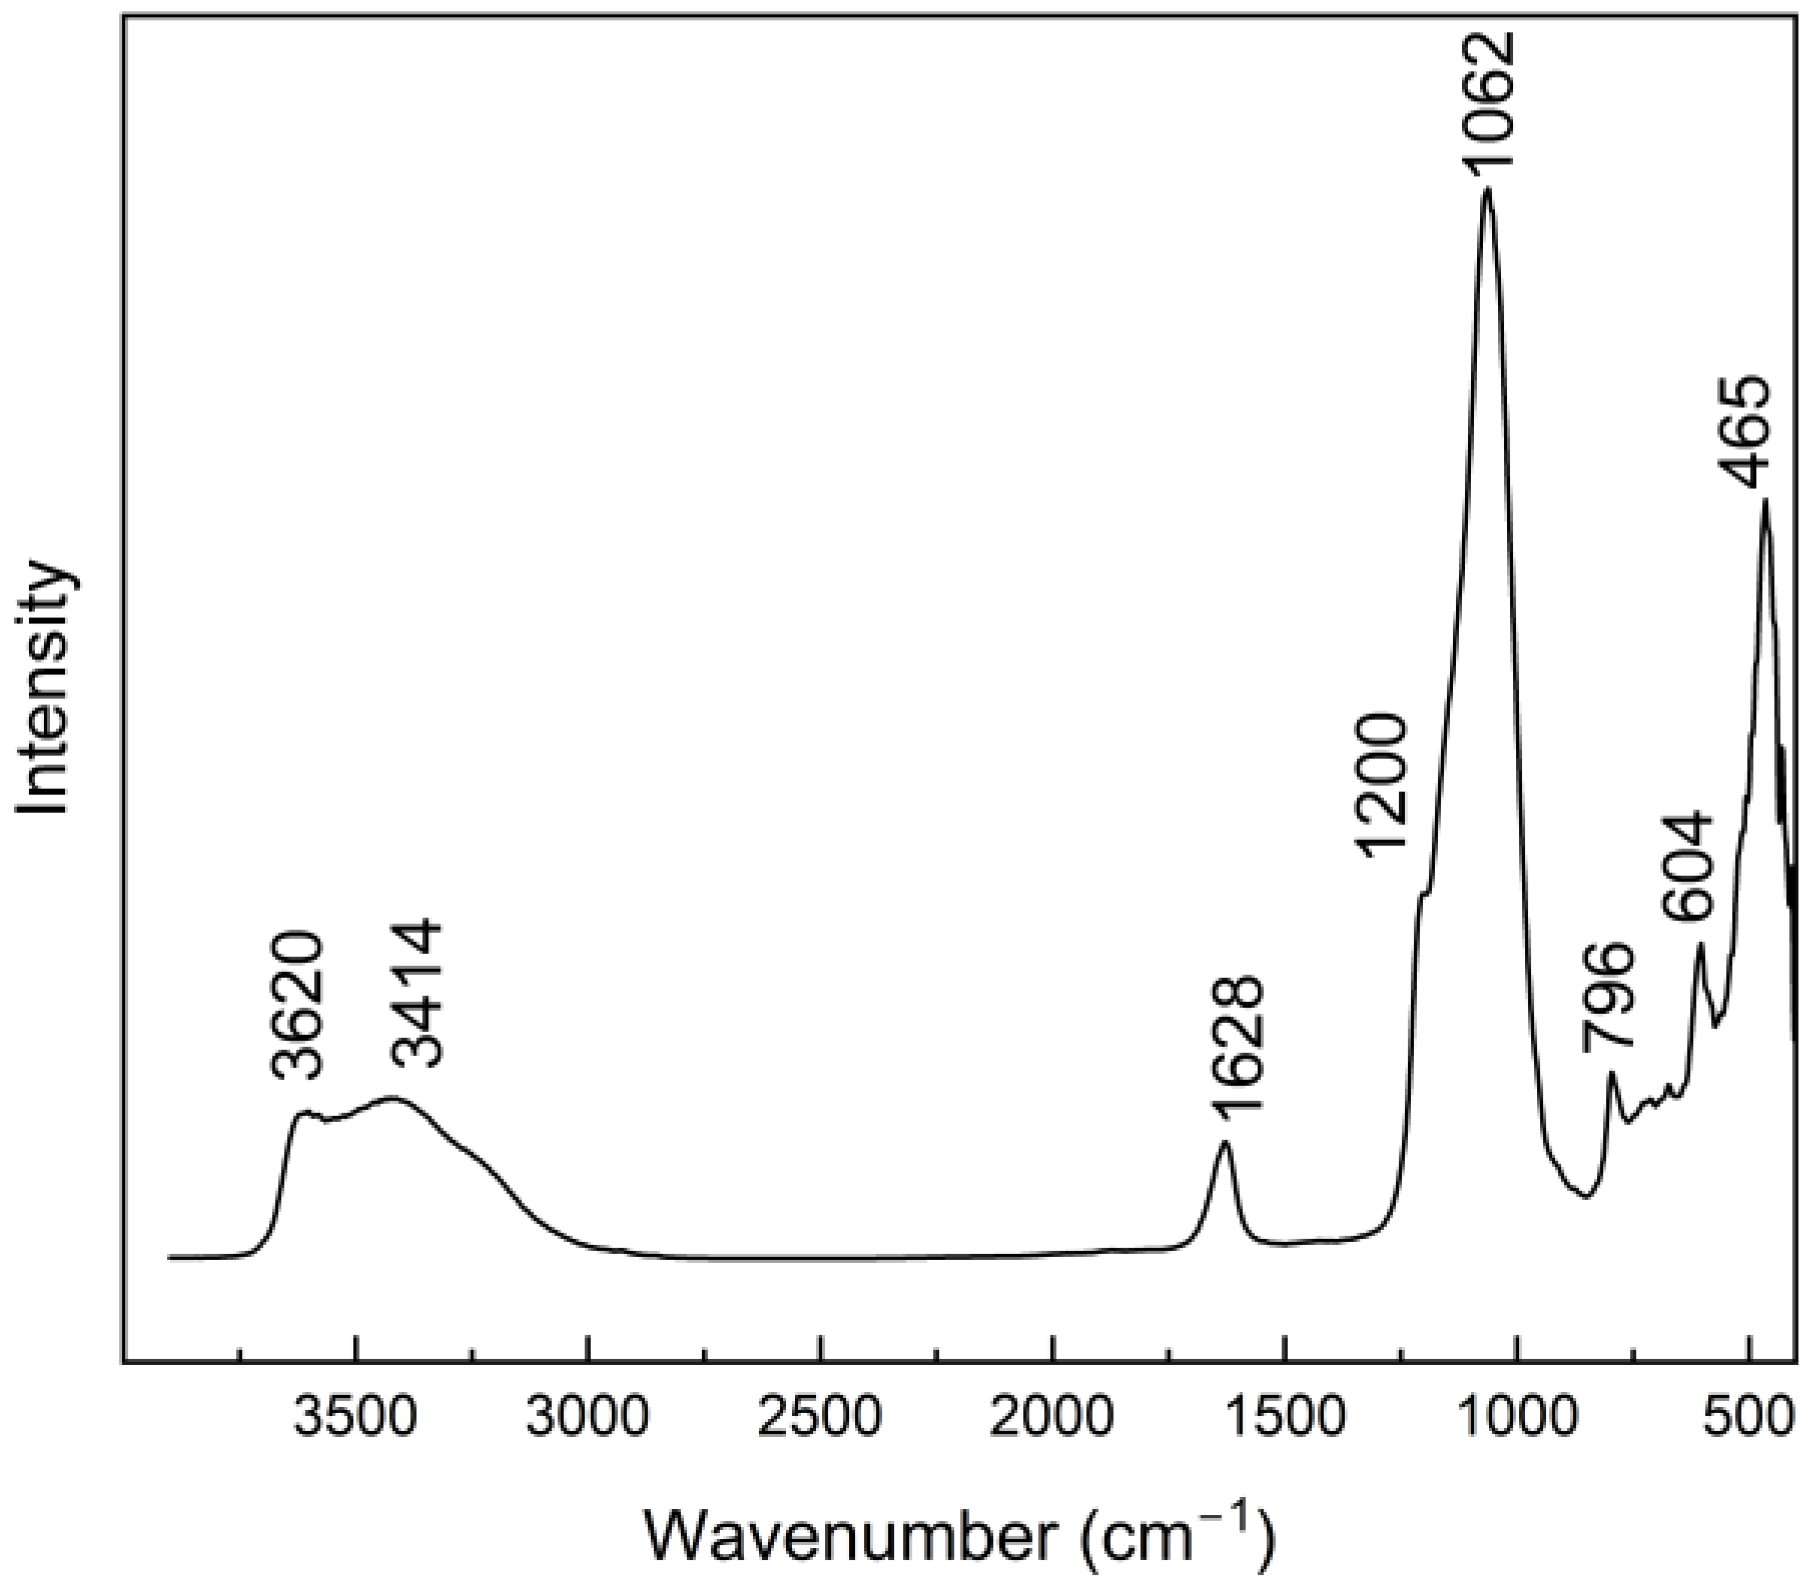
3.3. IR Studies
4. Conclusions
Author Contributions
Funding
Institutional Review Board Statement
Informed Consent Statement
Data Availability Statement
Conflicts of Interest
References
- Alberti, A. The crystal structure of two clinoptilolites. Tschermaks Mineral. Petrogr. Mitteilungen 1975, 22, 25–37. [Google Scholar] [CrossRef]
- Cerri, G.; Farina, M.; Brundu, A.; Dakovic, A.; Giunchedi, P.; Gavini, E.; Rassu, G. Natural zeolites for pharmaceutical formulations: Preparation and evaluation of a clinoptilolite-based material. Microporous Mesoporous Mater. 2016, 223, 58–67. [Google Scholar] [CrossRef]
- Momma, K.; Izumi, F. VESTA 3 for three-dimensional visualization of crystal, volumetric and morphology data. J. Appl. Cryst. 2011, 44, 1272–1276. [Google Scholar] [CrossRef]
- Grifasi, N.; Ziantoni, B.; Fino, D.; Piumetti, M. Fundamental properties and sustainable applications of the natural zeolite clinoptilolite. Environ. Sci. Pollut. Res. 2024. [Google Scholar] [CrossRef]
- de Souza, V.; Villarroel-Rocha, J.; de Araújo, M.; Sapag, K.; Pergher, S. Basic treatment in natural clinoptilolite for improvement of physicochemical properties. Minerals 2018, 8, 595. [Google Scholar] [CrossRef]
- Alsawalha, M. Overview of current and future perspectives of Saudi Arabian natural clinoptilolite zeolite: A Case Review. J. Chem. 2019, 2019, 153471. [Google Scholar] [CrossRef]
- Lihareva, N.; Petrov, O.; Dimowa, L.; Tzvetanova, Y.; Piroeva, I.; Ublekov, F.; Nikolov, A. Ion exchange of Cs+ and Sr2+ by natural clinoptilolite from bi-cationic solutions and XRD control of their structural positioning. J. Rad. Nuc. Chem. 2020, 323, 1093–1102. [Google Scholar] [CrossRef]
- Kowalczyk, P.; Sprynskyy, M.; Terzyk, A.P.; Lebedynets, M.; Namieśnik, J.; Buszewski, B. Porous structure of natural and modified clinoptilolites. J. Colloid Interface Sci. 2006, 297, 77–85. [Google Scholar] [CrossRef] [PubMed]
- Tugsuu, T.; Sugimoto, Y.; Enkhsaruul, B. Preparation of the natural zeolite based catalyst for hydrocracking process of petroleum derived atmospheric residue. J. Chem. Eng. Mater. Sci. 2017, 5, 14–22. [Google Scholar] [CrossRef]
- Sobuś, N.; Król, M.; Piotrowski, M.; Michorczyk, B.; Czekaj, I.; Kornaus, K.; Trenczek-Zając, A.; Komarek, S. Conversion of dihydroxyacetone to carboxylic acids on pretreated clinoptilolite modified with iron, copper, and cobalt. Catal. Commun. 2022, 171, 106509. [Google Scholar] [CrossRef]
- Grzeszczak, J.; Wróblewska, A.; Kiełbasa, K.; Koren, Z.C.; Michalkiewicz, B. The Application of clinoptilolite as the green catalyst in the solvent-free oxidation of α-pinene with oxygen. Sustainability 2023, 15, 10381. [Google Scholar] [CrossRef]
- Faghihian, H.; Vadafar, M.; Tavakoli, T. Desulfurization of gas oil by modified clinoptilolite. Iran. J. Chem. Chem. Eng. 2007, 26, 19–25. [Google Scholar] [CrossRef]
- Pereira, J.L.S.; Ferreira, S.; Pinheiro, V.; Trindade, H. Ammonia and greenhouse gas emissions following the application of clinoptilolite on the litter of a breeding hen house. Environ. Sci. Pollut. Res. 2019, 26, 8352–8357. [Google Scholar] [CrossRef] [PubMed]
- Kraljević Pavelić, S.; Simović Medica, J.; Gumbarević, D.; Filošević, A.; Pržulj, N.; Pavelić, K. Critical review on zeolite clinoptilolite safety and medical applications in vivo. Front. Pharmacol. 2018, 9, 1350. [Google Scholar] [CrossRef] [PubMed]
- Ibrahim, J.E.F.M.; Kurovics, E.; Tihtih, M.; Gömze, L.A. Ceramic bricks with enhanced thermal insulation produced from natural zeolite. Pollack Period. 2021, 16, 101–107. [Google Scholar] [CrossRef]
- Jolliffe, I.T.; Cadima, J. Principal component analysis: A review and recent developments. Philos. Trans. R. Soc. A Math. Phys. Eng. Sci. 2016, 374, 20150202. [Google Scholar] [CrossRef] [PubMed]
- Cocchi, M. Data Fusion Methodology and Applications, 1st ed.; Elsevier: Amsterdam, The Netherlands, 2019. [Google Scholar]
- Akdeniz, Y.; Ülkü, S. Thermal stability of Ag-exchanged clinoptilolite rich mineral. J. Therm. Anal. Calorim. 2008, 94, 703–710. [Google Scholar] [CrossRef]
- Zendelska, A.; Golomeova, M.; Jakupi, Š.; Lisičkov, K.; Kuvendžiev, S.; Marinkovski, M. Characterization and application of clinoptilolite for removal of heavy metal ions from water resources. Geol. Maced. 2018, 32, 21–32. [Google Scholar]
- Pabiś-Mazgaj, E.; Gawenda, T.; Pichniarczyk, P.; Stempkowska, A. Mineral Composition and Structural Characterization of the Clinoptilolite Powders Obtained from Zeolite-Rich Tuffs. Minerals 2021, 11, 1030. [Google Scholar] [CrossRef]
- Kukobat, R.; Škrbić, R.; Massiani, P.; Baghdad, K.; Launay, F.; Sarno, M.; Cirillo, C.; Senatore, A.; Salčin, E.; Gotovac Atlagić, S. Thermal and structural stability of microporous natural clinoptilolite zeolite. Microporous Mesoporous Mater. 2022, 341, 112101. [Google Scholar] [CrossRef]
- Armbruster, T. Dehydration mechanism of clinoptilolite and heulandite: Single-crystal X-ray study of Na-poor Ca-, K-, Mg-rich clinoptilolite at 100 K. Am. Min. 1993, 78, 260–264. [Google Scholar]
- Armbruster, T.; Gunter, M. Stepwise dehydration of heulandite-clinoptilolite from Succor Creelq Oregon, U.S.A.: A single-crystal X-ray study at 100 K. Am. Min. 1991, 76, 1872–1883. [Google Scholar]
- Dimowa, L.T.; Petrov, S.L.; Shivachev, B.L. Natural and Zn exchanged clinoptilolite: In situ high temperature XRD study of structural behavior and cation positions. Bulg. Chem. Comm. 2013, 45, 466–473. [Google Scholar]
- Dimowa, L.T.; Petrov, O.E.; Djourelov, N.I.; Shivachev, B.L. Structural study of Zn-exchanged natural clinoptilolite using powder XRD and positron annihilation data. Clay Miner. 2015, 50, 41–54. [Google Scholar] [CrossRef]
- Beta, I.A.; Böhlig, H.; Hunger, B. Investigation of the non-isothermal water desorption on alkali-metal cation-exchanged X-type zeolites: A temperature-programmed diffuse reaction infrared Fourier transform spectroscopic (TP-DRIFTS) study. Thermochim. Acta 2000, 361, 61–68. [Google Scholar] [CrossRef]
- Katoh, M.; Koide, R.; Yamada, K.; Yoshida, T.; Horikawa, T. IR spectroscopic analysis of thermal behavior of adsorbed water on Y-type zeolite. Int. J. Mod. Phys. Conf. Ser. 2012, 6, 437–442. [Google Scholar] [CrossRef]
- Singh, J.; White, R.L. A variable temperature infrared spectroscopy study of NaA zeolite dehydration. Vib. Spectrosc. 2018, 94, 37–42. [Google Scholar] [CrossRef]
- Jobic, H. Observation of the fundamental bending vibrations of hydroxyl groups in HNa–Y zeolite by neutron inelastic scattering. J. Catal. 1991, 131, 289–293. [Google Scholar] [CrossRef]
- Beck, K.; Pfeifer, H.; Staudte, B. Assignment of novel bands observed in the near infrared spectra of shallow-bed treated H-Y and H-ZSM-5 zeolites. Micropor. Mater. 1993, 2, 1–6. [Google Scholar] [CrossRef]
- Król, M.; Jeleń, P. The effect of heat treatment on the structure of zeolite A. Materials 2021, 14, 4642. [Google Scholar] [CrossRef]

Disclaimer/Publisher’s Note: The statements, opinions and data contained in all publications are solely those of the individual author(s) and contributor(s) and not of MDPI and/or the editor(s). MDPI and/or the editor(s) disclaim responsibility for any injury to people or property resulting from any ideas, methods, instructions or products referred to in the content. |
© 2024 by the authors. Licensee MDPI, Basel, Switzerland. This article is an open access article distributed under the terms and conditions of the Creative Commons Attribution (CC BY) license (https://creativecommons.org/licenses/by/4.0/).
Share and Cite
Król, M.; Dechnik, J.; Szymczak, P.; Handke, B.; Szumera, M.; Stoch, P. Thermal Behavior of Clinoptilolite. Crystals 2024, 14, 646. https://doi.org/10.3390/cryst14070646
Król M, Dechnik J, Szymczak P, Handke B, Szumera M, Stoch P. Thermal Behavior of Clinoptilolite. Crystals. 2024; 14(7):646. https://doi.org/10.3390/cryst14070646
Chicago/Turabian StyleKról, Magdalena, Jakub Dechnik, Patryk Szymczak, Bartosz Handke, Magdalena Szumera, and Paweł Stoch. 2024. "Thermal Behavior of Clinoptilolite" Crystals 14, no. 7: 646. https://doi.org/10.3390/cryst14070646
APA StyleKról, M., Dechnik, J., Szymczak, P., Handke, B., Szumera, M., & Stoch, P. (2024). Thermal Behavior of Clinoptilolite. Crystals, 14(7), 646. https://doi.org/10.3390/cryst14070646