
Synthesis, Characterization, and Analysis of Probenecid and Pyridine Compound Salts

 and
and
Abstract
:1. Introduction
2. Materials and Methods
2.1. Materials
2.2. Screening of Salts
2.3. Synthesis of Salts
2.3.1. Synthesis of (PRO)−(4AMP)+
2.3.2. Synthesis of (PRO)−(4DAP)+
2.4. Characterization
2.4.1. Single Crystal X-ray Diffraction (SCXRD)
2.4.2. Powder X-ray Diffraction (PXRD)
2.4.3. Differential Scanning Calorimetry (DSC)
2.4.4. Thermogravimetric Analysis (TGA)
2.4.5. Fourier Transform Infrared Spectroscopy (FT-IR)
2.4.6. Scanning Electron Microscopy (SEM)
2.4.7. Equilibrium Solubility Measurement
2.4.8. Accelerated Stability Experiment
2.5. Computational Details
2.5.1. Hirshfeld Surface (HS)
2.5.2. Atom in Molecules (AIM) and Independent Gradient Model (IGM)
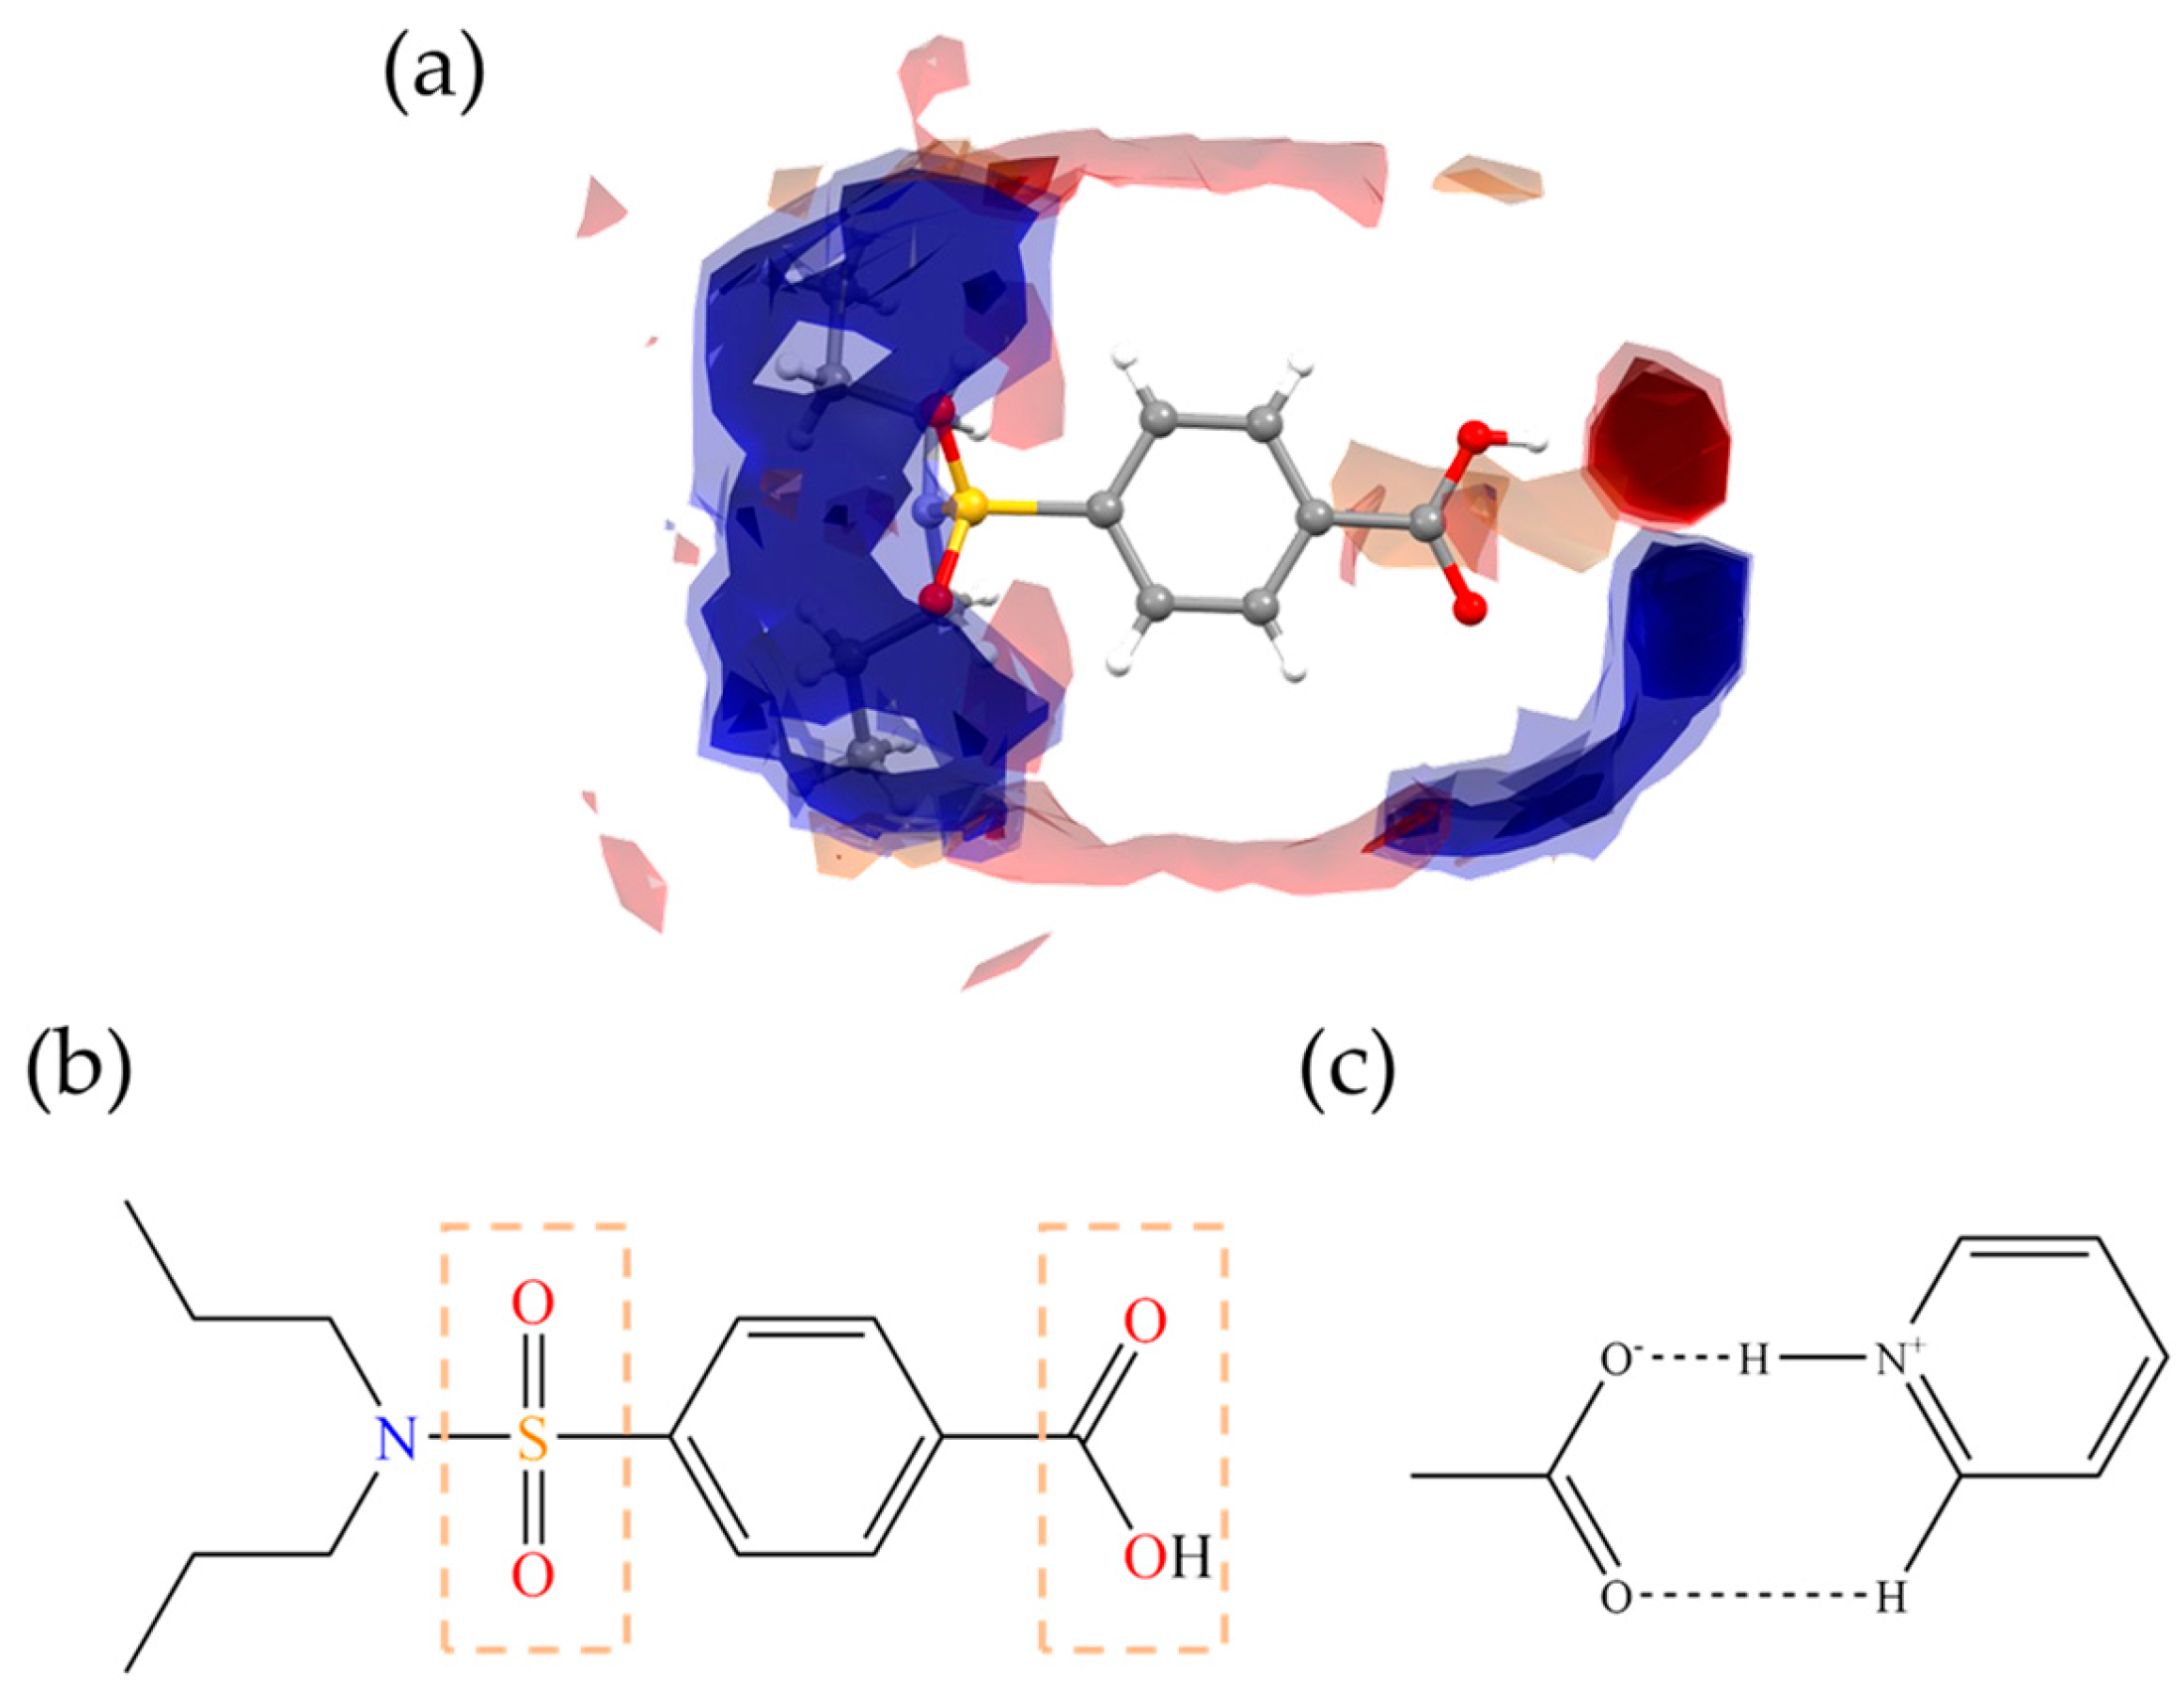
2.5.3. Molecular Electrostatic Potential Surfaces (MEPs)
2.5.4. pKa
2.5.5. Lattice Energy (EL) and Hydration-Free Energy (EHF)
3. Results and Discussion
3.1. Crystal Structure Analysis
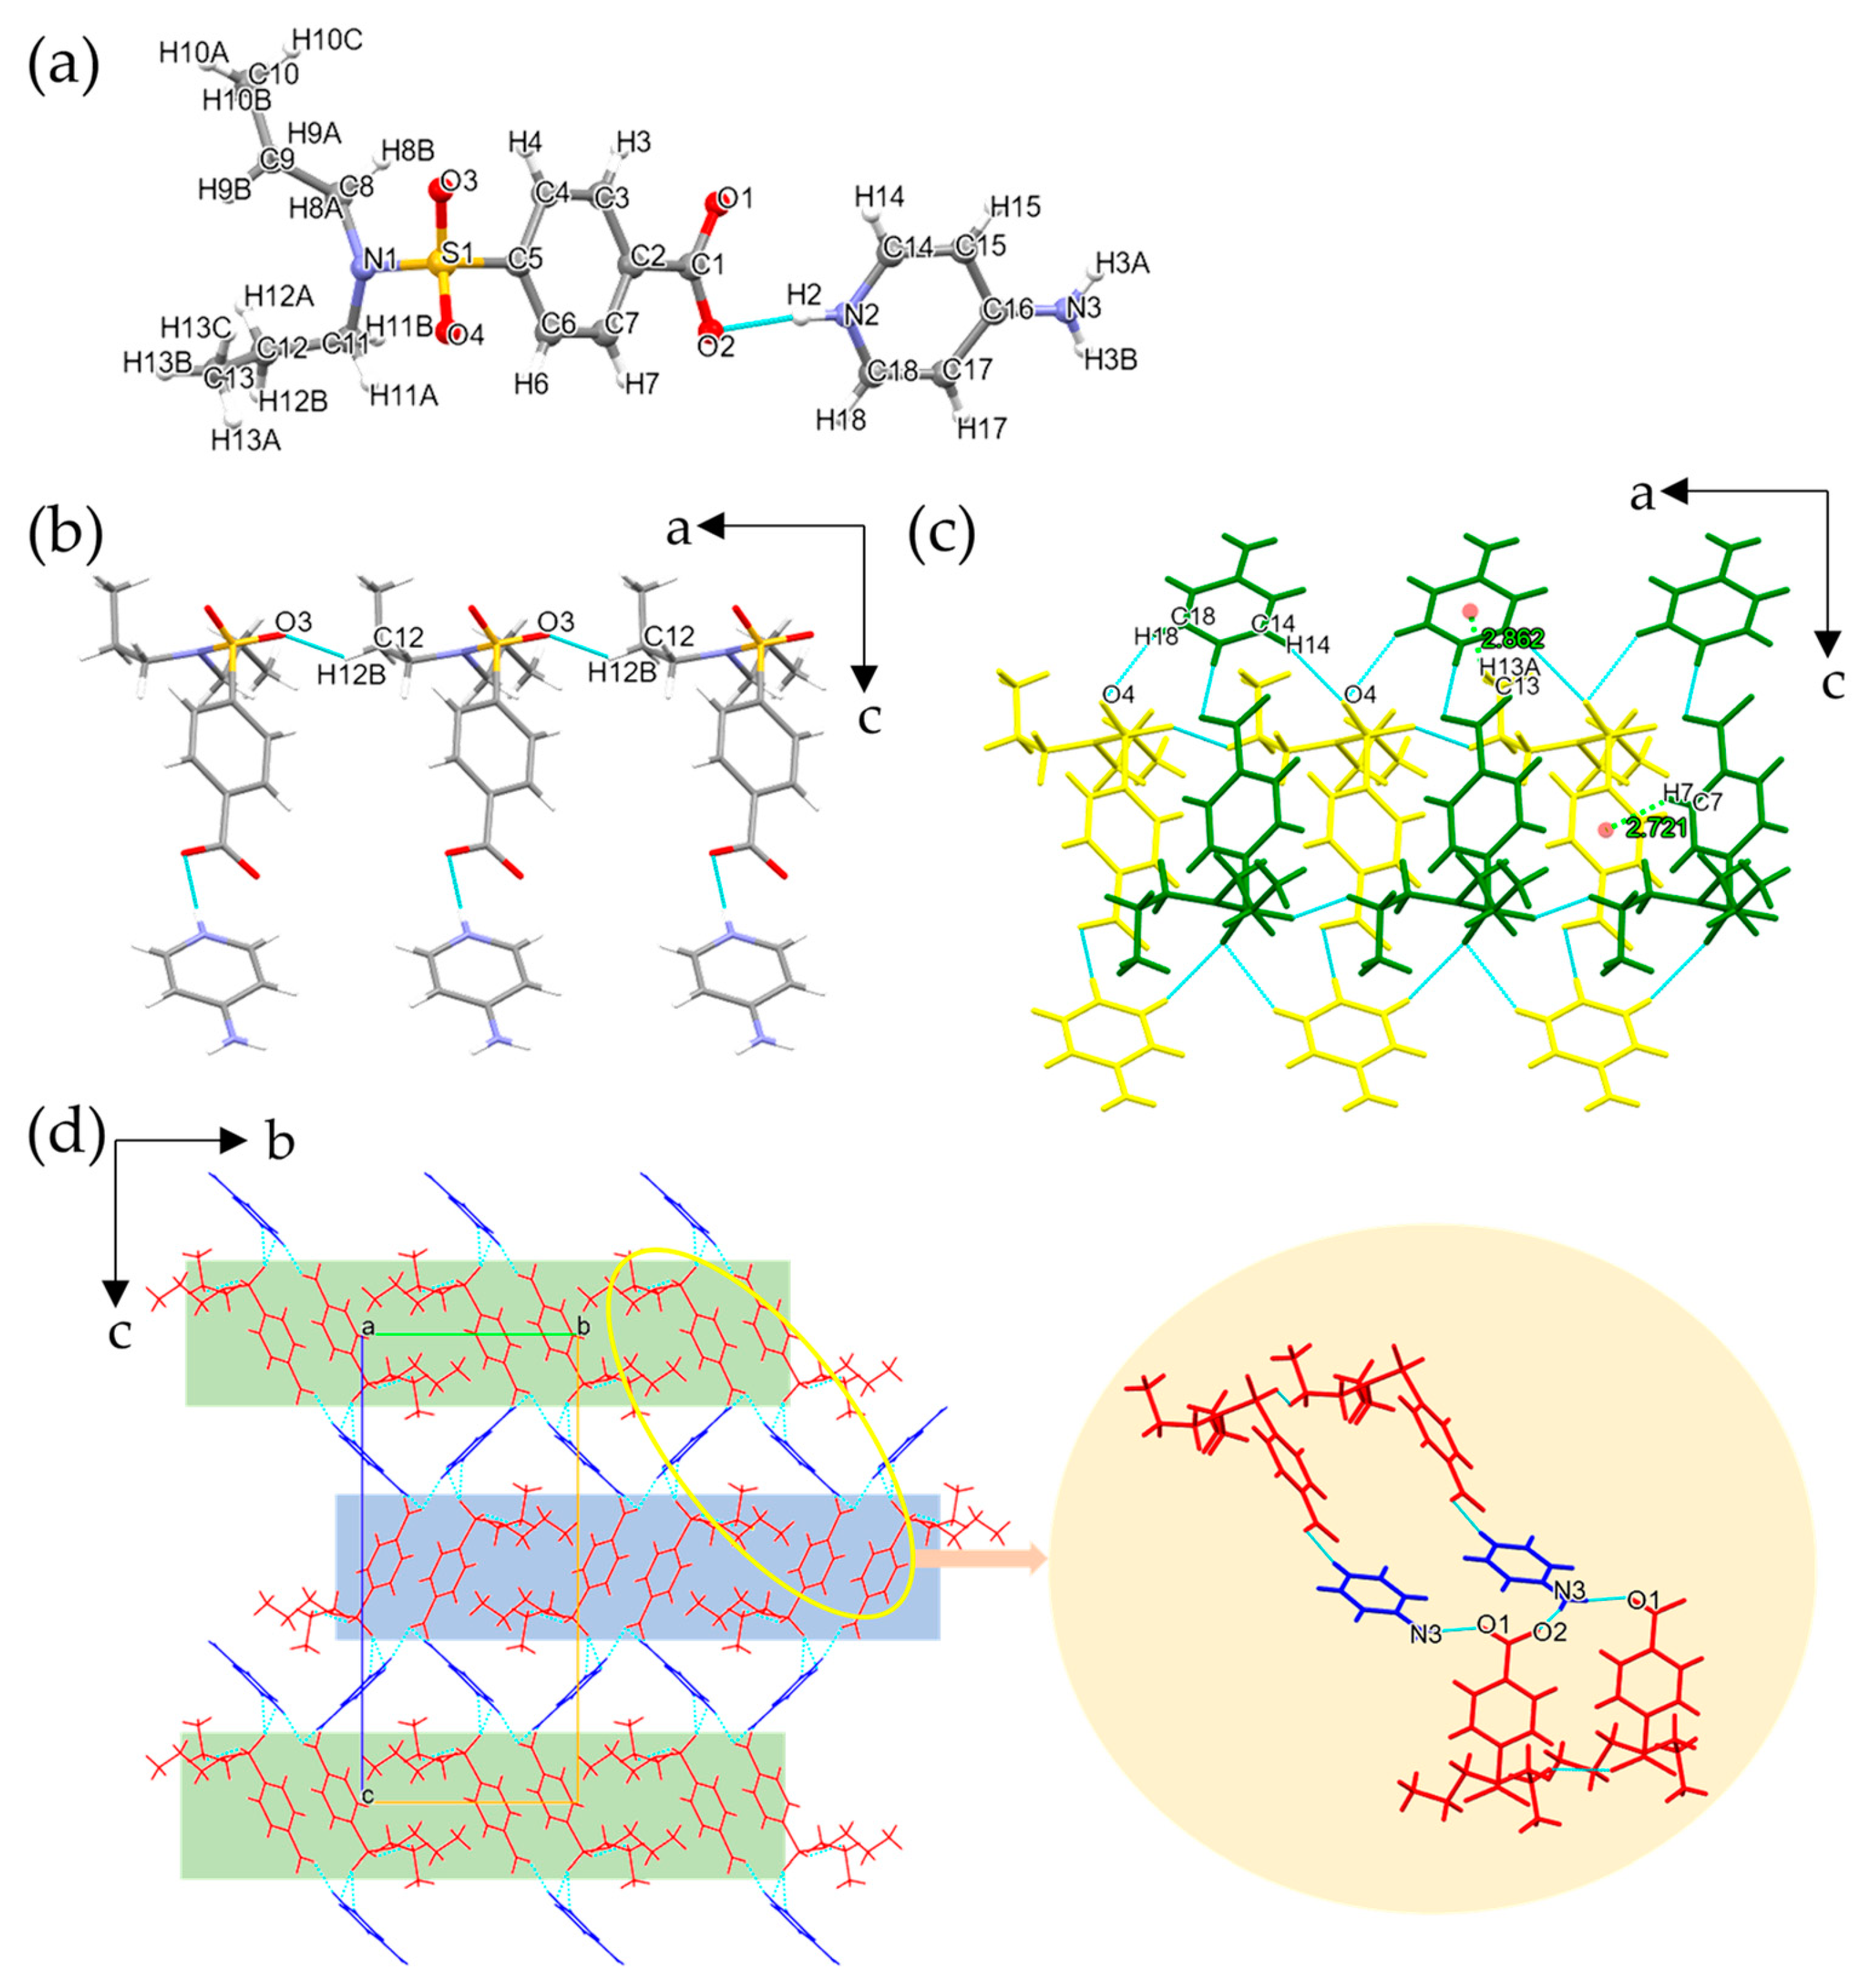
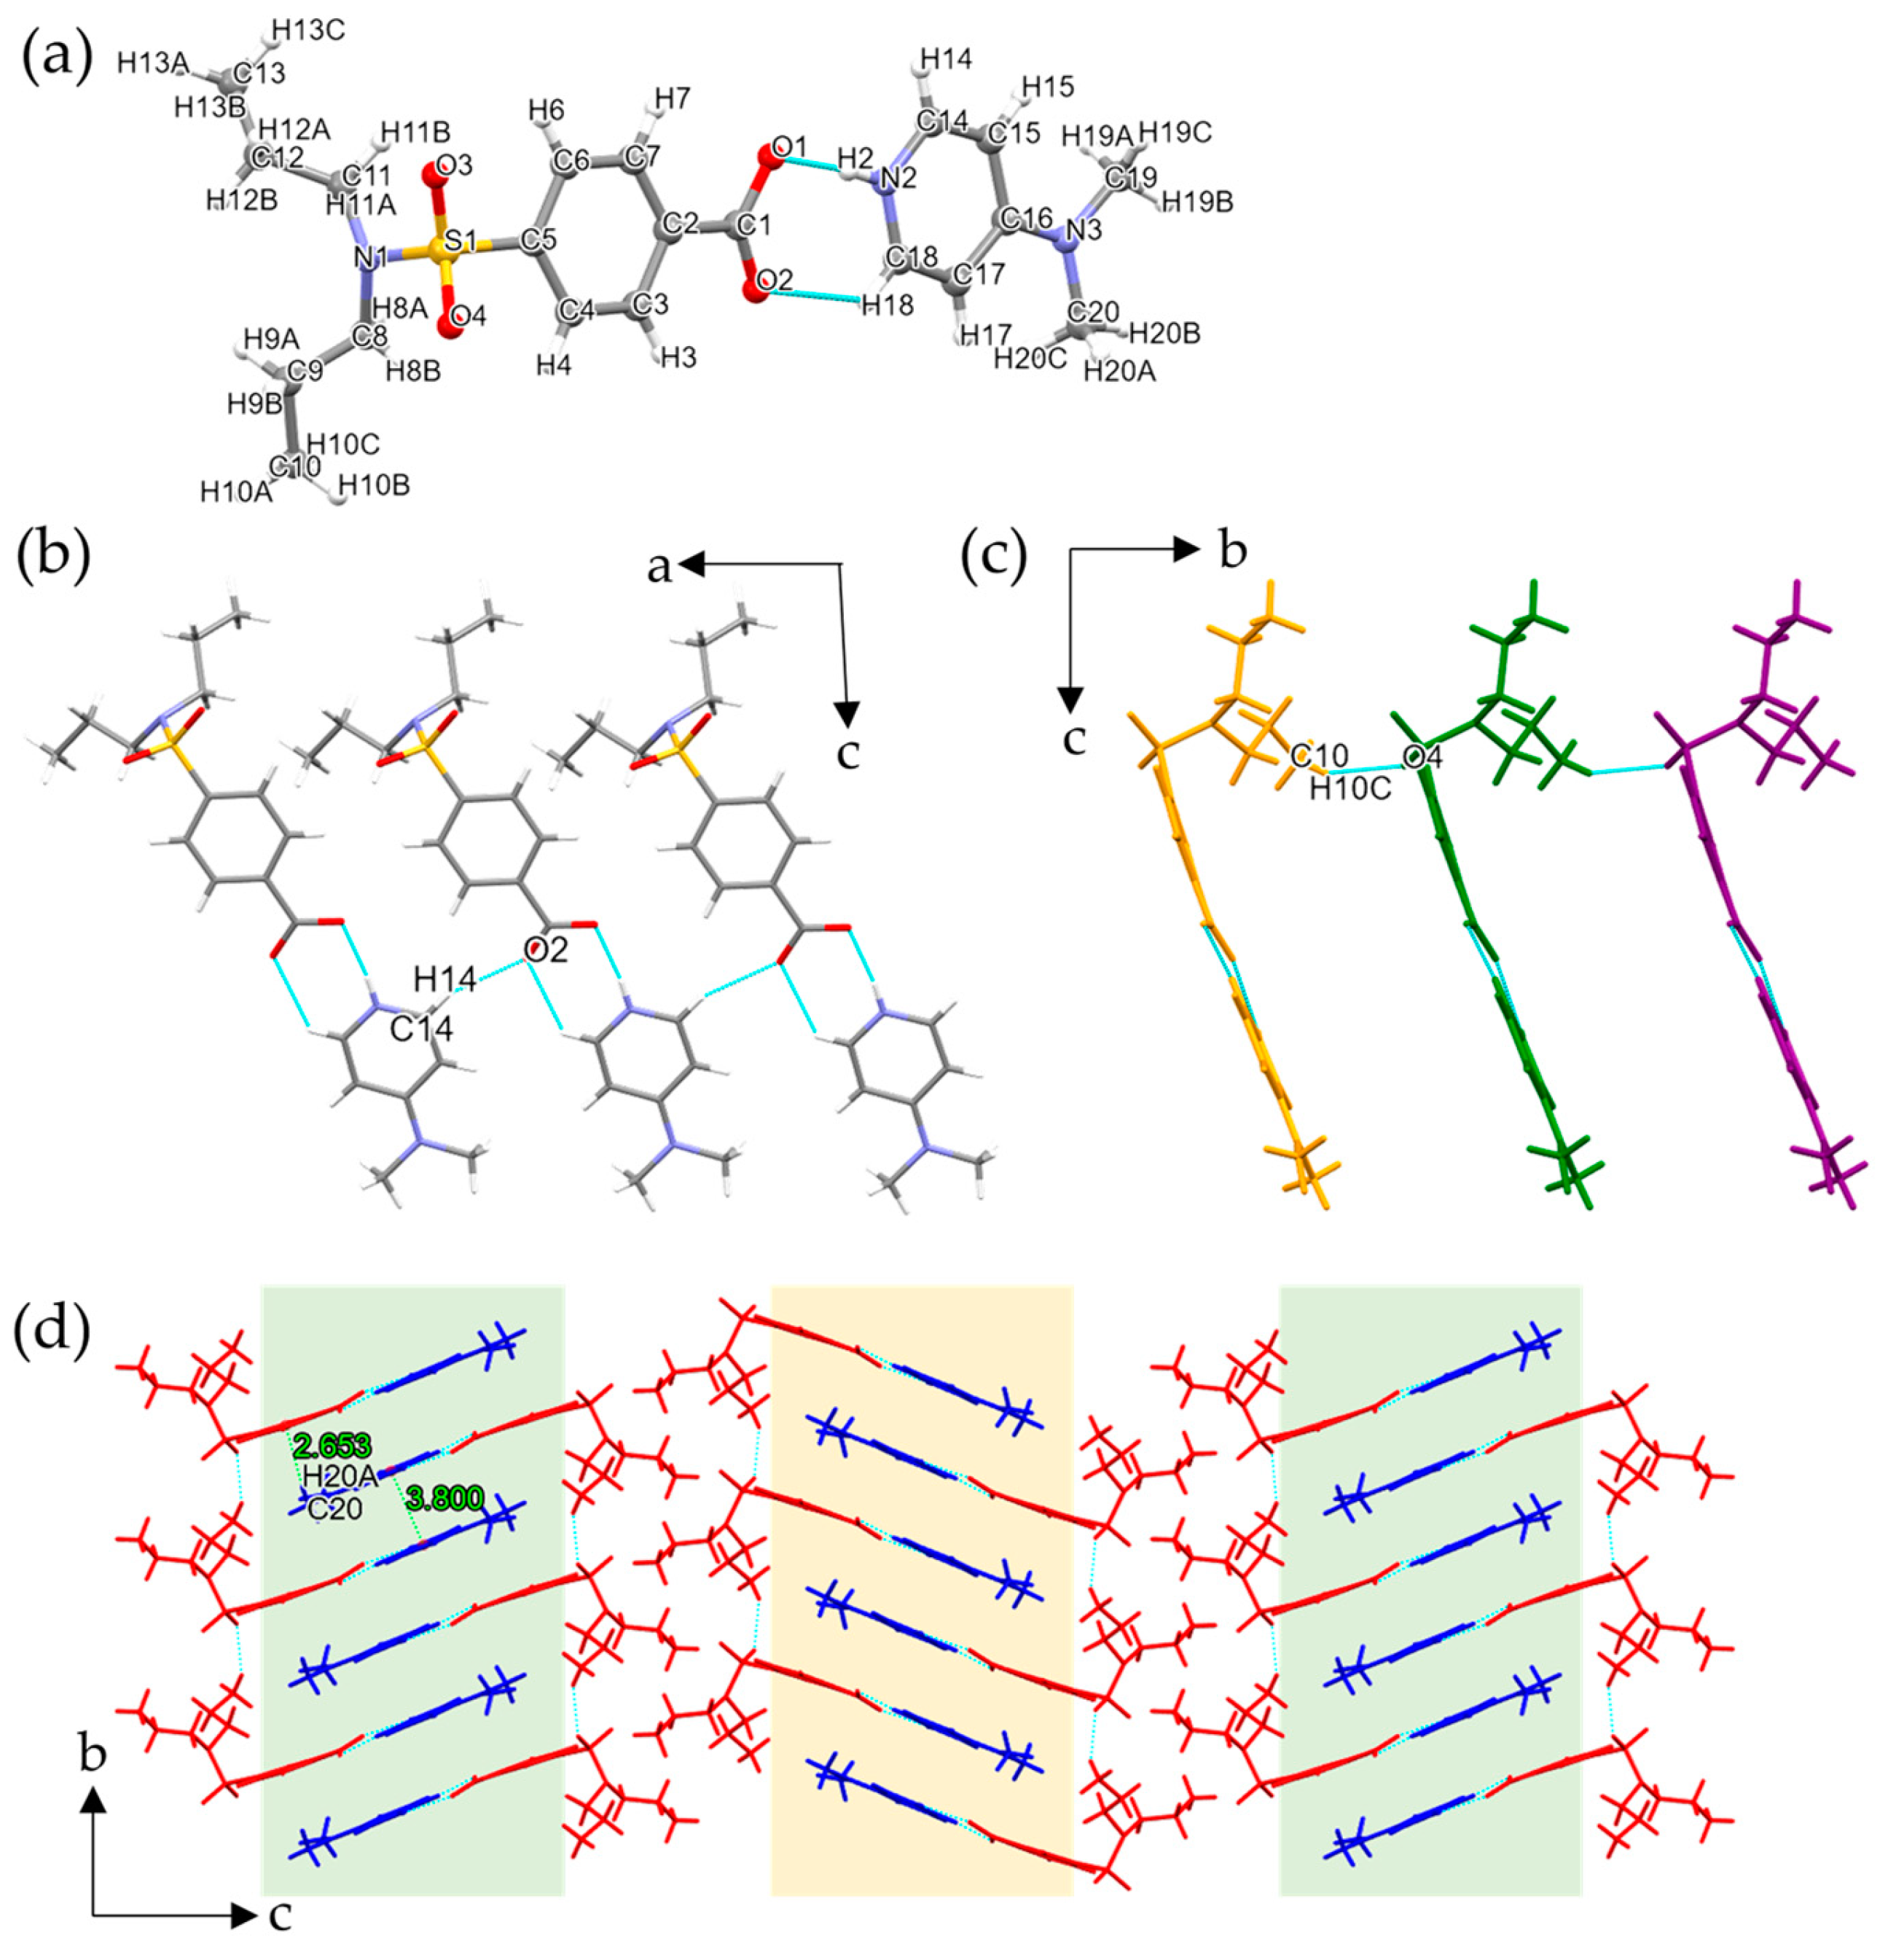
3.1.1. Single Crystal X-ray Diffraction Analysis
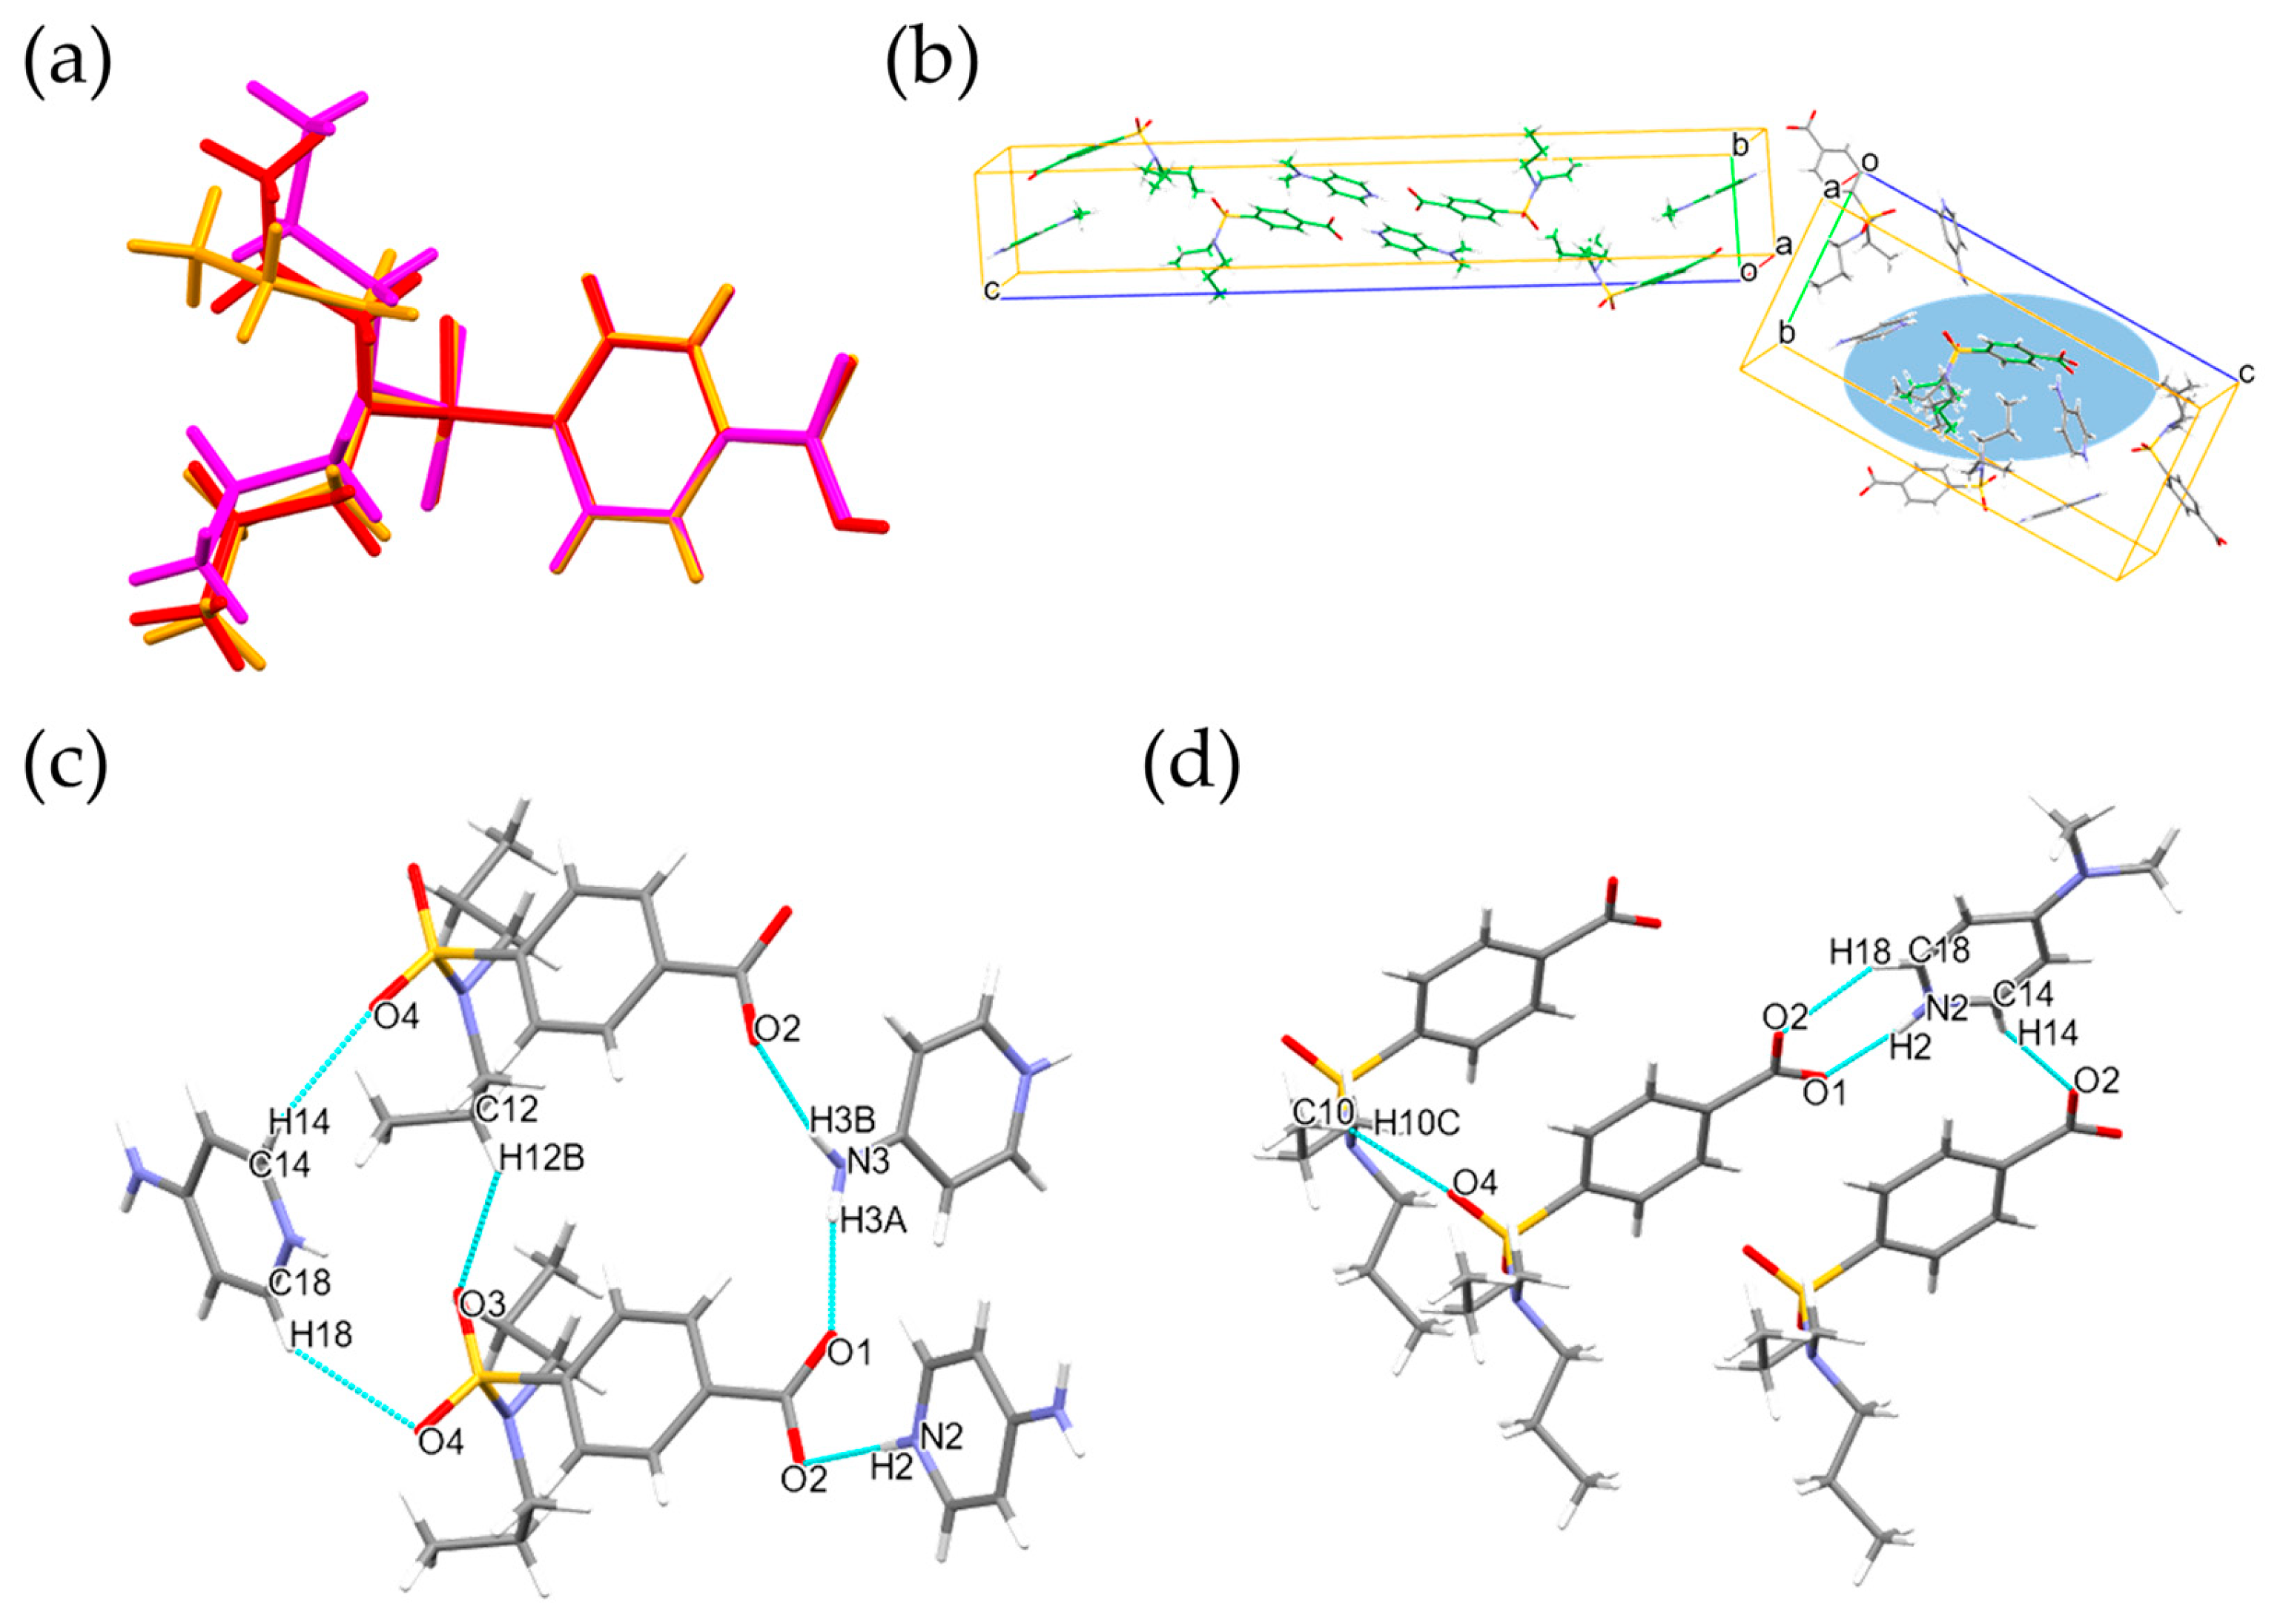
3.1.2. Conformation and Packing Similarity Analysis
3.2. Powder Characterization Analysis
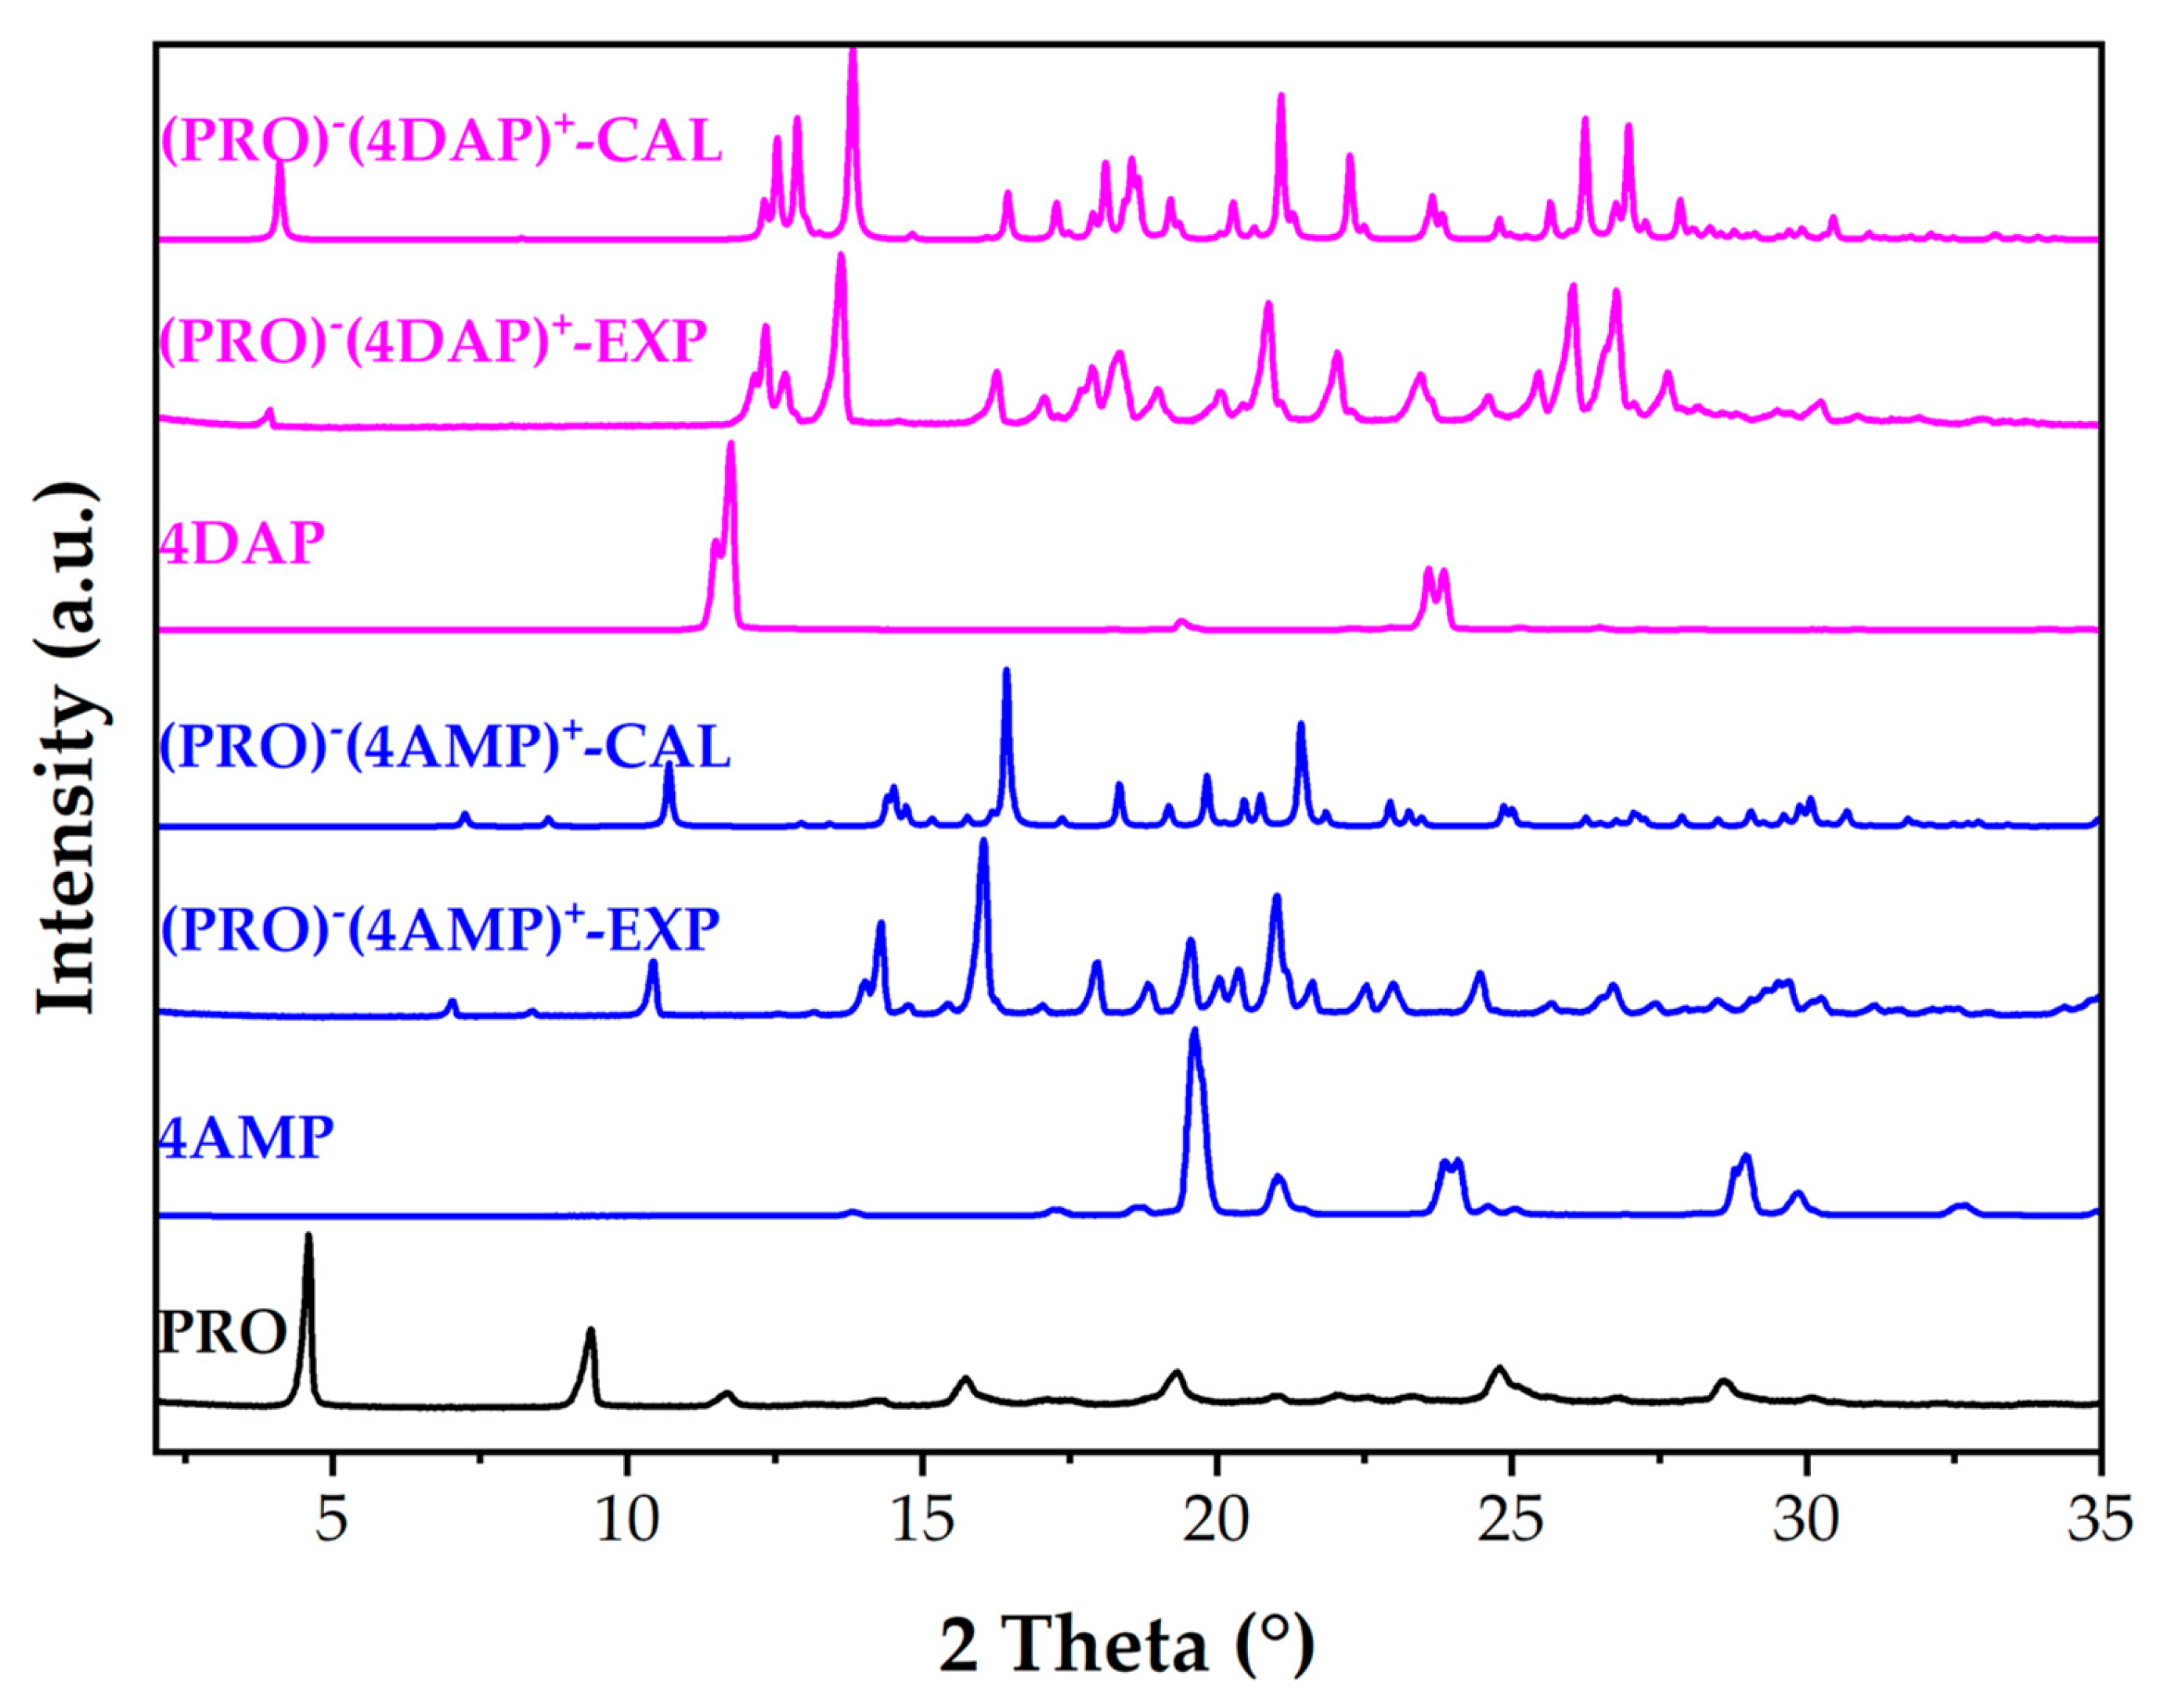
3.2.1. Powder X-ray Diffraction Analysis
3.2.2. Thermal Analysis
3.2.3. Spectral Analysis
3.2.4. SEM Analysis
3.2.5. Equilibrium Solubility Analysis
3.2.6. Accelerated Stability Analysis
3.3. Computational Analysis
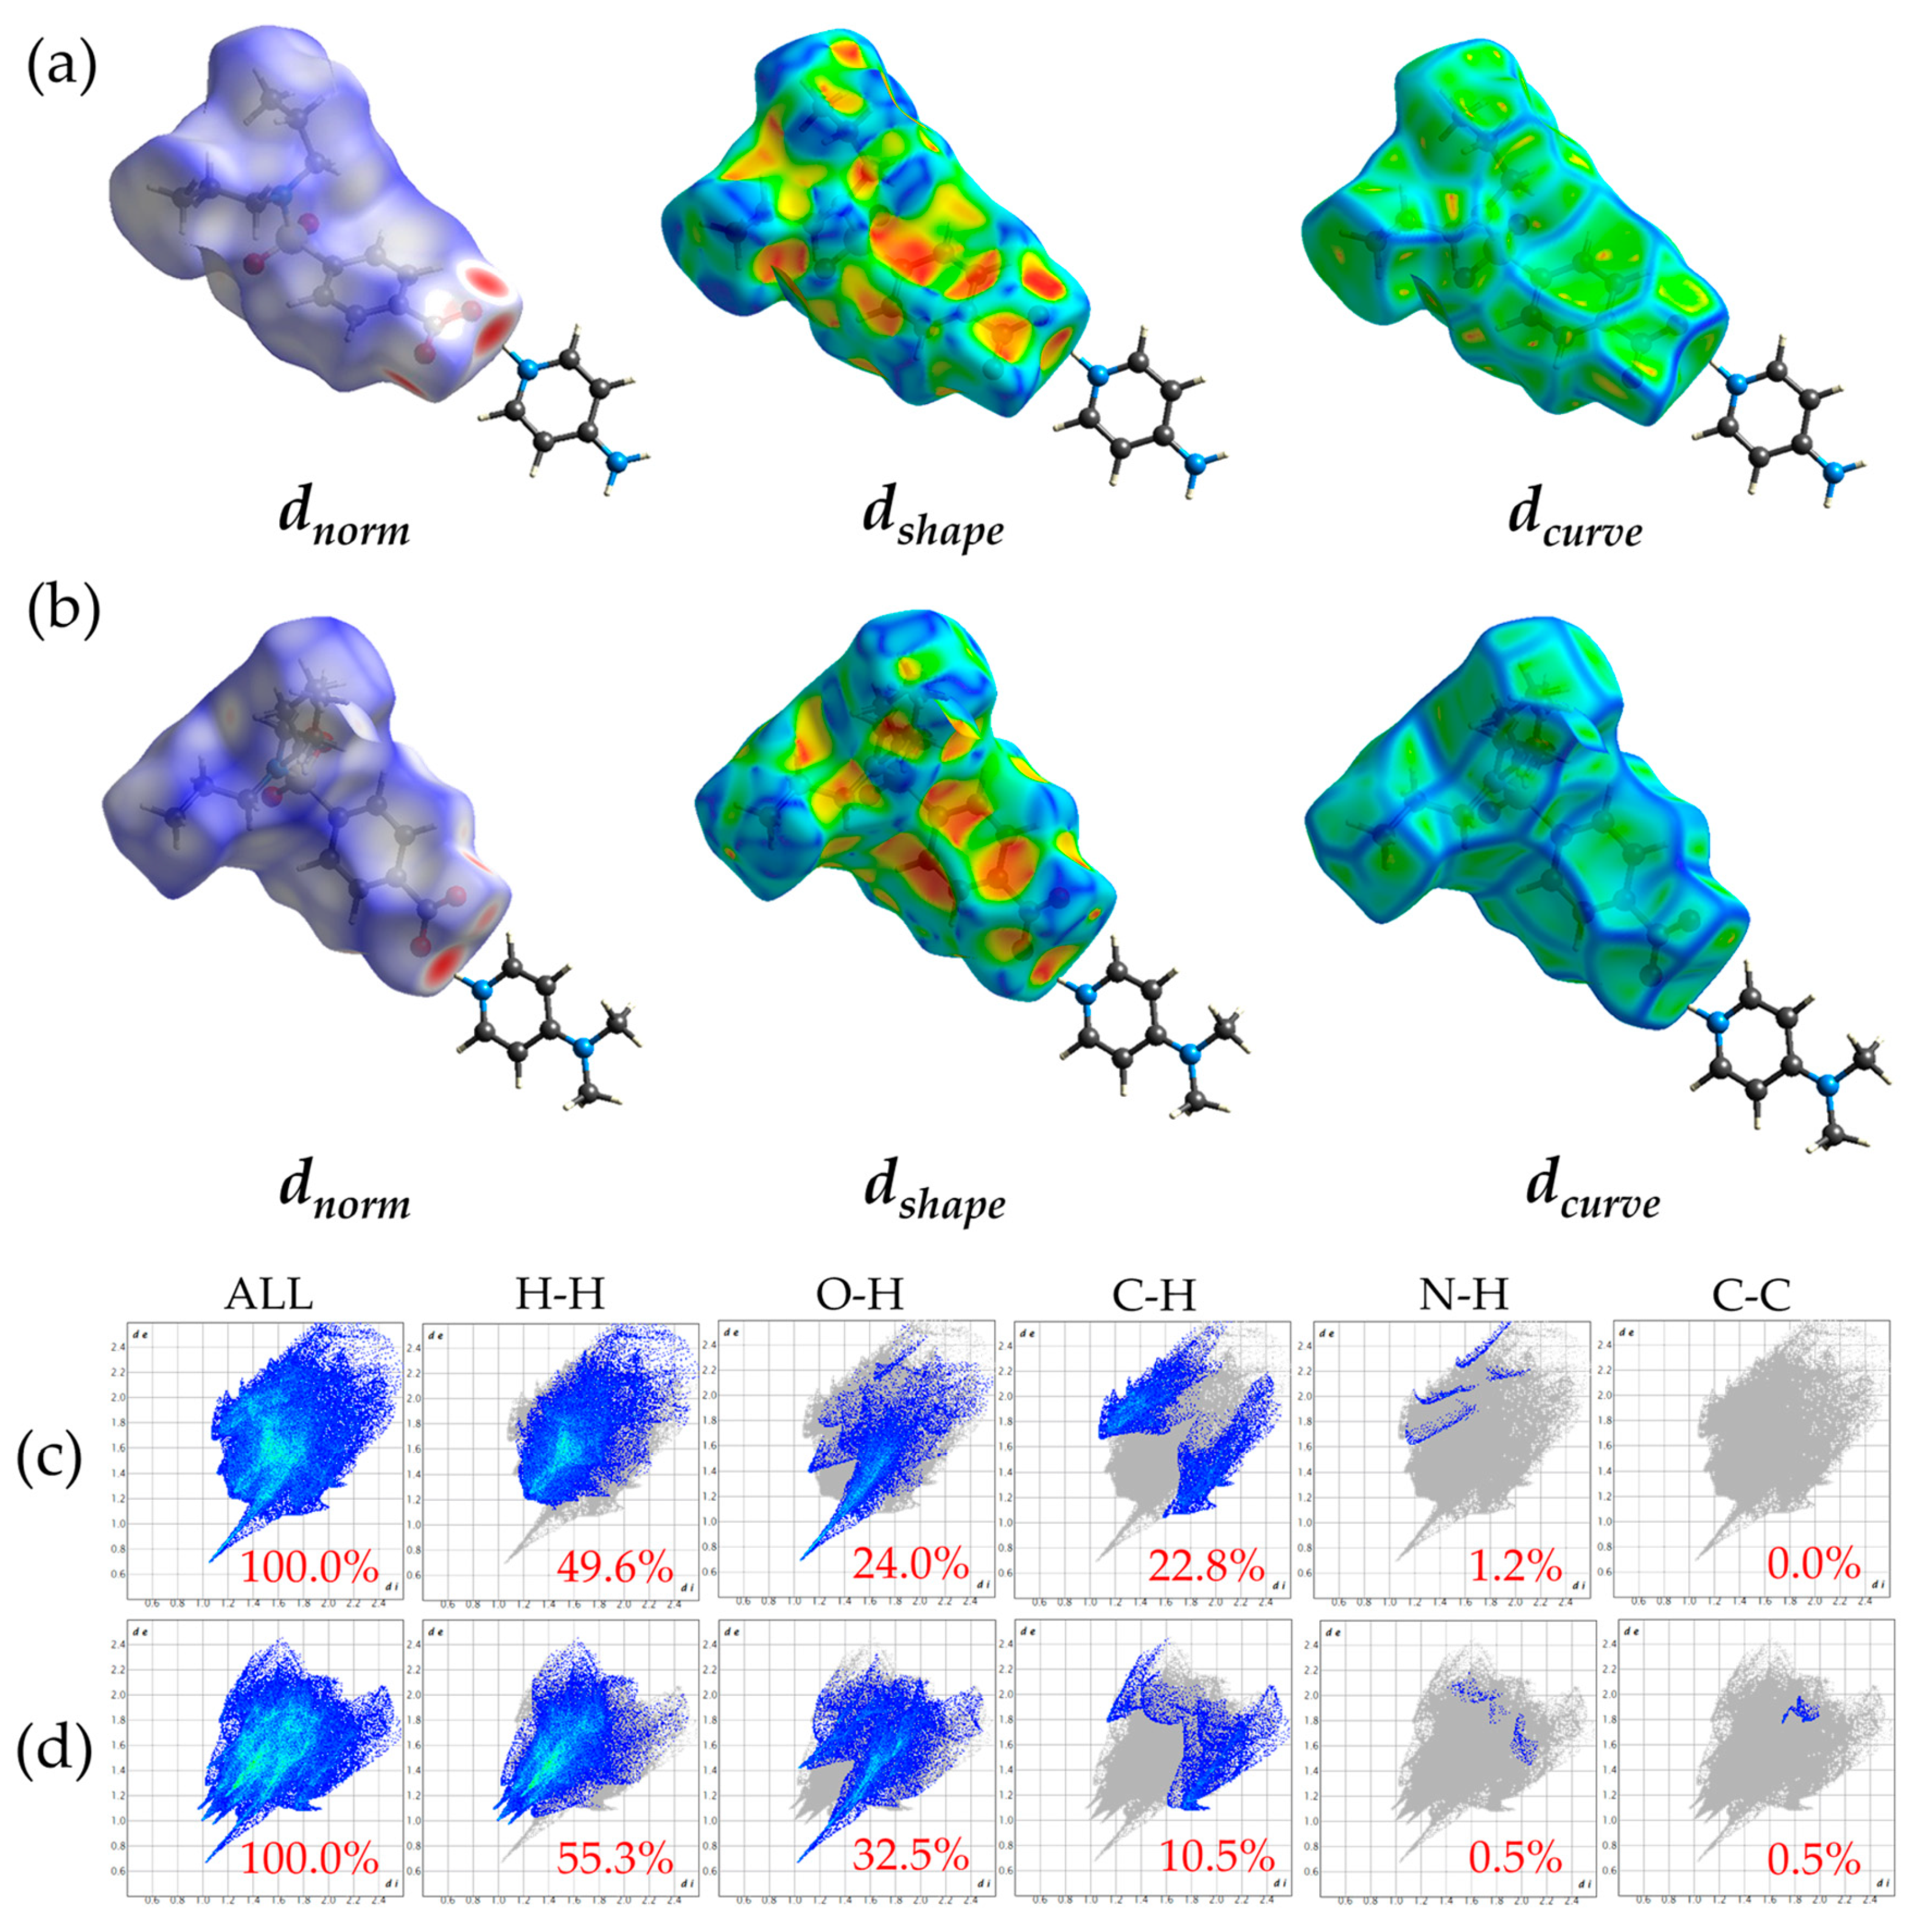
3.3.1. HS Analysis
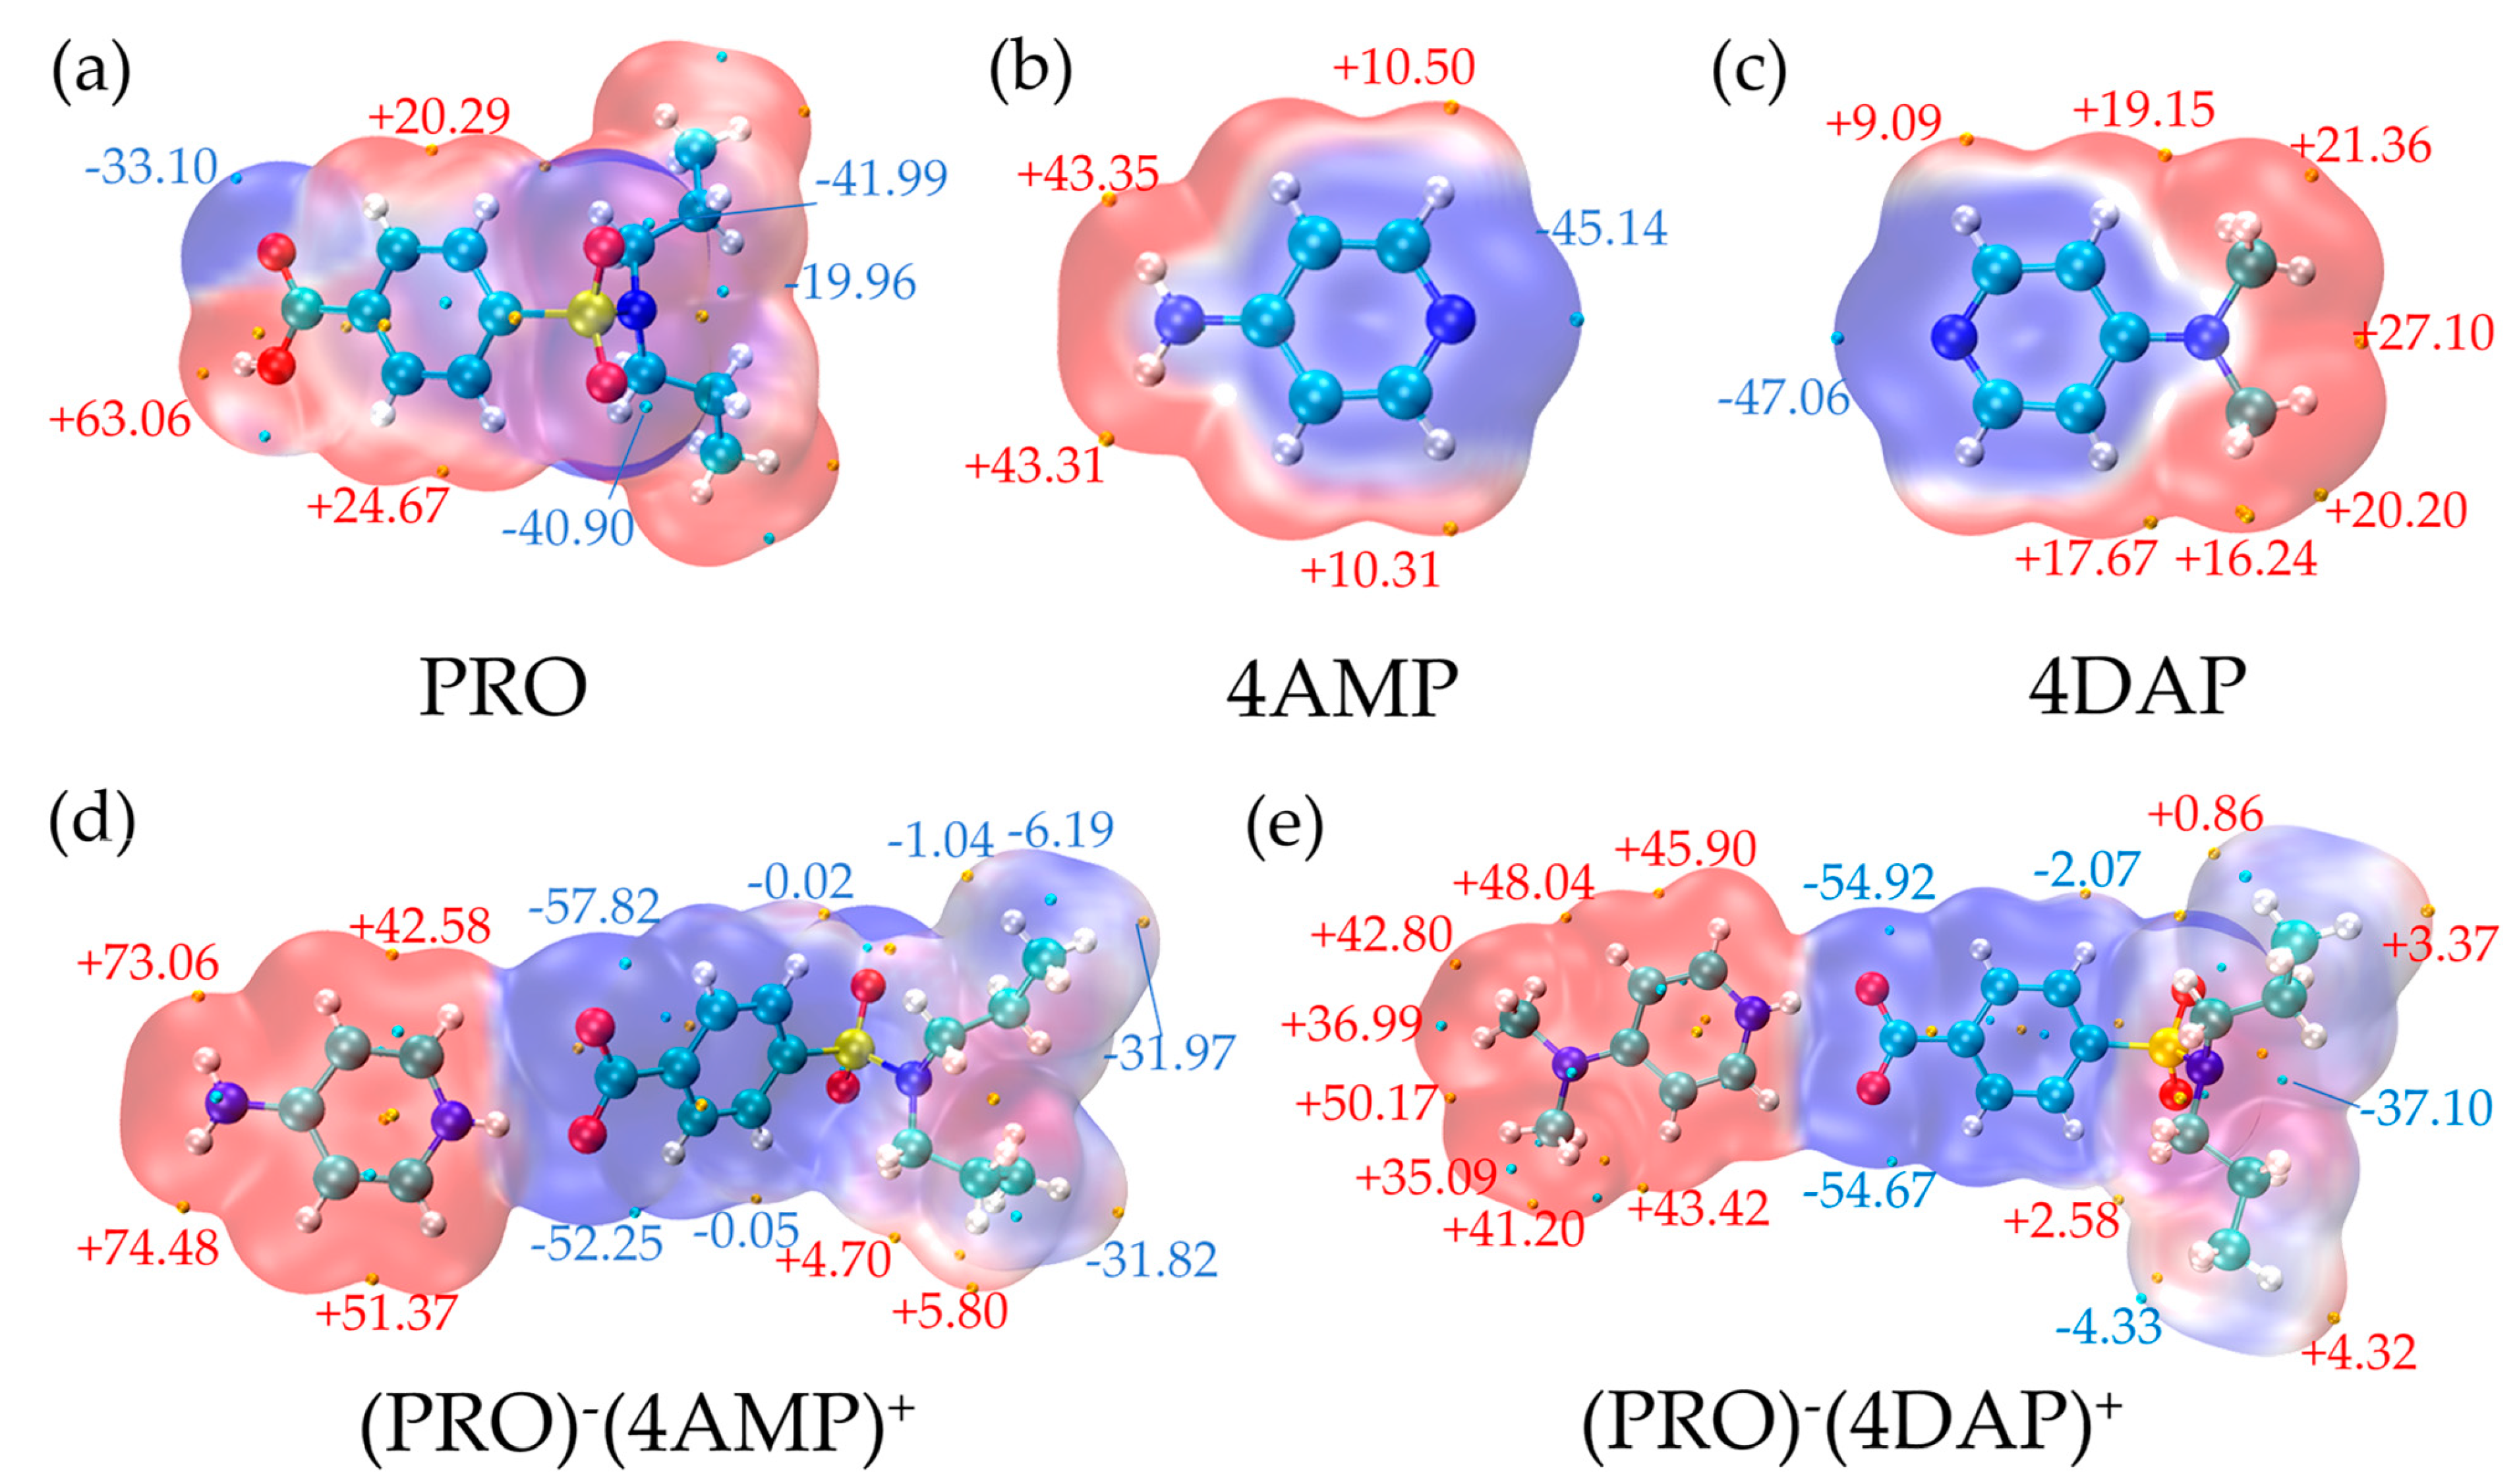
3.3.2. MEPs Analysis
3.3.3. pKa Analysis
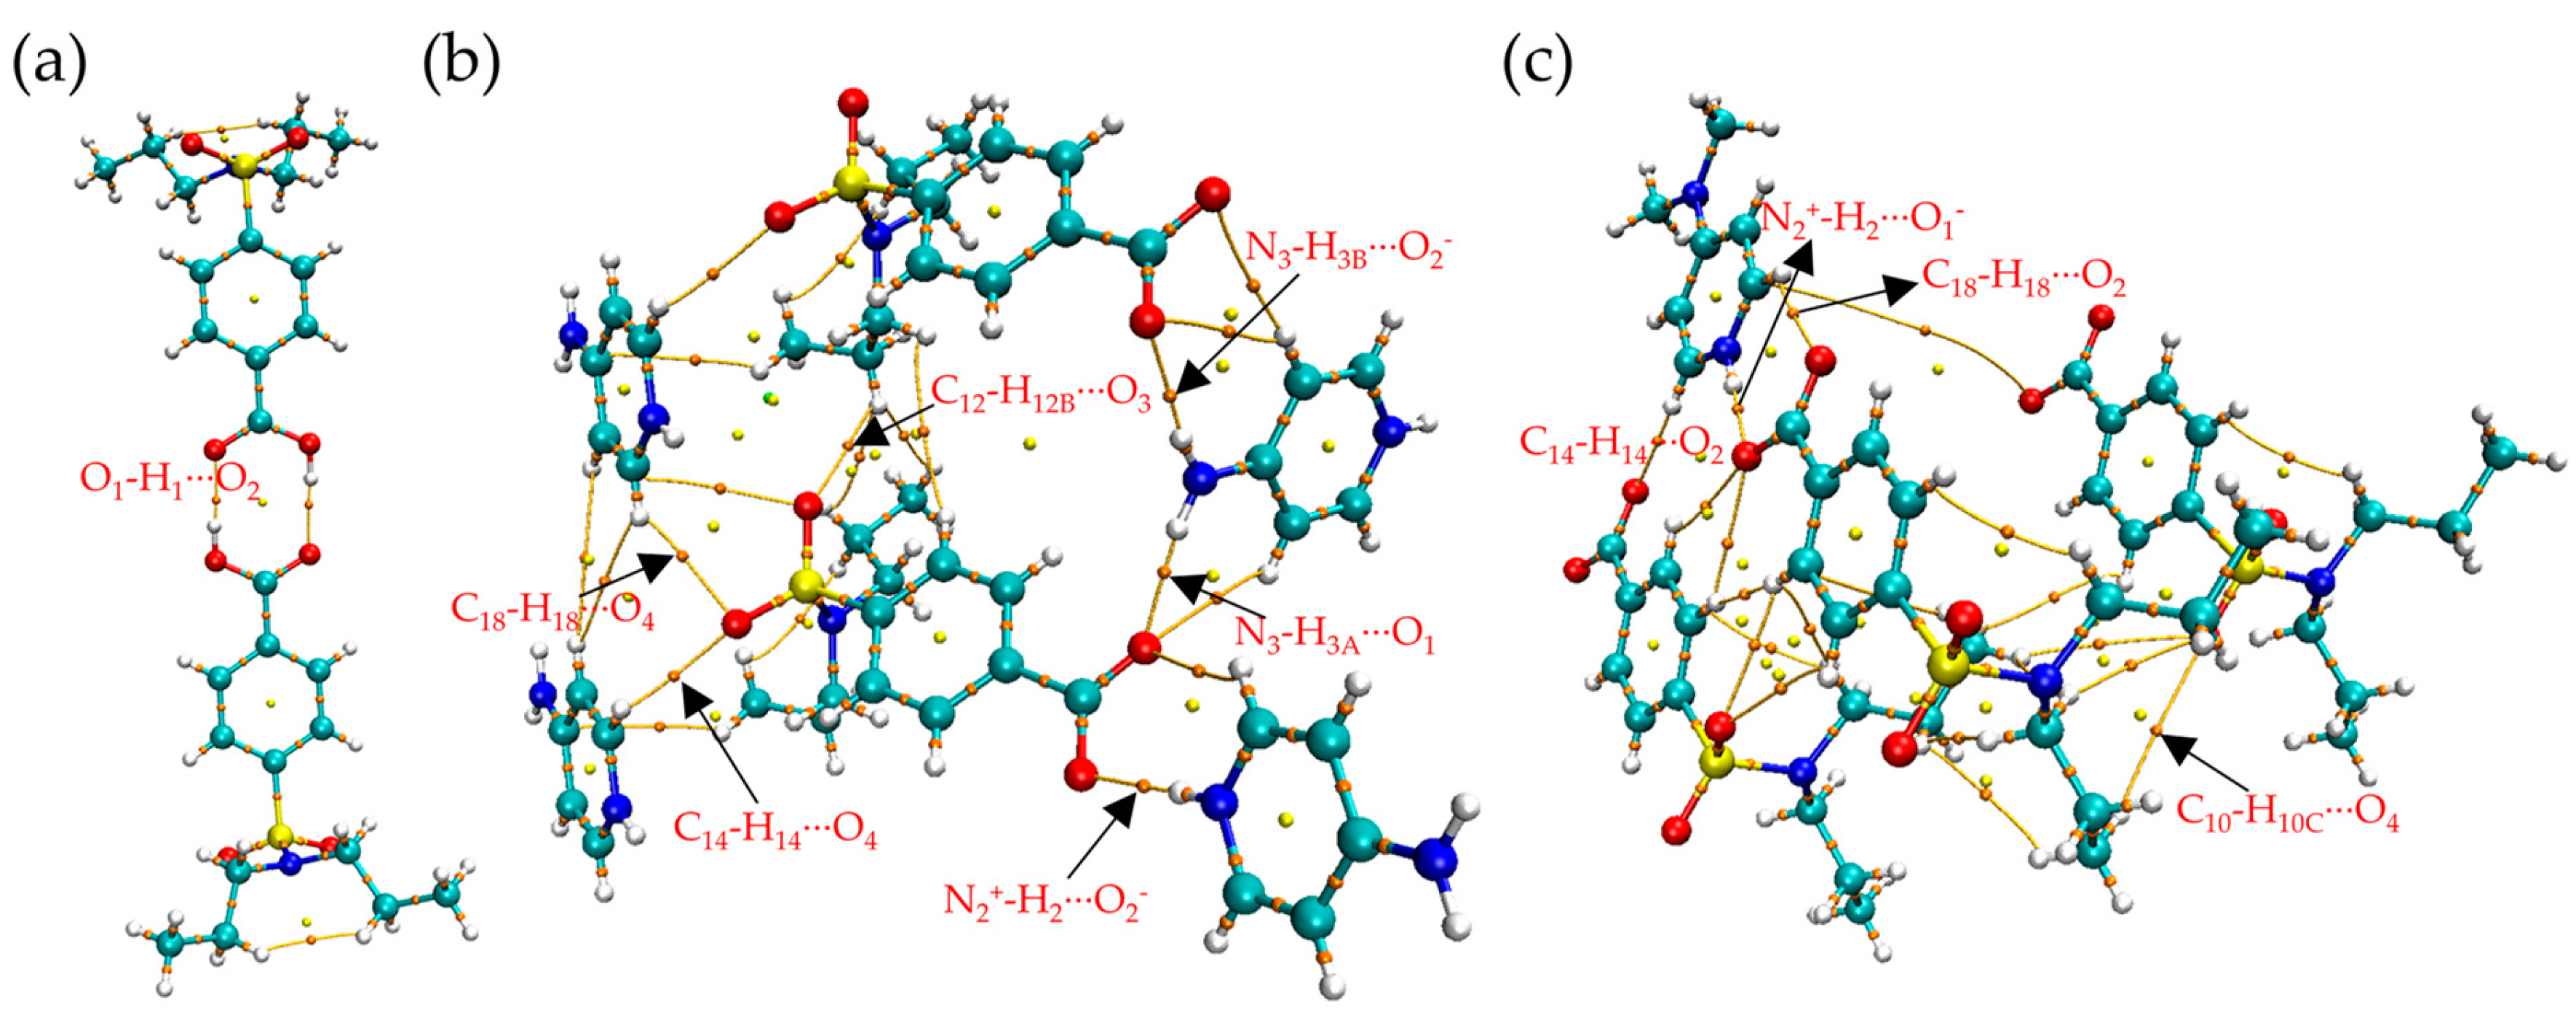
3.3.4. AIM Analysis
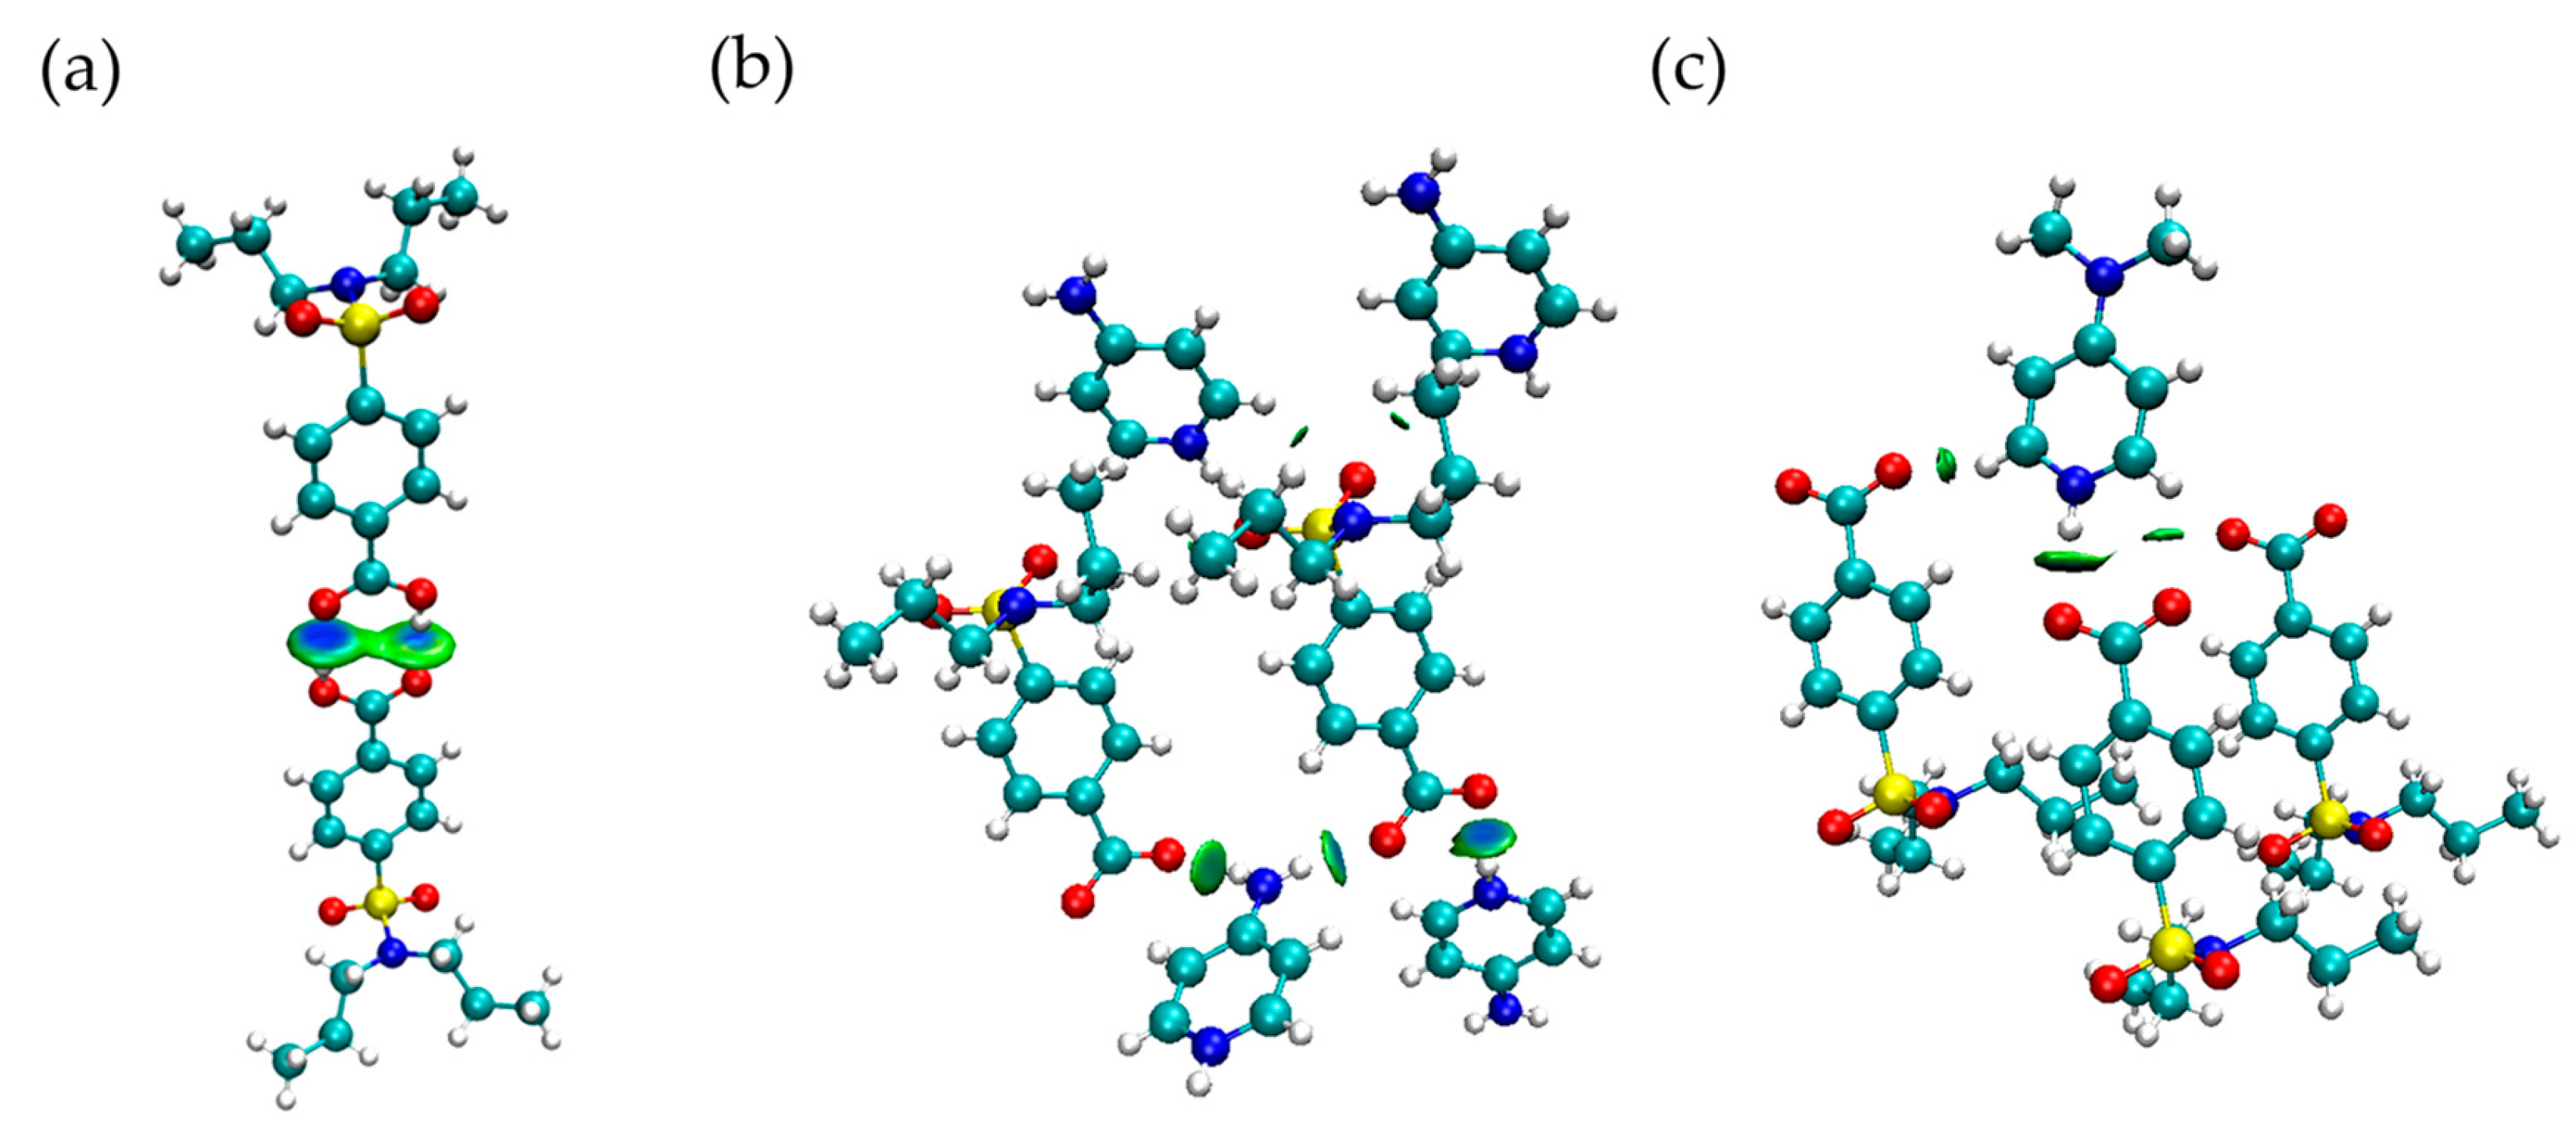
3.3.5. IGM Analysis
3.3.6. Lattice Energy (EL) and Hydration-Free Energy (EHF) Analysis
4. Conclusions
Supplementary Materials
Author Contributions
Funding
Data Availability Statement
Acknowledgments
Conflicts of Interest
References
- Childs, S.L.; Stahly, G.P.; Park, A. The Salt−Cocrystal Continuum: The Influence of Crystal Structure on Ionization State. Mol. Pharm. 2007, 4, 323–338. [Google Scholar] [CrossRef] [PubMed]
- Scheepers, M.C.; Lemmerer, A. Exploring the Crystal Structure Landscape of 3,5-Dinitrobenzoic Acid through Various Multicomponent Molecular Complexes. Cryst. Growth Des. 2021, 21, 344–356. [Google Scholar] [CrossRef]
- Surov, A.O.; Voronin, A.P.; Vasilev, N.A.; Ilyukhin, A.B.; Perlovich, G.L. Novel cocrystals of the potent 1,2,4-thiadiazole-based neuroprotector with carboxylic acids: Virtual screening, crystal structures and solubility performance. New J. Chem. 2021, 45, 3034–3047. [Google Scholar] [CrossRef]
- Babu, N.J.; Nangia, A. Solubility Advantage of Amorphous Drugs and Pharmaceutical Cocrystals. Cryst. Growth Des. 2011, 11, 2662–2679. [Google Scholar] [CrossRef]
- Hossain Mithu, M.S.; Economidou, S.; Trivedi, V.; Bhatt, S.; Douroumis, D. Advanced Methodologies for Pharmaceutical Salt Synthesis. Cryst. Growth Des. 2021, 21, 1358–1374. [Google Scholar] [CrossRef]
- Zhang, G.; Zhang, L.; Yang, D.; Zhang, N.; He, L.; Du, G.; Lu, Y. Salt screening and characterization of ciprofloxacin. Acta Crystallogr. Sect. B-Struct. Sci. Cryst. Eng. Mat. 2016, 72, 20–28. [Google Scholar] [CrossRef] [PubMed]
- Gao, L.; Li, X.; Yan, X.; Zhang, X. Ethylenediamine Salt Enhances the Solubility and Dissolution of Flurbiprofen. ChemistryOpen 2024, 13, e202300262. [Google Scholar] [CrossRef]
- Li, C.; Wu, D.; Gao, Z.; Chen, W. Molecular simulation studies on the design of multicomponent sorbic acid crystals for tuning solubility. CrystEngComm 2023, 25, 4889–4901. [Google Scholar] [CrossRef]
- Li, J.; Wu, D.; Xiao, Y.; Li, C.; Ji, X.; Sun, Q.; Chang, D.; Zhou, L.; Jing, D.; Gong, J.; et al. Salts of 2-hydroxybenzylamine with improvements on solubility and stability: Virtual and experimental screening. Eur. J. Pharm. Sci. 2022, 169, 106091. [Google Scholar] [CrossRef]
- Sun, J.; Jia, L.; Wang, M.; Liu, Y.; Li, M.; Han, D.; Gong, J. Novel Drug–Drug Multicomponent Crystals of Epalrestat–Metformin: Improved Solubility and Photostability of Epalrestat and Reduced Hygroscopicity of Metformin. Cryst. Growth Des. 2022, 22, 1005–1016. [Google Scholar] [CrossRef]
- Hu, X.; Xiao, Y.; Qi, L.; Bai, Y.; Sun, Y.; Ye, Y.; Xie, C. Enhancing the dissolution and bacteriostatic activity of trimethoprim through salt formation. CrystEngComm 2023, 25, 3445–3459. [Google Scholar] [CrossRef]
- Kumar, L.; Amin, A.; Bansal, A.K. An overview of automated systems relevant in pharmaceutical salt screening. Drug Discov. Today 2007, 12, 1046–1053. [Google Scholar] [CrossRef] [PubMed]
- Perez-Ruiz, F.; Herrero-Beites, A.M.; Atxotegi Saenz De Buruaga, J. Chapter 12—Uricosuric Therapy of Hyperuricemia in Gout; W.B. Saunders: Philadelphia, PA, USA, 2012. [Google Scholar]
- Sattui, S.E.; Gaffo, A.L. Treatment of hyperuricemia in gout: Current therapeutic options, latest developments and clinical implications. Ther. Adv. Musculoskelet. Dis. 2016, 8, 145–159. [Google Scholar] [CrossRef] [PubMed]
- Barone, S.; Xu, J.; Zahedi, K.; Brooks, M.; Soleimani, M. Probenecid Downregulates Kidney Pendrin and AQP-2 and Potentiates Hydrochlorothiazide Diuresis. Front. Physiol. 2018, 9, A325. [Google Scholar] [CrossRef] [PubMed]
- Wei, R.; Wang, J.; Xu, Y.; Yin, B.; He, F.; Du, Y.; Peng, G.; Luo, B. Probenecid protects against cerebral ischemia/reperfusion injury by inhibiting lysosomal and inflammatory damage in rats. Neuroscience 2015, 301, 168–177. [Google Scholar] [CrossRef] [PubMed]
- Smetanová, L.; Stĕtinová, V.; Svoboda, Z.; Kvetina, J. Caco-2 cells, biopharmaceutics classification system (BCS) and biowaiver. Acta Medica 2011, 54, 3–8. [Google Scholar] [PubMed]
- Gisclon, L.G.; Boyd, R.A.; Williams, R.L.; Giacomini, K.M. The effect of probenecid on the renal elimination of cimetidine. Clin. Pharmacol. Ther. 1989, 45, 444–452. [Google Scholar] [CrossRef]
- Bruni, G.; Monteforte, F.; Maggi, L.; Friuli, V.; Ferrara, C.; Mustarelli, P.; Girella, A.; Berbenni, V.; Capsoni, D.; Milanese, C.; et al. Probenecid and benzamide: Cocrystal prepared by a green method and its physico-chemical and pharmaceutical characterization. J. Therm. Anal. Calorim. 2020, 140, 1859–1869. [Google Scholar] [CrossRef]
- Shen, Y.; Zong, S.; Dang, L.; Wei, H. Solubility and thermodynamics of probenecid-4,4′-azopyridine cocrystal in pure and binary solvents. J. Mol. Liq. 2019, 290, 111195. [Google Scholar] [CrossRef]
- Gupta, P.; Karothu, D.P.; Ahmed, E.; Naumov, P.; Nath, N.K. Thermally Twistable, Photobendable, Elastically Deformable, and Self-Healable Soft Crystals. Angew. Chem. Int. Ed. 2018, 57, 8498–8502. [Google Scholar] [CrossRef]
- Nath, N.K.; Hazarika, M.; Gupta, P.; Ray, N.R.; Paul, A.K.; Nauha, E. Plastically bendable crystals of probenecid and its cocrystal with 4,4′-Bipyridine. J. Mol. Struct. 2018, 1160, 20–25. [Google Scholar] [CrossRef]
- Rao, K.U.; Bhogala, B.R.; Maguire, A.R.; Lawrence, S.E. Symmetry assisted tuning of bending and brittle multi-component forms of probenecid. Chem. Commun. 2017, 53, 3381–3384. [Google Scholar]
- Bruni, G.; Monteforte, F.; Maggi, L.; Girella, A.; Berbenni, V.; Milanese, C.; Marini, A. Probenecid and benzamide: DSC applied to the study of an “impossible” pharmaceutical system. J. Therm. Anal. Calorim. 2021, 145, 391–402. [Google Scholar] [CrossRef]
- Li, Y.; Zhang, Y.; Xu, H.; Li, M.; Li, Z.; Song, Z.; Chen, J.; Liu, Y.; Sun, Y.; Yang, Z. Synthesis and characterization of supramolecular assembly probenecid cocrystal. J. Mol. Struct. 2024, 1298, 136786. [Google Scholar] [CrossRef]
- Haneef, J.; Markad, D.; Chadha, R. Interaction Map Driven Cocrystallization of Ambrisentan: Structural and Biopharmaceutical Evaluation. Cryst. Growth Des. 2020, 20, 4612–4620. [Google Scholar] [CrossRef]
- Solares-Briones, M.; Coyote-Dotor, G.; Páez-Franco, J.C.; Zermeño-Ortega, M.R.; de la O Contreras, C.M.; Canseco-González, D.; Avila-Sorrosa, A.; Morales-Morales, D.; Germán-Acacio, J.M. Mechanochemistry: A Green Approach in the Preparation of Pharmaceutical Cocrystals. Pharmaceutics 2021, 13, 790. [Google Scholar] [CrossRef]
- Xiao, Y.; Wu, C.; Hu, X.; Chen, K.; Qi, L.; Cui, P.; Zhou, L.; Yin, Q. Mechanochemical Synthesis of Cocrystal: From Mechanism to Application. Cryst. Growth Des. 2023, 23, 4680–4700. [Google Scholar] [CrossRef]
- Khan, E.; Shukla, A.; Srivastava, K.; Gangopadhyay, D.; Assi, K.H.; Tandon, P.; Vangala, V.R. Structural and Reactivity Analyses of Nitrofurantoin–4-dimethylaminopyridine Salt Using Spectroscopic and Density Functional Theory Calculations. Crystals 2019, 9, 413. [Google Scholar] [CrossRef]
- Chitra, R.; Choudhury, R.R.; Capet, F.; Roussel, P.; Bhatt, P. Crystal structure of 4-aminopyridinium 3-(4-aminopyridinium) succinate tetra hydrate: A new salt from 4-aminopyridine and maleic acid crystallization. J. Mol. Struct. 2021, 1234, 130142. [Google Scholar] [CrossRef]
- Boycov, D.E.; Drozd, K.V.; Manin, A.N.; Churakov, A.V.; Perlovich, G.L. New Solid Forms of Nitrofurantoin and 4-Aminopyridine Salt: Influence of Salt Hydration Level on Crystal Packing and Physicochemical Properties. Molecules 2022, 27, 8990. [Google Scholar] [CrossRef]
- Huang, S.; Venables, D.S.; Lawrence, S.E. Pharmaceutical Salts of Piroxicam and Meloxicam with Organic Counterions. Cryst. Growth Des. 2022, 22, 6504–6520. [Google Scholar] [CrossRef]
- Ma, D.J.; Pei, T.Z.; Bai, Y.H.; Zhou, L.N.; Bao, Y.; Yin, Q.X.; Xie, C. Salts formation between ibuprofen and pyridine derivatives: Effect of amino group on supramolecular packing and proton transfer. J. Mol. Struct. 2019, 1179, 487–494. [Google Scholar] [CrossRef]
- Nauha, E.; Bernstein, J. “Predicting” Polymorphs of Pharmaceuticals Using Hydrogen Bond Propensities: Probenecid and its Two Single-Crystal-to-Single-Crystal Phase Transitions. J. Pharm. Sci. 2015, 104, 2056–2061. [Google Scholar] [CrossRef]
- Desiraju, G.R. The Supramolecular Synthon in Crystal Engineering. In Stimulating Concepts in Chemistry; Wiley-VCH Verlag GmbH & Co. KGaA: Weinheim, Germany, 2000. [Google Scholar]
- Sheldrick, G.M. A short history of SHELX. Acta Crystallogr. Sect. A 2008, 64, 112–122. [Google Scholar] [CrossRef]
- Corpinot, M.K.; Bučar, D. A Practical Guide to the Design of Molecular Crystals. Cryst. Growth Des. 2019, 19, 1426–1453. [Google Scholar] [CrossRef]
- Devogelaer, J.; Brugman, S.J.T.; Meekes, H.; Tinnemans, P.; Vlieg, E.; de Gelder, R. Cocrystal design by network-based link prediction. CrystEngComm 2019, 21, 6875–6885. [Google Scholar] [CrossRef]
- Krause, L.; Herbst-Irmer, R.; Sheldrick, G.M.; Stalke, D. Comparison of silver and molybdenum microfocus X-ray sources for single-crystal structure determination. J. Appl. Crystallogr. 2015, 48, 3–10. [Google Scholar] [CrossRef] [PubMed]
- Spek, A.L. Single-crystal structure validation with the program PLATON. J. Appl. Crystallogr. 2003, 36, 7–13. [Google Scholar] [CrossRef]
- Macrae, C.F.; Edgington, P.R.; Mccabe, P.; Pidcock, E.; Shields, G.P.; Taylor, R.; Towler, M.; van de Streek, J. Mercury: Visualization and analysis of crystal structures. J. Appl. Crystallogr. 2006, 39, 453–457. [Google Scholar] [CrossRef]
- Zhou, L.; Yang, L.; Tilton, S.; Wang, J. Development of a high throughput equilibrium solubility assay using miniaturized shake-flask method in early drug discovery. J. Pharm. Sci. 2007, 96, 3052–3071. [Google Scholar] [CrossRef]
- Yang, R. Improvement of the determination method for the content of probenecid. Chin. Med. Dig. Intern. Med. 2012, 7, 408–409. [Google Scholar]
- Mckinnon, J.J.; Spackman, M.A.; Mitchell, A.S. Novel tools for visualizing and exploring intermolecular interactions in molecular crystals. Acta Crystallogr. Sect. B 2004, 60, 627–668. [Google Scholar] [CrossRef]
- Spackman, P.R.; Turner, M.J.; Mckinnon, J.J.; Wolff, S.K.; Grimwood, D.J.; Jayatilaka, D.; Spackman, M.A. CrystalExplorer: A program for Hirshfeld surface analysis, visualization and quantitative analysis of molecular crystals. J. Appl. Crystallogr. 2021, 54, 1006–1011. [Google Scholar] [CrossRef]
- Clark, S.J.; Segall, M.D.; Pickard, C.J.; Hasnip, P.J.; Probert, M.I.J.; Refson, K.; Payne, M.C. First principles methods using CASTEP. Z. Kristallographie—Cryst. Mater. 2005, 220, 567–570. [Google Scholar] [CrossRef]
- Burke, K.; Ernzerhof, M. Generalized Gradient Approximation Made Simple. Phys. Rev. Lett. 1996, 77, 3865–3868. [Google Scholar]
- Vanderbilt, D. Soft self-consistent pseudopotentials in a generalized eigenvalue formalism. Phys. Rev. B 1990, 41, 7892–7895. [Google Scholar] [CrossRef] [PubMed]
- Grimme, S. Semiempirical GGA-type density functional constructed with a long-range dispersion correction. J. Comput. Chem. 2006, 27, 1787–1799. [Google Scholar] [CrossRef]
- Eichkorn, K.; Treutler, O.; Öhm, H.; Häser, M.; Ahlrichs, R. Auxiliary basis sets to approximate Coulomb potentials. Chem. Phys. Lett. 1995, 240, 283–290. [Google Scholar] [CrossRef]
- Mardirossian, N.; Head-Gordon, M. ΩB97M-V: A combinatorially optimized, range-separated hybrid, meta-GGA density functional with VV10 nonlocal correlation. J. Chem. Phys. 2016, 144, 214110. [Google Scholar] [CrossRef]
- Weigend, F.; Ahlrichs, R. Balanced basis sets of split valence, triple zeta valence and quadruple zeta valence quality for H to Rn: Design and assessment of accuracy. Phys. Chem. Chem. Phys. 2005, 7, 3297. [Google Scholar] [CrossRef]
- Neese, F.; Wennmohs, F.; Becker, U.; Riplinger, C. The ORCA quantum chemistry program package. J. Chem. Phys. 2020, 152, 224108. [Google Scholar] [CrossRef] [PubMed]
- Emamian, S.; Lu, T.; Kruse, H.; Emamian, H. Exploring Nature and Predicting Strength of Hydrogen Bonds: A Correlation Analysis Between Atoms-in-Molecules Descriptors, Binding Energies, and Energy Components of Symmetry-Adapted Perturbation Theory. J. Comput. Chem. 2019, 40, 2868–2881. [Google Scholar] [CrossRef] [PubMed]
- Lu, T.; Chen, Q. Independent gradient model based on Hirshfeld partition: A new method for visual study of interactions in chemical systems. J. Comput. Chem. 2022, 43, 539–555. [Google Scholar] [CrossRef] [PubMed]
- Zhang, J.; Lu, T. Efficient evaluation of electrostatic potential with computerized optimized code. Phys. Chem. Chem. Phys. 2021, 23, 20323–20328. [Google Scholar] [CrossRef]
- Lu, T.; Chen, F. Multiwfn: A multifunctional wavefunction analyzer. J. Comput. Chem. 2012, 33, 580–592. [Google Scholar] [CrossRef] [PubMed]
- Lu, T.; Chen, F. Quantitative analysis of molecular surface based on improved Marching Tetrahedra algorithm. J. Mol. Graph. Model. 2012, 38, 314–323. [Google Scholar] [CrossRef]
- Humphrey, W.; Dalke, A.; Schulten, K. VMD: Visual molecular dynamics. J. Mol. Graph. 1996, 14, 33–38. [Google Scholar] [CrossRef]
- Mittapalli, S.; Mannava, M.K.C.; Sahoo, R.; Nangia, A. Cocrystals, Salts, and Supramolecular Gels of Nonsteroidal Anti-Inflammatory Drug Niflumic Acid. Cryst. Growth Des. 2019, 19, 219–230. [Google Scholar] [CrossRef]
- Dzotam, J.K.; Simo, I.K.; Bitchagno, G.; Celik, I.; Sandjo, L.P.; Tane, P.; Kuete, V. In vitro antibacterial and antibiotic modifying activity of crude extract, fractions and 3’,4’,7-trihydroxyflavone from Myristica fragrans Houtt against MDR Gram-negative enteric bacteria. BMC Complement. Altern. Med. 2018, 18, 15. [Google Scholar] [CrossRef]
- Vener, M.V.; Levina, E.O.; Koloskov, O.A.; Rykounov, A.A.; Voronin, A.P.; Tsirelson, V.G. Evaluation of the Lattice Energy of the Two-Component Molecular Crystals Using Solid-State Density Functional Theory. Cryst. Growth Des. 2014, 14, 4997–5003. [Google Scholar] [CrossRef]
- Ranke, J.; Othman, A.; Fan, P.; Müller, A. Explaining Ionic Liquid Water Solubility in Terms of Cation and Anion Hydrophobicity. Int. J. Mol. Sci. 2009, 10, 1271–1289. [Google Scholar] [CrossRef]
- Vyboishchikov, S.F.; Voityuk, A.A. Fast non-iterative calculation of solvation energies for water and non-aqueous solvents. J. Comput. Chem. 2021, 42, 1184–1194. [Google Scholar] [CrossRef] [PubMed]
- Swapna, B.; Nangia, A. Epalrestat–Cytosine Cocrystal and Salt Structures: Attempt to Control E,Z → Z,Z Isomerization. Cryst. Growth Des. 2017, 17, 3350–3360. [Google Scholar] [CrossRef]
- Janiak, C. A critical account on π–π stacking in metal complexes with aromatic nitrogen-containing ligands. J. Chem. Soc. Dalton Trans. 2000, 21, 3885–3896. [Google Scholar] [CrossRef]
- Cruz-Cabeza, A.J. Acid-base crystalline complexes and the pKa rule. CrystEngComm 2012, 14, 6362–6365. [Google Scholar] [CrossRef]
- Tothadi, S.; Shaikh, T.R.; Gupta, S.; Dandela, R.; Vinod, C.P.; Nangia, A.K. Can we Identify the Salt–Cocrystal Continuum State Using XPS? Cryst. Growth Des. 2021, 21, 735–747. [Google Scholar] [CrossRef]
- Espinosa, E.; Molins, E.; Lecomte, C. Hydrogen bond strengths revealed by topological analyses of experimentally observed electron densities. Chem. Phys. Lett. 1998, 285, 170–173. [Google Scholar] [CrossRef]
- Rozas, I.; Alkorta, I.; Elguero, J. Behavior of Ylides Containing N, O, and C Atoms as Hydrogen Bond Acceptors. J. Am. Chem. Soc. 2000, 122, 11154–11161. [Google Scholar] [CrossRef]


| Compound | (PRO)−(4AMP)+ | (PRO)−(4DAP)+ |
|---|---|---|
| Empirical formula | C18H25N3O4S | C20H29N3O4S |
| Formula weight | 379.47 | 407.52 |
| Temperature/K | 293 (2) | 293 (2) |
| Crystal system | orthorhombic | monoclinic |
| Space group | P212121 | P21/c |
| a/Å | 7.1146 (1) | 6.8830 (1) |
| b/Å | 11.2314 (2) | 7.1512 (2) |
| c/Å | 24.3877 (4) | 43.1607 (8) |
| α/° | 90 | 90 |
| β/° | 90 | 93.680 (2) |
| γ/° | 90 | 90 |
| Volume/Å3 | 1948.75 (5) | 2120.06 (8) |
| Z | 4 | 4 |
| ρcalc/(g/cm3) | 1.293 | 1.277 |
| F (000) | 808.0 | 872.0 |
| 2θ range for data collection/° | 3.340 to 72.258 | 6.002 to 57.394 |
| Goodness-of-fit on F2 | 1.025 | 1.100 |
| Rint | 0.0613 | 0.0502 |
| R1 indexes [I ≥ 2σ (I)] | 0.0590 | 0.0534 |
| ωR2 indexes [all data] | 0.1280 | 0.1496 |
| CCDC No. | 2283803 | 2360637 |
| Compound | DC-O (Å) | ΔDC-O (Å) | Proton Transfer |
|---|---|---|---|
| (PRO)−(4AMP)+ | C1-O1:1.251, C1-O2:1.263 | 0.012 | Yes |
| (PRO)−(4DAP)+ | C1-O1:1.265, C1-O2:1.241 | 0.024 | Yes |
| D-H⋯A | D-H(Å) | H⋯A(Å) | D⋯A(Å) | D-H⋯A(°) | Symmetry |
|---|---|---|---|---|---|
| (PRO)−(4AMP)+ | |||||
| N2+-H2⋯O2− | 0.861 | 1.885 | 2.732 (3) | 167.36 | |
| N3-H3A⋯O1 | 0.860 | 1.965 | 2.812 (3) | 167.77 | x, −1/2 + y, 3/2 − z |
| N3-H3B⋯O2− | 0.861 | 2.042 | 2.888 (3) | 167.51 | 1 − x, −1/2 + y, 3/2 − z |
| C12-H12B⋯O3 | 0.970 | 2.585 | 3.268 (3) | 127.55 | 1 + x, y, z |
| C14-H14⋯O4 | 0.930 | 2.529 | 3.203 (3) | 129.62 | −1/2 + x, 1/2 − y, 1 − z |
| C18-H18⋯O4 | 0.930 | 2.556 | 3.357 (3) | 144.50 | 1/2 + x, 1/2 − y, 1 − z |
| (PRO)−(4DAP)+ | |||||
| N2+-H2⋯O1− | 0.859 | 1.858 | 2.7130 (19) | 172.85 | |
| C10-H10C⋯O4 | 0.961 | 2.573 | 3.465 (19) | 154.49 | x, 1 + y, z |
| C14-H14⋯O2 | 0.930 | 2.350 | 3.213 (2) | 154.29 | −1 + x, y, z |
| C18-H18⋯O2 | 0.930 | 2.356 | 3.036 (2) | 129.74 |
| Compound | Equilibrium Solubility (mg/mL) | The Increasing Factor |
|---|---|---|
| PRO | 4.61 | |
| (PRO)−(4AMP)+ | 658.45 | 142.83 |
| (PRO)−(4DAP)+ | 35.71 | 7.75 |
| D-H⋯A | H⋯A (Å) | ρ (a.u.) | ∇2ρ (a.u.) | G (a.u.) | V (a.u.) | H (a.u.) | EH (kcal/mol) |
|---|---|---|---|---|---|---|---|
| PRO | |||||||
| O1-H1⋯O2 | 1.796 | 0.0338 | 0.1434 | 0.0343 | −0.0328 | 0.0016 | −6.79 |
| (PRO)−(4AMP)+ | |||||||
| N2+-H2⋯O2− | 1.885 | 0.0297 | 0.1267 | 0.0288 | −0.0260 | 0.0028 | −10.95 |
| N3-H3A⋯O1 | 1.965 | 0.0224 | 0.1078 | 0.0228 | −0.0186 | 0.0042 | −8.50 |
| N3-H3B⋯O2− | 2.042 | 0.0195 | 0.0850 | 0.0180 | −0.0147 | 0.0033 | −7.54 |
| C12-H12B⋯O3 | 2.585 | 0.0076 | 0.0273 | 0.0059 | −0.0049 | 0.0010 | −3.59 |
| C14-H14⋯O4 | 2.529 | 0.0080 | 0.0308 | 0.0064 | −0.0052 | 0.0013 | −3.71 |
| C18-H18⋯O4 | 2.556 | 0.0080 | 0.0271 | 0.0059 | −0.0049 | 0.0009 | −3.74 |
| (PRO)−(4DAP)+ | |||||||
| N2+-H2⋯O1− | 1.858 | 0.0311 | 0.1332 | 0.0305 | −0.0277 | 0.0028 | −11.41 |
| C10-H10C⋯O4 | 2.573 | 0.0008 | 0.0039 | 0.0007 | −0.0004 | 0.0003 | −1.33 |
| C14-H14⋯O2 | 2.350 | 0.0104 | 0.0397 | 0.0081 | −0.0062 | 0.0019 | −4.52 |
| C18-H18⋯O2 | 2.356 | 0.0128 | 0.0473 | 0.0100 | −0.0082 | 0.0018 | −5.30 |
| Compound | EL (kcal/mol) | EHF (kcal/mol) |
|---|---|---|
| PRO | −64.87 | −14.33 |
| (PRO)−(4AMP)+ | −41.84 | −96.95 |
| (PRO)−(4DAP)+ | −50.62 | −95.84 |
Disclaimer/Publisher’s Note: The statements, opinions and data contained in all publications are solely those of the individual author(s) and contributor(s) and not of MDPI and/or the editor(s). MDPI and/or the editor(s) disclaim responsibility for any injury to people or property resulting from any ideas, methods, instructions or products referred to in the content. |
© 2024 by the authors. Licensee MDPI, Basel, Switzerland. This article is an open access article distributed under the terms and conditions of the Creative Commons Attribution (CC BY) license (https://creativecommons.org/licenses/by/4.0/).
Share and Cite
Zhang, M.; Hou, X.; Yu, F.; Zhang, L.; Hou, B.; Zhou, L.; Xie, C.; Wu, S.; Chen, W. Synthesis, Characterization, and Analysis of Probenecid and Pyridine Compound Salts. Crystals 2024, 14, 670. https://doi.org/10.3390/cryst14070670
Zhang M, Hou X, Yu F, Zhang L, Hou B, Zhou L, Xie C, Wu S, Chen W. Synthesis, Characterization, and Analysis of Probenecid and Pyridine Compound Salts. Crystals. 2024; 14(7):670. https://doi.org/10.3390/cryst14070670
Chicago/Turabian StyleZhang, Menglong, Xinyu Hou, Fuhai Yu, Liang Zhang, Baohong Hou, Lina Zhou, Chuang Xie, Songgu Wu, and Wei Chen. 2024. "Synthesis, Characterization, and Analysis of Probenecid and Pyridine Compound Salts" Crystals 14, no. 7: 670. https://doi.org/10.3390/cryst14070670