Article

A Visualized Microstructure Evolution Model Integrating an Analytical Cutting Model with a Cellular Automaton Method during NiTi Smart Alloy Machining

1
School of Mechanical Engineering and Automation, Northeastern University, Shenyang 110819, China
2
School of Control Engineering, Northeastern University at Qinhuangdao, Qinhuangdao 066004, China
3
Liaoning Provincial Key Laboratory of Intelligent Design and Manufacturing Technology for Large Equipment, Northeastern University, Shenyang 110819, China
4
Shanghai Electro-Mechanical Engineering Institute, Shanghai 201109, China
*
Author to whom correspondence should be addressed.
Crystals 2024, 14(8), 672; https://doi.org/10.3390/cryst14080672
Submission received: 26 June 2024 / Revised: 16 July 2024 / Accepted: 18 July 2024 / Published: 23 July 2024

Abstract

:
In this study, a visualized microstructure evolution model for the primary shear zone during NiTi smart alloy machining was established by integrating an analytical cutting model with a cellular automaton method. Experimental verification was conducted using an invented electromagnet rotation-type quick-stop device. The flow stress curve during the dynamic recrystallization of the NiTi smart alloy, the influence of relevant parameters on the dynamic recrystallization process, and the distribution of dynamic recrystallization in the primary shear zone were studied via the model. The simulation results showed that strain rate and deformation temperature significantly affect the relevant parameters during the dynamic recrystallization process. Three typical shear planes were selected for a comparison between simulation results and experimental results, with a minimum error of 3.76% and a maximum error of 11.26%, demonstrating that the model accurately simulates the microstructure evolution of the NiTi smart alloy during the cutting process. These results contribute theoretical and experimental insights into understanding the cutting mechanism of the NiTi smart alloy.

1. Introduction

As a new type of functional material, the NiTi smart alloy (NSA) has a unique shape memory effect and outstanding mechanical properties, which make it broadly employed in aerospace, biomedical, and other fields [1,2,3,4]. However, this alloy is sensitive to mechanical-thermal loads. While cutting, the workpiece material in the primary shear zone (PZ) undergoes shearing/slipping deformation, resulting in chip formation and machined surfaces. Therefore, modeling research on the microstructure evolution of the PZ is critical for understanding the cutting mechanism of the NSA.
A series of NSA cutting investigations were conducted. Kaynak et al. [5] revised and verified the NSA constitutive model considering mechanical-thermal loads and chip morphology. R Piquard et al. [6] studied burr formation during NSA micro-milling and found that feed rate and cutting width significantly impacted burr size. Zhao Yanzhe et al. [7] studied the NSA turning mechanism through experiments, focusing on chip formation characteristics at different cutting velocities. Their research results provided insights into material flow characteristics and offered suggestions for improving NSA processing technology. Zhao Yanzhe et al. [8] proposed a critical condition for NSA martensitic stress-driven metamorphism during cutting based on mechanical-thermal loads. Rosnan et al. [9] introduced nano-strengthened micro-lubrication into NSA drilling and found that nano-coated drills under nano-strengthened micro-lubrication conditions resulted in better processing performance than uncoated drills under wet conditions. Zailani et al. [10] applied low-temperature air micro-lubrication technology to NSA micro-milling and found that it significantly reduced tool wear and burr size, thereby enhancing surface quality. Kaynak et al. [11] introduced liquid nitrogen into NSA turning and found that low-temperature liquid nitrogen improved surface quality and significantly impacted phase transition characteristics. Liu Zhanqiang et al. [12] proposed a milling-electrochemical polishing process for the NSA, revealing reaction and polishing mechanisms that further improved the surface quality. Kaya et al. [13] studied the anti-wear performance of PCD tools for NSA turning and found excellent wear resistance at all cutting velocities. Kaynak et al. [14] studied the impact of cooling/lubrication conditions on tool wear during NSA cutting, demonstrating that low-temperature processing could significantly reduce tool wear degree. Kaynak et al. [15] simulated austenite–martensite transformation in NSA dry cutting and found that surface fracture and deformation layer depth were mainly affected by cutting velocity. These researchers [16] also explored how cutting velocity affected the surface integrity of the NSA in a low-temperature, dry cutting process, revealing that increasing the cutting velocity reduced subsurface hardness and increased the latent heat of phase transformations.
The NSA’s cutting characteristics are largely dependent on its microstructural properties, such as grain boundary distribution, grain size, and grain density. Therefore, studying the microstructure evolution during cutting is essential for enhancing the performance of NSA products. Dynamic recrystallization (DRX) is a major mode of microstructure evolution during high mechanical-thermal cutting processes, and the resulting changes in grain size directly affect the performance of NSA products. Thus, analyzing the DRX process during high-temperature cutting is crucial for studying the NSA cutting mechanism.
Several studies have focused on understanding the mechanism of DRX. Du et al. [17] studied the DRX mechanism of α and β phases during the isothermal compression of Ti55 composites and discussed the influence of TiBw on DRX. Kuan huang et al. [18] studied the DRX mechanism of Cu-15Ni-8Sn alloy ingots at varying extrusion ratios through hot extrusion experiments. They found that increasing the extrusion ratio led to a decrease in average grain size. Liu G et al. [19] used a cross-scale modeling technique by combining cellular automata and finite element methods to replicate the microstructure development of shear bands during Ti-6Al-4V cutting process. The simulation findings revealed that a higher compression temperature and lower strain rate both significantly promoted the DRX process. These studies contributed to a better understanding of DRX mechanisms, providing insights that can guide improvements in NSA cutting processes.
Most studies on DRX processes of metal materials rely on experimental methods, which are time-consuming, costly, and may not fully elucidate the underlying DRX mechanisms. In contrast, simulation methods offer a more efficient approach to studying microstructure evolution, making it of significant theoretical importance.
The cellular automaton (CA) method is commonly utilized in microstructure modeling because of its simplicity and efficiency. In the early 1990s, Goetz et al. [20] successfully employed the CA method to simulate DRX during high-temperature cutting based on the evolutionary hypothesis of dislocation density. Subsequently, DING et al. [21] simulated a DRX phenomenon in pure copper during high-temperature processing using CA methods. LI et al. [22] developed a topological deformation-based CA model to simulate the DRX process of the TA15 alloy, validating it against experimental results. Feng Zhou et al. [23] established a modified constitutive model derived from dislocation density evolution and developed a DRX model incorporating strain rate and deformation temperature using CA methods. This comprehensive model considered dislocation density evolution, nucleation, and grain growth processes with high precision. Jiawei Xu et al. [24] improved traditional CA models by implementing a non-uniform nucleation method, demonstrating enhanced model correctness through isothermal compression experiments. Jinheung Rark et al. [25] coupled crystal plasticity finite element methods with CA methods to establish a microstructure evolution model for the mechanical-thermal processing of AISI304LN stainless steel, validating the model’s accuracy through experiments.
This study designed a simulation analysis method based on the CA method to model DRX in the PZ during NSA cutting, focusing on the evolution of internal grain microstructures. The method enabled statistical analysis of the variation laws of grain size, flow stress, and other parameters, thereby exploring the microscopic mechanisms and dynamic laws governing the DRX process of NSA. The findings of this study provide a theoretical foundation for managing microstructure evolution and offer guidance for improving cutting performance.

2. Materials and Methods

2.1. Experimental

2.1.1. Experimental Material

The physical properties of the Ni50.8Ti49.2 (at%) chosen for the experiments are detailed in Table 1. Before the experiment, the workpiece with dimensions of 25 mm × 25 mm × 4 mm was grinded, polished and corroded using a solution with a ratio of HF/HNO3/H2O = 1:2:5 at room temperature for 1 min.

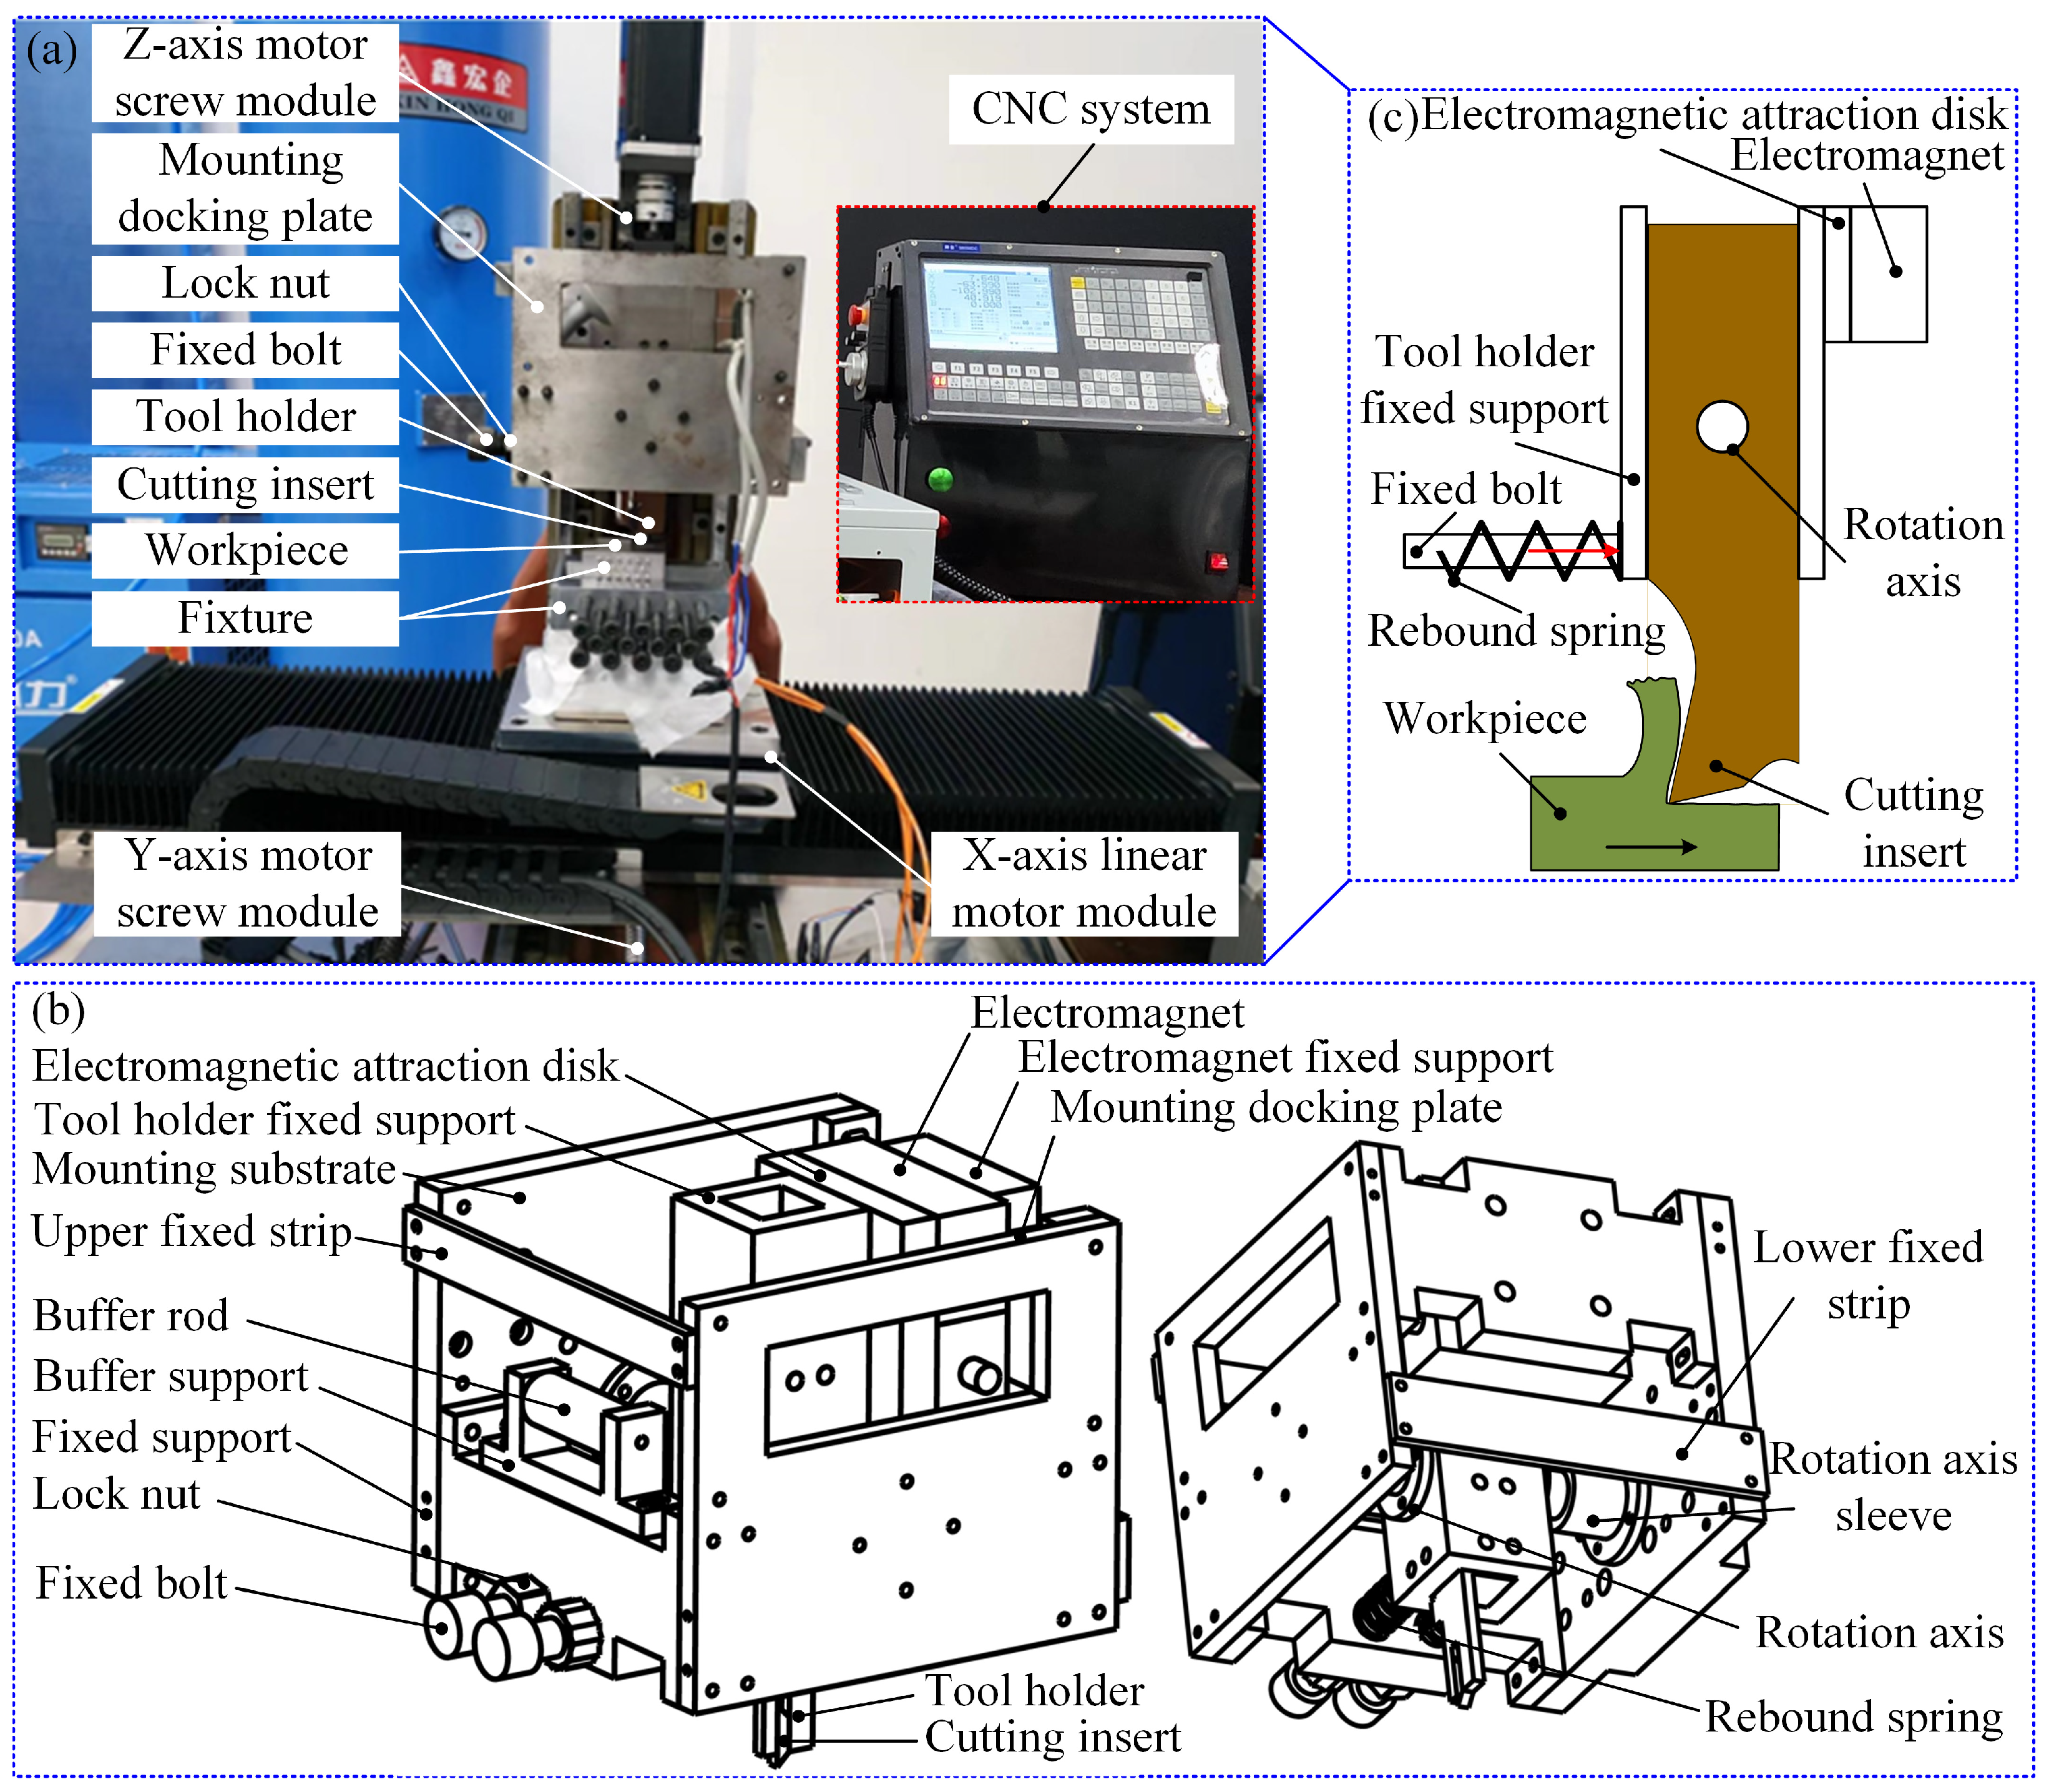
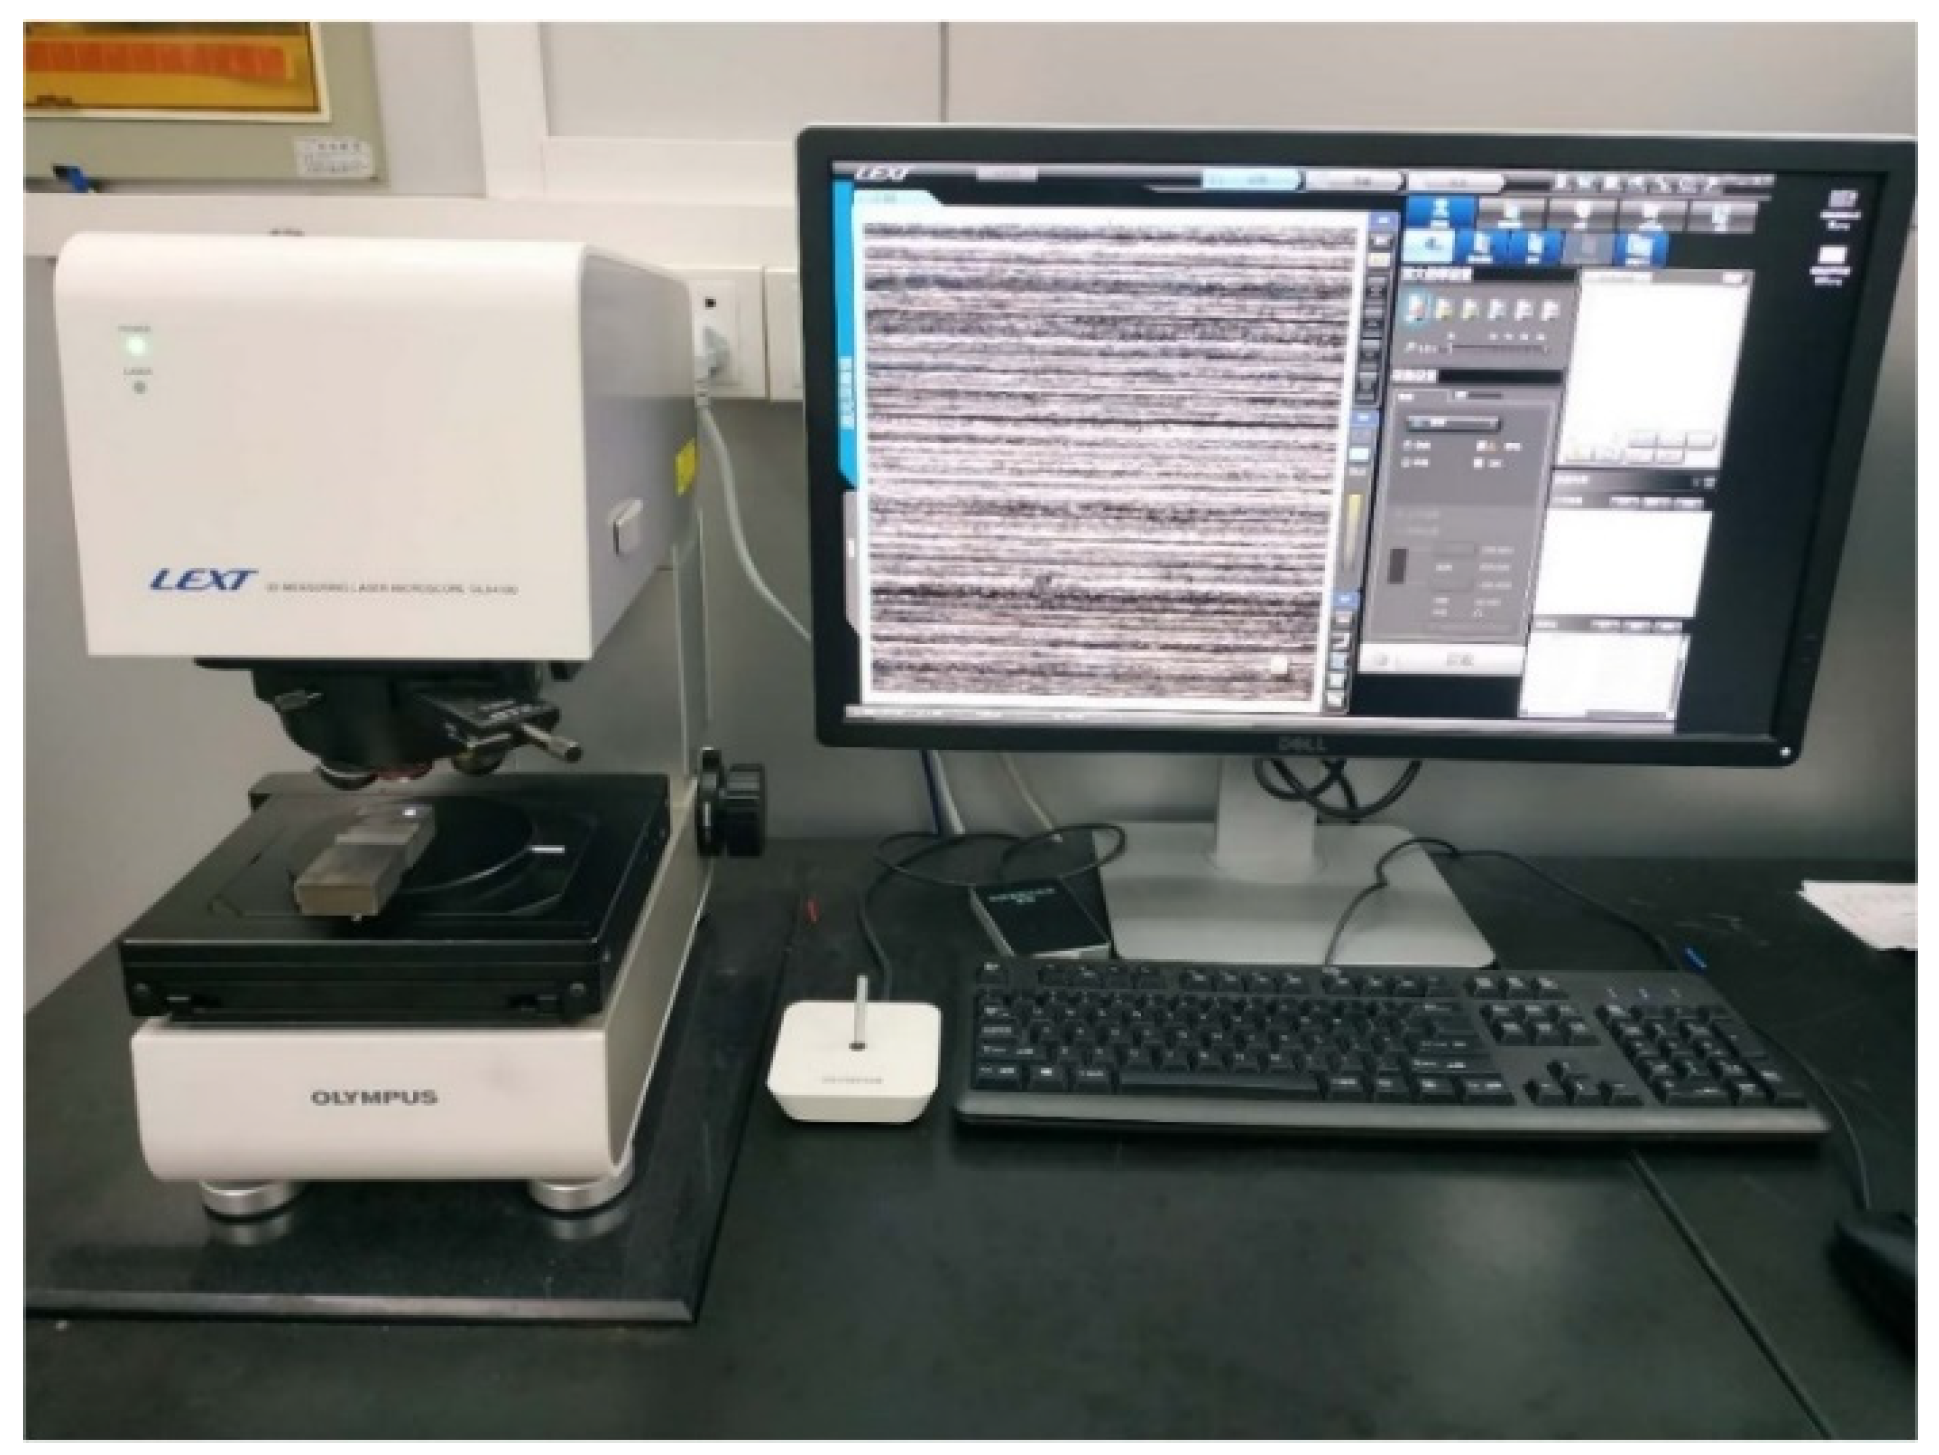
2.1.2. Experimental Device

The experimental parameters are detailed in Table 2. To capture the microstructure evolution of the PZ during cutting, it is necessary to preserve the instantaneous cutting state. This study introduced an electromagnet rotation-type quick-stop device for “freezing” the cutting state at specific moments. Unlike traditional quick-stop device that uses high-pressure gas explosion shocks or springs, this device offers precise control and minimal delay through rapid electrical signal control, ensuring accurate “freezing” of the instantaneous cutting state. An illustrated diagram of this device is shown in Figure 1.
The grain microstructure was observed using a laser confocal microscope (OLS4100-Olympus Corporation, Tokyo, Japan), as shown in Figure 2.

2.2. Cutting Model

The input parameters for the CA model mainly included strain, strain rate, temperature, and shear stress in the PZ. In this study, an analytical modeling method was used to determine those parameters.

2.2.1. Constitutive Model

The Johnson–Cook material plasticity constitutive model, widely used in high-temperature metal alloy cutting [26,27], was adopted as the foundation for the modeling. The specific formula is as follows:
τ = [ A + B ε n ] [ 1 + C ( ε ˙ ε ˙ 0 ) ] [ 1 ( T T r T m T r ) m ]
where ε represents strain, ε ˙ represents strain rate in s−1, Tr stands for the reference temperature in K, Tm for the melting temperature of the workpiece material in K, and T represents the instantaneous deformation temperature in K. A, B, C, n, m and ε ˙ 0 are constitutive parameters of the model, with their values being detailed in Table 3.

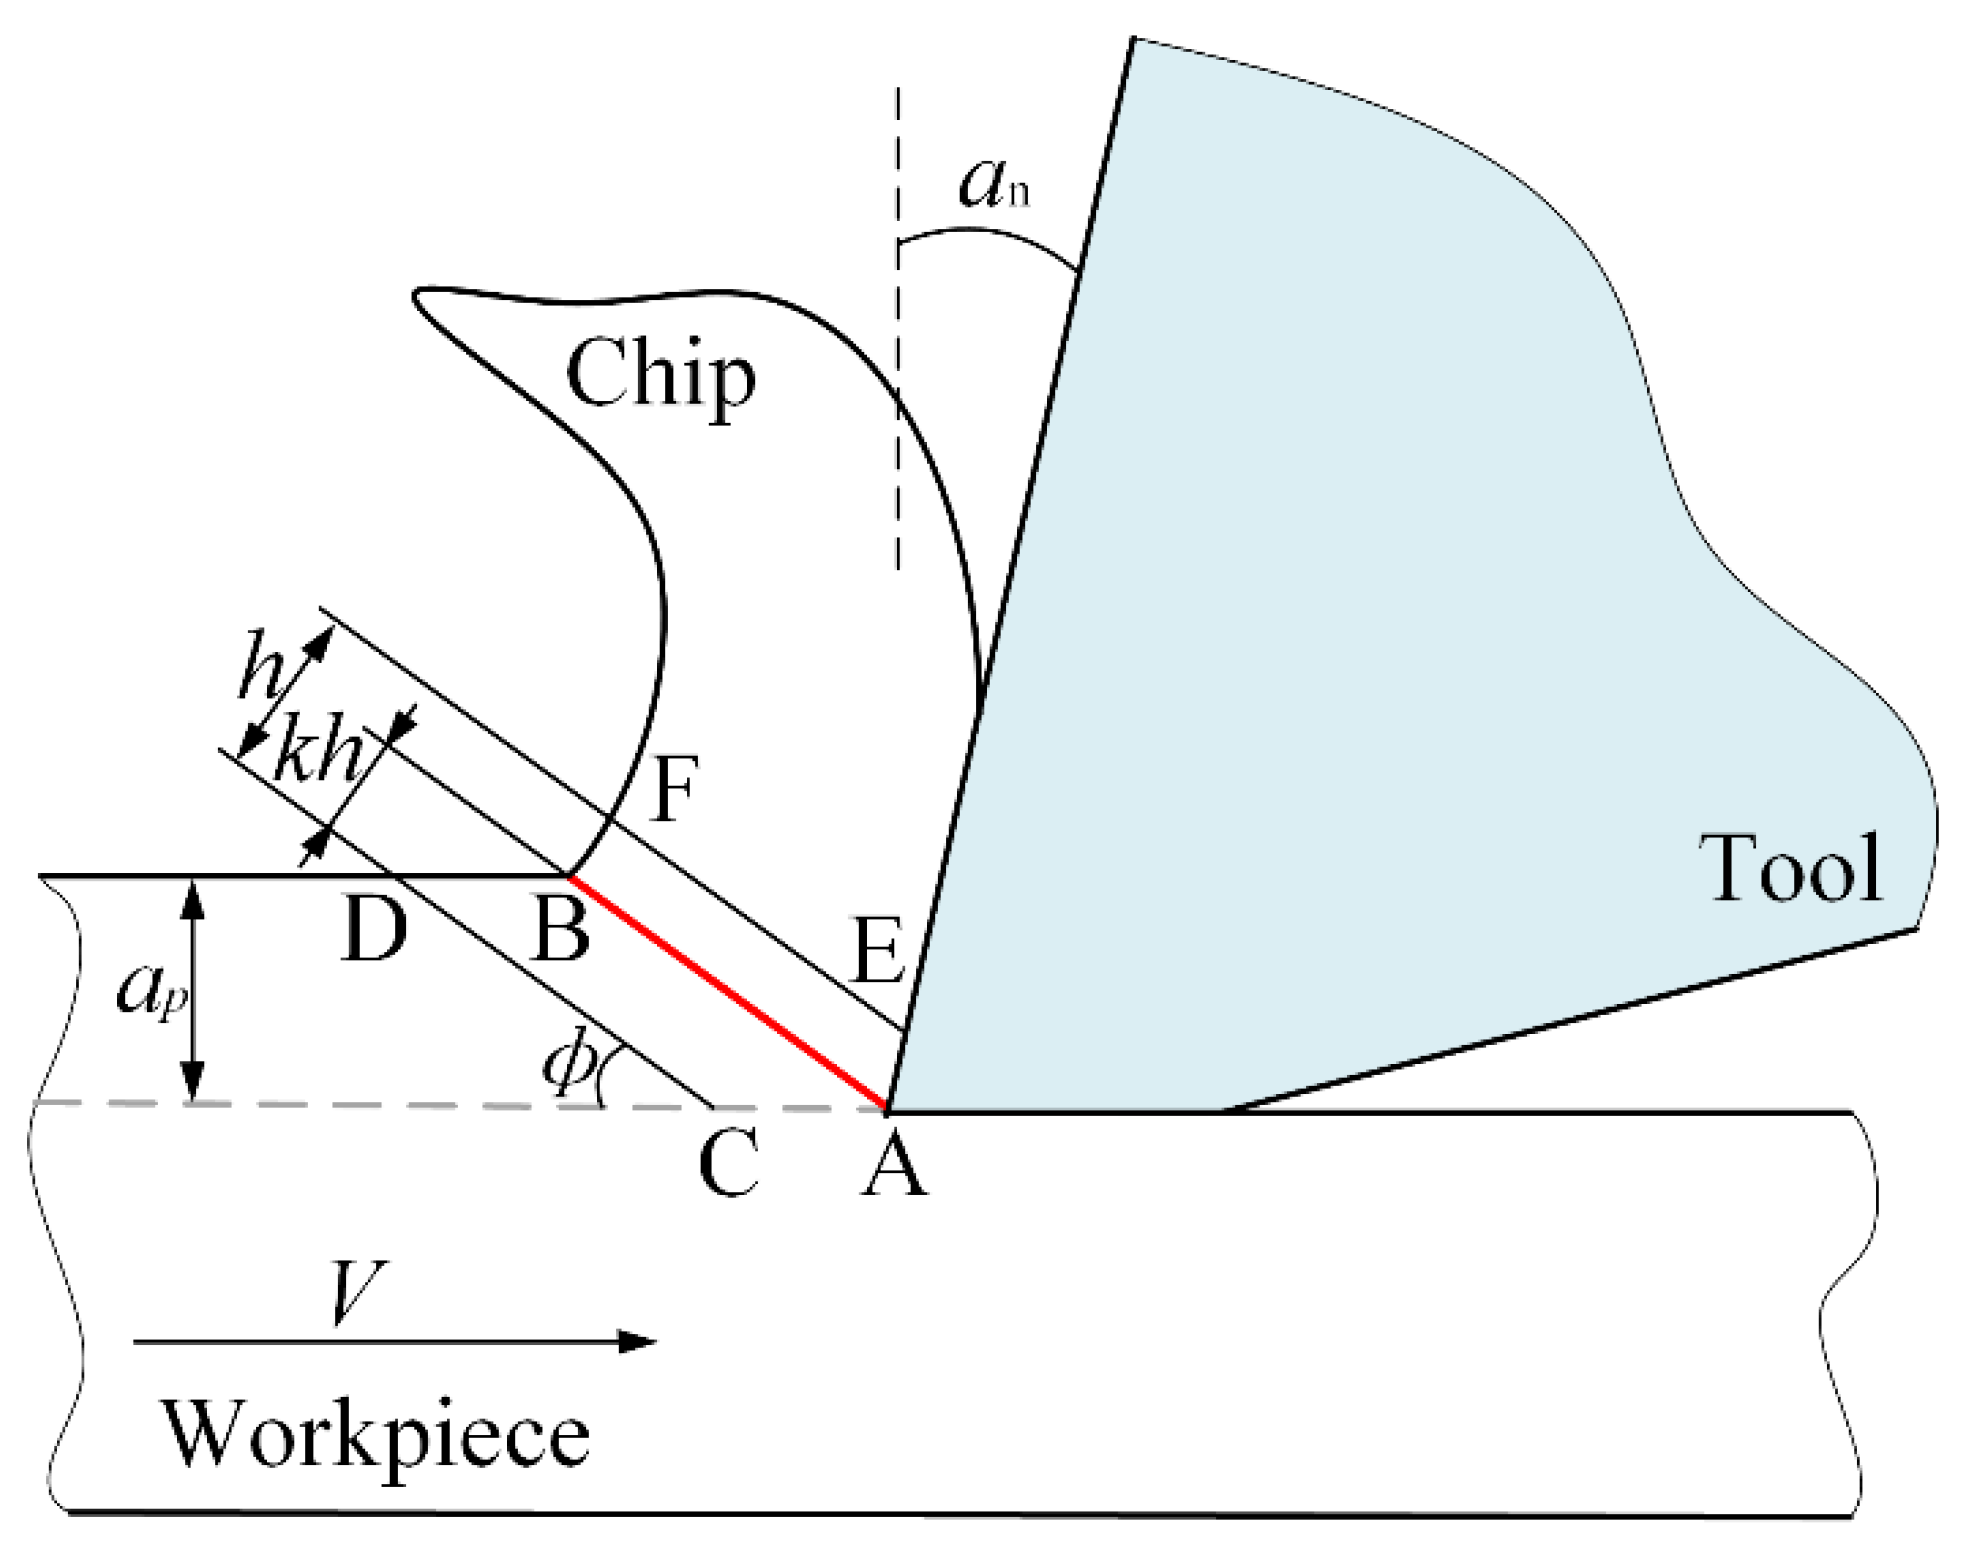
2.2.2. Unequal Shear Zone Model

The PZ is an extremely narrow region. While cutting, the PZ experiences significant strain rates. This study adopted the unequal shear zone model proposed by Astakhov [28], which splits the PZ into two parts of unequal length. A schematic diagram of the model is shown in Figure 3.

2.2.3. Solution of the Strain Rate and Strain Distributions in the PZ

The linear distribution equation proposed by Tounsi et al. [29] was used to determine the strain rate distribution in the PZ, shown as follows:
ε ˙ = y q ( k h ) q ε ˙ m y [ 0 , k h ] ( h y ) q ( 1 k ) q h q ε ˙ m y [ k h , h ]
where h represents the width of the PZ, set to a typical value of 0.025 mm; q represents the inconsistent distribution characteristics of tangential velocity, set to 7; k represents the PZ unequal division coefficient, calculated using Equation (3); and ε m ˙ represents the maximum strain rate, calculated using Equation (4), as follows:
k = cos ϕ cos ϕ α n cos α n
ε ˙ m = cos α n V q + 1 h cos ϕ α n
where V represents the cutting velocity in m/s; ϕ represents the shear angle and is shown in Figure 1, calculated using Equation (5):
ϕ = π 2 β α n 4
where β represents the friction angle, calculated using Equation (6):
β = tan 1 μ
where μ represents the frictional coefficient, calculated using cutting forces measured through the cutting experiment, as shown in Equation (7):
μ = F z cos α n + F x sin α n F z sin α n F x cos α n
The shear strain distribution in the PZ can be determined through the integration of ε ˙ with the following formula:
ε = y q + 1 ( q + 1 ) V sin ϕ n ( k h ) q ε ˙ m y [ 0 , k h ] ( h y ) q + 1 ( q + 1 ) V sin ϕ n ( 1 k ) q h q ε ˙ m + h ε ˙ m ( q + 1 ) V sin ϕ n y [ k h , h ]

2.2.4. Solution of the Temperature and Shear Stress Distributions in the PZ
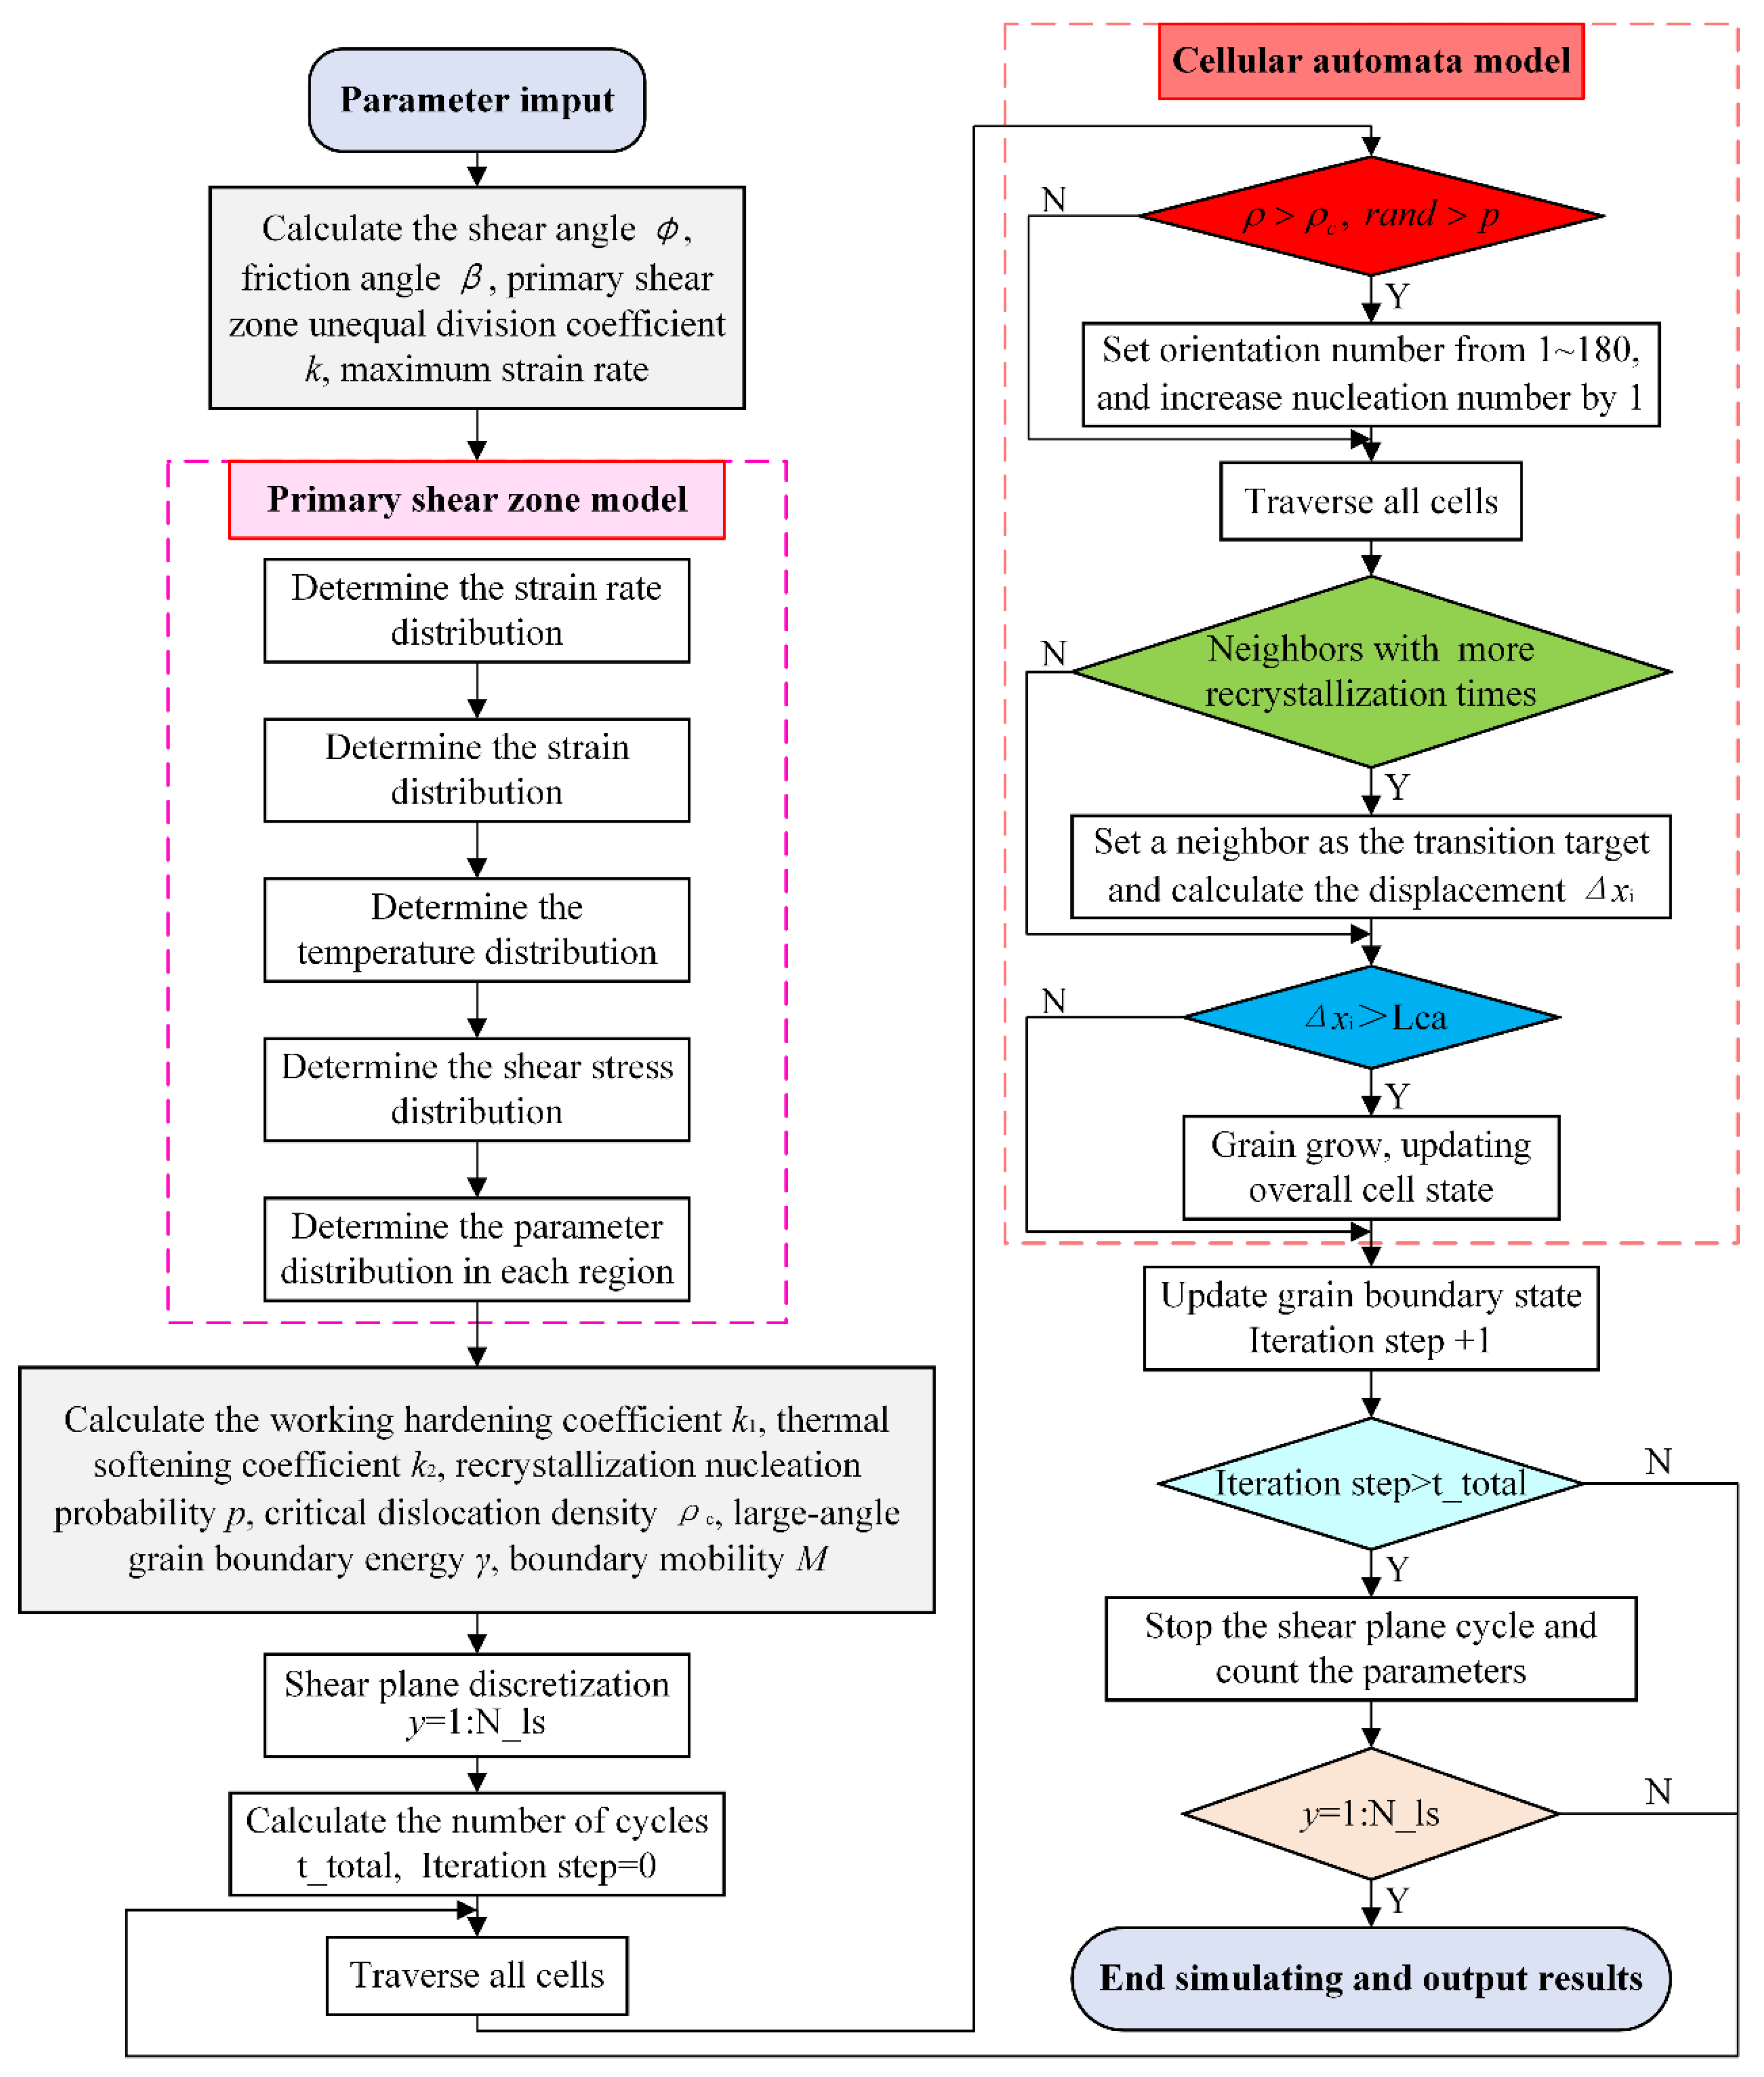
To determine the shear stress distribution in the PZ, it was necessary to obtain the deformation temperature distribution through the conventional two-dimensional heat conduction equation, which is given by
λ 2 T y 2 ρ c V T y + μ τ ε ˙ = ρ c T t
where λ represents thermal conductivity in W/(m·K); ρ represents density in kg/m3; c represents specific heat capacity in J/kg; μ represents the Taylor–Quinney coefficient, set to 0.85; and τ represents the shear stress in MPa derived from Equation (1) through a shear conversion coefficient, which can be solved using Equation (10):
τ = 1 3 [ A + B ε 3 n ] [ 1 + C ( ε ˙ ε ˙ 0 ) ] [ 1 ( T T r T m T r ) m ]
To assess the DRX situation on different shear planes, discrete methods were employed. The PZ was divided into discrete shear planes, allowing to calculate relevant parameters for each shear region using Equation (11).
ε ˙ i = ε ˙ i + ε ˙ i + 1 / 2 ε i = ε i + 1 ε i T i = T i + T i + 1 / 2 τ i = τ i + τ i + 1 / 2

2.3. CA Model

2.3.1. Simulation Conditions

Figure 4 displays the settings of the CA model. The simulated region is a 400 × 400 two-dimensional cellular space, with each unit cell size (Lca) being 4 μm. The material parameters used for the CA model are detailed in Table 4.
Five different functional state parameters were assigned to cells, as follows:
(1)
Dislocation density variable was used to record the dislocation density of cells, and the initial dislocation density was uniformly set to 1 × 10¹⁰ m−2 [31].
(2)
Orientation number variable was used to distinguish recrystallized grains with an orientation number ranging from 1 to 180.
(3)
Grain boundary variable was used to identify cells on the grain boundaries.
(4)
Recrystallization state variable was used to differentiate between initial tissue cells and recrystallized cells.
(5)
Recrystallization times variable was used to record the number of cell recrystallization times.

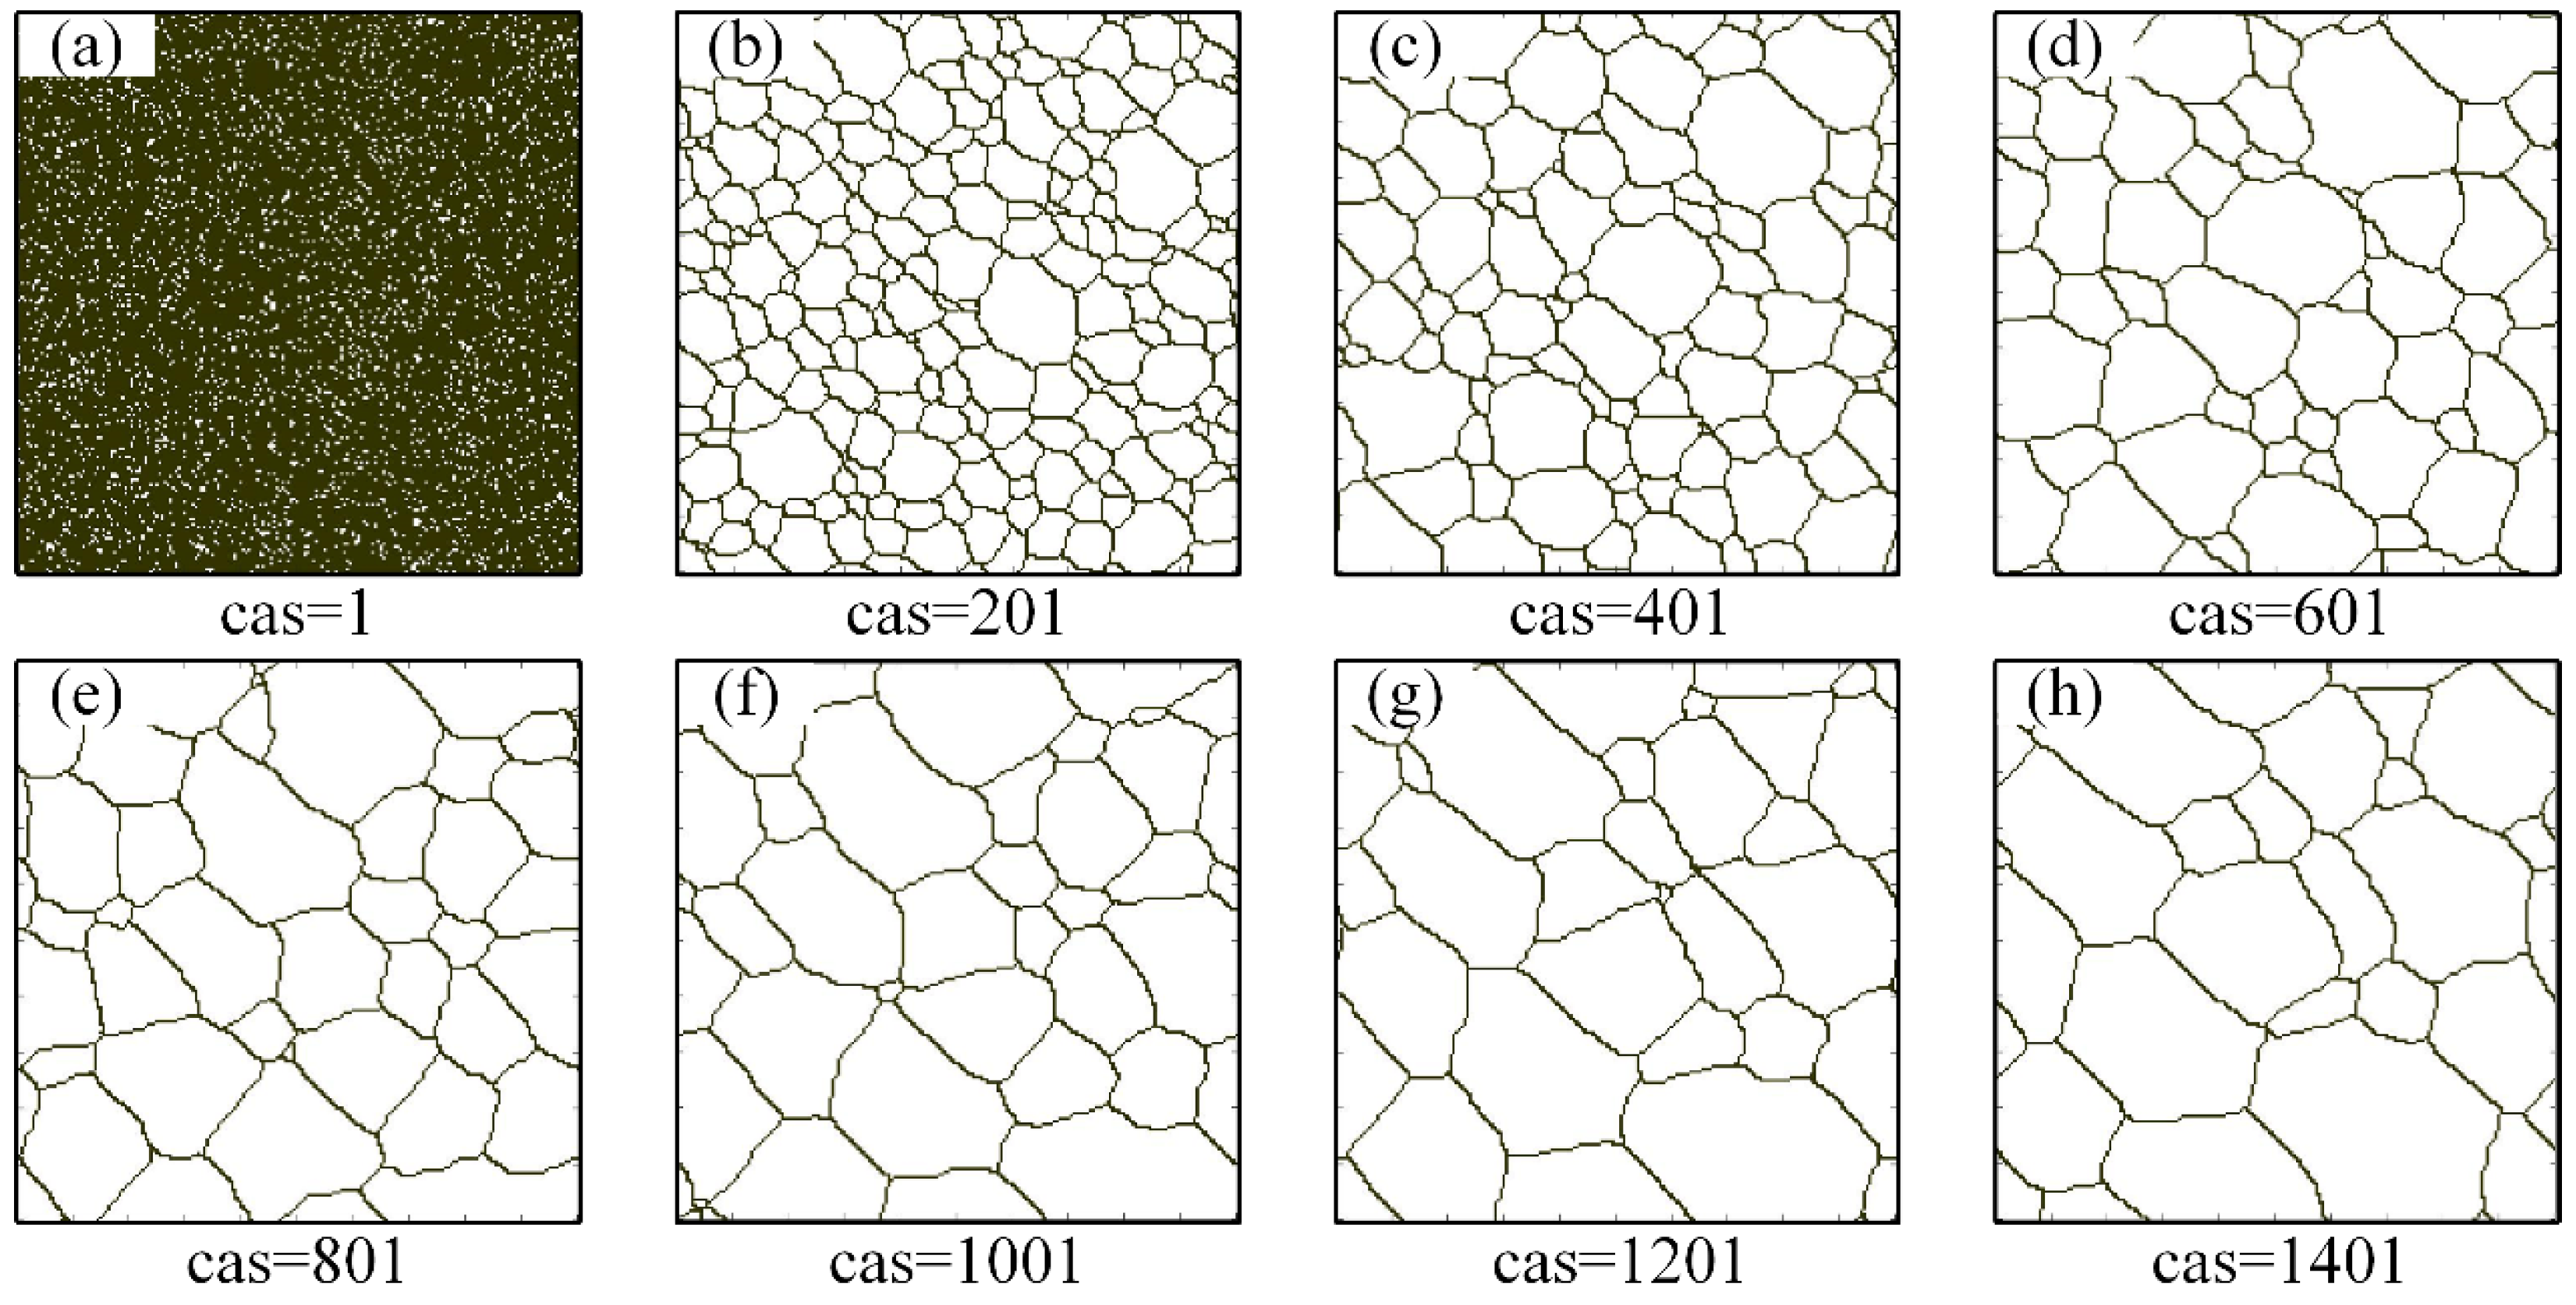
2.3.2. Formation of the Initial Austenite Microstructure

The CA model for simulating the initial austenite microstructure was based on certain cellular rules outlined, as follows: (1) If a cell was surrounded by three or more neighboring cells with the same orientation number, it would be homogenized by them at the next time step. (2) If a cell did not satisfy rule 1, it would randomly select a neighboring cell as the moving target. (3) The cell for rule 2 would compare the number of neighboring cells with the same orientation number before and after the movement. If the count of neighboring cells with the same orientation number increased after moving, the cell’s orientation number would match that of the target cell. Otherwise, the orientation number would remain unchanged.
The simulated images of the initial austenite microstructure at different time steps (cas) are shown in Figure 5. It is evident that with the evolution of microstructure, the grains continue to grow, mainly manifested as the boundary migration of large-volume grains through engulfing smaller-volume grains, resulting in an increase in average grain size.
The impact of the initial grain size on DRX was determined by comparing the simulation results, as shown in Figure 6. The colored grains represent recrystallized grains. It can be seen from the figure that the DRX degree increases, the impact of the initial structure on the DRX decreases. This simulation result is consistent with the findings of Zhang Yanqiu [32] and CAO zhuohan [33].
The initial microstructure used for the DRX model in this study is shown in Figure 7, which contained 160,000 cells with dimensions of 4 × 4 μm. The angle between adjacent three grain boundaries is approximately 120°.

2.3.3. Dislocation Density Evolution Model

The K-M dislocation density evolution model was used to predict the dislocation density of grains, which is shown as follows:
d ρ d ε = k 1 ρ k 2 ρ
where k1 and k2 represent the working hardening and thermal softening coefficients, calculated as follows:
k 1 = 2 × H T 0.5 × μ 1 × b k 2 = 2 × H T σ max
where σmax represents the maximum shear stress in MPa, HT represents hardening index, and b represents burgers vector in m.

2.3.4. Critical Dislocation Density

Roberts [34] proposed that one of the nucleation conditions for DRX is when the dislocation density (ρ) reaches its critical value (ρc). Equation (14) shows the solving method for this value:
ρ c = ( 20 γ ε ˙ 3 b l M τ 2 ) 1 / 3
where γ represents the large-angle grain boundary energy in J/m2, and M represents boundary mobility. They can be calculated as follows:
γ = μ 0 b θ 4 π ( 1 v ) ( 1 ln ( θ θ m ) ) θ > θ m μ 0 b θ m 4 π ( 1 v ) θ θ m M = δ D b b K T exp ( Q b R T )
where μ0 represents shear modulus in MN/m2; θ represents the orientation difference of grain boundaries; θm represents the orientation difference of the large-angle grain boundaries, set to 15°; v represents Poisson’s ratio; δDb represents the grain boundary diffusion coefficient; Qb represents the activation energy for grain boundary diffusion in KJ/mol; K represents the Boltzmann constant (taken as 1.3806505 × 10⁻²³); and R represents the gas constant.

2.3.5. Nucleation and Growth Model of the Recrystallized Grains

Once the dislocation density of the cells on the grain boundary reaches its critical value, grain nucleation occurs according to the recrystallization nucleation probability (p), calculated using the formula proposed by Kurtz [9]:
p = C 0 ε ˙ exp ( Q a c t / R T )
where Qact represents the nucleation activation energy in KJ/mol.
After nucleation, the grains continue to grow due to prolonged heating time. The driving force for growth of recrystallized grains depends on the difference between the deformation energy of recrystallized and initial grains, as shown in Equation (17):
Δ f i = τ ( ρ m ρ i ) 2 γ i r i
where ri represents grain radius in m, determined by converting the irregular shape of the grain into an equal-area circle, and ρm and ρi represent the dislocation density of initial and recrystallized grains, respectively.
The displacement increment of the ith recrystallized grain can be calculated using Equation (18):
Δ x i = M Δ f i Δ t
where ∆t represents a unit time step in s.

2.3.6. Flow Stress Model

This study employed the classical Taylor model to describe the relationship between flow stress and dislocation, which suggests that flow stress is proportional to the average dislocation density. The specific formula is shown as follows:
σ = α μ 1 b ρ ¯
where α is a coefficient, which was taken as 0.5 in this study.

2.4. Three-Dimensional Cellular Automata Model

The two-dimensional CA model can be extended to three-dimensional to make the simulation more realistic. The modeling of the three-dimensional model used the same method as the two-dimensional model, with the same neighbor rules and methods for random nucleation and equiaxed grain growth. The main difference was in the adjustments made for boundary conditions to accommodate the expanded dimensions; hence, the boundary conditions used in the two-dimensional model were no longer applicable in the three-dimensional model and needed to be reset according to the additional dimension. Figure 8 displays the simulation results of the three-dimensional model. It can be seen from the figure that the three-dimensional model has the same rules as those of the two-dimensional model.
Due to the additional dimension in the three-dimensional model, the statistical analysis of parameters such as grain size becomes much more complex. Thus, to manage this complexity, the model was divided into six sections by slicing. The grain parameters from these sections were then statistically analyzed and averaged to characterize the grain size of overall microstructure. Because of the geometric increase in computational space required compared to the two-dimensional model and the same cell rules, the model established above was not applied to the subsequent analysis.

2.5. Summary

Using this model, the DRX process in the PZ during the NSA cutting process can be simulated. The flow chart of modeling is shown in Figure 9, which mainly includes three parts: parameter input, PZ model, and CA model.

3. Results and Discussion
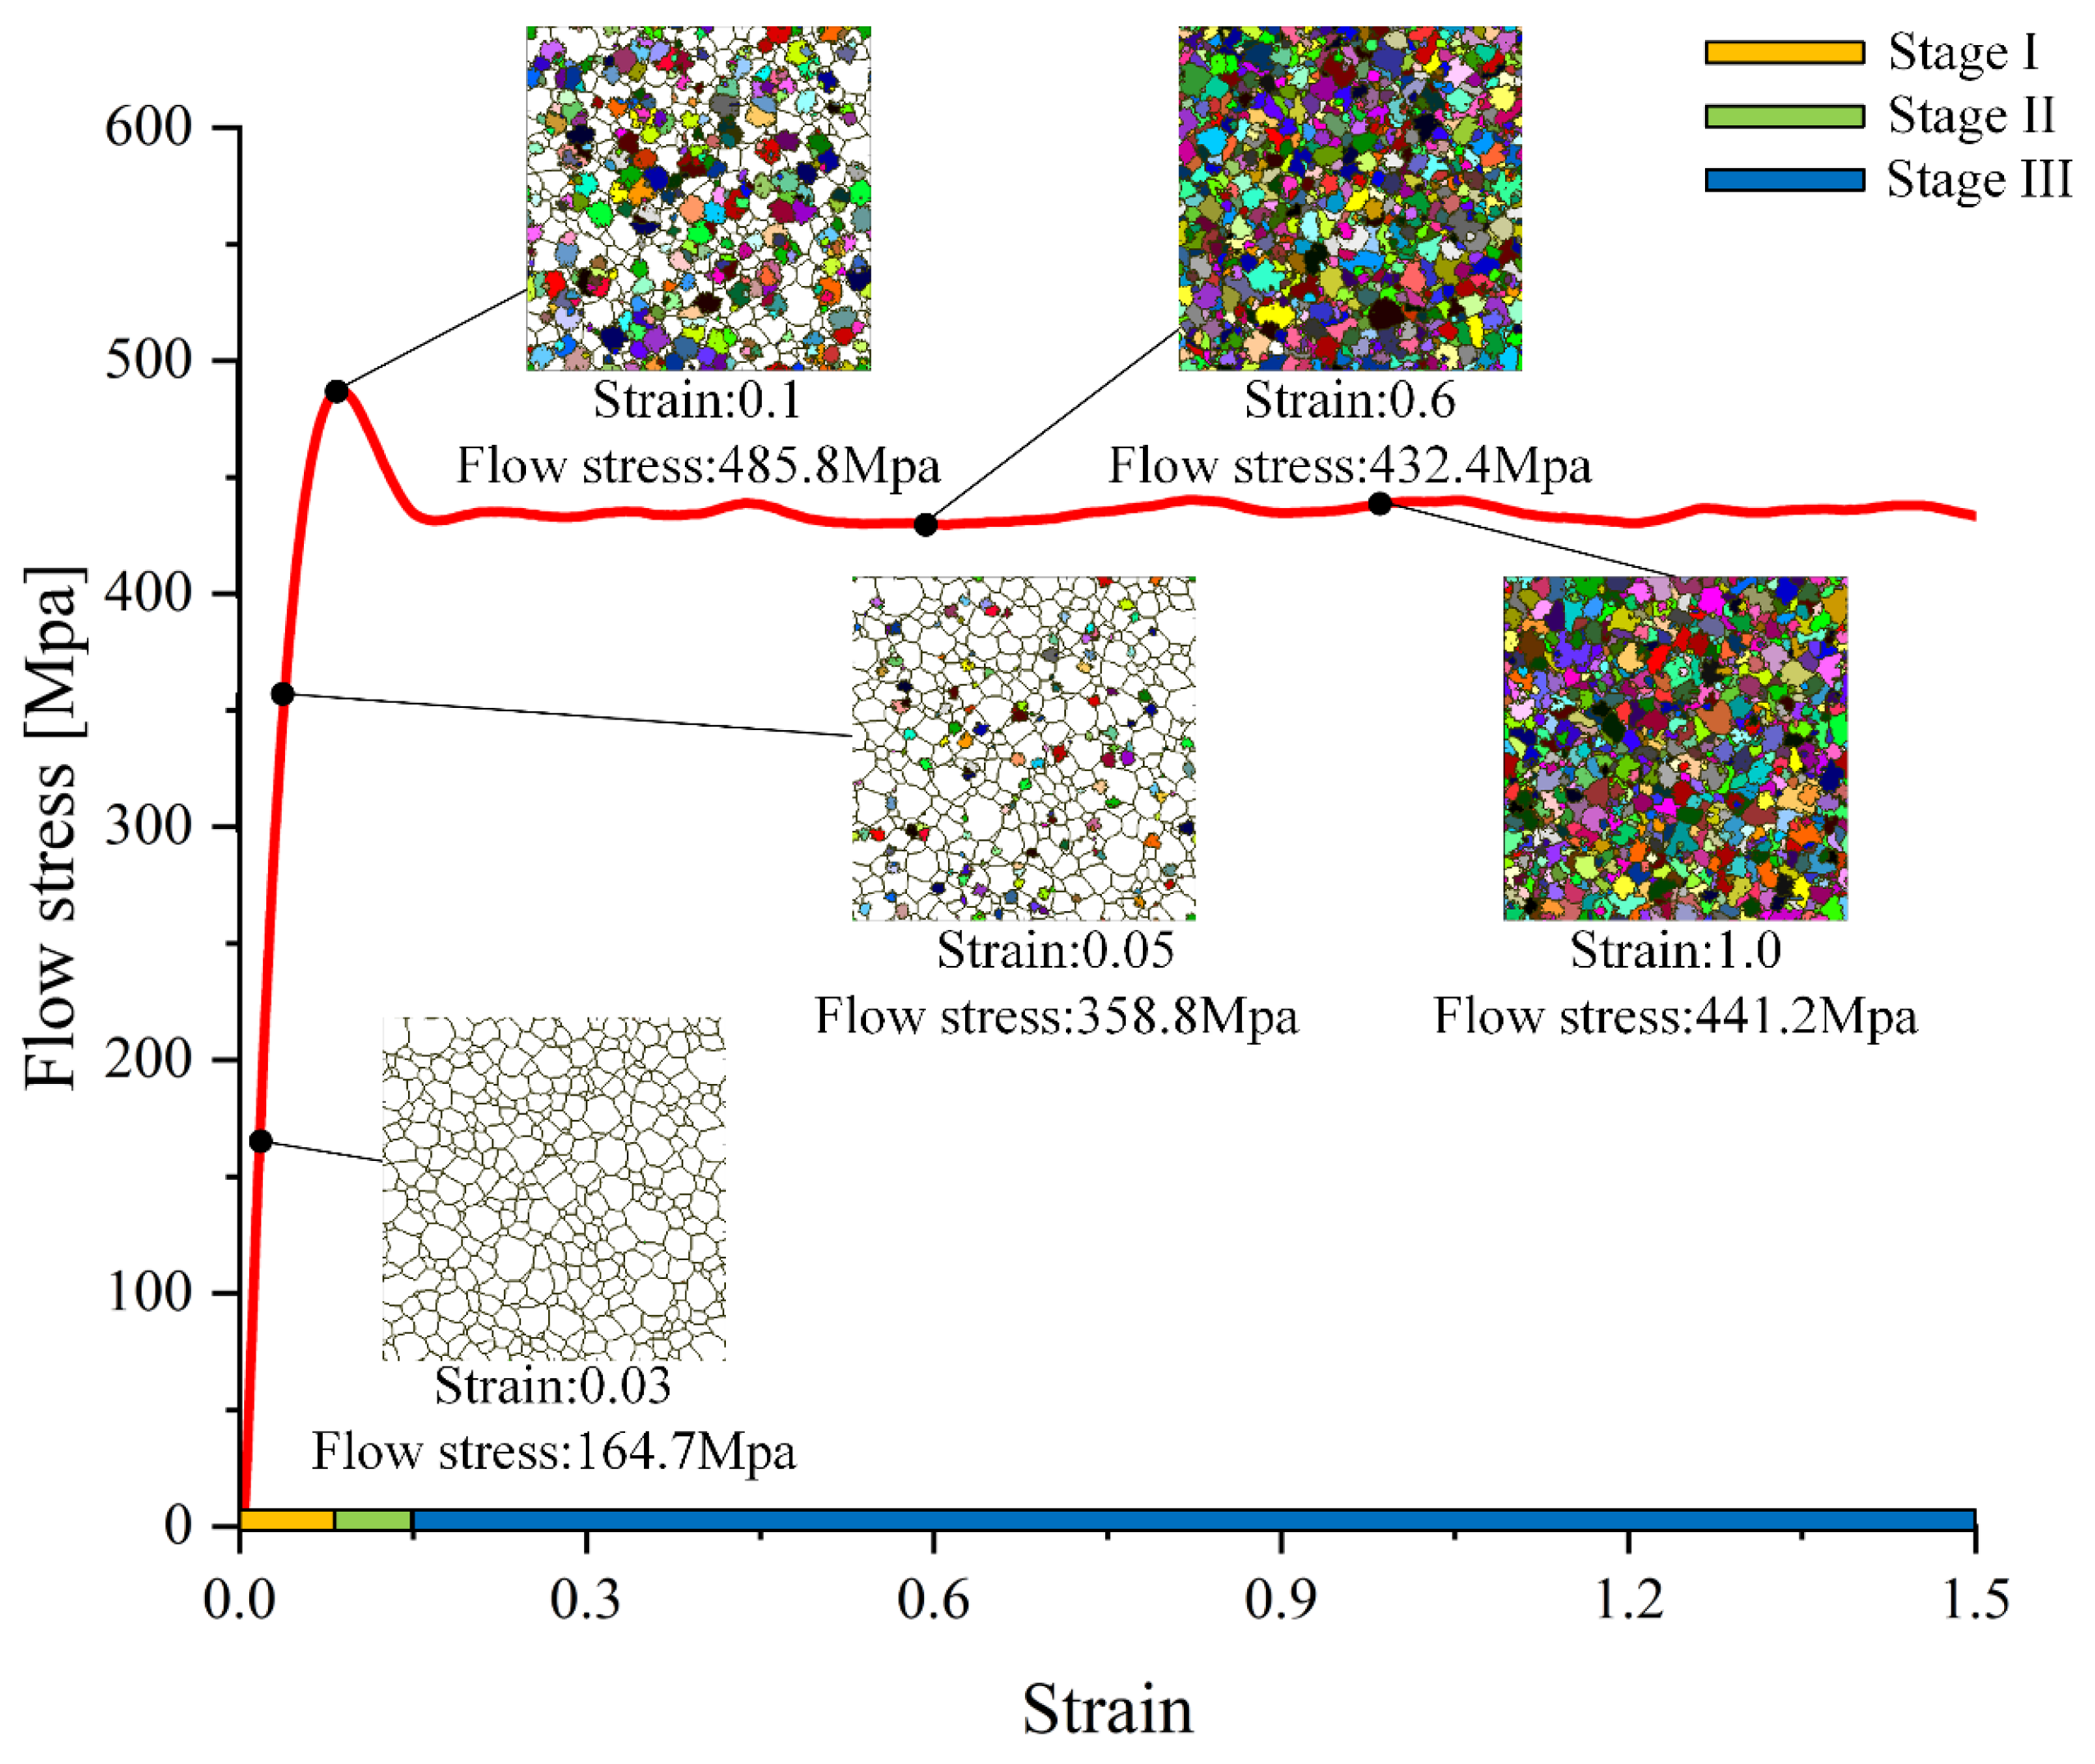
3.1. Flow Stress

According to the flow stress model established in Section 2.3.6, the flow stress varied proportionally with the average dislocation density. Figure 10 shows the flow stress curve during the DRX process, and Figure 11 illustrates the variation of dislocation density. From the figures, it is evident that the flow stress curve can be roughly separated into three stages.
Stage I ( ε < 0.1) was the preparation period for DRX. In this stage, only a small amount of DRX occurred, and the average dislocation density sharply increased (i.e., working hardening), as depicted in Figure 11a–c. Meanwhile, the thermal softening effect inside the material was far less significant compared to working hardening and insufficient to offset it. Therefore, the flow stress curve maintained an upward trend in this stage, as shown in Figure 10.
Stage II (0.1 < ε < 0.15) marked the onset of a large-scale DRX, characterized by numerous grain nucleation at the boundaries. During this stage, grains with a critical dislocation density nucleated based on nucleation probability, reducing the dislocation density back to the initial value, as shown in Figure 11d. The thermal softening effect inside the material gradually increased. When the flow stress curve hit its peak, the thermal softening effect exceeded the working hardening effect, causing the flow stress to decline.
Stage III ( ε > 0.15) was the steady-state stage, where thermal softening and working hardening effects reached a dynamic balance, and the average dislocation density of grains remained relatively stable, as depicted in Figure 11e,f. This resulted in a smooth flow stress curve with an extremely narrow fluctuation range.
The DRX model was simulated at various temperatures and strain rates, with the corresponding flow stress curves presented in Figure 12. From the figure, it is evident that at a temperature of 950 K, the flow stress curve showed no obvious peaks. This indicates that at this temperature, thermal softening was insufficient to counteract working hardening, resulting in an absence of prominent DRX during NSA cutting at 950 K. With increasing temperature, the stable value and peak point of the flow stress curve gradually decrease. This is attributed to the fact that high temperatures promote DRX by reducing dislocation slip resistance, leading to a more balanced state between working hardening and thermal softening.
The flow stress curves under different strain rates exhibited a similar trend, but with increasing strain rate, and the flow stress curve gradually transitioned from a fluctuating line to a nearly horizontal line. This is attributed to the slower increase in dislocation density at low strain rates, where thermal softening is unable to offset working hardening immediately, resulting in a rising curve. When the dislocation density hit the point where thermal softening surpassed working hardening, the curve began to decline, leading to fluctuations.
At higher strain rates, the thermal softening effect quickly reached a dynamic balance with the working hardening effect, resulting in a smoother curve without obvious fluctuations. It was also observed that as the strain rate increased, both the peak and stable value of the flow stress curve gradually increased. This can be attributed to the reduced time for the material to undergo DRX at higher strain rates, weakening thermal softening and increasing working hardening, thereby leading to an overall upward trend in the flow stress curve.

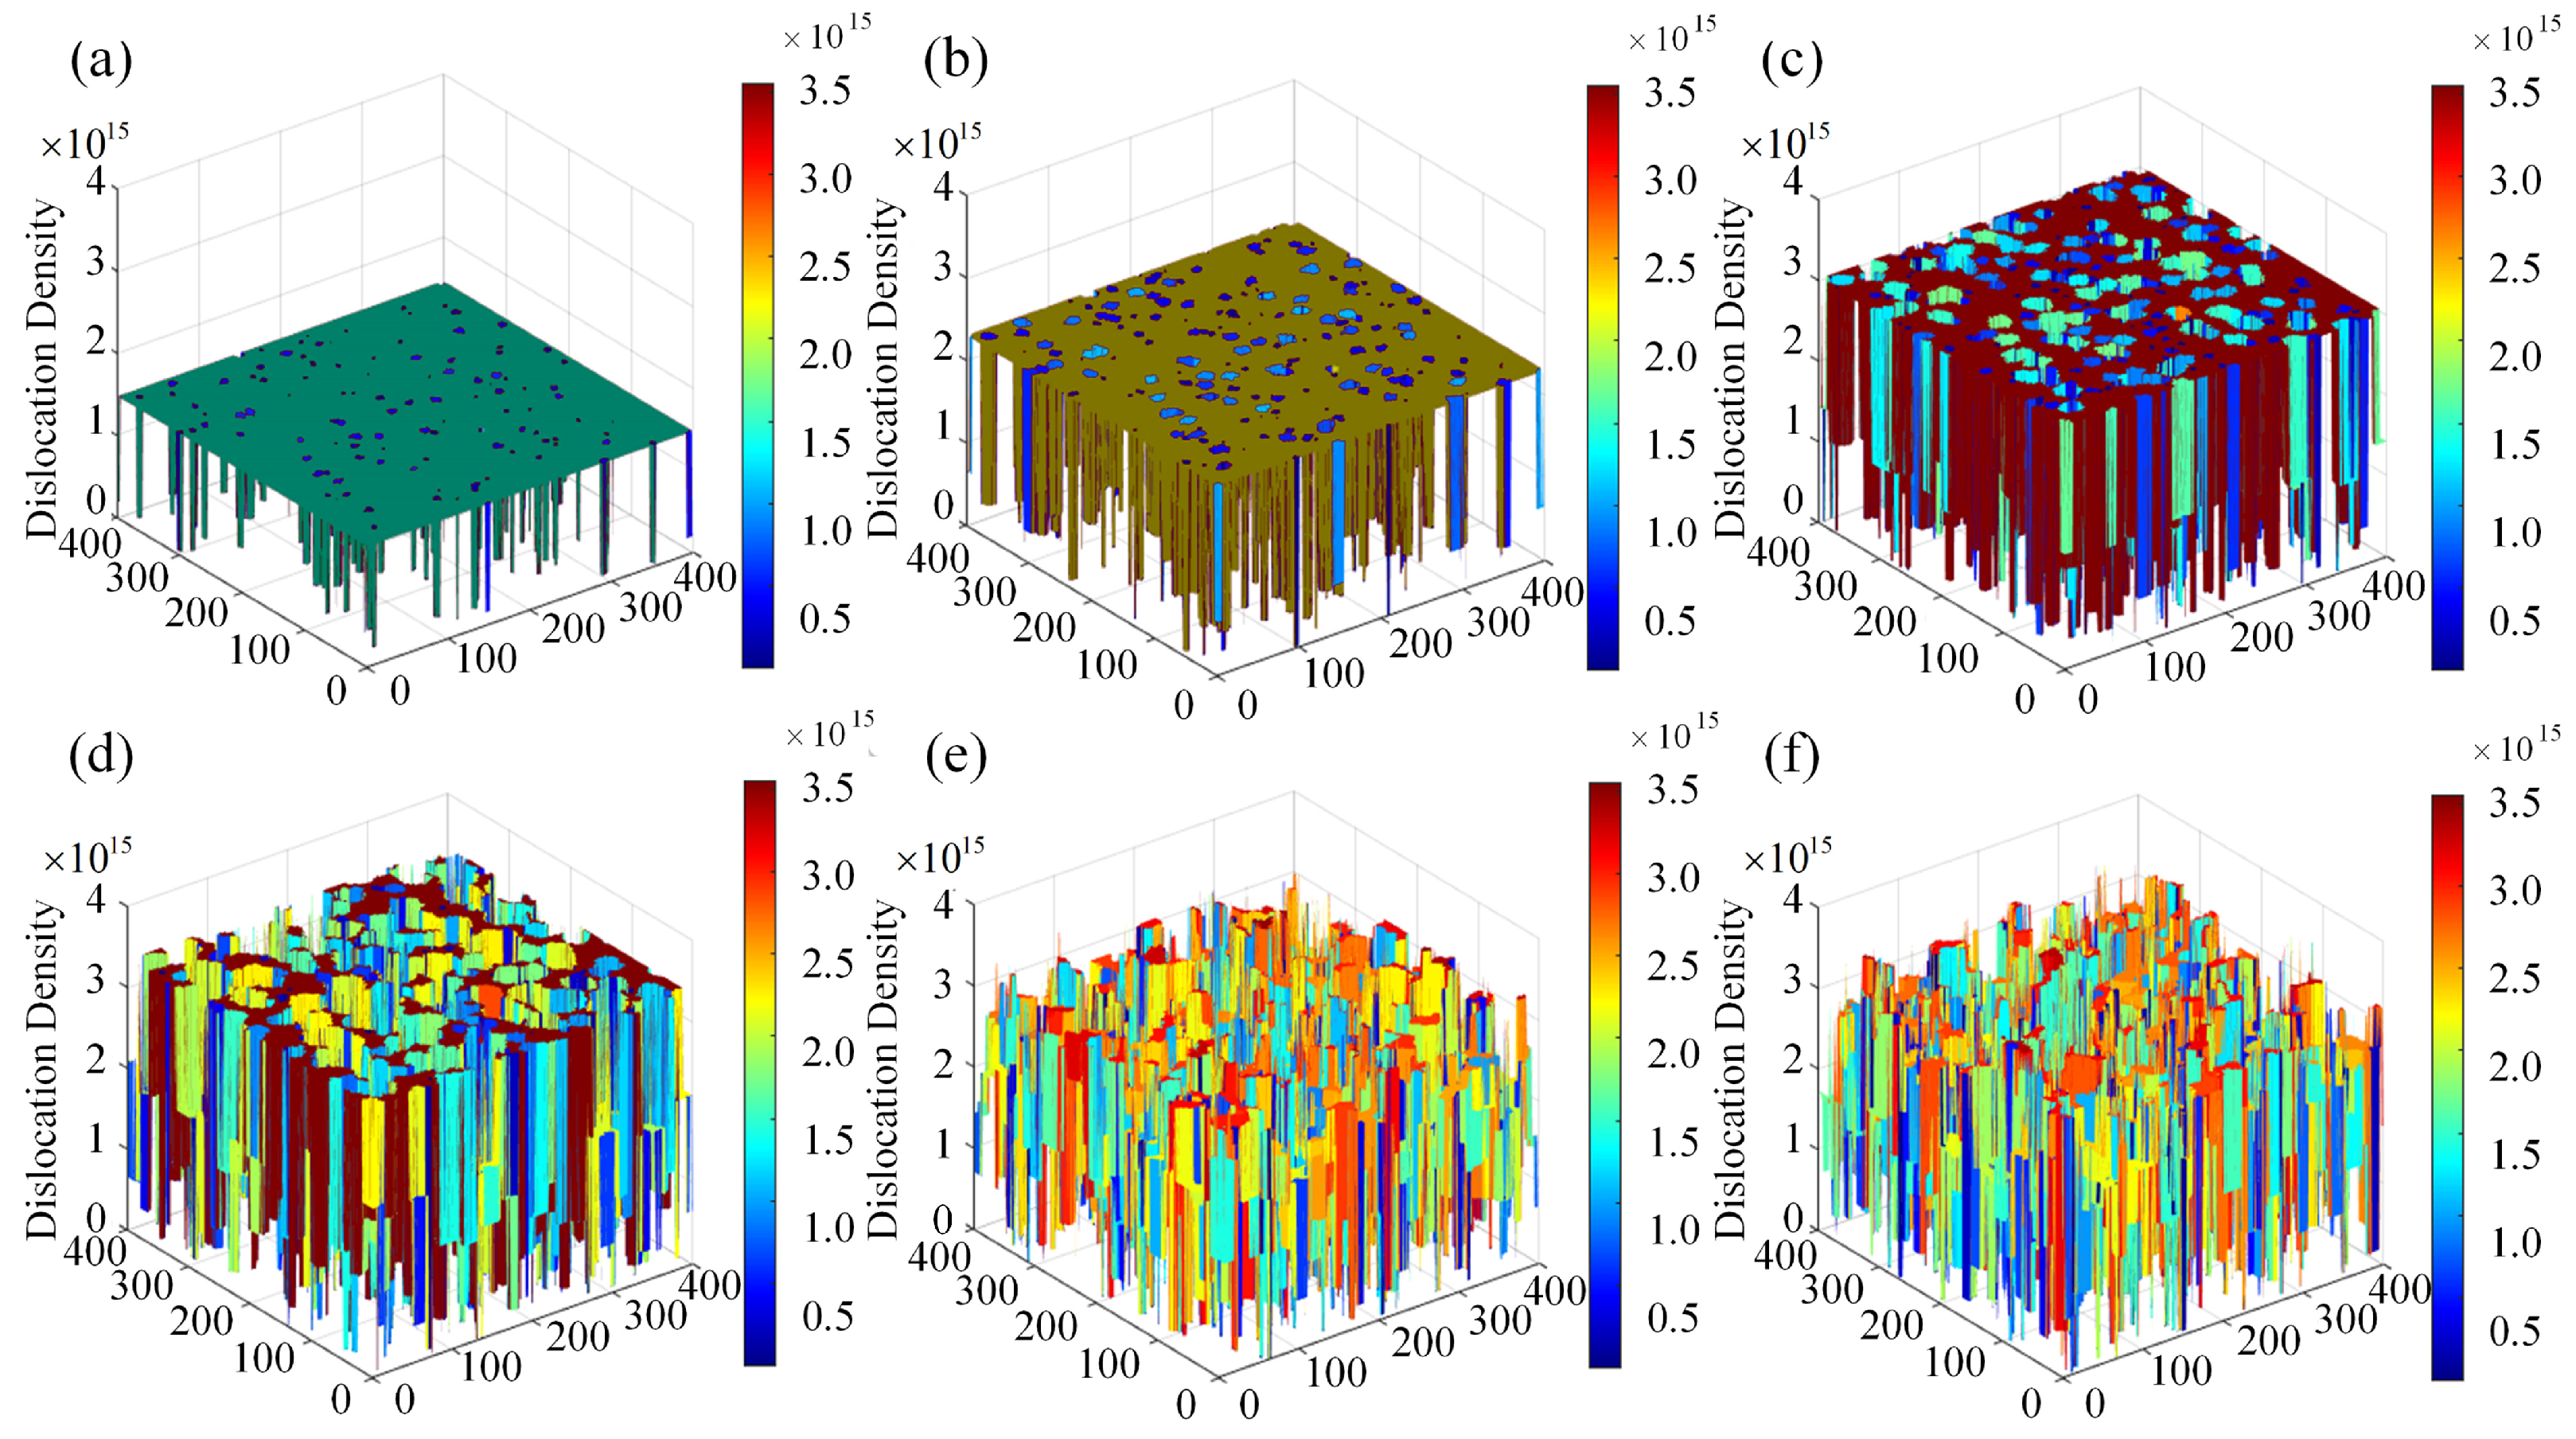
3.2. Impacts of the Strain, Strain Rate, and Temperature on DRX

The strain, strain rate, and temperature distribution in the PZ during cutting are the primary input parameters of the CA model, which directly affect the DRX process. Therefore, it was essential to analyze the impacts of strain, strain rate, and temperature on the DRX process.
The impact of the strain rate on DRX was determined by simulating DRX at strain rates of 2 s−1, 1 s−1, and 0.5 s−1 under a constant temperature. The simulation results depicted in Figure 13 show that in the initial stage, DRX did not occur because the internal dislocation density had not reached the critical value for nucleation, indicating a preparation stage for DRX.
Under a constant deformation temperature, the degree of DRX gradually decreased as the strain rate increased. For example, at a relatively low strain ( ε = 1.0), DRX at a strain state of 0.5 s−1 (Figure 13(a2)) was nearly complete, whereas DRX at a strain rate of 2 s−1 (Figure 13(c2)) had just begun. The increase in the strain rate simultaneously led to a decrease in the average grain size. This was attributed to the reduced time available for the same amount of strain to be increased at higher strain rates, inhibiting the degree of DRX. Additionally, the increase in the strain rate raised the critical dislocation density, with the maximum dislocation density remaining unchanged. Consequently, the growth time for recrystallization transformation cells decreased, resulting in smaller grain sizes. Figure 14 illustrates the influence curves of strain rates on DRX parameters.
Overall, the strain rate has a significant impact on DRX. Higher strain rates result in smaller average grain sizes generated by DRX, leading to grain refinement and lower transformation fractions of DRX. In practical processing, a refined and uniform grain microstructure can be obtained by increasing the strain rate. However, an excessively high strain rate may lead to incomplete DRX, where the recrystallized grain microstructure fails to fully replace the initial austenite microstructure, resulting in uneven mechanical properties. Conversely, at high strain rates with a low strain, it was too late for DRX to occur, resulting in larger average grain sizes, grain coarsening, and grain mixing due to a higher transformation fraction of DRX.
The impact of temperature on DRX was determined by simulating DRX at temperatures of 950 K, 1000 K, and 1050 K under a constant strain rate. The simulation results in Figure 15 show that increasing the temperature significantly accelerated the DRX velocity, nucleation rates, and DRX conversion rates at a constant strain rate. This acceleration can be attributed to the higher energy provided by an elevated temperature, which increased the driving force for DRX nucleation and facilitated grain nucleation, grain boundary migration, and other related processes, thereby promoting the DRX process. However, higher deformation temperatures also led to coarser recrystallized grains, which was not conducive to achieving refined and uniform grain microstructures. The simulation result is consistent with the results of Zhang Jie [35].
Figure 16 illustrates the impact of temperature on DRX-related parameters. It can be seen from Figure 16a that the average grain size at 1000 K was smaller compared to those at 1050 K and 950 K, indicating that a moderate deformation temperature could facilitate sufficient DRX without excessive grain coarsening. This result aligned with the above discussion. Therefore, selecting an appropriate deformation temperature is essential for promoting the refinement of grains.
From the simulation results and analysis above, it is evident that both strain rate and temperature have a significant impact on DRX. A high strain rate inhibits DRX and promotes grain refinement. Conversely, high temperatures promote the occurrence of DRX and increase the conversion rate of DRX, but they also lead to grains with larger volume, i.e., grain coarsening. The conclusion drawn is consistent with the research results of Zhang, Yanqiu [32].

3.3. Research on DRX in the PZ

The parameter distribution in the PZ was obtained using the established PZ model, as illustrated in Figure 17. During the transition from the initial shear line to the main shear plane, the shear strain rate curve showed a rising trend with an increasing slope, peaking at the primary shear plane. During the transition from the main shear plane to the final shear line, the shear strain rate curve showed a decreasing trend with a declining slope. Conversely, the shear strain rates at both the initial and the final shear lines were 0.
The strain first increased and then decreased with increasing y values, with the slope reaching its maximum near the primary shear plane. The strain distribution curve reached its maximum near the final shear line and exhibited a smooth trend. The temperature distribution curve in the PZ followed a trend similar to that of the strain distribution curve, with the temperature at the initial shear line corresponding to the workpiece or ambient temperature.
During cutting, the parameters on different shear planes in the PZ were different, resulting in different degrees of DRX. For instance, the strain at the initial shear line (y = 0) was 0, causing no DRX to occur on this surface. However, other shear planes experienced strain, potentially triggering DRX. Therefore, this section focuses on determining the degree of DRX and different shear planes within the PZ.
Figure 18 illustrates the parameter distribution of each partition. From the figure, it is evident that the distribution trend of strain in each region was the same as that of the strain rate, while other parameter distributions aligned with the original trends.
Through an iterative simulation of DRX within each shear plane, the DRX situation across the PZ could be obtained. The distribution curves of average grain size and recrystallization proportion are shown in Figure 19. It can be seen from the figure that as the y value increased, the average grain size initially remained constant before gradually decreasing. The average grain size reached its minimum value near the termination shear line and gradually stabilized.
The recrystallization conversion rate between the initial shear plane and the main shear plane remained 0, indicating no occurrence of DRX in this region. According to the analysis in Section 3.2, the deformation temperature in this range did not reach the critical point for DRX initiation. After passing through the primary shear plane, where the deformation temperature surpassed the critical value, DRX began. However, due to the extremely high strain rate during cutting, new grains primarily nucleated at grain boundary, resulting in a small grain size.
As the strain rate diminished near the final shear line, a small amount of large-volume grains nucleated at the grain boundaries. Although the recrystallization ratio continued to increase, the average grain size approached a state of stability because the size of the new grains was comparable to those of the original grains. Figure 20 displays the experimental image of DRX on the primary shear plane.
Figure 21 displays the size distributions of grains in various shear planes obtained from a CA simulation alongside experimental observations. It can be seen from the figure that, due to the absence of DRX on the shear plane where y = 0.01 mm, which belonged to the original grain structure, the grain size distribution was relatively uniform.
As y increased, the proportion of large-volume grains gradually decreased due to the nucleation of small-volume grains nucleated at the grain boundaries. The error between the simulation and experimental values is shown in Figure 21d. From the figure, it was evident that the error increased with y due to the significant number of nucleated grains at grain boundaries.
The maximum error value was 11.26% at the final shear plane, which was within the permitted range, indicating that the CA model can provide a relatively accurate prediction of DRX occurrence in the PZ during orthogonal cutting.

4. Conclusions

In this study, the microstructure evolution model for the PZ was established by integrating the analytical cutting model with the CA model. An experimental verification was conducted using the invented electromagnet rotation-type quick-stop device. The conclusions are as follows.
(1)
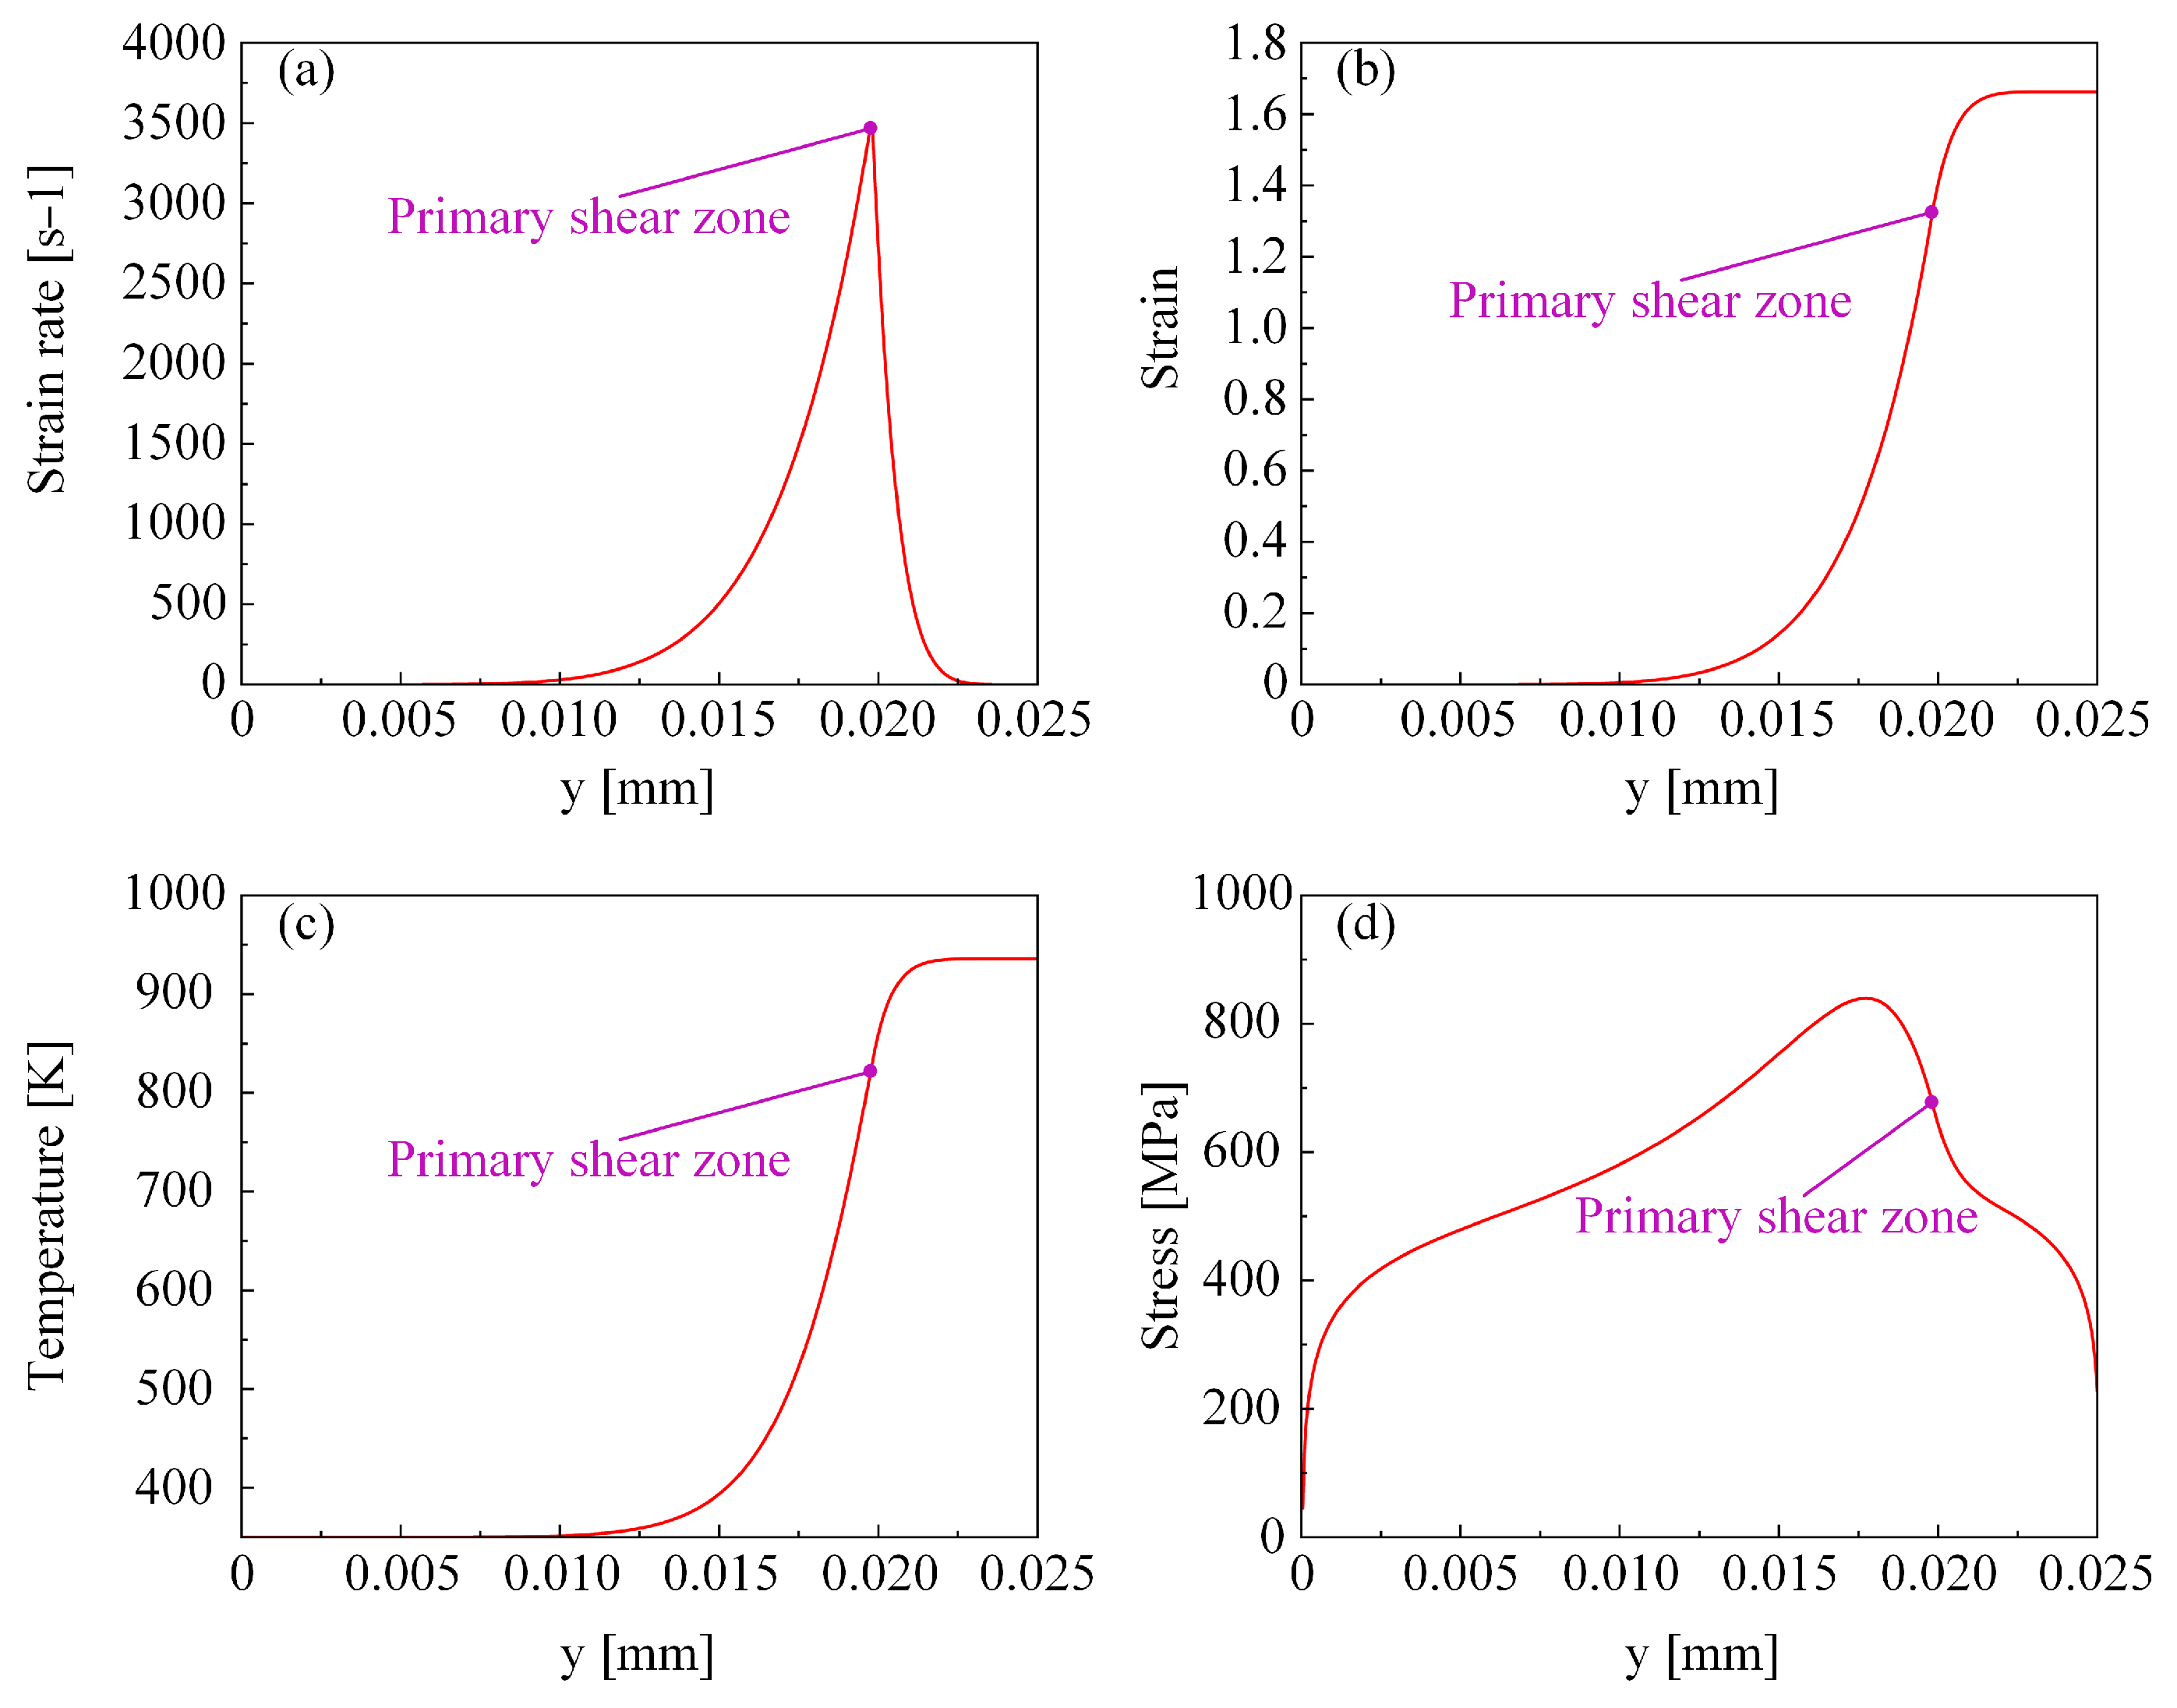
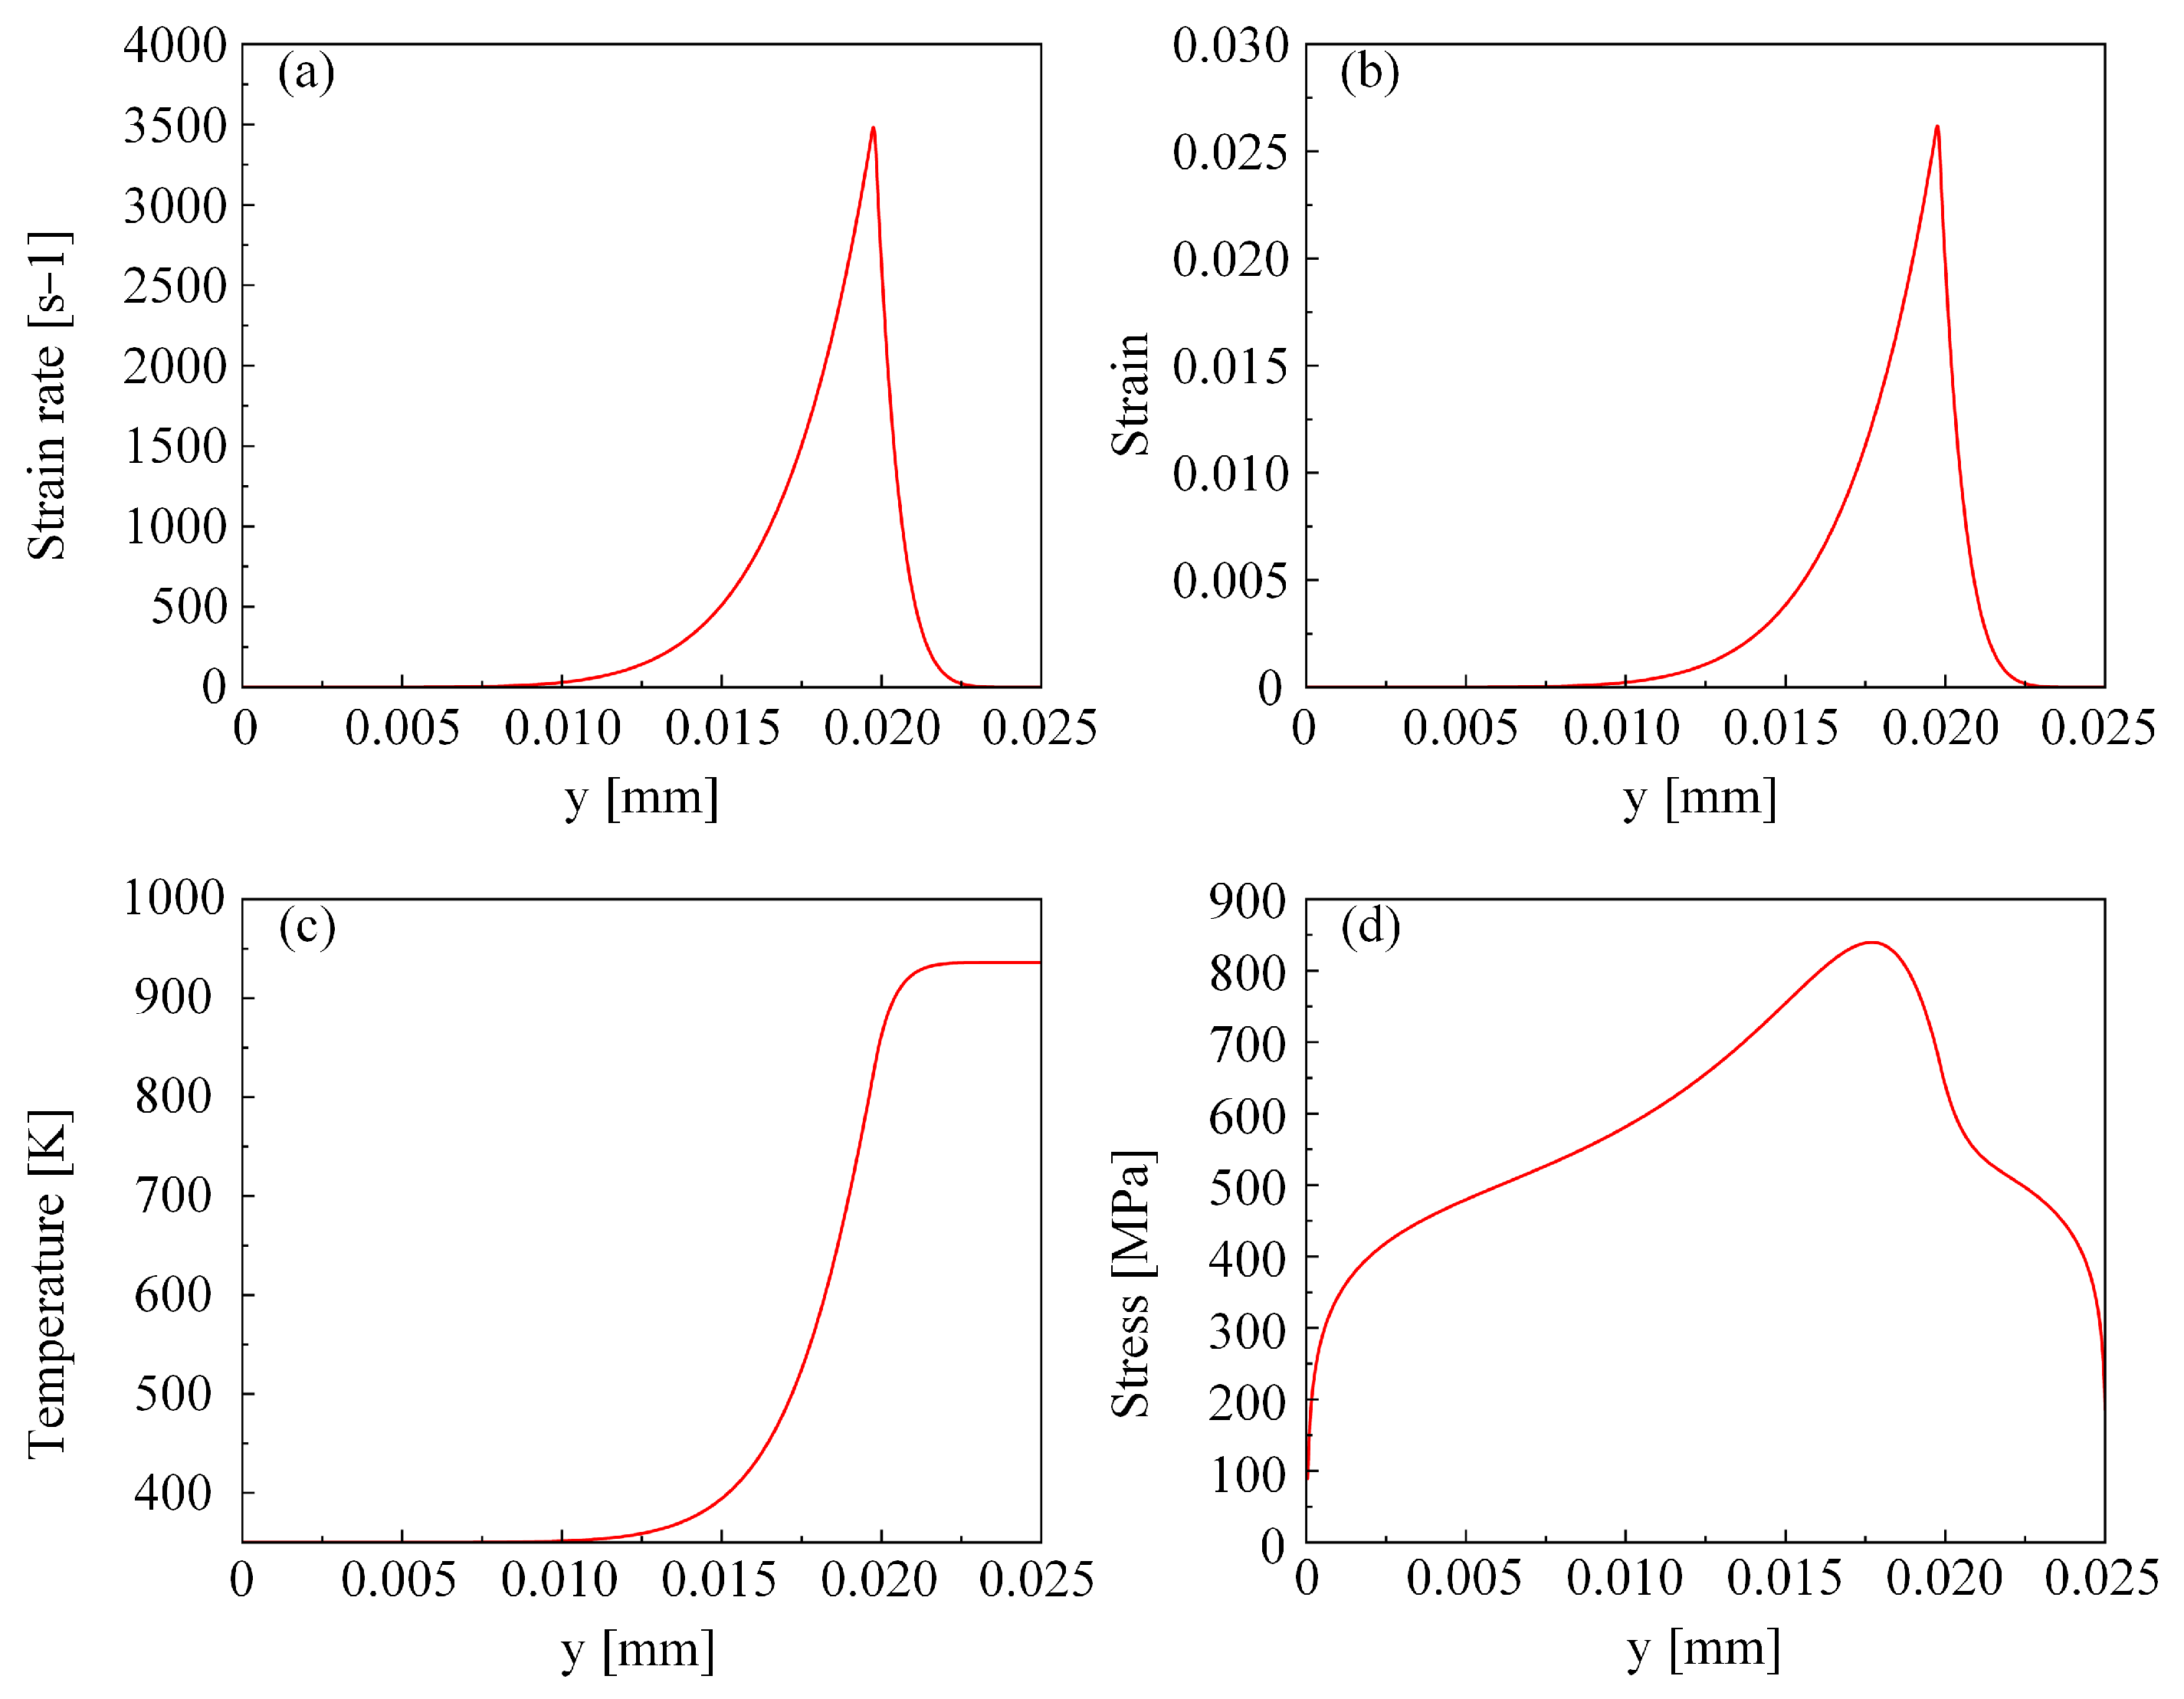
The PZ model was established to simulate the distribution of strain, strain rate, temperature, and stress during orthogonal cutting. Additionally, a CA model was developed to simulate the dynamic recrystallization of the NSA during high-temperature cutting. This model can predict the grain morphology, flow stress, recrystallization conversion rate, and average grain radius during a dynamic recrystallization process and can also visualize the dynamic recrystallization process.
(2)
The flow stress curve during the dynamic recrystallization was simulated and analyzed. Increasing the temperature promoted dynamic recrystallization, thereby decreasing the flow stress. Meanwhile, under a constant strain, higher temperatures reduced the dynamic recrystallization time, leading to an increase in flow stress.
(3)
Dynamic recrystallization at different shear planes within the PZ during cutting was simulated and analyzed. No dynamic recrystallization occurred at the initial shear line where strain was zero. From the initial shear line to the main shear plane, both the strain rate and temperature gradually increased. Dynamic recrystallization initiated once critical temperature values were reached, resulting in a decrease in the average grain size. Subsequently, as the grain size decreased, the average grain size tended to stabilize. After verification experiments, the maximum error between the simulation and experimental results was 11.26%, being within an acceptable range. This proved that the model established in this study had a certain degree of accuracy.
(4)
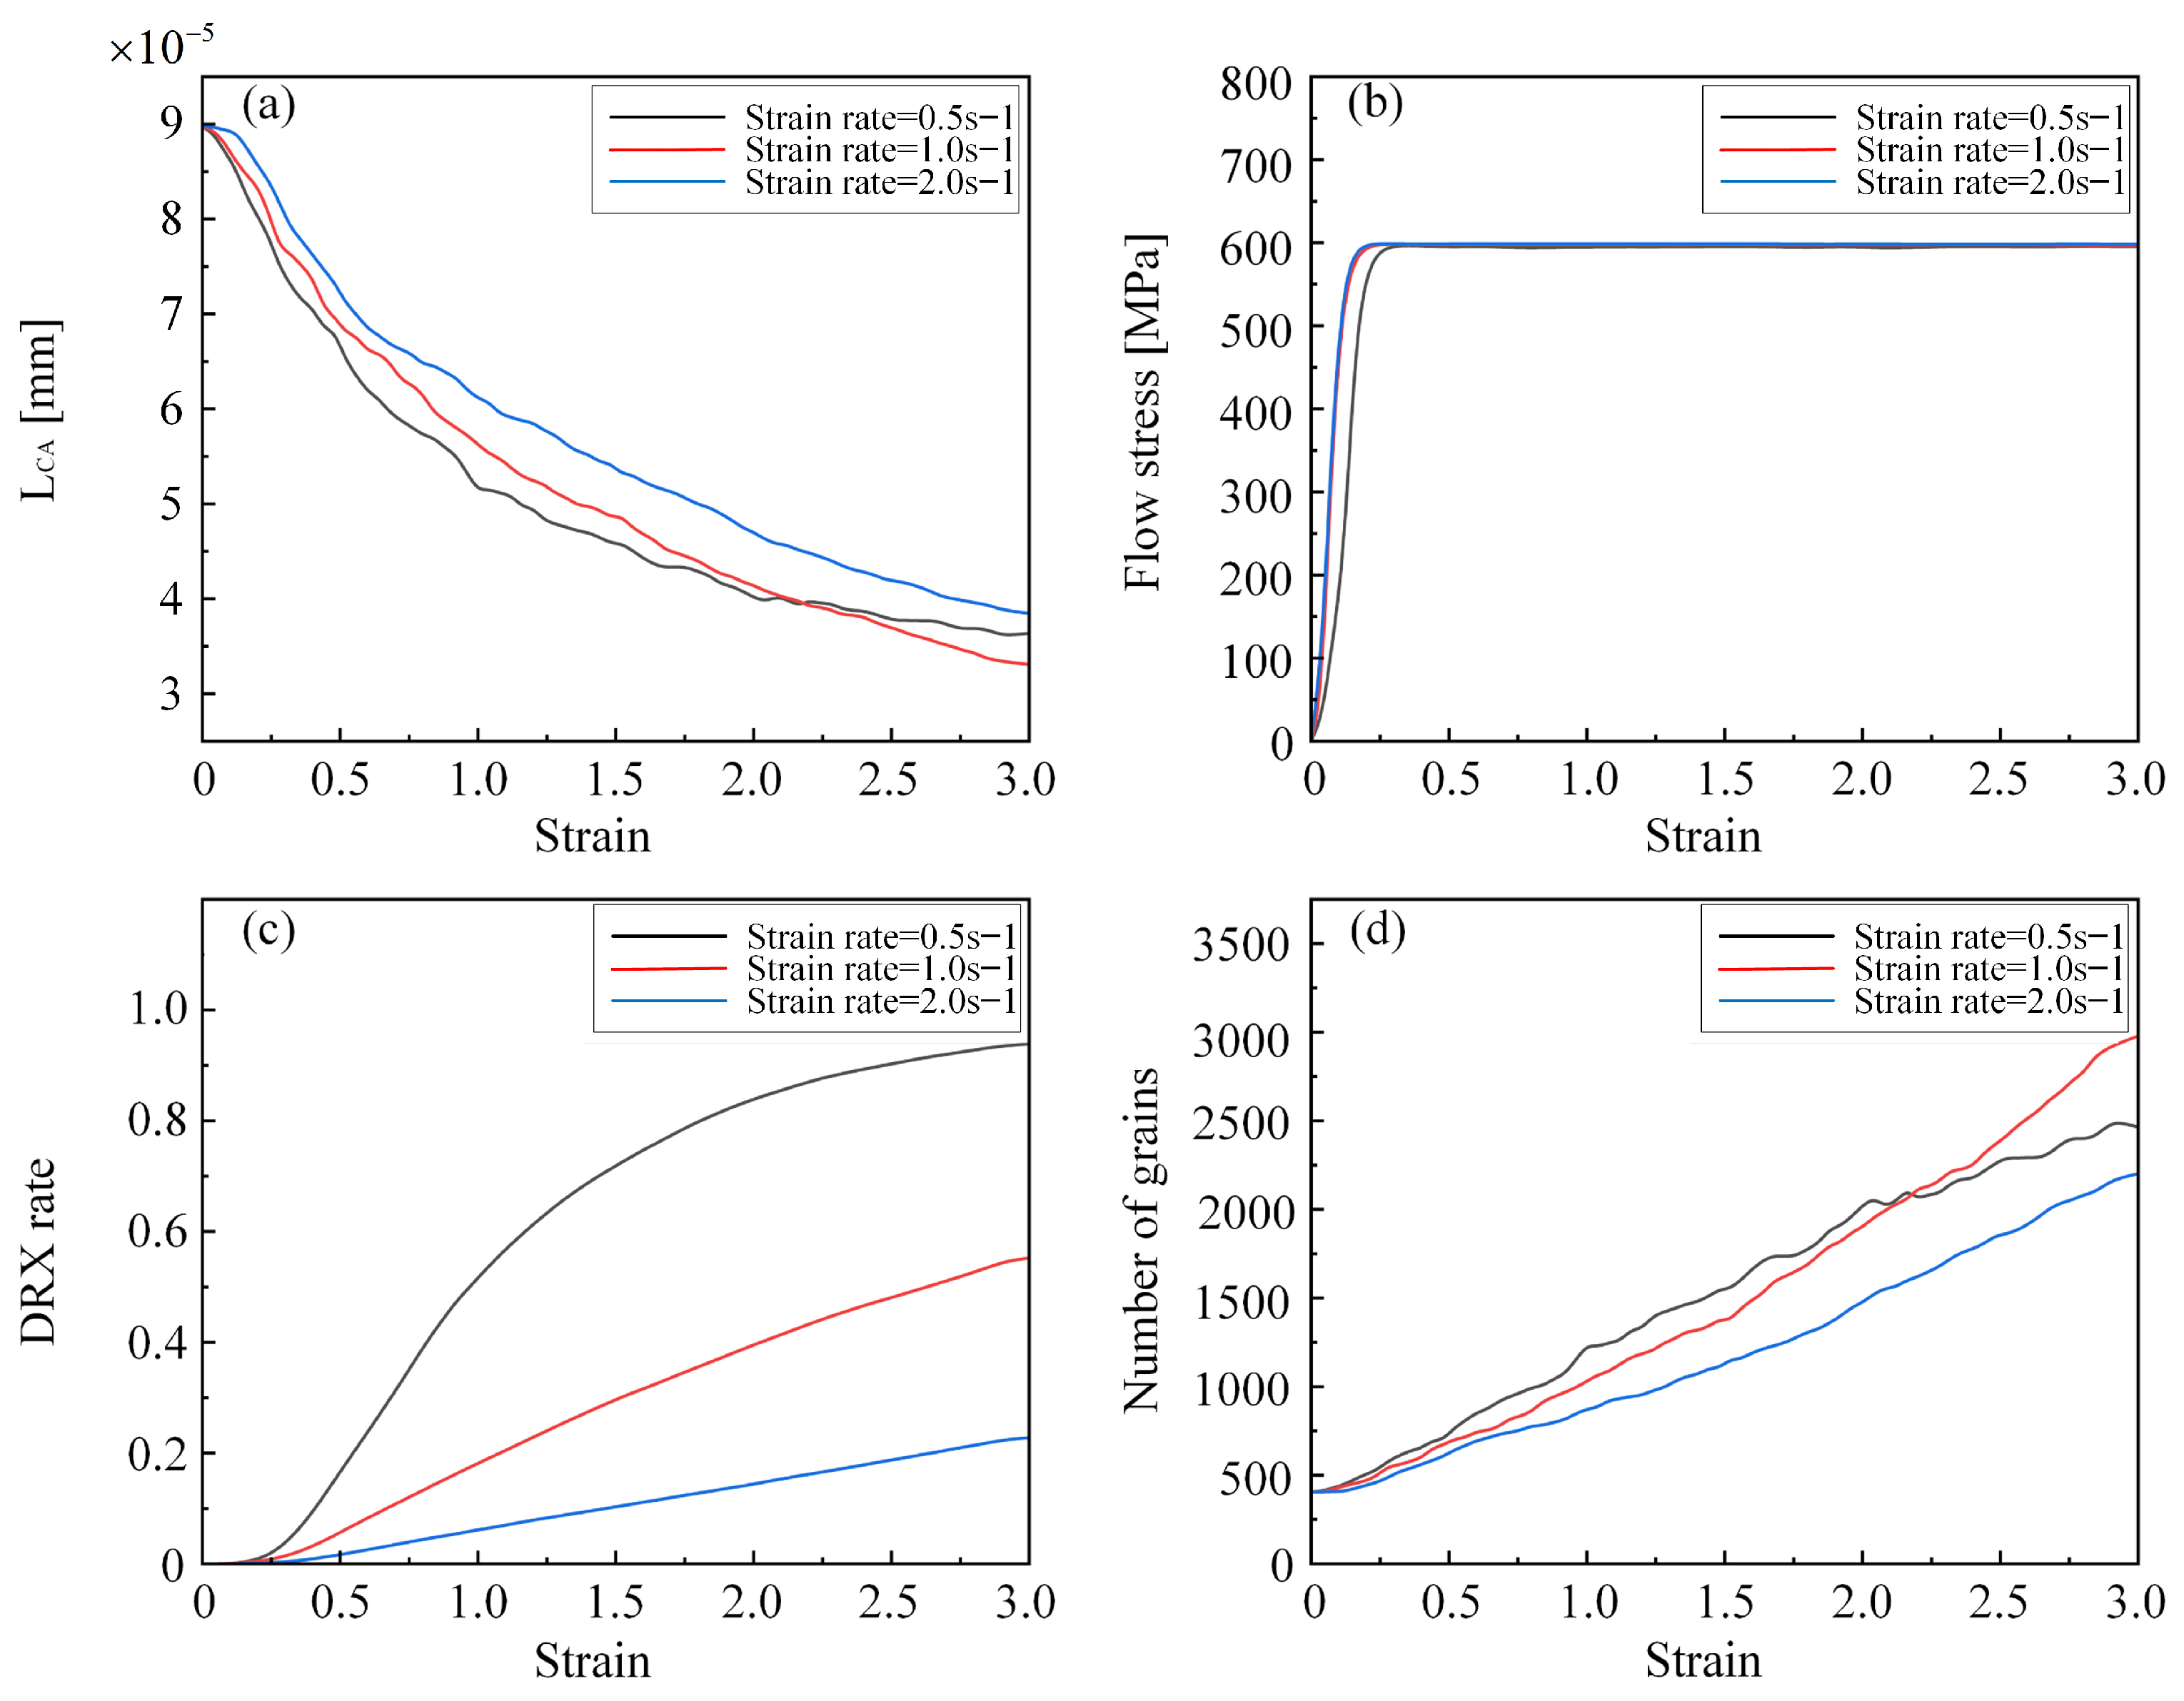
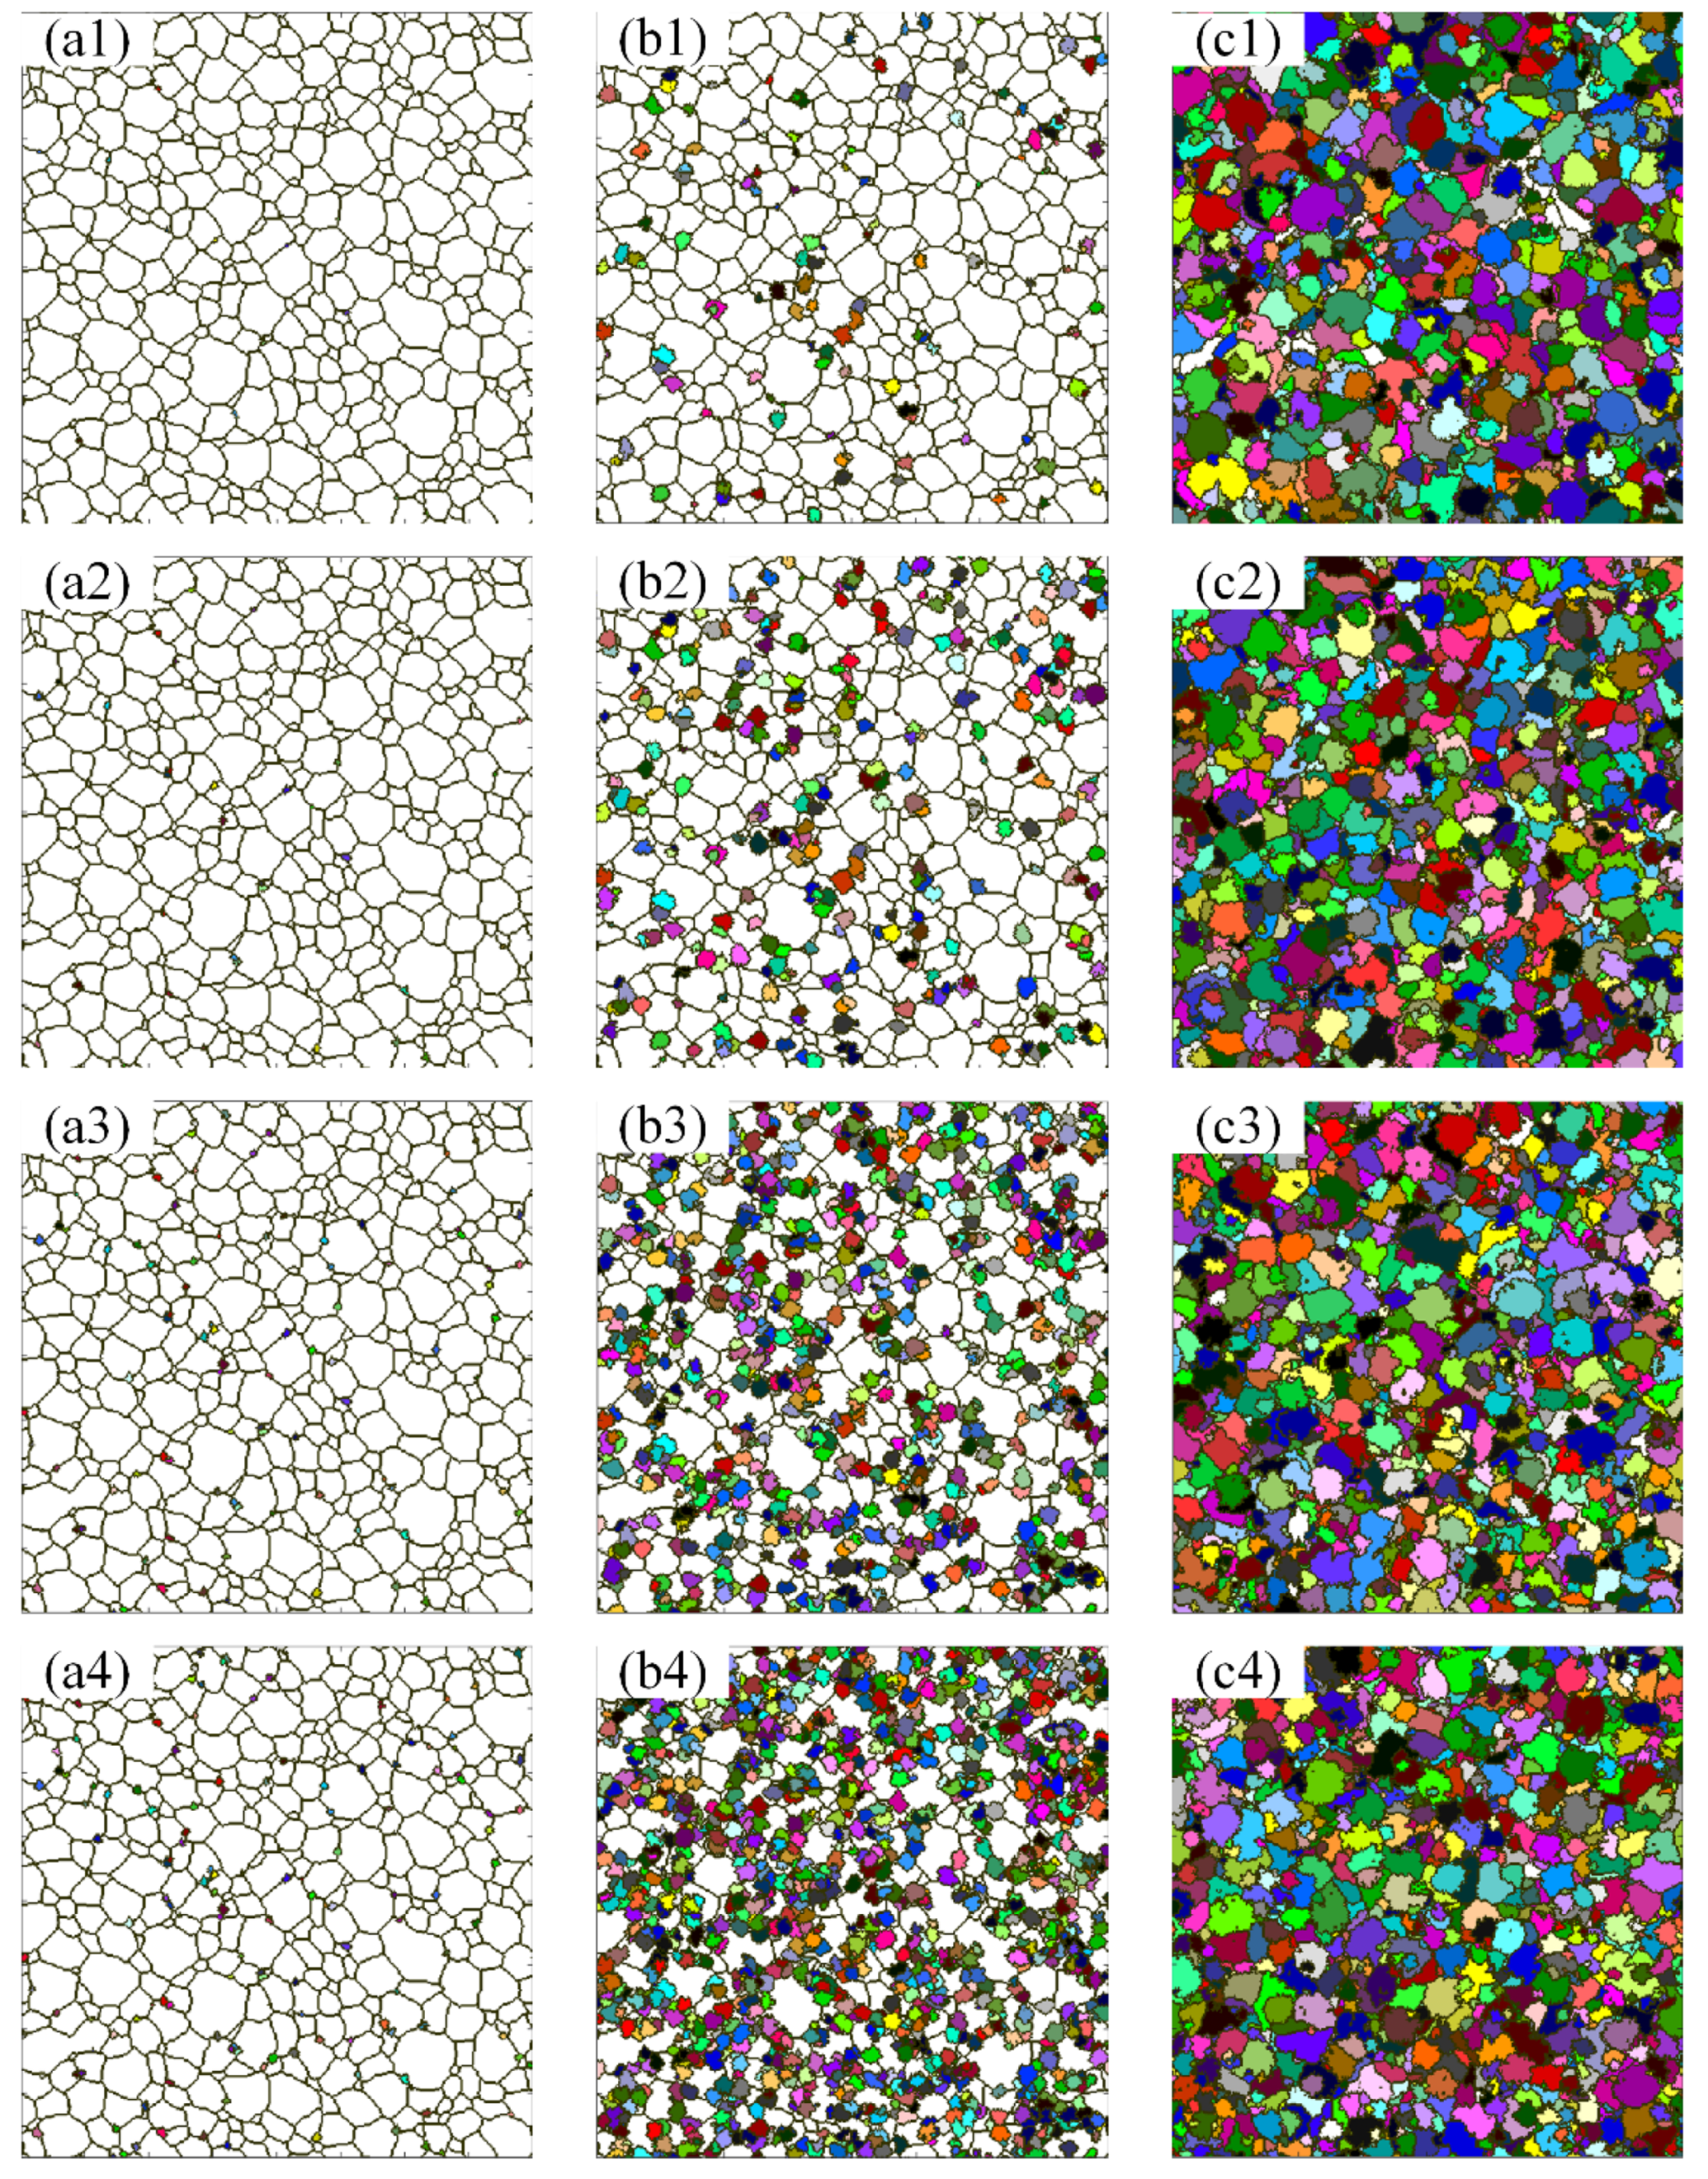
The effects of strain, strain rate, and temperature on dynamic recrystallization were explored through a simulation and analysis. Higher strain rates decreased the degree of dynamic recrystallization while promoting grain refinement. A higher temperature facilitated dynamic recrystallization but led to the coarsening of recrystallized grains.
(5)
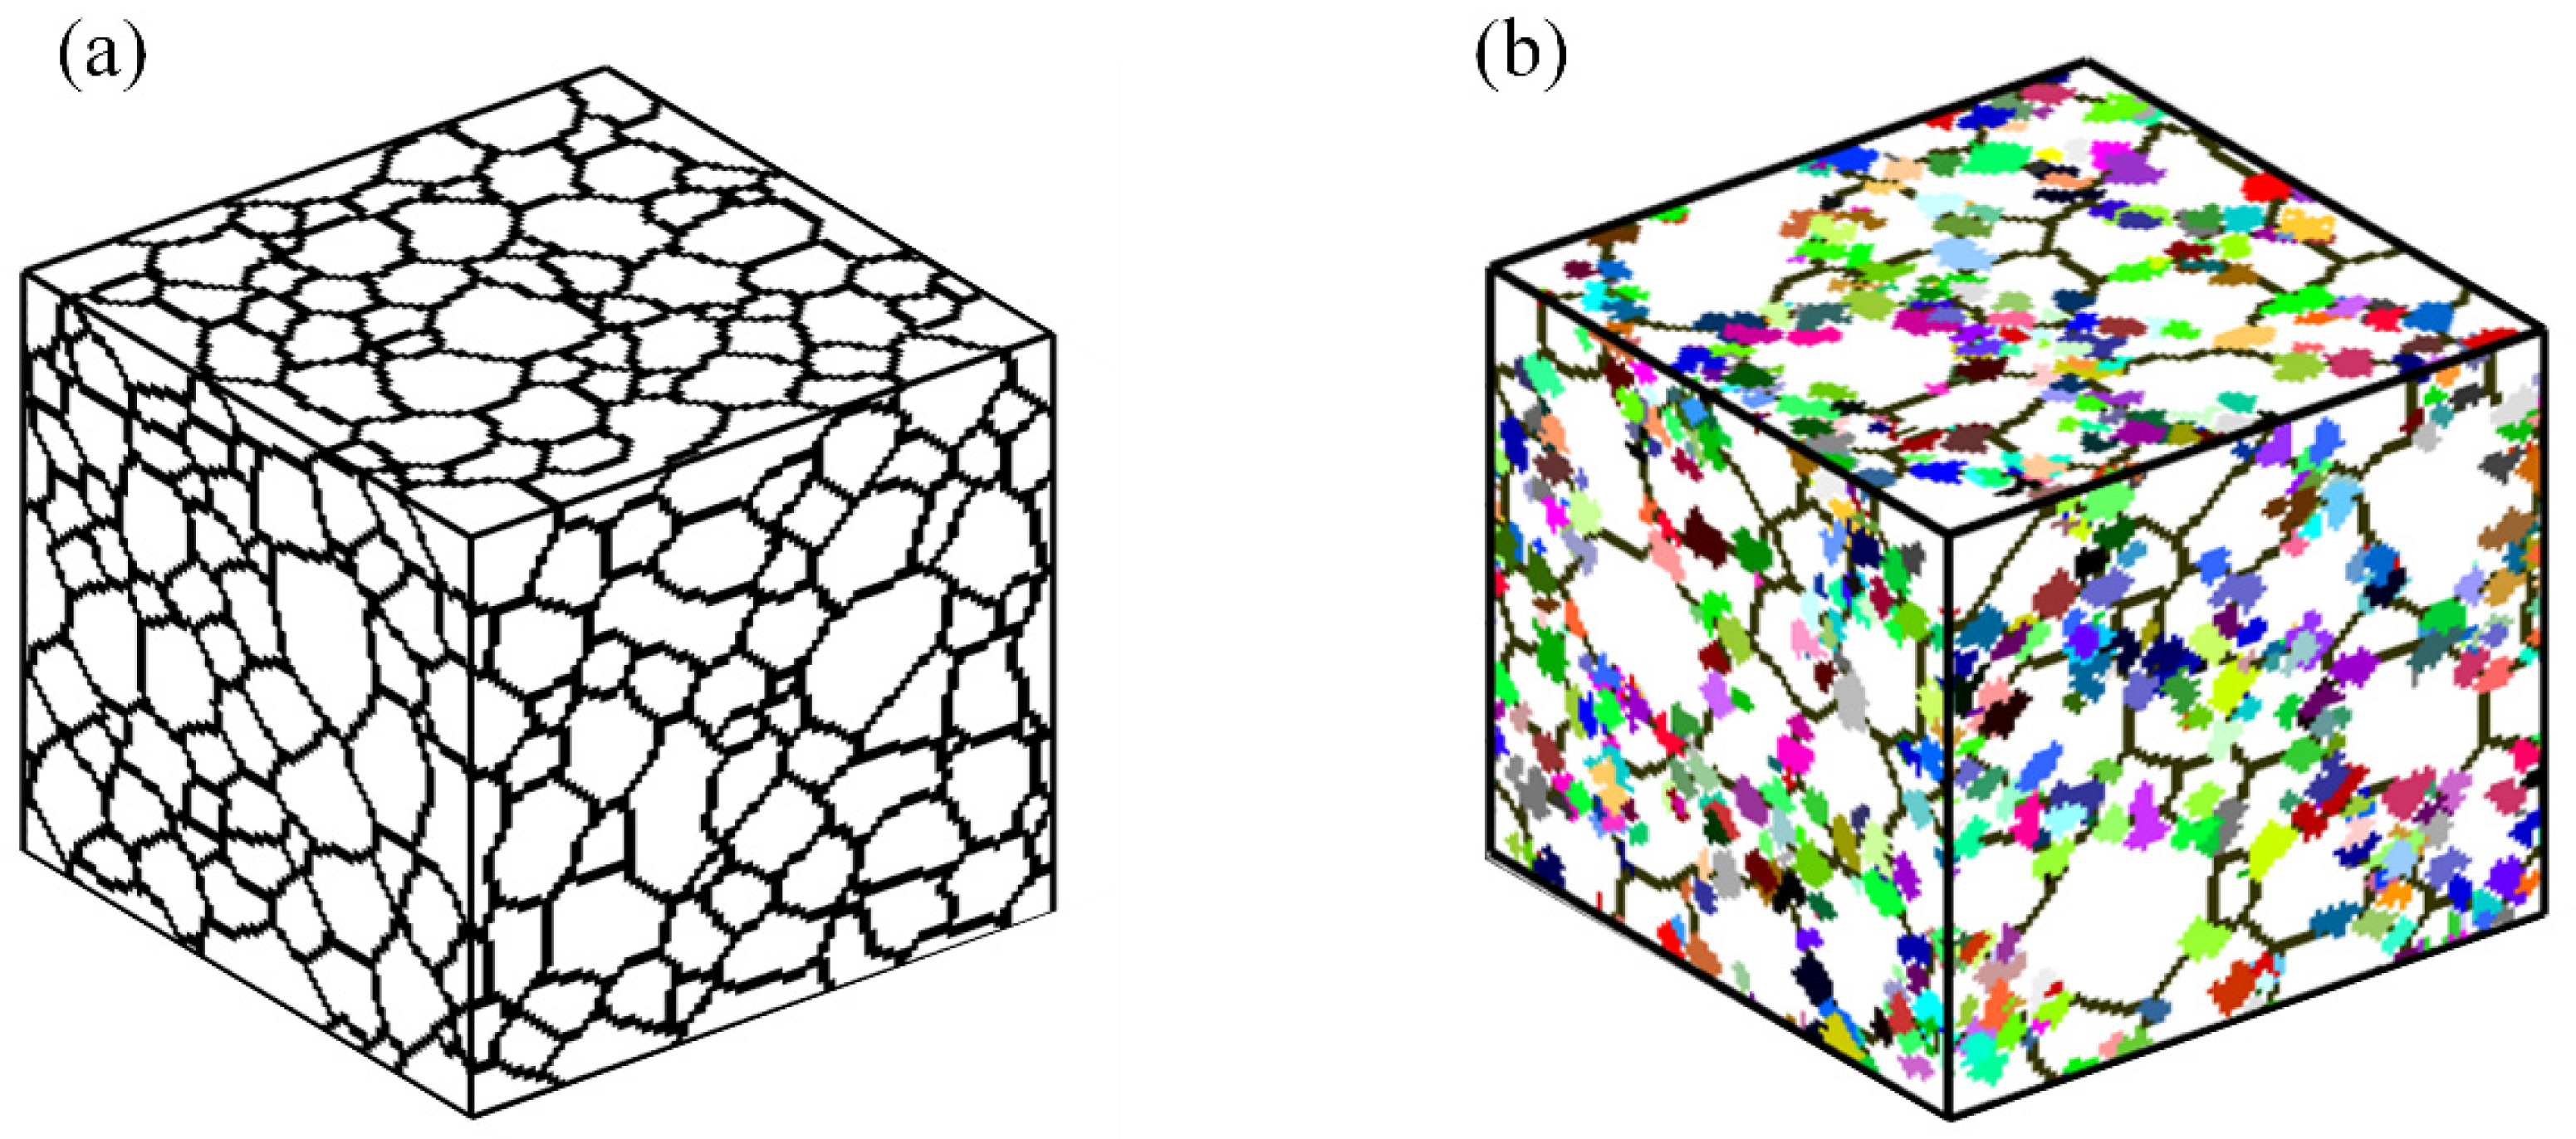
A successful extension of the two-dimensional cellular automaton model to three dimensions was achieved by adjusting boundary conditions and neighbor types. Grain size in the three-dimensional model was statistically analyzed using cross-sectional methods.

Author Contributions

Writing—review and editing, J.W.; validation, M.L. and Q.L.; investigation, X.P., Z.W., J.J., R.L., Y.Z., L.M. and T.Y. All authors have read and agreed to the published version of the manuscript.

Funding

This research was funded by the National Natural Science Foundation of China (52305453), the Natural Science Foundation of Hebei Province (E2021501027), the Science and Technology Project of Hebei Education Department (QN2022204), the Fundamental Research Funds for the Central Universities (N2423023, N2223012), the Hebei Province Graduate Innovation Ability Training Funding Project (CXZZSS2024170), and the Liaoning Provincial Natural Science Foundation of China (2023-MSBA-032).

Data Availability Statement

The original contributions presented in this study are included in this article; further inquiries can be directed to the corresponding author.

Conflicts of Interest

The authors declare no conflicts of interest.

References

  1. Ao, S.; Cheng, M.; Zhang, W.; Oliveira, J.; Manladan, S.; Zeng, Z.; Luo, Z. Microstructure and mechanical properties of dissimilar NiTi and 304 stainless steel joints produced by ultrasonic welding. Ultrasonics 2022, 121, 106684. [Google Scholar] [CrossRef] [PubMed]
  2. Mwangi, J.W.; Nguyen, L.T.; Bui, V.D.; Berger, T.; Zeidler, H.; Schubert, A. Nitinol manufacturing and micromachining: A review of processes and their suitability in processing medical-grade nitinol. J. Manuf. Process. 2019, 38, 355–369. [Google Scholar] [CrossRef]
  3. Bertagne, C.L.; Cognata, T.J.; Sheth, R.B.; Dinsmore, C.E.; Hartl, D.J. Testing and analysis of a morphing radiator concept for thermal control of crewed space vehicles. Appl. Therm. Eng. 2017, 124, 986–1002. [Google Scholar] [CrossRef]
  4. Behera, A.; Sahoo, A.K.; Mohapatra, S.S. Nickel–titanium smart hybrid materials for automotive industry. In Nickel-Titanium Smart Hybrid Materials; Elsevier: Amsterdam, The Netherlands, 2022; pp. 271–295. [Google Scholar]
  5. Kaynak, Y.; Manchiraju, S.; Jawahir, I.; Biermann, D. Chip formation and phase transformation in orthogonal machining of NiTi shape memory alloy: Microstructure-based modelling and experimental validation. CIRP Ann. 2020, 69, 85–88. [Google Scholar] [CrossRef]
  6. Piquard, R.; d’Acunto, A.; Laheurte, P.; Dudzinski, D. Micro-end milling of NiTi biomedical alloys, burr formation and phase transformation. Precis. Eng. 2014, 38, 356–364. [Google Scholar] [CrossRef]
  7. Zhao, Y.; Li, J.; Guo, K.; Sivalingam, V.; Sun, J. Study on chip formation characteristics in turning NiTi shape memory alloys. J. Manuf. Process. 2020, 58, 787–795. [Google Scholar] [CrossRef]
  8. Zhao, Y.; Sun, J. Study on the characteristics of phase in turning NiTi shape memory alloy. J. Manuf. Process. 2023, 98, 277–284. [Google Scholar] [CrossRef]
  9. Rosnan, R.; Murad, M.N.; Azmi, A.I.; Shyha, I. Effects of minimal quantity lubricants reinforced with nano-particles on the performance of carbide drills for drilling nickel-titanium alloys. Tribol. Int. 2019, 136, 58–66. [Google Scholar] [CrossRef]
  10. Zailani, Z.A.; Mativenga, P.T. Effects of Chilled Air on Machinability of NiTi Shape Memory Alloy. Procedia CIRP 2016, 45, 207–210. [Google Scholar] [CrossRef]
  11. Kaynak, Y.; Karaca, H.; Jawahir, I. Surface Integrity Characteristics of NiTi Shape Memory Alloys Resulting from Dry and Cryogenic Machining. Procedia CIRP 2014, 13, 393–398. [Google Scholar] [CrossRef]
  12. Wang, G.; Liu, Z.; Niu, J.; Huang, W.; Wang, B. Effect of electrochemical polishing on surface quality of nickel-titanium shape memory alloy after milling. J. Mater. Res. Technol. 2019, 9, 253–262. [Google Scholar] [CrossRef]
  13. Kaya, E.; Kaya, I. Tool wear progression of PCD and PCBN cutting tools in high speed machining of NiTi shape memory alloy under various cutting speeds. Diam. Relat. Mater. 2020, 105, 107810. [Google Scholar] [CrossRef]
  14. Kaynak, Y.; Robertson, S.W.; Karaca, H.E.; Jawahir, I.S. Progressive tool-wear in machining of room-temperature austenitic NiTi alloys: The influence of cooling/lubricating, melting, and heat treatment conditions. J. Mater. Process. Technol. 2015, 215, 95–104. [Google Scholar] [CrossRef]
  15. Kaynak, Y.; Manchiraju, S.; Jawahir, I. Modeling and Simulation of Machining-induced Surface Integrity Characteristicsof NiTi Alloy. Procedia CIRP 2015, 31, 557–562. [Google Scholar] [CrossRef]
  16. Kaynak, Y.; Karaca, H.E.; Jawahir, I.S. Cutting Speed Dependent Microstructure and Transformation Behavior of NiTi Alloy in Dry and Cryogenic Machining. J. Mater. Eng. Perform. 2014, 24, 452–460. [Google Scholar] [CrossRef]
  17. Du, Z.; Li, L.; Li, M. Heterogeneous dynamic recrystallization in the isothermal compression of Ti55-TiBw composite in α + β region. Mater. Charact. 2024, 207, 113574. [Google Scholar] [CrossRef]
  18. Huang, K.; Zhang, Y.-M.; Zhou, Y.-J.; Yang, R.; Meng, X.-P.; Chen, J.-D.; Zhang, X.-B.; Jiang, K.-X.; Liu, D.-D. Evolution of grain characteristics and dynamic recrystallization behavior of Cu–15Ni–8Sn alloy under different extrusion ratios. J. Mater. Res. Technol. 2024, 28, 2887–2897. [Google Scholar] [CrossRef]
  19. Liu, G.; Zhang, D.; Yao, C. Investigation of the grain refinement mechanism in machining Ti-6Al-4V: Experiments and simulations. J. Manuf. Process. 2023, 94, 479–496. [Google Scholar] [CrossRef]
  20. Goetz, R.; Seetharaman, V. Modeling Dynamic Recrystallization Using Cellular Automata. Scr. Mater. 1998, 38, 405–413. [Google Scholar] [CrossRef]
  21. Ding, R.; Guo, Z. Coupled quantitative simulation of microstructural evolution and plastic flow during dynamic recrystallization. Acta Mater. 2001, 49, 3163–3175. [Google Scholar] [CrossRef]
  22. Li, H.; Sun, X.; Yang, H. A three-dimensional cellular automata-crystal plasticity finite element model for predicting the multiscale interaction among heterogeneous deformation, DRX microstructural evolution and mechanical responses in titanium alloys. Int. J. Plast. 2016, 87, 154–180. [Google Scholar] [CrossRef]
  23. Zhou, F.; Guo, J.; Zhao, Y.; Chu, X.; Liu, L.; Zhou, C.; Zhao, Z. An improved cellular automaton model of dynamic recrystallization and the constitutive model coupled with dynamic recrystallization kinetics for microalloyed high strength steels. J. Mater. Res. Technol. 2023. [Google Scholar] [CrossRef]
  24. Xu, J.; He, Q.; Jin, X.; Bian, S.; Shan, D.; Wu, H.; Xu, W. A 3D cellular automaton with inhomogeneous nucleation for simulating dynamic recrystallization of low-alloy steel with mixed-grain microstructure. J. Mater. Process. Technol. 2023, 322, 118171. [Google Scholar] [CrossRef]
  25. Park, J.; Rout, M.; Min, K.M.; Chen, S.F.; Lee, M.G. A fully coupled crystal plasticity-cellular automata model for predicting thermomechanical response with dynamic recrystallization in AISI 304LN stainless steel. Mech. Mater. 2022, 167, 104248. [Google Scholar] [CrossRef]
  26. Gao, S.; Sang, Y.; Li, Q.; Sun, Y.; Wu, Y.; Wang, H. Constitutive modeling and microstructure research on the deformation mechanism of Ti-6Al-4V alloy under hot forming condition. J. Alloys Compd. 2021, 892, 162128. [Google Scholar] [CrossRef]
  27. Zhao, Y.; Guo, K.; Sui, X.; Jia, X.; Sun, J. Nonlinear Deformation Mechanism of Ni50.8Ti Shape Memory Alloy at Different Temperatures and Strain Rates. J. Mater. Eng. Perform. 2023, 1–11. [Google Scholar] [CrossRef]
  28. Astakhov, V.P.; Osman, M.O.M.; Hayajneh, M.T. Re-evaluation of the basic mechanics of orthogonal metal cutting: Velocity diagram, virtual work equation and upper-bound theorem. Int. J. Mach. Tools Manuf. 2001, 41, 393–418. [Google Scholar] [CrossRef]
  29. Tounsi, N.; Vincenti, J.; Otho, A.; Elbestawi, M. From the basic mechanics of orthogonal metal cutting toward the identification of the constitutive equation. Int. J. Mach. Tools Manuf. 2002, 42, 1373–1383. [Google Scholar] [CrossRef]
  30. Zhang, F.; Liu, D.; Yang, Y.; Wang, J.; Zheng, Y. Study of factors affecting simulation of static recrystallization of Ni-based superalloy through cellular automaton model. Procedia Eng. 2017, 207, 2131–2136. [Google Scholar] [CrossRef]
  31. Jin, Z.; Cui, Z. Modelling the Effect of Initial Grain Size on Dynamic Recrystallization Using a Modified Cellular Automata and a Adaptive Response Surface Method. J. Mater. Sci. Technol. 2010, 26, 1063–1070. [Google Scholar] [CrossRef]
  32. Zhang, Y.; Jiang, S.; Liang, Y.; Hu, L. Simulation of dynamic recrystallization of NiTi shape memory alloy during hot compression deformation based on cellular automaton. Comput. Mater. Sci. 2013, 71, 124–134. [Google Scholar] [CrossRef]
  33. Cao, Z.-H.; Sun, Y.; Zhou, C.; Wan, Z.-P.; Yang, W.-H.; Ren, L.-L.; Hu, L.-X. Cellular automaton simulation of dynamic recrystallization behavior in V-10Cr-5Ti alloy under hot deformation conditions. Trans. Nonferrous Met. Soc. China 2019, 29, 98–111. [Google Scholar] [CrossRef]
  34. Takaki, T.; Yoshimoto, C.; Yamanaka, A.; Tomita, Y. Multiscale modeling of hot-working with dynamic recrystallization by coupling microstructure evolution and macroscopic mechanical behavior. Int. J. Plast. 2014, 52, 105–116. [Google Scholar] [CrossRef]
  35. Zhang, J.; Li, Z.; Wen, K.; Huang, S.; Li, X.; Yan, H.; Yan, L.; Liu, H.; Zhang, Y.; Xiong, B. Simulation of dynamic recrystallization for an Al-Zn-Mg-Cu alloy using cellular automaton. Prog. Nat. Sci. 2019, 29, 477–484. [Google Scholar] [CrossRef]
Figure 1. Electromagnet rotation-type quick-stop device: (a) experimental device diagram, (b) device schematic diagram, and (c) cutting schematic diagram.
Crystals 14 00672 g001
Figure 2. Laser confocal microscope.
Crystals 14 00672 g002
Figure 3. Schematic diagram of the PZ model.
Crystals 14 00672 g003
Figure 4. CA model settings: (a) neighbor type; (b) boundary condition.
Crystals 14 00672 g004
Figure 5. Initial organizational evolution: (a) cas = 1, (b) cas = 201, (c) cas = 401, (d) cas = 601, (e) cas = 801, (f) cas = 1001, (g) cas = 1201, and (h) cas = 1401.
Crystals 14 00672 g005
Figure 6. DRX microstructure generated under different initial austenite microstructures: (a1a4) low DRX degree; (b1b4) high DRX degree.
Crystals 14 00672 g006
Figure 7. The initial austenite microstructure used for DRX input.
Crystals 14 00672 g007
Figure 8. Three-dimensional model: (a) initial microstructure model; (b) DRX model.
Crystals 14 00672 g008
Figure 9. Flow chart of overall modeling process.
Crystals 14 00672 g009
Figure 10. Flow stress curve of DRX process.
Crystals 14 00672 g010
Figure 11. The variation of dislocation density during DRX process: (a) ε = 0.04, (b) ε = 0.065, (c) ε = 0.085, (d) ε = 0.13, (e) ε = 0.6, and (f) ε = 1.5.
Crystals 14 00672 g011
Figure 12. Flow stress curve: (a) strain rate = 0.5 s−1, (b) strain rate = 1 s−1, (c) strain rate = 2 s−1, and (d) strain rate = 4 s−1.
Crystals 14 00672 g012
Figure 13. DRX microstructures obtained by CA simulation at different strain and strain rates: strain: (a1c1) ε = 0.5, (a2c2) ε = 1.0, (a3c3) ε = 2.0, and (a4c4) ε = 3.0 in rows 1–4; strain rate: (a1a4) 0.5 s−1, (b1b4) 1.0 s−1, (c1c4) 2.0 s−1 in columns a–c.
Crystals 14 00672 g013
Figure 14. Influence of strain rate on DRX-related parameters: (a) grain size, (b) flow stress, (c) DRX rate, and (d) number of grains.
Crystals 14 00672 g014
Figure 15. DRX microstructures obtained by CA simulation at different strain rates and deformation temperatures: strain: (a1c1) ε = 0.5, (a2c2) ε = 1.0, (a3c3) ε = 2.0, and (a4c4) ε = 3.0 in rows 1–4; deformation temperature: (a1a4) 950 K, (b1b4) 1000 K, (c1c4) 1050 K in columns a–c.
Crystals 14 00672 g015
Figure 16. Influence of deformation temperature on DRX-related parameters: (a) grain size, (b) flow stress, (c) DRX rate, and (d) number of grains.
Crystals 14 00672 g016
Figure 17. Parameter distributions of the PZ: (a) strain rate, (b) strain, (c) temperature, and (d) stress.
Crystals 14 00672 g017
Figure 18. Parameter distribution of each partition in the PZ: (a) strain rate, (b) strain, (c) temperature, and (d) stress.
Crystals 14 00672 g018
Figure 19. The distribution curves of average radius of grains and recrystallization.
Crystals 14 00672 g019
Figure 20. Observation of the DRX state of the shear plane.
Crystals 14 00672 g020
Figure 21. Simulated and experimental grain size distributions: (a) y = 0.01 mm, (b) y = 0.021 mm, (c) y = 0.025 mm, and (d) error.
Crystals 14 00672 g021
Table 1. Physical properties of Ni50.8Ti49.2 [26].
VariableValue
Density (kg/m3)6450
Thermal conductivity (W/m·°C)18
Poisson’s ratio0.3
Melting temperature (°C)1240
Thermal expansion coefficients (×10−6)11.3
Specific heat capacity (J/kg·°C)837.36
Table 2. Experimental parameters.
VariableValue
Cutting depth (mm)0.02
Cutting width (mm)0.04
Cutting velocity (m/min)650
Rake angle (deg)18
Table 3. Constitutive model parameters of Ni50.8Ti49.2 [26].
VariableValue
Yield strength A (MPa)1004
Thermal softening coefficient m1.64
Strain rate sensitivity coefficient C0.22
Reference strain rate ε ˙ 0 (s−1)2000
Melting point temperature Tm (K)1240
Reference temperature Tr (K)350
Table 4. CA model parameters [30].
VariableValue
Grain boundary migration energy Qb (kJ·mol−1)297
Shear modulus μ1 (MPa)7.89 × 10⁴
Poisson’s ratio v0.3
Burgers vector b (m)2.49 × 10⁻¹⁰
Disclaimer/Publisher’s Note: The statements, opinions and data contained in all publications are solely those of the individual author(s) and contributor(s) and not of MDPI and/or the editor(s). MDPI and/or the editor(s) disclaim responsibility for any injury to people or property resulting from any ideas, methods, instructions or products referred to in the content.

