Article

Advances in the Parameter Space Concept towards Picometer Precise Crystal Structure Refinement—A Resolution Study

by
Matthias Zschornak
1,2,*,
Christian Wagner
1,
Melanie Nentwich
3,
Muthu Vallinayagam
1,2 and
Karl F. Fischer
4,†
1
Center for Efficient High Temperature Processes and Materials Conversion ZeHS, Freiberg University of Mining and Technology, Winklerstr. 5, D-09596 Freiberg, Germany
2
Faculty of Physics, University of Applied Sciences, Friedrich-List-Platz 1, D-01069 Dresden, Germany
3
Deutsches Elektronen-Synchrotron DESY, Notkestr. 85, D-22607 Hamburg, Germany
4
Institute of Experimental Physics, Saarland University, D-66123 Saarbrücken, Germany
*
Author to whom correspondence should be addressed.
Deceased on 29 October 2023.
Crystals 2024, 14(8), 684; https://doi.org/10.3390/cryst14080684
Submission received: 10 June 2024 / Revised: 5 July 2024 / Accepted: 23 July 2024 / Published: 26 July 2024
(This article belongs to the Section Crystal Engineering)

Abstract

:
The Parameter Space Concept (PSC) is an alternative approach to solving and refining (partial) crystal structures from very few pre-chosen X-ray or neutron diffraction amplitudes without the use of Fourier inversion. PSC interprets those amplitudes as piecewise analytic hyper-surfaces, so-called isosurfaces, in the Parameter Space, which is spanned by the spatial coordinates of all atoms of interest. The intersections of all isosurfaces constitute the (possibly degenerate) structure solution. The present feasibility study investigates the La and Sr split position of the potential high-temperature super-conductor (La0.5Sr1.5)MnO4, I 4 /mmm, with a postulated total displacement between La and Sr of a few p m by theoretical amplitudes of pre-selected 0 0 l reflections ( l = 2 , 4 , , 20 ). The revision of 15-year-old results with state-of-the-art computing equipment enhances the former simplified model by varying the scattering power ratio f La / f Sr , as exploitable by means of resonant scattering contrast at synchrotron facilities, and irrevocably reveals one of the two originally proposed solutions as being a “blurred” pseudo-solution. Finally, studying the resolution limits of PSC as a function of intensity errors by means of Monte-Carlo simulations shows both that the split can only be resolved for sufficiently low errors and, particularly for the resonant scattering contrast, a theoretical precision down to ± 0.19   p m can be achieved for this specific structural problem.

1. Introduction

Within the last 15 years, the Parameter Space Concept (PSC) was theoretically developed by Fischer, Kirfel and Zimmermann in a series of six publications, e.g., Refs. [1,2], as an alternative approach to solving and refining (partial) crystal structures from diffraction amplitudes without the use of Fourier synthesis. The latter maps the electron or scattering density distribution ρ ( x , y , z ) for 0 x , y , z < 1 in the crystallographic unit cell (or in its asymmetric part). In contrast, PSC uses direct Fourier transforms in order to reveal the dependence of scattering amplitudes on the values of the structural parameters and their correlations. Hereby, the intrinsically as free considered 3 m parameters of an m atomic structure span its 3 m -dimensional Parameter Space (PS) P 3 m with an orthonormal basis in R 3 m real space [3]. As in the framework of structure factors F, the periodicity of F limits the Parameter Space to an 3 m -dimensional unit cell in the form of a ‘cube’ [ 0 , 1 ) 3 m . Each combination of coordinates results in a specific amplitude | F ( h k l ) | for a reflection h k l . If the experimental amplitude of a reflection is known from measurements, the possible coordinate combinations ensuring this amplitude are restricted by a piecewise analytic hyper-surface, a manifold of ( 3 m 1 ) dimensions called the isosurface of | F ( h k l ) | . Generally, each intersecting isosurface reduces the possible structure solutions by one dimension. The solution vector is the intersection of all such isosurfaces [3].
An essential feature of the PSC is as follows: If more than one solution reproduces the experimental observations within the accuracy limit, the PSC presents all those solutions, in contrast to conventional methods. Furthermore, the PSC intrinsically allows for the easy implementation of resonant scattering contrast, which may significantly boost the resolution, as demonstrated in Section 3.
To keep computing demand under control, we simplify the problem by one-dimensional projections of the structure onto the x, y, and z axes and subsequently interconnect these projected solutions [4]. For a one-dimensional structure projection, e.g., onto the z axis, only m independent isosurfaces for | F ( l ) | : = | F ( 00 l ) | are needed to define the “solution point” for the structure projection onto this axis.

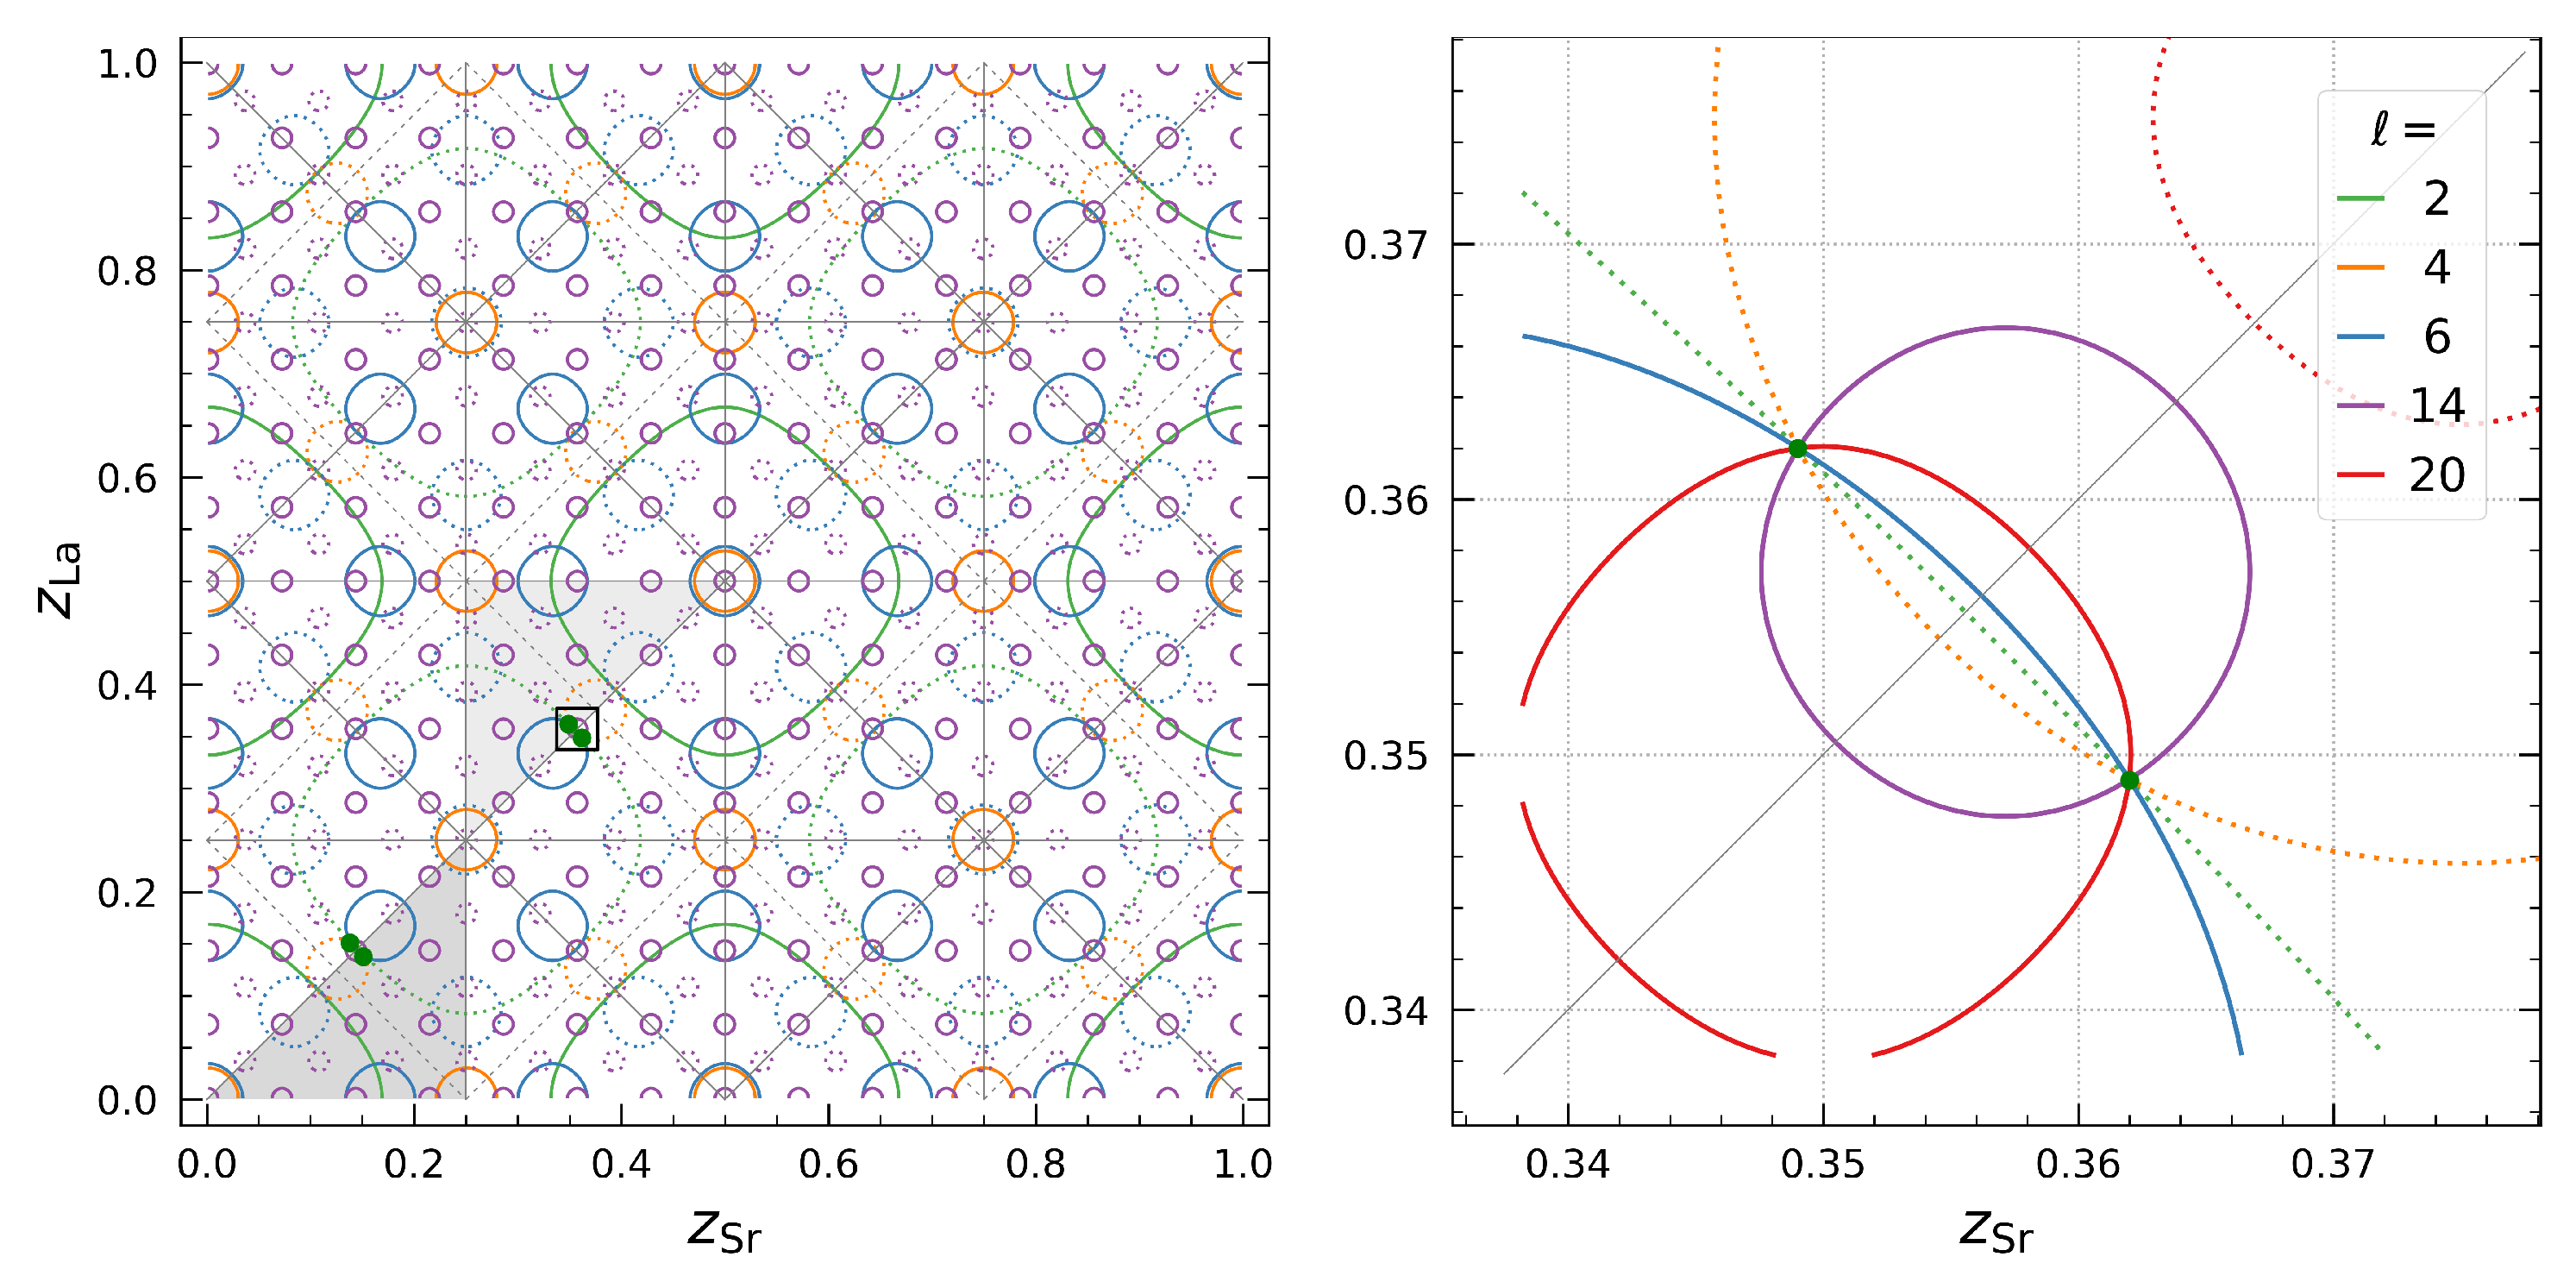
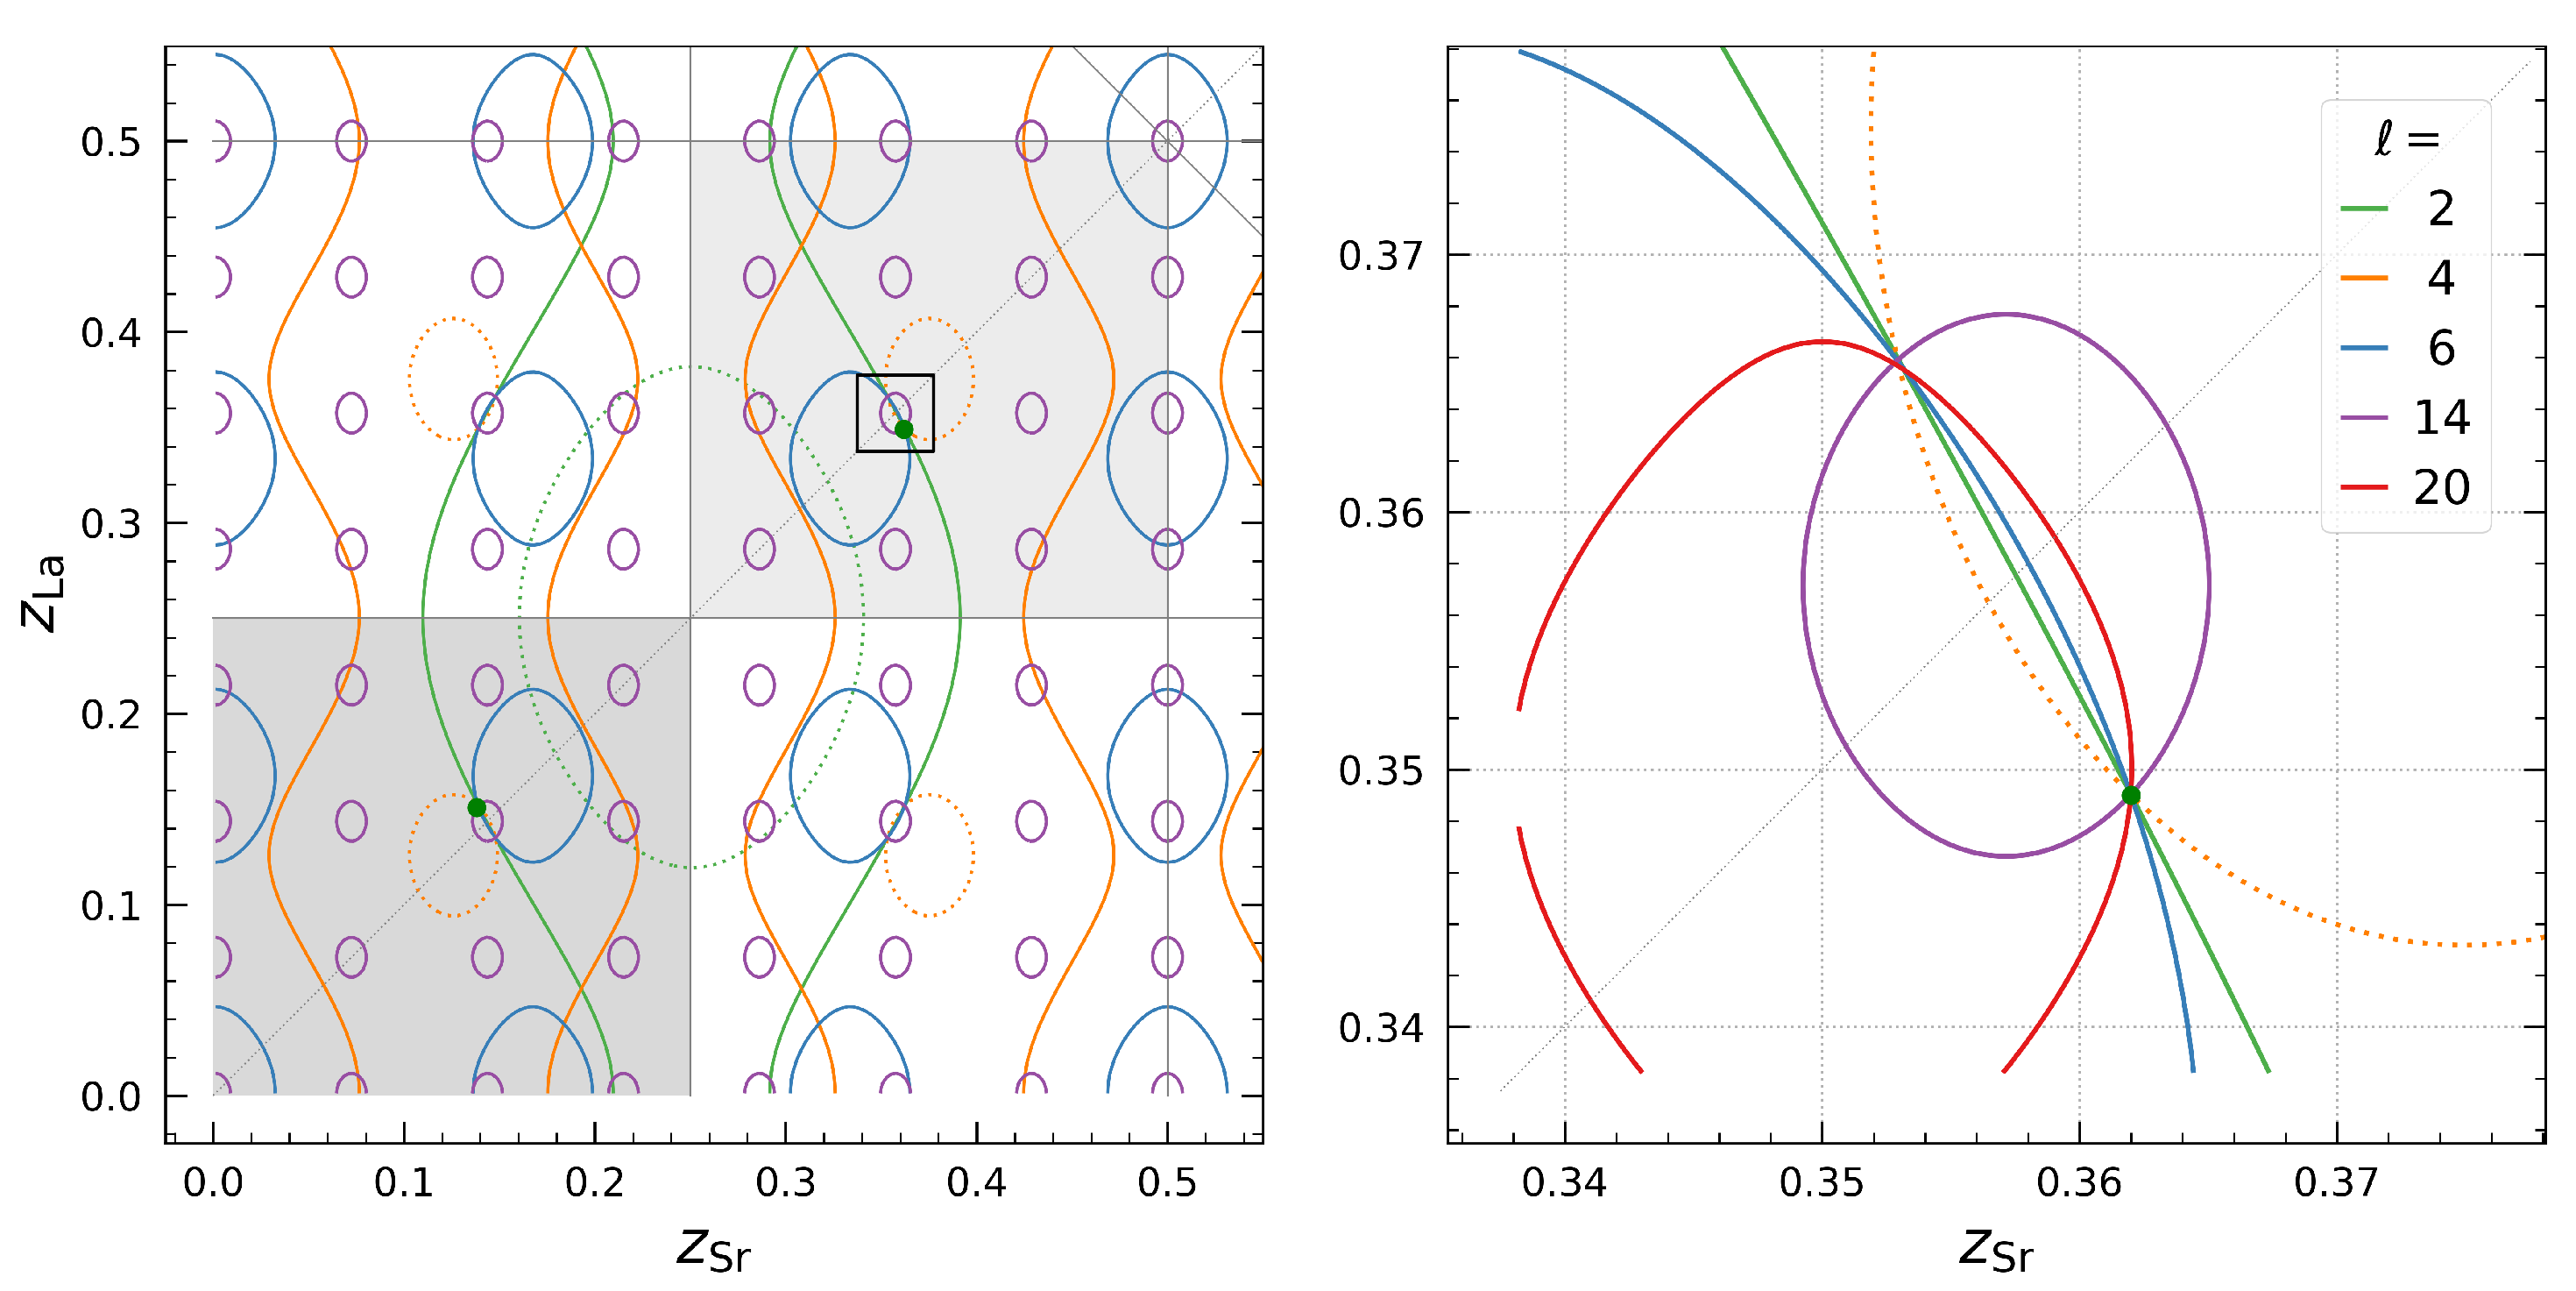
2. The Object and Its PSC-Handling

Regarding the positions of La and Sr within the crystal structure of the multiferroic (La0.5Sr1.5)MnO4 in the context of the present work, which is isostructural to the high-temperature super-conductor (La1−xSr1+x)CuO4 and shows complex spin, charge, and orbital ordered ground states below 230 K [5], initial data can be used from prior experiments reported in the literature, and theoretical considerations can be assessed through DFT modeling. As has been determined by powder and by single crystal diffraction using neutrons as well as X-rays, the crystal structure of (La0.5Sr1.5)MnO4 has a space group I 4 / mmm (139), with the lattice parameters a = 3.863 Å and c = 12.421 Å [6]. In the reported structure, La and Sr occupy the same equal point ( 0 , 0 , z 0 ) with an originally determined z 0 of 0.35816 ( 3 ) (error in brackets of the presented digital precision), and thus, 0.5 z 0 = 0.14184 . In addition, multipole refinements on accurate high-energy data (100 k e V , i.e., λ = 0.124 Å ) up to sin θ / λ = 1.1 Å 1 and R ( F ) = 0.009 were performed [7] with a resolution of about 1 pm . These data indicated the possibility of split positions for the cations La and Sr with a difference in z of Δ z : =   | z Sr z La |   0.0016 , i.e., 2.0 p m , well beyond the limit of resolution for this data set. To achieve a reliable estimate from ab initio electronic structure calculations, we performed preliminary modeling by means of density functional theory (see Appendix A for more details) in a 2 × 2 × 1 supercell. The results support an atomistic La/Sr split, predicting a value of about Δ z = 0.0034 ( 4.2 pm ).
Instead of performing, e.g., a least-squares refinement on all structure parameters based on a full three-dimensional data set, this problem can be investigated with PSC, as has already been carried out by Kirfel et al. [8]. Since the free coordinates only point along the c direction, the problem can be treated in a one-dimensional primitive lattice by employing only 0 0 l reflections, which account for the projection of the structure onto [0 0 l] [8]. Considering La / Sr partial structure contributions according to the Equal Point Atom (EPA) model [1,3] upon using for the atomic structure factors f the simplification f La = f Sr = 1 , the corresponding PSC model for the La / Sr split position is a centric two-dimensional Parameter Space P 2 . The permutation symmetry is reflected in the small asymmetric unit of the Partial Geometric Structure Factor  G 2 within the Parameter Space P 2 = z La z Sr , as indicated by the gray shaded area in Figure 1 (cf. Ref. [8]). Here, G 2 is defined as
G 2 ( l ) = s ( l ) g ( l ) = 2 j = Sr , La o j cos 2 π l z j + cos 2 π l ( z j + 0.5 ) ,
where s ( l ) depicts the sign and g ( l ) the amplitude of the expression, and o j is the occupancy of the crystallographic site. In general, the Geometric Structure Factor  G ( l ) = j = 1 m cos 2 π l z j represents the full centrosymmetric structure of m atoms in the EPA model.
In the early test calculations, Kirfel et al. assumed a rather large split of Δ z = 0.01 [8], as they did not expect to reach the (much smaller) estimation of the experiment [7]. The PSC approach then recovered the positions z La = 0.349 ( 2 ) and z Sr = 0.362 ( 2 ) with a split of Δ z = 0.013 . Alternatively, they also determined the z coordinates, using a batch of 300 calculations, to be z Sr z La = 0.0142 0.0150 with estimated errors of 0.0021 0.0038 (from Gaussian distribution fits and their single half-widths). For this approach, they put a maximum relative statistical data error of 10% or 20%, respectively, onto the G 2 values [8]. Both results reflect the identified split position close to the presumed z Sr z La = 0.360 0.350 = 0.010 , albeit with a significant offset of about 30%.
As a basis for the subsequent analysis of smaller and more reasonable splits, we recreated these calculations within the EPA model with state-of-the-art computing equipment, only using the Sr/La substructure with the originally applied split of Δ z = 0.01 for comparison. We calculated the diffraction amplitudes from the (La0.5Sr1.5)MnO4 structure, as determined by Senff et al., at room temperature [6]. Figure 1 shows the corresponding isolines for the reflections 0 0 l with l = 2 , 4 , , 20 for this very simple case. The PSC approach finds the exact solution without offset. Due to the permutation symmetry of P 2 , a second exact pseudo-solution is evident with interchanged La/Sr z-coordinates. None of the five selected reflections used in this figure had small amplitudes (this also applies to Figure 2); they were chosen because their isolines intersect at large angles, while others present severe correlation effects, and hence, do not provide optimal resolution results.

3. Resolution Studies

The following resolution study improves the performance of the simple PSC approach used by Kirfel et al. [8]. We evaluated the limits of the PSC method with dependence on different data qualities for this specific structural case. This goal was achieved, on the one hand, by abandoning the EPA model and taking into account a series of smaller positional splits, and on the other hand, by introducing enhanced (resonant) scattering contrast. The 0 0 l reflection intensities were calculated for l = 2 , 4 , , 20 at a wavelength of λ = 0.82656 Å (i.e., 15 k e V ) and, in addition, at λ e = 0.77009 Å (i.e., 16.1   k e V ), which is just below the excitation of the Sr-K absorption edge. These complementary calculations vary the scattering strength specifically of Sr and artificially enhance the contrast by means of dispersion-modified | F ( l ) | based on a significantly varying f Sr ( 2.25 at 15   k e V up to 11.04 at 16.1   k e V ) with f Sr about constant at 0.61 0.54 [9]. The structural scenario is not altered; only the incident photon energy is altered. This resonant contrast has been widely used in Resonant X-ray Diffraction for accurate crystal structure refinements (e.g., [10,11,12,13]), and may even become the dominant signal in the case of purely resonant diffraction at forbidden reflections (e.g., [14,15,16]).
In short, the following consecutive enhancements cover the following: (a) different real f (thus breaking the permutation symmetry of the EPA model; see solutions in Figure 1), (b) some smaller Δ z model assumptions and respective PSC resolution for several data qualities, and (c) resolution enhancement using energy-dispersive amplitude differences and the respective resonant contrast.

3.1. Step 1: Going beyond the Equal Point-Atom Model

In the first step, the scattering contributions of La and Sr are treated by computing the conventional structure factor F ( l )
F ( l ) = 2 j = Sr , La o j f j cos 2 π l z j + cos 2 π l ( z j + 0.5 ) + F MnO 4 fix ( l )
taking into account the specific scattering power of each atomic species by including the respective atomic scattering factors f j , omitting temperature effects (and accordingly, atomic displacement parameters). Again, we explore the Parameter Space for z Sr and z La , but with an additionally fixed MnO4 partial structure contribution F MnO 4 fix . Potential charge ordering on Mn electronic configurations is not accounted for in the presented work. To better understand the positional correlations, we incrementally increase the complexity and consider in this step only the non-resonant Thomson scattering contributions f j ( l ) = f 0 , j ( l ) [17] without dispersion corrections. While irrelevant for the EPA solution, now, a qualitative choice has to be made regarding the displacement direction of La and Sr. Following our preliminary DFT results, we define La as depicted in the zoomed-in area of Figure 2 (green dot) with the larger z coordinate. As f Sr f La , this induces a break of permutation symmetry in the Parameter Space, doubling the two-dimensional asymmetric unit (Figure 2, in comparison to Figure 1), as expected. The disproportionated La/Sr scattering strength results in elongation and contraction of the isosurfaces, which lifts the mirror symmetry along z Sr = z La . Additional qualitative changes in the isosurfaces’ landscapes originate from the inclusion of the MnO4 partial structure. By fixing the known MnO4 contribution, the herein defined “core question” of determining two z parameters can be approached independently of the noise from all the other structural parameters (and from almost all three-dimensional experimental measurements). Again, the PSC approach finds the exact solution without offset. Now, the exact pseudo-solution ( z Sr * , z La * ), formerly at inverted coordinates (cf. with Figure 1), shifts to the coordinates z Sr * 0.36 , z La * 0.35 .
For the discussed Sr/La split position, the “broken symmetry” may result either in two statistically occupied, equivalent 4 e positions ( 0 , 0 , z ) for Sr and La, keeping the space group I 4 / mmm, or in an asymmetric split of the position, a reduction in the space group’s symmetry, and possibly a superstructure of a multiple-cell volume. This cannot be answered at present without experimental details.
Figure 2 reveals that in general, isosurfaces (herein isolines) of larger l have stronger curvatures and higher gradients due to shorter periodicities, which is valid for the Parameter Space of any dimension. In terms of contrast, gradients may become especially large for isosurfaces of small or vanishing amplitudes (though they vary along the isosurfaces). This can be seen from the development of a structure factor close to zero intensity for small atomic displacement r j r j 0 + u
F ( E , Q ) = j = 1 m o j f j ( E , Q ) e M j e i Q r j = F u = 0 0 + F u k u = 0 u k + 1 2 2 F u k u l u = 0 u k u l + j = 1 m o j f j e M j e i Q r j 0 · i Q k u k 1 2 Q k Q l u k u l ,
with occupancy of the crystallographic site o j , the momentum transfer vector Q , and the Debye–Waller factor e M j taking into account the reduction in the scattering amplitude due to the uncertainty in the position r j of atom j (Einstein’s sum convention on k, l) [13]. Thus, these regions of high contrast provide the largest change in the amplitude’s interference balance, accompanied by enhanced sensitivity, reflecting the correlated structural dependencies not only respecting the direction of the gradient, but generally of any individual atomic position as well. Only for very specific correlated parameter changes along the m 1 dimensional manifold of the isosurface can the balance of destructive interference be kept fulfilled. This enhanced sensitivity to positional changes is similar to the high contrast for atomic displacements achieved by the Resonantly Suppressed Diffraction method, which varies the scattering power of certain atomic species by means of dispersion corrections [13].
Error-free isosurfaces of a given amplitude have no thickness, and are thus manifolds of no volume in the respective Parameter Space. Yet, a certain thickness occurs as soon as data sets have an error distribution. However, this non-vanishing volume for the solution space is less pronounced along large gradients. Thus, for obtaining a high resolution, the optimal reflections can be selected from a given set of observations (provided the parameter region investigated is sufficiently close to the final result), choosing high order, low amplitude, minimal | F | / | l | , and a low correlation with other isosurfaces (i.e., large intersection angles). If these (few) optimal reflections are measured more accurately, they provide the best basis for high resolution at low cost for synchrotron or neutron beamtimes. To select a set of low-correlated reflections, possible candidates are easily identifiable in the Parameter Space from isosurface representations as well; high correlation coefficients between two parameters show themselves on the basis of nearly parallel isosurfaces, i.e., through small intersection angles. The optimal parameters are thus obtained by selecting reflection amplitudes that intersect orthogonally at best.

3.2. Step 2: Variations in Atomic Scattering Power

To assess the general impact of resonant scattering contrast on the positional resolution, e.g., specifically in the smooth pre-edge regions of La and Sr without fine structure oscillations due to absorption effects, we varied the scattering strength ratio f La / f Sr while keeping the product f La · f Sr fixed. Within the chosen range of f La / f Sr up to a scaling factor of 10, the coordinates of the sharp solution vector have to remain constant, of course, as they resemble the true structural positions. However, the position of the pseudo-solution changes significantly in the relative coordinates (Figure 3a). As is evident, this qualitative displacement of the pseudo-solution vector in Parameter Space scales with the variation in the scattering power. This conclusion will generally hold for any structural pseudo-symmetry scenario with a false solution close to the true one. Since the element-specific weights of the partial structure contributions are directly varied, the isosurfaces’ boundary conditions of fixed amplitudes (Figure 3b,c) can only be maintained for the pseudo-solution by a hypothetical positional shift in the Parameter Space, whereas the true solution acts like an anchor for each isosurface. This immediately suggests the existence of a general concept to separate PSC solution volumes and identify false pseudo-solutions by using data sets of two photon energies offering different atomic scattering strength ratios, similar to resonant contrast in Resonant X-ray Diffraction methods. As expected from symmetry considerations according to the EPA model, the pseudo-solution has a minimum standard deviation of about 1 × 10⁻⁴ for f La = f Sr and increases by about one decade for disproportionated scattering strengths.
Further, the positions of the “lighter” atoms (with smaller f) are less well-defined (see Figure 3a), which coincides with the elongation of isosurfaces in these directions (Figure 3b,c). In the limit of zero contribution, the isosurfaces are indifferent to the position of that particular “zero electron” atom. Although in an absolute comparison, La is the heavier atomic species, the errors for “light La” are in the same magnitude as those for “light Sr”, because Sr has a triple stoichiometric weight. In addition, the limits for the resulting linear solution vector series (red dots in Figure 3a) are defined by twice the presumed difference Δ z .

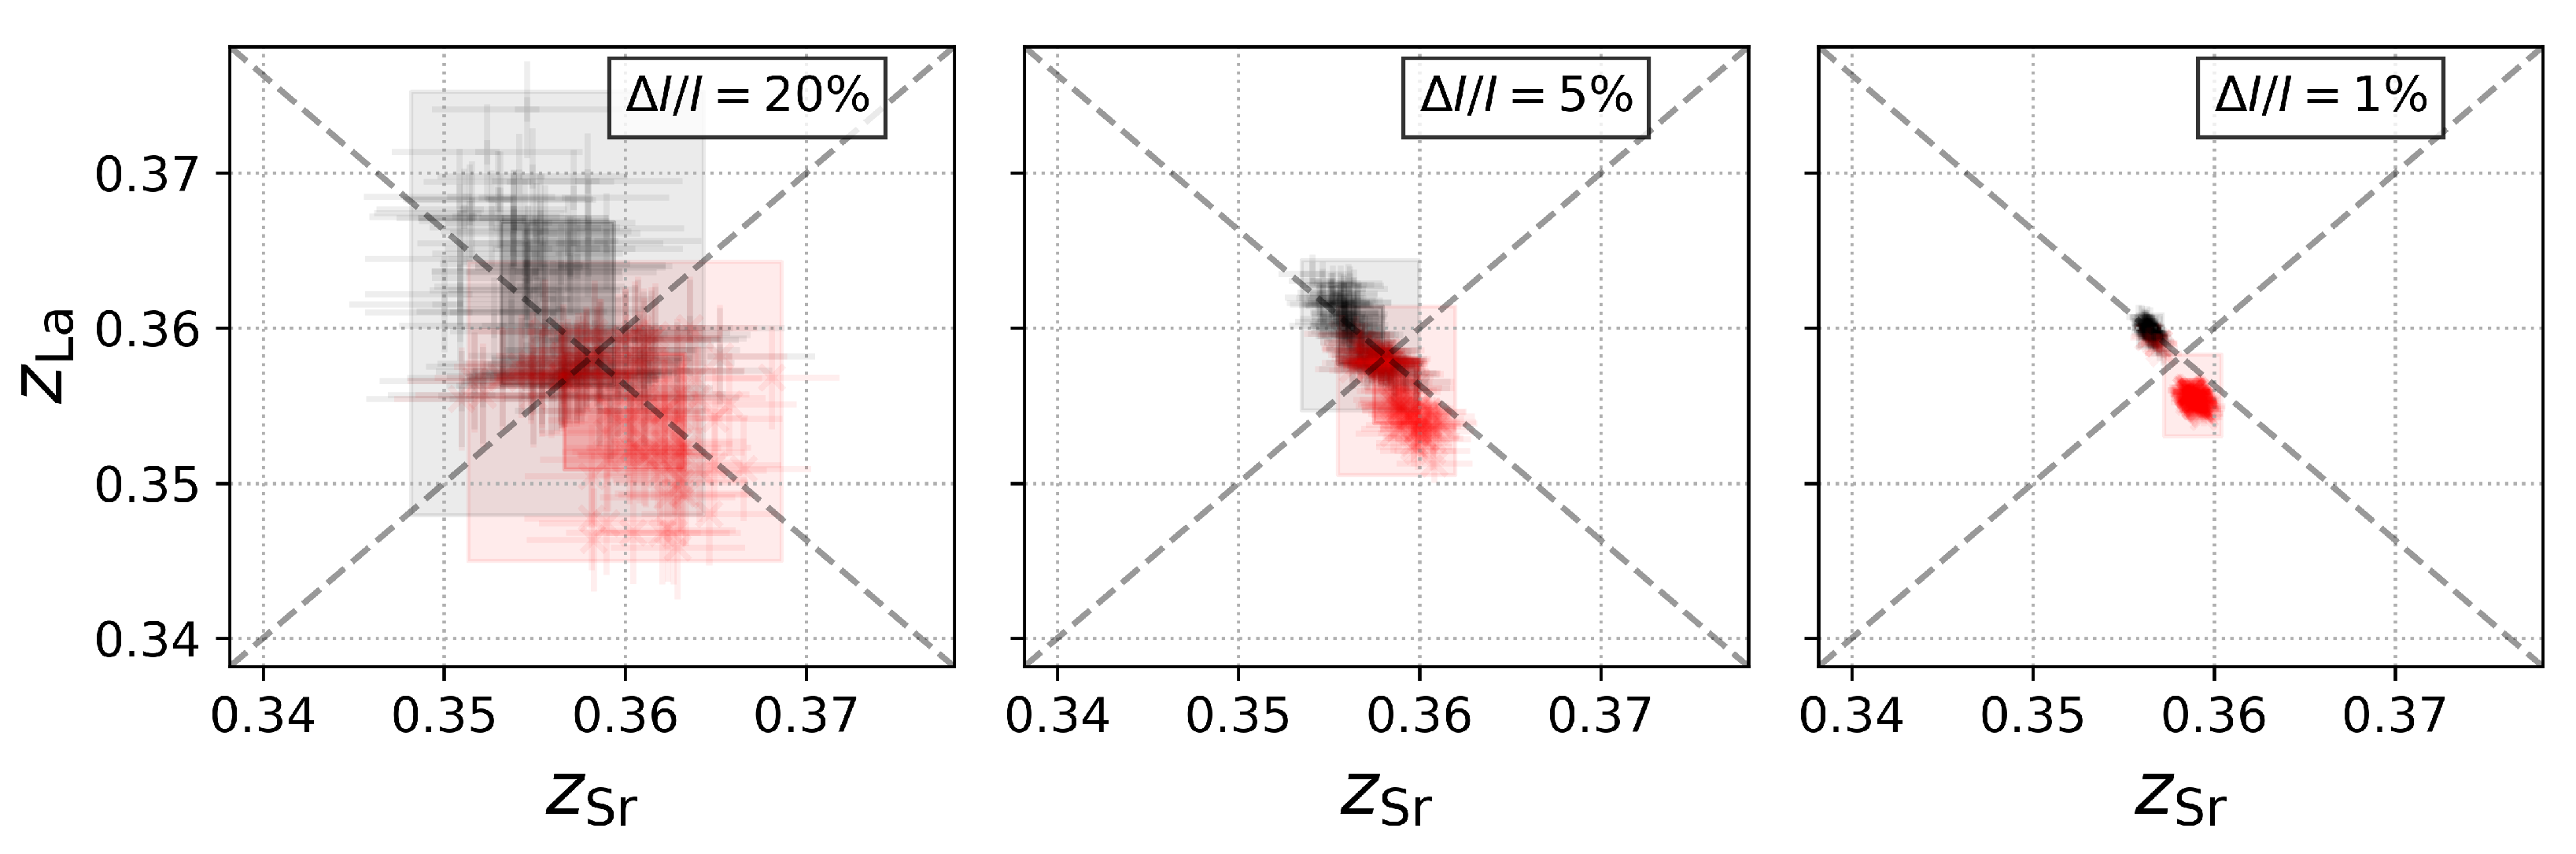
3.3. Step 3: Intensity Errors and Monte-Carlo Calculations

In this step, we studied the robustness of the PSC to reveal the presumed split position with respect to reflection intensity errors by means of Monte-Carlo calculations, similar to the approach by Kirfel et al. [8] and later by Zschornak et al. [18], now using the DFT-predicted more realistic split of Δ z = 0.0034 ( 4.2   p m ) for three error distributions Δ I / I of 20%, 5%, and 1% (Figure 4). Again, we performed the calculations with structure factors for the full structure, varying z La and z Sr while keeping the MnO4 contribution fixed. To implement conditions as close as possible to the experimental observations, we then analyzed the reflection intensities I = | F ( l ) | 2 .
By applying statistically, i.e., Gaussian, distributed artificial intensity errors of up to 20% to the theoretical data, we obtain quite different behavior as a function of the introduced intensity error. For the low-quality data with Δ I / I = 20%, only one solution vector is allocable within the 2.6 σ and 1 σ confidence regions in Parameter Space. In the free z parameters of La and Sr, the statistical center of the best fits is the high-symmetry position. Hence, low-quality data cannot identify two separate solutions. However, they may provide a hint, and by using better measurements, this hint is confirmed [18]. For the medium-quality data with Δ I / I = 5 % , two distinct solution vectors (Figure 4) become evident within the σ confidence region, confirming a split position. Only a few random error distributions result in the high-symmetry solution in the central region of the depicted Parameter Space. For the high-quality data with Δ I / I = 1 % , the split positions are the clear structure solution even within the 2.6 σ confidence region, with the pseudo-symmetric solution well separated as a second solution vector.
In conclusion, the split along the z axis can be effectively resolved as 0.0034 ± 0.0003 , corresponding to approx. ( 4.2 ± 0.4 )   p m , for sufficiently good data quality. The positional least-squares fit errors from random intensity errors are dominant in comparison to the fit errors from disproportionated scattering factors of the pseudo-solution (Step 2, magnified by a factor of 10 in Figure 3).

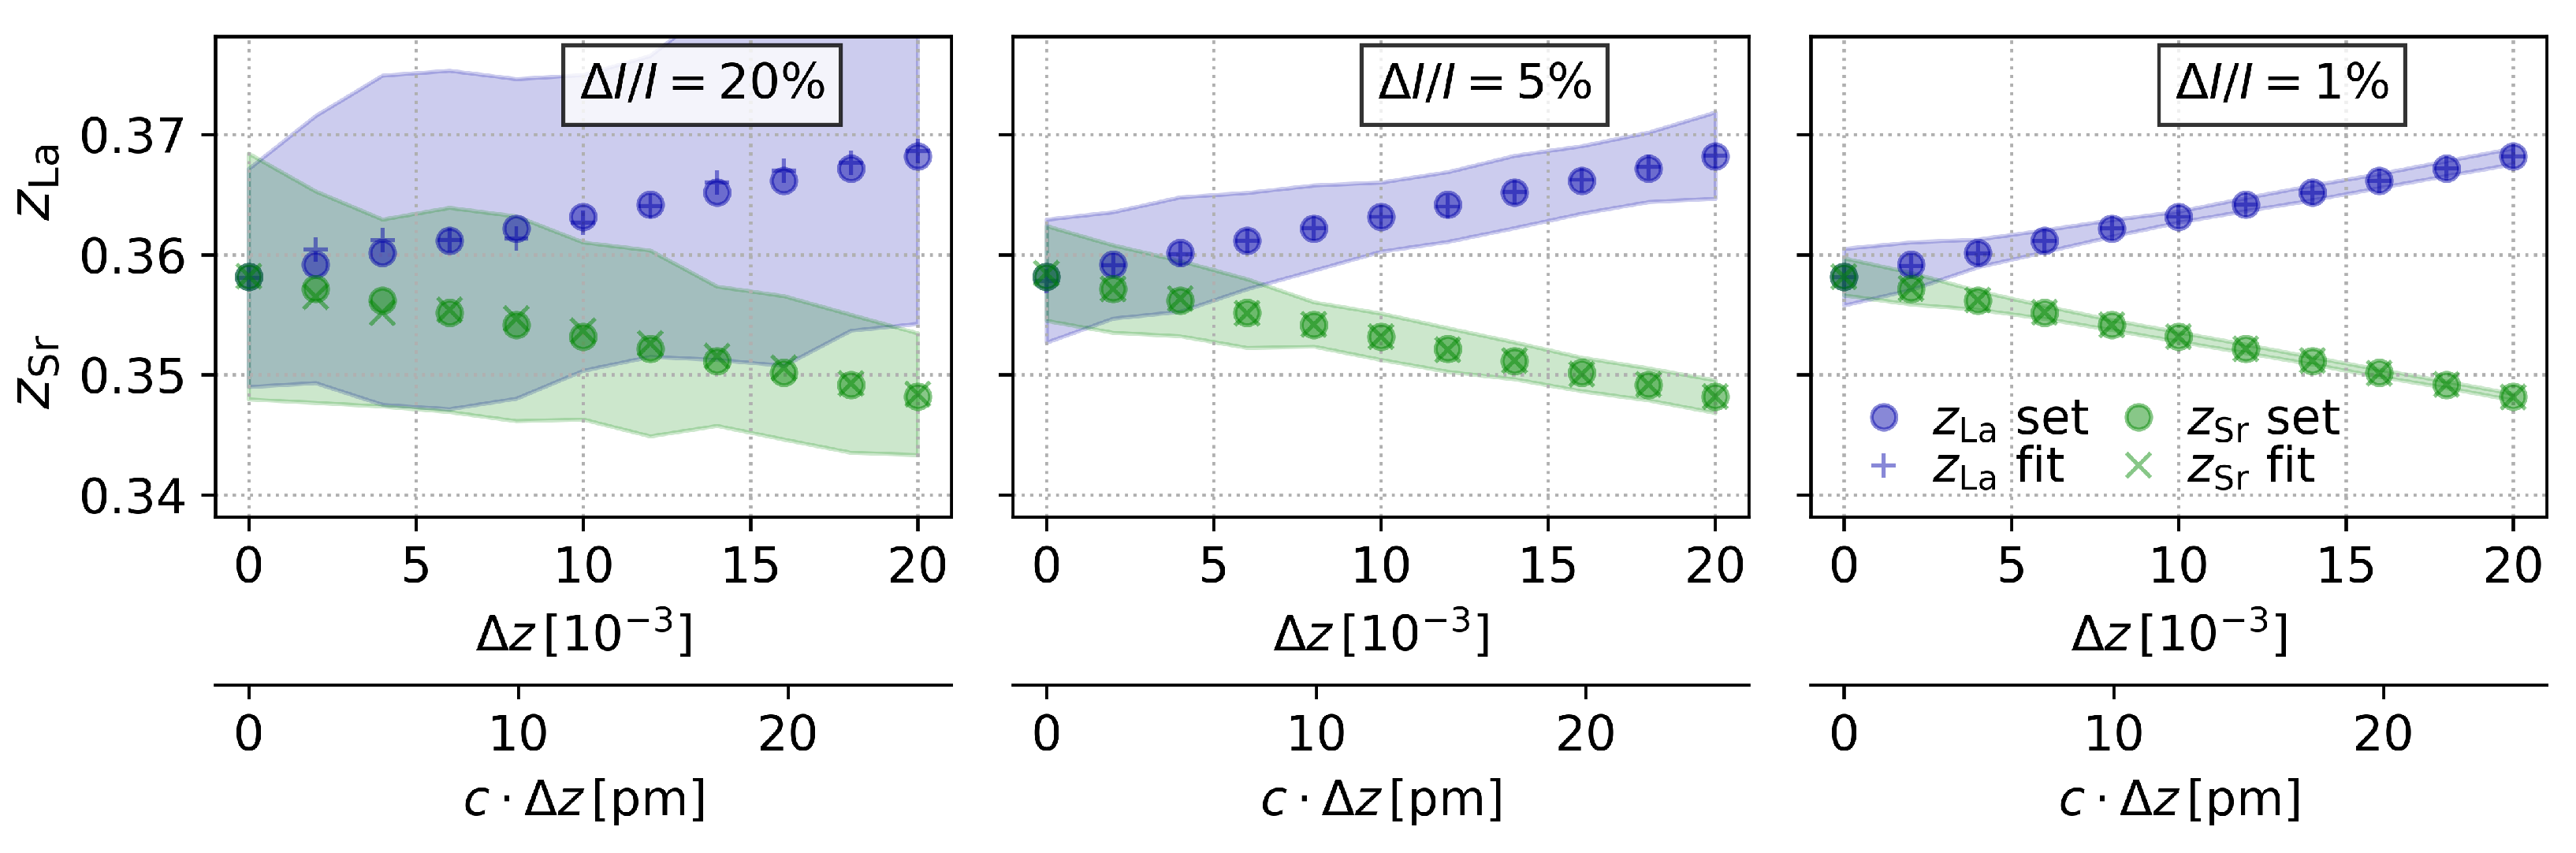
3.4. Step 4: Dependence of the Resolution on the Intensity Error

We tried to answer the question “What is the smallest difference Δ z that can be separated with a confidence level of 2.6 σ = 99 % by the above Monte-Carlo calculations?”. Figure 5 shows Monte-Carlo simulations of the (La0.5Sr1.5)MnO4, I 4 / mmm, structure for a series of different z La and z Sr input values and for different assumed data qualities. The resulting fits represent overlapping error envelopes for the z Sr and z La positions, respectively. For medium-quality data with Δ I / I = 5 % , a Δ z of 0.007 can be separated, which corresponds to 8.5   p m . For Δ I / I = 1 % , a resolution of Δ z > 0.003 ( 3.7   p m ) is possible. The precision of the method is even much ( > 10 1 ) better for finding the respective solution vectors. Further, it is evident what has already been found in Step 2: for poor data quality Δ I / I = 20%, the split position cannot be verified within the calculated Δ z range.

3.5. Step 5: Pushing the Limits of the PSC

Here, we offer an estimate of the maximum resolution that may be achieved by means of enhanced resonant scattering contrast, as well as extraordinary data quality, with Δ I / I = 1 % , e.g., in synchrotron conditions. For this purpose, we consider two different X-ray photon energies: one far away and one just below the Sr-K absorption edge at 15 k e V and 16.1   k e V , respectively, and apply the tabulated dispersion corrections, at 15 keV: f Sr + i f Sr = 2.25 + i 0.61 and at 16.1 keV: f Sr + i f Sr = 11.04 + i 0.54 [9]. The dispersion contrast results in particular from the huge change in the Sr partial structure weight induced by strongly varying f Sr in the structure factor.
Regarding the pseudo-solution, the relative influence of this correction to the scattering power of Sr is different for each reflection, and therefore, the deformation of the corresponding isosurface as well. The pair-wise intersections are thus distributed for the pseudo-solution in the p m range. For low-indexed reflections l 10 , this effect appears as two accumulation points along the linear relation depicted in Figure 3. (Figure 6, inset, upper right). Including higher-indexed reflections, the distribution of isosurface intersections becomes even broader and the volume of the pseudo-solution “blurs” (Figure 6, inset, lower right), whereas the true solution remains sharp. Consequently, as long as the error margins of the isosurfaces are sufficiently small, the pseudo-solution can be identified as a “false” solution, which is incompatible with the experimental observations.
Further, we focus on the sharp solution, which is equivalent to studying the sheer difference Δ z , without the discussion of the pseudo-solution. Specifically, Figure 6 demonstrates that reflections with low indices show strong covariance for an antisymmetric change in positions; in particular, the reflection 0 0 14 lifts this correlation. We achieved an estimated theoretical precision in the z coordinates of ±0.00015 corresponding to about ± 0.19   p m (Figure 6). Besides the resonant contrast, this seemingly extreme value is due to strong gradients of high-indexed reflections [18], which is valid here, especially for both energies of reflection 0 0 16 . Additional improvements are possible in principle, e.g., if high-indexed small amplitudes are available, presenting strong relative resonant contrast.

4. Discussion

The present work is a feasibility study based on synthetic data. It is, however, close to reality because several typical intensity error distributions are considered in the framework of kinematic diffraction. While abandoning the EPA model (Step 1, generally better for neutron diffraction), we prove both the enhanced resolution and precision of the coordinates through f contrast (Steps 2 and 5). Compared with preceding work [18], further qualitative and quantitative progress is achieved, as we now resolve realistic splits in the order of 4 p m (Step 3 and 4), as indicated by our preliminary DFT modeling.
In terms of resolution limits, the PSC offers very high theoretical precision, even well below the 1 p m range, when additionally using resonant contrast enhancement for the discussed two-dimensional Parameter Space case. This result is feasible, since the method does allow the easy implementation of resonant scattering contrast and directly relies on absolute intensities (normalized to the primary beam) errors. The resolution of ± 0.19   p m is comparable with that of Richter et al. [13]. Instead of fitting full spectra, herein, we employ precise standard reflection amplitudes for two wavelengths. Nevertheless, as soon as intensity errors are considered within a typical range between 5% and 20%, the precision drops significantly to about 10 p m , and pseudo-symmetries based on static atomic displacements smaller than this limit cannot be resolved. Crystal preparation techniques [19,20] as well as changes in environmental conditions [21,22,23], may severely affect X-ray diffraction data quality, with high data quality being an essential prerequisite for obtaining precise and reliable structural data. The influence of real structure and temperature effects on the resolution is the focus of ongoing research and will be discussed in consecutive work. In principle, isotropic as well as anisotropic atomic displacement parameters may be treated within the PSC methodology as additional degrees of freedom.
In particular, the qualitative changes in isosurfaces due to resonant scattering contrast, i.e., their individual elongations and contractions, offer unique dependencies to further restrict the solution volume in Parameter Space. As demonstrated here for the La/Sr split position in the structure of (La0.5Sr1.5)MnO4, this contrast may even help to reveal pseudo-symmetric solutions, as they move in Parameter Space with variations in the atomic scattering power ratios, while the “true” solution will remain fixed (Step 2). In general, model calculations of isosurfaces (preferably close to the solution region) can provide hints for the precise measurement of selected reflections that, in turn, lead to highly precise structure solutions (see text after Figure 2). The specific influence of f , considering supplementary absorption effects, must still be investigated. Work on how a relevant f , apart from being 0 or π , acts on the reflection phases is in progress.
The presumed shift Δ z 0.0034 ( 4.2   p m ) is obtained twice in the PSC picture: (i) precisely using the coordinate difference of the sharp solution (e.g., Figure 6) and (ii) in a less well-defined manner through the separation between both solutions (confidence regions in Figure 4 and Figure 5). A further “free” z parameter exists in the structure, that of O2 [6], also occupying a 4 e Wyckoff site, exactly as in Sr/La. Due to the split of La/Sr, this adjacent oxygen is affected as well, which might give rise to a second z split for this 4 e position. In a four-dimensional Parameter Space, the oxygen displacement may also be determined by PSC together with that of Sr and La, based on 0 0 l data.

5. Conclusions and Outlook

In summary, this article revises the application of the recently developed PSC method to resolve the La/Sr split position within the reported crystal structure of the potential high-temperature super-conductor (La0.5Sr1.5)MnO4. Based on methodical enhancements abandoning the Equal Point-Atom Model and varying the La/Sr scattering contributions by means of resonant contrast, the formerly found systematic offset in the determined solution vector could be eliminated. The originally proposed pseudo-solution could be identified as incompatible with the theoretical amplitudes of 0 0 l reflections ( l = 2 , 4 , , 20 ). Further, a postulated shift in the order of 4 p m was revealed for sufficiently good data quality.
To the best of our knowledge, resolution limits within the PSC have no theoretical basis yet, as compared to the complete “theoretical optics” for the “optical picture” of scattering densities. The consequences of intensity errors broadening isosurface restrictions and the solution region strongly depend on the specific structure. In general, the arising dependencies show non-linear behavior and result in an inverse problem. (La0.5Sr1.5)MnO4 did not offer small and uncorrelated 0 0 l amplitudes at the same time. Thus, the optimal resolution of the PSC methods was not reached.
In terms of resolution limits, the PSC offers very high theoretical precision when additionally using resonant contrast enhancement, even well below the 1 p m range. To include this resonant enhancement in conventional Fourier inversion is not straightforward, and in general, the conventional diffraction limit applies. The advantages of the presented PSC method are that correlations between the parameters are directly observable from the crossings of isosurfaces, that errors in the positions are directly accessible from the remaining solution region of the parameter space, and that resonant contrast can easily be implemented as additional sets of diffraction data in the routines. Similar resolutions to that of the herein discussed two-dimensional Parameter Space case can be expected for any structural problem. We plan to conduct further work on this and hope this study contributes to revealing these limits.
By reducing the Parameter Space (of a given substance) to a subspace covering only the equipoints in question, the high-dimensional data set is correspondingly reduced to much fewer reflection amplitudes, as fewer are necessary for solving this specific problem, as was shown here for the La/Sr split position. Since only a few reflections or amplitudes are sufficient (and not a complete XRD data set), this approach is especially interesting for studying time-dependent processes in already-known crystal structures, e.g., during phase transformations, dynamic transport processes, etc. In most cases, these reflections can be precisely specified in a preliminary analysis. This makes the PSC very attractive for in situ diffraction at synchrotron beamlines to localize or detect the smallest changes in atomic positions in material systems with known atomistic models, which meets the current demands of in situ and in operando research.

Author Contributions

Conceptualization: M.Z.; methodology: M.Z. and C.W.; software: M.Z.; validation: M.Z. and M.N.; formal analysis: M.Z. and M.N.; investigation: M.Z. and M.N.; resources: M.Z.; data curation: M.Z.; writing—original draft preparation: M.Z.; writing—review and editing: M.Z. and M.N.; visualization: M.Z. and K.F.F.; supervision: M.Z. and K.F.F.; project administration: M.Z.; funding acquisition: M.Z.; DFT Simulation: M.V. All authors have read and agreed to the published version of the manuscript.

Funding

This research was funded by the DFG within the project DFG 442646446, ZS 120/5-1. Additional funding was provided within DFG 409743569, ZS 120/1-1, by the Federal Ministry of Education and Research and the State of Saxony SN0390002, and the European Union’s Horizon 2020 research and innovation programme under grant agreement No. 871072.

Data Availability Statement

The data presented in this study are available on request from the corresponding author due to privacy restrictions.

Acknowledgments

The authors acknowledge the DFG for providing the main funding. The authors cordially thank Dmitri V. Novikov (DESY) for his thorough reading of the manuscript and helpful comments, as well as Dirk C. Meyer for providing ideal research conditions at the ZeHS. MZ, CW, MV, and KF would like to extend a special thank you to Melanie Nentwich as she continues to be very close to her former colleagues through her valuable support of ongoing projects. The authors thank the journal editors of Crystals for their invitation to publish this feature paper free of charge.

Conflicts of Interest

The authors declare no conflicts of interest.

Appendix A. Simulation Details

Density functional theory (DFT) calculations were performed as implemented in the VASP code [24,25,26,27]. The electron–electron interactions were treated with generalized-gradient approximation using the Perdew–Burke–Ernzerhof functional [28,29,30]. The plane waves were generated using 600   e V as the plane-wave cutoff energy. The integration of wave functions in the reciprocal space was performed with k-spacing Δ k < 0.02 × 2 π Å 1 , generated with the Monkhorst–Pack scheme [31]. The input atomic coordinates of Lanthanum strontium manganese oxide system was obtained from the ICSD database (ICSD Collection code: 153653). As mentioned above, the unit cell was multiplied in the x and y directions to model 2 × 2 × 1 supercells, cf. Table A1. The supercell was then relaxed precisely up to an accuracy level of 10 6 e V for ground-state energy and 10 4 e V Å 1 for the force on each atom. The relaxed cell was then investigated to analyze the La/Sr split position. For comparison purposes, the relaxed supercell details are given in Table A2.
Table A1. The initial atomic coordinates considered for the DFT simulation are summarized. The atoms are listed in VASP input format.
Distrontium manganate (IV)
1.00000000000000
7.6736389600347810 0.0000000000000000 0.0000000000000000
0.0000000000000000 7.6736389600347810 0.0000000000000000
0.0000000000000000 0.0000000000000000 12.5427138414602393
Sr Mn O La
12 8 32 4
Direct
0.0000000000000000 0.5000000000000000 0.3564199328324650
0.5000000000000000 0.0000000000000000 0.3564199328324650
0.5000000000000000 0.5000000000000000 0.3564199328324650
0.0000000000000000 0.0000000000000000 0.6435800671675350
0.0000000000000000 0.5000000000000000 0.6435800671675350
0.5000000000000000 0.0000000000000000 0.6435800671675350
0.2500000000000000 0.2500000000000000 0.8564199328324650
0.7500000000000000 0.2500000000000000 0.8564199328324650
0.7500000000000000 0.7500000000000000 0.8564199328324650
0.2500000000000000 0.2500000000000000 0.1435800671675351
0.2500000000000000 0.7500000000000000 0.1435800671675351
0.7500000000000000 0.7500000000000000 0.1435800671675351
0.0000000000000000 0.0000000000000000 0.0000000000000000
0.0000000000000000 0.5000000000000000 0.0000000000000000
0.5000000000000000 0.0000000000000000 0.0000000000000000
0.5000000000000000 0.5000000000000000 0.0000000000000000
0.2500000000000000 0.2500000000000000 0.5000000000000000
0.2500000000000000 0.7500000000000000 0.5000000000000000
0.7500000000000000 0.2500000000000000 0.5000000000000000
0.7500000000000000 0.7500000000000000 0.5000000000000000
0.0000000000000000 0.2500000000000000 0.0000000000000000
0.0000000000000000 0.7500000000000000 0.0000000000000000
0.5000000000000000 0.2500000000000000 0.0000000000000000
0.5000000000000000 0.7500000000000000 0.0000000000000000
0.2500000000000000 0.0000000000000000 0.0000000000000000
0.2500000000000000 0.5000000000000000 0.0000000000000000
0.7500000000000000 0.0000000000000000 0.0000000000000000
0.7500000000000000 0.5000000000000000 0.0000000000000000
0.2500000000000000 0.0000000000000000 0.5000000000000000
0.2500000000000000 0.5000000000000000 0.5000000000000000
0.7500000000000000 0.0000000000000000 0.5000000000000000
0.7500000000000000 0.5000000000000000 0.5000000000000000
0.0000000000000000 0.2500000000000000 0.5000000000000000
0.0000000000000000 0.7500000000000000 0.5000000000000000
0.5000000000000000 0.2500000000000000 0.5000000000000000
0.5000000000000000 0.7500000000000000 0.5000000000000000
0.0000000000000000 0.0000000000000000 0.1553844246870802
0.0000000000000000 0.5000000000000000 0.1553844246870802
0.5000000000000000 0.0000000000000000 0.1553844246870802
0.5000000000000000 0.5000000000000000 0.1553844246870802
0.0000000000000000 0.0000000000000000 0.8446155603129220
0.0000000000000000 0.5000000000000000 0.8446155603129220
0.5000000000000000 0.0000000000000000 0.8446155603129220
0.5000000000000000 0.5000000000000000 0.8446155603129220
0.2500000000000000 0.2500000000000000 0.6553844396870780
0.2500000000000000 0.7500000000000000 0.6553844396870780
0.7500000000000000 0.2500000000000000 0.6553844396870780
0.7500000000000000 0.7500000000000000 0.6553844396870780
0.2500000000000000 0.2500000000000000 0.3446155603129222
0.2500000000000000 0.7500000000000000 0.3446155603129222
0.7500000000000000 0.2500000000000000 0.3446155603129222
0.7500000000000000 0.7500000000000000 0.3446155603129222
0.0000000000000000 0.0000000000000000 0.3564199328324650
0.5000000000000000 0.5000000000000000 0.6435800671675350
0.2500000000000000 0.7500000000000000 0.8564199328324650
0.7500000000000000 0.2500000000000000 0.1435800671675351
Table A2. The relaxed final atomic coordinates of (La0.5Sr1.5)MnO4 are summarized. The atoms are listed in VASP input format.
Distrontium manganate (IV)
1.00000000000000
7.7858372911179767 0.0023080817258195 0.0000000000000000
0.0023080817258195 7.7858372911179767 0.0000000000000000
0.0000000000000000 0.0000000000000000 12.4406398723994869
Sr Mn O La
12 8 32 4
Direct
0.9993390456930498 0.5000586100218309 0.3581710826731619
0.4999413899781686 0.0006609543069503 0.3581710826731619
0.4998422129389304 0.5001577870610703 0.3562283827350087
0.9998422129389297 0.0001577870610699 0.6437716172649915
0.9999413899781691 0.5006609543069502 0.6418289173268383
0.4993390456930496 0.0000586100218313 0.6418289173268383
0.2506609543069504 0.2499413899781685 0.8581710826731617
0.7501577870610703 0.2498422129389301 0.8562283827350085
0.7500586100218309 0.7493390456930498 0.8581710826731617
0.2500586100218314 0.2493390456930496 0.1418289173268383
0.2501577870610696 0.7498422129389297 0.1437716172649916
0.7506609543069502 0.7499413899781691 0.1418289173268383
0.0007040310887861 0.9992959689112139 0.9995586822748290
0.0003266625387670 0.4996733374612328 0.0000000000000000
0.5003266625387670 0.9996733374612330 0.0000000000000000
0.5007040310887861 0.4992959689112138 0.0004413177251704
0.2496733374612332 0.2503266625387672 0.5000000000000000
0.2492959689112141 0.7507040310887861 0.4995586822748297
0.7492959689112139 0.2507040310887862 0.5004413177251710
0.7496733374612330 0.7503266625387670 0.5000000000000000
0.9969015784365151 0.2485667013989529 0.9987789905873521
0.0040134074384836 0.7502865612238758 0.0035995740597406
0.5040134074384829 0.2502865612238757 0.9964004259402590
0.4969015784365147 0.7485667013989531 0.0012210094126476
0.2497134387761242 0.9959865925615171 0.0035995740597406
0.2514332986010470 0.5030984215634849 0.0012210094126476
0.7514332986010469 0.0030984215634851 0.9987789905873521
0.7497134387761242 0.4959865925615162 0.9964004259402590
0.2459865925615165 0.9997134387761242 0.5035995740597410
0.2530984215634853 0.5014332986010469 0.4987789905873524
0.7530984215634849 0.0014332986010472 0.5012210094126479
0.7459865925615171 0.4997134387761243 0.4964004259402596
0.9985667013989531 0.2469015784365148 0.5012210094126479
0.0002865612238759 0.7540134074384829 0.5035995740597410
0.5002865612238758 0.2540134074384838 0.4964004259402596
0.4985667013989530 0.7469015784365151 0.4987789905873524
0.9913350885907994 0.0086649114092009 0.1661123553773317
0.9901280854182514 0.4897377050298622 0.1581879674051064
0.5102622949701375 0.0098719145817487 0.1581879674051064
0.5101079791093830 0.4898920208906173 0.1583105610085629
0.0101079791093830 0.9898920208906170 0.8416894239914393
0.0102622949701379 0.5098719145817557 0.8418120175948965
0.4901280854182511 0.9897377050298625 0.8418120175948965
0.4913350885907990 0.5086649114092006 0.8338876296226700
0.2598719145817489 0.2602622949701378 0.6581879824051035
0.2586649114092010 0.7413350885907994 0.6661123703773300
0.7398920208906170 0.2601079791093827 0.6583105760085607
0.7397377050298625 0.7401280854182443 0.6581879824051035
0.2397377050298622 0.2401280854182512 0.3418120175948958
0.2398920208906170 0.7601079791093830 0.3416894239914393
0.7586649114092006 0.2413350885907992 0.3338876296226703
0.7598719145817557 0.7602622949701375 0.3418120175948958
0.9991455283709102 0.0008544716290899 0.3609141141875367
0.4991455283709101 0.5008544716290898 0.6390858858124635
0.2508544716290899 0.7491455283709102 0.8609141141875365
0.7508544716290898 0.2491455283709099 0.1390858858124634

References

  1. Fischer, K.F.; Kirfel, A.; Zimmermann, H.W. Structure determination without Fourier inversion. Part I. Unique results for centrosymmetric examples. Z. Kristallogr. 2005, 220, 643. [Google Scholar] [CrossRef]
  2. Kirfel, A.; Fischer, K.F. Structure determination without Fourier inversion. Part VI: High resolution direct space structure information from one-dimensional data obtained with two wavelengths. Z. Kristallogr. 2010, 225, 261. [Google Scholar] [CrossRef]
  3. Zimmermann, H.W.; Fischer, K.F. Structure determination without Fourier inversion. Part V. A Concept based on parameter space. Acta Crystallogr. 2009, A65, 443. [Google Scholar] [CrossRef] [PubMed]
  4. Pilz, K. Weiterentwicklung und Anwendung einer Algebraischen Methode zur Teilstrukturbestimmung, ein Beitrag zur Eindeutigkeit von Strukturanalysen. Ph.D. Thesis, Universität des Saarlandes, Saarbrücken, Germany, 1996. [Google Scholar]
  5. Herrero-Martín, J.; Mirone, A.; Fernández-Rodríguez, J.; Glatzel, P.; García, J.; Blasco, J.; Geck, J. Hard X-ray probe to study doping-dependent electron redistribution and strong covalency in La1−xSr1+xMnO4. Phys. Rev. B 2010, 82, 075112. [Google Scholar] [CrossRef]
  6. Senff, D.; Reutler, P.; Braden, M.; Friedt, O.; Bruns, D.; Cousson, A.; Bourée, F.; Merz, M.; Büchner, B.; Revcolevschi, A. Crystal and magnetic structure of La1−xSr1+xMnO4: Role of the orbital degree of freedom. Phys. Rev. B 2005, 71, 024425. [Google Scholar] [CrossRef]
  7. Lippmann, T.; Kiele, S.; Geck, J.; Reutler, P.; von Zimmermann, M.; Büchner, B. Charge Density Study of La0.5Sr1.5MnO4 at Room Temperature. DESY Annual Report. 2003. Available online: http://hasyweb.desy.de/science/annual_reports/2003_report/part1/contrib/42/9852.pdf (accessed on 1 November 2020).
  8. Kirfel, A.; Fischer, K.F. High Resolution Structure Determination without Fourier Inversion: Study of a one-dimensional Split Position. In Proceedings of the Annual Conference of the German Society for Crystallography, Cologne, Germany, 28 February–4 March 2005. [Google Scholar]
  9. Henke, B.L.; Gullikson, E.M.; Davis, J.C. X-ray interactions: Photoabsorption, scattering, transmission, and reflection at E = 50–30,000 eV, Z = 1–92. At. Data Nucl. Data Tables 1993, 54, 181–342. [Google Scholar] [CrossRef]
  10. Materlik, G.; Sparks, C.; Fischer, K. Resonant Anomalous X-ray Scattering: Theory and Applications; North-Holland: Amsterdam, The Netherlands, 1994. [Google Scholar]
  11. Joly, Y.; Matteo, S.D.; Bunău, O. Resonant X-ray diffraction: Basic theoretical principles. Eur. Phys. J. Spec. Top. 2012, 208, 21. [Google Scholar] [CrossRef]
  12. Zschornak, M.; Richter, C.; Nentwich, M.; Stöcker, H.; Gemming, S.; Meyer, D.C. Probing a crystal’s short-range structure and local orbitals by Resonant X-ray Diffraction methods. Cryst. Res. Technol. 2014, 49, 43. [Google Scholar] [CrossRef]
  13. Richter, C.; Zschornak, M.; Novikov, D.; Mehner, E.; Nentwich, M.; Hanzig, J.; Gorfman, S.; Meyer, D.C. Picometer polar atomic displacements in strontium titanate determined by resonant X-ray diffraction. Nat. Commun. 2018, 9, 178. [Google Scholar] [CrossRef]
  14. Dmitrienko, V. Forbidden reflections due to anisotropic X-ray susceptibility of crystals. Acta Crystallogr. Sect. A 1983, 39, 29–35. [Google Scholar] [CrossRef]
  15. Richter, C.; Novikov, D.V.; Mukhamedzhanov, E.K.; Borisov, M.M.; Akimova, K.A.; Ovchinnikova, E.N.; Oreshko, A.P.; Strempfer, J.; Zschornak, M.; Mehner, E.; et al. Mechanisms of the paraelectric to ferroelectric phase transition in RbH2PO4 probed by purely resonant X-ray diffraction. Phys. Rev. B 2014, 89, 094110. [Google Scholar] [CrossRef]
  16. Ovchinnikova, E.; Novikov, D.; Zschornak, M.; Kulikov, A.; Kozlovskaya, K.; Dmitrienko, V.; Oreshko, A.; Blagov, A.; Mukhamedzhanov, E.; Marchenkov, N.; et al. Forbidden Reflections in TeO2 in the Vicinity of the Te L1 Absorption Edge. Crystals 2020, 10, 719. [Google Scholar] [CrossRef]
  17. Wilson, A.J.C. (Ed.) International Tables for Crystallography. Volume C: Mathematical, Physical and Chemical Tables; Kluwer Academic Publishers: Dordrecht, The Netherlands, 1992. [Google Scholar]
  18. Zschornak, M.; Wagner, C.; Nentwich, M.; Meyer, D.C.; Fischer, K.F. Advances in the Parameter Space Concept for Crystal Structure Determination—A maximum Resolution Study. Acta Crystallogr. 2021, A77, C1254. [Google Scholar] [CrossRef]
  19. Lindley, P.F. Preparation, selection, and investigation of specimens. In International Tables for Crystallography, Online MRW; John Wiley and Sons, Ltd.: Hoboken, NJ, USA, 2006; Chapter 3.1; pp. 148–155. [Google Scholar] [CrossRef]
  20. Weigel, T.; Funke, C.; Zschornak, M.; Behm, T.; Stöcker, H.; Leisegang, T.; Meyer, D.C. X-ray diffraction using focused-ion-beam-prepared single crystals. J. Appl. Crystallogr. 2020, 53, 614–622. [Google Scholar] [CrossRef]
  21. Prince, E. International Tables for Crystallography Volume C: Mathematical, Physical and Chemical Tables; John Wiley and Sons, Ltd.: Hoboken, NJ, USA, 2006. [Google Scholar] [CrossRef]
  22. Spiess, L.; Teichert, G.; Schwarzer, R.; Behnken, H.; Genzel, C. Moderne Röntgenbeugung: Röntgendiffraktometrie für Materialwissenschaftler, Physiker und Chemiker; Springer: Berlin/Heidelberg, Germany, 2009. [Google Scholar]
  23. Weigel, T.; Leisegang, T.; Zschornak, M.; Herrmann, M.; Rothenberger, M.; Wünsche, A.; Stöcker, H.; Meyer, D.C. Influence of environmental parameter variations on X-ray beam intensities: A time-dependent absorption correction. J. Appl. Crystallogr. 2015, 48, 1870–1882. [Google Scholar] [CrossRef]
  24. Kresse, G.; Furthmüller, J. Efficiency of ab-initio total energy calculations for metals and semiconductors using a plane-wave basis set. Comput. Mater. Sci. 1996, 6, 15–50. [Google Scholar] [CrossRef]
  25. Kresse, G.; Furthmüller, J. Efficient iterative schemes for ab initio total-energy calculations using a plane-wave basis set. Phys. Rev. B 1996, 54, 11169–11186. [Google Scholar] [CrossRef]
  26. Kresse, G.; Hafner, J. Ab initio molecular dynamics for liquid metals. Phys. Rev. B 1993, 47, 558–561. [Google Scholar] [CrossRef]
  27. Kresse, G.; Hafner, J. Ab initio molecular-dynamics simulation of the liquid-metal–amorphous-semiconductor transition in germanium. Phys. Rev. B 1994, 49, 14251–14269. [Google Scholar] [CrossRef]
  28. Perdew, J.P.; Burke, K.; Ernzerhof, M. Generalized Gradient Approximation Made Simple. Phys. Rev. Lett. 1996, 77, 3865–3868. [Google Scholar] [CrossRef]
  29. Blöchl, P.E. Projector augmented-wave method. Phys. Rev. B 1994, 50, 17953–17979. [Google Scholar] [CrossRef] [PubMed]
  30. Kresse, G.; Joubert, D. From ultrasoft pseudopotentials to the projector augmented-wave method. Phys. Rev. B 1999, 59, 1758–1775. [Google Scholar] [CrossRef]
  31. Monkhorst, H.J.; Pack, J.D. Special points for Brillouin-zone integrations. Phys. Rev. B 1976, 13, 5188–5192. [Google Scholar] [CrossRef]
Figure 1. The 2-dimensional Parameter Space z La z Sr for the La/Sr Partial Geometric Structure Factors G 2 ( l ) (Equation (1)) of (La0.5Sr1.5)MnO4, I 4 / mmm. The data are visualized in the full functional region (left) and the magnified region of interest (right) as isosurfaces, including positive (solid lines) and negative signs (dotted lines). The permutation symmetry of P 2 adds an exact pseudo-solution z La * = 0.35316 , z Sr * = 0.36316 to the presumed split position z La = 0.36316 , z Sr = 0.35316 (green dots). The gray shaded areas depict two different but equivalent asymmetric units, the conventional one (dark gray) and the one used in the literature (light gray), for better comparison. Gray solid lines depict mirrors and gray dashed lines anti-mirrors.
Crystals 14 00684 g001
Figure 2. The 2-dimensional Parameter Space z Sr z La for the complete structure of (La0.5Sr1.5)MnO4, I 4 / mmm, with computed diffraction data F ( l ) (Equation (2)) in the first quadrant (left) and the magnified region of interest (right). The functions are visualized as isosurfaces including positive (solid lines) and negative signs (dotted lines), with asymmetric units and mirrors in analogy to Figure 1. The mirror along z Sr = z La lifts via loss of permutation symmetry from f Sr f La and the pseudo-solution ( z La * , z Sr * ) with approximately interchanged coordinates shifts.
Crystals 14 00684 g002
Figure 3. (a) Model study of both the true and the pseudo-symmetric solutions as a function of scattering strength ratio by fitting intersecting isosurfaces F ( l ) (Equation (2), least-squares). The ratio was varied by a scaling factor of 10, keeping the mean product f La · f Sr fixed. The isosurfaces F ( l ) were calculated for reflections l = 2 , 4 , , 20 . Confidence regions are given as error bars of 2.6 σ , magnified by a factor of 10 for better visibility. The true solution ( z La , z Sr ) is independent of the varying ratio (green dot), whereas the pseudo-solutions result in a linear series between the limits at a distance of 2 · Δ z (red dots). As expected, the positional errors scale inversely to the scattering power. The change in scattering power directly reflects the distortion of the respective isosurface features, i.e., light weights act as elongations that increase the respective positional errors, shown for the limits of the series in (b) for “light La” (violet dot) and in (c) for “light Sr” (yellow dot).
Crystals 14 00684 g003
Figure 4. Monte-Carlo study of the split position with Δ z = 0.0034 for different Gaussian-distributed random errors of the reflection intensities for l = 2 , 4 , , 20 with 100 test samples each (Equation (2), least-squares fits). The solution is in black and the pseudo-solution in red, each with two confidence regions, 1 σ 68 % (heavy color shade) and 2.6 σ 99 % (light color shade). Whereas an intensity error of 5 % resolves the true solution within σ confidence, highly precise intensity data with an intensity error better than 1 % are needed for 2.6 σ confidence.
Crystals 14 00684 g004
Figure 5. Fitted positions z La (blue +) and z Sr (green ×) for a series of presumed splits 0 Δ z 0.02 (between green and blue circles, accordingly) and three data qualities, given with a confidence level of 99% (error envelopes, 100 samples each, Equation (2), least-squares fit). For the three different intensity errors Δ I / I = 20%, 5% and 1%, the distinct split positions can be resolved for splits Δ z > 0.02 (≈25 pm), Δ z > 0.007 (≈8.5 pm), and Δ z > 0.003 (≈3.7 pm), respectively.
Crystals 14 00684 g005
Figure 6. Two-dimensional Parameter Space z Sr z La for the structure (La0.5Sr1.5)MnO4, I 4 / mmm, in the vicinity of the split position (green dot). The diffraction data are given as intensity isosurfaces I ( l ) (Equation (2)) for two photon energies E = 15   k e V and E = 16.1   k e V (just below the Sr absorption edge) and for error envelopes of ± 1 % (blue and red lines). The contrast enhancement and respective superior resolution (small black region) originate from multiple large-angle intersections (upper right l = 2 , 4 , , 10 ; lower right l = 2 , 4 , , 20 ), and especially the small envelope of the low-intensity high-indexed reflection 0 0 16 (increased opacity in lower inset). In addition, the second wavelength severely lifts the degeneracy of the pseudo-solution.
Crystals 14 00684 g006
Disclaimer/Publisher’s Note: The statements, opinions and data contained in all publications are solely those of the individual author(s) and contributor(s) and not of MDPI and/or the editor(s). MDPI and/or the editor(s) disclaim responsibility for any injury to people or property resulting from any ideas, methods, instructions or products referred to in the content.

