Abstract
In the process of pharmaceutical crystallization, the automatic detection of crystal shapes in images is important since controlling the morphology of the crystals improves the quality of pharmaceutical crystals. In this paper, a novel image detection method called RECDet is proposed. It leverages an automatically adapted binary image to bypass background regions, thereby reducing the detection field. In addition, the method greatly reduces the training time while improving the detection accuracy by using a specially designed detection box for the crystal shape. The performance of our model is evaluated through experimental analysis on a publicly available glutamate crystal dataset and a self-made entecavir pharmaceutical crystal dataset. Experimental results show that RECDet improves the accuracy of prediction bounding boxes by more than 2% compared to other popular models and achieves a classification accuracy of 98%. It can be used as a promising tool in the application of pharmaceutical crystallization control.
1. Introduction
Control of pharmaceutical crystallization is a pivotal step in pharmaceutical development and manufacturing, involving the regulation of crystal size, shape, and purity to ensure optimal pharmaceutical efficacy and bioavailability [1,2]. Traditional crystallization control methods that rely on manual monitoring are time-consuming, labor-intensive, and often unreliable. Recent advancements in deep learning have significantly enhanced image analysis, fostering the development of models that improve the accuracy and efficiency of object detection [3,4,5]. As image recognition technologies evolve, there is increasing interest in automating the monitoring of crystallization processes [6,7,8,9]. Nevertheless, the extensive application of image recognition in crystallography is still not fully explored [10,11,12,13,14]. In contrast to specialized models used in medical image recognition, crystallography has predominantly employed the general image processing frameworks [15,16].
For example, Gao et al. [17] applied Mask R-CNN in the field of crystal recognition to record the transformation process of glutamate crystal morphology, including quantity, size, and surface area. Huo et al. [18] employed the UNet for crystal segmentation, which allowed for a detailed analysis of the particle size distribution during the crystal growth stages. Wu et al. [19] analyzed crystal images using S2A-Net in the field of aerial imaging and measured the two-dimensional size of crystals using a minimum-fitting rectangle. Manee et al. [20] utilized a single-stage segmentation model RetinaNet to segment crystals for real-time detection of crystal size distribution.
Despite these successes, the general object detection frameworks applied to crystal shape or type prediction still encounter numerous challenges, such as the limited dataset and algorithmic accuracy. These frameworks often focus excessively on image details to maintain detection effectiveness across various scenarios, leading to excessive attention to background impurities or water disturbances, which may hinder detection efficiency and accuracy [21,22,23]. Consequently, extensive data are required to filter out these distractions for model learning.
This study introduces a novel object detection framework named RECDet, which is expressly crafted for crystal image detection by employing background region filtering. It algorithmically generates a binary image to separate the foreground and background regions, and then inputs this information into a neural network, bypassing the background region detection to improve the crystal detection accuracy and processing speed. Additionally, considering that crystals typically exhibit uniform sizes, a specialized candidate box has been designed inspired by a two-stage object detection process, which can boost the model performance on small datasets [24]. To evaluate the effectiveness of RECDet, a public dataset consisting of 140 training images and 60 validation images is used for the test. Besides, a dataset with 180 training images, 40 validation images, and 20 test images, compiled in the COCO annotation format [25], is constructed by our experiment. The validation results of these datasets indicate that RECDet significantly improves the detection and classification of crystals, providing an effective tool for further analysis of crystal size distribution and crystallization quality.
2. Method
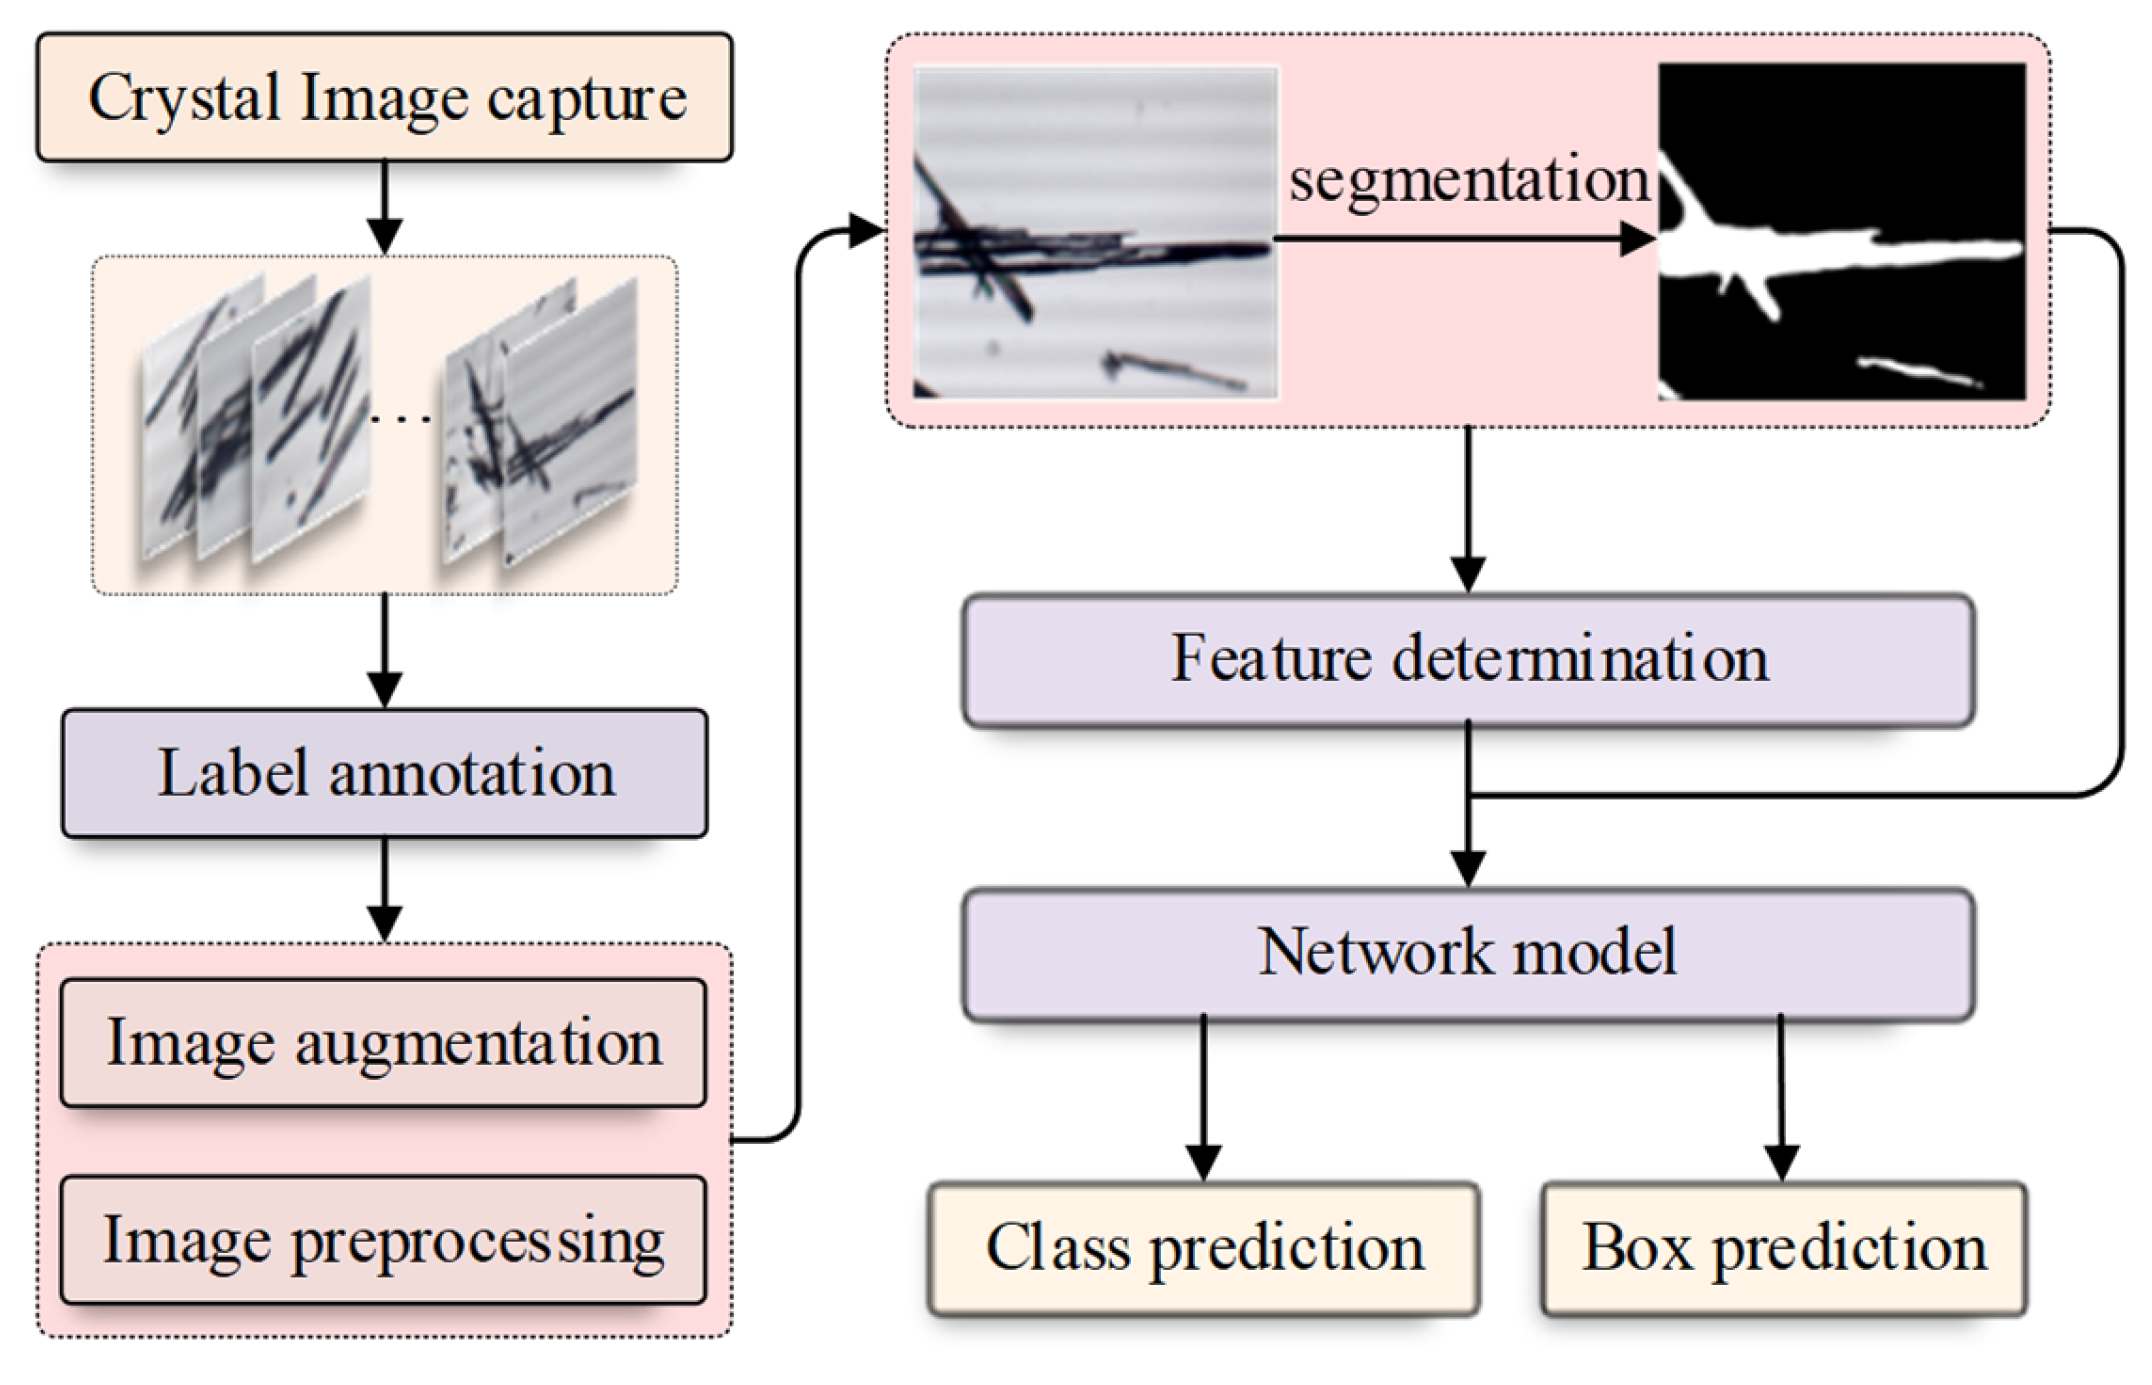
The detailed description of our RECDet is shown in Figure 1. We first collected crystal images and manually annotated the position of the crystals on these images. After the image acquisition, the original data was preprocessed and augmented. Then, we set the threshold and applied the binary segmentation to segment crystal regions and obtain binary images of crystals. Subsequently, a two-stage object detection model was used to modify the candidate box prediction by combining the binary crystal image. The background region can be directly skipped during the prediction process; this results in satisfactory experimental results that guarantee the identification of the crystal type and its specific position on the image.
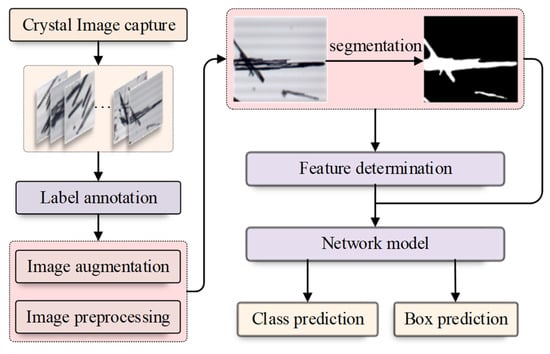
Figure 1.
The flow chart of RECDet.
2.1. Threshold Segmentation
As images with varying crystal densities exhibit distinct brightness levels, determining a single threshold that can perfectly segment all images is infeasible. To minimize the workload of subsequent processing steps, our RECDet model employs automatic threshold segmentation. Otsu threshold segmentation [26] is an adaptive threshold image segmentation method that uses a threshold to divide an image into foreground and background regions. The crystal image is firstly converted into a grayscale image, with a gray level interval set as [0, m]. The threshold t is then calculated and the image is divided according to two parts of [0, t] and [t + 1, m]. The calculation of threshold t is
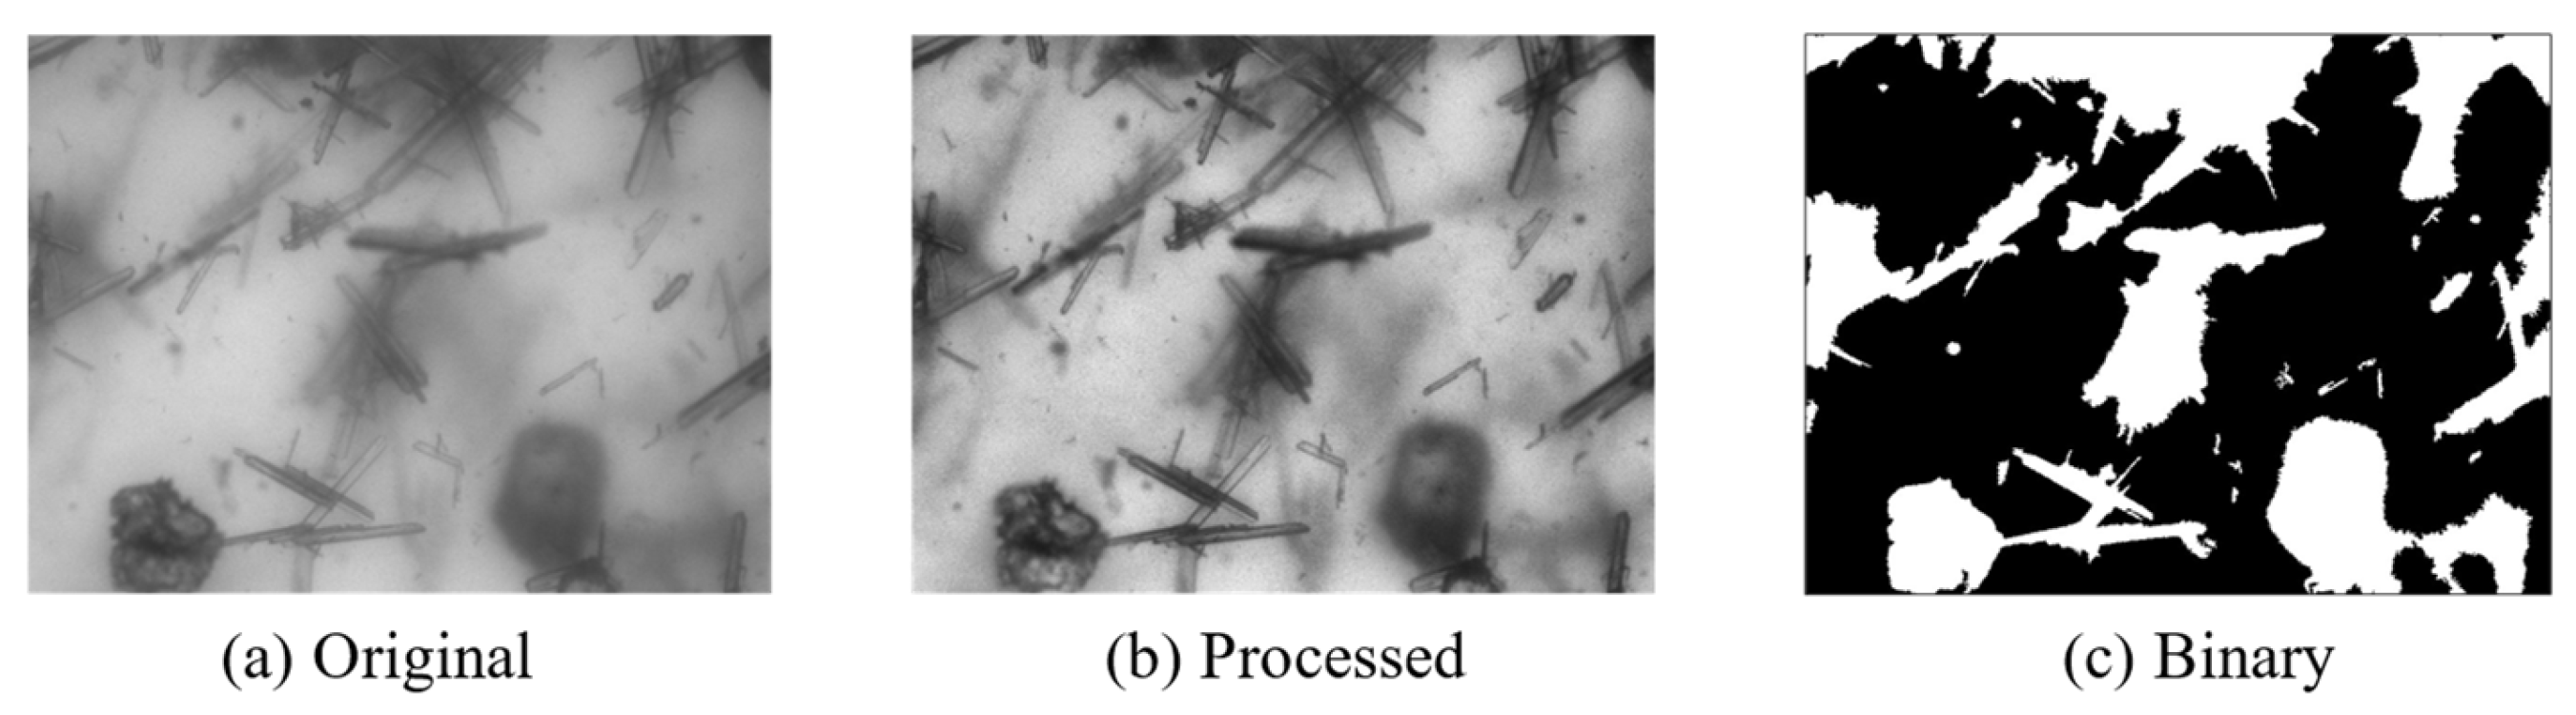
where is the proportion of foreground in the image with a mean of , is the proportion of background in the image with a mean of , and is the overall mean of the image calculated as . When F(t) reaches its maximum value, The threshold t is referred to as the optimal threshold. The image is finally divided into the foreground and background regions using this threshold. The effect of the application of the above method is shown in Figure 2. It can be seen that the binary image has a very blurry division of the crystal, and the model needs to be further processed.

Figure 2.
Segmentation results. (a) Original blurry crystal image. (b) The image after image enhancement processing. (c) Binary image obtained through OTSU processing.
For crystal images under complex conditions, threshold segmentation cannot accurately distinguish the crystal region, which is often affected by the brightness of the background region and impurities in the solution. Our model is based on the results of threshold segmentation, assisted by neural network image technology, to obtain more accurate target detection results.
2.2. Network Model Structure
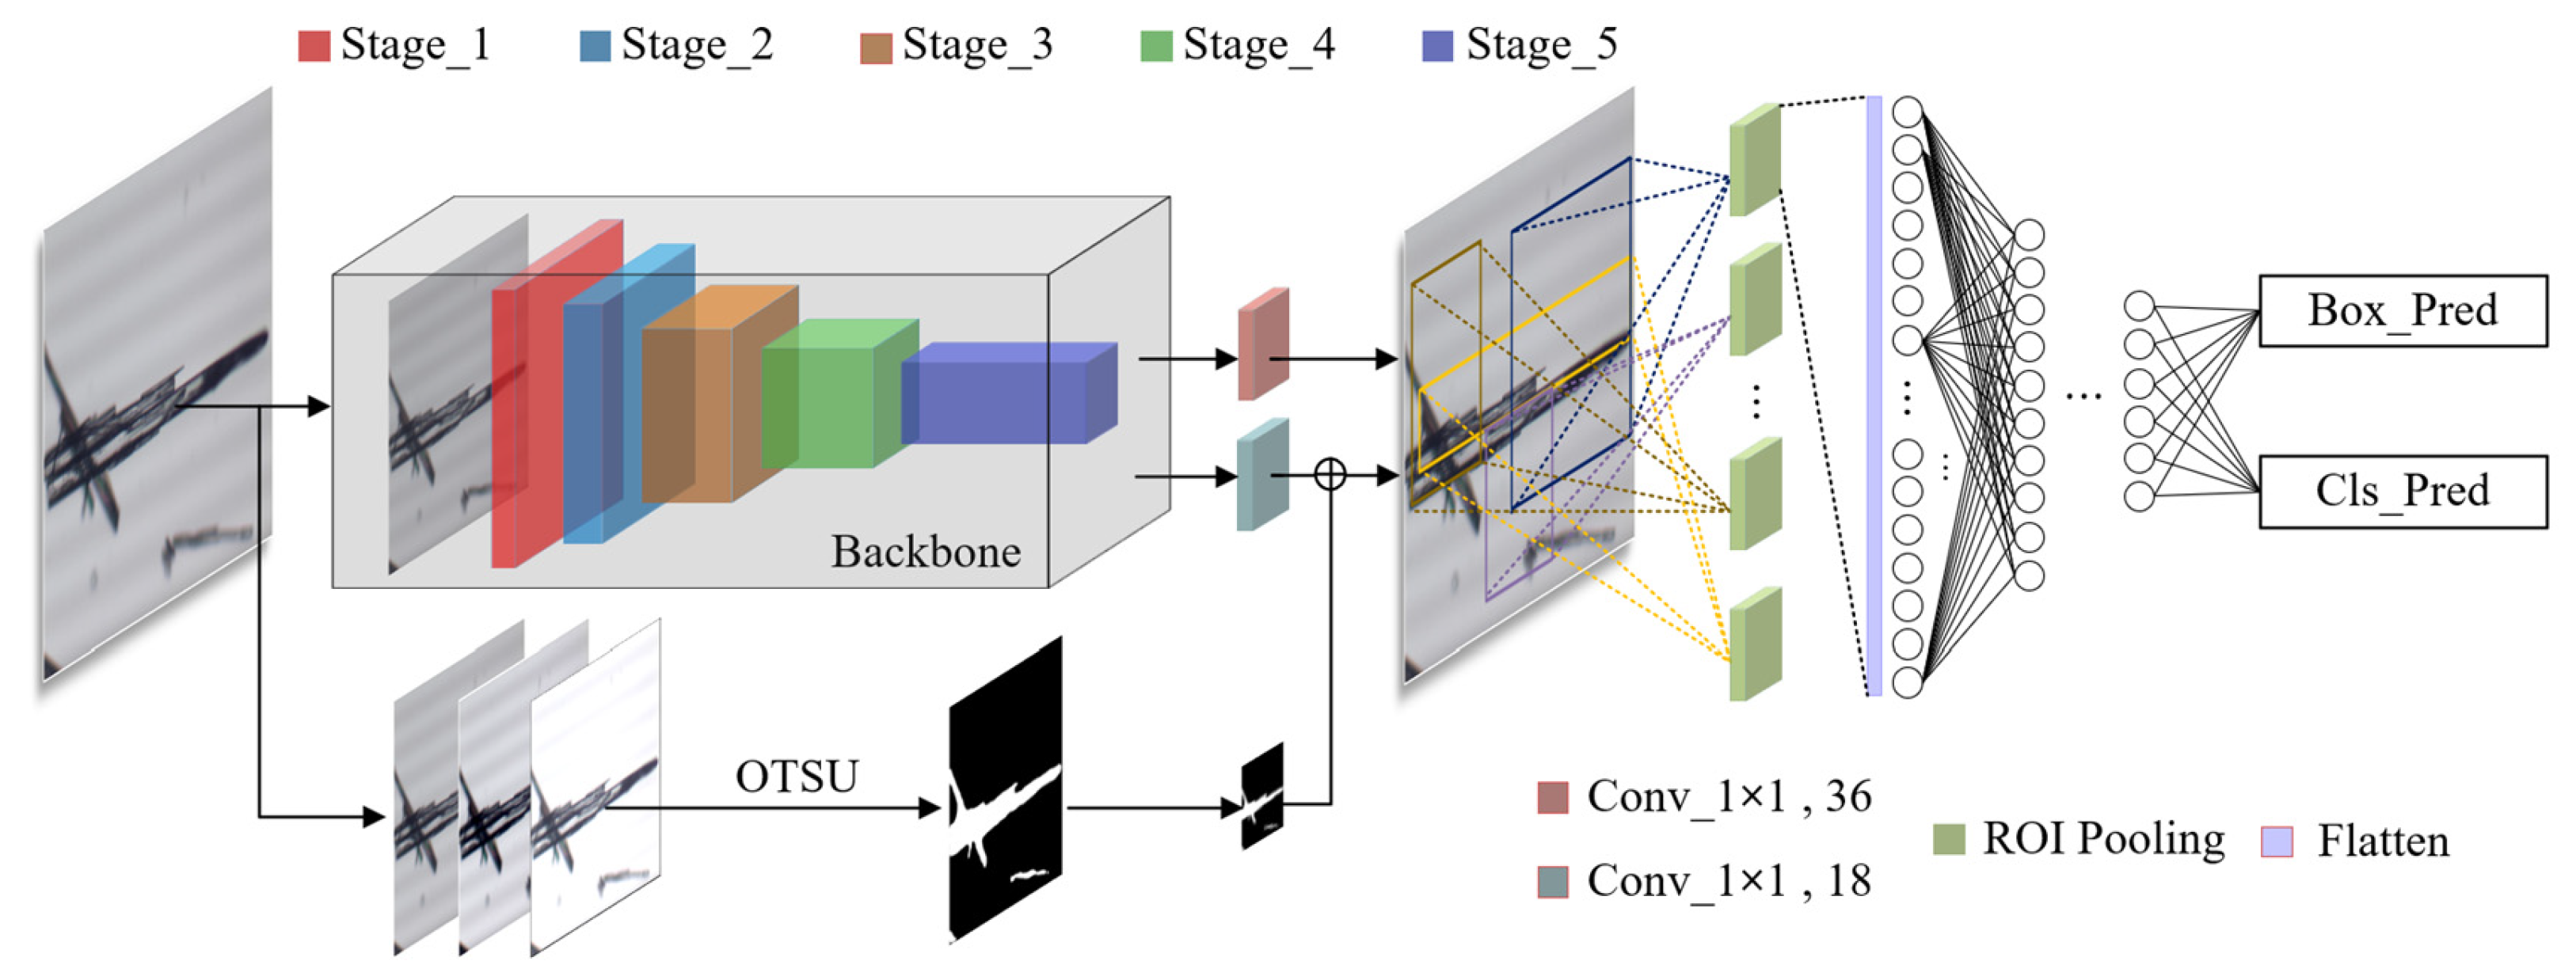
As shown in Figure 3, RECDet utilizes ResNet50 as its feature extraction backbone [27,28]. The input image (H × W) is divided into 5 stages. A feature map of 2048 channels is output after 49 convolution layers, and the size is recorded as M × N. The convolution process is shown in Table 1.
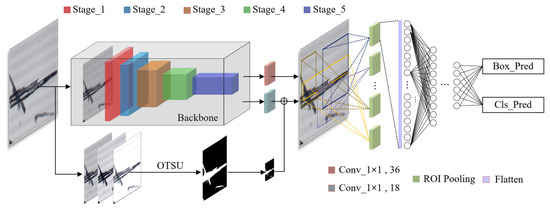
Figure 3.
Network model structure diagram.

Table 1.
The specific operation process of convolution in feature extraction network.
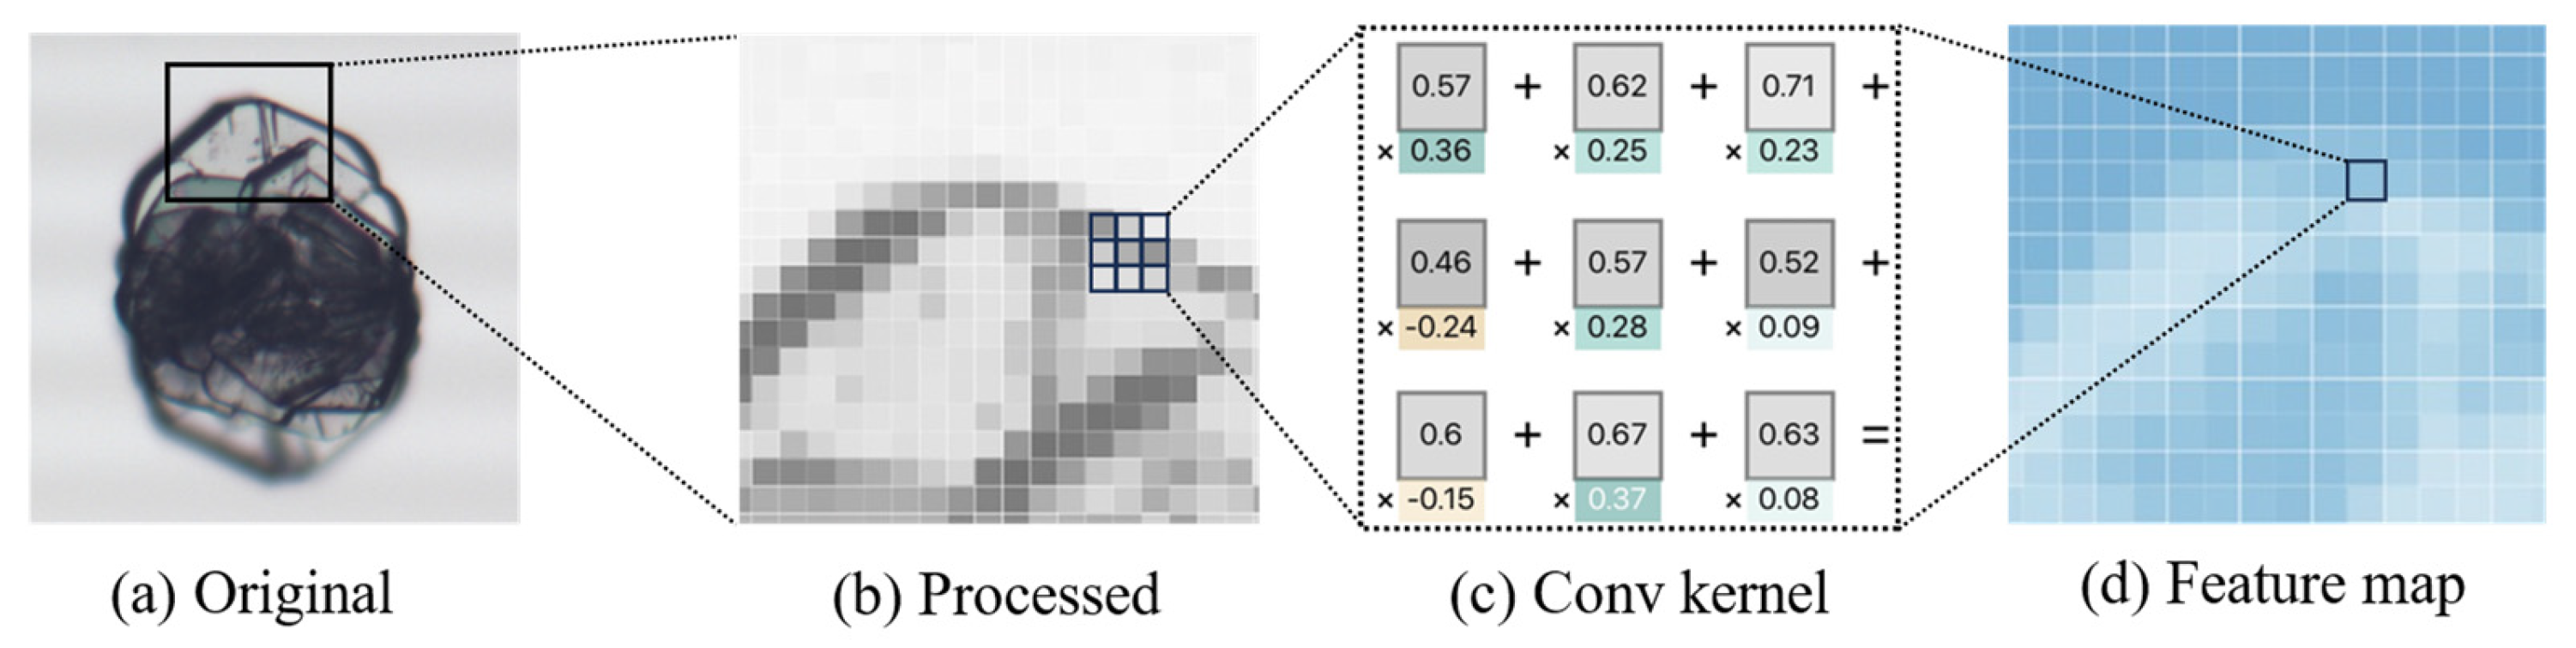
The convolution process involves the sliding of small, trainable convolutional kernels over the input image, extracting features through the computation of the dot product between the convolutional kernels and local regions of the input data. These kernels are capable of capturing spatial and temporal patterns within the data, such as edges or textures, to form feature maps. This process is illustrated in Figure 4.

Figure 4.
Processing of image feature extraction. (a) Original crystal image. (b) Image enhanced and enlarged with details. (c) An example of a 3 × 3 convolution kernel. (d) Example of feature map obtained after convolution.
After each convolution layer, a batch normalization layer and a ReLU activation layer are connected, and the gradient stability is kept by the residual connection. By the batch normalization, the input is distributed to a smaller range, which is conducive to the iterative optimization of the function. Its output is expressed as
After the batch normalization, ReLU introduces the nonlinear factors to enhance the ability of neural networks to solve the linear fitting problem of neural networks. It is expressed as
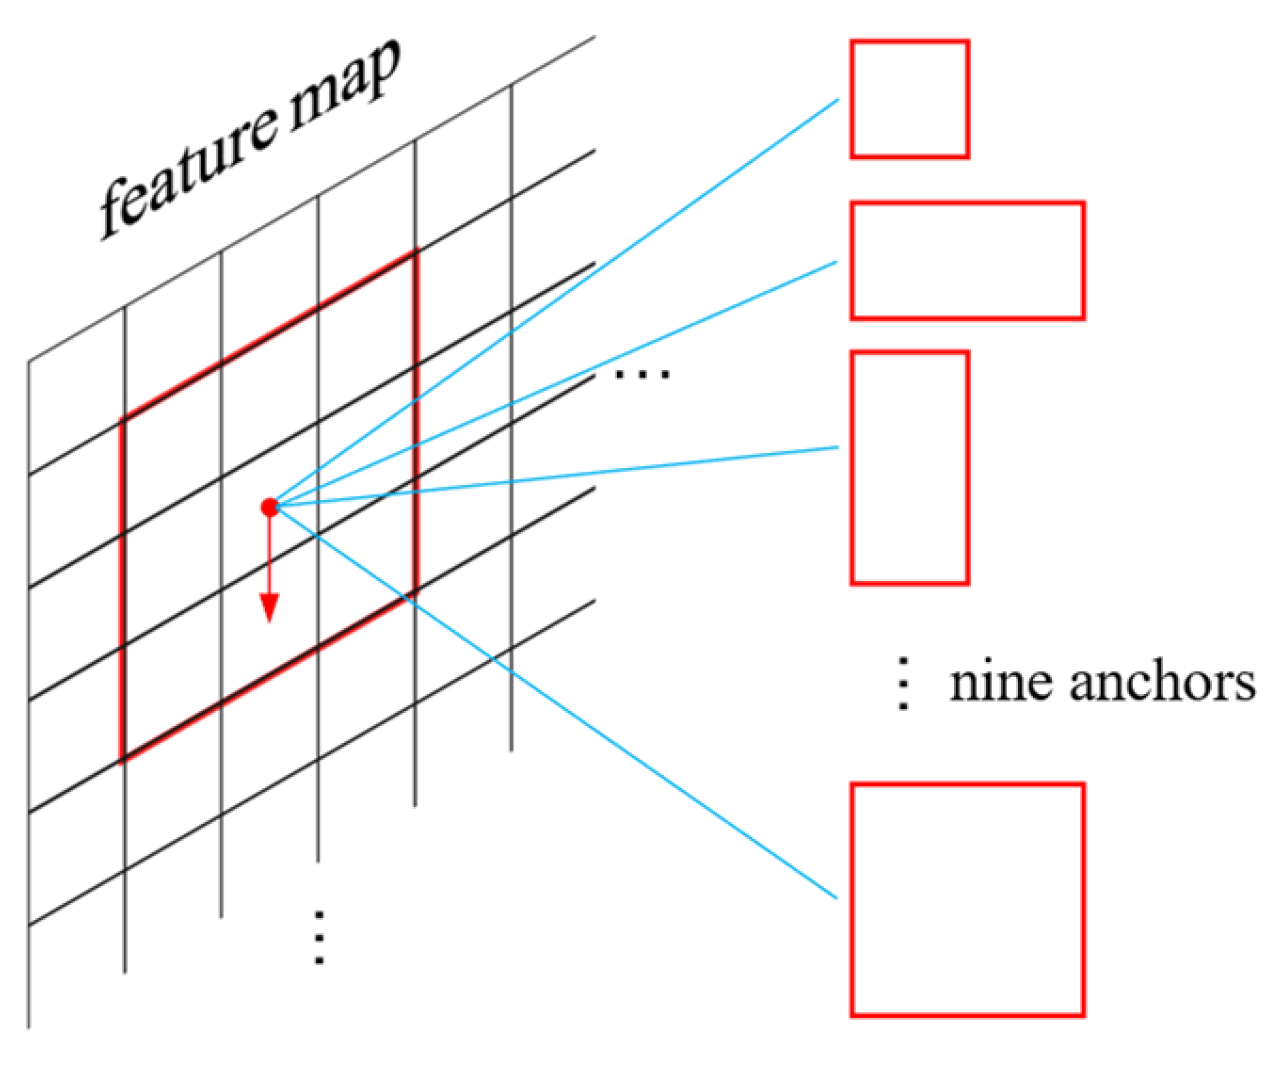
For the feature maps derived from the backbone network of the raw image, 9 anchors are set at each pixel point, the schematic of anchor generation is shown in Figure 5.

Figure 5.
Anchor generation, red arrows indicate anchor sliding on the feature map.
These anchors are designed with respect to length-to-width ratios of [1:1, 1:1.5, 1.5:1] and the size scales of [8,12,16]. The aspect ratios and size scales can be adjusted according to the specific shape of the target crystal, as we have found that the size and shape of pharmaceutical crystals are always similar. Each anchor is assigned by a binary label flag corresponding to the foreground and background regions, respectively. It is differentiated using the binary images generated in Section 2.1, which is represented as
where is the value at the pixel position corresponding to the anchor in the binary image. Thus, the crystal area is preliminarily determined by the binarization. Then it is judged whether the anchor corresponding to the current pixel point needs to be fed into the neural network for computation.
In the model training process, each anchor is convolved with a 1 × 1 convolution, with a channel number of 2 × 9. Thus, each anchor obtains two corresponding values, which are then used in a softmax function to perform a binary classification task, calculating the probability of the anchor being either a foreground or background class. This is represented as
where is the input data and c is set as 2 for a binary classification task. is the output probability value, converting the output to 1 for the foreground and 0 for the background, which is represented as
Then, a process is further refined by applying a weighted operation with the previously approximated foreground and background values:
where λ is a variable, starting with an initial value of 1. During the training process, it gradually decreases with each training epoch until it reaches 0 in the final epoch. Simultaneously, labels are continually assigned to the anchors using Equation (4) during the training. For anchors that are set to true by Equation (4), they undergo a 1 × 1 convolution with a channel number of 4 × 9. Consequently, each anchor obtains four values, which are then utilized for the box regression to refine the anchor box, thereby forming a more accurate bounding box. The calculation formula is represented as
where and are the coordinates of the center point of the anchor box, and , denote its width and height, respectively. , are the coordinates of the center point of the prediction box generated by the neural network, and , refer to its width and height, respectively. The obtained , , , represent the offsets predicted by the neural network. The corrected prediction box is expressed as , , , , which is calculated as
If the intersection over union (IOU) between the predicted bounding box and the ground truth box is greater than 0.7 [29], it is marked as a positive sample. Conversely, if the IOU between the predicted bounding box and the ground truth box is less than 0.3, it is marked as a negative sample. Any remaining predicted bounding boxes and those that exceed the image boundaries do not participate in the final calculation. The formula for calculating IOU is
where A is the area of the predicted bounding box and B is the area of the ground truth box.
2.3. Loss Function
During the neural network training process, predicted bounding boxes are scaled down by a factor of H/M to align with the feature map dimensions produced by the convolutional neural network. These adjusted regions undergo the region of interest (ROI) pooling [30], which involves the division with a 7 × 7 grid where max pooling is executed on each grid cell. The pooled output is then directed through the fully connected layers, leading to results for classification and regression tasks. The loss function for these tasks is expressed as
where the classification loss uses the cross-entropy, is the true label and is the predicted value. The regression loss applies the smooth L1 loss [31], where is the true label for the bounding box parameters and is the predicted value.
3. Experimental and Discussion
3.1. Dataset
To validate the effectiveness of RECDet, a public dataset is first utilized, consisting of 200 images of α and β glutamate crystals. This dataset is converted to the COCO label standard for the model training and evaluation. And the dataset is shuffled and segmented into training and validation sets with a 7:3 distribution.
In addition, a new specialized dataset is created by us based on microscopic photographs of entecavir pharmaceutical crystals obtained through cooling crystallization in an ethanol-aqueous solution. Images of lower quality are excluded, leaving a collection of 240 high-resolution photographs (2304 × 1728 pixels) of entecavir crystals. Each crystal in these images is meticulously labeled with dots and lines, following the annotation format of the COCO dataset, with the details recorded in .json files. The labels distinguish between single-crystal and polycrystalline forms. A total of 180 images were designated for training and 40 for validation, and the dataset was randomly shuffled to ensure the robustness of the evaluation.
3.2. Experiment Equipment
RECDet is implemented using the Pytorch deep learning framework (version 1.7.0). The operating system is Windows 10. The CPU model is Intel Core i5 10th and the GPU model is Nvidia RTX3060. The images were captured using the OPLENIC microscope photography system (CX23) (OPLENIC, located in Hangzhou, China).
3.3. Experiment Result
To demonstrate the effectiveness of RECDet, four general object detection models are compared, including two-stage object detection [32,33], single-stage object detection [34], and Transformer-based object detection [35]. The codes to run these models are obtained from the OpenMMLab GitHub repository [36], the detailed list of hyperparameters is shown in Table 2.
Table 2.
Hyperparameters.
The accuracy of prediction boxes, category judgment precision, training duration, and prediction speed (Fps) are compared. Among them, bbox mAP75 and classification accuracy are commonly used as evaluation metrics. bbox mAP75 refers to the mAP value (Mean Average Precision) at an IoU threshold of 0.75. For each predicted bounding box, both precision and recall are computed. AP denotes the area under the Precision-Recall curve, and its representation is
Considering the binary classification task in our experiment, the representation for accuracy (acc) is detailed as
where TP represents True Positives, TN denotes True Negatives, FP indicates False Positives, and FN means False Negatives. The detailed results of the comparison are presented in Table 3.
Table 3.
Comparison of experimental results with different methods.
It can be seen from Table 3, RECDet achieves an approximate 2% improvement over Mask R-CNN in the bbox mAP75 metric. Additionally, it not only improves the prediction speed but also boosts the prediction accuracy by 1%, achieving 98%, which also surpasses other comparison models. Such enhancements are crucial in applications with high-precision requirements [37]. Moreover, these enhancements can yield substantial benefits when handling large volumes of data, which can reduce the overall false positive rate and improve computational efficiency.
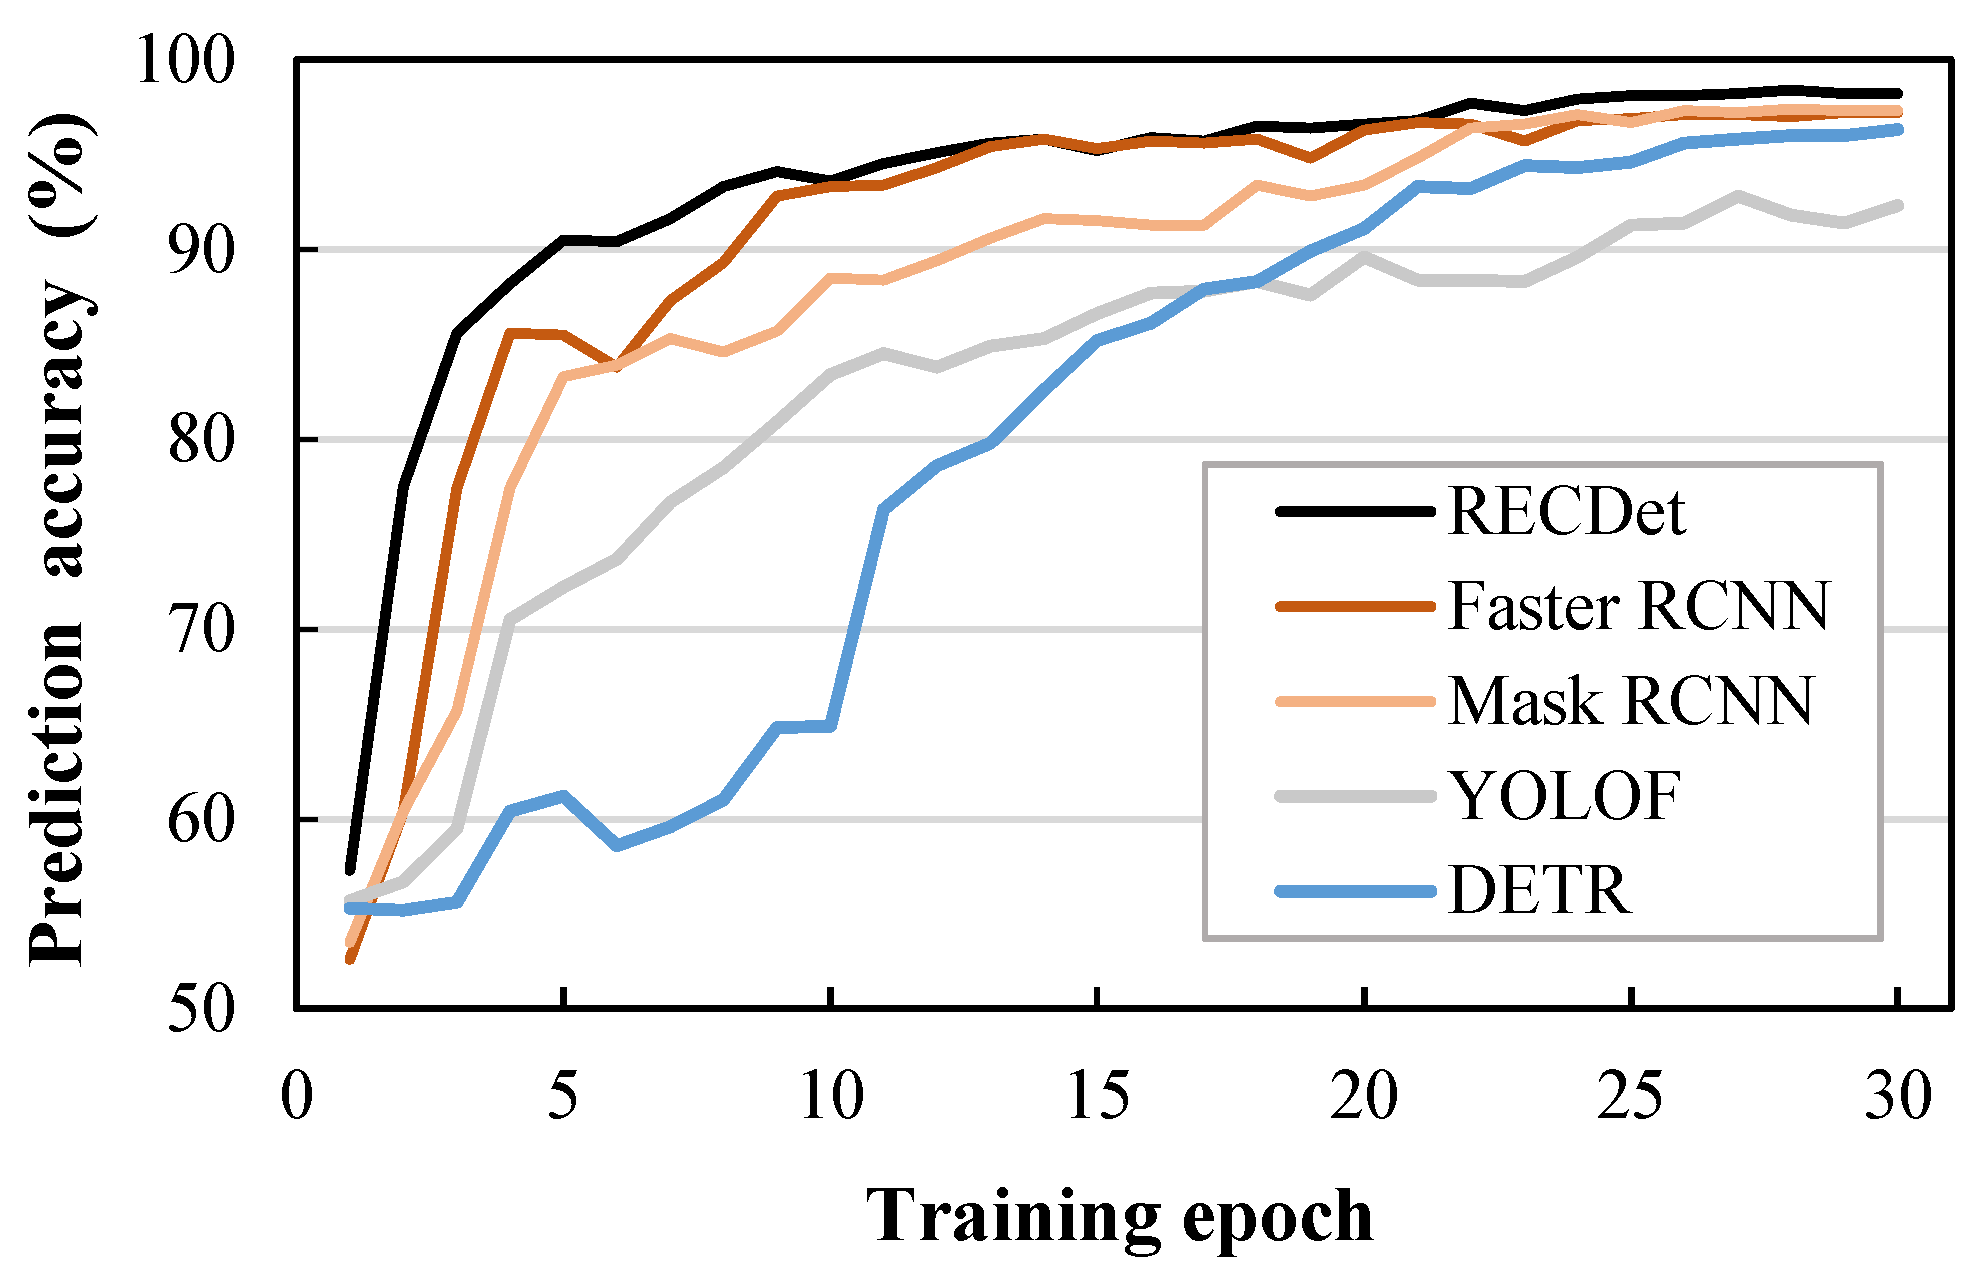
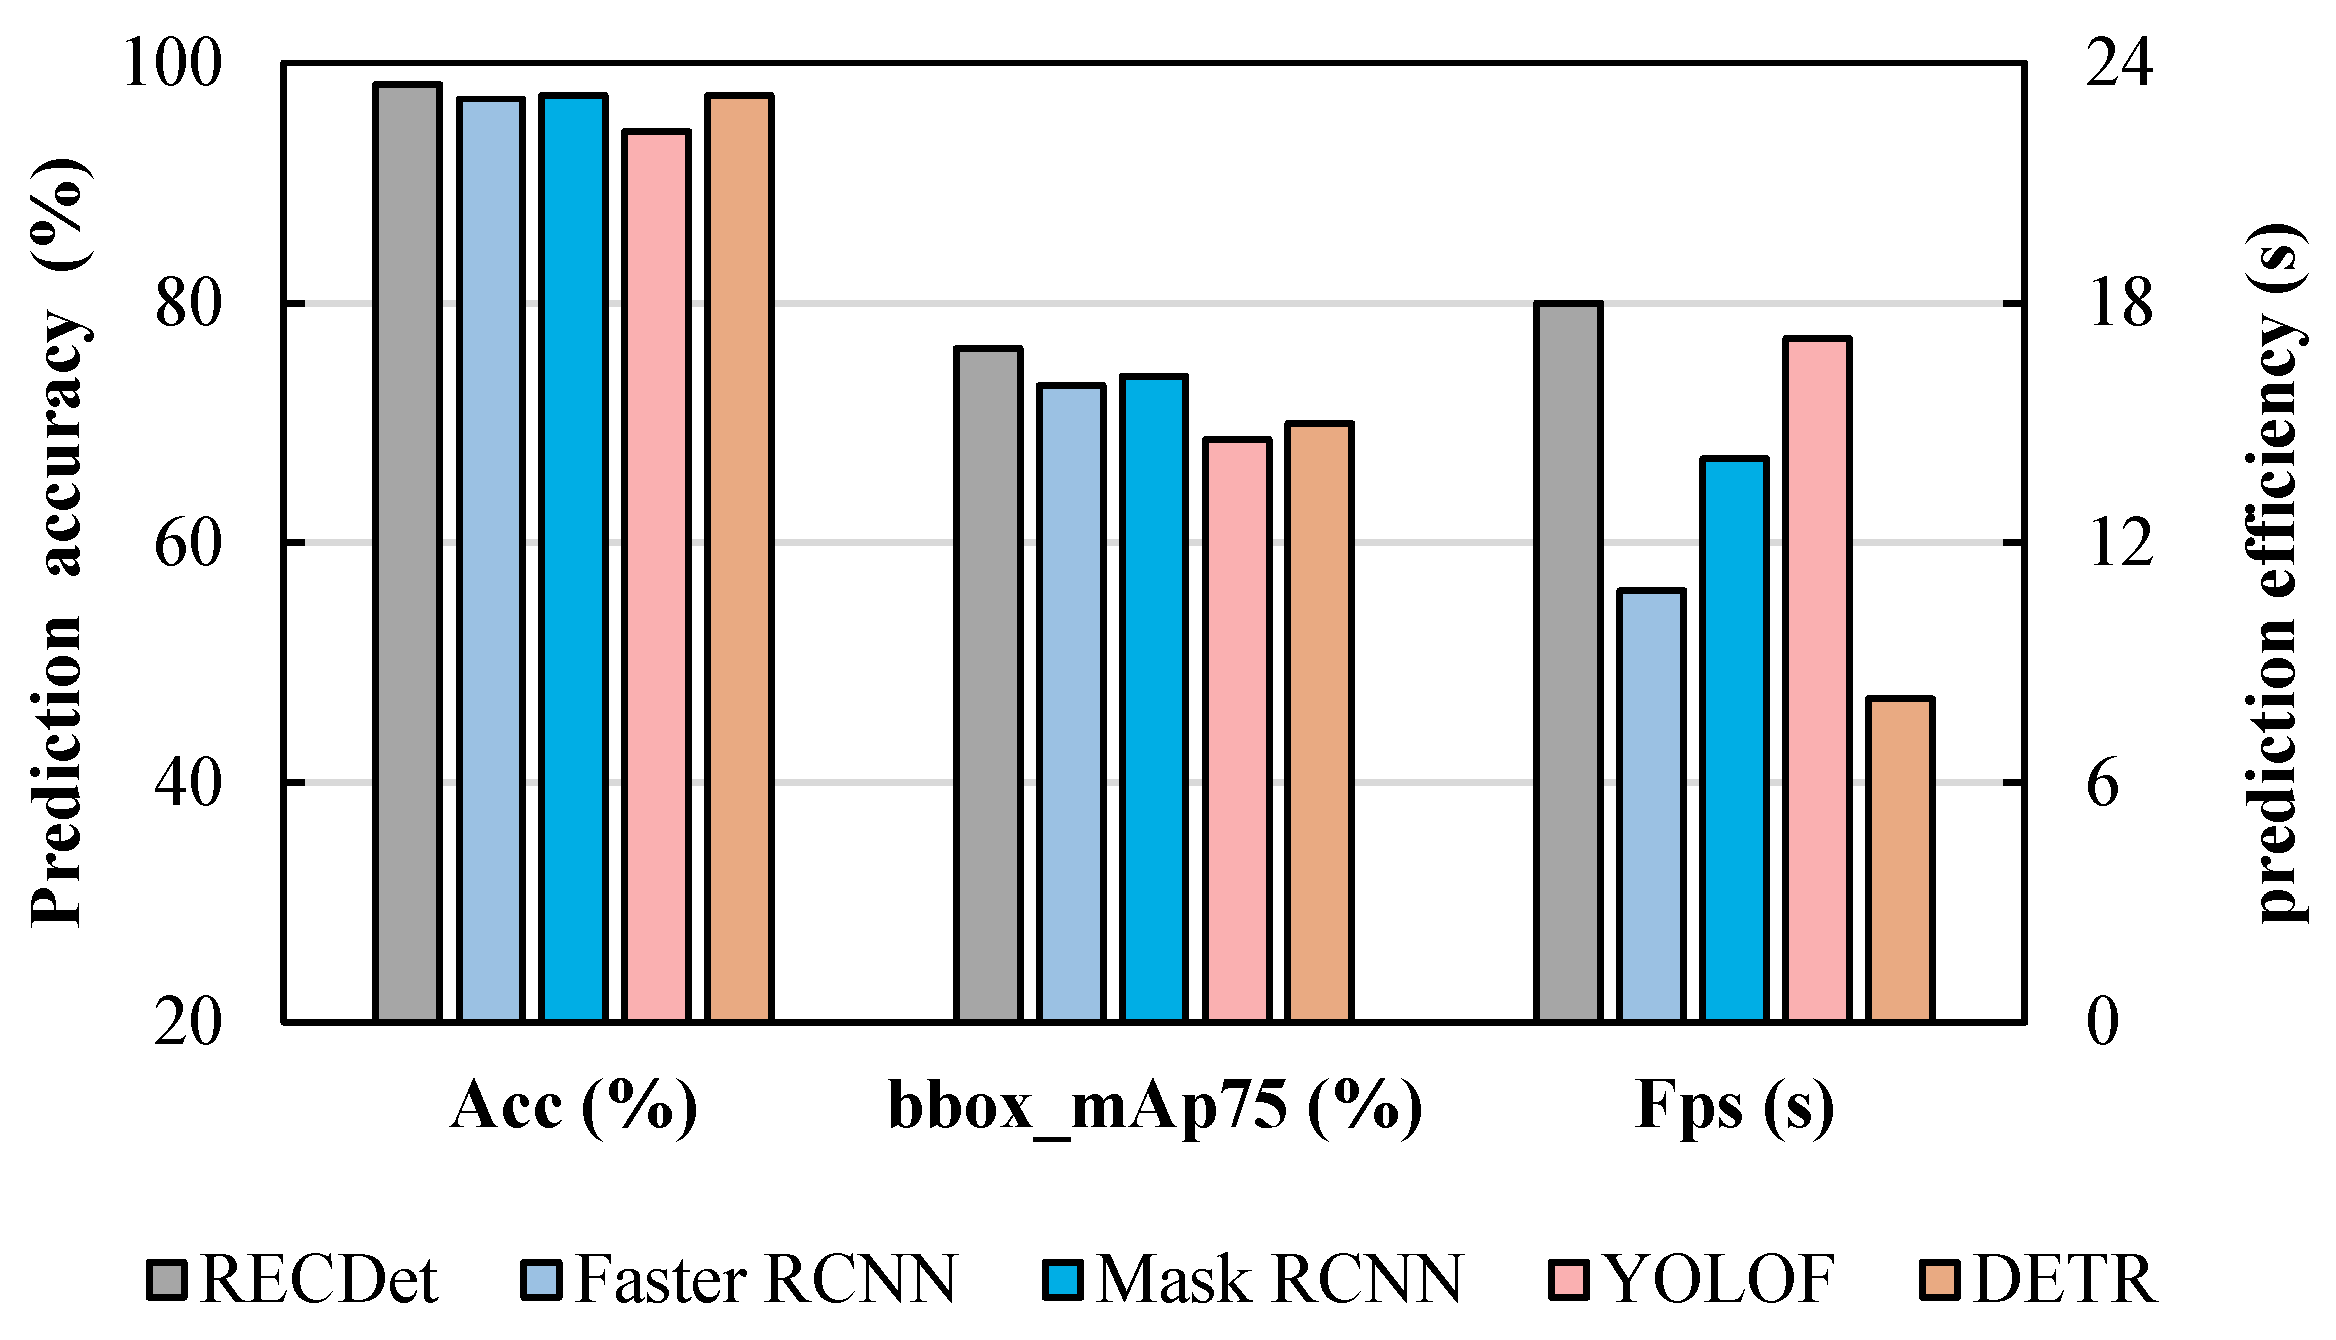
For the accuracy comparison shown in Figure 6, RECDet achieves a faster training speed and higher training stability as well as better prediction accuracy. This is because the features of the crystal are utilized to preprocess the image content, which enhances the neural network’s learning effect on crystal images, ensuring better accuracy in the early stages of training. When these processed crystal image features participate in the neural network training process, they yield a stable learning curve, minimize the background noise, and lead to fast learning and enhanced accuracy. The acc, bbox mAP75, and Fps comparisons by our RECDet and other models are shown in Figure 7.

Figure 6.
Comparison of accuracy during training on entecavir pharmaceutical dataset.
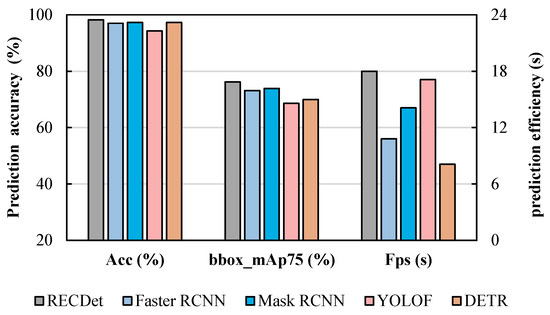
Figure 7.
Comparison of accuracy, box accuracy, and prediction speed among the four dominant models in the entecavir pharmaceutical dataset.
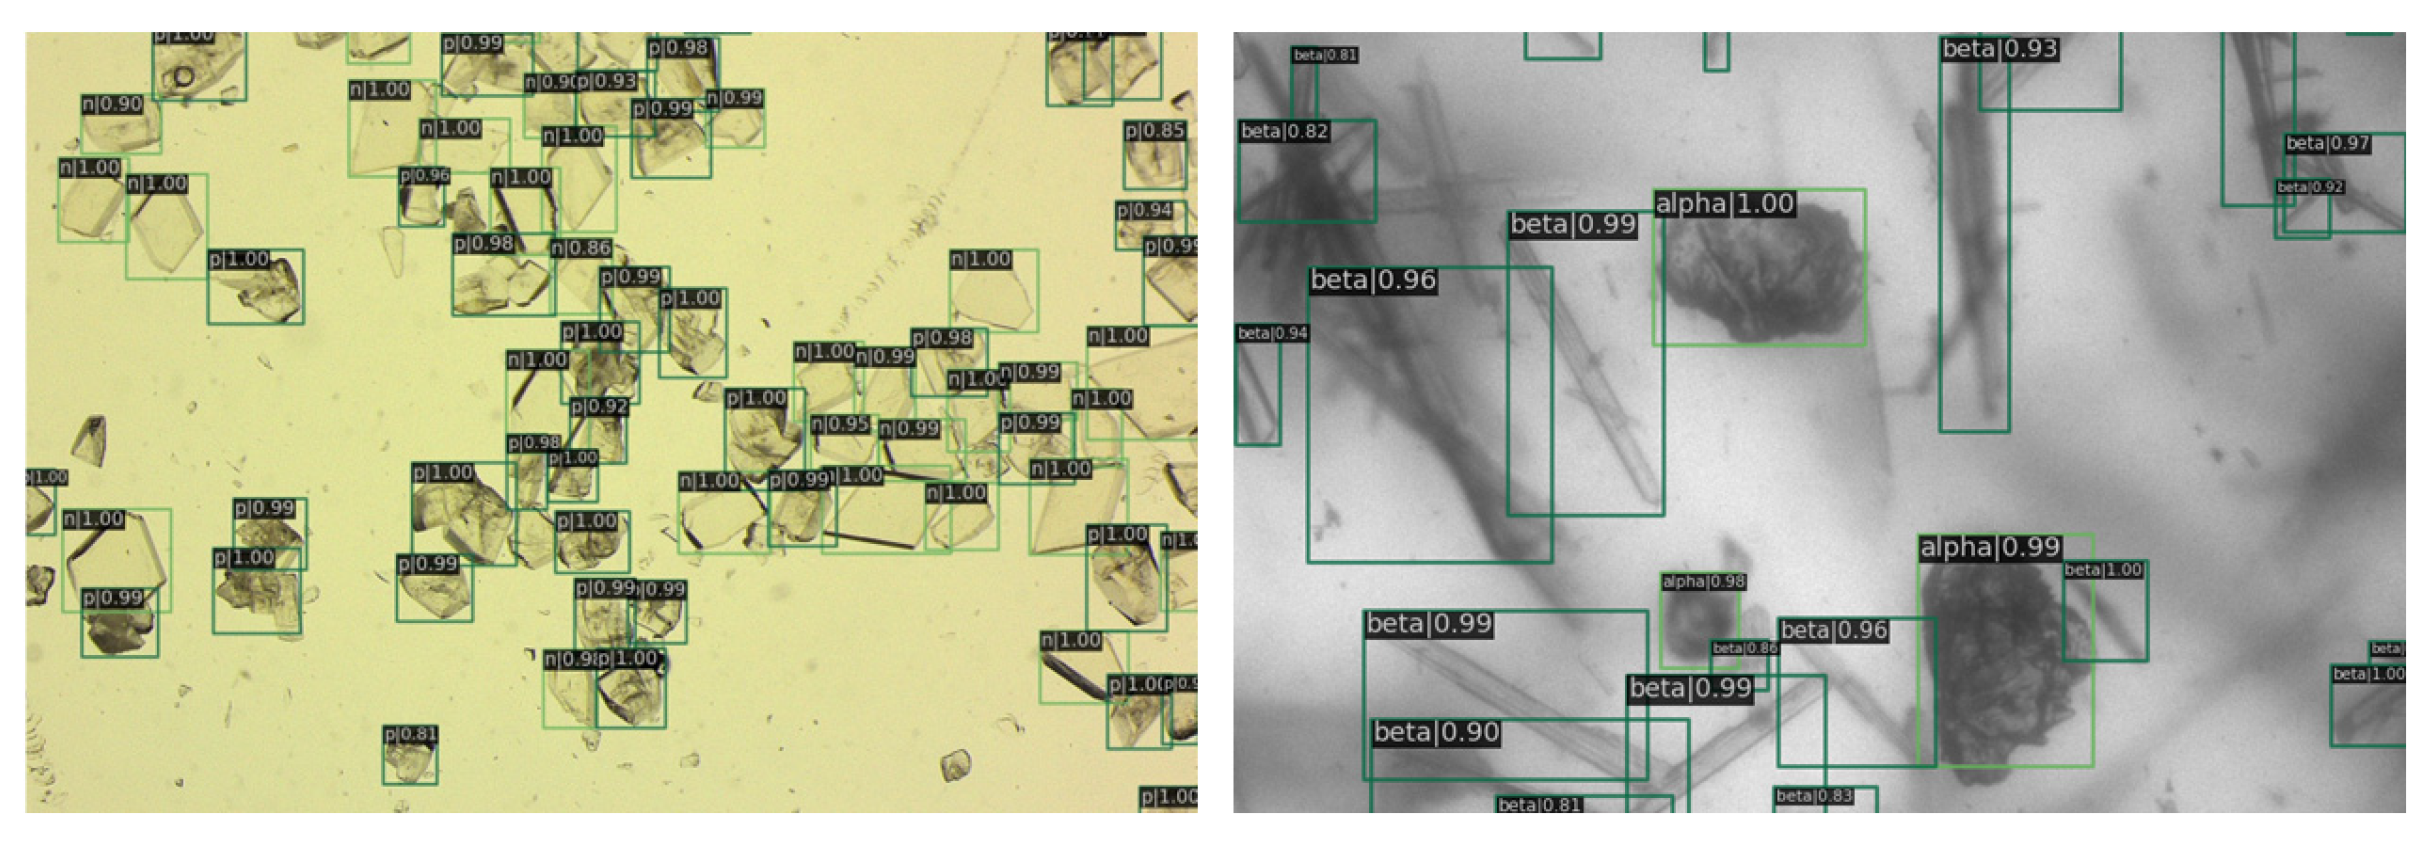
In Figure 8, it is evident that nearly all the crystals have been clearly annotated, with the details of images further delineated in subsequent figures.
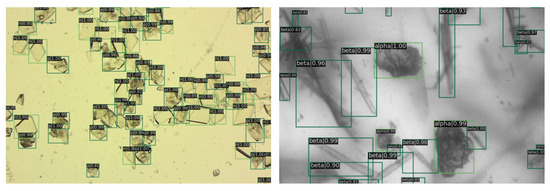
Figure 8.
The image depicts the detection results. On the left are the entecavir pharmaceutical crystals, and on the right are the glutamate crystals. Green rectangles are crystals identified by RECDet.
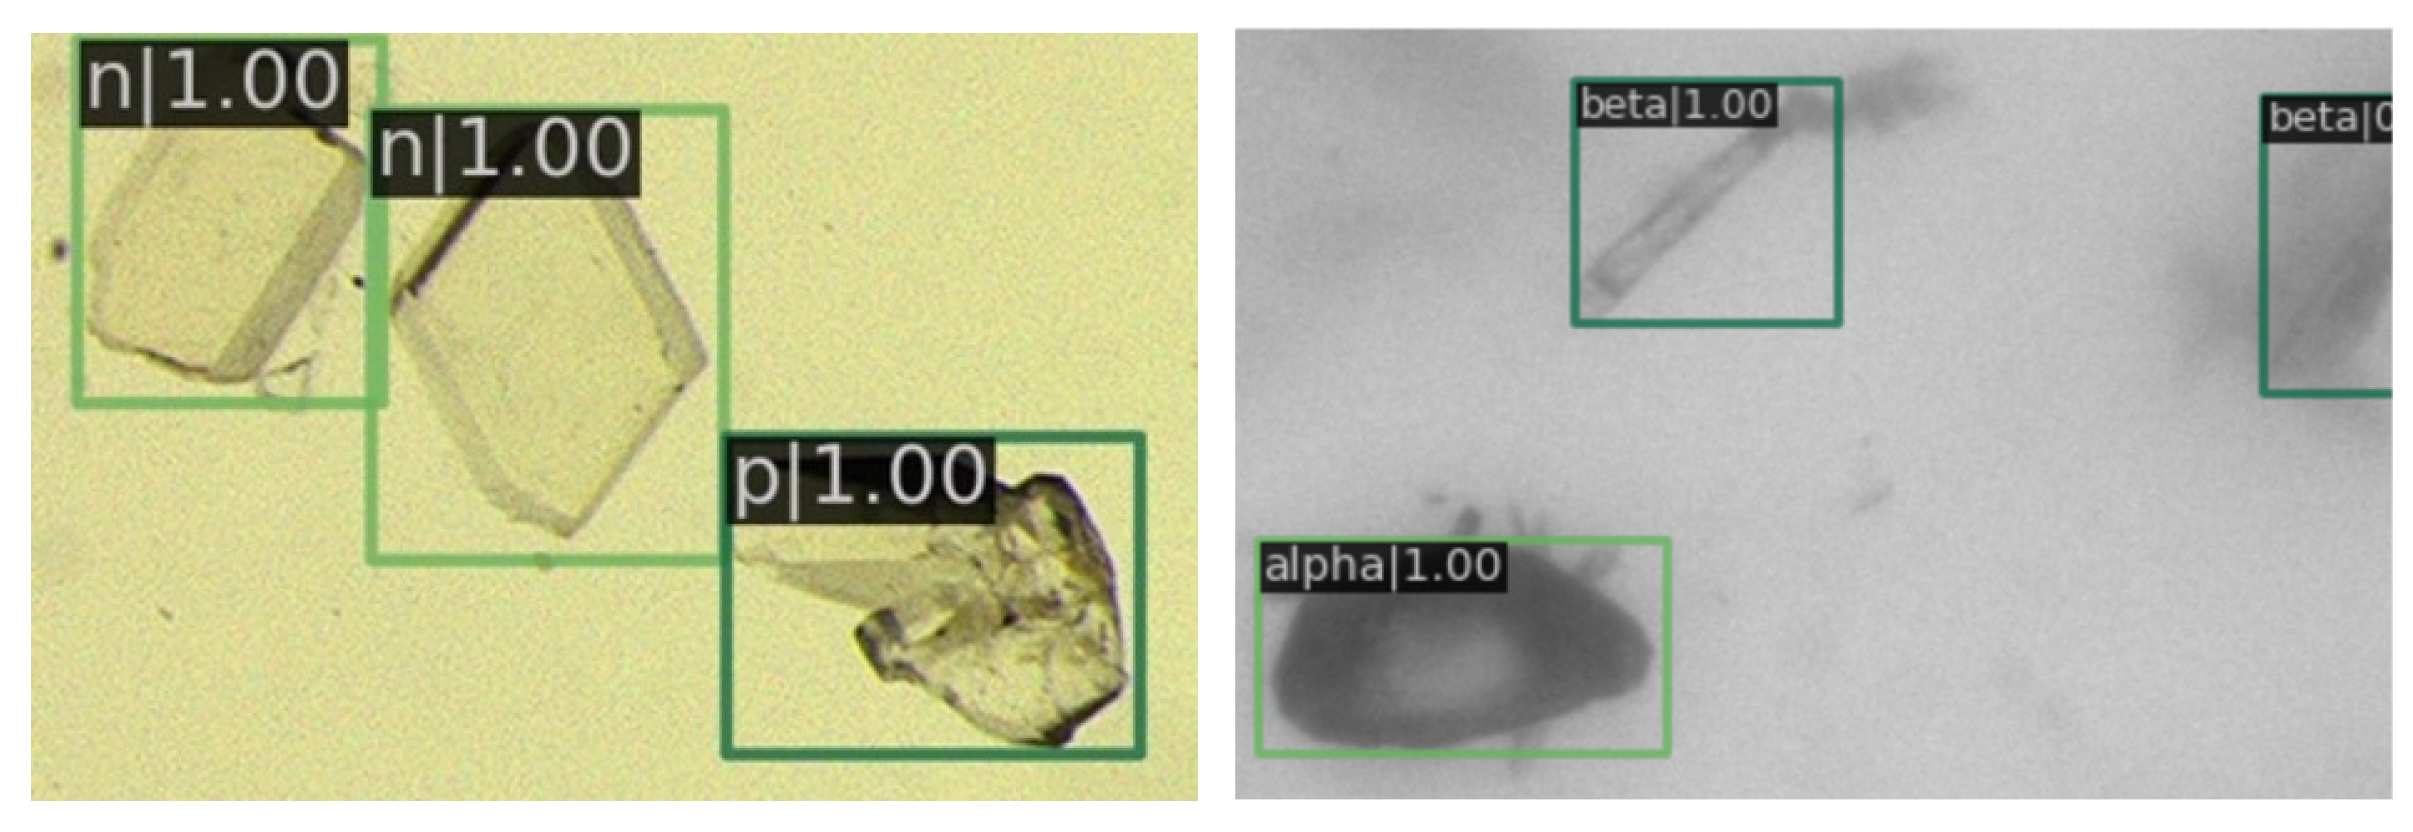
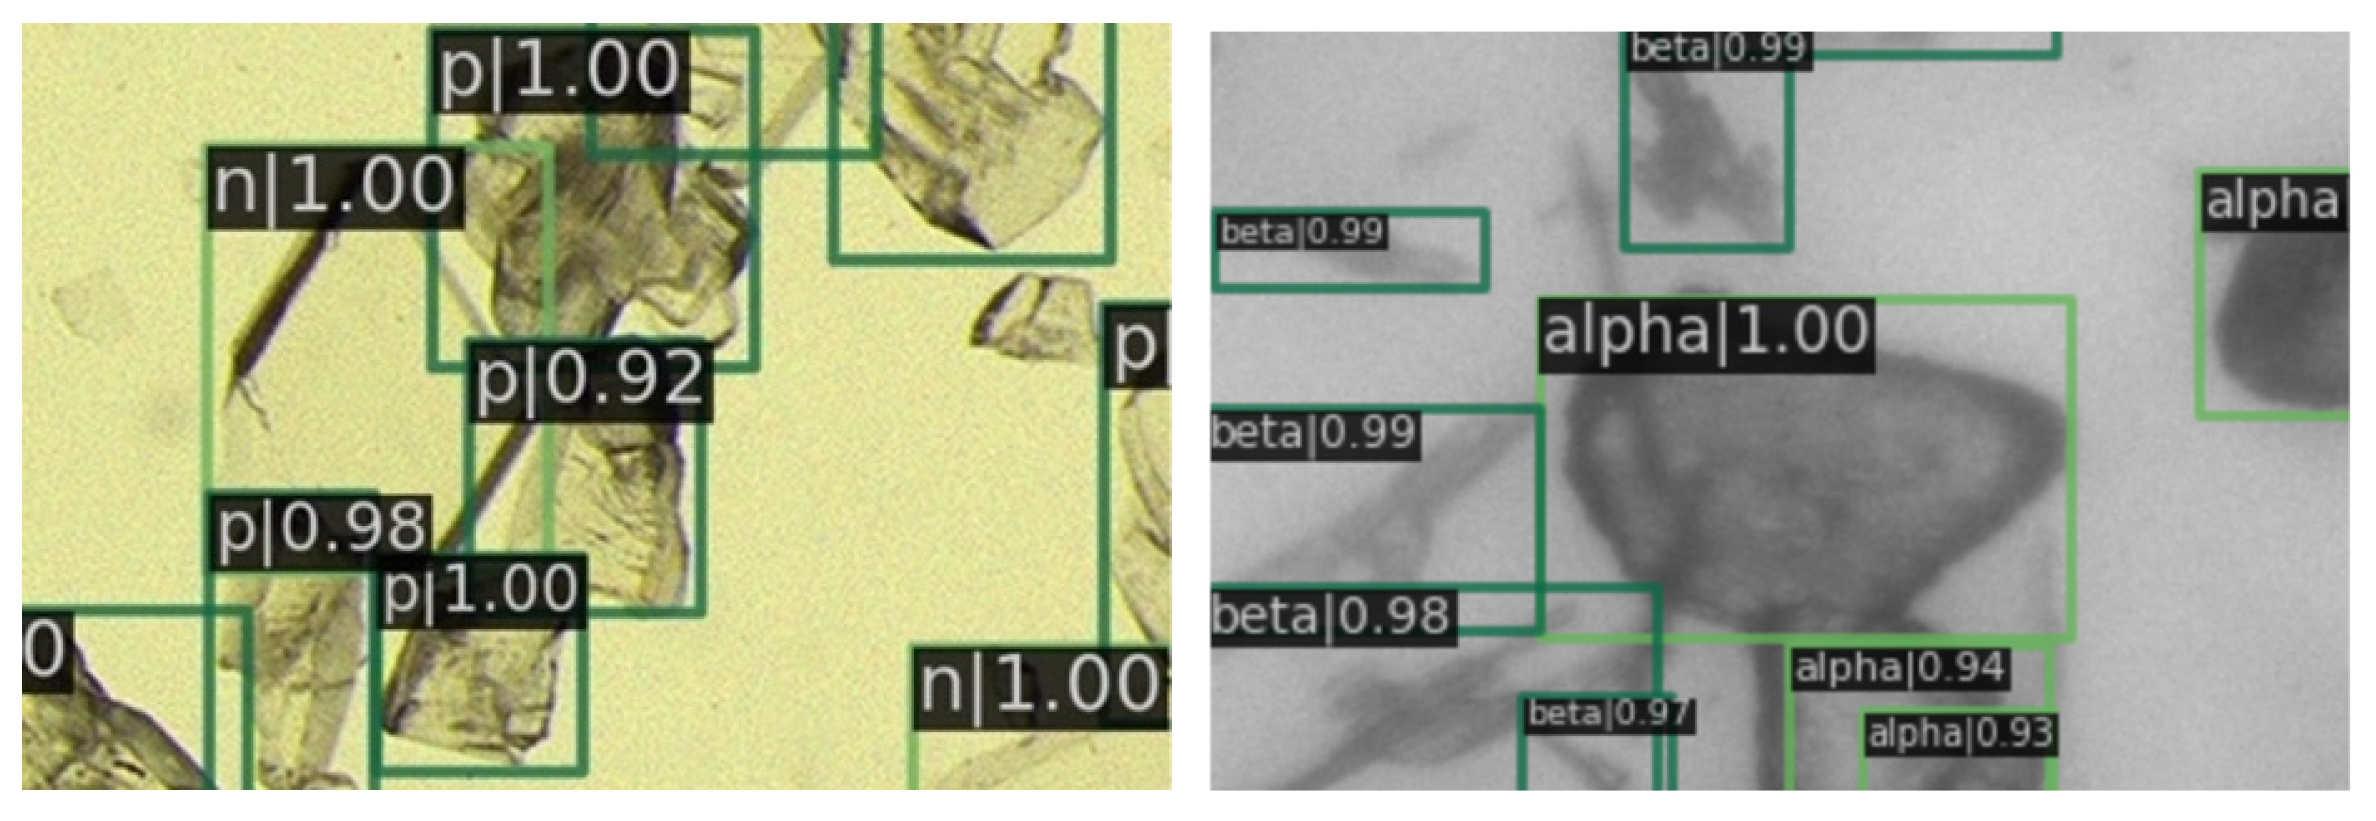
In Figure 9, a magnified view of image details is presented. It is evident that the prediction boxes are accurately annotated, and the crystal types are identified correctly. Figure 10 displays the detection results in regions with dense crystal formations, which also exhibit a satisfactory performance of our RECDet.
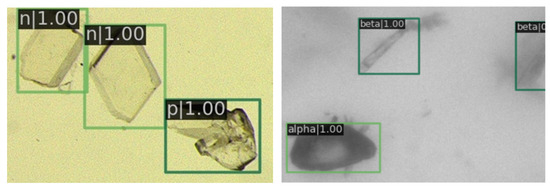
Figure 9.
Detail of detection results in sparse crystal regions. The letter in the top left corner denotes the type of crystal, followed by a number representing the predicted probability value. Green rectangles are crystals identified by RECDet.

Figure 10.
Detection effect details in crystal-dense areas. Green rectangles are crystals identified by RECDet.
3.4. Ablation Experiment
Ablation experiments evaluate how the binary maps for distinguishing background from the foreground and especially the designed detection boxes impact the model performance. The effects of removing the specially designed detection box (No box), removing the binary map to aid training (No bin), and the experimental effect of simultaneous removal (Null) are compared in the ablation experiment. As shown in Table 4, the observed decline in accuracy across all scenarios underscores the effectiveness of our RECDet.
Table 4.
Comparative results of ablation experiments.
3.5. Experimental Discussion
The biggest advantage of the RECDet model is that it eliminates background interference and saves computational resources. Traditional object detection models require resource allocation for foreground and background regions. The RECDet model intentionally avoids detecting background regions, which can significantly reduce the computational complexity and increase the prediction efficiency. As shown in Table 3, RECDet nearly doubles the prediction speed compared to other models. Besides, background interferences often introduce noise into the detection process, leading to false positives or missed detections. RECDet ignores these background regions which can minimize the interferences. In addition, the specially-designed detection box designed by RECDet further improves the prediction accuracy. These superiorities of RECDet in crystal object detection are well demonstrated according to the above experiments.
4. Conclusions
This paper introduces a novel method for crystal object detection. It utilizes a two-stage detection process combined with the Otsu threshold segmentation algorithm to adaptively distinguish between background and foreground regions in the crystal image, which helps our neural network to accurately predict the crystal shape and reduce the interference from impurities and background light intensity. Additionally, the background region is omitted during the candidate box generation process, minimizing the use of computational resources. Furthermore, the specially designed candidate box is well-suited to the crystal size, allowing for faster adaptation by the model. Compared to the current Mask RCNN model, the accuracy of the candidate box region is improved by more than 2%, and our classification accuracy reaches 98%. Finally, a self-made entecavir pharmaceutical crystals dataset is constructed for use in crystal object detection. The information including RECDet and the crystal image dataset is available at https://github.com/Alxcial/RECDet (accessed on 30 October 2023). The dataset will be made available for public use.
Certainly, there remains room for enhancement. The application of artificial intelligence technology in the actual crystalline production process still faces many challenges. These issues include blurred photos due to environmenal interference, uneven brightness caused by water ripples, problems related to turbid solutions and crystal agglomeration, and challenges associated with insufficient data. In our future work, we will continue to refine the method proposed in this study to solve the problems encountered in real production environments and mitigate the effects of these external factor disturbances.
Author Contributions
Conceptualization, Y.K. and Z.L.; methodology, Y.K.; software, Z.D., T.T. and X.Z.; validation, T.T., X.H. and H.H.; formal analysis, Z.D. and T.T.; resources, X.H.; data curation, Z.D.; writing—original draft preparation, Y.K. and Z.D.; writing—review and editing, Z.L.; funding acquisition, X.Z. and Z.L. All authors have read and agreed to the published version of the manuscript.
Funding
This work was supported by the National Natural Science Foundation of China (no. 62302165, no. 12171434, and no. 62376094), and the Science and Technology Plan Project of Huzhou City, China (no. 2022YZ03, no. 2022YZ15, and no. 2022GZ51).
Data Availability Statement
The supplementary information including RECDet and the crystal image dataset is available at https://github.com/Alxcial/RECDet (accessed on 30 October 2023). The data presented in this study are available on request from the corresponding author.
Conflicts of Interest
The authors declare no conflicts of interest.
References
- Su, W.; Jia, N.; Li, H.; Hao, H.; Li, C. Polymorphism of D-mannitol: Crystal Structure and the Crystal Growth Mechanism. Chin. J. Chem. Eng. 2017, 25, 358–362. [Google Scholar] [CrossRef]
- Kang, Y.; Chen, J.; Hu, X.; Jiang, Y.; Li, Z. A Cocrystal Prediction Method of Graph Neural Networks Based on Molecular Spatial Information and Global Attention. CrystEngComm 2023, 10, 16. [Google Scholar] [CrossRef]
- Kaul, P.; Xie, W.; Zisserman, A. Label, Verify, Correct: A Simple Few Shot Object Detection Method. In Proceedings of the IEEE/CVF Conference on Computer Vision and Pattern Recognition (CVPR), New Orleans, LA, USA, 18–24 June 2022; pp. 14237–14247. [Google Scholar]
- Yang, J.; Liu, S.; Li, Z.; Li, X.; Sun, J. Real-time Object Detection for Streaming Perception. In Proceedings of the IEEE/CVF Conference on Computer Vision and Pattern Recognition (CVPR), New Orleans, LA, USA, 18–24 June 2022; pp. 5385–5395. [Google Scholar]
- Chen, S.; Sun, P.; Song, Y.; Luo, P. Diffusiondet: Diffusion Model for Object Detection. In Proceedings of the IEEE/CVF International Conference on Computer Vision (ICCV), Paris, France, 1 October 2023; pp. 19830–19843. [Google Scholar]
- Xiouras, C.; Cameli, F.; Quilló, G.L.; Kavousanakis, M.E.; Vlachos, D.G.; Stefanidis, G.D. Applications of Artificial Intelligence and Machine Learning Algorithms to Crystallization. Chem. Rev. 2022, 122, 13006–13042. [Google Scholar] [CrossRef] [PubMed]
- Wilkinson, M.; Martinez-Hernandez, U.; Huggon, L.; Wilson, C.C.; Dominguez, B.C. Predicting Pharmaceutical Crystal Morphology Using Artificial Intelligence. CrystEngComm 2022, 24, 7545–7553. [Google Scholar] [CrossRef]
- Zhang, Y.; Xu, S.; Zhang, R.; Deng, Z.; Liu, Y.; Tian, J.; Yu, L.; Hu, Q.; Ye, Q. Automated Calculation of Liquid Crystal Sensing Images Based on Deep Learning. Anal. Chem. 2022, 94, 12781–12787. [Google Scholar] [CrossRef]
- Ramsundar, B.; Liu, B.; Wu, Z.; Verras, A.; Tudor, M.; Sheridan, R.P.; Pande, V. Is Multitask Deep Learning Practical for Pharma? J. Chem. Inf. Model. 2017, 57, 2068–2076. [Google Scholar] [CrossRef] [PubMed]
- Dang, Y.; Zhu, C.; Ikumi, M.; Takaishi, M.; Yu, W.; Huang, W.; Liu, X.; Kutsukake, K.; Harada, S.; Tagawa, M.; et al. Adaptive Process Control for Crystal Growth Using Machine Learning for High-speed Prediction: Application to SiC Solution Growth. CrystEngComm 2021, 23, 1982–1990. [Google Scholar] [CrossRef]
- Nakapraves, S.; Warzecha, M.; Mustoe, C.L.; Srirambhatla, V.; Florence, A.J. Prediction of Mefenamic Acid Crystal Shape by Random Forest Classification. Pharm. Res. 2022, 39, 3099–3111. [Google Scholar] [CrossRef] [PubMed]
- Taylor, L.S.; Braun, D.E.; Steed, J.W. Crystals and Crystallization in Drug Delivery Design. Cryst. Growth Des. 2021, 21, 1375–1377. [Google Scholar] [CrossRef]
- Doerr, F.; Brown, C.; Florence, A. Direct Image Feature Extraction and Multivariate Analysis for Crystallization Process Characterization. Cryst. Growth Des. 2022, 22, 2105–2116. [Google Scholar] [CrossRef] [PubMed]
- Lins, J.; Ebeling, U.; Wohlgemuth, K. Agglomeration Kernel Determination by Combining In-Process Image Analysis and Modeling. Cryst. Growth Des. 2022, 22, 5363–5374. [Google Scholar] [CrossRef]
- Zhou, Z.; Rahman, M.; Tajbakhsh, N.; Liang, J. UNet++: Redesigning Skip Connections to Exploit Multiscale Features in Image Segmentation. IEEE Trans. Med. Imaging 2019, 39, 1856–1867. [Google Scholar] [CrossRef] [PubMed]
- Choi, J.H.; Jang, W.; Lim, Y.J.; Mun, S.J.; Bong, K.W. Highly Flexible Deep-Learning-Based Automatic Analysis for Graphically Encoded Hydrogel Microparticles. ACS Sens. 2023, 8, 3158–3166. [Google Scholar] [CrossRef] [PubMed]
- Gao, Z.; Wu, Y.; Bao, Y.; Gong, J.; Wang, J.; Rohani, S. Image Analysis for In-line Measurement of Multidimensional Size, Shape, and Polymorphic Transformation of L-glutamic Acid Using Deep Learning-based Image Segmentation and Classification. Cryst. Growth Des. 2018, 18, 4275–4281. [Google Scholar] [CrossRef]
- Huo, Y.; Liu, T.; Jiang, Z.; Fan, J. U-net Based Deep-learning Image Monitoring of Crystal Size Distribution During L-glutamic Acid Crystallization. In Proceedings of the 2021 40th Chinese Control Conference (CCC), Shanghai, China, 26–28 July 2021; IEEE: Piscataway, NJ, USA, 2021; pp. 2555–2560. [Google Scholar]
- Wu, Y.; Gao, Z.; Rohani, S. Deep Learning-based Oriented Object Detection for In-situ Image Monitoring and Analysis: A Process Analytical Technology (PAT) Application for Taurine Crystallization. Chem. Eng. Res. Des. 2021, 170, 444–455. [Google Scholar] [CrossRef]
- Manee, V.; Zhu, W.; Romagnoli, J. A Deep Learning Image-based Sensor for Real-time Crystal Size Distribution Characterization. Ind. Eng. Chem. Res. 2019, 58, 23175–23186. [Google Scholar] [CrossRef]
- Selvaraju, R.R.; Cogswell, M.; Das, A.; Vedantam, R.; Parikh, D.; Batra, D. Grad-cam: Visual Explanations from Deep Networks Via Gradient-based Localization. In Proceedings of the IEEE/CVF International Conference on Computer Vision (ICCV), Venice, Italy, 22–29 October 2017; pp. 618–626. [Google Scholar]
- Zhang, Q.; Wu, Y.; Zhu, S. Interpretable Convolutional Neural Networks. In Proceedings of the IEEE/CVF Conference on Computer Vision and Pattern Recognition (CVPR), Salt Lake City, UT, USA, 18–23 June 2018; pp. 8827–8836. [Google Scholar]
- Ras, G.; Xie, N.; Van Gerven, M.; Doran, D. Explainable Deep Learning: A Field Guide for the Uninitiated. J. Artif. Intell. Res. 2022, 73, 329–396. [Google Scholar] [CrossRef]
- Du, L.; Zhang, R.; Wang, X. Overview of Two-stage Object Detection Algorithms. J. Phys. Conf. Ser. 2020, 1544, 012033. [Google Scholar] [CrossRef]
- Lin, T.; Maire, M.; Belongie, S.; Hays, J.; Perona, P.; Ramanan, D.; Dollár, P.; Zitnick, C.L. Microsoft COCO: Common Objects in Context. In Proceedings of the European Conference on Computer Vision (ECCV), Zurich, Switzerland, 6–12 September 2014; pp. 740–755. [Google Scholar]
- Zhan, Y.; Zhang, G. An Improved OTSU Algorithm Using Histogram Accumulation Moment for Ore Segmentation. Symmetry 2019, 11, 431. [Google Scholar] [CrossRef]
- He, K.; Zhang, X.; Ren, S.; Sun, J. Deep Residual Learning for Image Recognition. In Proceedings of the IEEE/CVF Conference on Computer Vision and Pattern Recognition (CVPR), Las Vegas, NV, USA, 27–30 June 2016; pp. 770–778. [Google Scholar]
- Theckedath, D.; Sedamkar, R. Detecting Affect States Using VGG16, ResNet50 and SE-ResNet50 Networks. SN Comput. Sci. 2020, 1, 79. [Google Scholar] [CrossRef]
- Zheng, Z.; Wang, P.; Liu, W.; Liu, J.; Ye, R.; Ren, D. Distance-IoU Loss: Faster and Better Learning for Bounding Box Regression. In Proceedings of the AAAI Conference on Artificial Intelligence, Vancouver, BC, Canada, 20–27 February 2020; Volume 34, pp. 12993–13000. [Google Scholar]
- Sun, Y.; Sun, C.; Wang, D.; He, L.; Lu, H. Roi Pooled Correlation Filters for Visual Tracking. In Proceedings of the IEEE/CVF Conference on Computer Vision and Pattern Recognition (CVPR), Long Beach, CA, USA, 15–20 June 2019; pp. 5783–5791. [Google Scholar]
- Wei, L.; Zheng, C.; Hu, Y. Oriented Object Detection in Aerial Images Based on the Scaled Smooth L1 Loss Function. Remote Sens. 2023, 15, 1350. [Google Scholar] [CrossRef]
- Ren, S.; He, K.; Girshick, R.; Sun, J. Faster R-CNN: Towards Real-Time Object Detection with Region Proposal Networks. IEEE Trans. Pattern Anal. Mach. Intell. 2015, 39, 1137–1149. [Google Scholar] [CrossRef]
- He, K.; Gkioxari, G.; Dollár, P.; Girshick, R. Mask R-CNN. In Proceedings of the IEEE/CVF Conference on Computer Vision and Pattern Recognition (CVPR), Venice, Italy, 22–29 October 2017; pp. 2961–2969. [Google Scholar]
- Chen, Q.; Wang, Y.; Yang, T.; Zhang, X.; Cheng, J.; Sun, J. You Only Look One-level Feature. In Proceedings of the IEEE/CVF Conference on Computer Vision and Pattern Recognition (CVPR), Nashville, TN, USA, 20–25 June 2021; pp. 13039–13048. [Google Scholar]
- Carion, N.; Massa, F.; Synnaeve, G.; Usunier, N.; Kirillov, A.; Zagoruyko, S. End-to-end Object Detection with Transformers. In Proceedings of the European Conference on Computer Vision (ECCV), Glasgow, UK, 23–28 August 2020; Volume 12346, pp. 213–229. [Google Scholar]
- Chen, K.; Wang, J.; Pang, J.; Wu, Y.; Dai, J.; Wang, J.; Shi, J.; Ouyang, W.; Loy, C.C.; Lin, D.; et al. MMDetection: Open mmlab Detection Toolbox and Benchmark. arXiv 2019, arXiv:1906.07155, 2019. [Google Scholar]
- Ren, J.; Wang, Y. Overview of object detection algorithms using convolutional neural networks. J. Comput. Commun. 2022, 10, 115–132. [Google Scholar]
Disclaimer/Publisher’s Note: The statements, opinions and data contained in all publications are solely those of the individual author(s) and contributor(s) and not of MDPI and/or the editor(s). MDPI and/or the editor(s) disclaim responsibility for any injury to people or property resulting from any ideas, methods, instructions or products referred to in the content. |
© 2024 by the authors. Licensee MDPI, Basel, Switzerland. This article is an open access article distributed under the terms and conditions of the Creative Commons Attribution (CC BY) license (https://creativecommons.org/licenses/by/4.0/).