Article

Plasma-Enhanced Atomic Layer Deposition of Hematite for Photoelectrochemical Water Splitting Applications

1
Department of Chemistry, University of Bath, Claverton Down, Bath BA2 7AY, UK
2
School of Chemistry, Monash University, Clayton, VIC 3800, Australia
*
Author to whom correspondence should be addressed.
Crystals 2024, 14(8), 723; https://doi.org/10.3390/cryst14080723 (registering DOI)
Submission received: 3 July 2024 / Revised: 5 August 2024 / Accepted: 10 August 2024 / Published: 13 August 2024

Abstract

:
Hematite (α-Fe2O3) is one of the most promising and widely used semiconductors for application in photoelectrochemical (PEC) water splitting, owing to its moderate bandgap in the visible spectrum and earth abundance. However, α-Fe2O3 is limited by short hole-diffusion lengths. Ultrathin α-Fe2O3 films are often used to limit the distance required for hole transport, therefore mitigating the impact of this property. The development of highly controllable and scalable ultrathin film deposition techniques is therefore crucial to the application of α-Fe2O3. Here, a plasma-enhanced atomic layer deposition (PEALD) process for the deposition of homogenous, conformal, and thickness-controlled α-Fe2O3 thin films (<100 nm) is developed. A readily available iron precursor, dimethyl(aminomethyl)ferrocene, was used in tandem with an O2 plasma co-reactant at relatively low reactor temperatures, ranging from 200 to 300 °C. Optimisation of deposition protocols was performed using the thin film growth per cycle and the duration of each cycle as optimisation metrics. Linear growth rates (constant growth per cycle) were measured for the optimised protocol, even at high cycle counts (up to 1200), confirming that all deposition is ‘true’ atomic layer deposition (ALD). Photoelectrochemical water splitting performance was measured under solar simulated irradiation for pristine α-Fe2O3 deposited onto FTO, and with a α-Fe2O3-coated TiO2 nanorod photoanode.

1. Introduction

Atomic layer deposition (ALD) is a highly precise and controlled gas phase method for the deposition of thin films onto a range of substrates, first developed independently within groups in the Soviet Union (1960s) and in Finland (1974) [1,2,3]. It has since been applied across a range of semiconductor-based technology that requires ultrathin, controlled, and conformal coatings [4]. One such use is in photoelectrochemical (PEC) devices, which can employ ALD to fabricate heterojunctions [5], protective layers [6], and blocking layers [7]. PEC devices are typically highly nanostructured with complex morphologies, making ALD perfectly suited for the deposition of conformal layers onto these high-aspect-ratio arrangements without losing or filling-in the desired architecture.
The conventional method of ALD, also known as thermal ALD, uses elevated substrate temperatures and simple oxidants (e.g., H2O, H2O2, O2 and O3) to drive surface reactions in each half-cycle [1,8]. However, these common oxidants are often not suitable co-reactants for efficient deposition on less reactive precursor compounds, significantly restricting the viable precursor options. An alternative method that is more effective on less reactive precursors is plasma-enhanced ALD (PEALD) [9,10], which utilises a strongly oxidising plasma (commonly O2 or N2 plasmas) as the co-reactant in the second half-cycle, providing access to lower substrate/deposition temperatures, faster reactions, shorter purge times, and a shorter initial nucleation delay before linear growth rates [9]. However, limitations of PEALD make its use situational and make it require stringent optimisation and characterisation protocols, including lower thin film uniformity, plasma-induced damage to the growing film or underlayers, and undesired surface reactions and defect formation [11,12,13].
ALD of α-Fe2O3 has been given significantly less attention compared to the alternative common metal oxide materials due to its low growth rates, low precursor volatilities and reactivities, and narrow temperature windows for ALD growth [14,15,16,17,18]. A range of Fe2O3 precursors have been studied and reported, including Fe(thd)3 [19], Fe2(OtBu)6 [20], bis(2,4-methylpentadienyl)iron [21], FeCl3 [22], Fe(acac)3 [23], and Fe(btmsa) [24], using either H2O, H2O2, O2, or O3 as a co-reactant, and sharing similar optimal deposition conditions [19,25,26,27,28].
While precursors such as FeCl3 are hampered by corrosion issues in the ALD chamber [22], precursors such as ferrocene [29] have received attention because of the combined features of its low cost, high level of availability, high air moisture, and thermal stability, making it an ideal candidate for scale-up [19,27]. However, even Ferrocene-based precursors require long deposition durations due to poor reactivity, often using O3 oxidant as the most reactive co-reactant commonly used in thermal ALD. It therefore makes sense to instead use highly reactive oxygen plasma as the oxidant (i.e., PEALD). Despite this, to the best of the authors’ knowledge, only two studies have been published using PEALD to deposit α-Fe2O3. Detavernier et al. [30] used a tertiary butyl ferrocene precursor with O2 plasma to produce crystalline, pure α-Fe2O3 films within the temperature range 250–400 °C. Jeong et al. [31] compared thermal ALD and PEALD for the deposition of α-Fe2O3 from bis(N,N’-dibutylacetamidinato)iron(II) precursor, revealing that PEALD-grown α-Fe2O3 possessed lower surface roughness and better crystallinity than the equivalent film grown by thermal ALD. Given the advantages of PEALD for overcoming limitations within α-Fe2O3 ALD, it is surprising that no additional literature exists on similar α-Fe2O3 PEALD processes.
Hematite (α-Fe2O3) possesses high stability under a large pH range, non-toxicity, high natural abundance, low cost, and narrow bandgap of 2.0–2.2 eV, allowing absorption of most of the visible light spectrum (up to 620 nm) [32]. This combination of properties has made it one of the most promising and best-researched materials for use in PEC water splitting, however, its application in energy storage devices such as batteries [33,34,35,36] and supercapacitors [37,38,39], sensors that detect the presence of certain gases or chemicals [40,41,42,43,44,45], and PEC solar cells has also been explored [46,47,48]. The predominant limitation of α-Fe2O3 is its short hole-diffusion lengths, restricting its use to ultra-thin films or highly nanostructured morphologies such as nanowires to minimise diffusion distances [49,50,51]. A TiO2 underlayer is known to improve the PEC performance of α-Fe2O3 on FTO substrate as α-Fe2O3 and FTO have a significant lattice mismatch, resulting in a poor interface for electron transport [50]. In fact, a study by Grätzel et al. used an O3 co-reactant in a thermal ALD process to conformally coat TiO2 nanorods with a α-Fe2O3 overlayer, which significantly enhanced the PEC performance of the electrode relative to both films individually [52]. Here we have developed for the first time a viable PEALD process for the fabrication of hematite thin films using a widely commercially available precursor system. This study represents our initial research in this area.

2. Results

Dimethyl(aminomethyl)ferrocene (DMAMFc) has been previously reported by Grätzel et al. [52] as a precursor in an ALD process using ozone (O3) oxidant as the co-reactant. It was therefore deemed a promising option for application within a PEALD regime. Due to the differing technique and instruments, it was important to optimise the complete process for PEALD, and not simply the second, plasma half-cycle parameters.
Thermogravimetric analysis (TGA) was performed on DMAMFc to reveal its volatilisation behaviour and suitability for ALD (Figure 1). A single and relatively fast mass loss event was measured, showing clean volatilisation (reaching ~0% wt%) initiating at 108.2 °C (temperature after 1% mass loss) and completing at 217.7 °C. The absence of any signs of decomposition reveals the high thermal stability of the DMAMFc precursor, a vital property for ALD precursors to ensure no decomposition (CVD) processes occur during precursor pulse half-cycles. Indeed, possession of both suitable volatility and high thermal stability indicates the promise of DMAMFc precursor towards ALD.

2.1. PEALD Process Development

All optimisation figures herein have used a ‘standard deposition procedure’ developed throughout the work as the most optimised parameters. Unless otherwise stated, all figures will vary only according to the discussed parameters from this procedure. The standard deposition procedure was: 90 °C pot temperature, 240 °C chamber temperature, {0.5/3.0/5.0 s} × 3 vapour boost/precursor-pulse/purge sequence in the precursor pulse half-cycle, 5 s plasma pulse (100 W), and 10 s plasma purge. Preliminary depositions were ineffective and yielded negligible Fe2O3 thicknesses due to the slow rate of precursor uptake. In order to effect precursor transfer, a vapour boost protocol was introduced, specifically, the pressure within the precursor pot was increased by a short (<1 s) nitrogen pulse immediately before exposure to the vacuum, resulting in a more forceful initial response and increased agitation of the liquid precursor, and therefore the vapour formation and uptake.
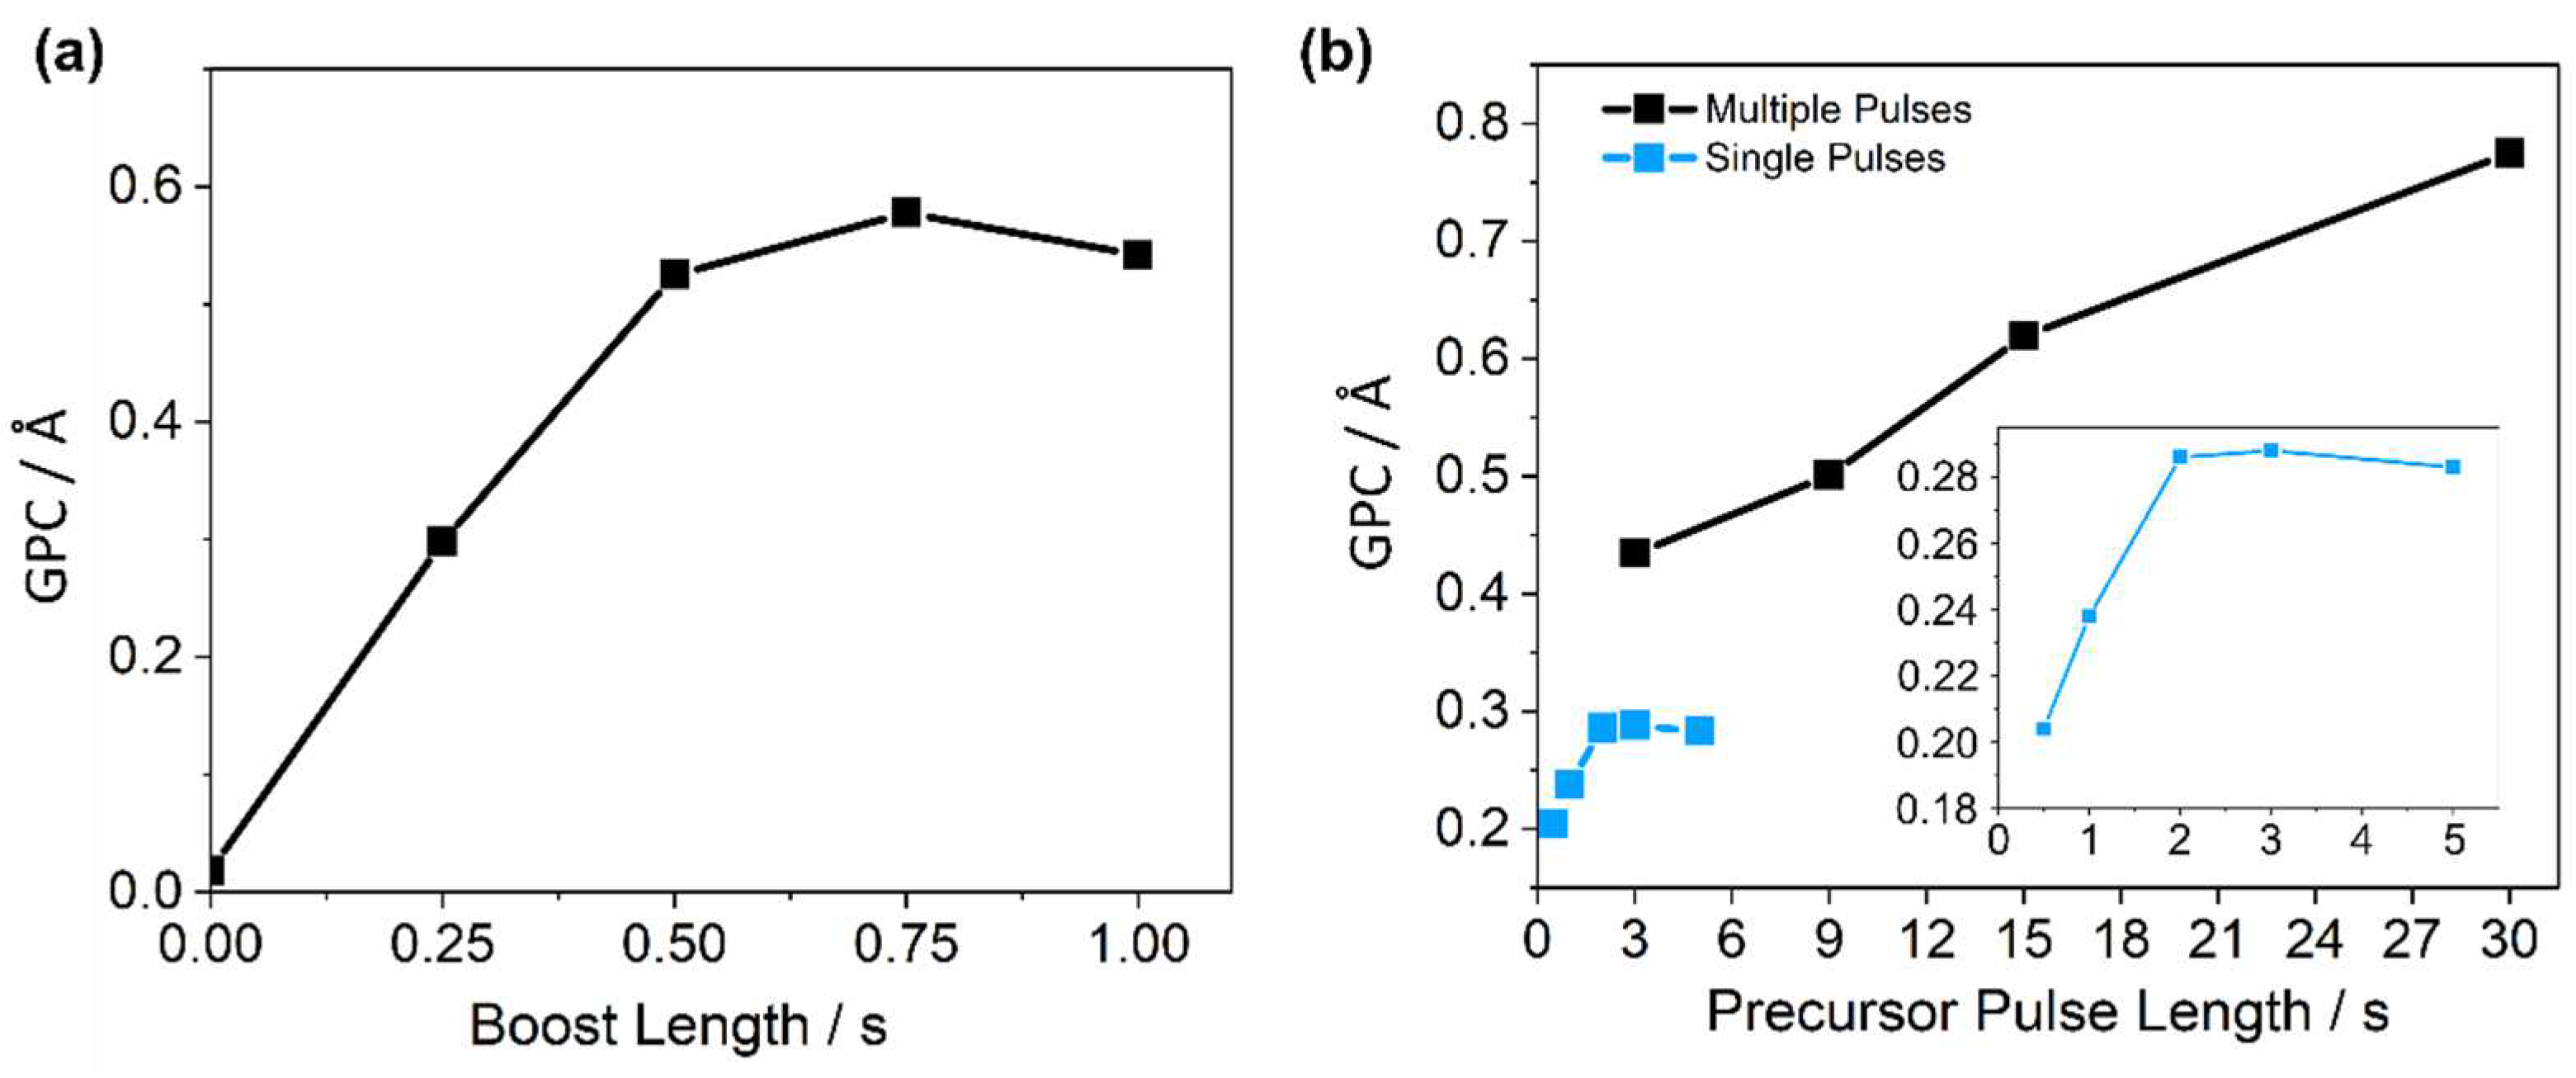
Growth per cycle (GPC) values (obtained by measurement of the final thickness of a grown film with a known number of cycles) from no boost to 1 s boost sequences (Figure 2a) reveal the significant enhancement in performance provided, and that the DMAMFc PEALD process is likely primarily limited by the precursor extraction from the pot into the chamber.
The GPC begins to plateau after 0.5 s, an indication that precursor uptake has passed the threshold where it is the limiting factor for deposition, and the process is now limited by the reaction rate at the sample surface. A duration of 0.5 s was therefore chosen to maximise uptake and minimise cycle duration.
Precursor pulse lengths from 0.5 to 5 s, all with a 0.5 s boost, were trialled, yielding an apparent GPC saturation regime from 2 s onward, a classic indication of self-limiting ALD growth (blue trace and inset, Figure 2b). However, the GPC value at the plateau (~0.29 Å) was significantly lower than expected for an ALD process with complete surface saturation in each cycle. Considering boosts were essential for extraction of the precursor, multiple pulses, each with its own boost, were trialled within the same precursor half-cycle, effectively refreshing the pot to the boost pressure after each individual pulse (black trace, Figure 2b). Using the multi-pulse half-cycles, the GPC increased significantly for the same total precursor pulse lengths and continued a relatively linear increase as total pulse length increased further, even reaching total pulse lengths of 30 s (10 consecutive 0.5 s boosts + 3 s pulse) without a plateau.
These data clearly show that the precursor is unusually difficult to volatilise, reaching a point after initial exposure to the vacuum where no, or significantly limited, volatilisation occurs, despite the continuation of the vacuum environment. While it is conventional to increase pulse duration until saturated ALD growth is seen, 30 s total pulse lengths consumed large quantities of precursor and required long deposition periods of 110 s per cycle. It was therefore concluded that a higher pulse duration was impractical for employment in both a research and commercial environment.
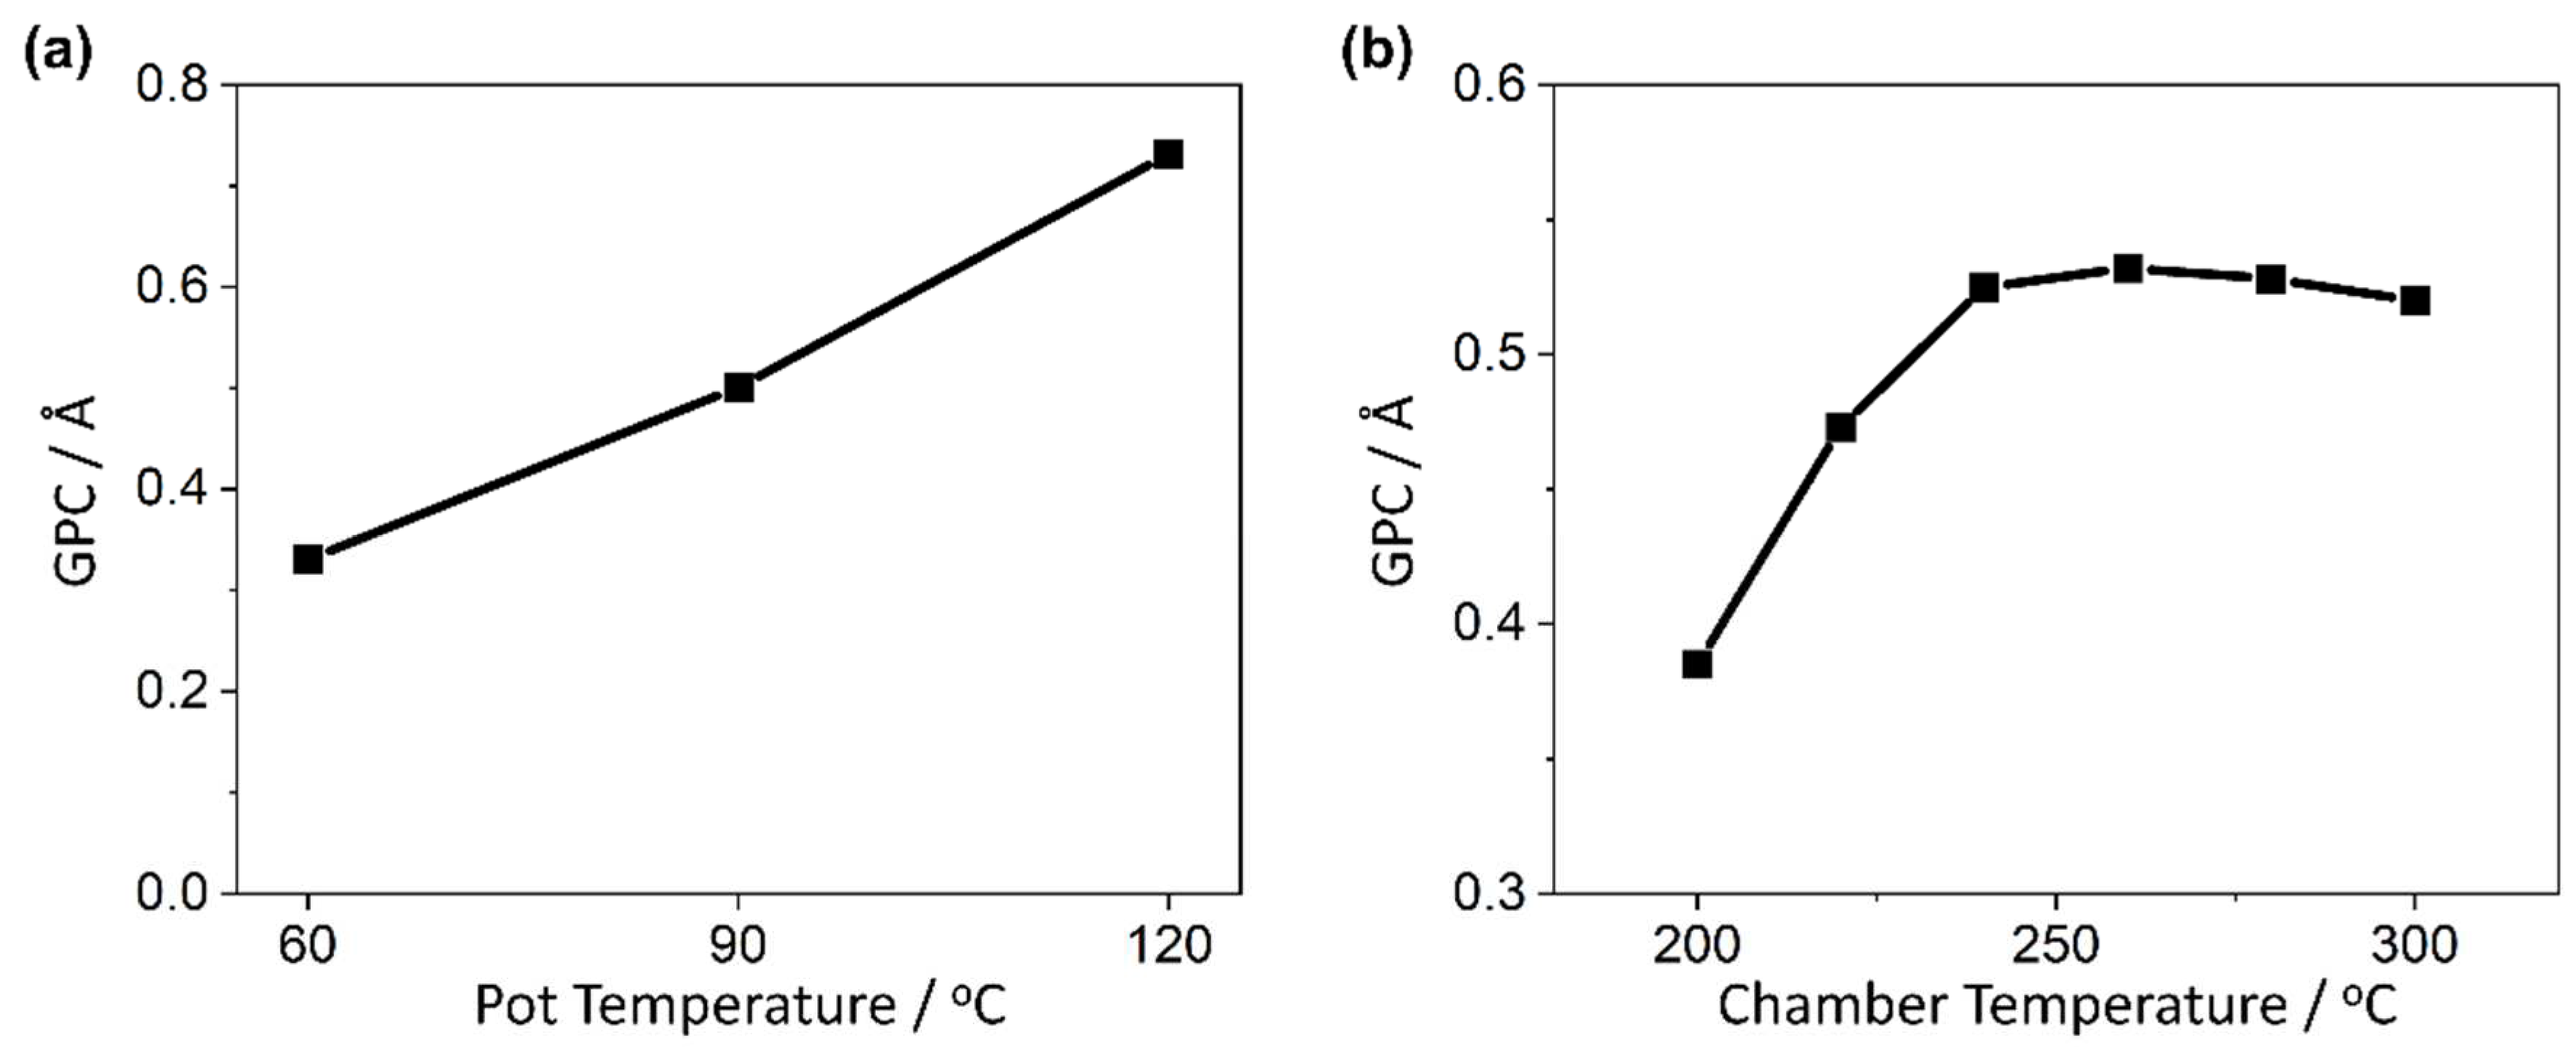
A linear increase in GPC with increasing pot temperature was seen (Figure 3a), suggesting that the rate of monolayer deposition within the DMAMFc deposition was limited by the amount of precursor pulsed into the chamber. Temperatures above 120 °C were not tested as a previous report using this precursor identified a reduction in photoactivity of the resulting film with pot temperatures at 120 °C and higher [52]. The temperature of the reaction chamber was optimised to reside within the self-limiting growth ALD window. After trialling six points between 200 and 300 °C, the GPC plateaus at 240 and 260 °C before decreasing at 280 and 300 °C, likely due to desorption from the sample surface (Figure 3b).
There are no signs of CVD contribution, therefore the precursor can be used at all these temperatures. The optimal temperature was chosen to be 240 °C, despite its 0.007 Å cycle−1 lower GPC than 260 °C (0.525 compared to 0.532 Å cycle−1, respectively). Lower temperature processes are preferred due to the reduced energy requirement and greater flexibility in choice of substrate and co-reactant, hence the marginal GPC difference does not justify the increased temperature.
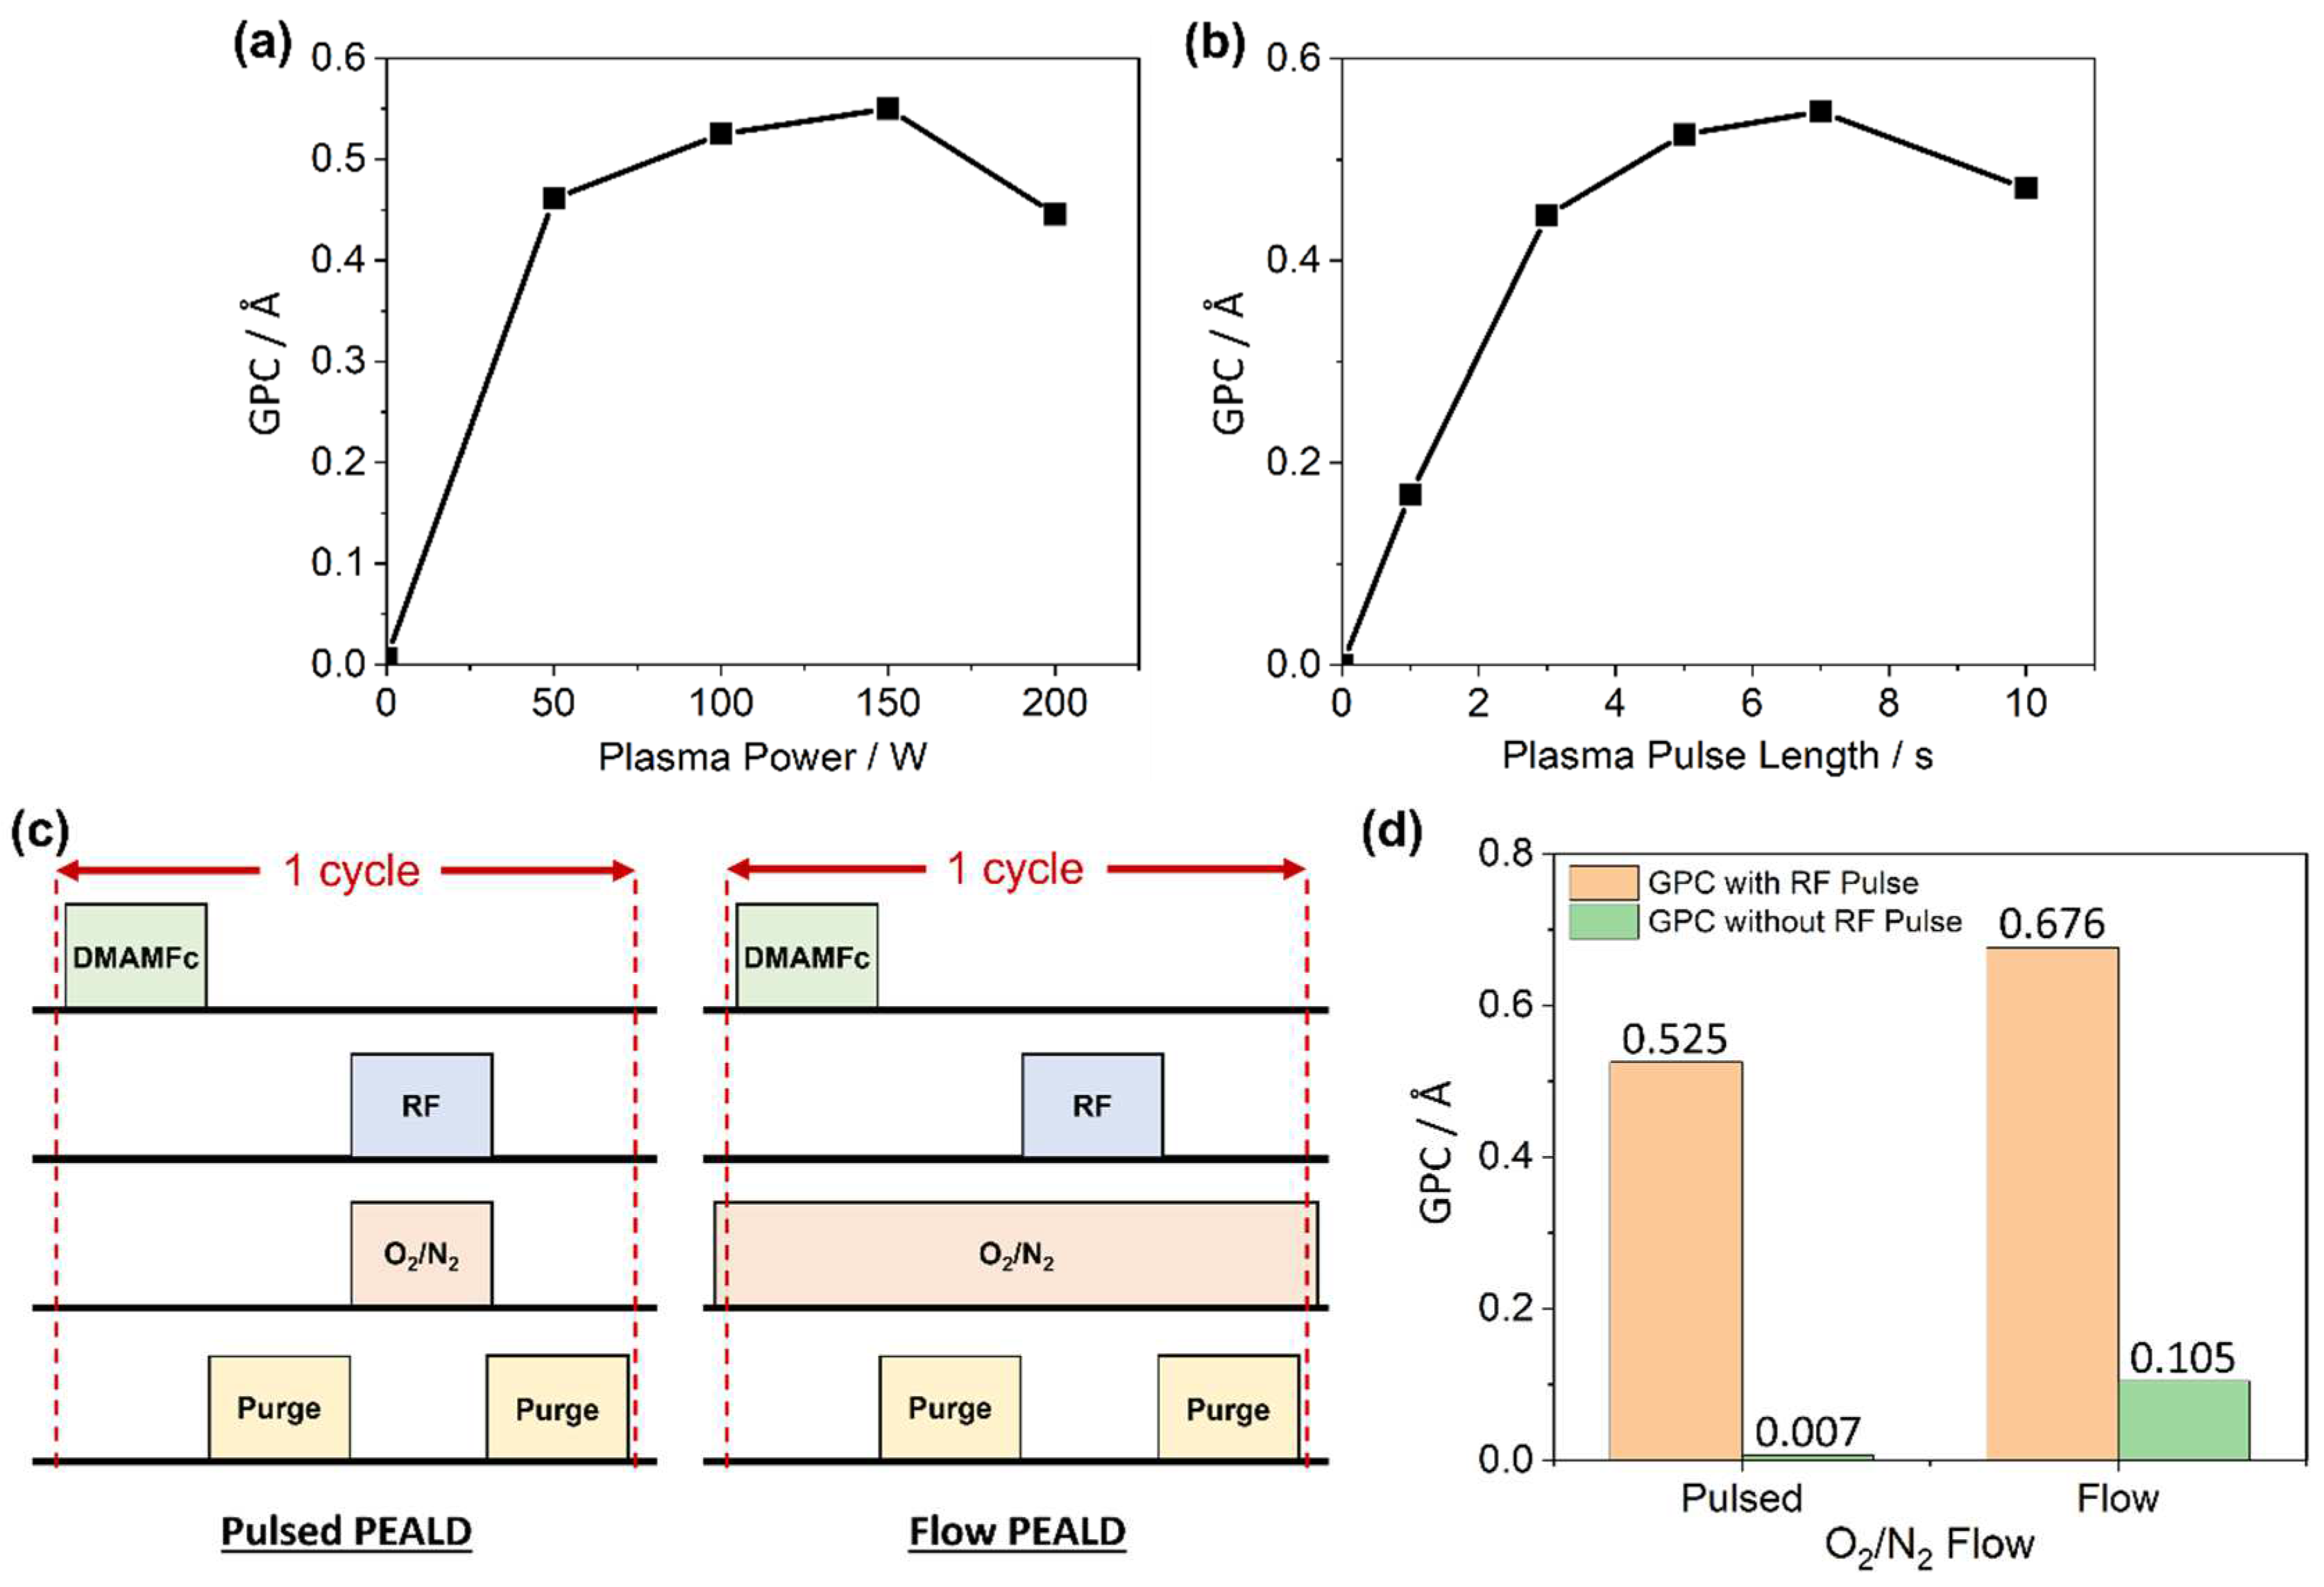
Oxygen plasma was produced using an RF generator, with power ranging from 0 W (resulting in only an O2 gas pulse) to 200 W (Figure 4a). For 0 W, no O2 plasma will be produced, and the negligible GPC (0.0065 Å) revealed that O2 does not act as an oxidant to functionalise the surface during co-reactant half-cycles, confirming that all deposits within this study have been solely PEALD, and not a combination of PEALD and thermal ALD. The GPC shows a positive correlation with plasma power from 50 to 150 W, as increased power generated more O2 plasma and therefore more of the surface can be functionalised. However, instead of plateauing as plasma power increased further (tending towards complete surface functionalisation), the GPC decreased significantly at 200 W. It is likely that the growing Fe2O3 layers were sensitive to excessive O2 plasma exposure, resulting in damage or removal of the surface upon the plasma pulse half cycle. In support of this, a similar trend was identified for the plasma pulse duration parameter (Figure 4b). A GPC of zero with no plasma pulse confirmed that no CVD occurred, followed by a positive correlation of increasing GPC with plasma pulse duration up to a 7 s pulse period, after which a detrimental effect was, again, observed. This is not a new observation, with similar having been reported previously for a range of different materials [53,54].
All deposition processes used thus far have been in a pulsed plasma gas regime, meaning that the plasma gas in the co-reactant half-cycle is pulsed into the chamber simultaneously with the RF power on/off (Figure 4c). Alternatively, the plasma gas can be flowed continuously into the chamber throughout the entire ALD cycle window, and only the RF generator will be pulsed in the co-reactant half-cycle (i.e., O2 gas flow is constant, but O2 plasma is only generated during this second half-cycle). When the Fe2O3 GPC from each process is compared, it appears that the flow regime is more effective (Figure 4d).
However, when the same regimes were trialled without the RF pulse (i.e., expecting zero deposition as no O2 plasma was generated), the flow regime still had a significant GPC value (0.105 Å cycle−1). This indicates that CVD processes were occurring, likely due to the reaction between O2 and the DMAMFc precursor at the elevated temperature during precursor pulsing. The flow regime was therefore deemed unsuitable for this process.
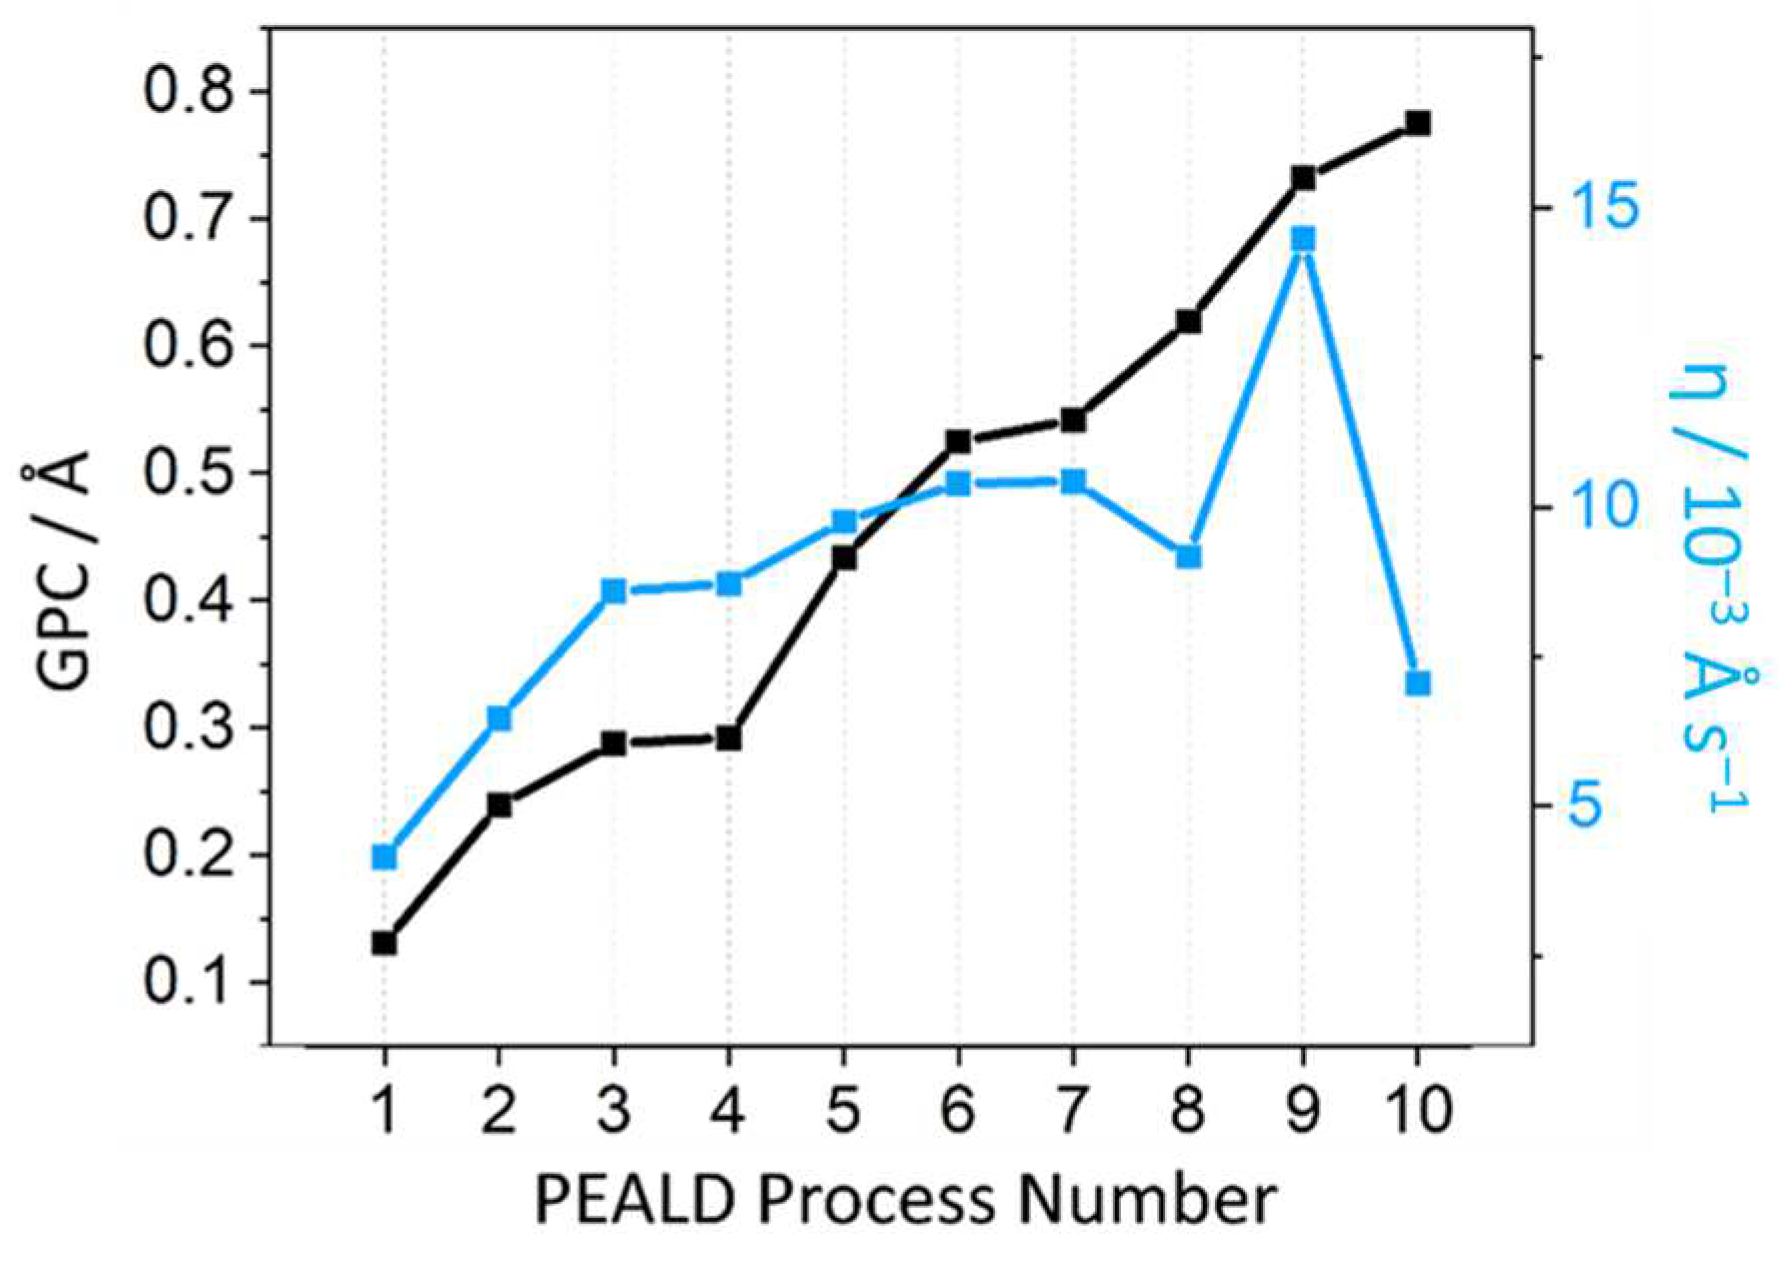
The GPC of a series of ALD processes with varying pulse sequences, pot temperatures, and chamber temperatures were recorded (Table 1, Figure 5). For practical application, a high GPC is not useful if each cycle is excessive in duration. A new efficiency parameter (η) was therefore introduced to account for this, calculated by dividing the GPC by the duration of each full ALD cycle, as in Equation (1):
η = G P C   ( Å ) / t c y c l e   ( s )
where η is the deposition efficiency and tcycle is the duration of one full ALD cycle. Processes 1–4 were all single-pulse sequences, and all possessed lower efficiencies than all 3× (and even 5×) multi-pulse sequences, once again confirming the effectiveness of employing multiple boost/pulse sequences within the same half-cycle, despite the time it adds to the cycle. While 5× and 10× boost/pulse sequences yield the highest GPC values (processes 8 and 10, respectively), the increase is not enough to mitigate the resulting extended cycle durations, evidenced by the lower η values. A half-cycle of 3× boost/pulse sequences is therefore considered the optimal parameter out of this dataset. Process 9 is clearly optimal for deposition, showcasing the greatest GPC and efficiency; however, as previously discussed, a precursor pot temperature of 120 °C is known to decrease the photoactivity of the resulting Fe2O3 film [52]. Consequently, processes 6 and 7 emerge as the optimal conditions. Process 7 consumed more precursor while only exhibiting a marginal increase in GPC and η, thus process 6 was concluded to be the most optimal among parameters tested.
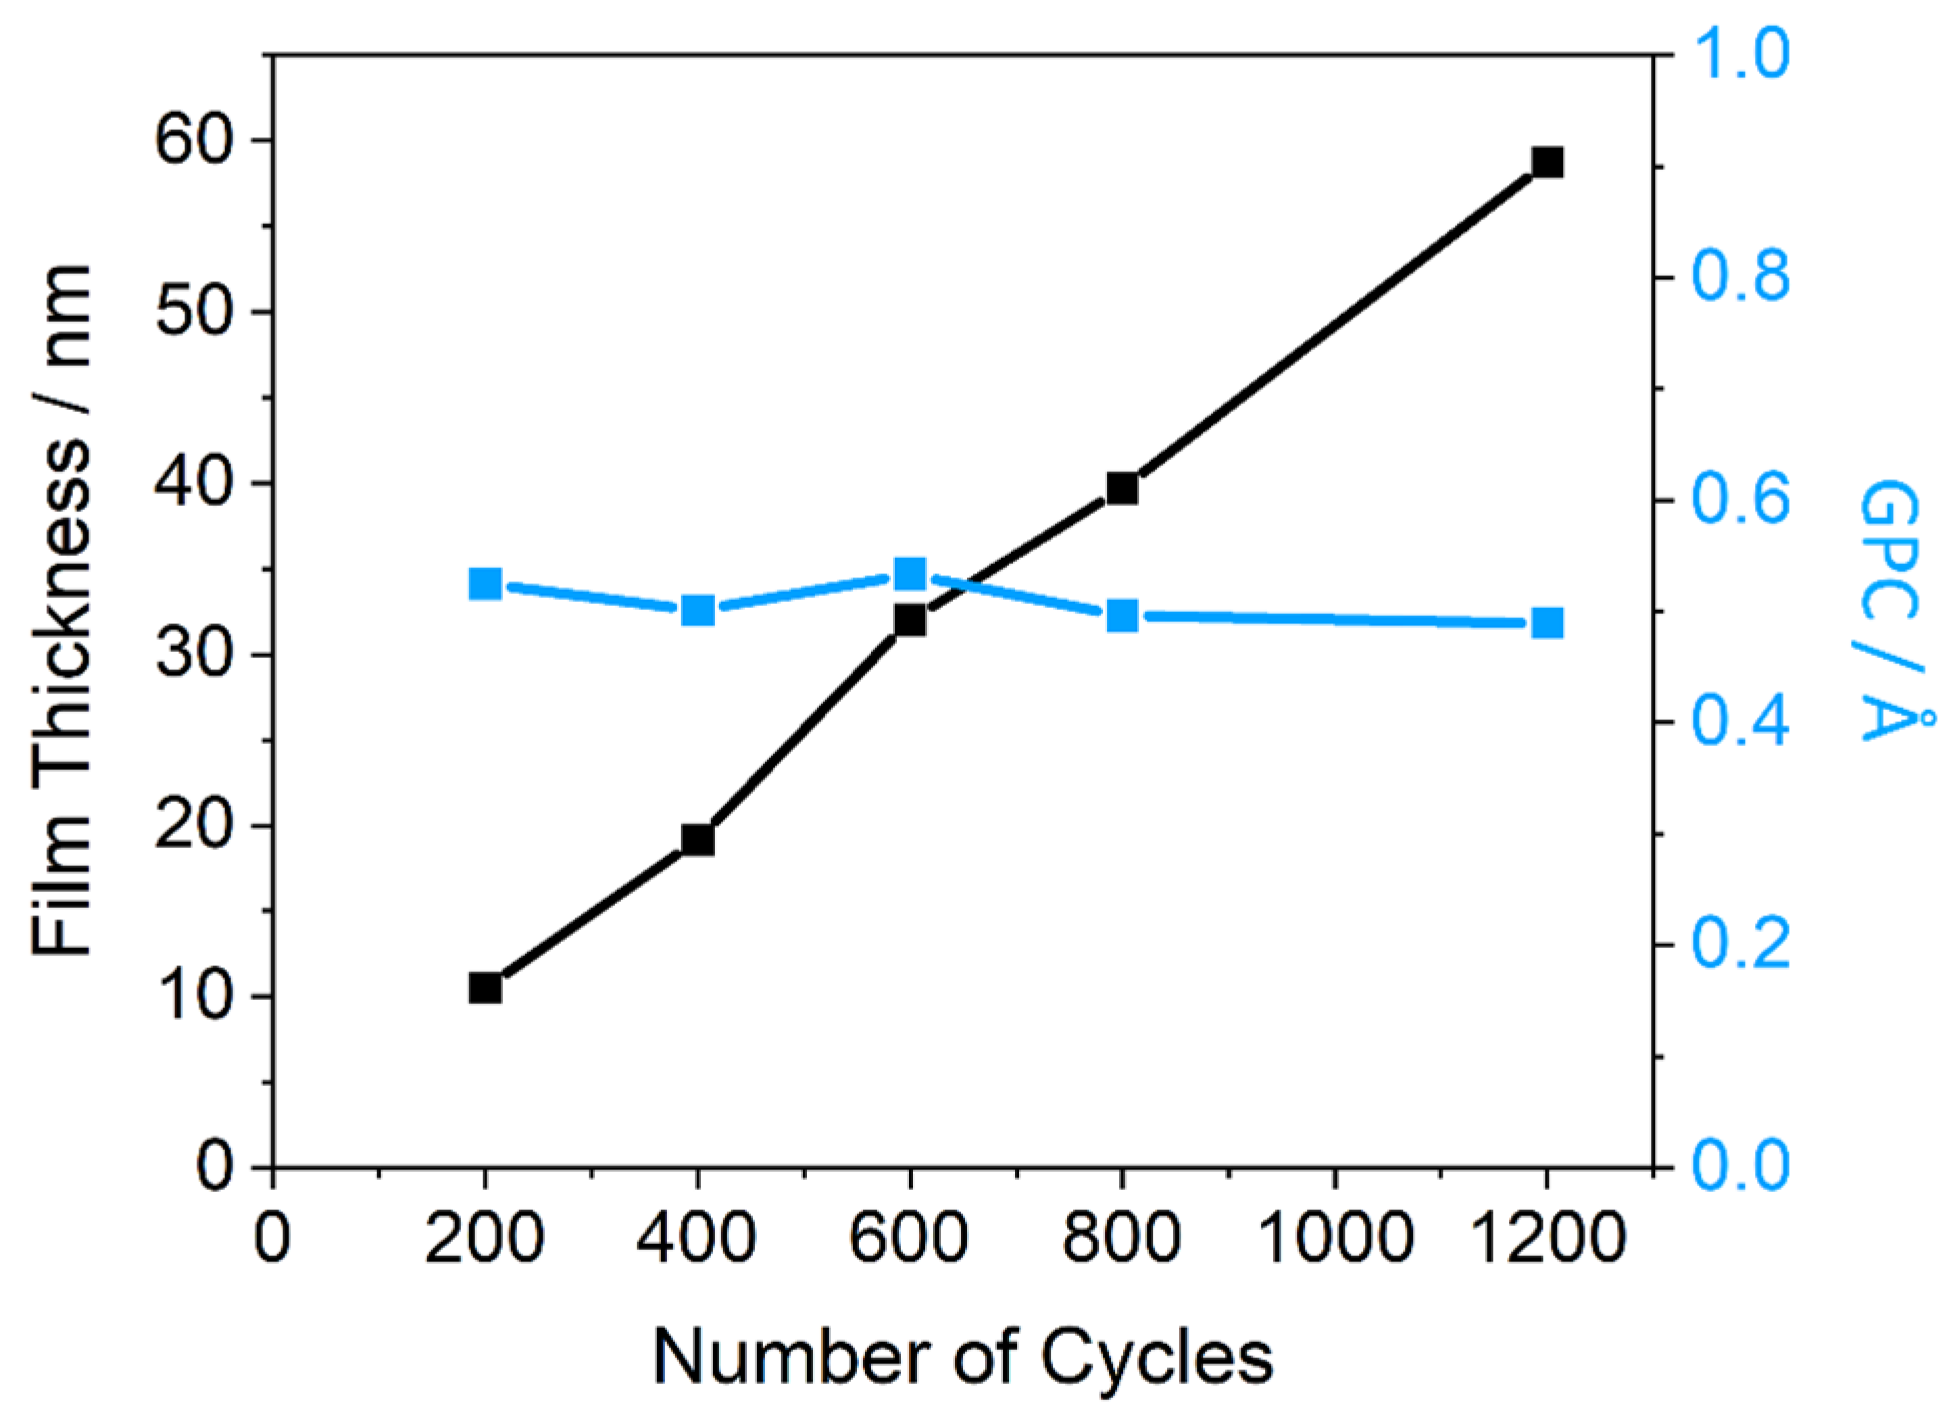
The linearity of growth rate seen in both total film thickness and GPC trends (Figure 6), using the optimised parameters from process 6, reveal the high degree of control this process has for the deposition of Fe2O3. An approximately decreasing GPC with increasing cycles suggests it may become more difficult to grow the film as thickness increases, however, the drop is negligible for the number of cycles being investigated. These trends are indicative of a pure ALD process, without any CVD contribution. The process is therefore an effective method for depositing ultrathin (<100 nm) Fe2O3 films, and can now be applied to PEC systems to study its photoactivity and performance, both alone and in a simple heterojunction.

2.2. Thin Film Physical Characterisation

All initial deposition processes were initially performed using silica wafers as a thin film substrate. However, for PEC application, deposition onto a transparent conducting oxide (TCO) substrate was required. FTO-coated (TEC-15) glass slides were therefore used as the substrate. Selected samples were annealed at 500 °C for 4 h after deposition, which resulted in a change of colour from dark brown to orange/red (Figure 7), indicating formation of crystalline α-Fe2O3 only after annealing. An annealing temperature of 500 °C was used in other studies and was chosen here as it is below the glass transition temperature of TEC-15 (564 °C) [55].
Grazing incidence XRD (GIXRD) was employed on an annealed Fe2O3 thin film (500 °C for 4 h) and a pristine FTO-coated glass substrate control with an incidence angle (ω) of 5°. Spectra were obtained within the 20–90° (Figure 8a) and the 30–40° (Figure 8b) 2θ ranges—the latter also performed on an as-deposited (unannealed) Fe2O3 thin film. In the resulting spectra, a clear and unambiguous peak at 35.6° (matching the position of the expected (110) α-Fe2O3 peak) was present for the annealed Fe2O3 thin film, but was absent for both the FTO and, interestingly, unannealed Fe2O3. As-deposited Fe2O3 must therefore be amorphous, only becoming crystalline after annealing at 500 °C. Amorphous materials can possess improved conductivity in bulk, compared to their crystalline counterparts, and would be particularly effective as an outermost layer (which is complementary to the use of ALD as the conformal coating tool) in an electrode due to the higher surface energy of amorphous materials, therefore increasing the electrocatalytic activities. However, the study of the amorphous thin film is beyond the scope of this preliminary work, and therefore all samples herein have been annealed at 500 °C for 4 h and will therefore be denoted as α-Fe2O3.
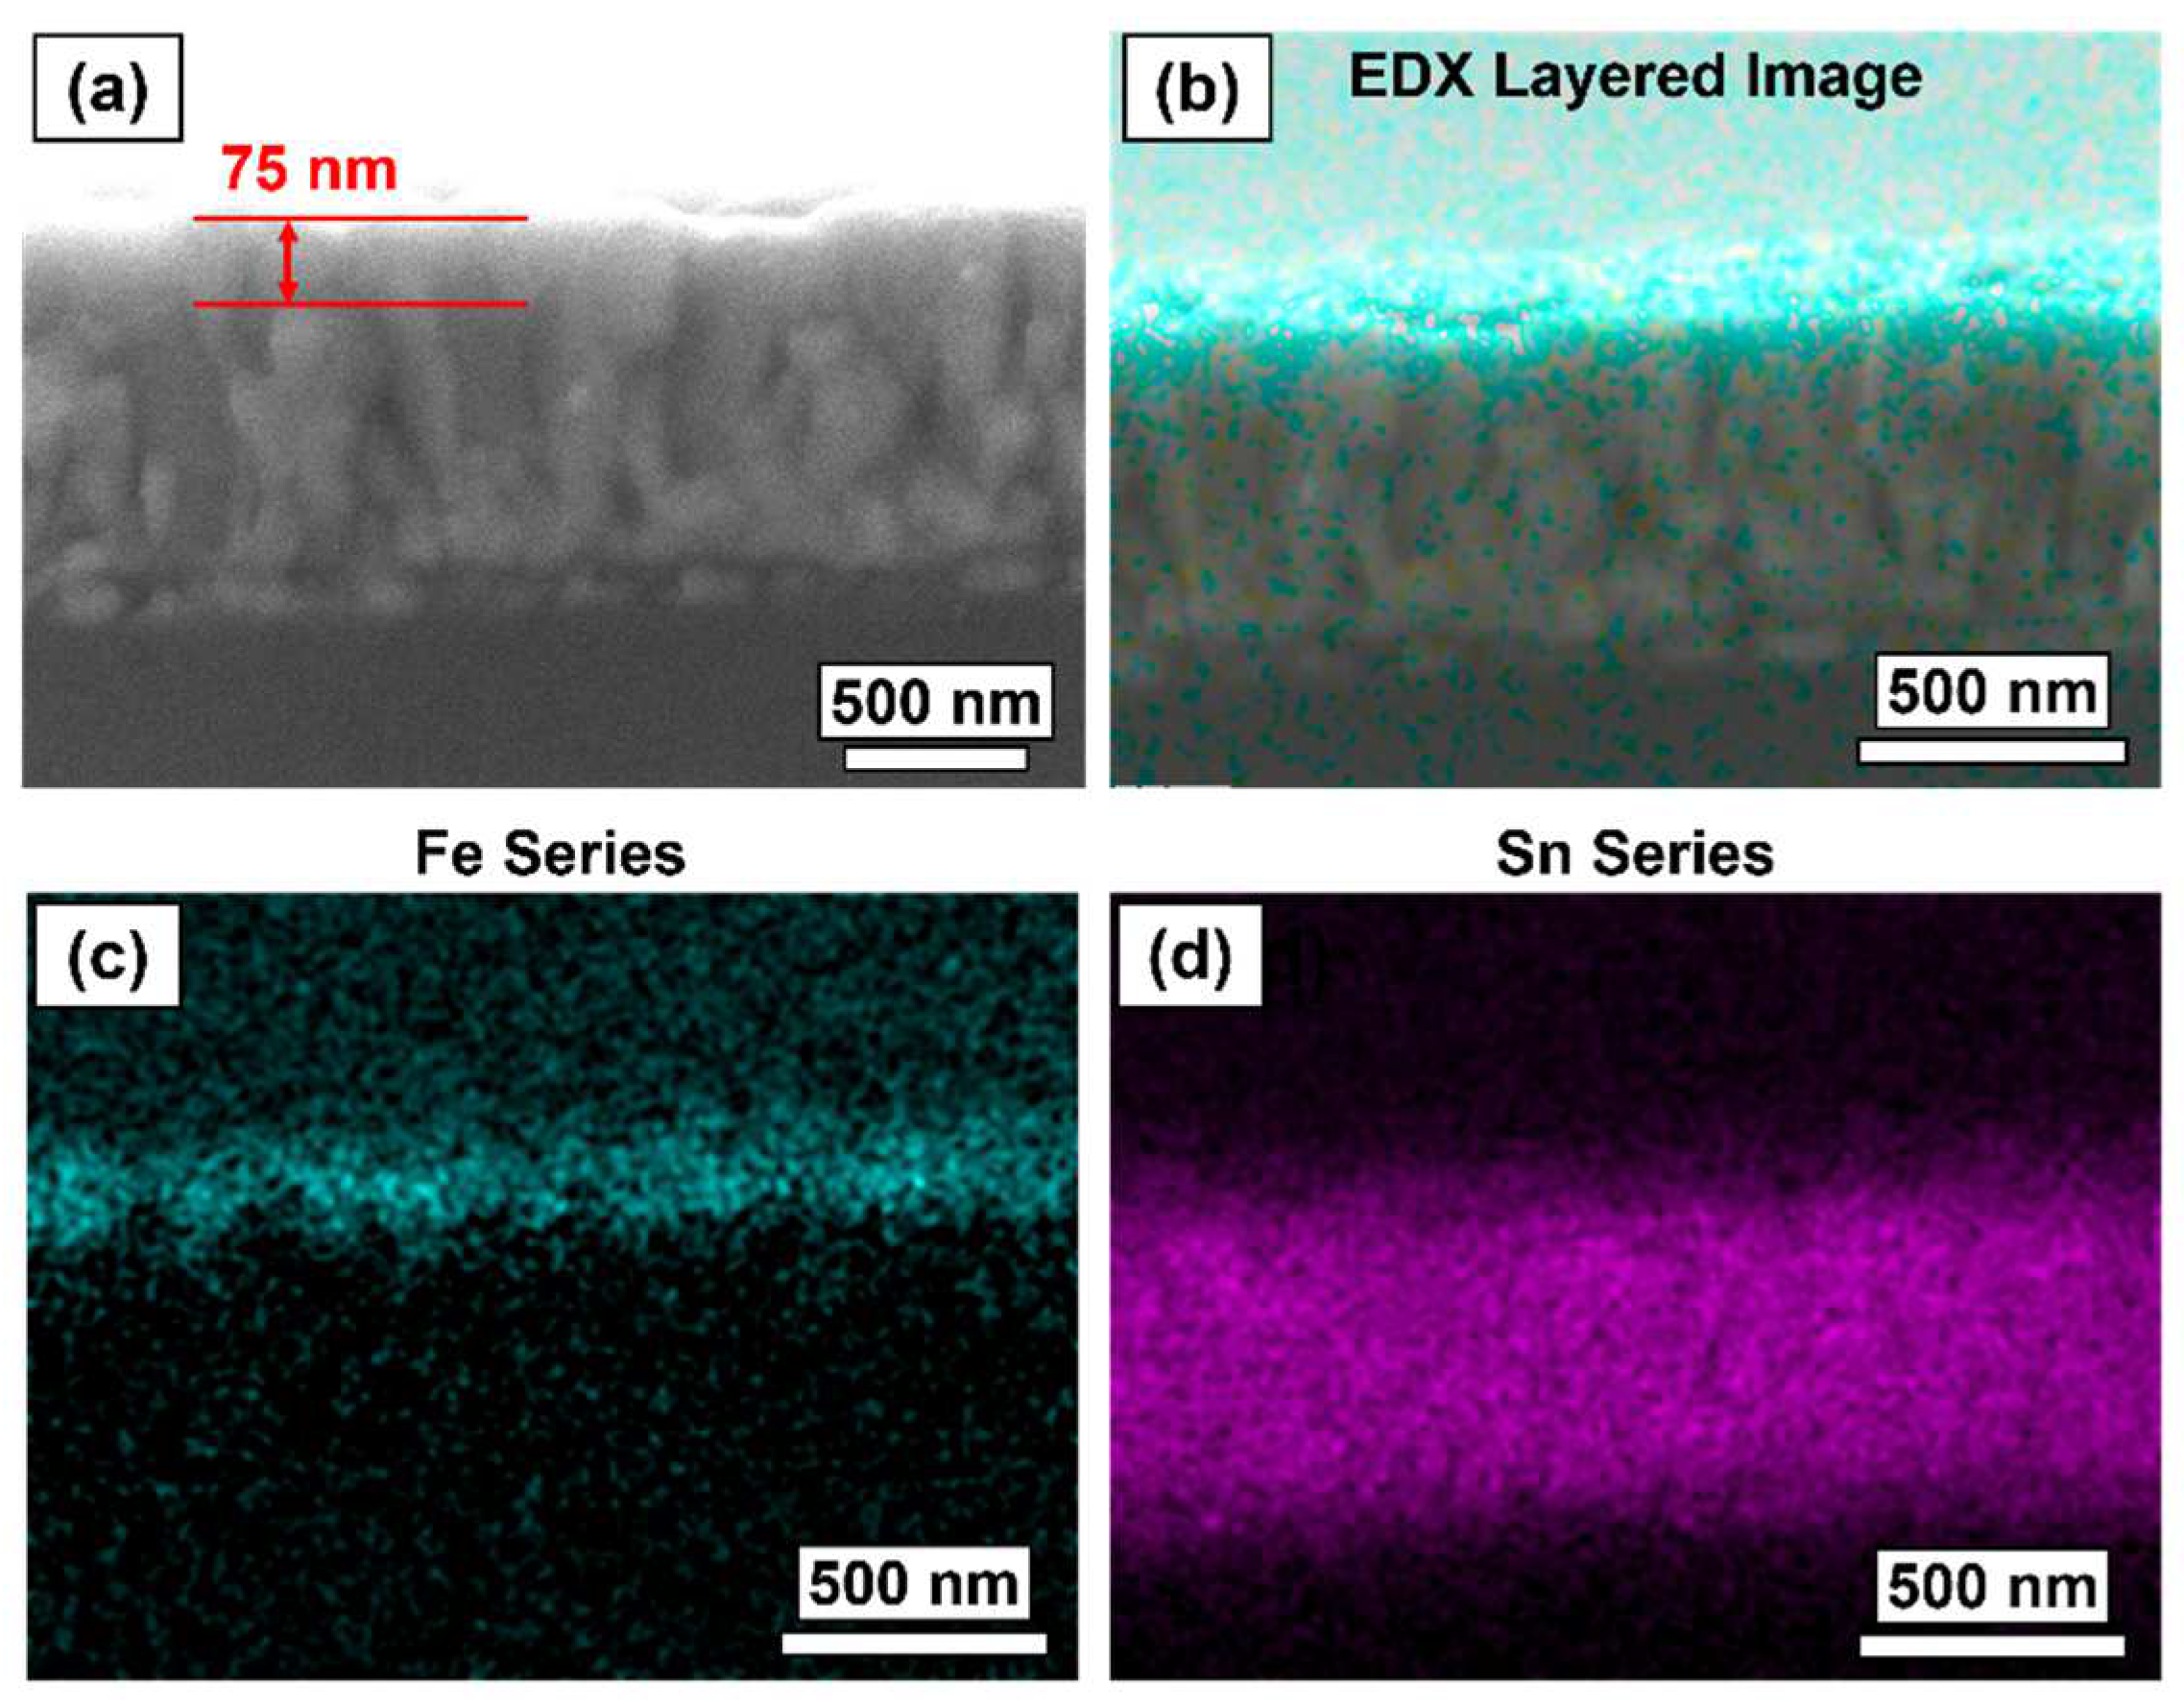
SEM cross-sectional images coupled with EDX were used to identify a 60 nm α-Fe2O3 layer on a pristine FTO-coated glass substrate (Figure 9). It is difficult to confirm the thickness of the α-Fe2O3 due to the poor resolution at such high magnifications, and the lack of distinction between the conformal α-Fe2O3 coating and the FTO layer, however, it was approximated to be 75 nm. It could therefore be concluded that the α-Fe2O3 growth is more favored on FTO than silica (i.e., there is more surface coverage as the surface is closer to saturation in each individual precursor pulse half-cycle). EDX data defined a clear, flat, and uniform Fe layer on top of the Sn (FTO) layer.
To demonstrate the conformal deposition and layering potential of the PEALD process, a 30 nm- and 60 nm-α-Fe2O3 thin film was deposited onto a previously studied [5,56,57] photoanode consisting of TiO2 nanorods grown onto FTO substrate (herein denoted as TiO2/Fe2O3-30 nm and TiO2/Fe2O3-60 nm, respectively). Similar TiO2 nanorods have previously shown enhanced PEC performance after α-Fe2O3 ALD coating [52].
Top-down SEM images of the TiO2 (Figure 10a) and TiO2/Fe2O3-60 nm (Figure 10b) show a seemingly successful conformal coating onto the nanorod morphologies. The roughness of the tips of the TiO2 nanorods vanishes after the α-Fe2O3 coating, resulting in a far smoother morphology. The diameter of the nanorods does not appear to change significantly after coating (~70–100 nm), suggesting that the growth rate measured on the silica substrate may be greater compared to a TiO2 surface, although the nature of smoothing rough edges and measuring on nanorods makes it difficult to accurately measure and/or confirm this. For clarity, both heterojunction samples will continue to be referred to as TiO2/Fe2O3-30 nm and TiO2/Fe2O3-60 nm herein.
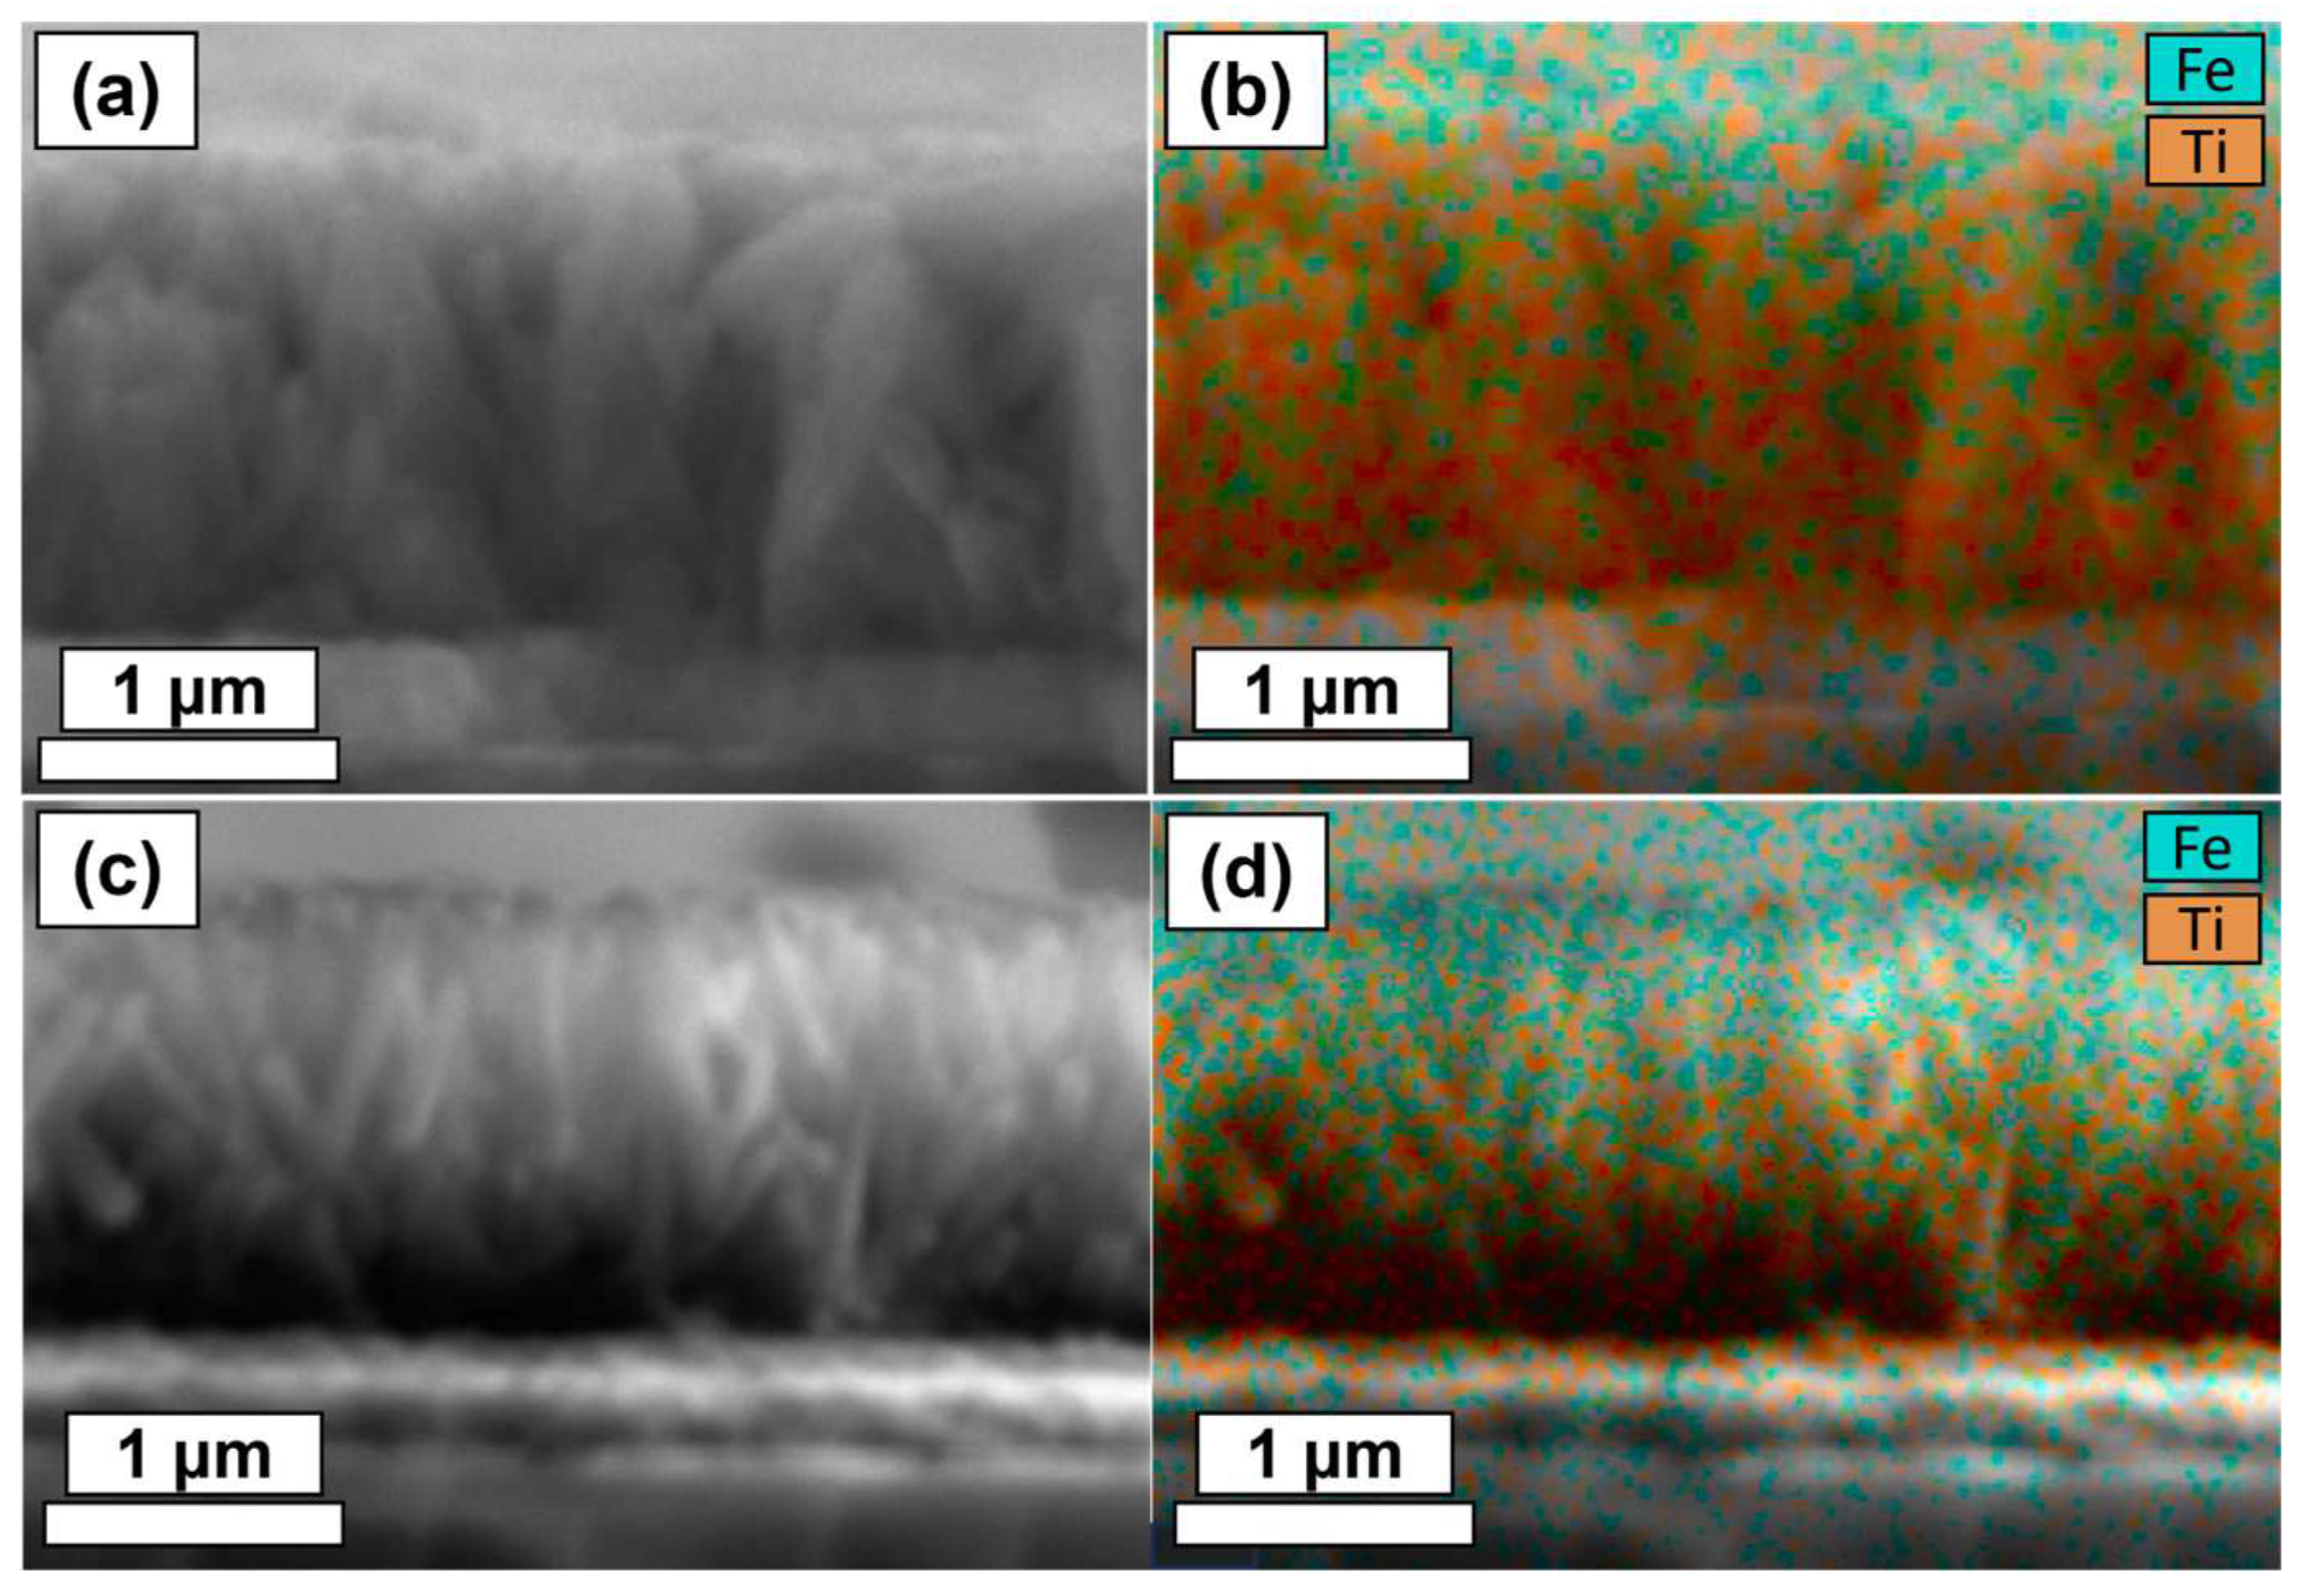
The highly directional nature of plasma often results in a significant decrease in the conformality of a PEALD coating compared to thermal ALD [9]. Given the high aspect-ratio of the TiO2 nanorod structure, it was necessary to study the depth of the Fe2O3 coating on the nanorods via EDX of thin film cross-sections (Figure 11). Qualitative analysis of Figure 11a,c reveals a clear decrease in the abundance of Fe further down the length of the nanorod structures. Interestingly, the thicker Fe2O3 coating (TiO2/Fe2O3-60 nm, Figure 11c) shows greater relative Fe abundance near the lower region of the nanostructures, revealing that Fe2O3 must be deposited across the entire structure, but without complete coverage further down the rod length. This suggests that longer precursor pulse half cycles could provide greater conformality by ensuring complete monolayer coverage of the lower nanorod regions. However, as discussed previously, it is impractical to increase the deposition durations further.
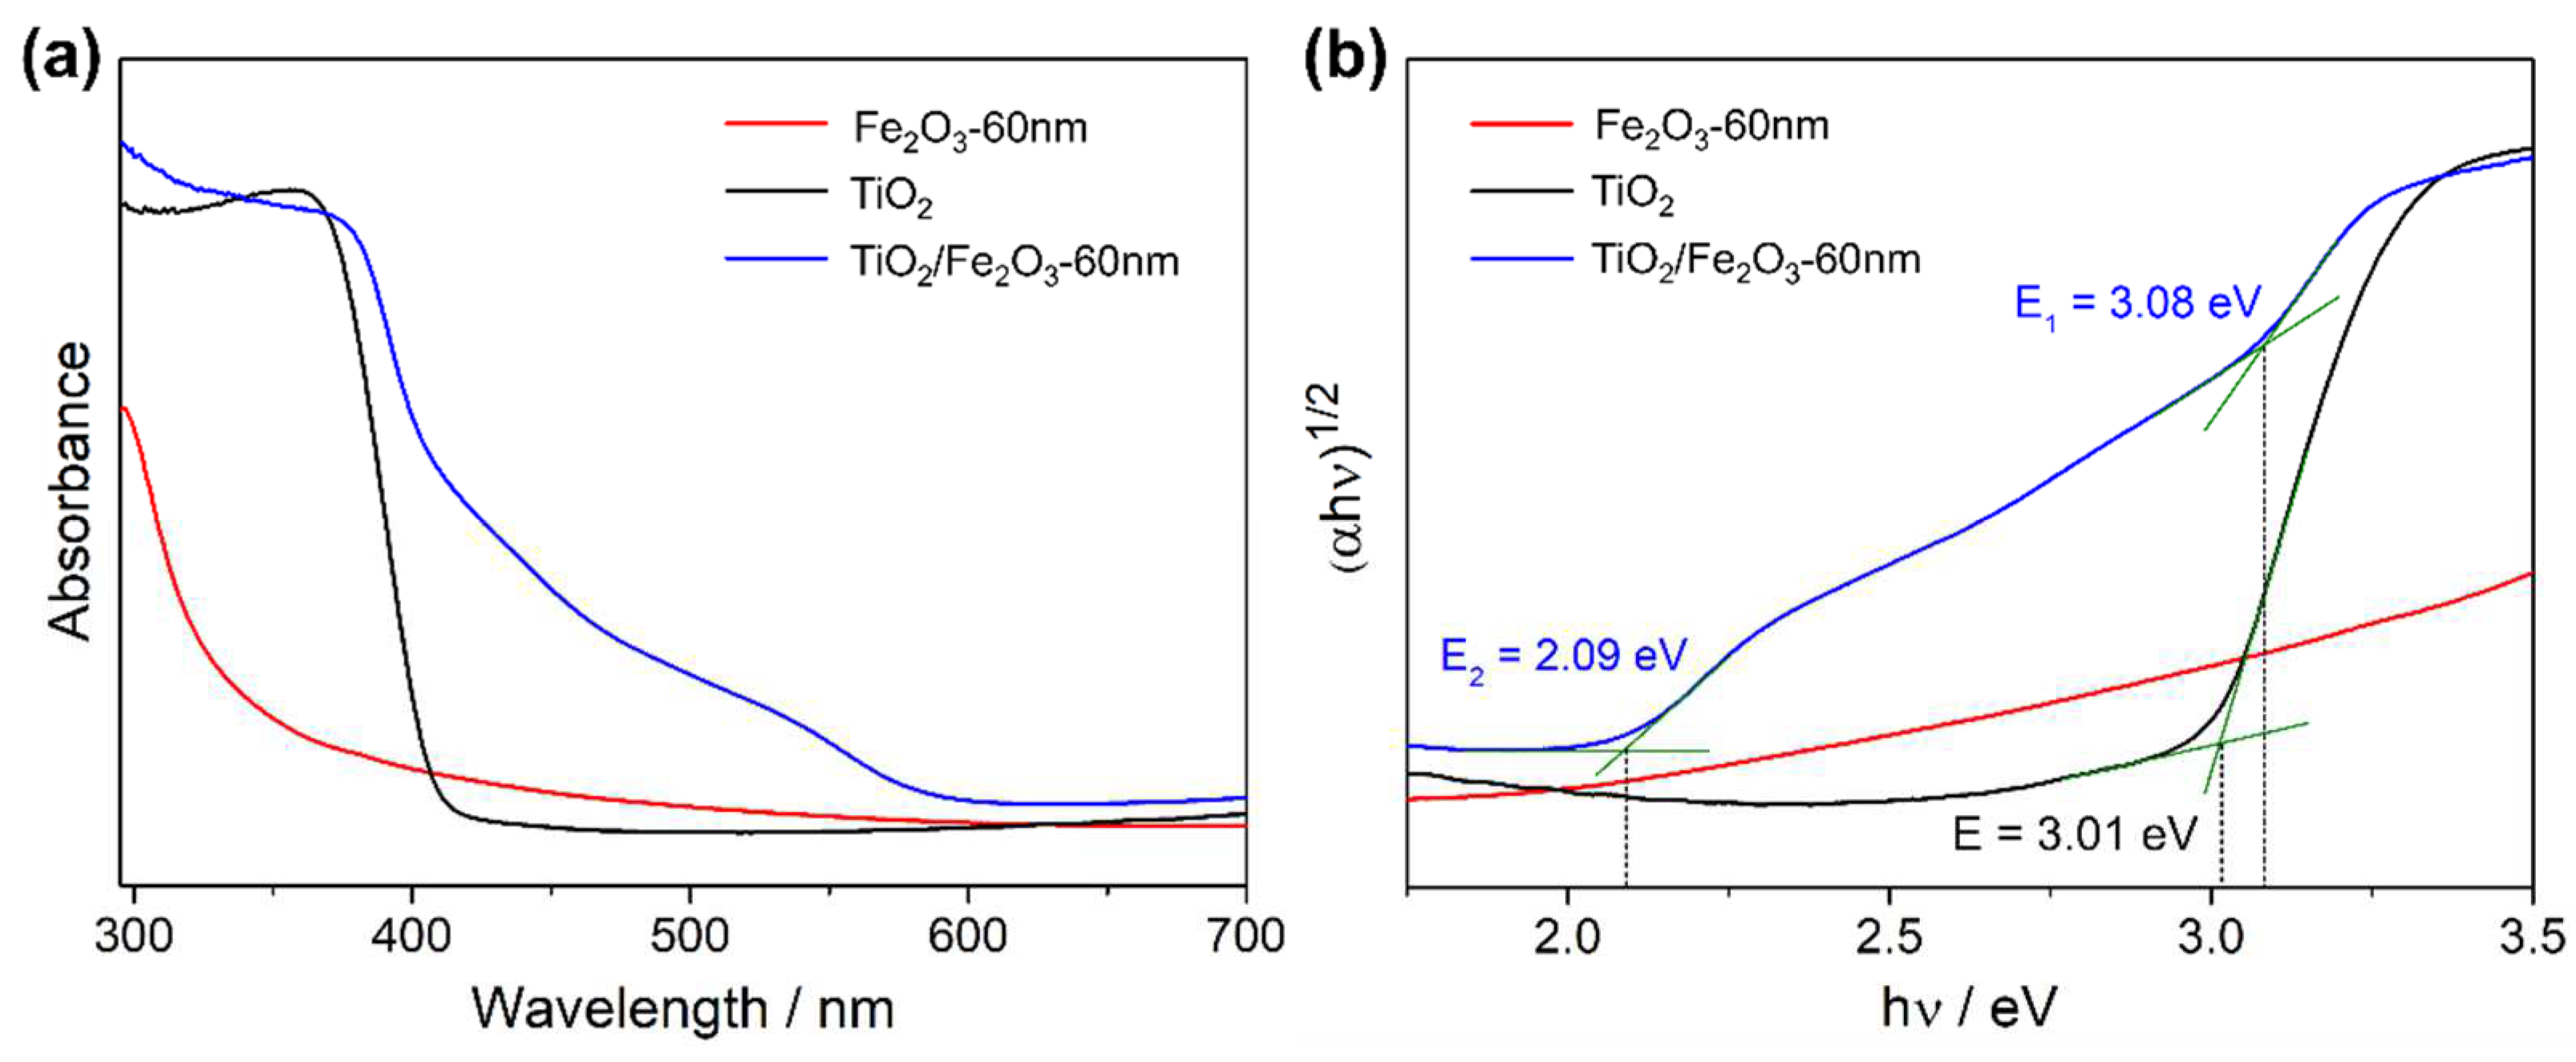
UV/Vis spectroscopy revealed a sharp absorption onset at 415 nm for the as-deposited TiO2 film (Figure 12a), corresponding to a 3.01 eV bandgap evaluated using the corresponding Tauc plot (Figure 12b), and the values matched those of the expected rutile polymorph. Interestingly, α-Fe2O3 showed no characteristic absorbance onset, however absorbance does appear to flatten at >600 nm, which matches the expected bandgap. It is likely that the film was too thin for clear absorption onset peaks, particularly when considering the low absorption coefficient of α-Fe2O3 (requiring a 375 nm thickness to absorb 95% of 550 nm incident light) [50]. The absorption spectra from the TiO2/Fe2O3 heterojunction contained two distinct absorption peaks at 595 nm and 405 nm, representing bandgaps of 3.08 and 2.09 eV, respectively. The 2.09 eV peak is within the expected range for α-Fe2O3 (1.9–2.2 eV) [58], and the 3.08 eV peak is between values for anatase (3.2 eV) and rutile (3.0 eV) TiO2. The presence of two TiO2 phases is unexpected, as it is known from a previous study [56] that the TiO2 nanorods are purely rutile when deposited onto FTO.
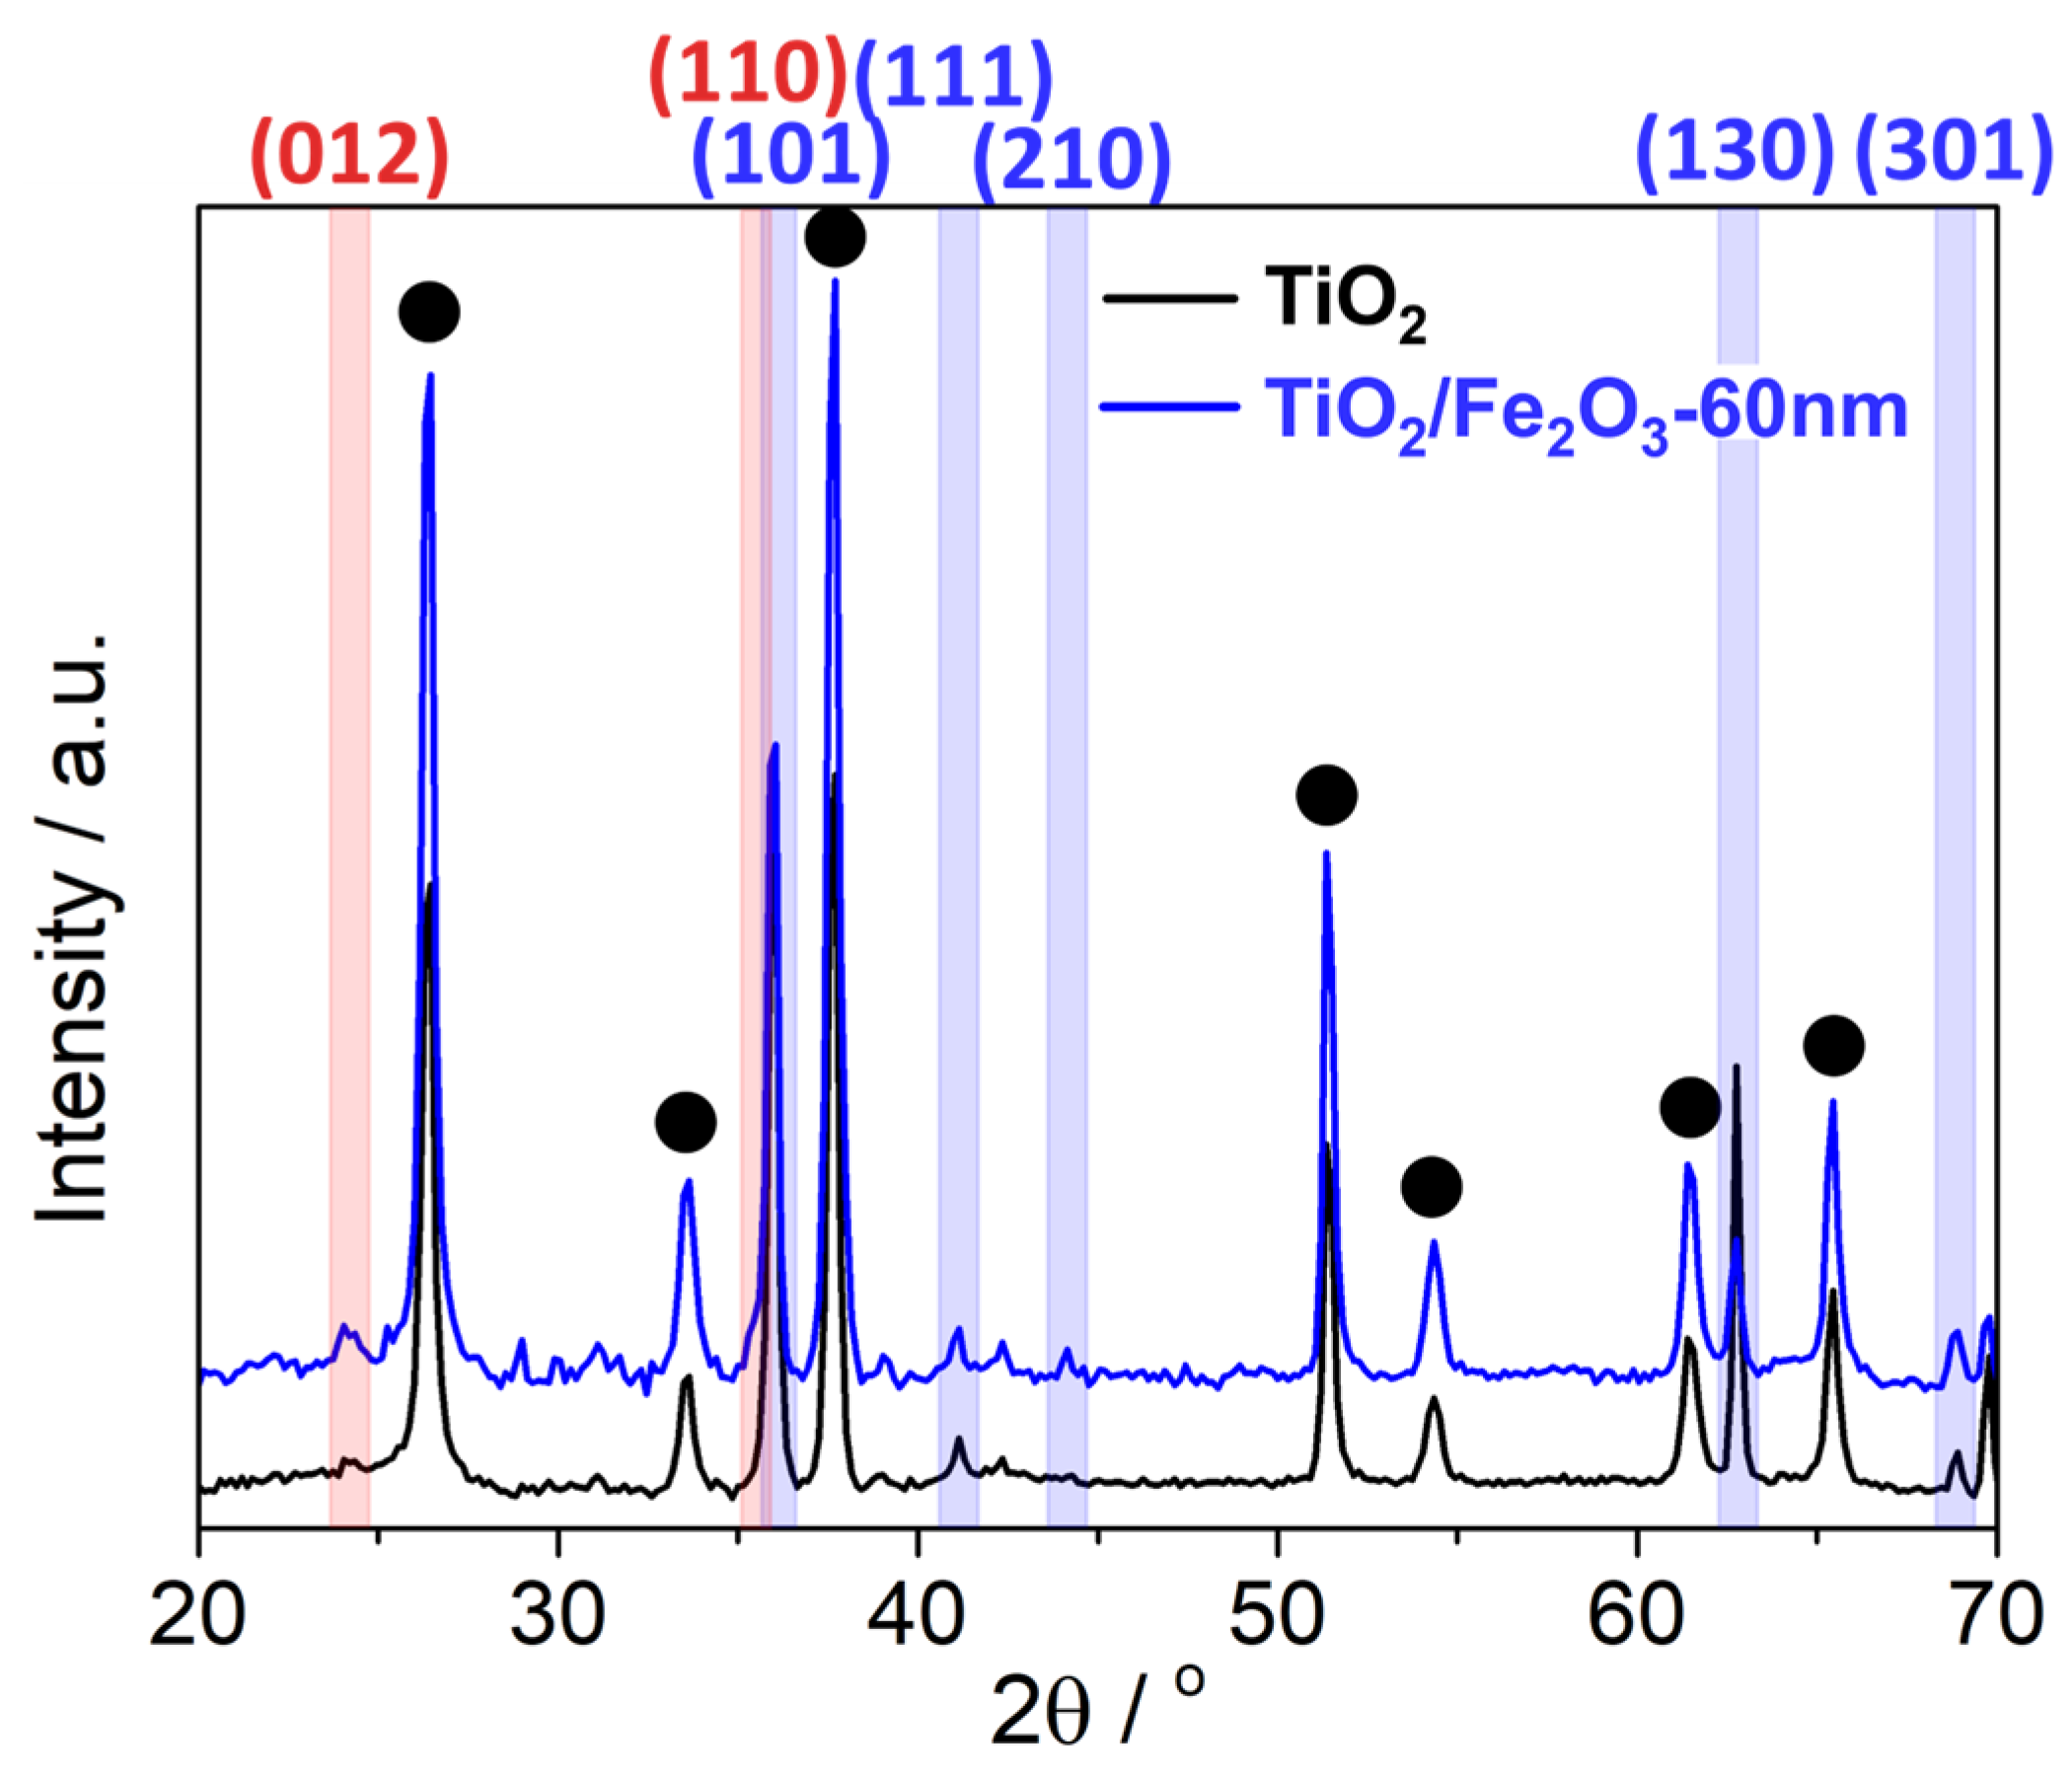
Standard reflection-XRD of TiO2 and TiO2/Fe2O3-60 nm was performed to further study the TiO2 phases present, and the possibility of rutile conversion to anatase during the ALD process. XRD patterns (Figure 13) contained only rutile peaks for TiO2 environments, which contrasts the bandgap measured via Tauc analysis (rutile bandgap expected: ~3.00 eV, measured: 3.08 eV). It is therefore likely that the slight widening is a result of either: (i) long-term (24 h) exposure to the vacuum environment at 240 °C with regular oxygen plasma pulses has caused a widening of the bandgap [56], or (ii) the uncertainty associated with the Tauc analysis is ≥0.08 eV. Potential a-Fe2O3 peaks are visible in the TiO2/Fe2O3 pattern (red highlight), however, the similar sizes relative to the background noise, and the overlap of 2θ positions with rutile and FTO peaks, limit the certainty of identification.

2.3. Thin Film Photoelectrochemical Characterisation

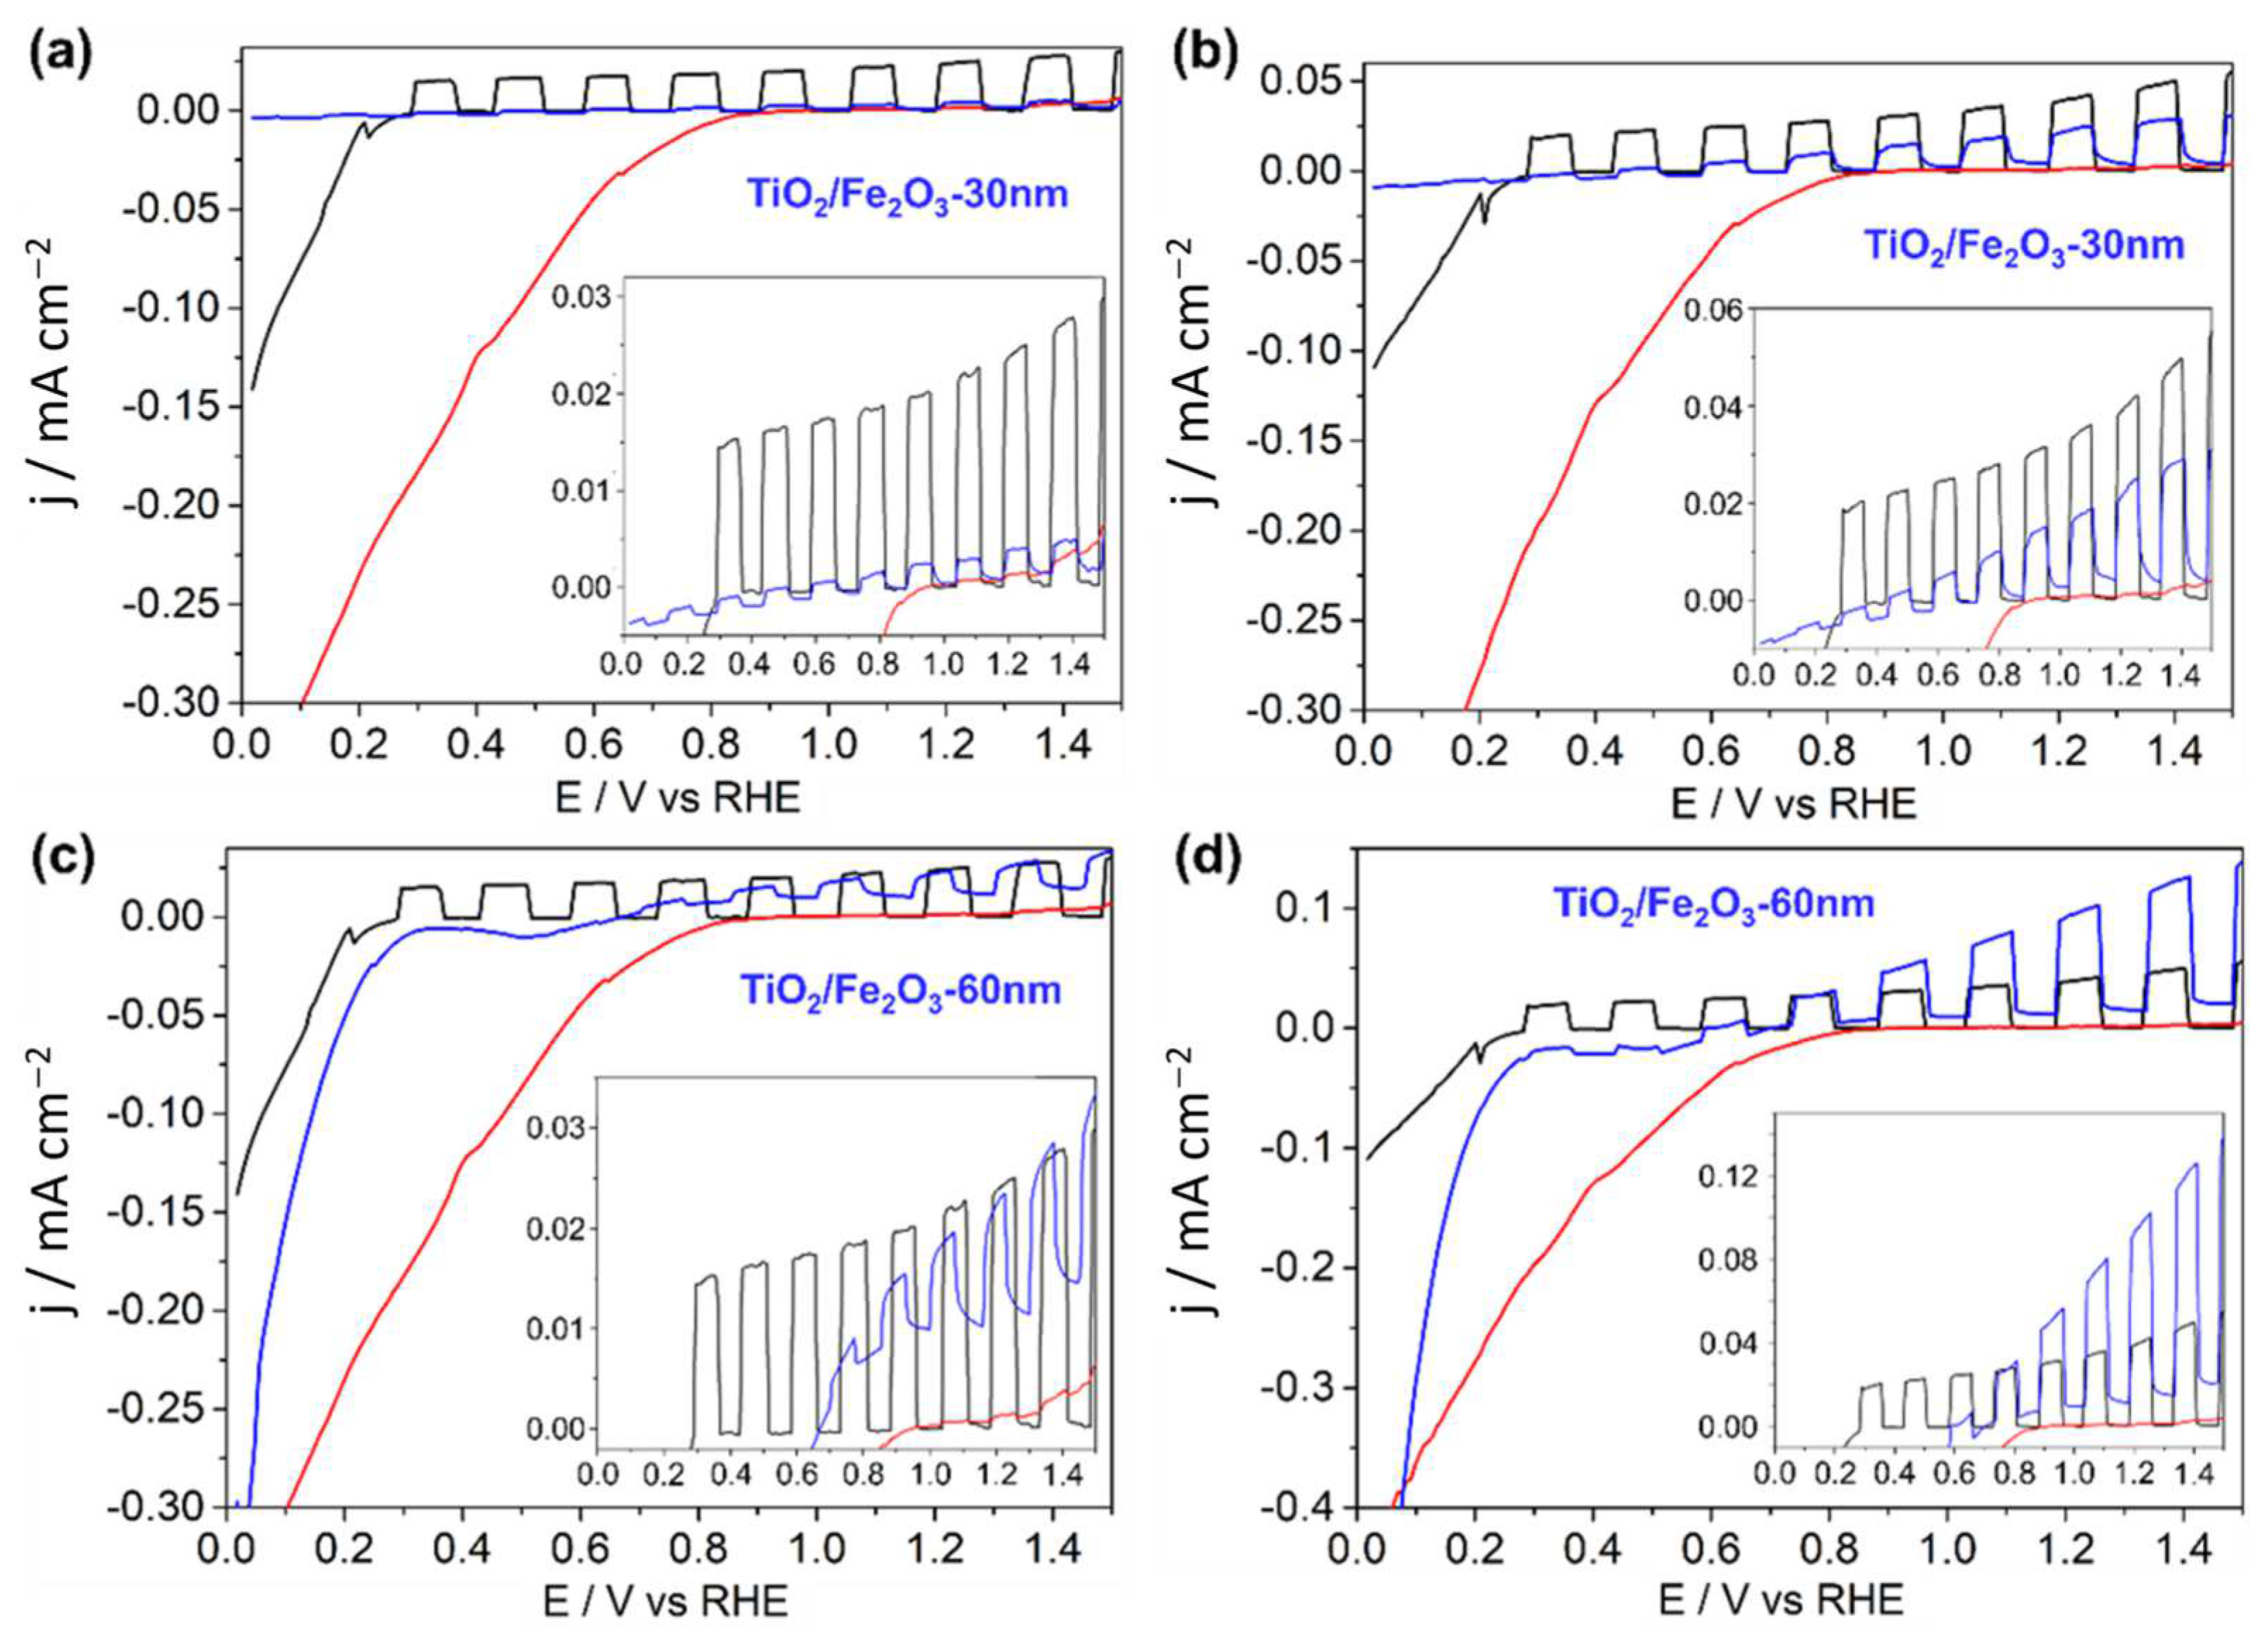
PEC analysis on a pristine TiO2 nanorod thin film, 30 nm α-Fe2O3, and the TiO2/Fe2O3 heterojunction with 30 nm (Figure 14a,b) and 60 nm (Figure 14c,d) α-Fe2O3 thicknesses was performed under both front and rear illumination. A summary of the photocurrent densities for each photoanode at 1.23 V vs. RHE is provided in Table 2. Like many metal oxide electrodes, the pristine TiO2 nanorod electrode showed greater performance under rear illumination than front—an indication that charge carrier transport within the material may be relatively slow with respect to the timescale for recombination.
Photocurrents for α-Fe2O3 were negligible from both front and rear illumination, likely due to the ultrathin layer resulting in no appreciable photon absorption, particularly relevant for α-Fe2O3 which possesses a relatively small absorption coefficient [50]. As expected, given this and the possible detrimental band alignment, the TiO2/Fe2O3-30 nm thin film showed poorer photocurrents than pristine TiO2, most noticeably for front-side (α-Fe2O3 first) illumination. In fact, the relative difference between front- and rear-side performance for TiO2/Fe2O3-30 nm (2.8 vs. 20 µA cm−2) was far greater than for TiO2 (24 vs. 40 µA cm−2) (Figure 14a,b). Interestingly, the TiO2/Fe2O3-60 nm heterojunction had a front-side performance worse than TiO2 (13 vs. 24 µA cm−2), albeit still significantly higher than that for TiO2/Fe2O3-30 nm, while the rear-side photocurrent density was over double (85 vs. 40 µA cm−2) (Figure 14c,d). The addition of the α-Fe2O3 layer is therefore detrimental under front illumination for both thicknesses but can improve performance when illuminated from the rear for thicker (60 nm) coatings.
A cathodic baseline current is observed within all photocurrent density scans (Figure 14), with varying onsets for each sample, indicating that a reduction reaction becomes thermodynamically favourable at potentials more negative than the onset potential. The baseline shift is reproduceable with repeat experiments, and there is no oxidation reaction seen at high anodic potentials, hence it cannot be attributed to experimental error such as electrolyte contact with the silver paint or copper tape used to connect the electrode to the potentiostat. It is therefore concluded that the reduction reaction must be either self-reduction, which will impact the stability of the thin film(s), or reduction of a species within the solution, for example, oxygen. The onset potential (vs. RHE) of the cathodic baseline for all samples is in the order: TiO2 (0.29 V) < TiO2/Fe2O3 (0.69 V) < Fe2O3-30 nm (0.9V), and the thickness of the Fe2O3 layer in the heterojunction does not impact the onset.
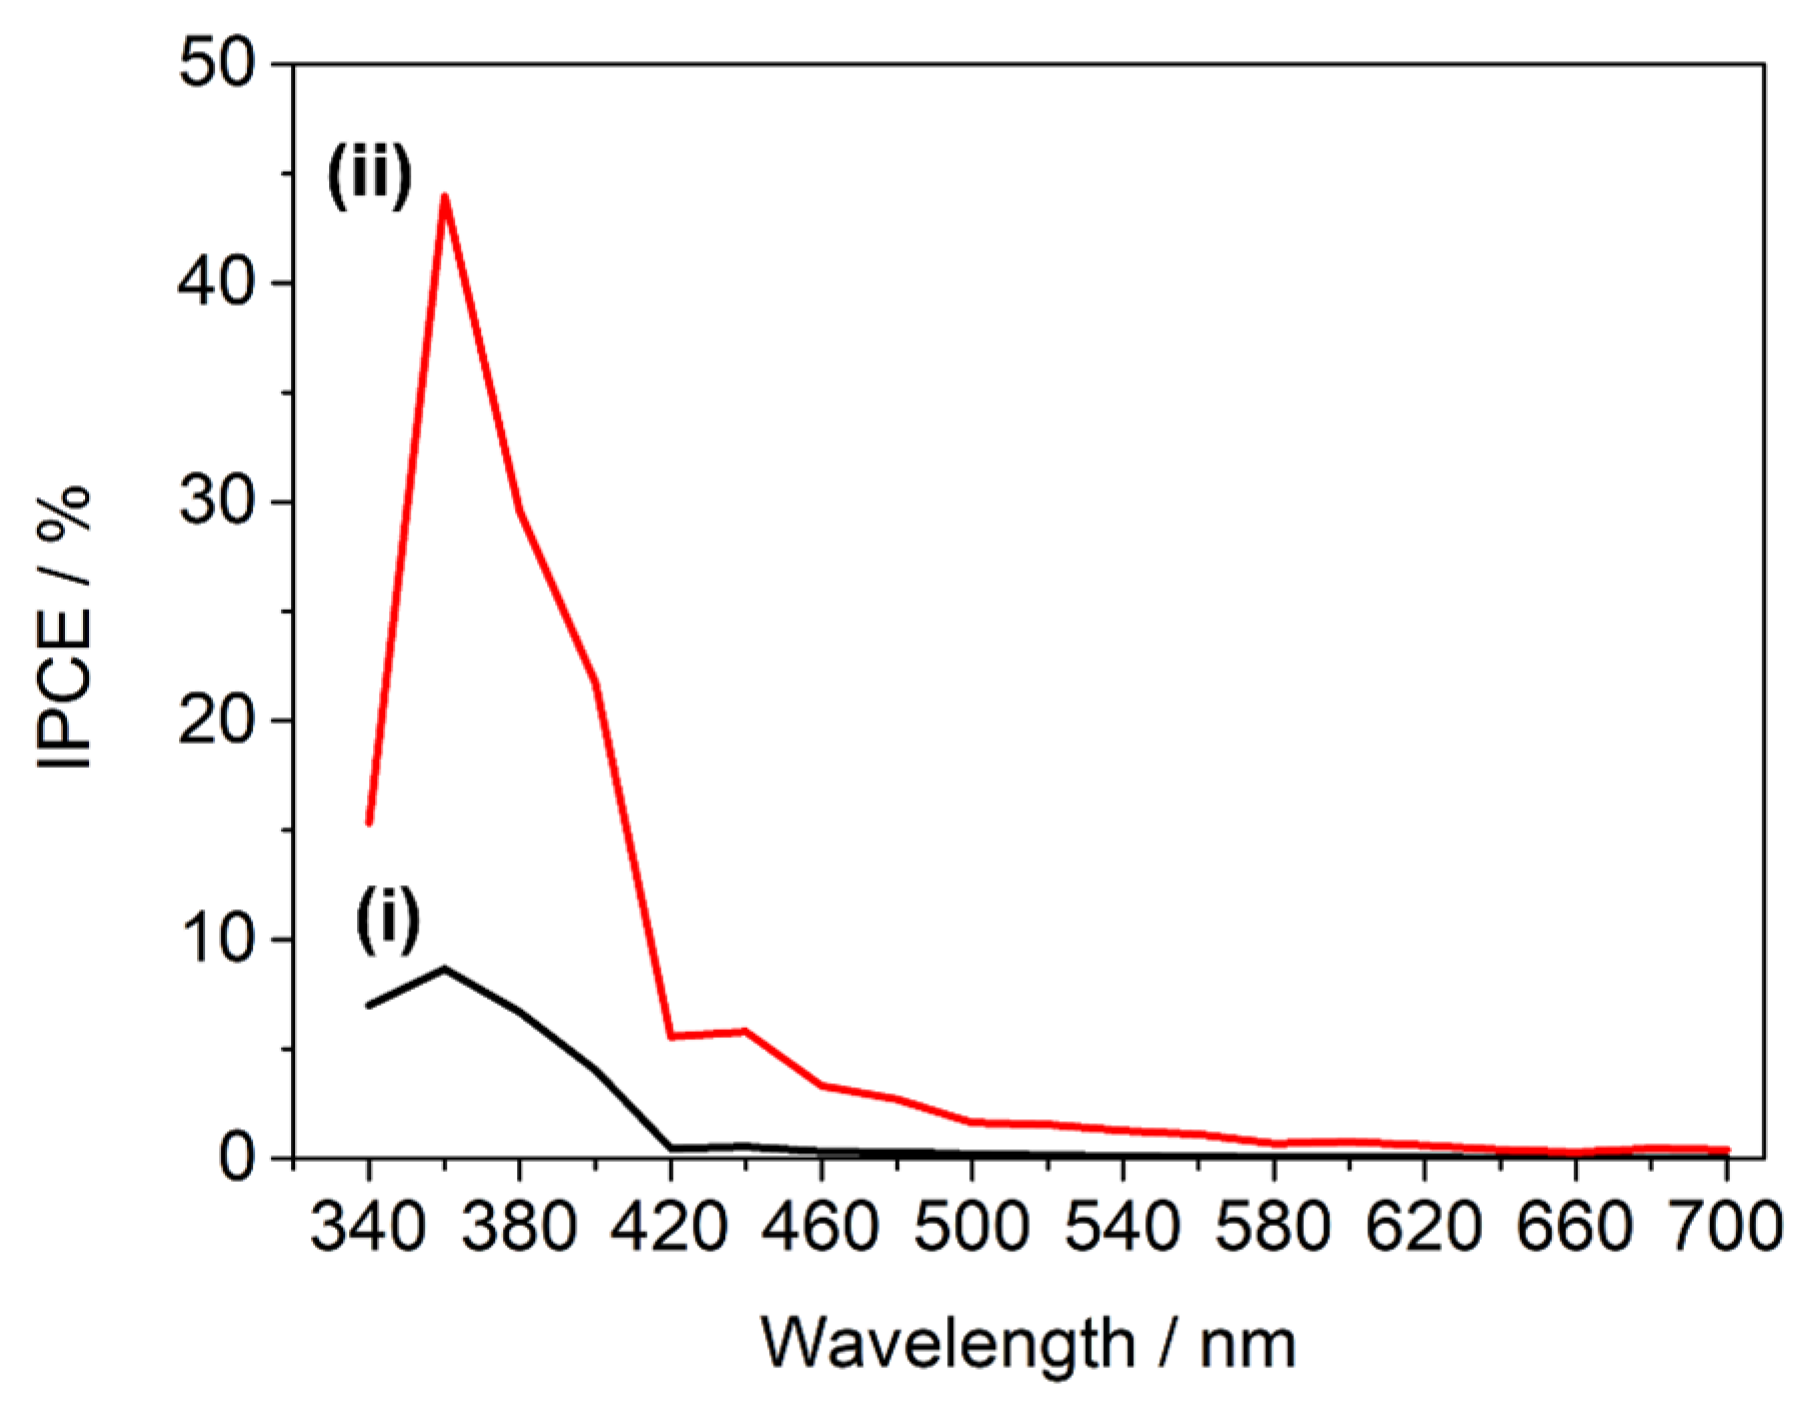
IPCE measurements for TiO2 and TiO2/Fe2O3-60 nm (the highest performing heterojunction) thin films were carried out to further investigate the photoelectronic impact of the α-Fe2O3 coating (Figure 15). TiO2 possessed the expected trend given its large bandgap, the IPCE only significantly increasing above zero at <420 nm (2.95 eV) incident photon wavelength and peaking at 360 nm (3.44 eV). Over this range, the IPCE of the TiO2/Fe2O3-60 nm-layered film was enhanced significantly, increasing from 8.5% to 43.5% at 360 nm. While this could be partly due to increased photon absorption, the α-Fe2O3 layer was significantly thinner than TiO2, so considering that the wavelength was within the bandgap of TiO2, the addition of α-Fe2O3 was not expected to significantly increase the total 360 nm photon absorption of the electrode. The increased performance must therefore be linked to improved charge separation due to the heterojunction formation, and therefore the band alignment must, in fact, become preferential (type-II heterojunction) for electron-hole separation upon semiconductor contact [59,60]. The narrower bandgap of α-Fe2O3 (measured as ~2.09 eV, Figure 12) results in IPCE above zero for incident wavelengths greater than the 420 nm cut-off seen in TiO2. Interestingly, despite measuring the ~2.09 eV (593 nm) bandgap, the IPCE of TiO2/Fe2O3-60nm remained above zero up to ~620 nm (2.0 eV), the lower limit of the accepted α-Fe2O3 bandgap range.

3. Conclusions

An effective deposition protocol for conformal, thickness-controlled α-Fe2O3 thin films was developed using PEALD, for which there are only two other reported processes. Pure ALD growth was confirmed by a constant GPC and linearly increasing film thickness with an increasing number of growth cycles, and an optimised deposition protocol was determined from several possible processes by comparison with the respective GPC and time efficiency values. Due to the poor uptake of the precursor, a vapour boost protocol was introduced and repeated within a single precursor pulse half-cycle to ensure sufficient GPC for film growth on a practical timescale, although, even with this addition, the deposition periods were high, which prevented film-thickness growth beyond 60 nm. Poor uptake is a common property of ferrocene-based precursors, hence it is of interest to expand and adapt this deposition protocol to a bespoke α-Fe2O3 precursor, tailor-made for this PEALD process (i.e., possessing greater volatility than commercially available ferrocene-based structures, improving uptake and reducing required pot temperatures), which is particularly relevant for PEALD compared to thermal ALD due to the greater flexibility in molecular precursor design afforded by the high-reactivity oxygen plasma co-reactant.
To confirm the conformality of the thin film deposition, a coating of α-Fe2O3 was deposited onto a photoanode consisting of TiO2 nanorods. The resulting film did not show complete uniform and conformal deposition down the entire length of the nanorod, with decreasing Fe abundance towards the lower region of the nanorod structure. Photoelectrochemical water splitting measurements were performed on annealed α-Fe2O3, as well as the α-Fe2O3-coated TiO2 nanorods and as-deposited TiO2 nanorods for performance comparisons, revealing that the thickest (60 nm) α-Fe2O3 coating was the only electrode to compete with the performance of as-deposited TiO2, possessing ca. half the photocurrent density at 1.23 V vs. RHE from the front-side illumination, but ca. double that from the rear-side illumination. Despite focusing on the annealed films here, the as-deposited Fe2O3 was found to be amorphous and would be of interest for further study in PEC application as a heterojunction. Overall, this study represents our initial results from the development of thin films of hematite using a PEALD process. Future work in this area should focus on the development of Fe2O3 films at lower temperatures on softer substrates, and will be reported elsewhere.

4. Experimental

Precursor thermal characterisation was performed using thermogravimetric analysis (TGA, PerkinElmer TGA 4000), heating the compound of interest between 50 and 520 °C at a constant ramp rate of 5 °C min−1 under a 20 mL min−1 argon flow. For isothermal measurements, the precursor was heated to 90 °C, held for 8 min, then heated to 95 °C at a constant ramp rate of 5 °C min−1, and repeated until the final temperature had been reached.
All depositions were performed on a Beneq TFS-200 reactor using a direct, capacitively coupled plasma configuration. Dimethylaminomethyl ferrocene (DMAMFc, Alfa Aesar, >98%) was used without further purification. DMAMFc was kept in a HS300 stainless steel container and heated to 60, 90, or 120 °C. To avoid condensation of the precursor, ultrapure nitrogen (N2) was used as a carrier gas and purging gas. O2 and N2 were used in the plasma system and maintained at 50 sccm and 200 sccm, respectively, throughout the deposition. The process was trialled in both pulsed and flow plasma gas regimes. A 13.56 MHz RF power source (CESAR 133, Advanced Energy) and impedance matching network (Navio, Advanced Energy) system were used to generate O2 plasma. The process was systematically examined to optimise the precursor pulse and purging times. Depositions were completed using applied plasma powers ranging from 0 to 200 W, and a chamber temperature range of 75–325 °C.
Growth of α-Fe2O3 was primarily investigated by depositing it onto 150 mm Si (100) wafers. Resulting film thicknesses were measured using spectroscopic ellipsometry (Stokes LSE-USB ellipsometer), and crystallinity was measured by grazing incidence X-ray diffraction (GIXRD, STOE STADI P Bragg-Brentano geometry, CuK incident X-rays) at incidence angles of 0.5–5°. Absorption spectra were collected on samples deposited onto ultrasonic and plasma-cleaned, fluorine-doped tin oxide (FTO, AGC type U TCO glass)-coated glass, using a Cary 5000 UV-Vis-NIR spectrophotometer equipped with an integrating sphere and a centre mount sample holder to account for scattering and reflection contribution. High resolution images of the thin films were obtained by field emission scanning electron microscopy (FESEM, JEOL JSM-7900F), and elemental analysis was performed by energy dispersive X-ray spectroscopy (EDX, Oxford Instruments AZtec 170 mm2 Ultim Max).
The TiO2 nanocrystal array was grown on FTO-coated glass substrate by a hydrothermal synthesis reaction previously reported by Zhang et al. [34]. Briefly, an FTO-coated glass substrate was ultrasonically cleaned for 30 min in a 1:1 solution of ethanol and acetone, and placed inside a 100 mL Teflon-lined stainless-steel autoclave with the conductive FTO-coated side facing upwards. A solution containing 0.7 g of titanium(IV) butoxide in a 50 mL mixture of 1:1 concentrated hydrochloric acid (37%) and de-ionised water was stirred for 30 min and pipetted onto the FTO-coated substrate. The autoclave was sealed and heated in an oven at 180 °C for 3 h.
Electrochemical data were recorded with an Autolab electrochemical workstation (PGSTAT100) connected to a three-electrode electrochemical cell containing a platinum wire counter electrode (CE), 3 M Ag/AgCl reference electrode (RE), and thin film sample working electrode (WE). Simulated sunlight was generated from a 300 W Xenon lamp (Microsolar300 Beijing Perfectlight Technology Co. Ltd., AM 1.5 G, 100 mW cm−2) and employed to provide chopped light (5 s on, 5 s off) incidents on the WE to demonstrate photocurrents and dark background currents across a potential range scanned with a scan rate of 15 mV s−1. All measurements were performed in 1 M KOH (pH 13.7) electrolyte.

Author Contributions

A.L.J. conceived and designed the study and made a significant contribution to the editing and manuscript preparation alongside T.R.H.-L. T.R.H.-L. and A.B. performed the experimental work, collected data, and contributed to the data analysis and interpretation. T.R.H.-L. wrote and prepared an initial draft of the manuscript and contributed to the editing. A.L.J., F.M., C.L.B., and J.Z. contributed to the supervision of T.R.H.-L. and A.B., as well as to the interpretation of analysis of data, funding acquisition, visualization of the project, and the project’s administration. All authors have read and agreed to the published version of the manuscript.

Funding

C.L.B. is the recipient of an Australian Research Council (ARC) Discovery Early Career Researcher Award (DECRA, project number: DE200101076), funded by the Australian Government.

Data Availability Statement

The data that support the findings of this study are available from the corresponding authors due to privacy.

Acknowledgments

This work has been supported by the University of Bath (UoBath) and Monash University (MonashU), both of which are thanked for the provision of a joint Bath–Monash Global PhD studentship to TRHL. The authors acknowledge the use of the instruments, and the scientific and technical assistance, at the Monash Centre for Electron Microscopy (MCEM), a Node of Microscopy Australia.

Conflicts of Interest

The authors declare no conflicts of interest.

References

  1. George, S.M. Atomic Layer Deposition: An Overview. Chem. Rev. 2009, 110, 111–131. [Google Scholar] [CrossRef]
  2. Malygin, A.A.; Drozd, V.E.; Malkov, A.A.; Smirnov, V.M.; From, V.B. Aleskovskii’s “Framework” Hypothesis to the Method of Molecular Layering/Atomic Layer Deposition. Chem. Vap. Depos. 2015, 21, 216–240. [Google Scholar] [CrossRef]
  3. Mallick, B.C.; Hsieh, C.-T.; Yin, K.-M.; Gandomi, Y.A.; Huang, K.-T. Review—On Atomic Layer Deposition: Current Progress and Future Challenges. ECS J. Solid State Sci. Technol. 2019, 8, N55–N78. [Google Scholar] [CrossRef]
  4. Puurunen, R.L. Surface chemistry of atomic layer deposition: A case study for the trimethylaluminum/water process. J. Appl. Phys. 2005, 97, 121301. [Google Scholar] [CrossRef]
  5. Innocent, J.W.F.; Napari, M.; Johnson, A.L.; Harris-Lee, T.R.; Regue, M.; Sajavaara, T.; MacManus-Driscoll, J.L.; Marken, F.; Alkhalil, F. Atomic scale surface modification of TiO2 3D nano-arrays: Plasma enhanced atomic layer deposition of NiO for photocatalysis. Mater. Adv. 2021, 2, 273–279. [Google Scholar] [CrossRef]
  6. O’Donnell, S.; Jose, F.; Shiel, K.; Snelgrove, M.; McFeely, C.; McGill, E.; O’Connor, R. Thermal and plasma enhanced atomic layer deposition of ultrathin TiO2 on silicon from amide and alkoxide precursors: Growth chemistry and photoelectrochemical performance. J. Phys. D Appl. Phys. 2022, 55, 085105. [Google Scholar] [CrossRef]
  7. Hu, H.; Dong, B.; Hu, H.; Chen, F.; Kong, M.; Zhang, Q.; Luo, T.; Zhao, L.; Guo, Z.; Li, J.; et al. Atomic Layer Deposition of TiO2 for a High-Efficiency Hole-Blocking Layer in Hole-Conductor-Free Perovskite Solar Cells Processed in Ambient Air. ACS Appl. Mater. Interfaces 2016, 8, 17999–18007. [Google Scholar] [CrossRef] [PubMed]
  8. Ponraj, J.S.; Attolini, G.; Bosi, M. Review on Atomic Layer Deposition and Applications of Oxide Thin Films. Crit. Rev. Solid State Mater. Sci. 2013, 38, 203–233. [Google Scholar] [CrossRef]
  9. Profijt, H.B.; Potts, S.E.; van de Sanden, M.C.M.; Kessels, W.M.M. Plasma-Assisted Atomic Layer Deposition: Basics, Opportunities, and Challenges. J. Vac. Sci. Technol. A Vac. Surf. Film. 2011, 29, 050801. [Google Scholar] [CrossRef]
  10. Kim, H.; Oh, I.-K. Review of plasma-enhanced atomic layer deposition: Technical enabler of nanoscale device fabrication. Jpn. J. Appl. Phys. 2014, 53, 03DA01. [Google Scholar] [CrossRef]
  11. Takagi, T. Ion–surface interactions during thin film deposition. J. Vac. Sci. Technol. A Vac. Surf. Film. 1984, 2, 382–388. [Google Scholar] [CrossRef]
  12. Ren, H.; Nishi, Y.; Shohet, J.L. Changes to Charge and Defects in Dielectrics from Ion and Photon Fluences during Plasma Exposure. Electrochem. Solid-State Lett. 2011, 14, H107. [Google Scholar] [CrossRef]
  13. Oviroh, P.O.; Akbarzadeh, R.; Pan, D.; Coetzee, R.A.M.; Jen, T.-C. New development of atomic layer deposition: Processes, methods and applications. Sci. Technol. Adv. Mater. 2019, 20, 465–496. [Google Scholar] [CrossRef] [PubMed]
  14. Lie, M.; Fjellvåg, H.; Kjekshus, A. Growth of Fe2O3 thin films by atomic layer deposition. Thin Solid Film. 2005, 488, 74–81. [Google Scholar] [CrossRef]
  15. Rooth, M.R.; Johansson, A.; Kukli, K.; Aarik, J.; Boman, M.; Hårsta, A. Atomic Layer Deposition of Iron Oxide Thin Films and Nanotubes using Ferrocene and Oxygen as Precursors. Chem. Vap. Depos. 2008, 14, 67–70. [Google Scholar] [CrossRef]
  16. Lin, Y.; Xu, Y.; Mayer, M.T.; Simpson, Z.I.; McMahon, G.; Zhou, S.; Wang, D. Growth of p-Type Hematite by Atomic Layer Deposition and Its Utilization for Improved Solar Water Splitting. J. Am. Chem. Soc. 2012, 134, 5508–5511. [Google Scholar] [CrossRef] [PubMed]
  17. Riha, S.C.; Klahr, B.M.; Tyo, E.C.; Seifert, S.; Vajda, S.; Pellin, M.J.; Hamann, T.W.; Martinson, A.B.F. Atomic Layer Deposition of a Submonolayer Catalyst for the Enhanced Photoelectrochemical Performance of Water Oxidation with Hematite. ACS Nano 2013, 7, 2396–2405. [Google Scholar] [CrossRef] [PubMed]
  18. Emery, J.D.; Schlepütz, C.M.; Guo, P.; Riha, S.C.; Chang, R.P.H.; Martinson, A.B.F. Atomic Layer Deposition of Epitaxial Iron Oxides for Photoelectrochemical Water Oxidation. ECS Meet. Abstr. 2015, MA2015-02, 1719. [Google Scholar] [CrossRef]
  19. Li, X.; Fan, N.C.; Fan, H.J. A Micro-pulse Process of Atomic Layer Deposition of Iron Oxide Using Ferrocene and Ozone Precursors and Ti-Doping. Chem. Vap. Depos. 2013, 19, 104–110. [Google Scholar] [CrossRef]
  20. Bachmann, J.; Jing; Knez, M.; Barth, S.; Shen, H.; Mathur, S.; Gösele, U.; Nielsch, K. Ordered Iron Oxide Nanotube Arrays of Controlled Geometry and Tunable Magnetism by Atomic Layer Deposition. J. Am. Chem. Soc. 2007, 129, 9554–9555. [Google Scholar] [CrossRef]
  21. Riha, S.C.; Racowski, J.M.; Lanci, M.P.; Klug, J.A.; Hock, A.S.; Martinson, A.B.F. Phase Discrimination through Oxidant Selection in Low-Temperature Atomic Layer Deposition of Crystalline Iron Oxides. Langmuir 2013, 29, 3439–3445. [Google Scholar] [CrossRef] [PubMed]
  22. Klug, J.A.; Becker, N.G.; Riha, S.C.; Martinson, A.B.F.; Elam, J.W.; Pellin, M.J.; Proslier, T. Low temperature atomic layer deposition of highly photoactive hematite using iron(iii) chloride and water. J. Mater. Chem. A 2013, 1, 11607–11613. [Google Scholar] [CrossRef]
  23. de Ridder, M.; van de Ven, P.C.; van Welzenis, R.G.; Brongersma, H.H.; Helfensteyn, S.; Creemers, C.; Van Der Voort, P.; Baltes, M.; Mathieu, M.; Vansant, E.F. Growth of Iron Oxide on Yttria-Stabilized Zirconia by Atomic Layer Deposition. J. Phys. Chem. B 2002, 106, 13146–13153. [Google Scholar] [CrossRef]
  24. Selvaraj, S.; Moon, H.; Yun, J.-Y.; Kim, D.-H. Iron oxide grown by low-temperature atomic layer deposition. Korean J. Chem. Eng. 2016, 33, 3516–3522. [Google Scholar] [CrossRef]
  25. Klahr, B.; Gimenez, S.; Fabregat-Santiago, F.; Hamann, T.; Bisquert, J. Water Oxidation at Hematite Photoelectrodes: The Role of Surface States. J. Am. Chem. Soc. 2012, 134, 4294–4302. [Google Scholar] [CrossRef] [PubMed]
  26. Klahr, B.M.; Martinson, A.B.F.; Hamann, T.W. Photoelectrochemical Investigation of Ultrathin Film Iron Oxide Solar Cells Prepared by Atomic Layer Deposition. Langmuir 2011, 27, 461–468. [Google Scholar] [CrossRef] [PubMed]
  27. Martinson, A.B.F.; DeVries, M.J.; Libera, J.A.; Christensen, S.T.; Hupp, J.T.; Pellin, M.J.; Elam, J.W. Atomic Layer Deposition of Fe2O3 Using Ferrocene and Ozone. J. Phys. Chem. C 2011, 115, 4333–4339. [Google Scholar] [CrossRef]
  28. Van Bui, H.; Grillo, F.; van Ommen, J.R. Atomic and molecular layer deposition: Off the beaten track. Chem. Commun. 2017, 53, 45–71. [Google Scholar] [CrossRef]
  29. Astruc, D. Why is Ferrocene so Exceptional? Eur. J. Inorg. Chem. 2016, 2017, 6–29. [Google Scholar] [CrossRef]
  30. Ramachandran, R.K.; Dendooven, J.; Detavernier, C. Plasma enhanced atomic layer deposition of Fe2O3 thin films. J. Mater. Chem. A 2014, 2, 10662–10667. [Google Scholar] [CrossRef]
  31. Choi, B.; Park, G.-W.; Jeong, J.-R.; Jeon, N. Comparative Study of Thermal and Plasma-Enhanced Atomic Layer Deposition of Iron Oxide Using Bis(N,N′-di-butylacetamidinato)iron(II). Nanomaterials 2023, 13, 1858. [Google Scholar] [CrossRef] [PubMed]
  32. Chen, Q.; Fan, G.; Fu, H.; Li, Z.; Zou, Z. Tandem photoelectrochemical cells for solar water splitting. Adv. Phys. X 2018, 3, 1487267. [Google Scholar] [CrossRef]
  33. Wang, L.; Liang, K.; Wang, G.; Yang, Y. Interface-engineered hematite nanocones as binder-free electrodes for high-performance lithium-ion batteries. J. Mater. Chem. A 2018, 6, 13968–13974. [Google Scholar] [CrossRef]
  34. Yang, Y. A mini-review: Emerging all-solid-state energy storage electrode materials for flexible devices. Nanoscale 2020, 12, 3560–3573. [Google Scholar] [CrossRef] [PubMed]
  35. Wang, K.; Cao, J.; Gao, J.; Zhao, J.; Jiang, W.; Ahmad, W.; Jiang, J.; Ling, M.; Liang, C.; Chen, J. Unveiling the structure-activity relationship of hollow spindle-like α-Fe2O3 nanoparticles via phosphorus doping engineering for enhanced lithium storage. Sustain. Mater. Technol. 2023, 38, e00744. [Google Scholar] [CrossRef]
  36. Yu, L.; Zhou, X.; Lu, L.; Wu, X.; Wang, F. Recent Developments of Nanomaterials and Nanostructures for High-Rate Lithium Ion Batteries. ChemSusChem 2020, 13, 5361–5407. [Google Scholar] [CrossRef]
  37. Lu, X.; Zeng, Y.; Yu, M.; Zhai, T.; Liang, C.; Xie, S.; Balogun, M.S.; Tong, Y. Oxygen-Deficient Hematite Nanorods as High-Performance and Novel Negative Electrodes for Flexible Asymmetric Supercapacitors. Adv. Mater. 2020, 32, 3148–3155. [Google Scholar] [CrossRef]
  38. Lai, F.; Feng, J.; Heil, T.; Wang, G.-C.; Adler, P.; Antonietti, M.; Oschatz, M. Strong metal oxide-support interactions in carbon/hematite nanohybrids activate novel energy storage modes for ionic liquid-based supercapacitors. Energy Storage Mater. 2019, 20, 188–195. [Google Scholar] [CrossRef]
  39. Yadav, A.A.; Deshmukh, T.B.; Deshmukh, R.V.; Patil, D.D.; Chavan, U.J. Electrochemical supercapacitive performance of Hematite α-Fe2O3 thin films prepared by spray pyrolysis from non-aqueous medium. Thin Solid Film. 2016, 616, 351–358. [Google Scholar] [CrossRef]
  40. Hjiri, M.; Algessair, S.; Dhahri, R.; Mirzaei, A.; Neri, G. Gas sensing properties of hematite nanoparticles synthesized via different techniques. RSC Adv. 2024, 14, 17526–17534. [Google Scholar] [CrossRef]
  41. Garcia, D.; Picasso, G.; Hidalgo, P.; Peres, H.E.M.; Sun Kou, R.; Gonçalves, J.M. Sensors based on Ag-loaded hematite (α-Fe2O3) nanoparticles for methyl mercaptan detection at room temperature. Anal. Chem. Res. 2017, 12, 74–81. [Google Scholar] [CrossRef]
  42. Zhou, B.; Jiang, Y.; Guo, Q.; Das, A.; Sobrido, A.B.J.; Hing, K.A.; Zayats, A.V.; Krause, S. Photoelectrochemical Detection of Calcium Ions Based on Hematite Nanorod Sensors. ACS Appl. Nano Mater. 2022, 5, 17087–17094. [Google Scholar] [CrossRef] [PubMed]
  43. Lee, S.; Jang, H.W. α-Fe2O3 nanostructure-based gas sensors. J. Sens. Sci. Technol. 2021, 30, 210–217. [Google Scholar] [CrossRef]
  44. Tulliani, J.-M.; Baroni, C.; Zavattaro, L.; Grignani, C. Strontium-Doped Hematite as a Possible Humidity Sensing Material for Soil Water Content Determination. Sensors 2013, 13, 12070–12092. [Google Scholar] [CrossRef] [PubMed]
  45. Hjiri, M. Highly sensitive NO2 gas sensor based on hematite nanoparticles synthesized by sol–gel technique. J. Mater. Sci. Mater. Electron. 2020, 31, 5025–5031. [Google Scholar] [CrossRef]
  46. Shen, S.; Lindley, S.A.; Chen, X.; Zhang, J.Z. Hematite heterostructures for photoelectrochemical water splitting: Rational materials design and charge carrier dynamics. Energy Environ. Sci. 2016, 9, 2744–2775. [Google Scholar] [CrossRef]
  47. Park, J.; Kang, J.; Chaule, S.; Jang, J.-H. Recent progress and perspectives on heteroatom doping of hematite photoanodes for photoelectrochemical water splitting. J. Mater. Chem. A 2023, 11, 24551–24565. [Google Scholar] [CrossRef]
  48. Zhu, L.; Li, Z.; Cheng, Y.; Zhang, X.; Du, H.; Zhu, C.; Jiang, D.; Yuan, Y. A highly efficient hematite photoelectrochemical fuel cell for solar-driven hydrogen production. Int. J. Hydrog. Energy 2023, 48, 32699–32707. [Google Scholar] [CrossRef]
  49. Klahr, B.; Gimenez, S.; Fabregat-Santiago, F.; Bisquert, J.; Hamann, T.W. Electrochemical and photoelectrochemical investigation of water oxidation with hematite electrodes. Energy Environ. Sci. 2012, 5, 7626–7636. [Google Scholar] [CrossRef]
  50. Wang, D.; Chang, G.; Zhang, Y.; Chao, J.; Yang, J.; Su, S.; Wang, L.; Fan, C.; Wang, L. Hierarchical three-dimensional branched hematite nanorod arrays with enhanced mid-visible light absorption for high-efficiency photoelectrochemical water splitting. Nanoscale 2016, 8, 12697–12701. [Google Scholar] [CrossRef]
  51. Zhang, G.; Zhang, X.; Huang, H.; Wang, J.; Li, Q.; Chen, L.Q.; Wang, Q. Toward Wearable Cooling Devices: Highly Flexible Electrocaloric Ba0.67Sr0.33TiO3 Nanowire Arrays. Adv. Mater. 2016, 28, 4811–4816. [Google Scholar] [CrossRef] [PubMed]
  52. Steier, L.; Luo, J.; Schreier, M.; Mayer, M.T.; Sajavaara, T.; Grätzel, M. Low-Temperature Atomic Layer Deposition of Crystalline and Photoactive Ultrathin Hematite Films for Solar Water Splitting. ACS Nano 2015, 9, 11775–11783. [Google Scholar] [CrossRef]
  53. Dobbelaere, T.; Mattelaer, F.; Roy, A.K.; Vereecken, P.; Detavernier, C. Plasma-enhanced atomic layer deposition of titanium phosphate as an electrode for lithium-ion batteries. J. Mater. Chem. A 2017, 5, 330–338. [Google Scholar] [CrossRef]
  54. Henderick, L.; Blomme, R.; Minjauw, M.; Keukelier, J.; Meersschaut, J.; Dendooven, J.; Vereecken, P.; Detavernier, C. Plasma-enhanced atomic layer deposition of nickel and cobalt phosphate for lithium ion batteries. Dalton Trans. 2022, 51, 2059–2067. [Google Scholar] [CrossRef]
  55. Wu, W.-Q.; Lei, B.-X.; Rao, H.-S.; Xu, Y.-F.; Wang, Y.-F.; Su, C.-Y.; Kuang, D.-B. Hydrothermal Fabrication of Hierarchically Anatase TiO2 Nanowire arrays on FTO Glass for Dye-sensitized Solar Cells. Sci. Rep. 2013, 3, 1352. [Google Scholar] [CrossRef] [PubMed]
  56. Harris-Lee, T.R.; Zhang, Y.; Bowen, C.R.; Fletcher, P.J.; Zhao, Y.; Guo, Z.; Innocent, J.W.F.; Johnson, S.A.L.; Marken, F. Photo-Chlorine Production with Hydrothermally Grown and Vacuum-Annealed Nanocrystalline Rutile. Electrocatalysis 2021, 12, 65–77. [Google Scholar] [CrossRef]
  57. Harris-Lee, T.R.; Johnson, S.A.L.; Wang, L.; Fletcher, P.J.; Zhang, J.; Bentley, C.; Bowen, C.R.; Marken, F. TiO2 nanocrystal rods on titanium microwires: Growth, vacuum annealing, and photoelectrochemical oxygen evolution. New J. Chem. 2022, 46, 8385–8392. [Google Scholar] [CrossRef]
  58. Lianos, P. Review of recent trends in photoelectrocatalytic conversion of solar energy to electricity and hydrogen. Appl. Catal. B Environ. 2017, 210, 235–254. [Google Scholar] [CrossRef]
  59. Liu, J.; Yang, S.; Wu, W.; Tian, Q.; Cui, S.; Dai, Z.; Ren, F.; Xiao, X.; Jiang, C. 3D Flowerlike α-Fe2O3@TiO2 Core–Shell Nanostructures: General Synthesis and Enhanced Photocatalytic Performance. ACS Sustain. Chem. Eng. 2015, 3, 2975–2984. [Google Scholar] [CrossRef]
  60. Peng, L.; Xie, T.; Lu, Y.; Fan, H.; Wang, D. Synthesis, photoelectric properties and photocatalytic activity of the Fe2O3/TiO2 heterogeneous photocatalysts. Phys. Chem. Chem. Phys. 2010, 12, 8033–8041. [Google Scholar] [CrossRef] [PubMed]
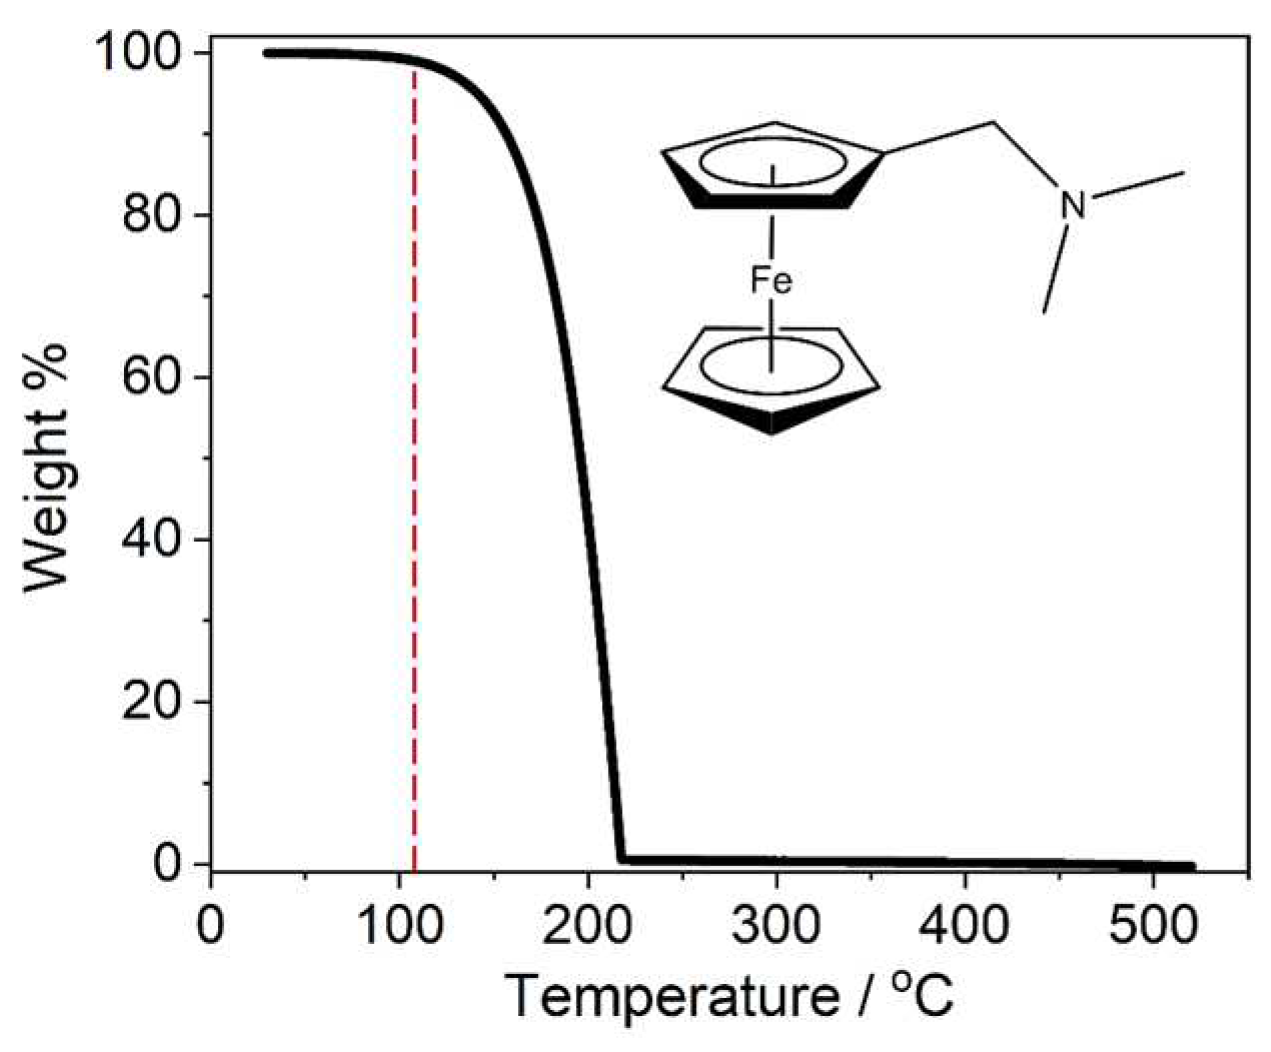
Figure 1. Thermogravimetric analysis of DMAMFc, measured under an Ar flow between 30 and 520 °C at a constant ramp rate of 5 °C min−1, with volatilisation onset marked with a red dashed line.
Crystals 14 00723 g001
Figure 2. Optimisation of DMAMFc PEALD pulse sequence process, comparing measured growth rate to (a) DMAMFc delivery boost pulse, and (b) DMAMFc delivery pulse for a single boost pulse before plasma step (blue, zoomed on inset), and multiple boost pulse sequences before the plasma step (black). All depositions completed with the defined ‘standard protocol’ except for the single varied parameter.
Crystals 14 00723 g002
Figure 3. Optimisation of DMAMFc PEALD temperatures, comparing measured growth rate with (a) pot temperature, and (b) chamber temperature. All depositions completed with the defined ‘standard protocol’ except for the single varied parameter.
Crystals 14 00723 g003
Figure 4. Optimisation of DMAMFc PEALD plasma parameters, comparing measured growth rate with (a) plasma power, and (b) plasma pulse length. All depositions completed with the defined ‘standard protocol’ except for the single varied parameter. (c) Comparison of pulse/purge/pulse/purge protocols for pulsed vs. flow plasma gas input, and (d) measured growth from pulsed vs. flow plasma gas protocols, with and without RF pulse.
Crystals 14 00723 g004
Figure 5. Growth rates and corresponding deposition efficiencies (η) for a series of PEALD processes.
Crystals 14 00723 g005
Figure 6. Growth rate and total film thickness measurements for films deposited by PEALD using process 6 across a range of total cycle numbers.
Crystals 14 00723 g006
Figure 7. Appearance (from left to right) of: initial FTO-coated glass substrate, as-deposited 60 nm thin films, annealed 60 nm thin film (note that the silver area at the top is silver paint and not part of the sample).
Crystals 14 00723 g007
Figure 8. Grazing incidence X-ray diffraction patterns for pristine FTO (red), (blue) as-deposited Fe2O3 on FTO, and annealed Fe2O3 on FTO (black), measured at an X-ray incidence angle of 5° for ~12 h within a 2θ range of (a) 20–90° and (b) 30–40°. Insets show zoomed views of the peak of interest with XRD patterns overlayed. Peaks associated with FTO are marked with a black dot.
Crystals 14 00723 g008
Figure 9. (a) FE-SEM cross-section image of 60 nm-α-Fe2O3 deposited onto FTO-coated glass substrate (approximate α-Fe2O3 layer indicated in red). EDX data for 60 nm-α-Fe2O3 deposited onto FTO-coated glass substrate: (b) electron image overlayed with Fe series from EDX analysis (teal), (c) Fe map across electron image, and (d) Sn map across the electron image.
Crystals 14 00723 g009
Figure 10. FE-SEM surface images of (a) TiO2-nanorods, and (b) TiO2/Fe2O3-60nm, deposited onto FTO-coated glass substrate.
Crystals 14 00723 g010
Figure 11. (a) FE-SEM cross-section image of TiO2/Fe2O3-30 nm, (b) electron image of TiO2/Fe2O3-30 nm overlayed with Fe (blue) and Ti (orange) series from EDX analysis, (c) FE-SEM cross-section image of TiO2/Fe2O3-60 nm, and (d) electron image of TiO2/Fe2O3-60 nm overlayed with Fe (blue) and Ti (orange) series from EDX analysis.
Crystals 14 00723 g011
Figure 12. (a) Optical absorption spectra for: (black) TiO2, (red) α-Fe2O3, (blue) TiO2/Fe2O3. (b) Tauc plots for each sample with extrapolated indirect bandgaps as annotated. All thin films were deposited onto FTO-coated glass.
Crystals 14 00723 g012
Figure 13. X-ray diffraction pattern for the pristine TiO2 nanorod and TiO2/Fe2O3-60 nm samples, both grown onto FTO-coated glass substrate. Peak locations corresponding to rutile TiO2 and a-Fe2O3 are highlighted in blue and red, respectively, and FTO is marked with a black dot.
Crystals 14 00723 g013
Figure 14. Linear sweep voltammograms under one sun-chopped AM 1.5 (a,c) front, (b,d) rear illumination for (black) TiO2, (red) 30 nm α-Fe2O3, ((a,b); blue) TiO2/Fe2O3-30nm, ((c,d); blue TiO2/Fe2O3-60 nm). Insets contain zoomed-in views ignoring the cathodic current density baseline shift. All measurements performed in 1 M KOH (pH 13.7) with a 15 mV s−1 scan rate.
Crystals 14 00723 g014
Figure 15. Incident photon-electron conversion efficiencies measured at 1.23 V vs. RHE under one sun AM 1.5 rear illumination for (i) as-deposited TiO2, and (ii) TiO2/Fe2O3-60 nm. All measurements carried out 1 M KOH (pH 13.7).
Crystals 14 00723 g015
Table 1. PEALD processes with varying pulse sequences and temperatures, all using 100 W RF generator power, a 5 s plasma gas and RF pulse, and a 10 s purge.
Process
Number
Sequence/s
(Boost/Pulse) × n
Temp/°C
(Pot/Chamber)
GPC/Å cycle−1η/10−3 Å s−1
1(0.5/1.0) × 160/2400.134.16
2(2.0/5.0) × 160/2400.246.46
3(0.5/3.0) × 190/2400.298.60
4(0.5/3.0) × 190/3000.298.72
5(0.5/1.0) × 390/2400.439.75
6(0.5/3.0) × 390/2400.5310.40
7(1.0/3.0) × 390/2400.5410.42
8(0.5/3.0) × 590/2400.629.17
9(0.5/3.0) × 3120/2400.7314.49
10(0.5/3.0) × 10120/2400.787.05
Table 2. Photocurrent densities at 1.23 V vs. RHE for photoanodes measured in Figure 14.
jphoto/µA cm−2
Illumination SideTiO230 nm α-Fe2O3TiO2/Fe2O3-30 nmTiO2/Fe2O3-60 nm
Front240.462.813
Rear400.432085
Disclaimer/Publisher’s Note: The statements, opinions and data contained in all publications are solely those of the individual author(s) and contributor(s) and not of MDPI and/or the editor(s). MDPI and/or the editor(s) disclaim responsibility for any injury to people or property resulting from any ideas, methods, instructions or products referred to in the content.