Article

Surface Recrystallization Model of Fully Amorphized C3H5-Molecular-Ion-Implanted Silicon Substrate

1
SUMCO Corporation, 1-52 Kubara, Yamashiro-cho, Imari-shi 849-4256, Saga, Japan
2
Graduate School of System Engineering, Okayama Prefectural University, 111 Kuboki, Soja-shi 719-1197, Okayama, Japan
3
Department of Communication Engineering, Okayama Prefectural University, 111 Kuboki, Soja-shi 719-1197, Okayama, Japan
*
Author to whom correspondence should be addressed.
Crystals 2024, 14(9), 748; https://doi.org/10.3390/cryst14090748
Submission received: 17 July 2024 / Revised: 18 August 2024 / Accepted: 21 August 2024 / Published: 23 August 2024
(This article belongs to the Section Crystal Engineering)

Abstract

:
The surface recrystallization model of the fully amorphized C3H5-molecular-ion-implanted silicon (Si) substrate is investigated. Transmission electron microscopy is performed to observe the amorphous/crystalline interface near the C3H5-molecular-ion-implanted Si substrate surface after the subsequent recovery thermal annealing treatment. At a depth of high-concentration carbon of approximately 4.8 × 10²⁰ atoms/cm3, recrystallization from the crystalline template to the surface by solid-phase epitaxial growth is partially delayed, and the activation energy was estimated to be 2.79 ± 0.14 eV. The change in the crystalline fraction of the fully amorphized C3H5-molecular-ion-implanted Si substrate surface is quantitatively evaluated from the binding energy of Si 2p spectra by X-ray photoelectron spectroscopy. Using the Kolmogorov–Johnson–Mehl–Avrami equation, the surface recrystallization of the fully amorphized C3H5-molecular-ion-implanted Si substrate is assumed to proceed two-dimensionally, and its activation energy is obtained as 2.71 ± 0.28 eV without the effect of carbon. Technology computer-aided design (TCAD) process simulations calculate recrystallization under the effect of high-concentration carbon and demonstrate the reach of some crystalline regions to the surface first. In the fully amorphized C3H5-molecular-ion-implanted Si substrate, it is considered that recrystallization is partially delayed due to high-concentration carbon and surface recrystallization proceeds two-dimensionally from some crystalline regions reaching the surface first.

1. Introduction

During the fabrication of complementary metal oxide semiconductor (CMOS) image sensors, contaminating transition metallic impurities cause white spots and leakage current, thereby significantly degrading imaging performance [1,2]. Therefore, some types of gettering technique are used to remove transition metallic impurities from device-active regions to a silicon (Si) substrate [3,4]. We have been conducting research and development on C3H5-molecular-ion-implanted epitaxial Si substrates as a proximity gettering technique for advanced high-sensitivity CMOS image sensors and have demonstrated that these Si substrates can improve the characteristics of imaging devices [5,6,7]. The manufacturing procedure for C3H5-molecular-ion-implanted epitaxial Si substrates is simple and suitable for mass production. First, cyclohexane (C6H12) is ionized by the electron impact method to generate fragment ions. Next, C3H5 molecular ions are selected from the fragment ions by mass spectrometry and then implanted at a low energy into a Czochralski (CZ)-grown Si substrate. After the implantation of C3H5 molecular ions, an epitaxial Si layer is grown on the Si substrate surface by the chemical vapor deposition (CVD) method using trichlorosilane (SiHCl3) as a source gas. In the projection range of C3H5 molecular ions in the Si substrate, carbon aggregation defects are formed with high density. These ion-implantation-induced defects work as an effective gettering sink for transition metallic impurities during device fabrication [8,9,10]. Furthermore, previous studies demonstrated that the high-dose implantation of C3H5 molecular ions increases the density of carbon aggregation defects and improves the gettering capability for transition metallic impurities even more [5,6]. However, depending on the amount of increase in the implantation dose of C3H5 molecular ions, the Si substrate surface is amorphized [11]. It is necessary to add a subsequent recovery thermal annealing treatment after implantation to recrystallize the amorphous region in a high-dose-C3H5-molecular-ion-implanted Si substrate surface [12].
In the past, a great deal of study has been carried out into the amorphization of Si substrates by ion implantation and the recrystallization via solid-phase epitaxial growth (SPEG) during the subsequent thermal annealing treatment due to its importance in industrial applications [13,14]. The amorphization of Si substrates is the result of the interaction between the implanted ions and the lattice Si atoms, and it is influenced by ion mass [15], implantation dose, energy [16], dose rate, tilt angle [17], and Si substrate temperature [18]. In the ion-implanted Si substrate, excessive point defects (i.e., vacancies (V) and interstitial Si atoms (I)) are generated owing to binary collisions of the ions and the Si lattice atoms. These implantation cascades of V and I form small amorphous regions (i.e., amorphous pockets). The small discrete amorphous regions then overlap to form a fully amorphous layer [19]. Kadono et al. analyzed the relationship between the implantation dose of C3H5 molecular ions and the amorphous ratio of the Si substrate surface [11]. They reported that the Si substrate surface is discretely and fully amorphized by a C3H5 molecular ion implantation of 1.00 × 10¹⁵ ions/cm2 and 1.67 × 10¹⁵ ions/cm2, respectively, resulting from the overlapping of columnar amorphized regions induced by each molecular ion. On the other hand, in the subsequent thermal annealing treatment, the recrystallization of the amorphized Si substrate via SPEG is a thermally activated process with a single activation energy of 2.70 eV [13]; however, it is affected by the crystal orientation, impurity concentration, and stress. The atomic-scale mechanism of SPEG is as follows. Initially, at the amorphous/crystalline (a/c) interface, the Si atoms in the amorphous and crystalline regions are coordinated and during the thermal annealing treatment SPEG progresses through the bond breaking and atomistic rearrangement [20,21]. This movement is also illustrated as the formation of kinks, ledges, and terraces at the a/c interface [22]. The ratio of the recrystallization rates for the (100), (110), and (111) crystalline orientations is approximately 20:10:1, which can be explained by the atomic configurations at the a/c interface and the number of bonds required for the additional crystalline Si atoms to be bonded to crystalline template in each orientation [23]. Regarding the effect of impurities, when electrically active dopants such as boron, phosphorus, and arsenic are present at high concentrations of subpercentage, the recrystallization rate increases. Johnson and McCallum formulated the enhancement of the recrystallization rate due to the charging of the a/c interface as a generalized Fermi level shifting (GFLS) model [24]. Moreover, when electrically inactive dopant such as the group four element, hydrogen and oxygen are present at the a/c interface, it is known that the recrystallization rate decreased. For example, when carbon is present at high concentrations, the recrystallization rate decreased significantly [25,26,27]. It has been shown that hydrogen diffuses into the amorphous layer during SPEG and segregates at the a/c interface, thus affecting the recrystallization rate [28,29,30]. In the analysis of the stress on recrystallization rate, the activation volume of SPEG is negative, and it is known that the recrystallization rate increases with hydrostatic pressure [31]. Additionally, in the case of uniaxial pressure, the roughness of the a/c interface deteriorates during SPEG, and the recrystallization rate decreases [32]. As described above, atomic-scale mechanisms and the kinetics of SPEG have been revealed both experimentally and theoretically.
However, in addition to understanding phenomena on the atomic-scale, it is necessary to clarify recrystallization behavior on a more macroscopic scale on the Si substrate surface for industrial applications. In particular, providing a comprehensive surface recrystallization model is useful for optimization of thermal annealing treatment conditions (temperature and time) and predicting the formation of defects. The authors previously analyzed the recrystallization behavior of a discretely amorphized Si substrate surface by C3H5 molecular ion implantation of 1.00 × 10¹⁵ ions/cm2 and found three-dimensional recrystallization of isolated amorphous regions [12], although the recrystallization behavior of a fully amorphized Si substrate surface by C3H5 molecular ion implantation of 1.67 × 10¹⁵ ion/cm2 has not been clarified.
In this study, the surface recrystallization model of the fully amorphized C3H5-molecular-ion-implanted silicon (Si) substrate is investigated. We evaluate the recrystallization behavior of Si substrate bulk after thermal annealing treatment by cross-sectional transmission electron microscopy (TEM) and obtain the depth profile of impurity concentration by secondary ion mass spectrometry (SIMS). Then, we compare the TEM images and depth profiles of impurity concentration to investigate the impurity distribution at the a/c interface. We quantitively estimate the recrystallization rate and the activation energy for recrystallization under the effect of impurities. In addition, after recrystallization proceeds from the bulk to the surface of the fully amorphized C3H5-molecular-ion-implanted Si substrate, to analyze the surface recrystallization behavior, we obtain the change in the crystalline fraction of the surface after thermal annealing treatment from the binding energy of Si 2p spectra obtained by X-ray photoelectron spectroscopy (XPS). Moreover, we analyze the obtained change in crystalline fraction on the basis of the Kolmogorov–Johnson–Mehl–Avrami (KJMA) theory to determine the dimension of recrystallization of the fully amorphized C3H5-molecular-ion-implanted Si substrate surface [33,34]. Furthermore, we carry out technology computer-aided design (TCAD) process simulations by incorporating the obtained activation energy for recrystallization under the effect of impurities into the calculation condition. Finally, we propose the macroscopic surface recrystallization model of the fully amorphized C3H5-molecular-ion-implanted substrate from the results of experiment and simulation.

2. Experimental Methods

2.1. Sample Preparation and Evaluation Procedure

First, CZ-grown p-type Si (100) substrates were implanted with C3H5 molecular ions at a dose of 1.67 × 10¹⁵ ions/cm2 at room temperature (RT) to form a fully amorphous layer. The implantation energy of C3H5 molecular ions was 80 keV/ion. The tilt and twist were both 0°. We used a hydrocarbon molecular ion implanter (CLARIS®, Nissin Ion Equipment, Kyoto, Japan) for all implantations. In the subsequent recovery thermal annealing treatment, C3H5-molecular-ion-implanted Si substrates were annealed at 613 °C, 625 °C, 638 °C, and 650 °C for 5–200 s in nitrogen (N2) ambient using rapid thermal annealing equipment (AccuThermo AW610, Allwin21, Morgan Hill, CA, USA). In the rapid thermal annealing equipment, infrared halogen lamps set on both the surface and back side effectively heated Si substrate. The ramp-up rate from RT was 20 °C/s and the cooling rate from the set temperature was −20 °C/s. The temperature during thermal annealing treatment was measured accurately using back-contact-type thermocouples. It was confirmed that the process temperature was within ±3 °C of the set temperature and there was no overshoot or undershoot in the temperature profile. Then, we observed the amorphization of the C3H5-molecular-ion-implanted Si substrate and recrystallization behavior after thermal annealing treatment by cross-sectional TEM. Samples were prepared by argon ion milling and observed by TEM (H-9000UHR-I, Hitachi, Tokyo, Japan). Selected area electron diffraction (SAED) patterns were obtained at a diameter of 100 nm near the Si substrate surface. We also measured depth profiles of carbon and hydrogen concentrations by SIMS (IMS-7f, CAMECA, Gennevilliers, France). We superimposed cross-sectional TEM images and depth profiles of carbon and hydrogen concentrations. Then, for the evaluation of surface recrystallization behavior, we obtained the change in the crystalline fraction of Si substrate surface after C3H5 molecular ion implantation and thermal annealing treatment from the binding energy of Si 2p spectra by XPS (Quantera SXM, ULVAC-PHI, Kanagawa, Japan). A series of XPS analysis were performed using a monochromatic AlKα X-ray source (1486.6 eV) with a spot diameter of 100 μm. The photoelectron take-off angle was set at 45°. The electron escape depth is a few nanometers, and XPS evaluates the recrystallization behavior from the surface to the ultrashallow depth. A native oxide film on the Si substrate surface was removed using 0.5% dilute hydrofluoric acid before XPS analysis.

2.2. TCAD Process Simulation Procedure

We applied TCAD process simulation to analyze the amorphization of the Si substrate induced by C3H5 molecular ion implantation and the recrystallization behavior during the subsequent thermal annealing treatment. Both the C3H5 molecular ion implantation and the thermal annealing treatment were simulated using TCAD process simulation software (Sentaurus™ process, Synopsys, Sunnyvale, CA, USA) [35]. The simulation model was a Si single crystal, and the size was 80 nm in length, 80 nm in width, and 800 nm in height. The native oxide thickness on the simulation model was set at 1.0 nm.
Firstly, the implantation of C3H5 molecular ions was simulated using the Monte Carlo (MC) ion implantation code [36] built in the SentaurusTM process. C3H5 molecular ions were implanted into the simulation model at 1.67 × 10¹⁵ ions/cm2 at RT as in the experiment. When C3H5 molecular ions penetrated the Si substrate surface, it was assumed that molecular ions immediately separated into its constituent carbon and hydrogen atoms [35]. In the MC ion implantation simulation, binary collisions were calculated between each implanted ion and each lattice Si atom in the Si single-crystal structure, and it was assumed that point defects (V and I) were generated where the transferred energy exceeded a threshold E T h r e s h o l d [37]. In this simulation, E T h r e s h o l d was set at a conventional value of 15 eV [38]. The amorphous–crystalline parameter A C in the simulation model was calculated as
A C = C V + C I C T h r e s h o l d ,
where C V and C I are, respectively, the V and I concentrations generated by C3H5 molecular ion implantation in the set certain volume M i n . A m o r p h o u s . V o l . and C T h r e s h o l d is the threshold of the sum of V and I concentrations for amorphization. When the sum of the V and I concentrations was less than C T h r e s h o l d ( A C < 1 ), V and I existed as point defects in the Si single-crystal structure. When the sum of the V and I concentrations was equal to or greater than C T h r e s h o l d ( A C 1 ), the region did not retain the single-crystal structure, and the volume M i n . A m o r p h o u s . V o l was regarded to indicate an amorphous region. In amorphous regions, V and I were redefined as amorphous defect particles and were subject to recrystallization [36].
Secondly, we calculated the recrystallization behavior of the C3H5-molecular-ion-implanted simulation model during thermal annealing treatment. In the simulation, thermal annealing treatments were performed at 613 °C, 625 °C, 638 °C, and 650 °C for 5–200 s in N2 ambient, as in the experiment. To define the a/c interface and calculate the recrystallization behavior considering the crystal orientation, we applied the lattice kinetic Monte Carlo (LKMC) code [39]. In the LKMC code, the recrystallization frequency υ was assigned to each amorphous defect particles located at the a/c interface as
υ = K i × e x p E a + P Δ V S P E + c k B T ,
where K i is the parameter of the crystal orientation. K 1 , K 2 , and K 3 correspond to the prefactors of recrystallization rates in the (100), (110), and (111) directions, respectively. K 1 , K 2 , and K 3 were calibrated based on values from a previous study [40]. E a is the activation energy for recrystallization due to intrinsic SPEG and was set to 2.70 eV [13]. k B is the Boltzmann constant and T is the absolute temperature of the thermal annealing treatment. P is the pressure and V S P E is the activation volume. c is the parameter indicating the effect of impurities. High-concentration impurities cause stress at the a/c interface and may form regrowth-related defects such as microtwins and hairpin dislocations [27]. However, in this recrystallization simulation, the diffusion of impurities during SPEG, the impurity-induced stress, and the formation of defects were not taken into account; however, the change in recrystallization rate due to the activation energy under the effect of impurities was considered.
In the LKMC algorithm, two random numbers were used to select the recrystallizing amorphous defect particles at the a/c interface and determine the recrystallizing event caused by their recrystallization frequency. Then, the recrystallization behavior was calculated in a short period using the two random numbers obtained each time, and this calculation was repeated until the thermal annealing time was ended. The input values of TCAD process simulation are summarized in Table 1.

3. Results and Discussion

3.1. Recrystallization Behavior of Fully Amorphized C3H5-Molecular-Ion-Implanted Si Substrate under the Effect of Impurities after Thermal Annealing Treatment Analyzed by Cross-Sectional TEM and SIMS

In this section, we describe the recrystallization behavior of the amorphous layer under the effect of impurities in the C3H5-molecular-ion-implanted Si substrate analyzed by a both cross-sectional TEM and SIMS. Figure 1 shows cross-sectional TEM images of the Si substrate after C3H5 molecular ion implantation at a dose of 1.67 × 10¹⁵ ions/cm2 and thermal annealing treatments at 650 °C for 10 s, 20 s, and 40 s. The thicknesses of the cross-sectional TEM samples are approximately 100–200 nm. SAED patterns are also shown as insets in each TEM image. From Figure 1a, we confirm that the fully amorphous layer is formed at the C3H5-molecular-ion-implanted Si substrate surface with a depth of approximately 90 nm. It is also indicated that the a/c interface is flat. The SAED pattern from the surface to a depth of 100 nm show a concentric halo pattern, which indicate a completely amorphous structure. As shown in Figure 1b, the amorphous layer is recrystallized by approximately 25 nm from the crystalline template after the thermal annealing treatment at 650 °C for 10 s. The SAED pattern shows a mixture of diffraction spots that indicate a crystalline structure and a concentric halo pattern caused by the amorphous structure. After the thermal annealing treatment at 650 °C for 20 s, the roughness of the a/c interface significantly increases, recrystallization is partially delayed, and some crystalline regions proceed to the Si substrate surface first. In the SAED pattern near the surface, crystalline spots are intensified, and the amorphous concentric halo pattern are faint. Finally, as shown in Figure 1d, the amorphous layer is completely recrystallized by the thermal annealing treatment at 650 °C for 40 s. In addition, it is observed that some defects are formed in the recrystallized regions, as shown in Figure 1d. In the SAED pattern of the recrystallized region near the surface, the concentric halo pattern due to the amorphous structure disappears. Figure 2 is additional cross-sectional TEM image of the defects formed in the recrystallized regions of Figure 1d. In the recrystallized regions of Figure 2, black point defects are observed with high density in a band shape at a depth of 100 nm. As reported by Kurita et al., the black point defects are aggregates of carbon and I [5]. On the other hand, large defects of 30–60 nm extend from the band of black point defects to the surface. The density of these large defects is estimated to be approximately 5.0 × 10¹⁴/cm3 based on an extensive TEM image. A high concentration of carbon agglomerate defects is considered to cause distortion in the surrounding Si crystal structure, resulting in the introduction of stacking faults. In the SAED image focused on the defect in Figure 2, streaks due to the structure are observed, and these defects are presumed to be stacking faults. Additionally, the formation of defects may have suppressed SPEG in that region, further decreasing the recrystallization rate.
Moreover, Figure 3 shows depth profiles of carbon and hydrogen concentrations of the Si substrate after C3H5 molecular ion implantation at a dose of 1.67 × 10¹⁵ ions/cm2 and thermal annealing treatments at 650 °C for 10 s, 20 s, and 40 s obtained by SIMS analysis and are superimposed on the cross-sectional TEM images shown in Figure 1. The amorphous region contains high carbon and hydrogen concentrations, which are known to have a negative effect on the recrystallization rate. As shown in Figure 3a, the peaks of carbon and hydrogen concentrations are located at depths of 80 nm and 30 nm, respectively, after C3H5 molecular ion implantation. In Figure 3a, from near the surface to a depth of 20 nm, the carbon and hydrogen concentrations appear to increase owing to the pile-up of carbon and hydrogen at the Si substrate surface. After the thermal annealing treatment at 650 °C for 10 s, as shown in Figure 3b, it is found that hydrogen diffuses and segregates at the moving a/c interface with a constant concentration of approximately 1.0 × 10¹⁹ atoms/cm3. Furthermore, it is seen that hydrogen diffuses significantly after thermal annealing treatments at 650 °C for 20 s and 40 s, as shown in Figure 3c,d. On the other hand, the depth profile of carbon concentration hardly changes after C3H5 molecular ion implantation and thermal annealing treatments at 650 °C.
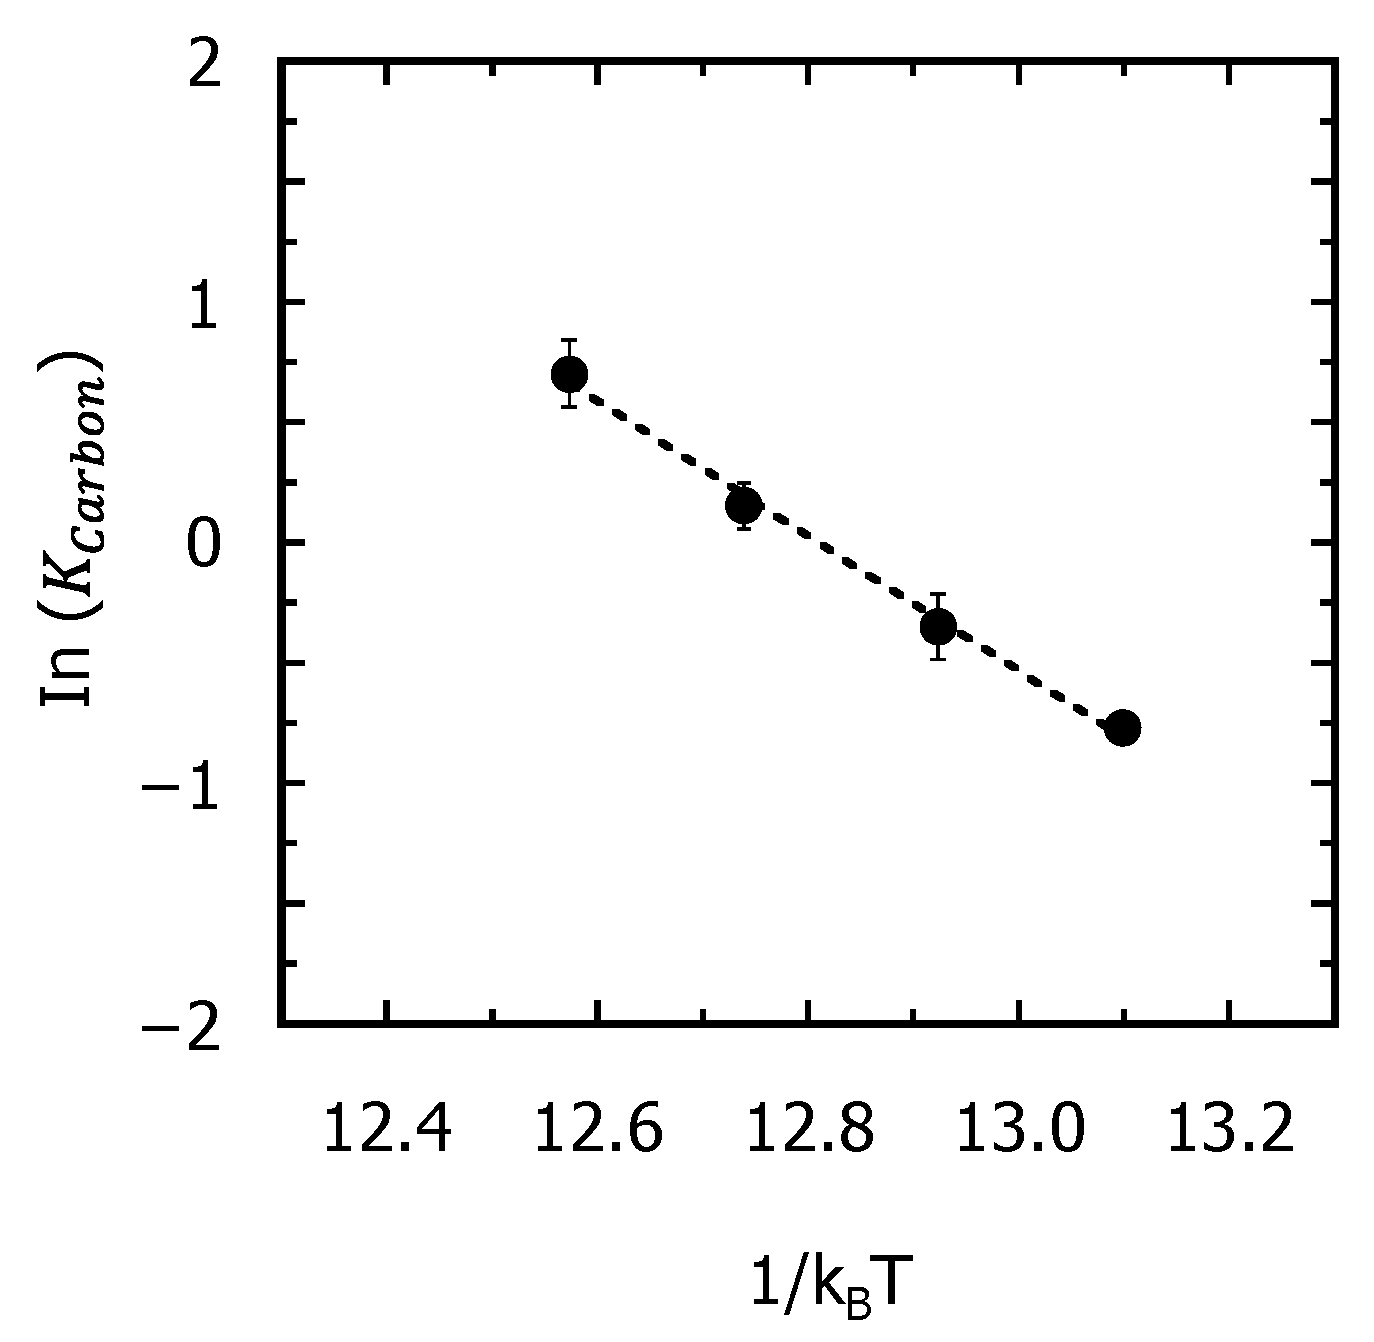
Figure 4 shows the changes in the thickness of the amorphous layer in the C3H5-molecular-ion-implanted Si substrate after thermal annealing treatments at 613 °C, 625 °C, 638 °C, and 650 °C. The error bars in each plot indicate the roughness of the a/c interface. In Figure 4, the recrystallization of the amorphous layer progresses in two stages. Here, considering that hydrogen segregates at an approximately constant concentration at the a/c interface, it is assumed that the change in the recrystallization rate in these two stages is due to the effect of carbon. At all thermal annealing temperatures, the recrystallization rate decreases at depths of 90–50 nm, where the average carbon concentration is 4.8 × 10²⁰ atoms/cm3. As shown by the dotted line in Figure 3, we estimate the recrystallization rate at high concentrations of carbon at depths of 90–50 nm. Then, from the recrystallization rate K C a r b o n under the effect of high-concentration carbon, the activation energy E a C a r b o n is calculated as
K C a r b o n = v 0 e x p E a C a r b o n k B T .
Figure 5 shows an Arrhenius plot of the recrystallization. The activation energy for the recrystallization E a C a r b o n is estimated to be 2.79 ± 0.14 eV at a high carbon concentration of approximately 4.8 × 10²⁰ atoms/cm3. This estimated activation energy for the recrystallization at high carbon concentration is higher than 2.70 eV in the recrystallization in an amorphized Si substrate without any impurities [13]. Roth et al. reported a decrease in the SPEG rate and activation energy under the effect of hydrogen [29]. Their report also shows that hydrogen segregates at approximately 1.0 × 10¹⁹ atoms/cm3 at the a/c interface near the surface during thermal annealing treatment. Moreover, in their report, the activation energy for SPEG hardly changes from that of intrinsic SPEG (2.70 eV) under the high-concentration hydrogen. Therefore, in this study, we consider that the effect of hydrogen on the SPEG rate is related to the prefactor in Equation (3). In the next section, after the recrystallization proceeded from the amorphous layer formed in the C3H5-molecular-ion-implanted substrate, we evaluate the surface recrystallization by XPS analysis.

3.2. Surface Recrystallization Behavior of Fully Amorphized C3H5-Molecular-Ion-Implanted Si Substrate after Thermal Annealing Treatment by XPS Analysis

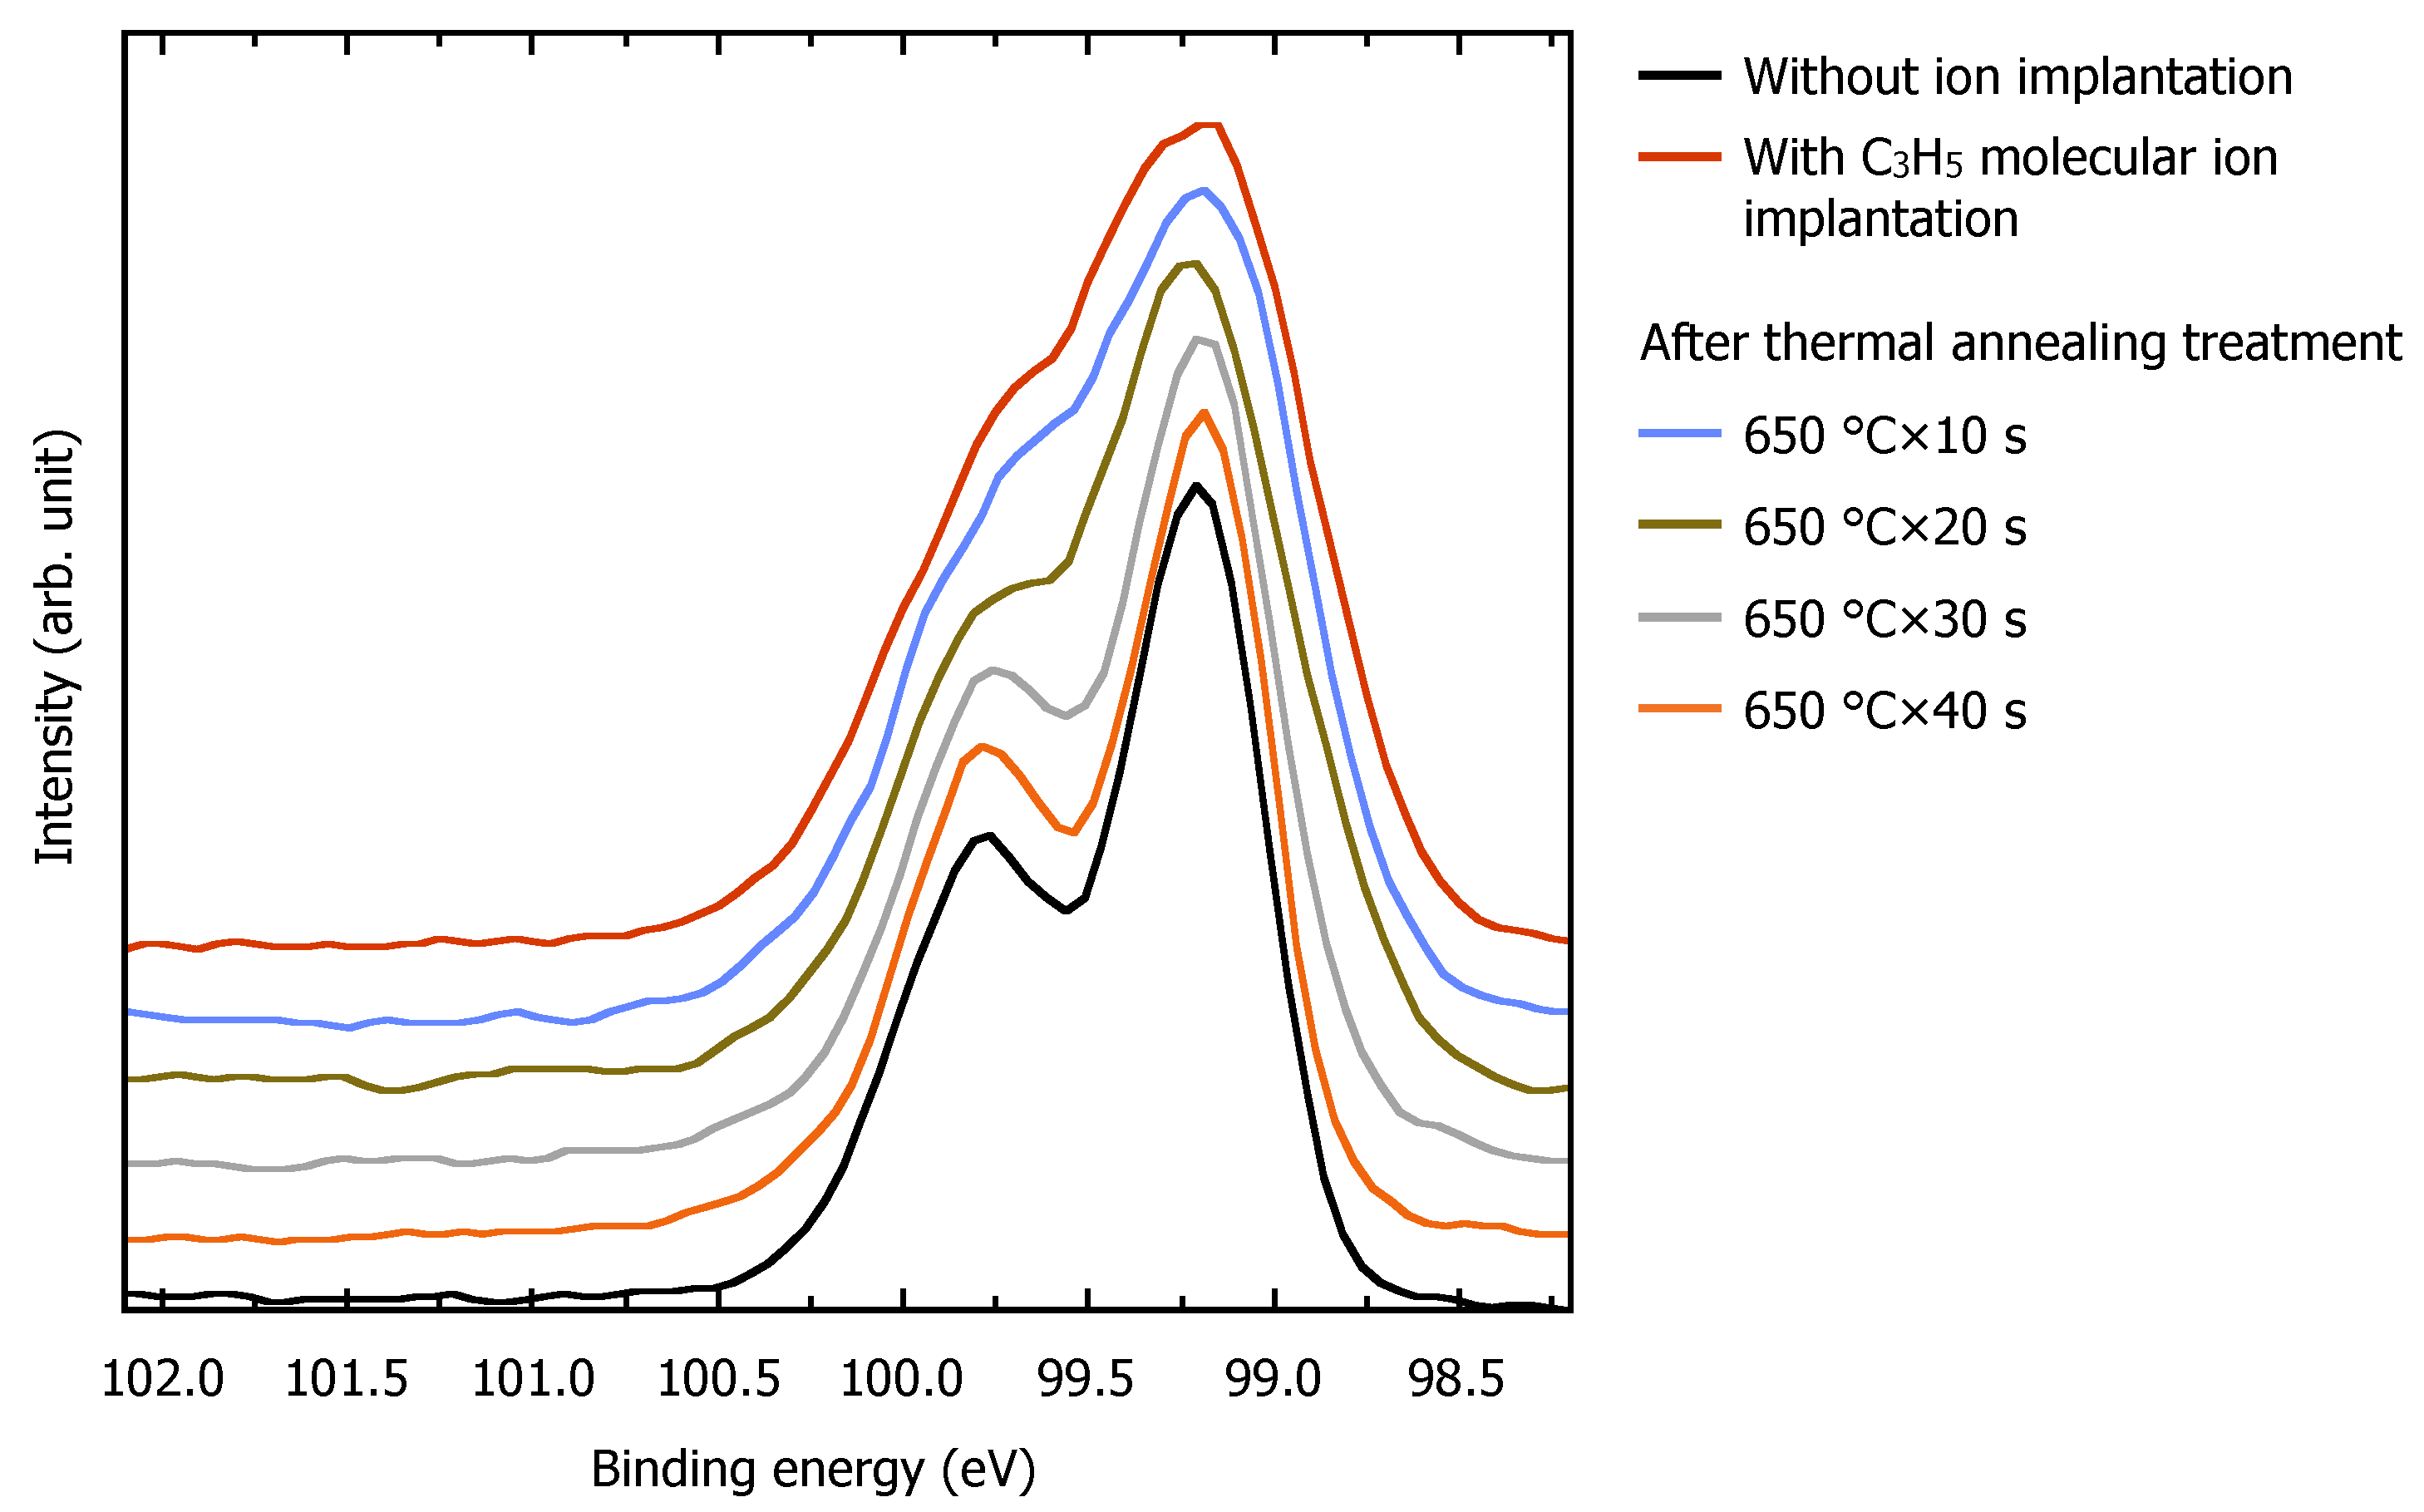
Here, we evaluate by XPS analysis the surface recrystallization behavior of the fully amorphized C3H5-molecular-ion-implanted Si substrate after the thermal annealing treatment. Figure 6 shows the binding energy of Si 2p spectra of the Si substrate surface without ion implantation, with C3H5 molecular ion implantation, and after thermal annealing treatments at 650 °C for 10 s, 20 s, 30 s, and 40 s. All spectra were smoothed by 3-point Savitzky–Golay filtering [41], and inelastic background was removed by the Proctor–Sherwood–Shirley method [42]. In the Si 2p spectrum of the Si substrate surface without ion implantation, the Si 2p1/2 and 2p3/2 peaks are observed at 99.8 eV and 99.2 eV clearly, which indicates a Si single-crystal structure in the Si substrate surface. Conversely, in the Si 2p spectrum of the Si substrate surface with C3H5 molecular ion implantation, the peaks of Si 2p1/2 and 2p3/2 completely broaden, and the doublet is no longer observed, which means the formation of a fully amorphous layer in the Si substrate surface. Then, as shown in Si 2p spectra after thermal annealing treatments at 650 °C for 10 s, 20 s, 30 s, and 40 s, we can observe the gradual recovery of the peaks of Si 2p1/2 and 2p3/2 with increasing the thermal annealing time. Finally, after the thermal annealing treatment at 650 °C for 40 s, the Si 2p spectrum of the C3H5-molecular-ion-implanted Si substrate surface is almost the same as that of the Si substrate without ion implantation. In addition, as Si suboxides, it is known that the peaks of Si1+, Si2+, Si3+, and Si4+ originating from the surface oxide film of Si substrate occur at a binding energy of 1.15 eV, 1.81 eV, 2.59 eV, and 3.48 eV from the peak of the Si 2p3/2 at 99.2 eV [43]. However, as mentioned in the experimental procedure, a native oxide film was removed by hydrofluoric acid immediately before placing the sample in the vacuum chamber of the XPS equipment, and as shown in Figure 6, the peaks of Si1+, Si2+, Si3+, and Si4+ are not observed near the Si 2p spectra. In the Si 2p spectra obtained from the C3H5-molecular-ion-implanted Si substrate surface after the thermal annealing treatment, it is also confirmed that no extra peak originated from Si carbide, which is formed at 101.8 eV [44].
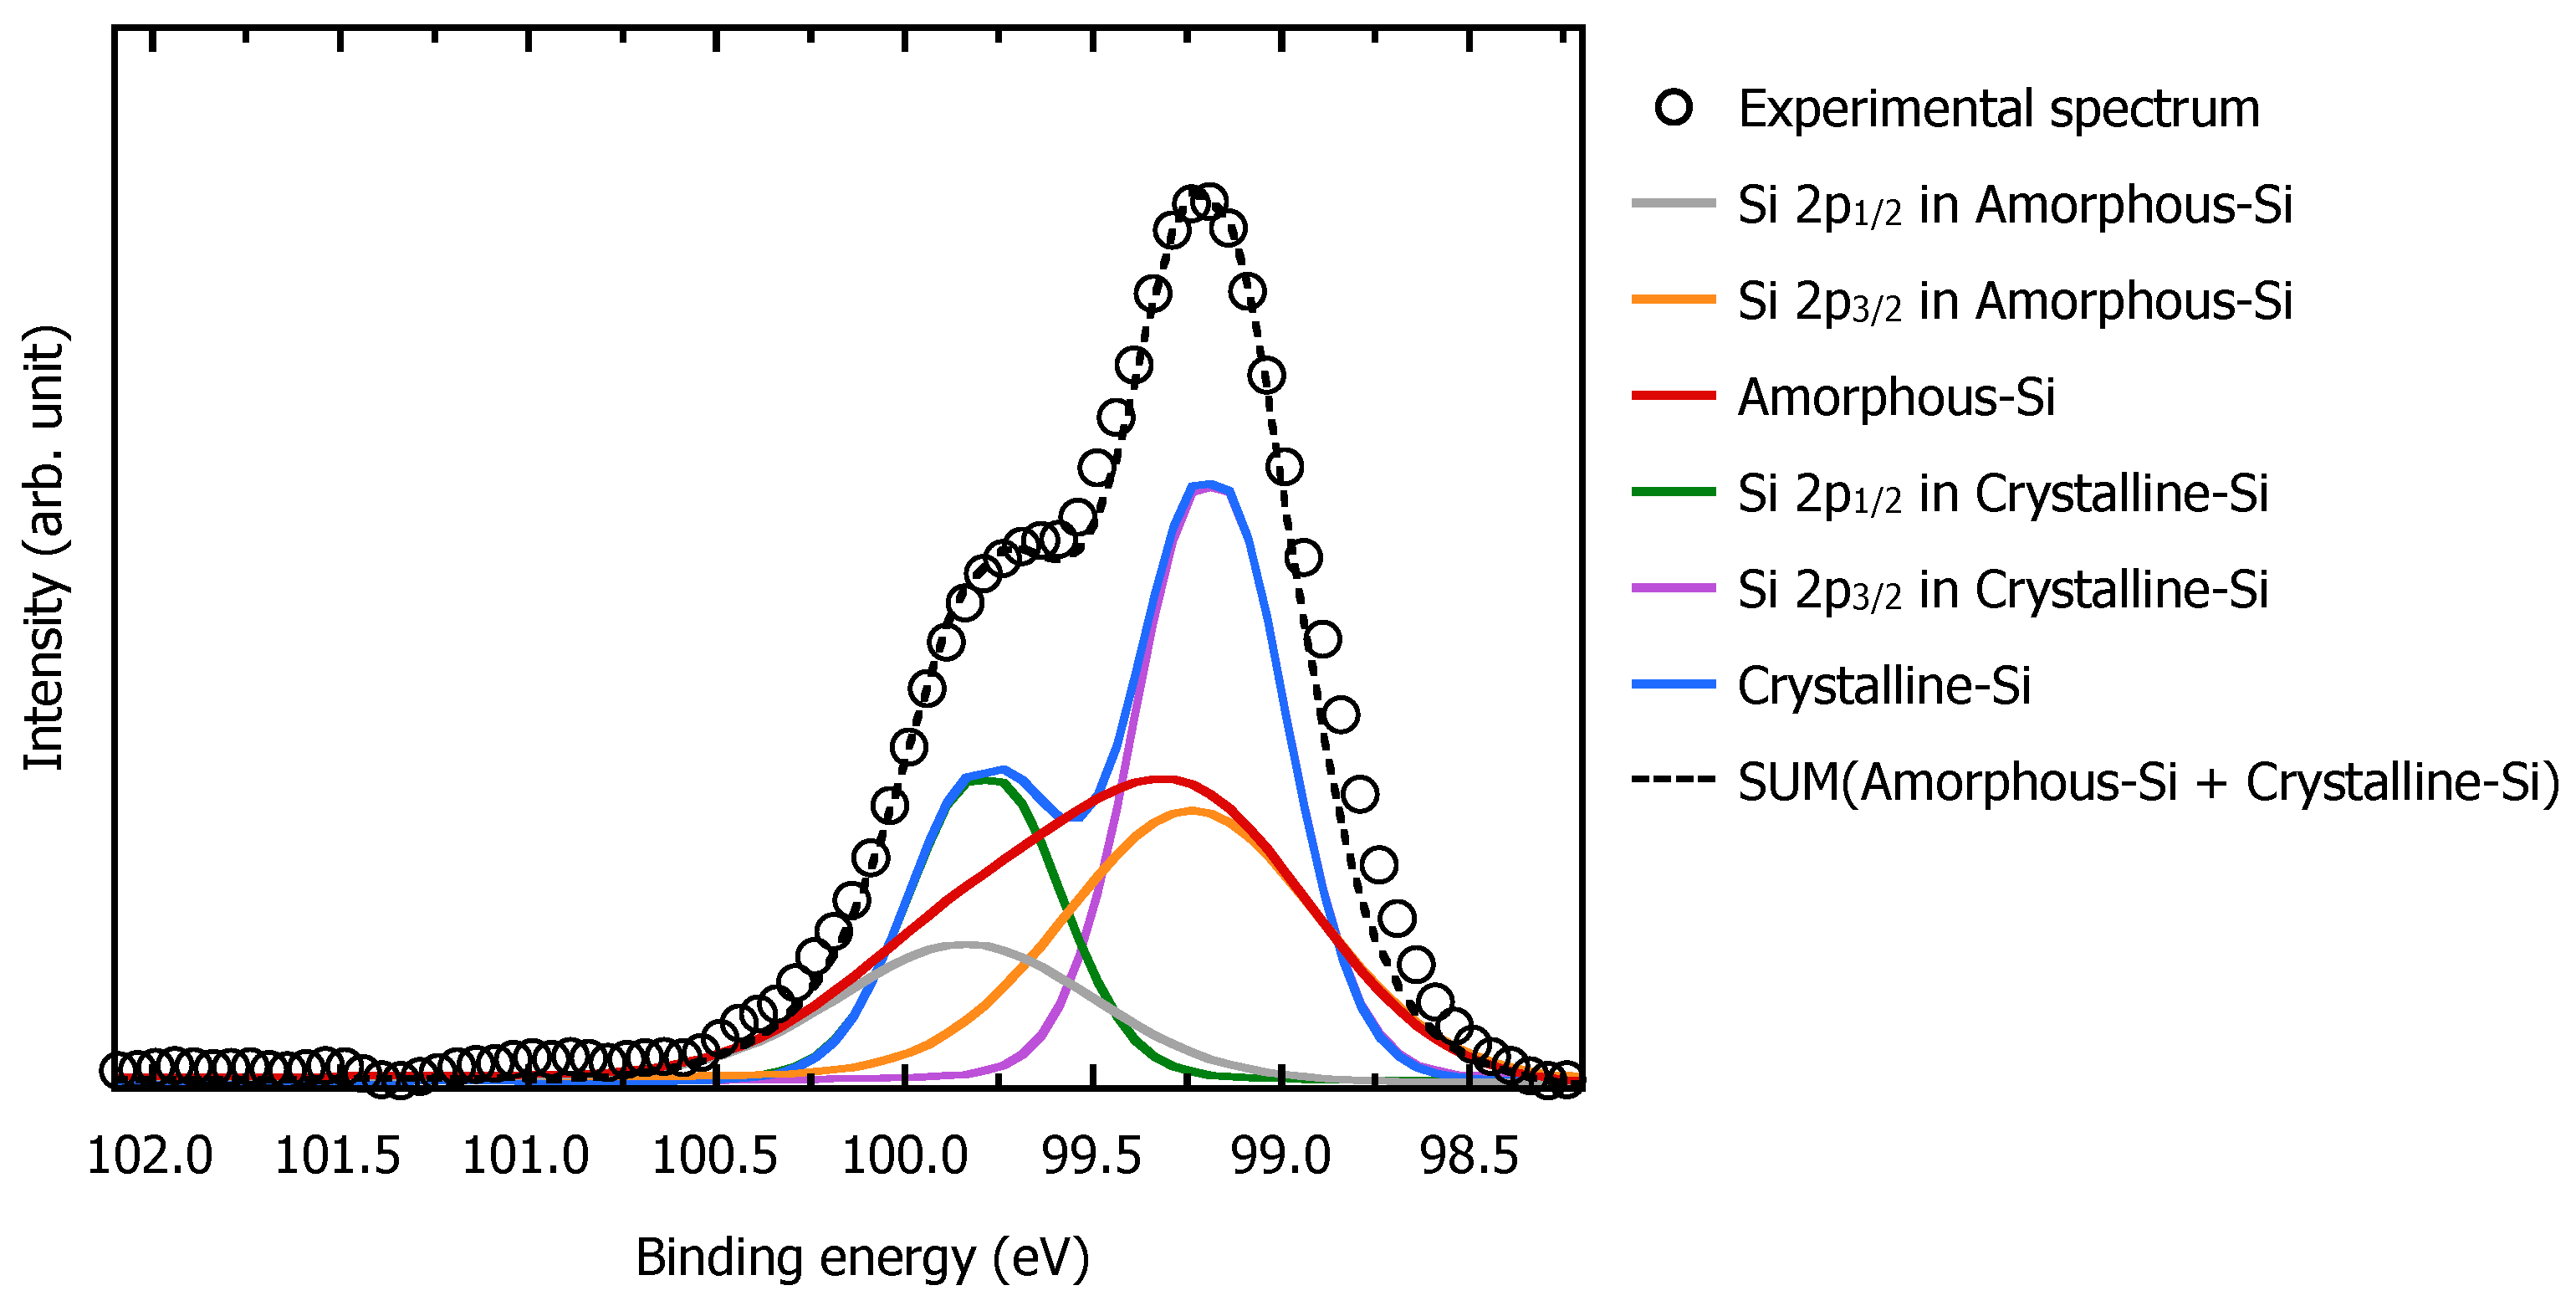
Furthermore, the crystalline fraction of the Si substrate surface is quantitatively derived from these binding energies of Si 2p spectra using ideal amorphous-Si and crystalline-Si spectra [45,46]. We performed curve fitting to minimize the difference between the sum of the ideal amorphous-Si and crystalline-Si spectra and the experimental spectrum as shown in Figure 7. Then, the crystalline fraction X t of the Si substrate surface is determined as
X t = I C r y s t a l l i n e I S U M A m o r p h o u s + C r y s t a l l i n e ,
where I C r y s t a l l i n e is the integral of the ideal crystalline-Si spectrum and I S U M A m o r p h o u s + C r y s t a l l i n e is the integral of the sum of the ideal amorphous-Si and crystalline-Si spectra, as shown by the blue and dotted black line in Figure 7, respectively. In the ideal crystalline-Si spectrum, the Si 2p1/2 and Si 2p3/2 peaks are located at binding energy of 99.8 eV and 99.2 eV, respectively, and represented as Voigt function consisting of a Gaussian function with a full width at half maximum (FWHM) of 0.43 eV and a Lorentzian function with a FWHM of 0.10 eV. The intensity ratio of the Si 2p1/2 and Si 2p3/2 peaks in the ideal crystalline-Si spectrum is fixed at 1:2. The intensity of the ideal crystalline-Si spectrum is used as a fitting parameter. On the other hand, in the ideal amorphous-Si spectrum, the Si 2p1/2 and Si 2p3/2 peaks are represented as a Gaussian function with a FWHM of 0.62 eV. The intensity ratio of the Si 2p1/2 and Si 2p3/2 peaks in the ideal amorphous-Si spectrum is also fixed at 1:2 and the splitting width is set at 0.6 eV. The intensity and binding energy of the ideal amorphous-Si spectrum are used as fitting parameters. We conducted the curve fitting of all Si 2p spectra of the C3H5-molecular-ion-implanted Si substrate surface after thermal annealing treatments at 613 °C, 625 °C, 638 °C, and 650 °C for 5–200 s and obtained the changes in the crystalline fraction.
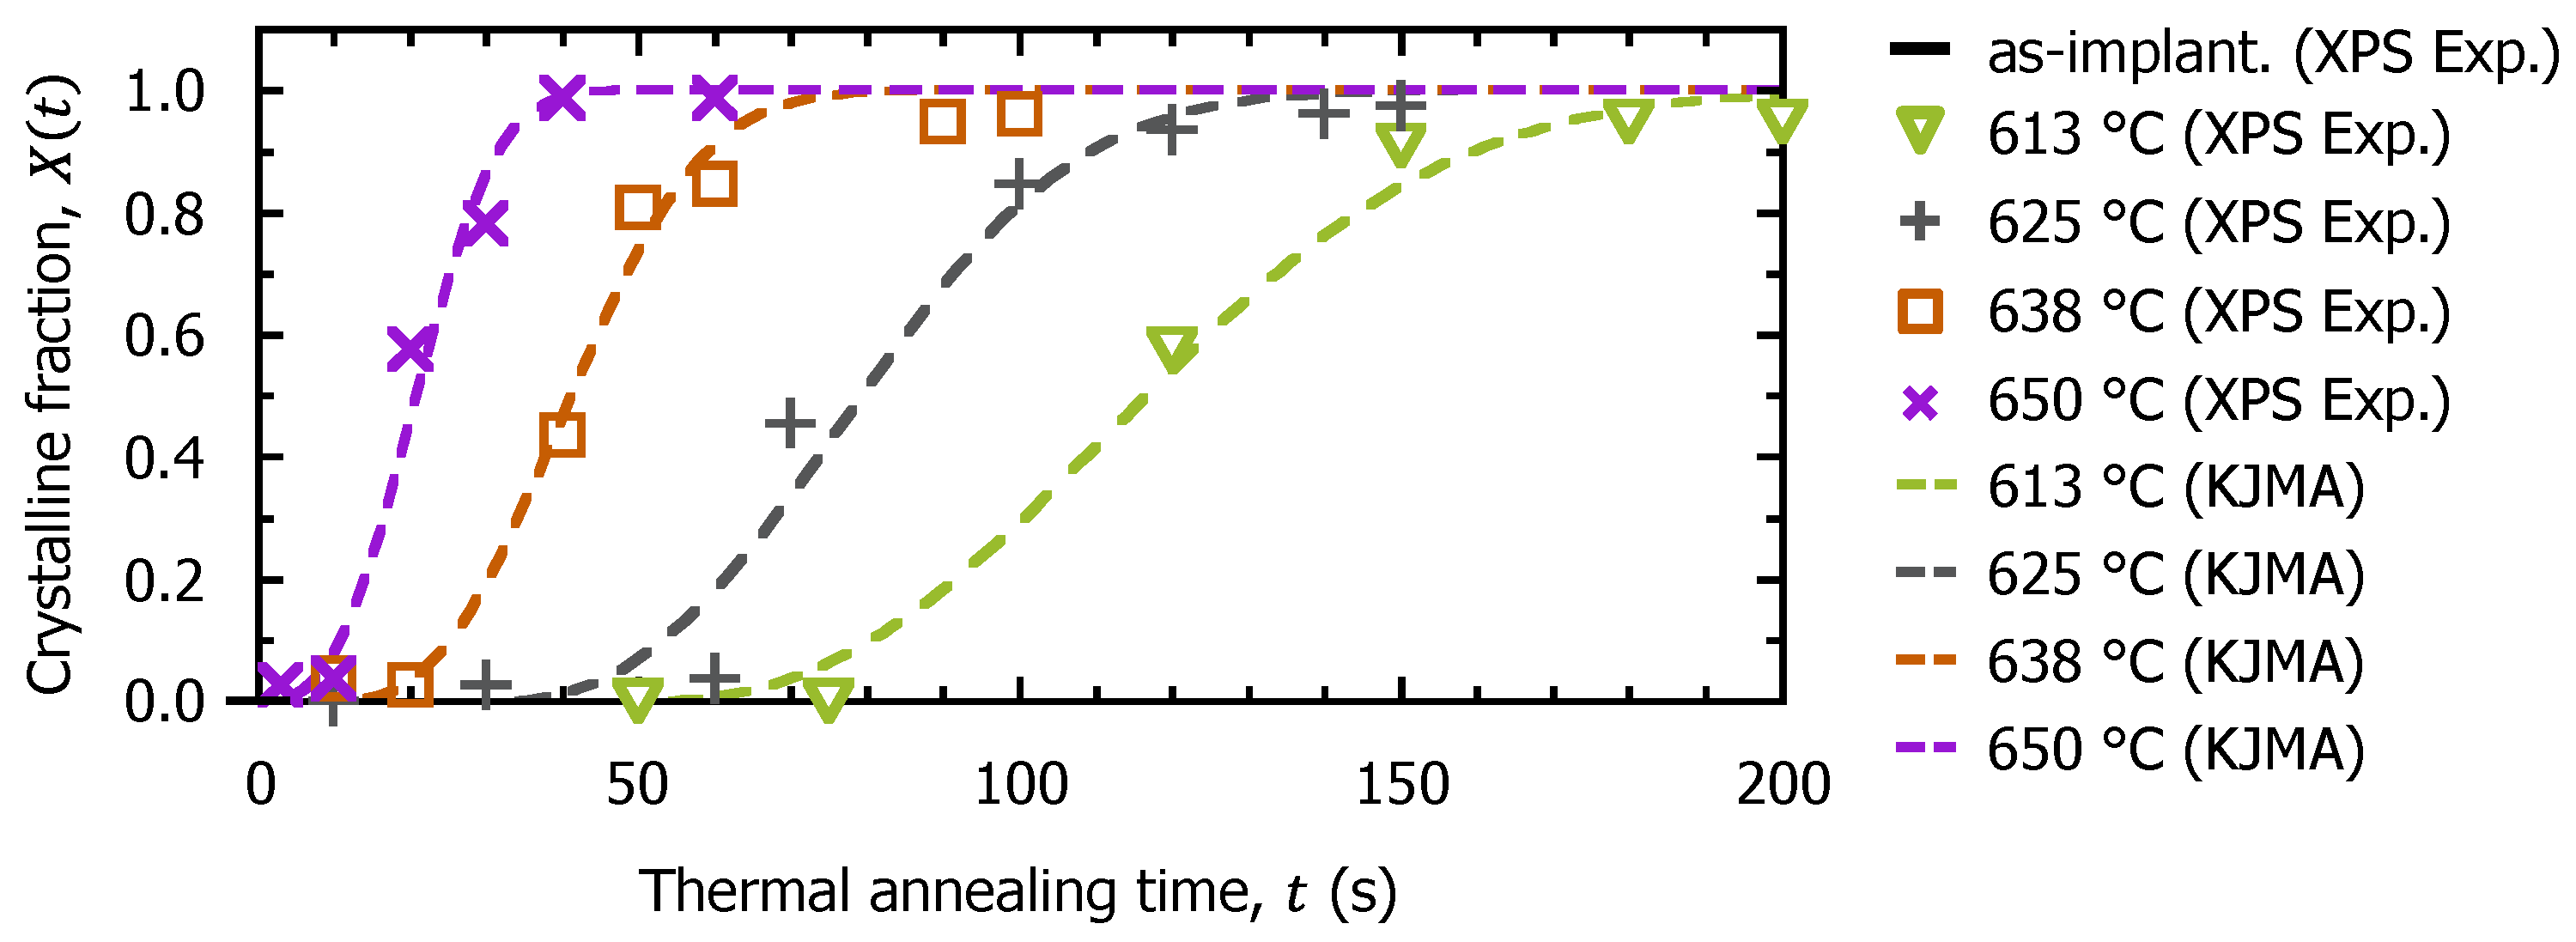
As a result of the analysis of binding energy of 2p spectra, we show in Figure 8 the changes in the crystalline fraction of the fully amorphized C3H5-molecular-ion-implanted Si substrate surface after thermal annealing treatments at 613 °C, 625 °C, 638 °C, and 650 °C. The crystalline fraction of the Si substrate surface is approximately 0 after C3H5 molecular ion implantation. Then, as the thermal annealing time increases, the fully amorphized C3H5-moelcular-ion-implanted Si substrate surface recrystallizes gradually with a sigmoidal curve to a perfect crystal. It is also seen in Figure 8 that the slope of the sigmoidal curve increases with the thermal annealing temperature. We interpret the sigmoidal curve of the changes in the crystalline fraction of the fully amorphized C3H5-molecular-ion-implanted Si substrate after thermal annealing treatments as a type of phase transformation phenomenon. Then, we analyze the transition from the amorphous to the crystalline phase on the basis of the KJMA theory. The change in the crystalline fraction X t in the KJMA equation is expressed as
X t = 1 e x p K s u r f t n ,
where K s u r f is the combined value of the crystalline nucleation rate from amorphous regions and recrystallization rates from the nucleated crystalline embryo. However, in amorphous Si formed by ion implantation or deposition, the activation energy for random nucleation and growth is estimated to be 5.1 eV [47], so it does not compete with SPE, which has an activation energy of 2.70 eV, unless high-temperature thermal annealing (>1330 °C) occurs [48]. Then, in this experiment, because the thermal annealing temperature is low (<650 °C) and a crystalline template is located under the amorphous layer, recrystallization via SPE absolutely dominates. Therefore, in this situation, K s u r f is treated as a parameter of the recrystallization rate of the Si substrate surface, and activation energy is obtained from the Arrhenius plot. Furthermore, n is called the Avrami index, which can be used to estimate the dimensions of recrystallization. When n is between 1 and 2, recrystallization can be assumed to be a one-dimensional wire-like growth from a certain crystalline region. It is also considered that the recrystallization is two-dimensional like island growth when n is between 2 and 3. Moreover, when n is between 3 and 4, the recrystallization behavior is implied to be three-dimensional growth including not only horizontal but also vertical movement. As shown in Figure 8, the dotted lines are fitting curves of the KJMA equation for the change in crystalline fraction at each thermal annealing temperature, from that the parameter K s u r f and n are derived. Figure 9 shows the Avrami index at each thermal annealing temperature and the Arrhenius plot for recrystallization as the results of analysis using the KJMA equation. In Figure 9, the Avrami index n is between 2 and 3 at all thermal annealing temperatures, which suggests that recrystallization proceeds two-dimensionally on the fully amorphized C3H5-molecular-ion-implanted Si substrate surface. In addition, from the Arrhenius plot for the recrystallization rate, the activation energy for surface recrystallization is derived to be 2.71 ± 0.28 eV, which is approximately the same as that for the recrystallization in the Si substrate without any impurities [13]. Since there is almost no effect of impurities on the Si substrate surface, the activation energy of surface recrystallization is considered close to that of an intrinsic amorphized Si crystal.
In the above sections, we observed the recrystallization behavior of a fully amorphous layer in C3H5-molecular-ion-implanted Si substrate by cross-sectional TEM and evaluated the change in the crystalline fraction in the surface by Si 2p spectrum analysis by XPS; however, there are some unclear phenomena from these experimental approaches. Firstly, the cross-sectional TEM observations in Section 3.1 suggest that high-concentration carbon causes a partial delay of the a/c interface, but this is difficult to demonstrate experimentally. Secondly, in the XPS analysis in Section 3.2, after the rough a/c interface progresses toward the surface, the change in the crystalline fraction is discussed based on the KJMA equation. The Avrami index suggests that surface recrystallization is a two-dimensional reaction; however, the overall image is not clear. Therefore, in the next section, we apply TCAD process simulation to verify these phenomena that are difficult to observe experimentally. Specifically, we indicate the partial delay of the a/c interface due to high-concentration carbon in the fully amorphized C3H5-molecular-ion-implanted Si substrate by simulation of SPEG using LKMC. In addition, we show a TCAD simulation model to demonstrate the overall image of the recrystallization behavior from the insider to the surface of fully amorphized C3H5-moleuclar-ion-implanted Si substrate and clarify the two-dimensional behavior of the surface.

3.3. TCAD Process Simulation of Recrystallization of Fully Amorphized C3H5-Molecular-Ion-Implanted Si Substrate

TCAD process simulation is used to describe the recrystallization behavior of the fully amorphized C3H5-molecular-ion-implanted Si substrate. First, we confirm the accuracy of the TCAD simulation model after C3H5 molecular ion implantation. Subsequently, the experimentally obtained activation energy for the recrystallization is incorporated, and we simulate the recrystallization of the C3H5-molecular-ion-implanted Si substrate.
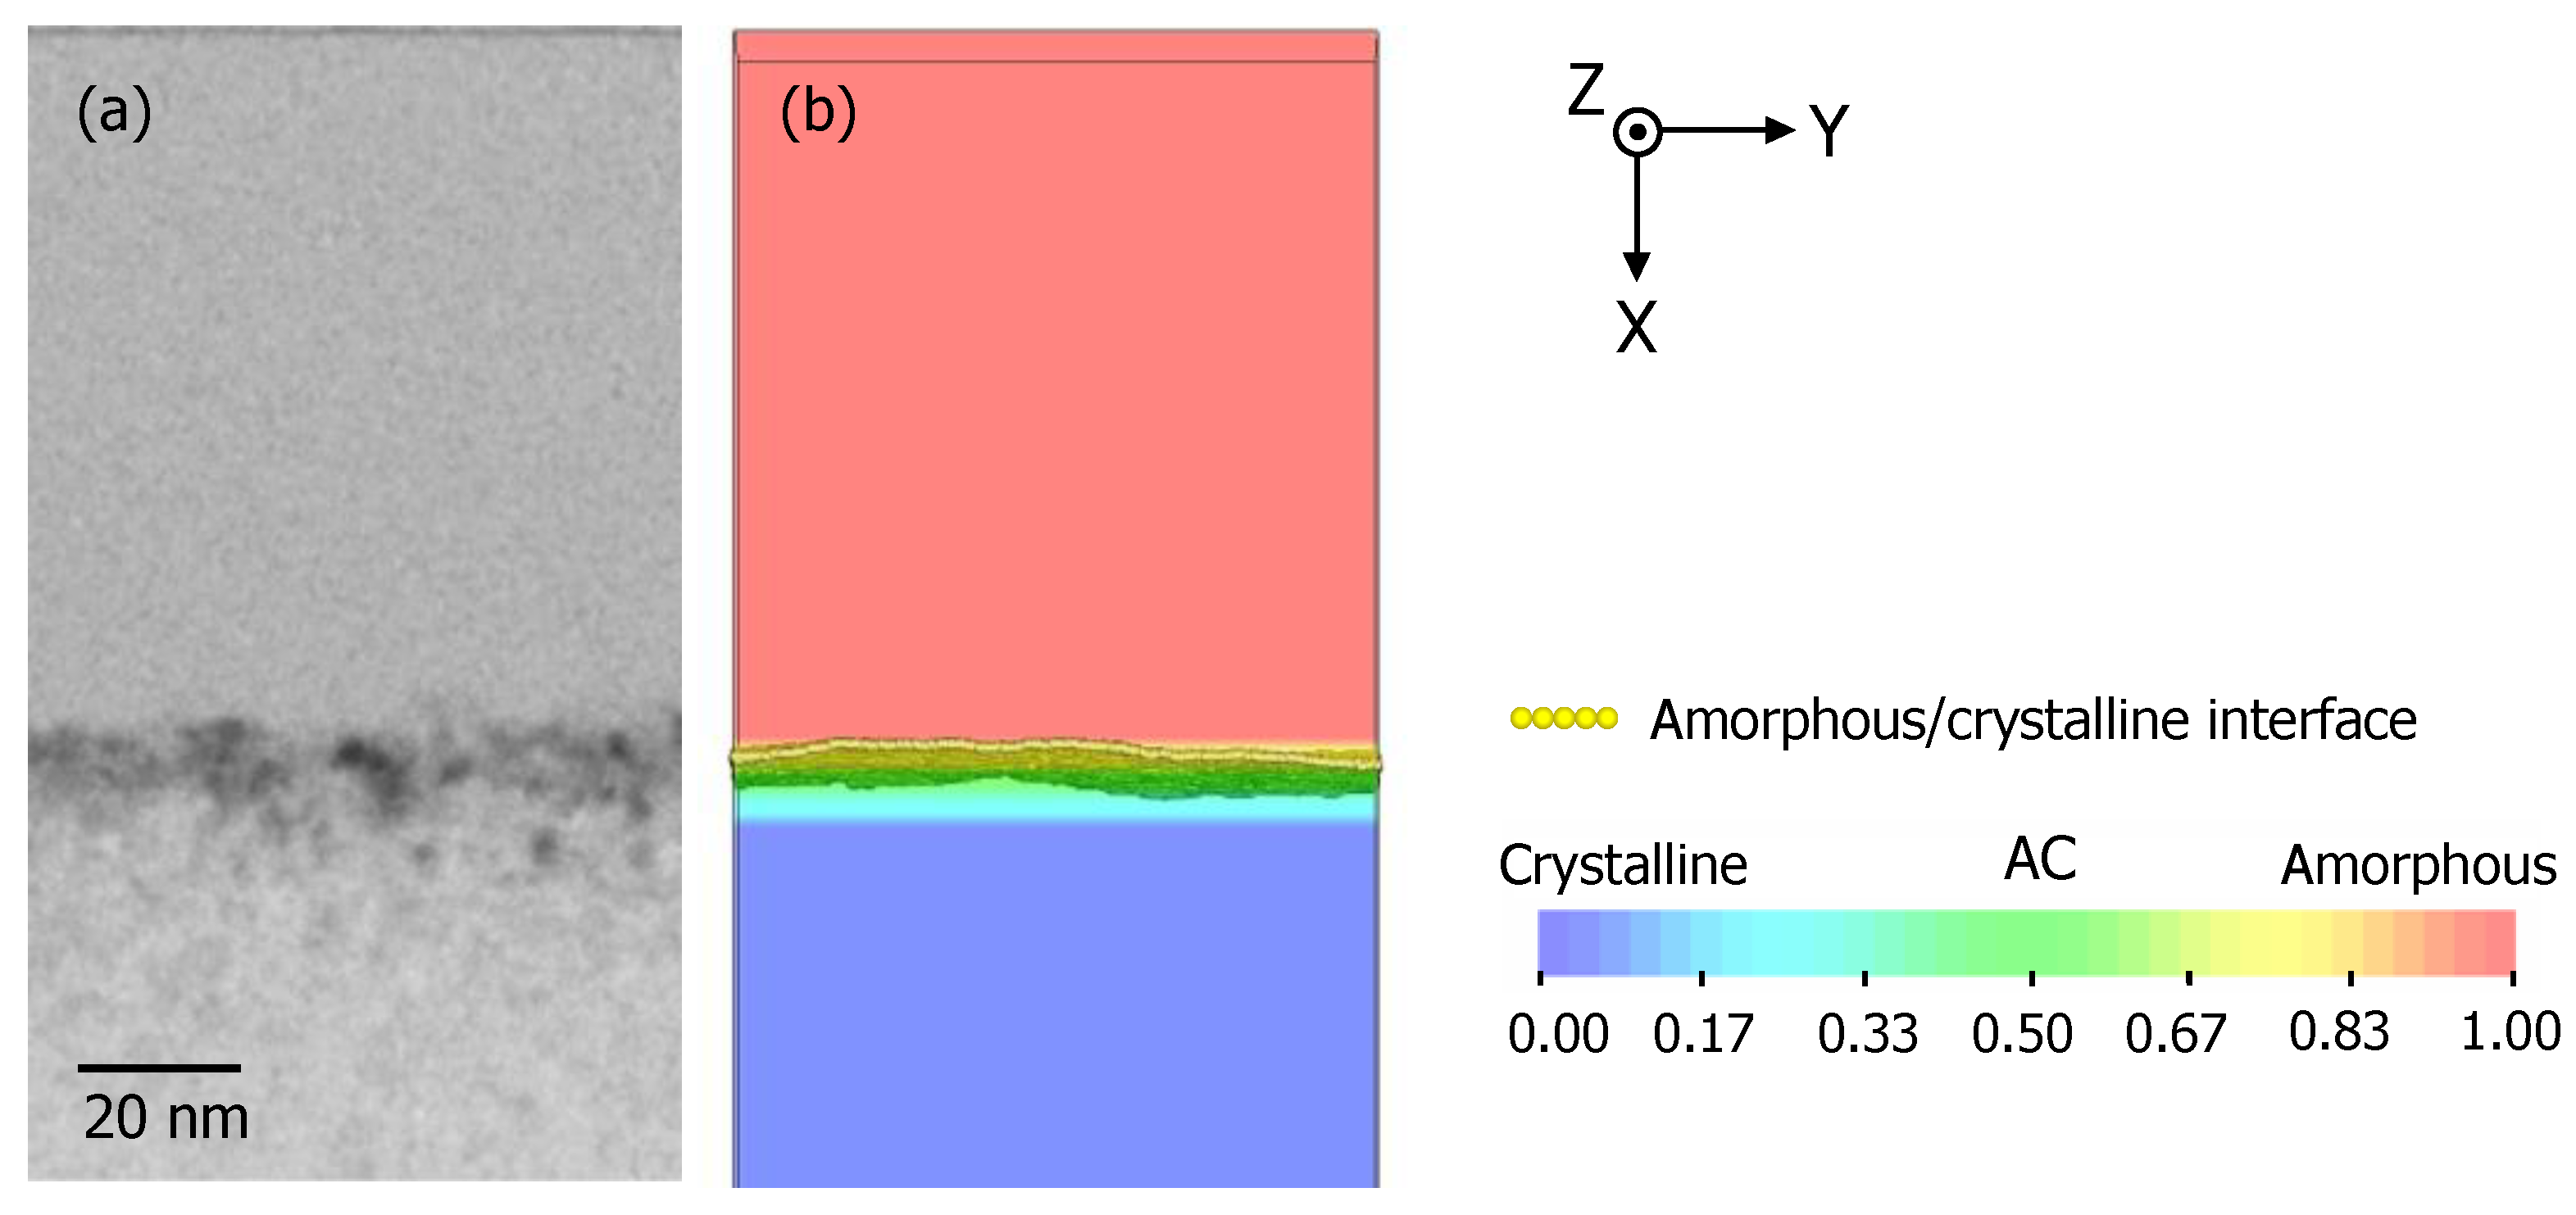
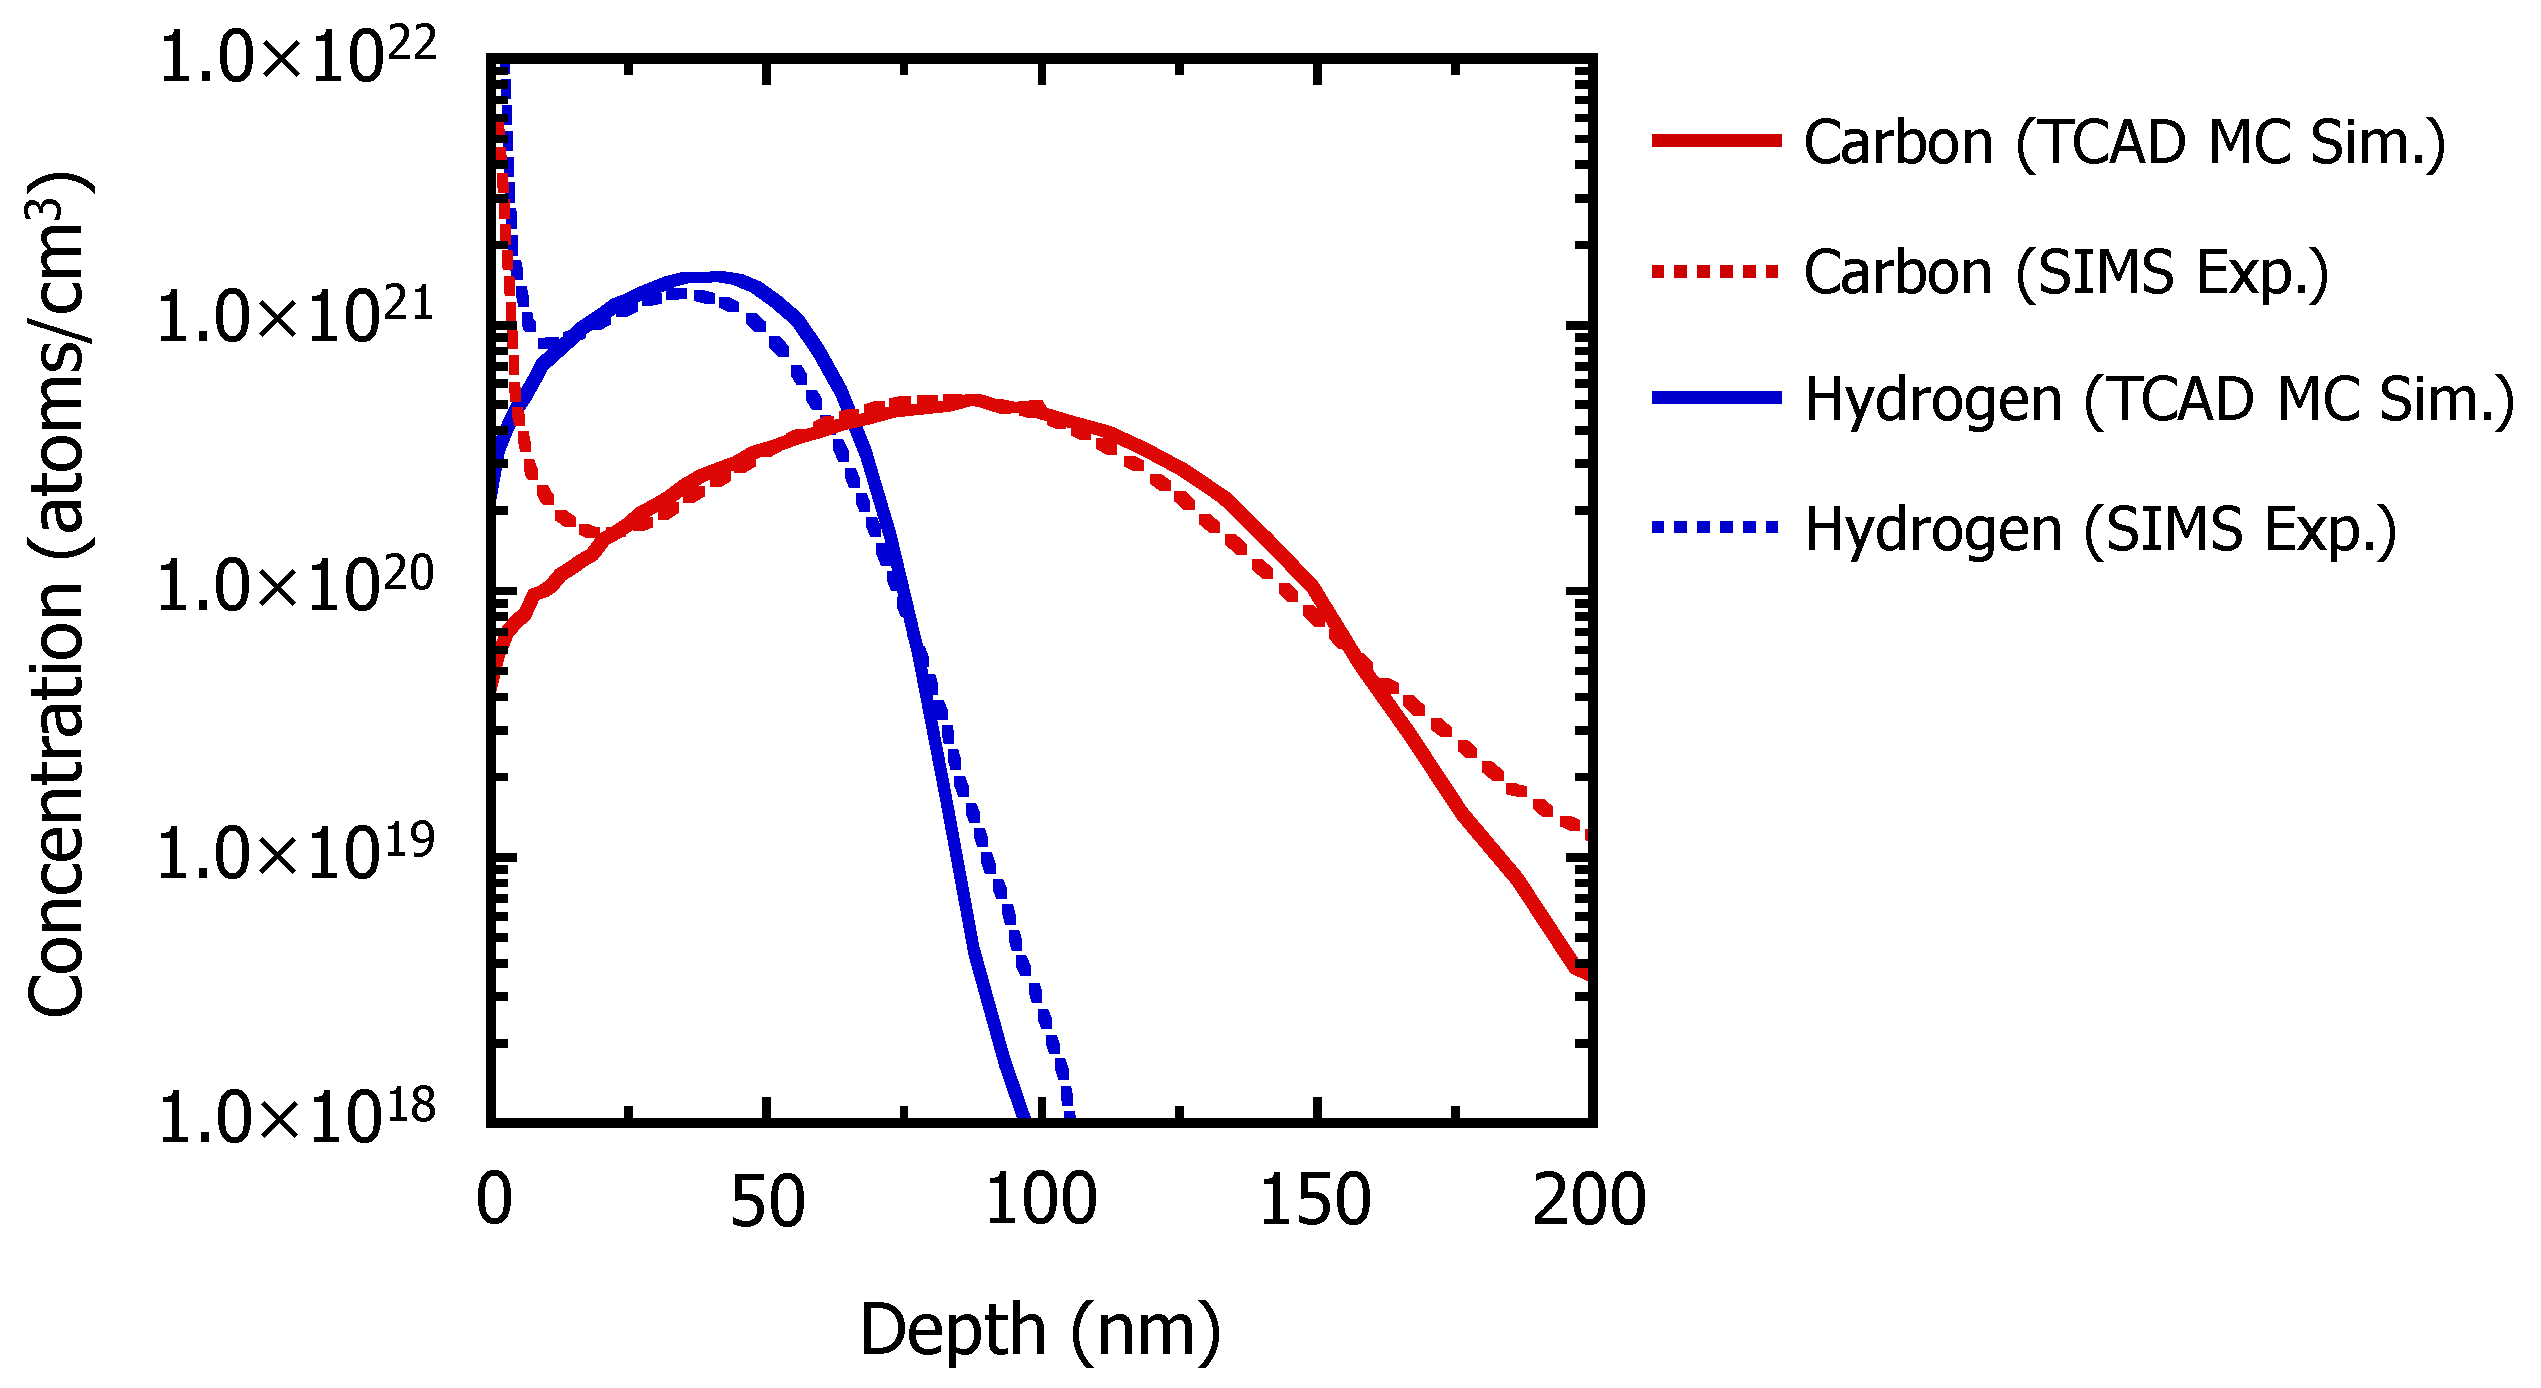
In Figure 10, we compare the experimental cross-sectional TEM image of the Si substrate and the TCAD simulation model after C3H5 molecular ion implantation at a dose of 1.67 × 10¹⁵ ions/cm2. In the TCAD simulation model, the amorphous-crystalline parameter A C is represented by red to blue contours and the a/c interface is expressed as a plane consisting of small yellow spheres. The TCAD simulation model show that no residual crystalline region remains on the surface, similar to the cross-sectional TEM image. In the cross-sectional TEM image, the amorphous layer is 90 nm thick, whereas in the TCAD simulation model, the surface is amorphized to a thickness of 92 nm. Figure 11 shows a comparison between the results of the SIMS analysis and MC ion implantation simulation of the depth profiles of carbon and hydrogen concentrations after C3H5 molecular ion implantation. It is confirmed that the depth profiles of carbon and hydrogen concentrations are consistent between the experimental SIMS analysis and MC ion implantation simulation results. In addition, in the carbon and hydrogen concentration profiles calculated by MC ion implantation simulation, there is no pile-up of carbon and hydrogen near the Si substrate surface. As shown in Figure 3, the depth profile of carbon concentration does not change after thermal annealing treatment, so the recrystallization behavior under the effect of high-concentration carbon can be calculated.
Then, we incorporate the recrystallization rate depending on the carbon concentration to simulate recrystallization in the presence of carbon. We derive the calculated recrystallization activation energy E a C a r b o n , m a x when the imaginary carbon is included at a concentration of 5.0 × 10²² atoms/cm3, which is the same as that of Si atoms. The relationship between the carbon concentration and the activation energy for recrystallization is described as
E a C a r b o n E a = E a C a r b o n , m a x E a C C a r b o n C S i ,
where E a C a r b o n is the experimentally obtained activation energy for recrystallization in the presence of carbon, which is 2.79 eV as shown in Section 3.1, and C C a r b o n is the carbon concentration in this situation, which is 4.8 × 10²⁰ atoms/cm3. In addition, E a is the activation energy for recrystallization in the absence of impurities as reported previously, which is 2.70 eV [13]. Furthermore, the Si concentration C S i is set as 5.0 × 10²² atoms/cm3. As a result, the calculated recrystallization activation energy E a C a r b o n , m a x is derived as 12.0 eV, as shown in Figure 12.
Then, the effect of carbon concentration for the activation energy on recrystallization is expressed as
c = E a C a r b o n , m a x E a C C a r b o n C S i .
Equation (7) is introduced into Equation (2) as the parameter of the effect of carbon concentration on the recrystallization rate. Figure 13 shows the changes in the thickness of the amorphous layer formed in the simulation model after thermal annealing treatments at 613 °C, 625 °C, 638 °C, and 650 °C. It is confirmed that the changes in the thickness of the amorphous layer of the TCAD simulation model correspond to those in TEM observations in the experiment. The simulation results also show that the recrystallization rate decreases at depths from 90–50 nm where the carbon concentration is approximately 4.8 × 10²⁰ atoms/cm3, as in the experiment.
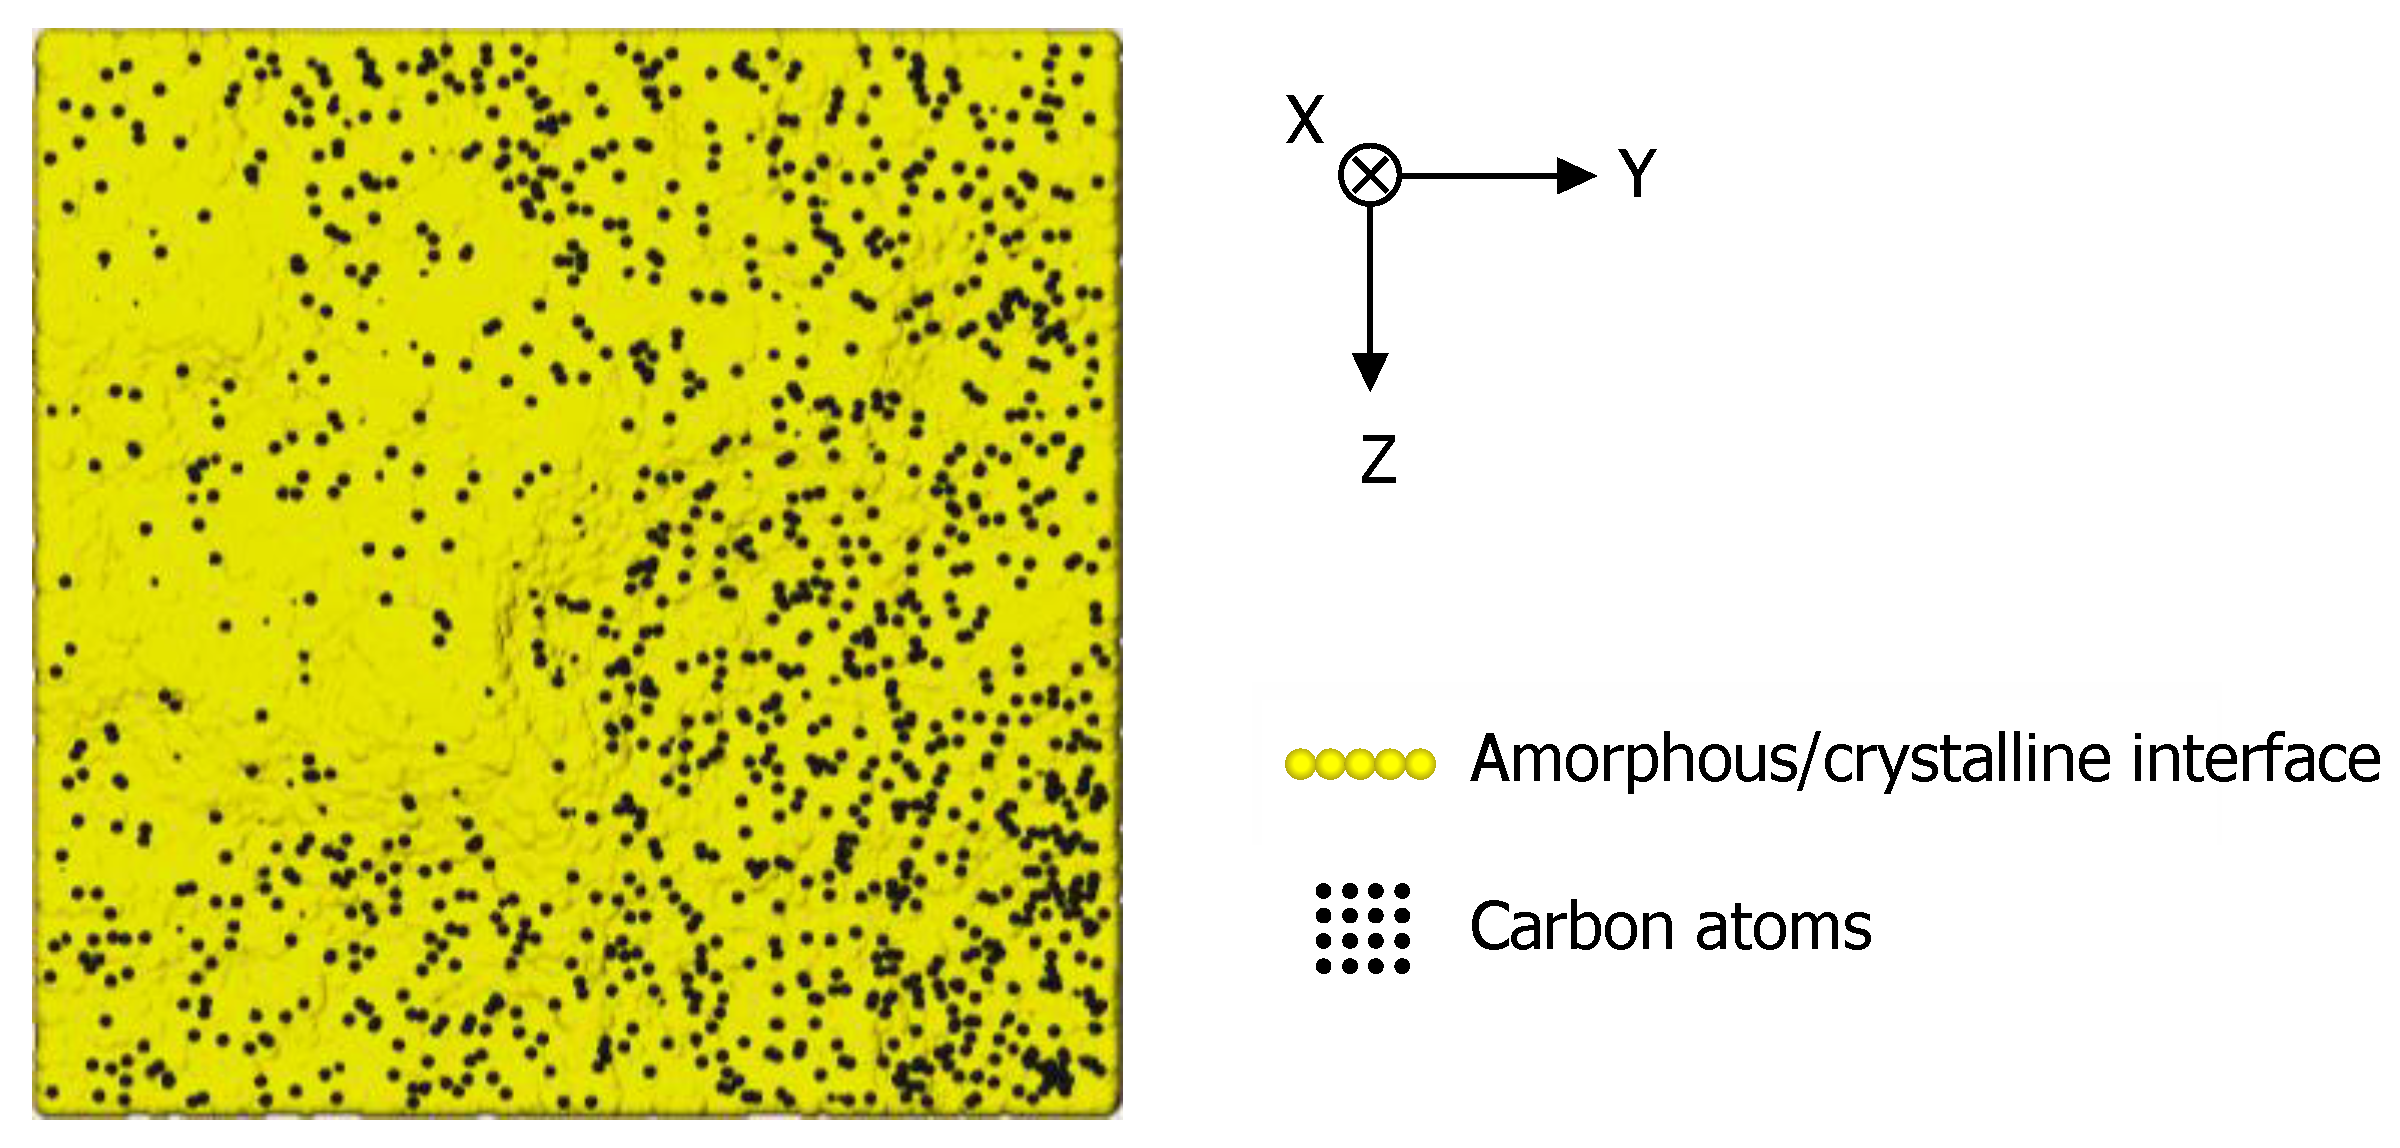
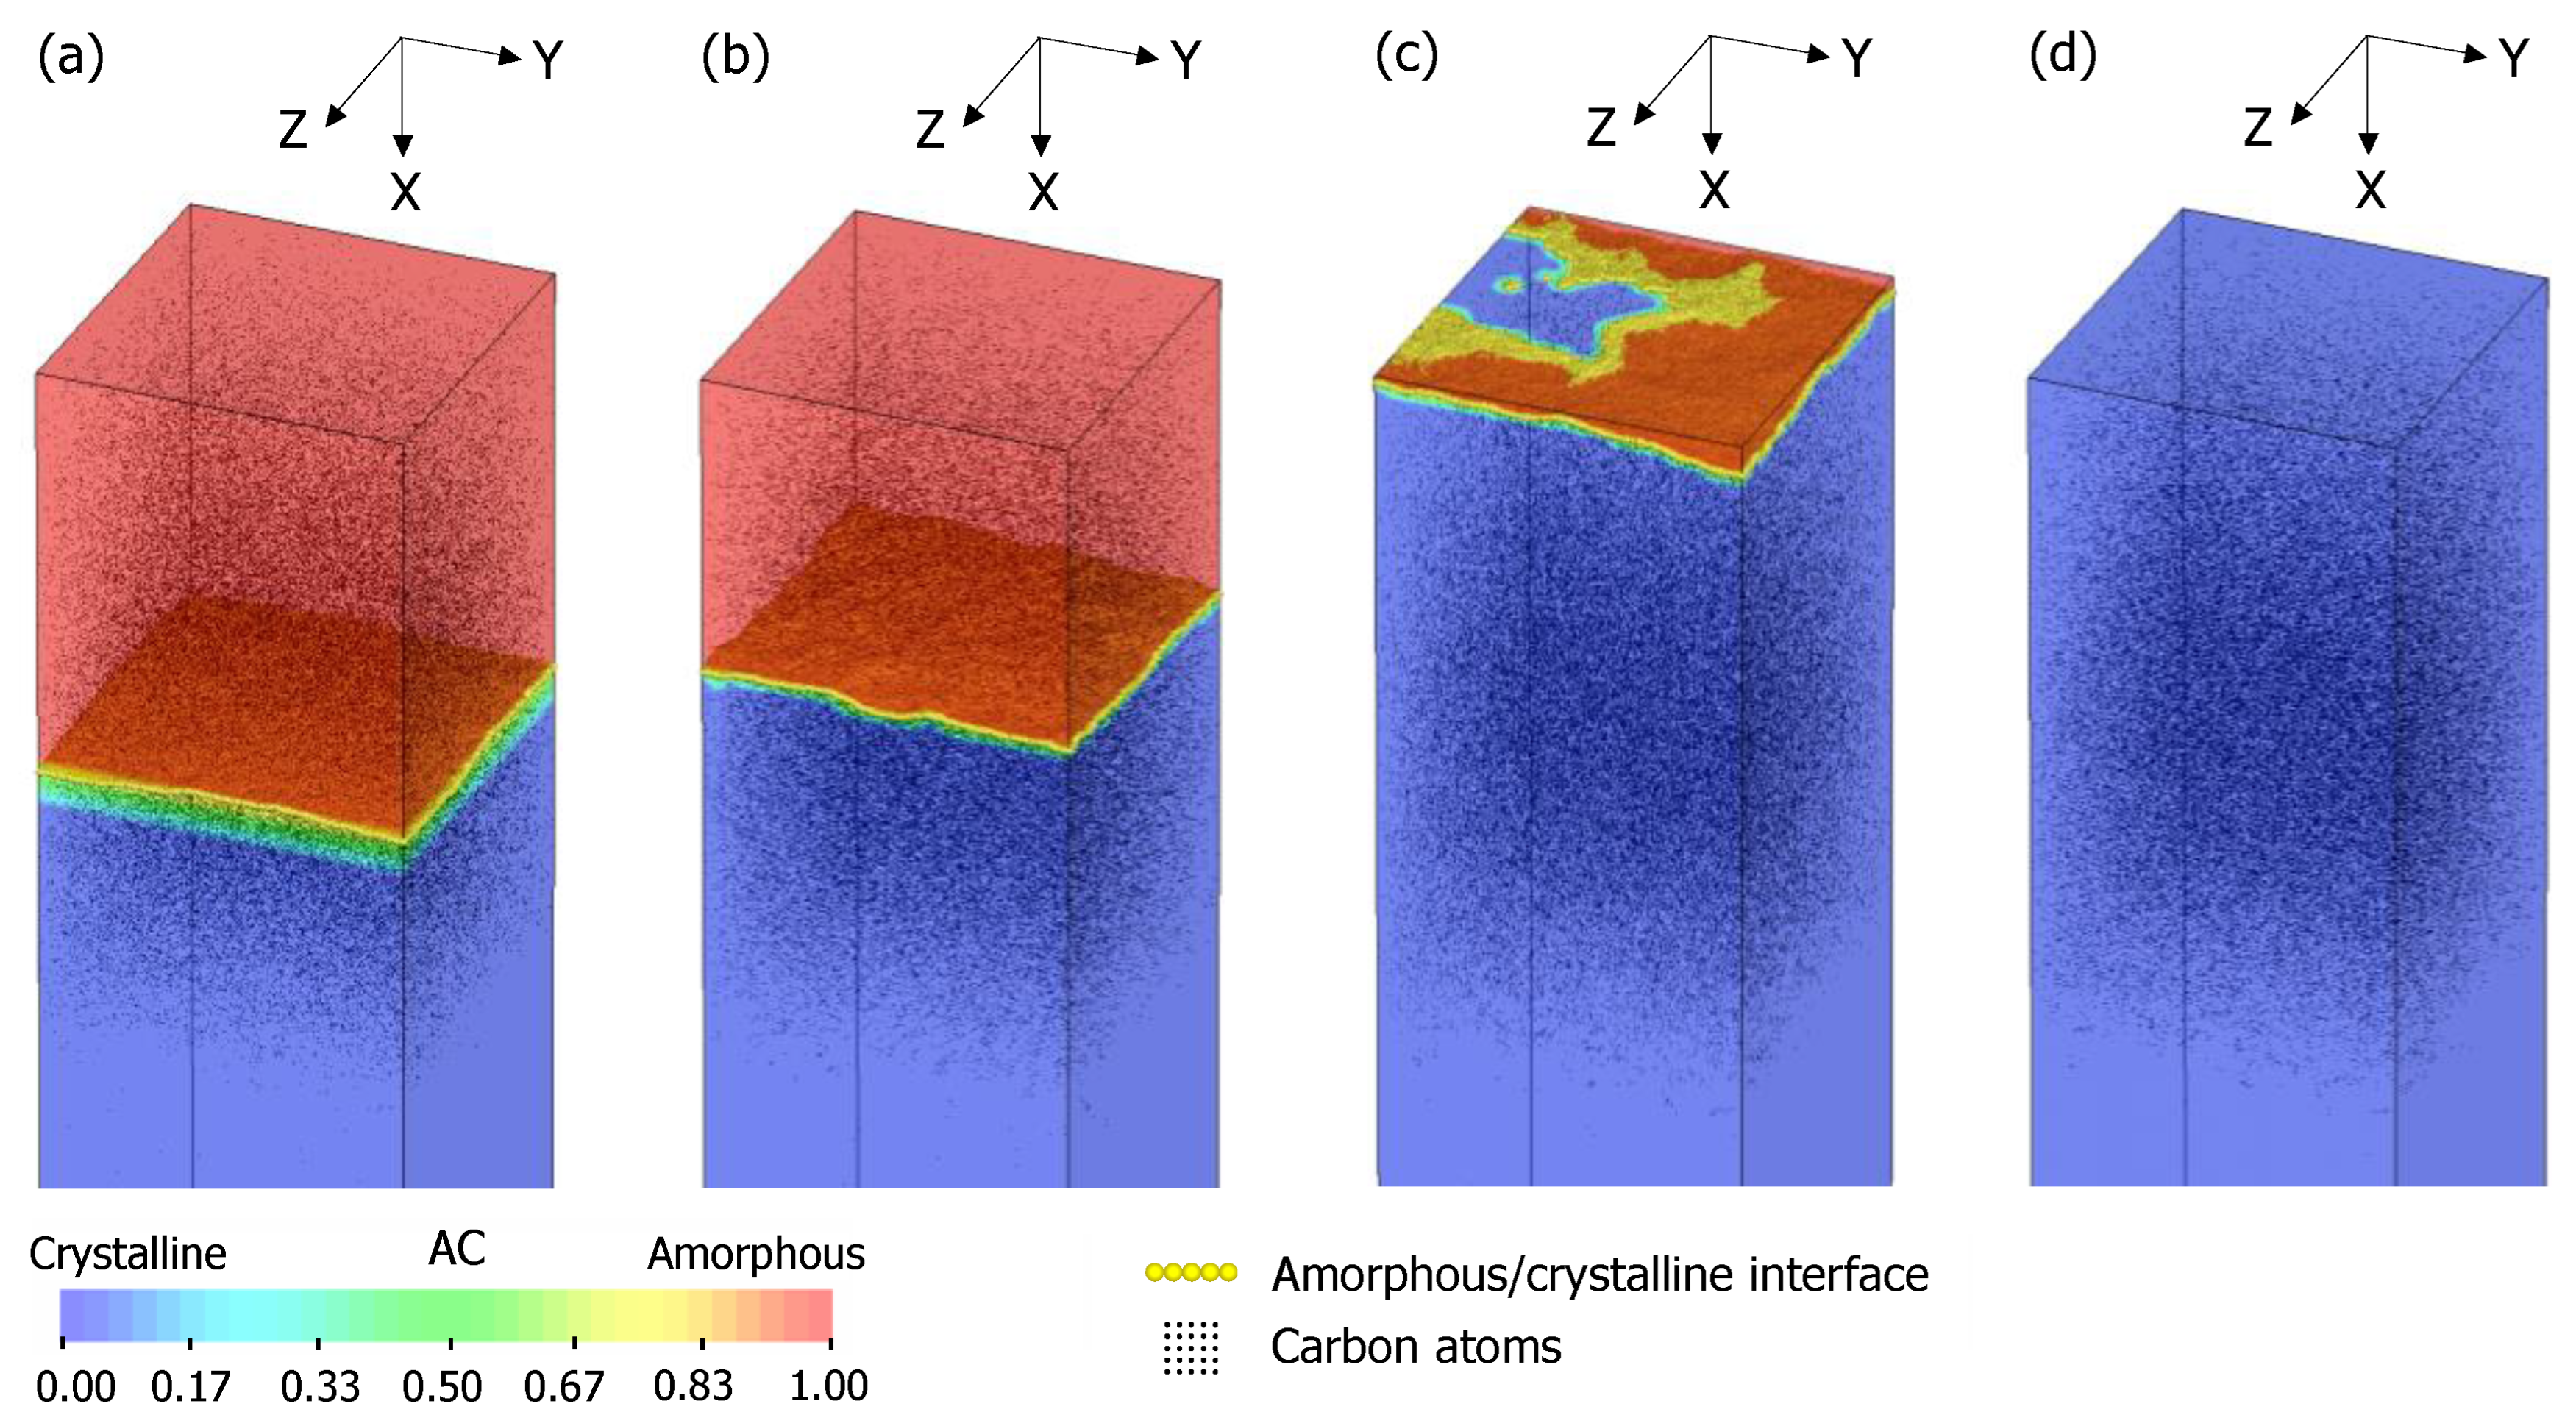
Figure 14 shows the distribution of carbon atoms at the a/c interface after the thermal annealing treatment at 650 °C for 25 s. At the a/c interface, carbon atoms are not distributed uniformly, and there are some areas of high and low carbon concentrations. In addition, Figure 15 shows the simulation models after C3H5 molecular ion implantation at a dose of 1.67 × 10¹⁵ ions/cm2 and thermal annealing treatments at 650 °C for 10 s, 27 s, and 40 s. The a/c interface appears flat after C3H5 molecular ion implantation in Figure 15a. However, the high-concentration carbon in the a/c interface partially delays recrystallization, as shown in Figure 15b. Then, in Figure 15c, some crystalline region reaches the surface first owing to the partial delay of recrystallization in the fully amorphized C3H5-molecular-ion-implanted Si substrate. Figure 15d shows the complete recrystallization of the amorphous layer in the C3H5-molecular-ion-implanted Si substrate after the thermal annealing treatment at 650 °C for 40 s.
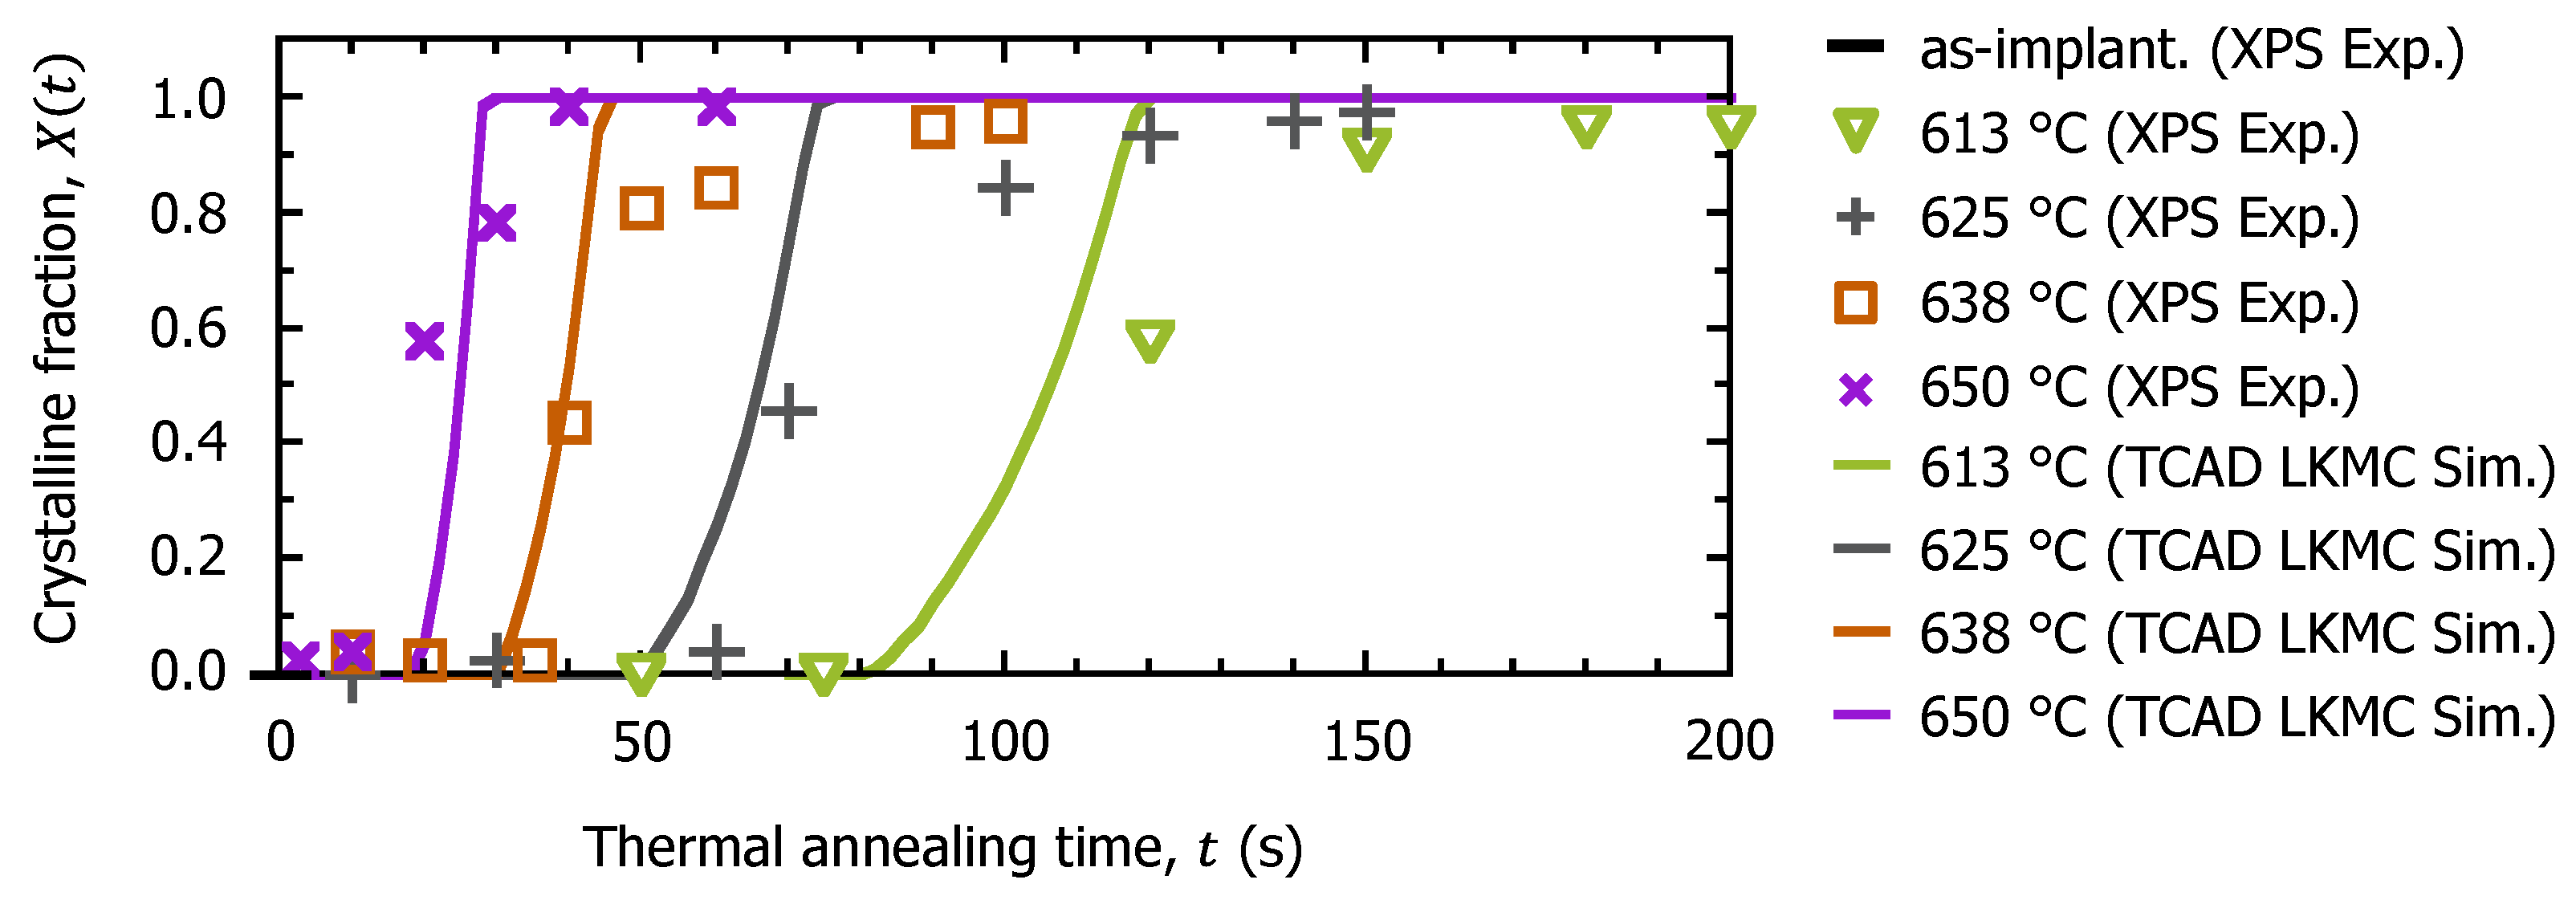
Furthermore, Figure 16 shows the changes in the crystalline fraction of the TCAD simulation model surface after thermal annealing treatments at 613 °C, 625 °C, 638 °C, and 650 °C. In Figure 16, the crystalline fraction of the TCAD simulation model surface is calculated by averaging A C from the surface to a depth of 30 nm. It is confirmed that the crystalline fraction of the TCAD simulation model surface also changes with sigmoidal curves, as in the experimental result of the analysis of binding energy of 2p spectra in Section 3.2. An incubation period in the change in the crystalline fraction of the Si substrate surface is the time until the internal a/c interface reaches the surface. Additionally, to directly confirm the surface recrystallization behavior of the fully amorphized C3H5-molecular-ion-implanted Si substrate, plan-view TEM observation is described in the next section. However, the change in crystalline fraction in the TCAD simulation model is a curve with a steeper slope than the experimental results of C3H5-molecular-ion-implanted Si substrate during thermal annealing treatment. The difference between the calculated and experimental results is due to the fact that the TCAD simulation only considers the delay in recrystallization rate by high-concentration carbon and does not consider the effect of defects on the recrystallization rate.

3.4. Surface Recrystallization Behavior of Fully Amorphized C3H5-Molecular-Ion-Implanted Si Substrate after Thermal Annealing Treatment Evaluated by Plan-View TEM Observation

To demonstrate the two-dimensional recrystallization analyzed on the basis of the KJMA theory and TCAD process simulation, we conducted plan-view TEM observations of the fully amorphized C3H5-molecular-ion-implanted Si substrate surface after the thermal annealing treatment at 650 °C. Figure 17 shows plan-view TEM images of the Si substrate surface after C3H5 molecular ion implantation at a dose of 1.67 × 10¹⁵ ions/cm2 and thermal annealing treatments at 650 °C for 10 s, 20 s, and 40 s. The sample thickness of the plan-view TEM observation is approximately 40–60 nm. The spots of the SAED pattern have a diameter of 100 nm. As shown in Figure 17a,b, the Si substrate surface is fully amorphized after C3H5 molecular ion implantation and does not change after thermal annealing at 650 °C for 10 s. The ring in the SAED pattern that indicates an amorphous structure is also unchanged. However, after the thermal annealing treatment at 650 °C for 20 s, it is seen that crystal islands grow two-dimensionally on the C3H5-molecular-ion-implanted Si substrate surface, as shown in Figure 17c. Then, the Si substrate surface becomes completely crystalline after the thermal annealing treatment at 650 °C for 40 s, as shown in Figure 17d. In the SAED pattern, corresponding to the recrystallization of the surface, spots due to single-crystal Si are clearly observed. In the following final section, we summarize experimental and simulation results and propose the surface recrystallization model of the fully amorphized C3H5-molecular-ion-implanted Si substrate.

3.5. Surface Recrystallization Model of Fully Amorphized C3H5-Molecular-Ion-Implanted Si Substrate

Here, we explain the surface recrystallization model of the fully amorphized C3H5-molecular-ion-implanted Si substrate based on experimental and simulation results. Figure 18 shows schematic images of the fully amorphized Si substrate after high-dose-C3H5 molecular-ion implantation and the recrystallization behavior during the subsequent recovery thermal annealing treatment. From the cross-sectional TEM observations, the a/c interface becomes flat after C3H5 molecular ion implantation, as shown in Figure 18a. We assume that this flat a/c interface is a result of low-energy molecular ion implantation, which can suppress the channeling effects of implanted ions. Furthermore, since the continuous amorphous layer is considered to be formed by the overlapping of discrete amorphous regions generated from each C3H5 molecular ion [11], there are some areas with many overlaps and other areas with few overlaps; thus, the carbon concentration is not uniform. Because of this, during the subsequent thermal annealing treatment, the recrystallization is partially delayed in some areas with high-concentration carbon in the fully amorphized C3H5-molecular-ion-implanted Si substrate. In a previous study, during recrystallization via SPEG, the rearrangement of Si atoms at the a/c interface is considered to be suppressed by local distortion caused by the difference in size between carbon and Si atoms [24]. The a/c interface has a large roughness owing to the partial delay of recrystallization and this process is no longer a simple layer-by-layer growth. Then, some crystalline regions that reached the Si substrate surface first act as crystal nuclei; thus, two-dimensional recrystallization proceeds on the surface as shown in Figure 18b.

4. Conclusions

The recrystallization behavior from the bulk to the surface is analyzed in the fully amorphized C3H5-molecular-ion-implanted Si substrate by experiment and TCAD process simulation, and the macroscopic surface recrystallization model is discussed. It is found that the recrystallization via SPEG from the crystalline template in the bulk to the surface is partially delayed due to locally distributed high-concentration carbon and formed defects during thermal annealing treatment. The activation energy for the recrystallization at a carbon concentration of 4.8 × 10²⁰ atoms/cm3 is determined as 2.79 ± 0.14 eV. The changes in the crystalline fraction of the C3H5-molecular-ion-implanted Si substrate surface after thermal annealing treatment are interpreted as being due to the transformation from the amorphous phase to the crystalline phase and analyzed using the KJMA equation. As a result, the Avrami index is obtained as between 2 and 3 in all thermal annealing temperatures, suggesting that surface recrystallization proceeds two-dimensionally. In the Si substrate surface, the activation energy for surface recrystallization is obtained as 2.71 ± 0.28 eV without the effect of carbon. The TCAD simulation model demonstrates that high-concentration carbon delays the recrystallization of the Si substrate and surface recrystallization starts from some crystal regions that reached the surface first. Therefore, as a recrystallization model of the fully amorphized C3H5-molecular-ion-implanted Si substrate surface, since recrystallization is partially delayed owing to the high-concentration carbon in the substrate, surface recrystallization starts from some crystalline regions that reached the surface and proceeds two-dimensionally. This macroscopic surface recrystallization model provides the information required for optimization of the subsequent recovery thermal annealing treatment conditions and achievement of surface crystalline perfection in amorphized Si substrate by the ion implantation of electrically inactive impurities that delay recrystallization. To determine the thermal annealing conditions for the fully amorphized Si substrate after high-dose-C3H5-molecular-ion implantation, it is necessary to consider both the partial delay of recrystallization due to high-concentration carbon and the two-dimensional recrystallization of the substrate surface. As a future work, to further improve the accuracy of the surface recrystallization model for the fully ion-implanted amorphized Si substrate, it is needed to consider the defect formation and the associated delay effect on recrystallization. The high-dose-C3H5-molecular-ion-implanted Si substrate requires an additional subsequent recovery thermal annealing treatment before epitaxial Si layer growth; however, we believe that such Si substrates have the highest gettering capability for transition metallic impurities and contribute to improving the characteristics of advanced CMOS image sensors.

Author Contributions

Conceptualization, K.K. (Koji Kobayashi), R.O., T.K., A.O.-M., R.H., A.S., S.N., Y.K., K.S. and K.K. (Kazunari Kurita); methodology, K.K. (Koji Kobayashi), R.O. and T.K.; software, K.K. (Koji Kobayashi), R.O., R.H. and S.N.; validation, K.K. (Koji Kobayashi); formal analysis, K.K. (Koji Kobayashi); investigation, K.K. (Koji Kobayashi); resources, K.K. (Koji Kobayashi), T.K. and K.K. (Kazunari Kurita); data curation, K.K. (Koji Kobayashi), R.O., T.K., A.O.-M., R.H., A.S., Y.K., K.S. and K.K. (Kazunari Kurita); writing—original draft preparation, K.K. (Koji Kobayashi); writing—review and editing, K.K. (Koji Kobayashi), K.S. and K.K. (Kazunari Kurita); visualization, K.K. (Koji Kobayashi); supervision, K.K. (Kazunari Kurita); project administration, K.K. (Kazunari Kurita). All authors have read and agreed to the published version of the manuscript.

Funding

This research received no external funding.

Data Availability Statement

The data presented in this study are available on request from the corresponding author due to privacy and confidentiality concerns.

Acknowledgments

The authors would like to express their gratitude to Hisashi Furuya and Naoki Ikeda of SUMCO Corporation for their great encouragement and management support in the research activities. The thermal annealing treatment of experimental samples is supported by Shuzo Takeuchi and Terumi Nishimura of Kitakyushu Foundation for the Advancement of Industry, Science and Technology Support Center for the Semiconductor Industry.

Conflicts of Interest

The authors declare no conflicts of interest. The authors Koji Kobayashi, Ryosuke Okuyama, Takeshi Kadono, Ayumi Onaka-Masada, Ryo Hirose, Akihiro Suzuki, Sho Nagatomo, Yoshihiro Koga, and Kazunari Kurita are employed by SUMCO Corporation (Japan). The remaining author declares that the research was conducted in the absence of any commercial or financial relationships that could be construed as a potential conflict of interest.

References

  1. Russo, F.; Nardone, G.; Polignano, M.L.; D’Ercole, A.; Pennella, F.; Felice, M.D.; Monte, A.D.; Matarazzo, A.; Moccia, G.; Polsinelli, G.; et al. Dark Current Spectroscopy of Transition Metals in CMOS Image Sensors. ECS J. Solid State Sci. Technol. 2017, 6, 217. [Google Scholar] [CrossRef]
  2. Domengie, F.; Regolini, J.L.; Bauza, D. Study of metal contamination in CMOS image sensors by dark-current and deep-level transient spectroscopies. J. Electron. Mater. 2010, 39, 625–629. [Google Scholar] [CrossRef]
  3. Kuroi, T.; Kawasaki, Y.; Komori, S.; Fukumoto, K.; Inuishi, M.; Tsukamoto, K.; Shinyashiki, H.; Shingyoji, T. Proximity Gettering of Heavy Metals by High-Energy Ion Implantation. Jpn. J. Appl. Phys. 1993, 32, 303. [Google Scholar] [CrossRef]
  4. Russo, F.; Moccia, G.; Nardone, G.; Alfonsetti, R.; Polsinelli, G.; D’Angelo, A.; Patacchiola, A.; Liverani, M.; Pianezza, P.; Lippa, T.; et al. Proximity Gettering of Slow Diffuser Contaminants in CMOS Image Sensors. Solid-State Electron. 2014, 91, 91–99. [Google Scholar] [CrossRef]
  5. Kurita, K.; Kadono, T.; Okuyama, R.; Hirose, R.; Onaka-Masada, A.; Koga, Y.; Okuda, H. Proximity gettering of C3H5 carbon cluster ion-implanted silicon wafers for CMOS image sensors: Gettering effects of transition metal, oxygen, and hydrogen impurities. Jpn. J. Appl. Phys. 2016, 55, 121301. [Google Scholar] [CrossRef]
  6. Kurita, K.; Kadono, T.; Okuyama, R.; Shigematsu, S.; Hirose, R.; Onaka-Masada, A.; Koga, Y.; Okuda, H. Proximity gettering technology for advanced CMOS image sensors using carbon cluster ion-implantation technique: A review. Phys. Status Solidi A 2017, 214, 1700216. [Google Scholar] [CrossRef]
  7. Kurita, K.; Kadono, T.; Shigematsu, S.; Hirose, R.; Okuyama, R.; Onaka-Masada, A.; Okuda, H.; Koga, Y. Proximity Gettering Design of Hydrocarbon-Molecular-Ion-Implanted Silicon Wafers Using Dark Current Spectroscopy for CMOS Image Sensors. Sensors 2019, 19, 2073. [Google Scholar] [CrossRef]
  8. Okuyama, R.; Masada, A.; Shigematsu, S.; Kadono, T.; Hirose, R.; Koga, Y.; Okuda, H.; Kurita, K. Effect of dose and size on defect engineering in carbon cluster implanted silicon wafers. Jpn. J. Appl. Phys. 2018, 57, 011301. [Google Scholar] [CrossRef]
  9. Shirasawa, S.; Sueoka, K.; Yamaguchi, T.; Maekawa, K. Density functional theory calculations for estimation of gettering sites of C, H, intrinsic point defects and related complexes in Si wafers. Mater. Sci. Semicond. Process. 2016, 44, 13–17. [Google Scholar] [CrossRef]
  10. Shigematsu, S.; Okuyama, R.; Hirose, R.; Kadono, T.; Onaka-Masada, A.; Suzuki, A.; Kobayashi, K.; Okuda, H.; Koga, Y.; Kurita, K. Influence of oxygen on copper gettering in hydrocarbon molecular ion implanted region using atom probe tomography. Nucl. Instrum. Methods Phys. Res. B 2020, 478, 99. [Google Scholar] [CrossRef]
  11. Kadono, T.; Okuyama, R.; Onaka-Masada, A.; Hirose, R.; Shigematsu, S.; Koga, Y.; Okuda, H.; Kurita, K. Effect of hydrocarbon molecular ion size for amorphous region formation analyzed by X-ray photoelectron spectroscopy. Jpn. J. Appl. Phys. 2020, 59, 025510. [Google Scholar] [CrossRef]
  12. Kobayashi, K.; Okuyama, R.; Kadono, T.; Onaka-Masada, A.; Hirose, R.; Suzuki, A.; Koga, Y.; Kurita, K. Recrystallization model of discrete amorphous regions in C3H5-molecular-ionimplanted silicon substrate surface analyzed by X-ray photoelectron spectroscopy. Jpn. J. Appl. Phys. 2022, 61, 115501. [Google Scholar] [CrossRef]
  13. Johnson, B.C.; McCallum, J.C.; Aziz, M.J. Solid-phase epitaxy. In Handbook of Crystal Growth; Elsevier: Boston, MA, USA, 2015; Chapter 7; pp. 31–363. [Google Scholar]
  14. Pelaz, L.; Marqués, L.A.; Aboy, M.; López, P.; Santos, I. Improved physical models for advanced silicon device processing. Mater. Sci. Semicond. Process. 2017, 62, 62. [Google Scholar] [CrossRef]
  15. Mok, K.R.C.; Benistant, F.; Jaraiz, M.; Rubio, J.E.; Castrillo, P.; Pinacho, R.; Srinivasan, M.P. Comprehensive model of damage accumulation in silicon. J. Appl. Phys. 2008, 103, 014911. [Google Scholar] [CrossRef]
  16. Liang, G.; Zhong, H.; Wang, Y.; Zhang, S.; Xu, M.; Kuang, S.; Ren, J.; Zhang, N.; Yan, S.; Yu, X.; et al. Molecular Dynamics Simulations of Vacancy Generation and Migration near a Monocrystalline Silicon Surface during Energetic Cluster Ion Implantation. Coatings 2020, 10, 146. [Google Scholar] [CrossRef]
  17. Pongrácz, A.; Szívós, J.; Ujhelyi, F.; Zolnai, Z.; Sepsi, Ö.; Nádudvari, G.; Byrnes, J.; Rubin, L.M.; Moore, E.D. Tilt angle and dose rate monitoring of low energy ion implantation processes with photomodulated reflectance measurement: AM: Advanced Metrology. In Proceedings of the 2020 31st Annual SEMI Advanced Semiconductor Manufacturing Conference (ASMC), Saratoga Springs, NY, USA, 24–26 August 2020; pp. 1–4. [Google Scholar]
  18. Julliard, P.L.; Dumas, P.; Monsieur, F.; Hilario, F.; Rideau, D.; Hémeryck, A.; Cristiano, F. Implant heating contribution to amorphous layer formation: A KMC approach. In Proceedings of the 2020 International Conference on Simulation of Semiconductor Processes and Devices (SISPAD), Kobe, Japan, 23 September–6 October 2020; pp. 43–46. [Google Scholar]
  19. Camara, O.; Tunes, M.A.; Greaves, G.; Mir, A.H.; Donnelly, S.; Hinks, J.A. Understanding amorphization mechanisms using ion irradiation in situ a TEM and 3D damage reconstruction. Ultramicroscopy 2019, 207, 112838. [Google Scholar] [CrossRef] [PubMed]
  20. Kirschbaum, J.; Teuber, T.; Donner, A.; Radek, M.; Bougeard, D.; Böttger, R.; Hansen, J.L.; Larsen, A.H.; Posselt, M.; Bracht, H. Self-diffusion in amorphous silicon by local bond rearrangements. Phys. Rev. Lett. 2018, 120, 225902. [Google Scholar] [CrossRef]
  21. Posselt, M.; Bracht, H.; Radić, D. Atomistic simulations on the relationship between solid-phase epitaxial recrystallization and self-diffusion in amorphous silicon. J. Appl. Phys. 2022, 131, 035102. [Google Scholar] [CrossRef]
  22. Williams, J.S.; Elliman, R.G. Role of Electronic Processes in Epitaxial Recrystallization of Amorphous Semiconductors. Phys. Rev. Lett. 1983, 51, 1069. [Google Scholar] [CrossRef]
  23. Lampin, E.; Krzeminski, C. Molecular dynamics simulations of the solid phase epitaxy of Si: Growth mechanism and orientation effects. J. Appl. Phys. 2009, 106, 063519. [Google Scholar] [CrossRef]
  24. Johnson, B.C.; McCallum, J.C. Dopant-enhanced solid-phase epitaxy in buried amorphous silicon layers. Phys. Rev. B 2007, 76, 045216. [Google Scholar] [CrossRef]
  25. Strane, J.W.; Lee, S.R.; Stein, H.J.; Picraux, S.T.; Watanabe, J.K.; Mayer, J.W. Carbon incorporation into Si at high concentrations by ion implantation and solid phase epitaxy. J. Appl. Phys. 1996, 79, 637. [Google Scholar] [CrossRef]
  26. Werner, P.; Eichler, S.; Mariani, G.; Kögler, R.; Skorupa, W. Investigation of CxSi defects in C implanted silicon by transmission electron microscopy. Appl. Phys. Lett. 1997, 70, 252. [Google Scholar] [CrossRef]
  27. Rudawski, N.G.; Whidden, L.R.; Craciun, V.; Jones, K.S. Amorphization and Solid-Phase Epitaxial Growth of C-Cluster Ion-Implanted Si. J. Electron. Mater. 2009, 38, 1926. [Google Scholar] [CrossRef]
  28. Roth, J.A.; Olson, G.L.; Jacobson, D.C.; Poate, J.M. Kinetics of solid phase epitaxy in thick amorphous Si layers formed by MeV ion implantation. Appl. Phys. Lett. 1990, 57, 1340. [Google Scholar] [CrossRef]
  29. Roth, J.A.; Olson, G.L.; Jacobson, D.C.; Poate, J.M.; Kirschbaum, C. The effect of hydrogen on the kinetics of solid phase epitaxy in amorphous silicon. Mater. Res. Soc. Symp. Proc. 1992, 205, 45. [Google Scholar] [CrossRef]
  30. Pyke, D.J.; McCallum, J.C.; Johnson, B.C. Hydrogen refinement during solid phase epitaxy of buried amorphous silicon layers. J. Appl. Phys. 2010, 108, 044901. [Google Scholar] [CrossRef]
  31. Lu, G.Q.; Nygren, E.; Aziz, M.J. Pressure-enhanced crystallization kinetics of amorphous Si and Ge: Implications for point-defect mechanisms. J. Appl. Phys. 1991, 70, 5323. [Google Scholar] [CrossRef]
  32. Sklenard, B.; Barbe, J.C.; Batude, P.; Rivallin, P.; Tavernier, C.; Cristoloveanu, S.; Martin-Bragado, I. An atomistic investigation of the impact of in-plane uniaxial stress during solid phase epitaxial regrowth. Appl. Phys. Lett. 2013, 102, 151907. [Google Scholar] [CrossRef]
  33. Yamamoto, M. Kinetics of Material; Uchida Rokakuho: Tokyo, Japan, 2015; Chapter 3; pp. 145–148. [Google Scholar]
  34. Shirzad, K.; Viney, C. A critical review on applications of the Avrami equation beyond materials science. J. R. Soc. Interface 2023, 20, 20230242. [Google Scholar] [CrossRef]
  35. Synopsys Sentaurus Process User’s Manual, Release p-2019.03; Synopsys Inc.: Zurich, Switzerland, 2019; pp. 104–129, 455–470.
  36. Tian, S. Predictive Monte Carlo ion implantation simulator from sub-keV to above 10 MeV. J. Appl. Phys. 2003, 93, 5893–5904. [Google Scholar] [CrossRef]
  37. Posselt, M.; Schmidt, B.; Murthy, C.S.; Feudel, T.; Suzuki, K. Modeling of Damage Accumulation during Ion Implantation into Single-Crystalline Silicon. J. Electrochem. Soc. 1997, 144, 1495–1504. [Google Scholar] [CrossRef]
  38. Caturla, M.-J.; Diaz de la Rubia, T.; Marques, L.A.; Gilmer, G.H. Ion-beam processing of silicon at keV energies: A molecular-dynamics study. Phys. Rev. B 1996, 54, 16683. [Google Scholar] [CrossRef]
  39. Martin-Bragado, I.; Moroz, V. Facet formation during solid phase epitaxy regrowth: A lattice kinetic Monte Carlo model. Appl. Phys. Lett. 2009, 95, 123123. [Google Scholar] [CrossRef]
  40. Martin-Bragado, I.; Sklenard, B. Understanding Si (111) solid phase epitaxial regrowth using Monte Carlo modeling: Bi-modal growth, defect formation, and interface topology. J. Appl. Phys. 2012, 112, 024327. [Google Scholar] [CrossRef]
  41. Schafer, R.W. What is a savitzky-golay filter? [lecture notes]. IEEE Signal Process. Mag. 2011, 28, 111. [Google Scholar] [CrossRef]
  42. Tougaard, S. Practical guide to the use of backgrounds in quantitative XPS. J. Vac. Sci. Technol. A 2021, 39, 011201. [Google Scholar] [CrossRef]
  43. Ogawa, S.; Tang, J.; Yoshigoe, A.; Ishidzuka, S.; Teraoka, Y.; Takakuwa, Y. Relation between oxidation rate and oxidation-induced strain at SiO2/Si (001) interfaces during thermal oxidation. Jpn. J. Appl. Phys. 2013, 52, 110128. [Google Scholar] [CrossRef]
  44. Kim, M.; Lippert, G.; Osten, H.J. X-ray photoelectron spectroscopic investigation of carbon incorporation and segregation during pseudomorphic growth of Si1−yCy on Si (001). J. Appl. Phys. 1996, 80, 5748. [Google Scholar] [CrossRef]
  45. Lu, Z.H.; Mitchell, D.F.; Graham, M.J. Quantitative analysis of low-energy Xe+ ion bombardment damage of Si (100) surfaces using x-ray photoelectron spectroscopy. Appl. Phys. Lett. 1994, 65, 552–554. [Google Scholar]
  46. Ishii, M.; Hirose, Y.; Sato, T.; Ohwaki, T.; Taga, Y. In situ analysis of Si (100) surface damage induced by low-energy rare-gas ion bombardment using x-ray photoelectron spectroscopy. J. Vac. Sci. Technol. A 1997, 15, 820–824. [Google Scholar] [CrossRef]
  47. Masaki, Y.; LeComber, P.G.; Fitzgerald, A.G. Solid phase crystallization of thin films of Si prepared by plasma-enhanced chemical vapor deposition. J. Appl. Phys. 1993, 74, 129. [Google Scholar] [CrossRef]
  48. Olson, G.L.; Roth, J.A. Kinetics of solid phase crystallization in amorphous silicon. Mater. Sci. Rep. 1988, 3, 1–77. [Google Scholar] [CrossRef]
Figure 1. Cross-sectional TEM images of Si substrate after (a) C3H5 molecular ion implantation and subsequent thermal annealing treatments at 650 °C for (b) 10 s, (c) 20 s, and (d) 40 s. An amorphous layer (a-Si) is formed on the crystalline template (c-Si) in the C3H5-molecular-ion-implanted Si substrate and recrystallized gradually after the thermal annealing treatment.
Crystals 14 00748 g001
Figure 2. Defects formed in the recrystallized region in C3H5-molecular-ion-implanted Si substrate after subsequent thermal annealing treatments at 650 °C for 40 s.
Crystals 14 00748 g002
Figure 3. Depth profiles of carbon and hydrogen concentrations of Si substrate after (a) C3H5 molecular ion implantation at a dose of 1.67 × 10¹⁵ ions/cm2 and subsequent thermal annealing treatments at 650 °C for (b) 10 s, (c) 20 s, and (d) 40 s.
Crystals 14 00748 g003
Figure 4. Changes in thickness of the amorphous layer of C3H5-molecular-ion-implanted Si substrate after thermal annealing treatments at 613 °C, 625 °C, 638 °C, and 650 °C. The error bars in each plot indicate the deterioration of the a/c interface roughness during recrystallization.
Crystals 14 00748 g004
Figure 5. Arrhenius plots of recrystallization of the fully amorphized C3H5-molecular-ion-implanted Si substrate in the presence of high-concentration carbon.
Crystals 14 00748 g005
Figure 6. Binding energy of Si 2p spectra obtained from the Si substrate surface without ion implantation and after C3H5 molecular ion implantation at a dose of 1.67 × 10¹⁵ ions/cm2 and subsequent thermal annealing treatments at 650 °C for 10 s, 20 s, 30 s, and 40 s.
Crystals 14 00748 g006
Figure 7. Fitting curves of Si 2p spectra of fully amorphized C3H5-molecular-ion-implanted Si substrate surface after thermal annealing treatment at 650 °C for 20 s and sum of ideal spectra of amorphous-Si and crystalline-Si. The ratio of amorphous-Si to crystalline-Si in the Si 2p spectrum is calculated to be 43:57.
Crystals 14 00748 g007
Figure 8. Changes in crystalline fraction of fully amorphized C3H5-molecular-ion-implanted Si substrate surface after thermal annealing treatments at 613 °C, 625 °C, 638 °C, and 650 °C. The dotted lines are the fitting curves for the KJMA equation.
Crystals 14 00748 g008
Figure 9. Avrami index and Arrhenius plots of recrystallization of fully amorphized C3H5-molecular-ion-implanted Si substrate surface in subsequent thermal annealing treatment. The Avrami index n is between 2 and 3 at all thermal annealing temperatures.
Crystals 14 00748 g009
Figure 10. (a) Cross-sectional TEM image and (b) TCAD simulation model of the amorphous layer formation after C3H5 molecular ion implantation. The amorphous-crystalline parameter A C is shown as contours in blue to red, and the a/c interface is expressed by a plane tiled with small yellow spheres.
Crystals 14 00748 g010
Figure 11. Results of SIMS analysis and TCAD MC ion implantation simulation of depth profiles of carbon and hydrogen concentrations after C3H5 molecular ion implantation.
Crystals 14 00748 g011
Figure 12. Estimated relationship between carbon concentration and activation energy for recrystallization.
Crystals 14 00748 g012
Figure 13. Changes in thickness of the amorphous layer in the TCAD simulation model after thermal annealing treatments at 613 °C, 625 °C, 638 °C, and 650 °C.
Crystals 14 00748 g013
Figure 14. Distribution of carbon atoms at the a/c interface in the TCAD simulation model after thermal annealing treatment at 650 °C for 25 s. There are areas with high and low carbon concentrations at the a/c interface during the thermal annealing treatment.
Crystals 14 00748 g014
Figure 15. TCAD simulation models after (a) C3H5 molecular ion implantation at a dose of 1.67 × 10¹⁵ ions/cm2 and thermal annealing treatments at 650 °C for (b) 10 s, (c) 27 s, and (d) 40 s. After C3H5 molecular ion implantation, the a/c interface appears flat; however, its roughness deteriorates owing to the effect of high-concentration carbon after the thermal annealing treatment at 650 °C for 10 s. Then, some crystalline regions reach the surface first after the thermal annealing treatment at 650 °C for 27 s. Finally, the amorphous layer of the simulation model is completely disappeared by thermal annealing treatment at 650 °C for 40 s.
Crystals 14 00748 g015
Figure 16. Changes in the crystalline fraction of the C3H5-molecular-ion-implanted TCAD simulation model surface after the thermal annealing treatments at 613 °C, 625 °C, 638 °C, and 650 °C.
Crystals 14 00748 g016
Figure 17. Plan-view TEM images of the Si substrate surface after (a) C3H5 molecular ion implantation and thermal annealing treatments at 650 °C for (b) 10 s, (c) 20 s, and (d) 40 s.
Crystals 14 00748 g017
Figure 18. Schematic images of (a) fully amorphized high-dose-C3H5-molecular-ion-implanted Si substrate and (b) recrystallization behavior during subsequent thermal annealing treatment.
Crystals 14 00748 g018
Table 1. Input values in TCAD process simulation.
ProcessParameterInput ValueUnit
MC ion implantation E T h r e s h o l d 15.0 e V
  M i n . A m o r p h o u s . V o l 40.0 n m 3
C T h r e s h o l d 1.15 × 10 22 / c m 3
LKMC
recrystallization
K 1 2.88 × 10 16 c m 2 / s
K 2 7.36 × 10 14 c m 2 / s
K 3 3.52 × 10 11 c m 2 / s
E a 2.70 e V
Δ V S P E 0.00 n m 3
c e V
C S i 5.00 × 10 22 a t o m s / c m 3
Disclaimer/Publisher’s Note: The statements, opinions and data contained in all publications are solely those of the individual author(s) and contributor(s) and not of MDPI and/or the editor(s). MDPI and/or the editor(s) disclaim responsibility for any injury to people or property resulting from any ideas, methods, instructions or products referred to in the content.