Article

Magnetic Flux Concentration Technology Based on Soft Magnets and Superconductors

1
Institute of Electrical Engineering, Chinese Academy of Sciences, Beijing 100190, China
2
University of Chinese Academy of Sciences, Beijing 100049, China
3
Aerospace Information Research Institute, Chinese Academy of Sciences, Beijing 100049, China
4
School of Electronic, Electrical and Communication Engineering, University of Chinese Academy of Sciences, Beijing 100049, China
*
Author to whom correspondence should be addressed.
Crystals 2024, 14(8), 747; https://doi.org/10.3390/cryst14080747 (registering DOI)
Submission received: 27 June 2024 / Revised: 31 July 2024 / Accepted: 10 August 2024 / Published: 22 August 2024
(This article belongs to the Special Issue Superconductors and Magnetic Materials)

Abstract

:
High-sensitivity magnetic sensors are fundamental components in fields such as biomedicine and non-destructive testing. Flux concentration technology enhances the sensitivity of magnetic sensors by amplifying the magnetic field to be measured, making it the most effective method to improve the magnetic field resolution of magnetic sensors. Superconductors and high-permeability soft magnetic materials exhibit completely different magnetic effects. The former possesses complete diamagnetism, while the latter has extremely high magnetic permeability. Both types of materials can be used to fabricate flux concentrators. This paper compares superconducting and soft magnetic flux concentration technologies through theoretical simulations and experiments, investigating the impact of different structural parameters on the magnetic field amplification performance of superconducting and soft magnetic concentrators. This research is significant for the development of magnetic focusing technology and its applications in weak magnetic detection and other fields.

1. Introduction

Weak magnetic detection technology is a crucial component of modern sensing technologies and has significant applications in geological and marine exploration, geomagnetic navigation, non-destructive testing, and biomagnetic signal detection [1,2,3,4,5,6]. The core of weak magnetic detection technology is high-sensitivity magnetic sensors. Currently, the magnetic field resolution of most types of magnetic sensors can only achieve the microtesla (µT) to nanotesla (nT) range [7], which is insufficient to meet the higher precision requirements of magnetic field measurements at the picotesla (pT) to femtotesla (fT) level (such as magnetocardiography and magnetoencephalography).
Flux concentration technology focuses and locally enhances the external magnetic field, making it a crucial method for improving the magnetic field resolution of magnetic sensors. Flux concentrators (FC) are mostly made of soft magnetic materials with high permeability. In the magnetic field environment, high permeability materials have the effect of converging magnetic field lines, which can make the internal magnetic field strength of the high permeability material greater than the external magnetic field. This kind of FC initially adopts a conical structure [8]. Subsequently, Schneider et al. [9] employed CMOS technology to fabricate funnel-shaped flux concentration structures based on permalloy material, significantly increasing the sensitivity of magneto-transistors. Drljaca et al. [10] conducted preliminary studies on the magnetic field amplification characteristics of two-dimensional thin-film flux concentrator structures of various shapes. They analyzed the relationship between the amplification factor and the ambient magnetic field for T-shaped, triangular, and funnel-shaped concentrators and designed high-sensitivity Hall sensors.
Moreover, researchers also explored the application of FCs to enhance the sensitivity of giant magnetoresistance (GMR) and tunnel magnetoresistance (TMR) sensors [11,12,13,14,15,16]. Guedes A et al. [14] increased the sensitivity of the GMR sensor from 0.2%/Oe to 3.8%/Oe with a magnification of 19 times by using an FC prepared by soft magnetic materials; Chaves et al. [17] employed multi-stage FCs to enhance the sensitivity of TMR sensors to 72%/Oe, with an amplification factor exceeding 100 and achieved a noise level of 97 pT/Hz(1/2) at 10 Hz.
In addition to high-permeability soft magnetic materials, superconductors can also achieve magnetic focusing. D. Robbes et al. [18] first proposed that if superconductors are designed as closed loops with special structures, the external magnetic field can be amplified hundreds or even thousands of times. M. Pannitier et al. [19,20,21,22,23] prepared the GMR-Superconducting composite magnetic sensor for the first time by using the superconducting FC, which improved the magnetic field resolution of GMR by more than 100 times. On this basis, H. Dyvorne et al. [24] improved the sensitivity of GMR devices by nearly 1000 times by adjusting the size of superconducting FCs. Subsequently, Wu, Hu et al. respectively, combined the Superconducting FC with TMR devices, which increased the sensitivity of TMR devices by more than 1000 times, and the magnetic field noise level reached 1 pT/Hz(1/2) at 1 Hz [25,26,27,28,29,30,31].
This paper combines theoretical simulations and experimental methods to compare superconducting and soft magnetic FCs. It investigates the effects of factors such as structure and dimensions on the performance of superconducting and soft magnetic FCs.

2. Simulation and Results

2.1. Soft Magnetic Flux Concentrators

2.1.1. Principles and Simulation Model

High permeability soft magnetic materials will gather ambient magnetic fields. Under the influence of an external magnetic field, the magnetic induction intensity inside the soft magnetic material is:
B i n = μ 0 μ r H
where μ 0 is the free space’s permeability, μ r is the relative permeability of the soft magnetic material, and H is the magnetic field strength acting within the soft magnetic material. When the length of the soft magnetic material is finite, the magnetization induced by the external magnetic field will generate a demagnetizing field H d inside the soft magnet, which is in the opposite direction of the external magnetic field. The demagnetizing field is related to the geometry of the material:
H d = N M
where N is the demagnetizing factor, and M is the magnetization. Thus, the magnetic field strength inside the soft magnetic material can be expressed as:
H = H e x t N μ r 1 H
Based on Equations (1)–(3), it can be obtained that:
B i n = μ 0 μ r 1 + μ r 1 N H e x t
When the magnetic sensor is very close to the soft magnetic material, it can be approximated that the magnetic induction intensity acting on the sensor is B i n . Currently, the amplification factor of the soft magnetic material is:
G m = μ r 1 + μ r 1 N
From Equation (5), by using high-permeability soft magnetic materials and optimizing the structure to reduce the demagnetizing factor, the magnetic field in the sensitive area of the magnetic sensor can be enhanced (as shown in Figure 1a). However, since the demagnetizing factor is a complex function of the shape and magnetization state of soft magnetic materials and often has no analytical solution, finite element simulation methods are required.
We established a simulation model of the soft magnetic FC using COMSOL Multiphysics (6.0) finite element simulation software. The model includes two identical soft magnetic structures. This paper focuses on the T-shaped magnetic FC. Figure 1b shows a schematic diagram of the T-shaped magnetic FC, with its initial structural parameters listed in Table 1. Except for the outer edge thickness h m 1 , the length of the magnetic concentrator L m , and the width of the central air gap w m which are variable, the other structural parameters are fixed values. In our study, Permalloy was selected as the material for the magnetic FC, and the background magnetic field is along the x-direction. We used the magnetic fields, no currents(mfnc) module in COMSOL to simulate the magnetic field gain factor at the center of the air gap of the magnetic FC.

2.1.2. Simulation Results

We varied h m 1 , L m , and w m , respectively, and calculated the impact of these parameters on the performance of the T-type soft magnetic FC. During the simulation calculations, whenever one variable changed, the other variables were kept constant.
The variation of the magnetic field amplification factor G m of the soft magnetic FC with h m 1 is shown in Figure 2a. As h m 1 increases from 1 mm to 10 mm, G m slowly rises from 10.55 to 10.87 and then gradually decreases to 10.7. It is evident that increasing h m 1 does not significantly enhance G m . Furthermore, G m does not monotonically increase with h m 1 ; instead, it reaches a maximum value when h m 1 is 6 mm. The main reason is that the demagnetization factor of the T-type soft magnetic FC in the magnetic field-sensitive direction increases with the rise in h m 1 , which greatly affects the enhancement of G m . When h m 1 exceeds 6 mm, the impact of the demagnetization factor surpasses the increase of the magnetic field sensing area brought by the rise in h m 1 , thus leading to a decreasing trend of G m . Since increasing h m 1 does not significantly improve the magnetic field gain factor but increases the volume and mass of the soft magnetic FC, we set h m 1 as 1 mm in subsequent studies.
The variation of G m with L m is shown in Figure 2b. As L m increases from 5 mm to 20 mm, G m increases in an approximately linear manner from 10.55 to 21. This is because increasing the length of the soft magnetic structure reduces its demagnetization factor, thereby enhancing the magnetic field gain.
Figure 2c shows the variation of G m With the air gap w m . G m increases rapidly with w m decreasing, which is due to the large air-gap reluctance and magnetic leakage phenomenon of soft magnetic FC. Reducing w m effectively lowers the magnetic reluctance and reduces magnetic leakage of the air gap. At the same time, we found that w m and G m are approximately inversely proportional (fitting results in Figure 2c) when w m reaches 50 um (the typical size of GMR and TMR devices), G m exceeds 98.
The magnetic field gain factor depends not only on the geometric structure of the device but also closely on the magnetic permeability of the soft magnetic material. In this regard, we studied the influence of the permeability of soft magnetic materials μ r on G m (as shown in Figure 2d). It can be seen that G m increases significantly with the rise in μ r and tends to saturate when μ r exceeds 5000, indicating that when μ r is sufficiently high, the soft magnetic FC experiences almost no magnetic leakage, and thus G m no longer changes significantly. In this study, we selected permalloy, which has a magnetic permeability of up to 100,000, making it an ideal material for the soft magnetic FC. In contrast, magnetic materials such as silicon steel and ferrite, due to their lower magnetic permeability, would adversely affect the magnetic field gain factor.

2.2. Superconducting FC

2.2.1. Principle and Simulation Model

The structure of the superconducting FC is shown in Figure 3a, which is a closed superconducting loop containing a constriction. Below the superconducting transition temperature, when an external magnetic field passes through the superconducting FC vertically (along the z-direction), the induced current will be generated in the superconducting loop to offset the external magnetic flux passing through the superconducting loop due to the zero resistance of the superconductor and the Meissner effect:
I = B a S L
where B a is the external magnetic induction intensity, S and L are the effective areas and self-inductance of the superconducting FC. When the induced current passes through the constriction of the superconducting ring, the current density increases locally, and a strong local magnetic field is formed (Figure 3b). Assuming that the induced current is evenly distributed in the constriction, then:
B c = μ 0 I 2 w s
where w s is the constriction width. It should be stated that Equation (7) is valid at the top and bottom of an infinitely wide plate of current. Since the thickness of the superconducting constriction is much smaller than the width, it can be treated as an infinitely wide plate. The magnetic field gain factor of the superconducting FC can be obtained as follows:
G s = μ 0 S 2 w s L
As seen from Equation (8), the magnetic field gain factor can be improved by increasing the effective area of the superconducting FC, reducing the width of the constriction, and lowering the self-inductance. However, the loop inductance of the superconducting FC is a complex function of shape and often lacks an analytical solution. Additionally, the supercurrent within the superconductor is not uniformly distributed but exhibits a skin effect. Therefore, finite element simulation methods are required.
We used COMSOL Multiphysics (6.0) software to establish a three-dimensional finite element model of the superconducting FC. The superconducting FC adopts a square structure, with its structural parameters shown in Table 2. Except for the edge of the inner square D s 2 and the width of the constriction w s , all other structural parameters are fixed values. In our study, YBCO was selected as the material for the superconducting FC. The non-linear resistivity of YBCO is described by the E–J power law:
ρ = E c J c J J c n 1
where J c is critical current density, which is 2 × 10⁸ A/m2 for YBCO bulks. E c is the characteristic electrical field, which is 10−4 V/m and acted as the critical current criterion. The n-value is set to 15 in this model [32].

2.2.2. Simulation Results

The variation of the amplification factor G s of the superconducting FC with D s 2 is shown in Figure 4a. As D s 2 increases from 2 mm to 18 mm, G s firstly increases from 59.5, reaches a maximum value of 75 at D s 2 = 10   mm , and then gradually decreases to 59. To explain this phenomenon, we calculated the variations of L and S with D s 2 (shown in Figure 4b). It can be seen that S increases almost linearly with D s 2 , while the relationship between L and D s 2 is approximately parabolic. Since G s is directly proportional to S and inversely proportional to L , and G s first increases and then decreases.
Figure 4c shows the variation of G s with w s . It can be observed that G s is approximately inversely proportional to w s (fitting results in Figure 4c), which is consistent with Equation (8). It is worth noting that the supercurrent inside the superconductor is not uniformly distributed; instead, the London penetration depth exists, which affects the uniformity of the magnetic field on the surface of the constriction. Figure 4d shows the distribution of G s on the surface of the superconducting constriction. It is not difficult to see that at the edges of the constriction, G s   exhibits sharp peaks. The main reason is the skin effect of the superconducting current, which causes a higher current density at the edges of the constriction. Nevertheless, the magnetic field is uniform in most areas in the center of the narrow zone, which can provide a stable and uniform magnetic field environment for magnetic-sensitive components such as magnetoresistance.

3. Experimental Results and Discussion

From the above simulation results, both the soft magnetic FC and the superconducting FC exhibit excellent magnetic field amplification characteristics. To verify the theoretical results, highly sensitive tunnel magnetoresistance (TMR) is used as a magnetic-sensitive element in this paper. The specific fabrication process of TMR is consistent with that in Ref. [21]. Figure 5a shows the series structure of the fabricated TMR.
Figure 5b shows the voltage–magnetic field response curve of the TMR device at room temperature and 77 K, with the TMR device biased at 1 V. By calculating the slope of the curve near zero field, the sensitivity of the TMR at room temperature and 77 K is 9.1 mV/V/Oe and 7.1 mV/V/Oe, respectively. The decrease in sensitivity at low temperatures is due to the influence of the magnetic domain flipping of the free layer of the TMR. Figure 5c shows the voltage noise spectrum of the TMR device at room temperature and 77 K. The low-frequency voltage noise of the device decreases at low temperatures, indicating that the magnetic moment disturbances due to thermal excitation are a major factor in generating low-frequency noise in the TMR. Lowering the temperature effectively suppresses these magnetic moment disturbances. Figure 5d shows the magnetic noise spectrum of the TMR. Despite the sensitivity of TMR decreases at low temperatures, its magnetic noise is still lower than at room temperature.
Both types of FCs are combined with the TMR device using flip-chip bonding technology. The inset of Figure 6a shows the fabricated TMR–soft magnetic and the TMR–superconducting composited magnetic sensor. To compare the magnetic field amplification characteristics of the two types of FCs, the soft magnetic FC and the superconducting FC used in this study have the same external dimensions (20 mm × 20 mm), and the gap width of the soft magnetic FC and the constriction width of the superconducting FC are both set to 500 µm.
Figure 6a shows the sensitivity comparison of the two composite magnetic sensors. The sensitivities of the TMR-soft magnetic and TMR-superconducting composited magnetic sensor reach 135 mV/V/Oe and 138 mV/V/Oe, respectively, with the corresponding field amplification factors being 14.8 and 19.4. The experimental results are generally consistent with the simulation results, validating the accuracy of the simulations. With the same dimensions, the superconducting FC has a higher amplification factor. However, due to the decreased sensitivity of the TMR device at low temperatures, the sensitivities of the two composite magnetic sensors are almost the same.
Figure 6b,c show the voltage noise of the two composite magnetic sensors compared with that of the TMR without magnetic FC. The soft magnetic FC causes a certain increase in the TMR’s noise (the voltage noise at 1 Hz increases by 50%), whereas the voltage noise of the TMR device combined with the superconducting FC does not show a significant change. The primary reason is that under the influence of environmental thermal disturbances, magnetic domain disturbances occur within the soft magnetic FC and bring additional noise. In contrast, the magnetic field gain of the superconducting FC is derived from the supercurrent. Due to the zero-resistance characteristic of the superconductor, the supercurrent hardly introduces any additional noise.
Figure 6d shows the magnetic noise of the two composite magnetic sensors. At 1 Hz, the magnetic noise of the TMR-superconducting and the TMR-soft magnetic composited sensor are 580 pT/Hz(1/2) and 65 pT/Hz(1/2), respectively. The comparison shows that with the same dimensions, the TMR-superconducting composited sensor exhibits superior magnetic field detection capability.

4. Conclusions

Flux concentration technology is widely used to enhance the detection performance of magnetic sensors. This study conducted simulations and experimental research on two different types of flux concentrators: soft magnetic and superconducting. The following conclusions were obtained:
1
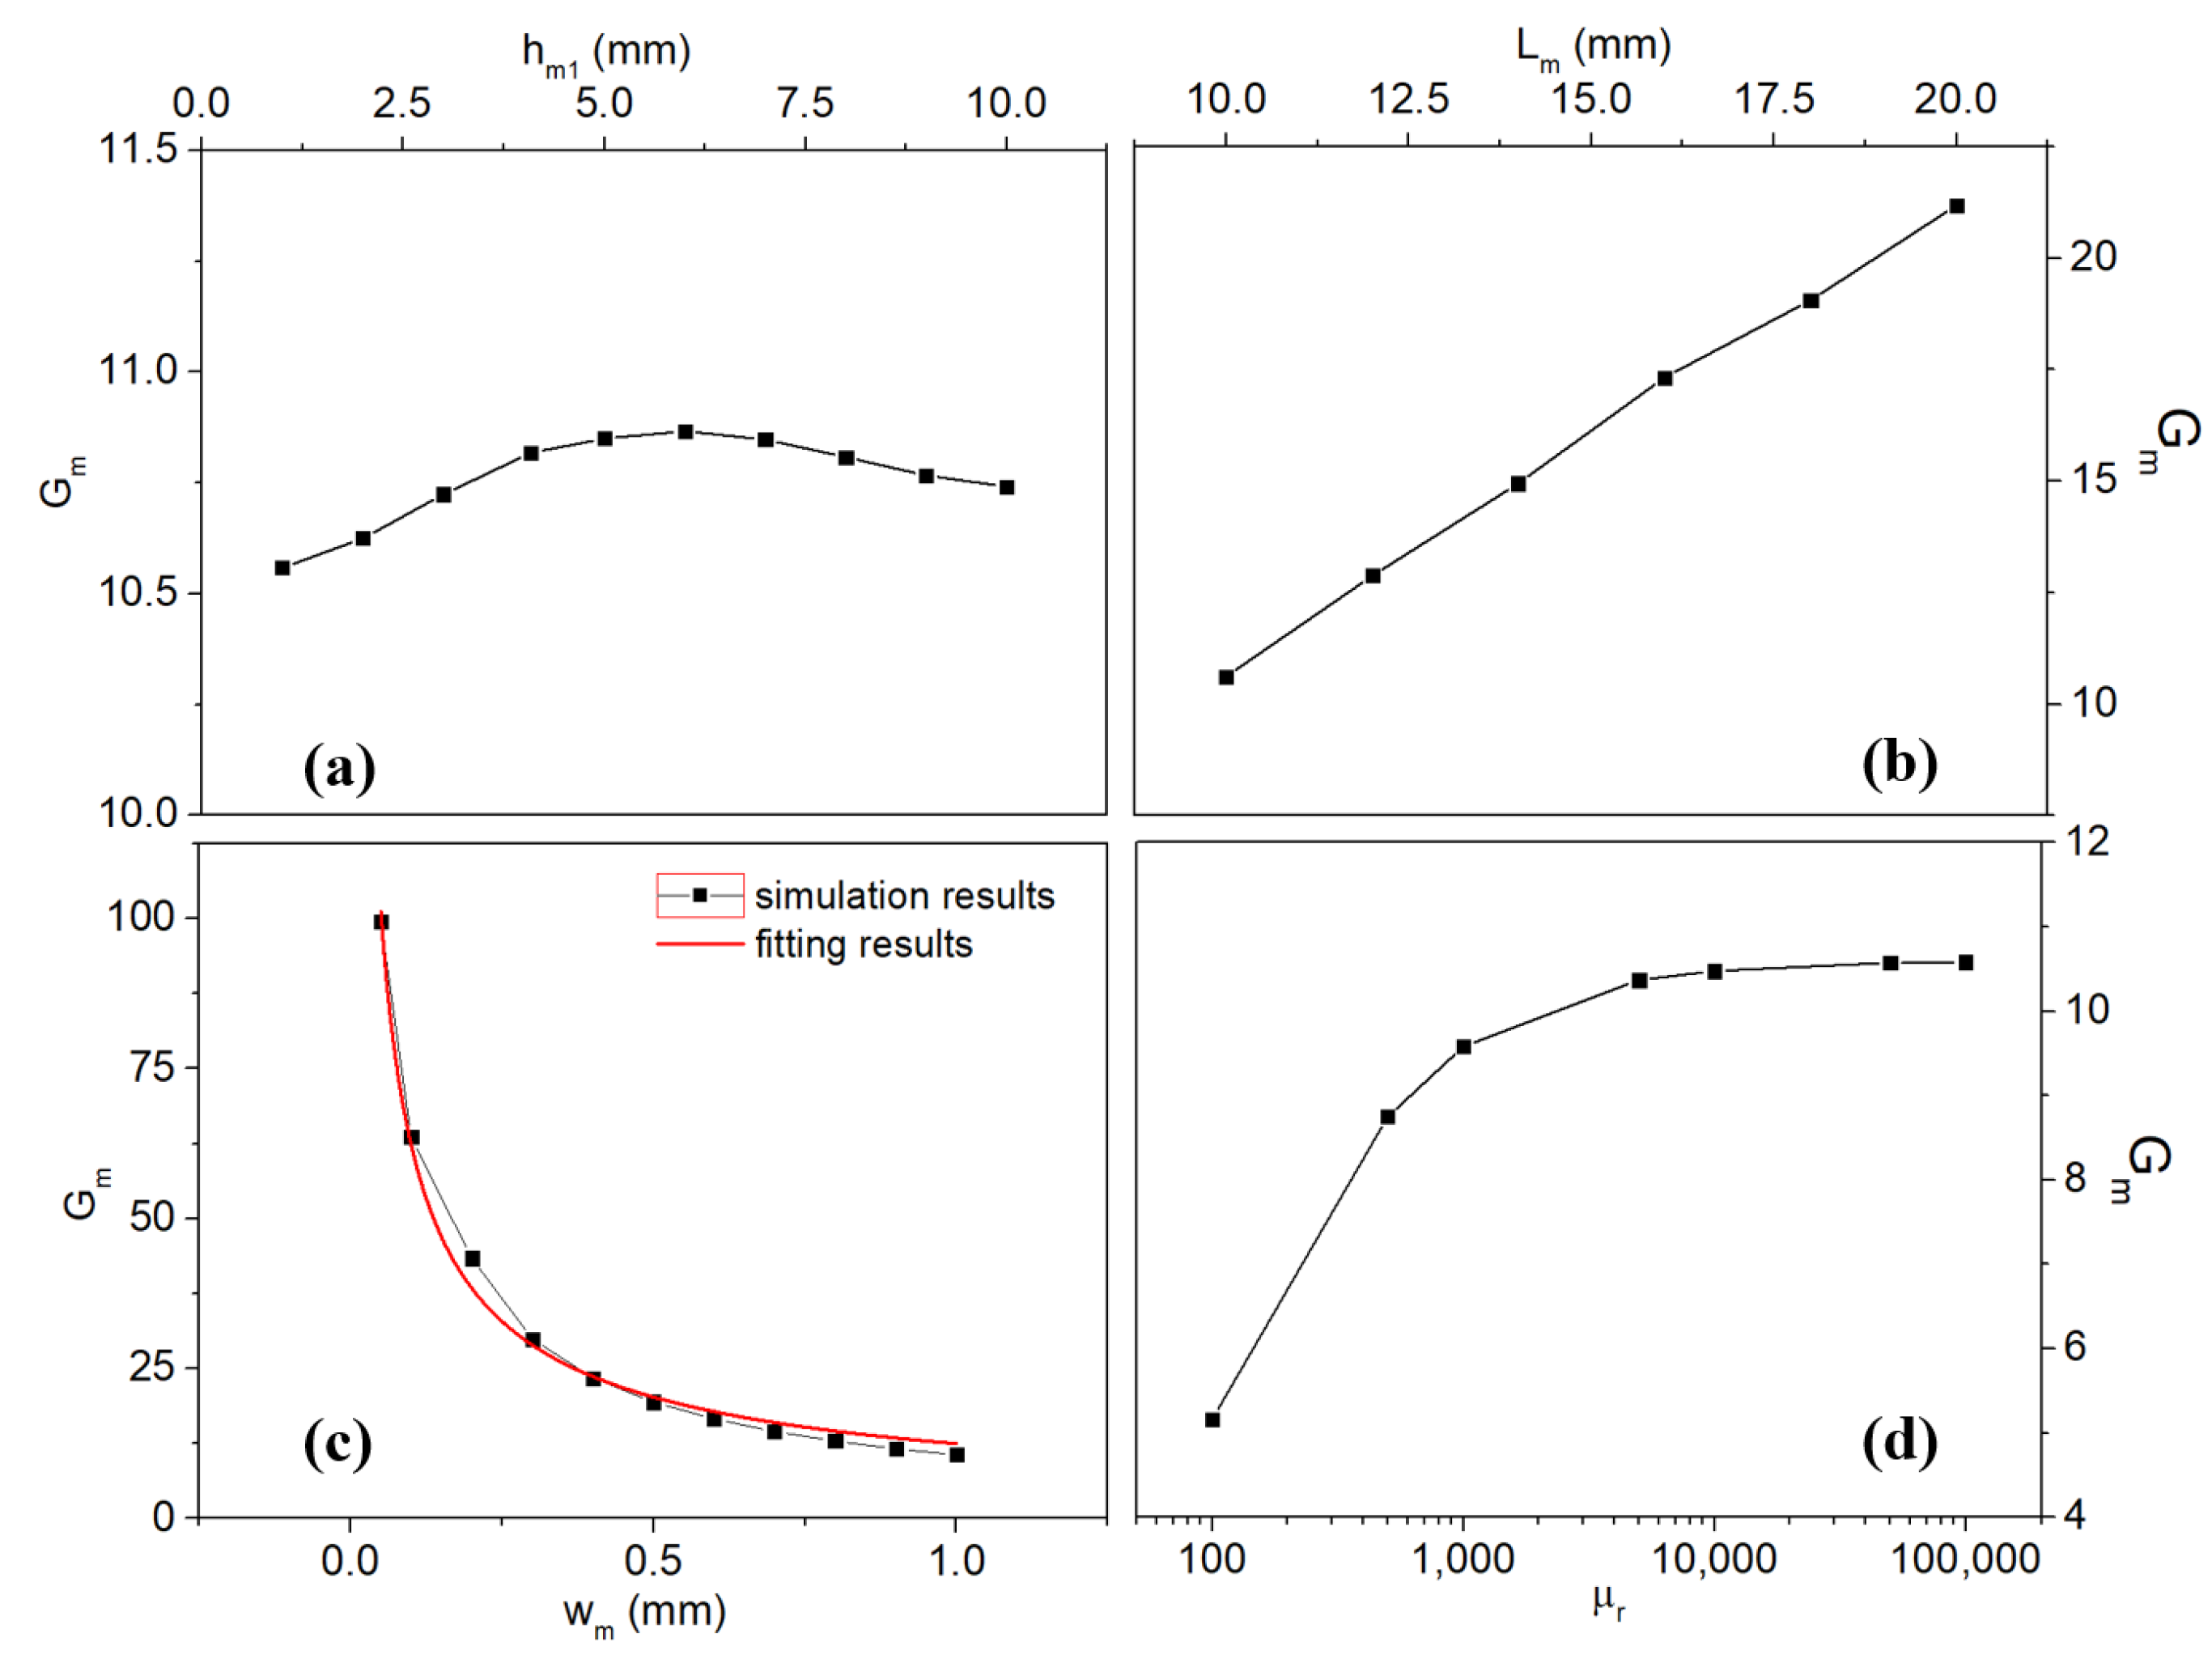
The main factors affecting the magnetic field amplification performance of the soft magnetic FC include permeability, demagnetizing factor, and gap width. First, the magnetic field amplification factor of the soft magnetic FC increases with the addition in permeability and starts to saturate when the permeability exceeds 5000. Secondly, enlarging the aspect ratio of the soft magnetic FC can effectively reduce the demagnetization factor and improve the magnetic field gain factor. Finally, the air gap should be minimized to reduce magnetic leakage. In practical applications, the size and gap width of the soft magnetic FC should be reasonably designed according to the size requirements of the sensor and the magnetic-sensitive element.
2
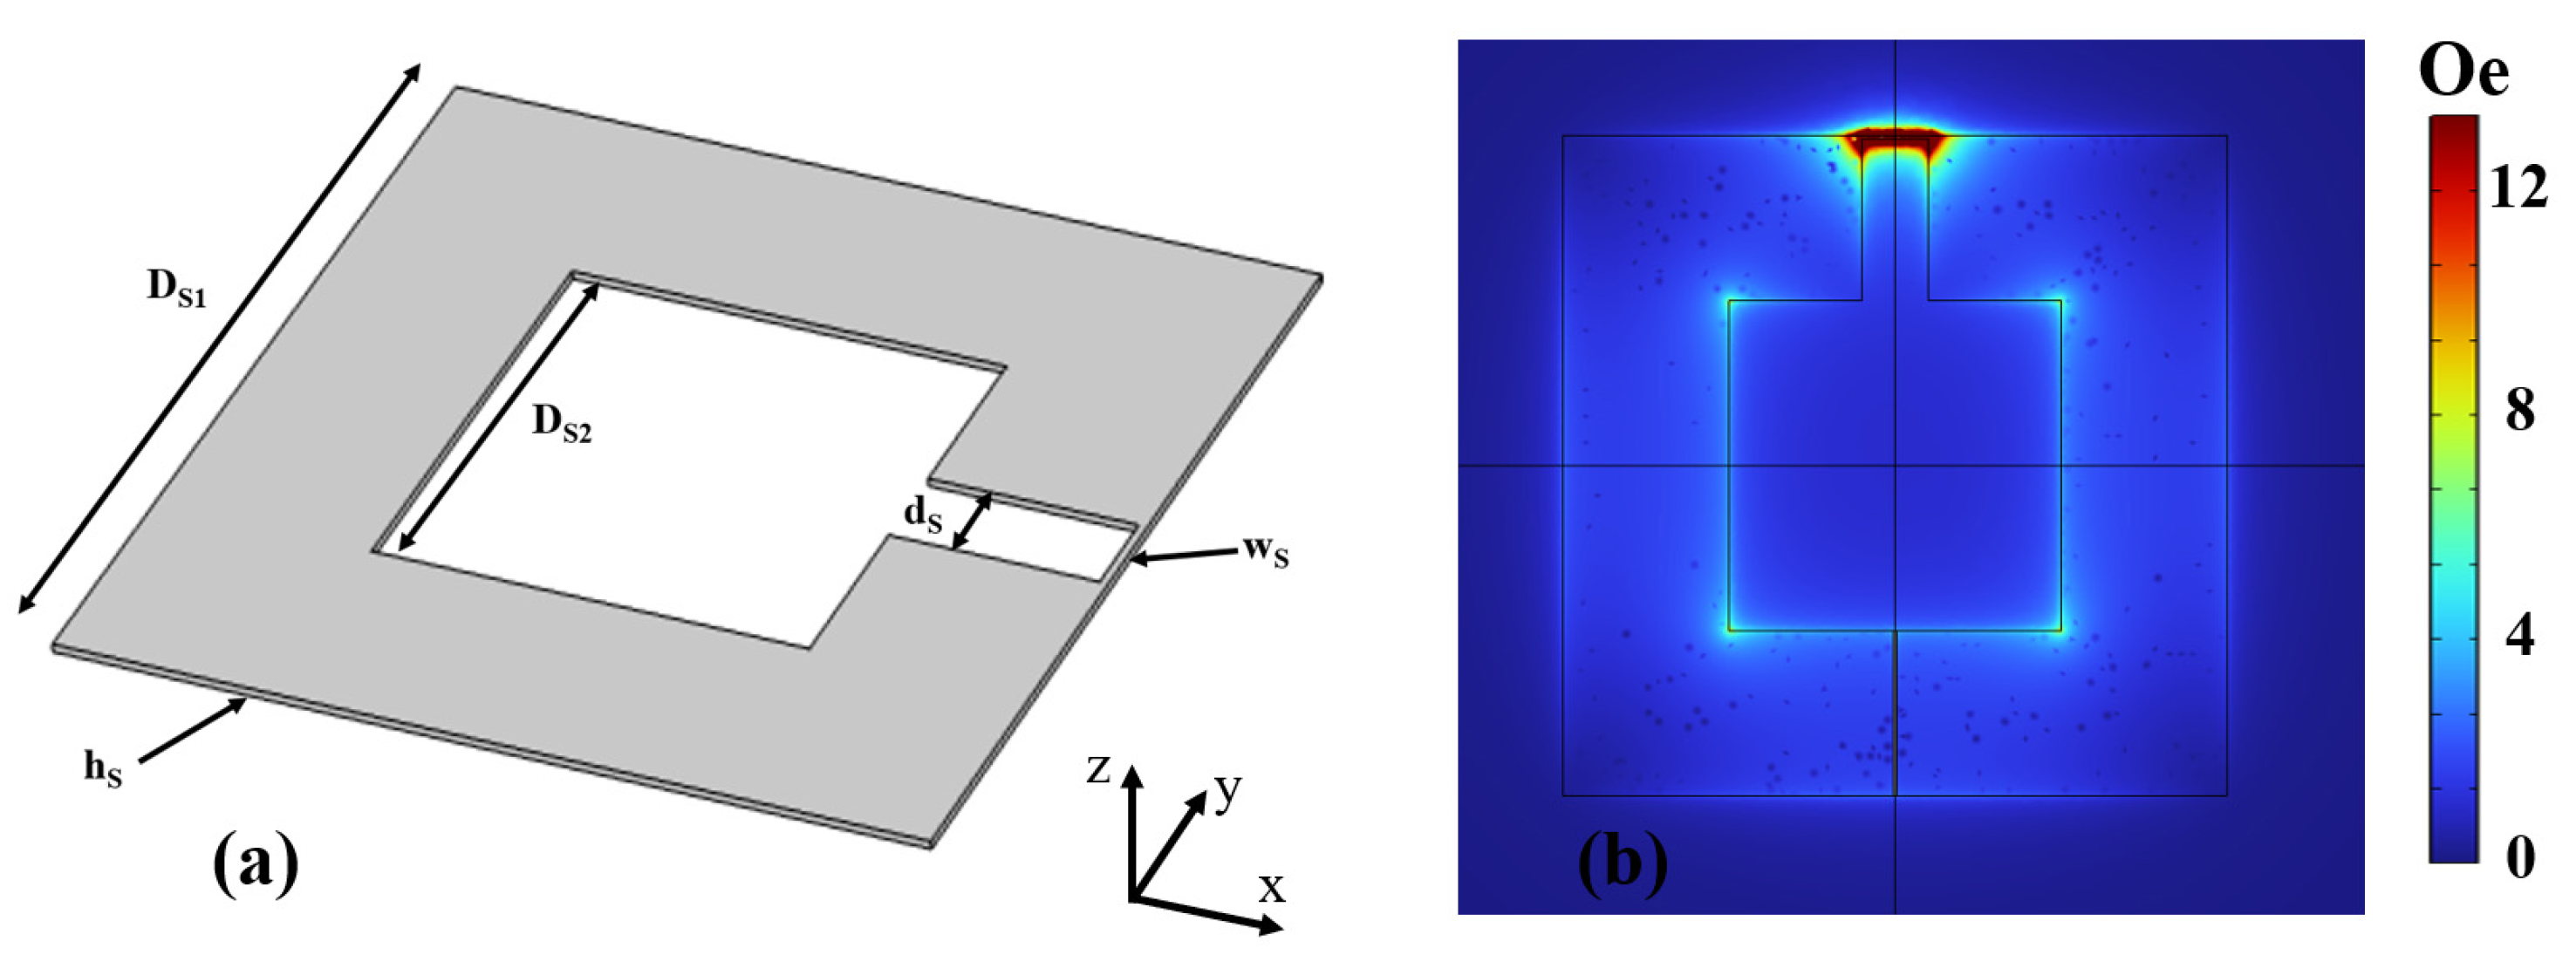
The main factors affecting the magnetic field amplification performance of the superconducting FC include the effective area, the self-inductance of the superconducting loop, and the width of the constriction. With the external dimensions of the superconducting FC determined, the ratio of the inner to outer radii of the superconducting loop should be set to 1:2, while minimizing the width of the constriction as much as possible. It should be noted that reducing the width of the constriction decreases the magnetic field amplification area and reduces the magnetic field range. In practical applications, the width of the constriction and other parameters should be reasonably designed according to the size requirements of the sensor and the magnetic-sensitive element (e.g., the size of the TMR junction region).
3
At the same size, the superconducting FC exhibits superior magnetic field amplification performance. Additionally, since the superconducting FC operates in a low-temperature environment, the thermal noise of the magnetic-sensitive element (TMR) can be effectively reduced, thereby enhancing magnetic field resolution. However, it is important to note that the superconducting FC requires low-temperature cooling equipment (such as refrigerators or liquid nitrogen). Therefore, in practical applications, the choice of flux concentrator should be made based on the specific application scenarios.

Author Contributions

Conceptualization, Y.W.; methodology, Y.W. and L.X.; validation, Y.W., J.C., and S.H.; formal analysis, J.C.; investigation, S.H.; resources, L.X. and J.C.; data curation, S.H.; writing—original draft preparation, Y.W.; writing—review and editing, Y.W.; funding acquisition, L.X. All authors have read and agreed to the published version of the manuscript.

Funding

This research was funded by the National Key R&D Program of China (2021YFB2011600), Foundation for Innovative Research Groups of the National Natural Science Foundation of China (51721005), and The Institute of Electrical Engineering, CAS (Grant No. 2021000038).

Data Availability Statement

The original contributions presented in the study are included in the article, further inquiries can be directed to the corresponding author.

Conflicts of Interest

The authors declare no conflicts of interest.

References

  1. Lenz, J.; Edelstein, A.S. Magnetic sensors and their applications. IEEE Sens. J. 2006, 6, 631–649. [Google Scholar] [CrossRef]
  2. Diaz-Michelena, M. Small Magnetic Sensors for Space Applications. Sensors 2009, 9, 2271–2288. [Google Scholar] [CrossRef]
  3. Zhou, L.; Wu, F.; Jolfaei, M.A.; Hobson, S.; Davis, C.L. Non-destructive characterisation of pearlitic steel microstructure at room temperature and in-situ microstructure development during heat treatment using electromagnetic sensors. NDT E Int. 2024, 147, 103199. [Google Scholar] [CrossRef]
  4. Li, W.; Wang, J.L. Magnetic Sensors for Navigation Applications: An Overview. J. Navigation. 2014, 67, 263–275. [Google Scholar] [CrossRef]
  5. Chiang, C.Y.; Jeng, J.T.; Lai, B.L.; Luong, V.S.; Lu, C. Tri-axis magnetometer with in-plane giant magnetoresistance sensors for compass application. J. Appl. Phys. 2015, 177, 17A321. [Google Scholar] [CrossRef]
  6. Petrenko, M.V.; Pazgalev, A.S.; Vershovskii, A.K. All-Optical Nonzero-Field Vector Magnetic Sensor for Magnetoencephalography. Phys. Rev. Appl. 2023, 20, 024001. [Google Scholar] [CrossRef]
  7. Morgan, W.M. Colloquium: Quantum limits to the energy resolution of magnetic field sensors. Rev. Mod. Phys. 2020, 92, 021001. [Google Scholar]
  8. Deeter, M.N. Fiber-Optic Faraday-Effect Magnetic-Field Sensor Based on Flux Concentrators. Appl. Opt. 1996, 35, 154–157. [Google Scholar] [CrossRef]
  9. Schneider, M.; Castagnetti, R.; Allen, M.; Baltes, H. Integrated Flux Concentrator Improves CMOS Magnetotransistors. In Proceedings of the IEEE Micro Electro Mechanical Systems, Amsterdam, The Netherlands, 29 January–2 February 1995; pp. 151–156. [Google Scholar]
  10. Drljaca, P.M.; Vincent, F.; Besse, P.A.; Popović, R.S. Design of Planar Magnetic Concentrators for High Sensitivity Hall Device. Sens. Actuators A 2002, 97, 10–14. [Google Scholar] [CrossRef]
  11. Zheng, C.; Zhu, K.; De Freitas, S.C.; Chang, J.Y.; Davies, J.E.; Eames, P.; Freitas, P.P.; Kazakova, O.; Kim, C.G.; Leung, C.W.; et al. Magnetoresistive Sensor Development Roadmap. IEEE Trans. Magn. 2019, 10, 1109. [Google Scholar]
  12. He, G.; Zhang, Y.; Qian, L.; Xiao, G.; Zhang, Q.; Santamarina, J.C.; Patzek, T.W.; Zhang, X. Pico Tesla magnetic tunneling junction sensors integrated with double staged magnetic flux concentrators. Appl. Phys. Lett. 2018, 113, 242401. [Google Scholar] [CrossRef]
  13. Edelstein, A.S.; Fischer, G.A.; Pedersen, M.; Nowak, E.; Cheng, S.F.; Nordman, C.A. Progress toward a thousandfold reduction in 1/f noise in magnetic sensors using an ac microelectromechanical system flux concentrator. J. Appl. Phys. 2006, 99, 08B317. [Google Scholar] [CrossRef]
  14. Guedes, A.; Almeida, J.M.; Cardoso, S.; Ferreira, R.; Freitas, P.P. Improving magnetic field detection limits of spin valve sensors using magnetic flux guide concentrators. IEEE Trans. Magn. 2007, 43, 2376–2378. [Google Scholar] [CrossRef]
  15. Manceau, S.; Brun, T.; Fischer, J.; Ducruet, C.; Sabon, P.; Cavoit, C.; Jannet, G.; Pinçon, J.-L.; Prejbeanu, I.L.; Kretzschmar, M.; et al. Large amplification of the sensitivity of symmetric-response magnetic tunnel junctions with a high gain flux concentrator. Appl. Phys. Lett. 2023, 123, 082405. [Google Scholar] [CrossRef]
  16. Lamichhane, S.; Yang, Y.; Sokolov, A.; Yin, X.L.; Liu, Y.F.; Liou, S.H. Half bridge configurated magneto-resistive sensors with flux guide structure for enhancing sensitivity. Appl. Phys. Lett. 2024, 124, 212401. [Google Scholar] [CrossRef]
  17. Chaves, R.C.; Freitas, P.P.; Ocker, B.; Maass, W. Low frequency picotesla field detection using hybird MgO based tunnel sensors. Appl. Phys. Lett. 2007, 91, 102504. [Google Scholar] [CrossRef]
  18. Robbes, D.; Dolabdjian, C.; Saez, S.; Monfort, Y.; Kaiser, G.; Ciureanu, P. High sensitivity magnetic sensors. IEEE Trans. Appl. Supercond. 2001, 11, 629. [Google Scholar] [CrossRef]
  19. Pannetier, M.; Fermon, C.; Le Goff, G.; Simola, J.; Kerr, E. Femtotesla magnetic field measurement with magnetoresistive sensors. Science 2004, 304, 1648–1650. [Google Scholar] [CrossRef]
  20. Pannetier, M.; Polovy, H.; Sergeeva, C.N.; Cannies, G.; Fermon, C.; Parkkonen, L. Magnetocardiography with GMR-based sensors. J. Phys. Conf. Ser. 2011, 303, 012054. [Google Scholar] [CrossRef]
  21. Pannetier-Lecoeur, M.; Parkkonen, L.; Sergeeva-Chollet, N.; Polovy, H.; Fermon, C.; Fowley, C. Magnetocardiography with sensors based on giant magnetoresistance. Appl. Phys. Lett. 2011, 98, 153705. [Google Scholar] [CrossRef]
  22. Campiglio, P.; Caruso, L.; Paul, E.; Demonti, A.; Azizi-Rogeau, L.; Parkkonen, L.; Fermon, C.; Pannetier-Lecoeur, M. GMR-based sensors arrays for biomagnetic source imaging applications. Magnetics. IEEE Trans. Magn. 2012, 48, 3501–3504. [Google Scholar] [CrossRef]
  23. Sinibaldi, R.; De Luca, C.; Nieminen, J.O.; Galante, A.; Pizzella, V.; Sebastiani, P.; Pannetier-Lecoeur, M.; Manna, A.; Chiacchiaretta, P.; Tamburro, G.; et al. NMR detection at 8.9 mT with a GMR based sensor coupled to a superconducting Nb flux transformer. Prog. Electromagn. Res. 2013, 142, 389–408. [Google Scholar] [CrossRef]
  24. Dyvorne, H.; Fermon, C.; Pannetier, M.; Polovy, H.; Walliang, A.L. NMR with superconducting-GMR mixed sensors. IEEE Trans. Appl. Supercond. 2010, 19, 819. [Google Scholar] [CrossRef]
  25. Wu, Y.; Xiao, L.Y.; Hou, S.Z.; Gao, Z.S.; Han, L. High Tc TMR-Superconducting Mixed Sensor: Fabrication and Performance. IEEE Trans. Appl. Supercond. 2019, 29, 1800105. [Google Scholar] [CrossRef]
  26. Sun, K.; Yang, L.; Li, P.; Tao, J.; Zhang, X.; Ji, M.; Qiu, W.; Zhang, Q.; Hu, Y. A superconductor/TMR composite magnetic sensor for pico-Tesla magnetic field detection. AIP Adv. 2022, 12, 105003. [Google Scholar] [CrossRef]
  27. Yang, L.; Sun, K.; Tao, J.; Zhang, X.; Huang, D.; Pan, M.; Hu, J.; Qiu, W.; Ji, M.; Hu, Y.; et al. Superconducting magnetic flux transformation amplifier for the superconductor/magnetoresistance mixed magnetic sensor: Finite element simulation method and experimental verification study. Sens. Actuators A 2022, 342, 113658. [Google Scholar] [CrossRef]
  28. Yang, L.; Sun, K.; Pan, M.; Zhang, X.; Peng, J.; Hu, Y.; Qiu, W.; Li, P. The In-Plane Magnetic Field Measurement Method of SC/MR Mixed Sensor and Its Three-Axis Magnetic Sensor with Integrated Magnetic Concentrator. IEEE. Sens. J. 2023, 23, 240–246. [Google Scholar] [CrossRef]
  29. Sun, K.; Tao, J.; Yang, L.; Peng, J.; Li, P.; Pan, M.; Chen, D.; Huang, D.; Zhang, X.; Qiu, W.; et al. Vertical Magnetic Flux Concentrators for High-Sensitivity Superconductor/Magnetoresistance Composite Sensors. IEEE Sens. J. 2022, 22, 8460–8465. [Google Scholar] [CrossRef]
  30. Wu, Y.; Han, S.Y.; Xiao, L.Y.; Chen, J.M. TMR-high-temperature superconductor composite magnetic sensor and its performance optimization. Cryogenics 2024, 139, 103810. [Google Scholar] [CrossRef]
  31. Han, S.Y.; Wu, Y.; Xiao, L.Y.; Chen, J.M. Fabrication and performance enhancement of TMR-Superconducting composite magnetic sensors for weak magnetic field detection. Cryogenics 2024, 138, 103803. [Google Scholar] [CrossRef]
  32. Douine, B.; Male, G.; Lubin, T.; Mezani, S.; Leveque, J.; Berger, K. Improvement of YBCO superconductor magnetic shielding by using multiple bulks. J. Supercond. Novel Magn. 2014, 27, 903–990. [Google Scholar] [CrossRef]
Figure 1. (a) Magnetic field distribution of soft-magnetic FC (the background magnetic field is set to 1 Oe, along the x-direction). (b) Schematic diagram of the T-shaped magnetic FC.
Crystals 14 00747 g001
Figure 2. (a) The variation of the magnetic field amplification factor G m with (a) h m 1 , (b) L m , (c) w m , and (d) μ r .
Crystals 14 00747 g002
Figure 3. (a) The structure of the superconducting FC. (b) Magnetic field distribution of superconducting FC (the background magnetic field is set to 1 Oe, along the z-direction).
Crystals 14 00747 g003
Figure 4. (a) The variation of G s with D s 2 . (b) The variations of L and S with D s 2 . (c) The variation of G s with w s . (d) The distribution of G s on the surface of the superconducting constriction.
Crystals 14 00747 g004
Figure 5. (a) The series structure of the fabricated TMR. (b) Voltage–magnetic field response curve of TMR at room temperature and 77 K. (c) Voltage noise and (d) magnetic noise spectrum of TMR at room temperature and 77 K.
Crystals 14 00747 g005
Figure 6. (a) Sensitivity comparison of TMR-soft magnetic (TMR-MFC) and TMR-superconducting (TMR-SC) composited magnetic sensor. The voltage noise of (b) TMR-soft magnetic and (c) TMR-superconducting magnetic sensors compared with that of the TMR without magnetic FC. (d) Magnetic noise of the two composite magnetic sensors.
Crystals 14 00747 g006
Table 1. Initial structural parameters of T-shaped magnetic FC.
ParametersDm1Dm2Lmhm1hm2wm
Unit (mm)20210111
Table 2. Initial structural parameters of superconducting FC.
ParametersDS1DS2hsdsws
Unit (mm)20100.00121
Disclaimer/Publisher’s Note: The statements, opinions and data contained in all publications are solely those of the individual author(s) and contributor(s) and not of MDPI and/or the editor(s). MDPI and/or the editor(s) disclaim responsibility for any injury to people or property resulting from any ideas, methods, instructions or products referred to in the content.

