Article

Study on the Wear Resistance Performance of the Hot-Rolled BTW1/Q345 Composite Plate under Different Annealing Temperatures

College of Mechanical Engineering, Taiyuan University of Science and Technology, Taiyuan 030024, China
*
Author to whom correspondence should be addressed.
Crystals 2024, 14(9), 772; https://doi.org/10.3390/cryst14090772
Submission received: 7 July 2024 / Revised: 12 August 2024 / Accepted: 28 August 2024 / Published: 29 August 2024
(This article belongs to the Section Crystalline Metals and Alloys)

Abstract

:
Wear-resistant steel/carbon steel composite plates not only have the double performance advantages of high strength and wear resistance but can also reduce energy consumption and production costs. Based on a 50% reduction rate, the wear resistance of the BTW1/Q345 composite was studied at different annealing temperatures, and the dry friction and wear tests of the BTW1/Q345 composite at different annealing temperatures were carried out using RETC MFT-5000. By using the white-light interference three-dimensional surface profiler, scanning electron microscope (SEM), and backscattered electron diffraction (EBSD) technology, we carried out a detailed analysis of the macroscopic and microscopic morphology and wear mechanism of wear traces at different annealing temperatures. The effects of the annealing process on the thickness and composition of the wear layer were studied, and the causes of wear failure were analyzed based on the results of scanning electron microscopy. It was found that as the annealing temperature gradually increased, the particle size near the scratch of BTW1 in the wear-resistant layer of the composite plate became smaller. On this basis, the effects of different annealing temperatures on the friction and wear characteristics of the composite plate were further studied. At the annealing temperature of 860 ° C, the wear resistance of the material was the best.

1. Introduction

With the continuous development of science and technology, the working efficiency of mechanical equipment has been improved, resulting in a large number of workpieces and equipment failure due to wear and tear. Wear failure, which is closely related to industrial production, has attracted more and more attention, and wear is one of the main forms of failure of metal materials, and the economic losses caused by it are huge [1]. According to statistics, about 30% of the energy of the world’s industrialized countries is consumed in different forms of wear and tear. For example, in the United States, the annual loss caused by friction and corrosion is about 100 billion US dollars, and the annual consumption of wear-resistant steel used for abrasive wear conditions in China is about 2 million tons, resulting in economic losses of about 40 billion yuan [2].
Traditional wear-resistant materials, such as high-manganese steel, wear-resistant cast-iron steel, and low-alloy wear-resistant steel, show excellent wear resistance. These materials can not only withstand large external shocks and high stress but are also very suitable for use in harsh working environments. Using these materials to manufacture parts can effectively extend the service life of the machine [3]. In the mining machinery industry, the traditional wear-resistant steel is mostly high-manganese steel. Although high-manganese steel has the characteristics of work hardening, it can only perform its function under large impact loads, and the service conditions in coal mining are mostly medium and low impact and cyclic fatigue, and high-manganese steel cannot improve its wear resistance for the working conditions with small impact loads [4]. To adapt to the wear conditions of medium and low loads, on the basis of traditional high-manganese steel, in order to solve the problem of poor mechanical properties caused by the decrease in manganese content, researchers have successfully developed austenitic medium-manganese steel by reducing the content of manganese and adding elements such as chromium. The results showed that the surface layer of austenitic manganese steel hardens rapidly under medium and low impact, extrusion, and other working conditions, and the hardened layer showed good anti-wear performance: compared with high-manganese steel, its work-hardening sensitivity was higher [5].
The emergence of wear-resistant composite plates greatly meets the requirements for the wear-resistant performance of materials [6]. Metal composites are composed of two or more materials that have superior properties compared to individual components, with cladding providing high hardness and excellent wear resistance, and substrates providing good toughness and weldability [7,8]. Wear-resistant composites combine the advantages of matrix materials and cladding materials. Under harsh working conditions, when the material is subjected to severe impact, a large amount of energy generated by the impact is absorbed by the substrate, so the material has strong impact resistance and crack resistance, has several times the wear resistance as that of ordinary carbon steel, and has excellent comprehensive properties that cannot be matched by a single metal or alloy. In addition to significantly improving the service life of parts, wear-resistant composites can also effectively reduce the consumption of alloy materials, thereby saving resources and reducing production costs. Therefore, wear-resistant composite materials are widely used in various industrial fields [9].
As a new generation of advanced high-strength steel, medium-manganese steel has high strength and high plasticity. In recent years, manganese steel has attracted more and more attention from scholars from all over the world, and the research of scholars at home and abroad mainly focuses on composition design, rolling parameter design, and heat treatment process optimization [10,11,12,13]. From the perspective of process optimization, annealing treatment can effectively improve the mechanical properties of austenitic steel, and the main strengthening elements include grain refinement strengthening, dislocation strengthening, and precipitation strengthening [14]. By adjusting the manganese content in the medium-temperature quenched and tempered steel, quenched and tempered steel with different performance requirements can be obtained. The volume fraction of residual austenite in the room-temperature structure of medium-manganese steel needs to reach about 20–30%, which requires the alloying element to be an element with austenite zone expansion and stabilization, and a slow diffusion rate to ensure the formation of residual austenite and the ultra-refinement of the matrix. At the same time, it needs to inhibit the excessive coarseness of martensite slats in the annealing process, so the replacement atom should be selected instead of the pure interstitial atom for alloying design, which needs to increase the content of Mn. At present, the research on the Mn content in medium-manganese steel is concentrated between 3% and 12% [15,16,17]. Grajcar et al. compared the two components of medium-manganese steel with Mn content of 3% and 5% and found that the hardness of the material increased with the increase in Mn content, but higher Mn content would reduce the C content and lattice constant of residual austenite, and it was not conducive to obtaining more residual austenite [18]. Aydin et al.’s research on the medium-manganese steel with Mn content of 5%, 7%, and 10% showed that increasing the Mn content can reduce the stacking fault energy in the austenite, which is conducive to the improvement of mechanical properties, and the increase in Mn content can obtain more residual austenite [19]. Zhi et al. [20] studied the effect of rolling pressure on the microstructure and mechanical properties of hot-rolled BTW1/Q345R composite plates. The results showed that the rate under high pressure led to the rupture of the interfacial oxide film and further formed a large composite metallurgical bond. Bai et al. [21] found that SDHA austenitic steel had better wear resistance than martensitic steel at 400~700 °C, which is attributed to the excellent hardness stability at high temperatures.
The BTW1 series of medium-manganese wear-resistant steel produced by a steel enterprise is a new type of wear-resistant hot-rolled steel plate obtained through microalloying, controllable heat treatment, and composite rare-earth metamorphism. Under the condition of medium- and low-impact loads, the wear-resistant self-strengthening effect of the hot-rolled plate is realized with the help of deformation-induced martensitic phase transformation, twin crystal transformation, grain refinement, and other strengthening effects, and the wear resistance is better than that of common medium- and low-alloy steels, and martensitic and bainite wear-resistant steels [22]. In this paper, the friction and wear mechanisms of the wear-resistant layer of the BTW1/Q345 composite plate under different annealing temperatures at a 50% rolling pressure rate were studied.

2. Experiment

2.1. Method

The material used was the vacuum hot-rolled BTW1/Q345 composite plate, the main components of which are shown in Table 1. The BTW1/Q345 plate was rolled with a 50% total pressing rate, and 15 mm × 15 mm × 10 mm (length × width × height) cuboid samples were taken by wire cutting, of which the BTW1 layer was 4 mm and Q345 layer was 6 mm, refer to the Table 1, Table 2 and Table 3. The samples were annealed at different temperatures using a muffle furnace. The annealing temperatures were 860 °C, 900 °C, and 940 °C, respectively, and the annealing time was 20 min. After annealing, the oxide layer on one side of the BTW1 specimen was sanded and removed. The surface of the BTW1 cladding was polished with sandpaper with a sand degree of 2000, and then polished with a metallographic polishing machine to ensure that the roughness of each sample was consistent.
In a room-temperature (25 °C) environment, The tests were carried out on the reciprocating sliding module of the RTEC (MFT-5000) friction and wear testing machine. Using a tungsten carbide ball with a diameter of 9.3 mm, the friction time was 3600 s, the frequency was 1 Hz, the test load was 200 N, the friction mode was linear reciprocating motion, and the stroke was 6 mm (that is, 1 s reciprocating 12 mm, for a total of 3600 cycles).To reduce error, all tests were performed three times, refer to the Figure 1.
After the friction and wear experiment, the microstructure of the wear scar was observed by scanning electron microscope (SEM). The sample was cut along the direction of the wear scar, and the sample was sanded and metallographically polished. Polishing with the vibration polishing instrument, EBSD samples with sub-surface texture were prepared, EBSD detection was carried out, and their microstructures were analyzed.

2.2. Characterization Form

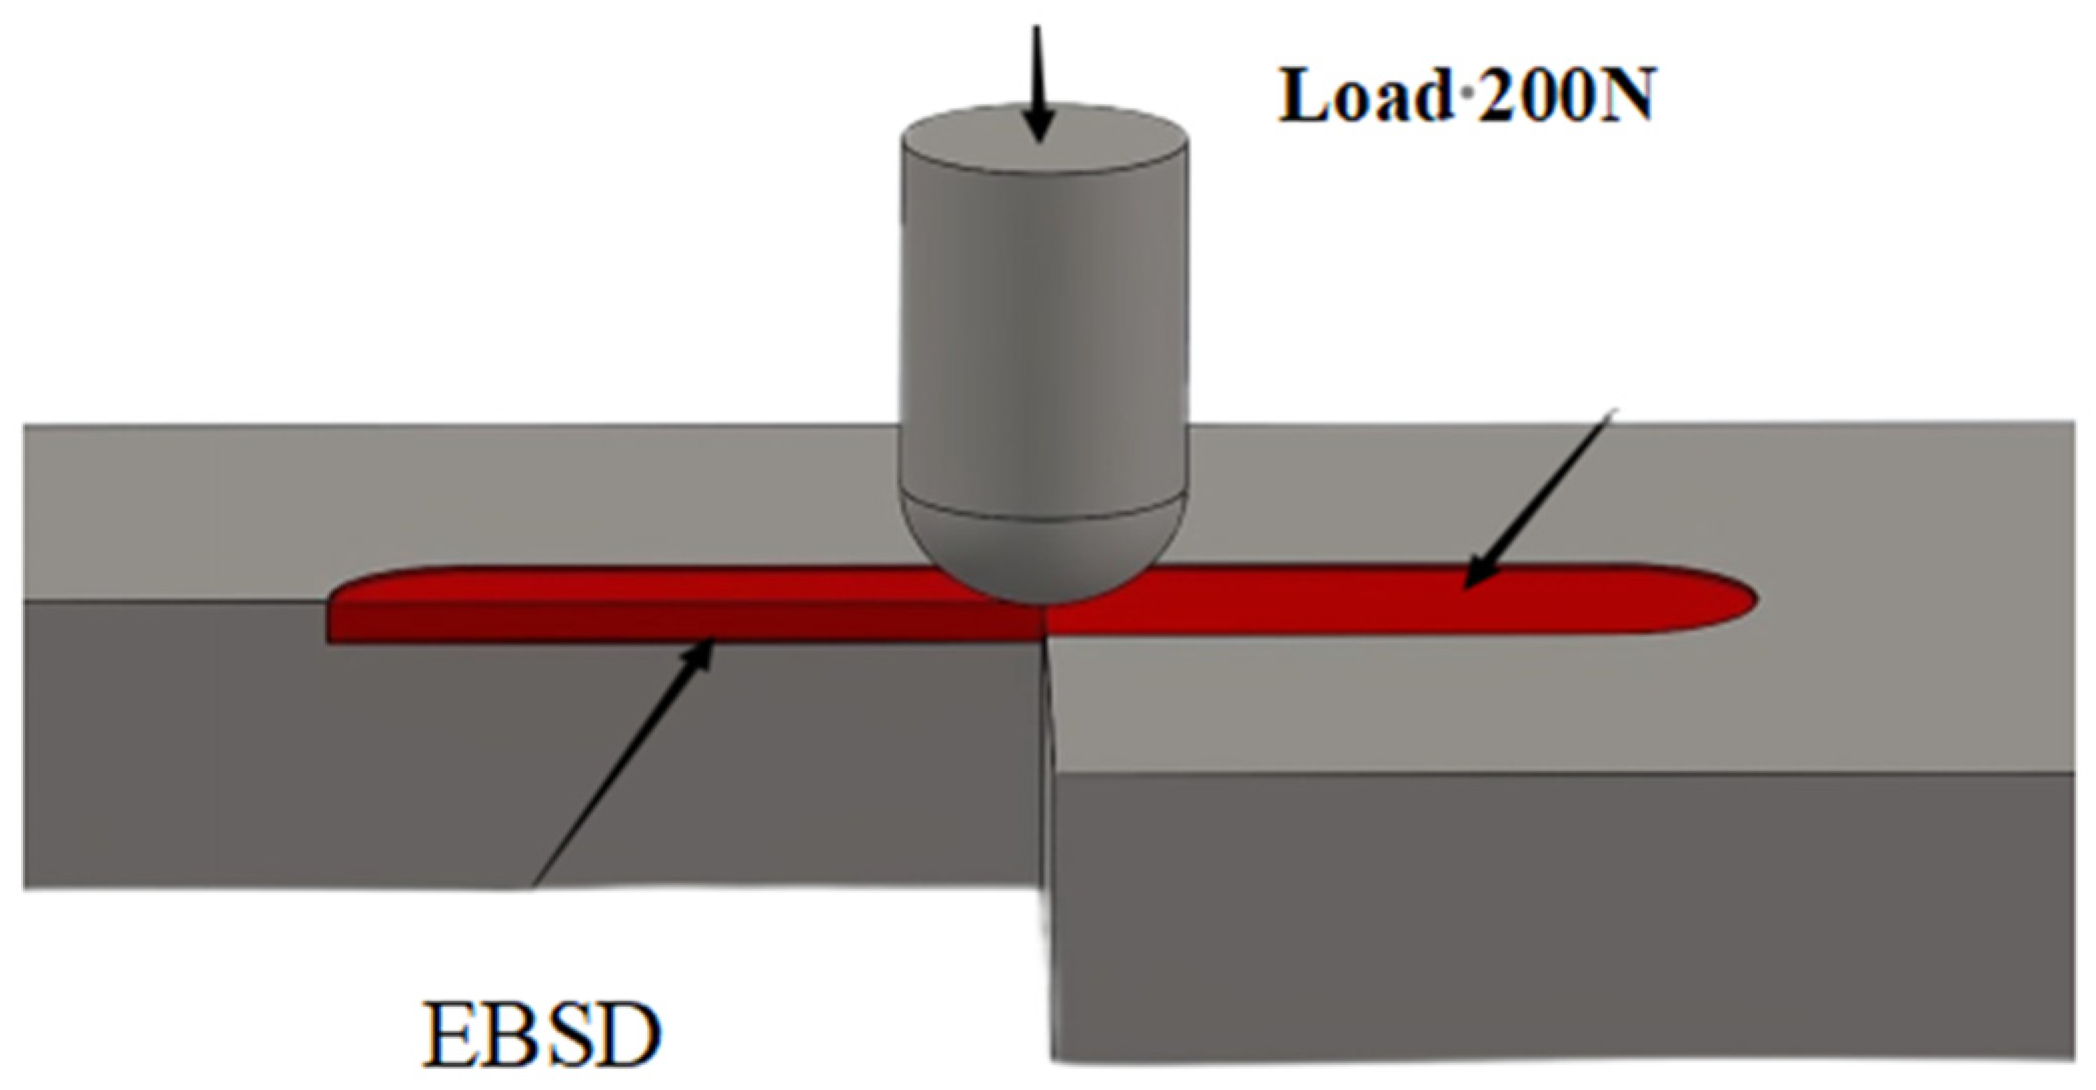
2.2.1. Friction Factor and Three-Dimensional Topography

The dynamic change in the friction factor reflects the working stability of the friction pair during dry friction, which is one of the important indicators to evaluate the friction performance. The friction factor in the test came from the dynamic measurement of the RTEC (MFT-5000) friction and wear testing machine, which measures the friction shear force and normal stress during the test process online, and calculates the average friction factor based on the simple adhesion theory through the set data acquisition frequency, so that the friction shear force obtained by the load cell is proportional to the normal stress [23].
The two-dimensional and three-dimensional observations of the wear marks produced by the test were carried out by the white-light interferometry three-dimensional surface profiler of the testing machine, the macroscopic morphology of the wear marks was obtained, and the depth and width of the wear marks were measured through the three-dimensional diagram.

2.2.2. Observation of Microstructure and Wear Surfaces

The microstructure of the BTW1/Q345 composite wear layer BTW1 and the micromorphology of the wear surface of the specimen were observed and analyzed by scanning electron microscope (ZIESS SIGMA FE SEM). Taking the area near the wear trajectory as the sample, EBSD was used to analyze the influence of friction and wear on the structure of the sample.

3. Results and Discussion

3.1. Tribological Properties

3.1.1. Friction Factor

Figure 2 shows the sliding friction coefficient curve of the wear-resistant layer BTW1 (860 °C, 900 °C, and 940 °C) and the tungsten carbide ball of the BTW1/Q345 composite plate, with a depressive rate of 50% under dry friction conditions under different heat treatment temperatures. The average friction coefficients of the samples without heat treatment and annealed at 860 °C, 900 °C, and 940 °C were 0.401, 0.415, 0.422, and 0.459, respectively. The trend of the friction factor in the figure with time shows that the friction factor of the sample first increased rapidly, then decreased to a certain extent, and then gradually increased, and finally reached a zigzag fluctuation. In the initial wear stage, the friction factor showed an upward trend and fluctuated greatly, because at the beginning of the experiment, the surface of the friction pair was uneven, the contact mode of the friction pairs at the beginning of the sliding stage was point contact, the load per unit area was very large, and the dry friction was carried out. The sliding friction surface was not lubricated, so the friction factor increased rapidly [24]. After a period of friction, grinding chips were generated, a large amount of grinding chips accumulated between the grinding pairs to play the role of solid lubrication, and the friction factor decreased slightly [25]. As the friction continued, the grinding debris increased, and the hard abrasive debris was pressed into the friction surface under the normal action, resulting in a furrow and an increase in the surface contact area, resulting in an increase in the friction factor. The zigzag fluctuation in the stabilization phase was caused by the microstructural changes in BTW1. The matrix of BTW1 is austenite, with excellent fracture toughness. In the process of friction and wear, austenite is in a metastable state, which makes it easy to induce phase transformation strengthening, micro-alloy strengthening, and dislocation deformation strengthening. As the hardened material surface wears out, the newly exposed surface also reinforces itself. Therefore, when the scraper of the scraper conveyor adopts the BTW1 wear-resistant steel composite plate, the transportation of coal will cause wear on the scraper, and the wear-strengthening mechanism of BTW1 can increase the service time of the scraper [26].
As shown in Figure 2, the friction factor of the BTW1/Q345 composite plate wear-resistant BTW1 layer after annealing was higher than that before annealing, the heat treatment temperature was 940 °C, and the friction factor was the highest.

3.1.2. Macroscopic Morphology and Cross-Sectional Curve of Wear Marks

The specimen and tungsten carbide balls, which were used as abrasive materials, were subjected to shear stress and compressive stress during sliding friction wear. Due to the different annealing temperatures of the materials, the material removal mechanism was also different in the process of friction and wear, resulting in different macroscopic morphologies of the wear marks.
Figure 3 shows the three-dimensional morphology and scratch cross-section curve of the scratches on the wear surface of the specimen after the wear-resistant layer of the BTW1/Q345 composite plate was pressed at 50%, and the original surface was selected as the reference surface. The macroscopic topography of the middle part of the scratch can be seen from Figure 3a–d, and the width and depth of different specimens can be seen from the legend. Figure 3e provides a more intuitive view of the depth and width of the scratch at different annealing temperatures. It can be concluded that when the depressing rate was 50%, the maximum depth and width of the scratch of the unannealed specimen were 51 μm and 1.35 mm, respectively, the maximum depth of the scratch was 20 μm and the width was 0.825 mm when the annealing temperature was 860 °C, the maximum depth of the scratch was 37 μm and the width was 1.125 mm when the annealing temperature was 900 °C, and the maximum depth of the scratch was 27 μm and the width was 1.025 mm when the annealing temperature was 940 °C.
Based on the topography results of Figure 3, when the material was not annealed, the wear was the most severe, the maximum depth value was the largest, and the width was the widest. The annealing was completed at 860 °C, the maximum scratch depth of the wear-resistant layer was 20 μm, the width was 0.825 mm, and the wear performance was the best.

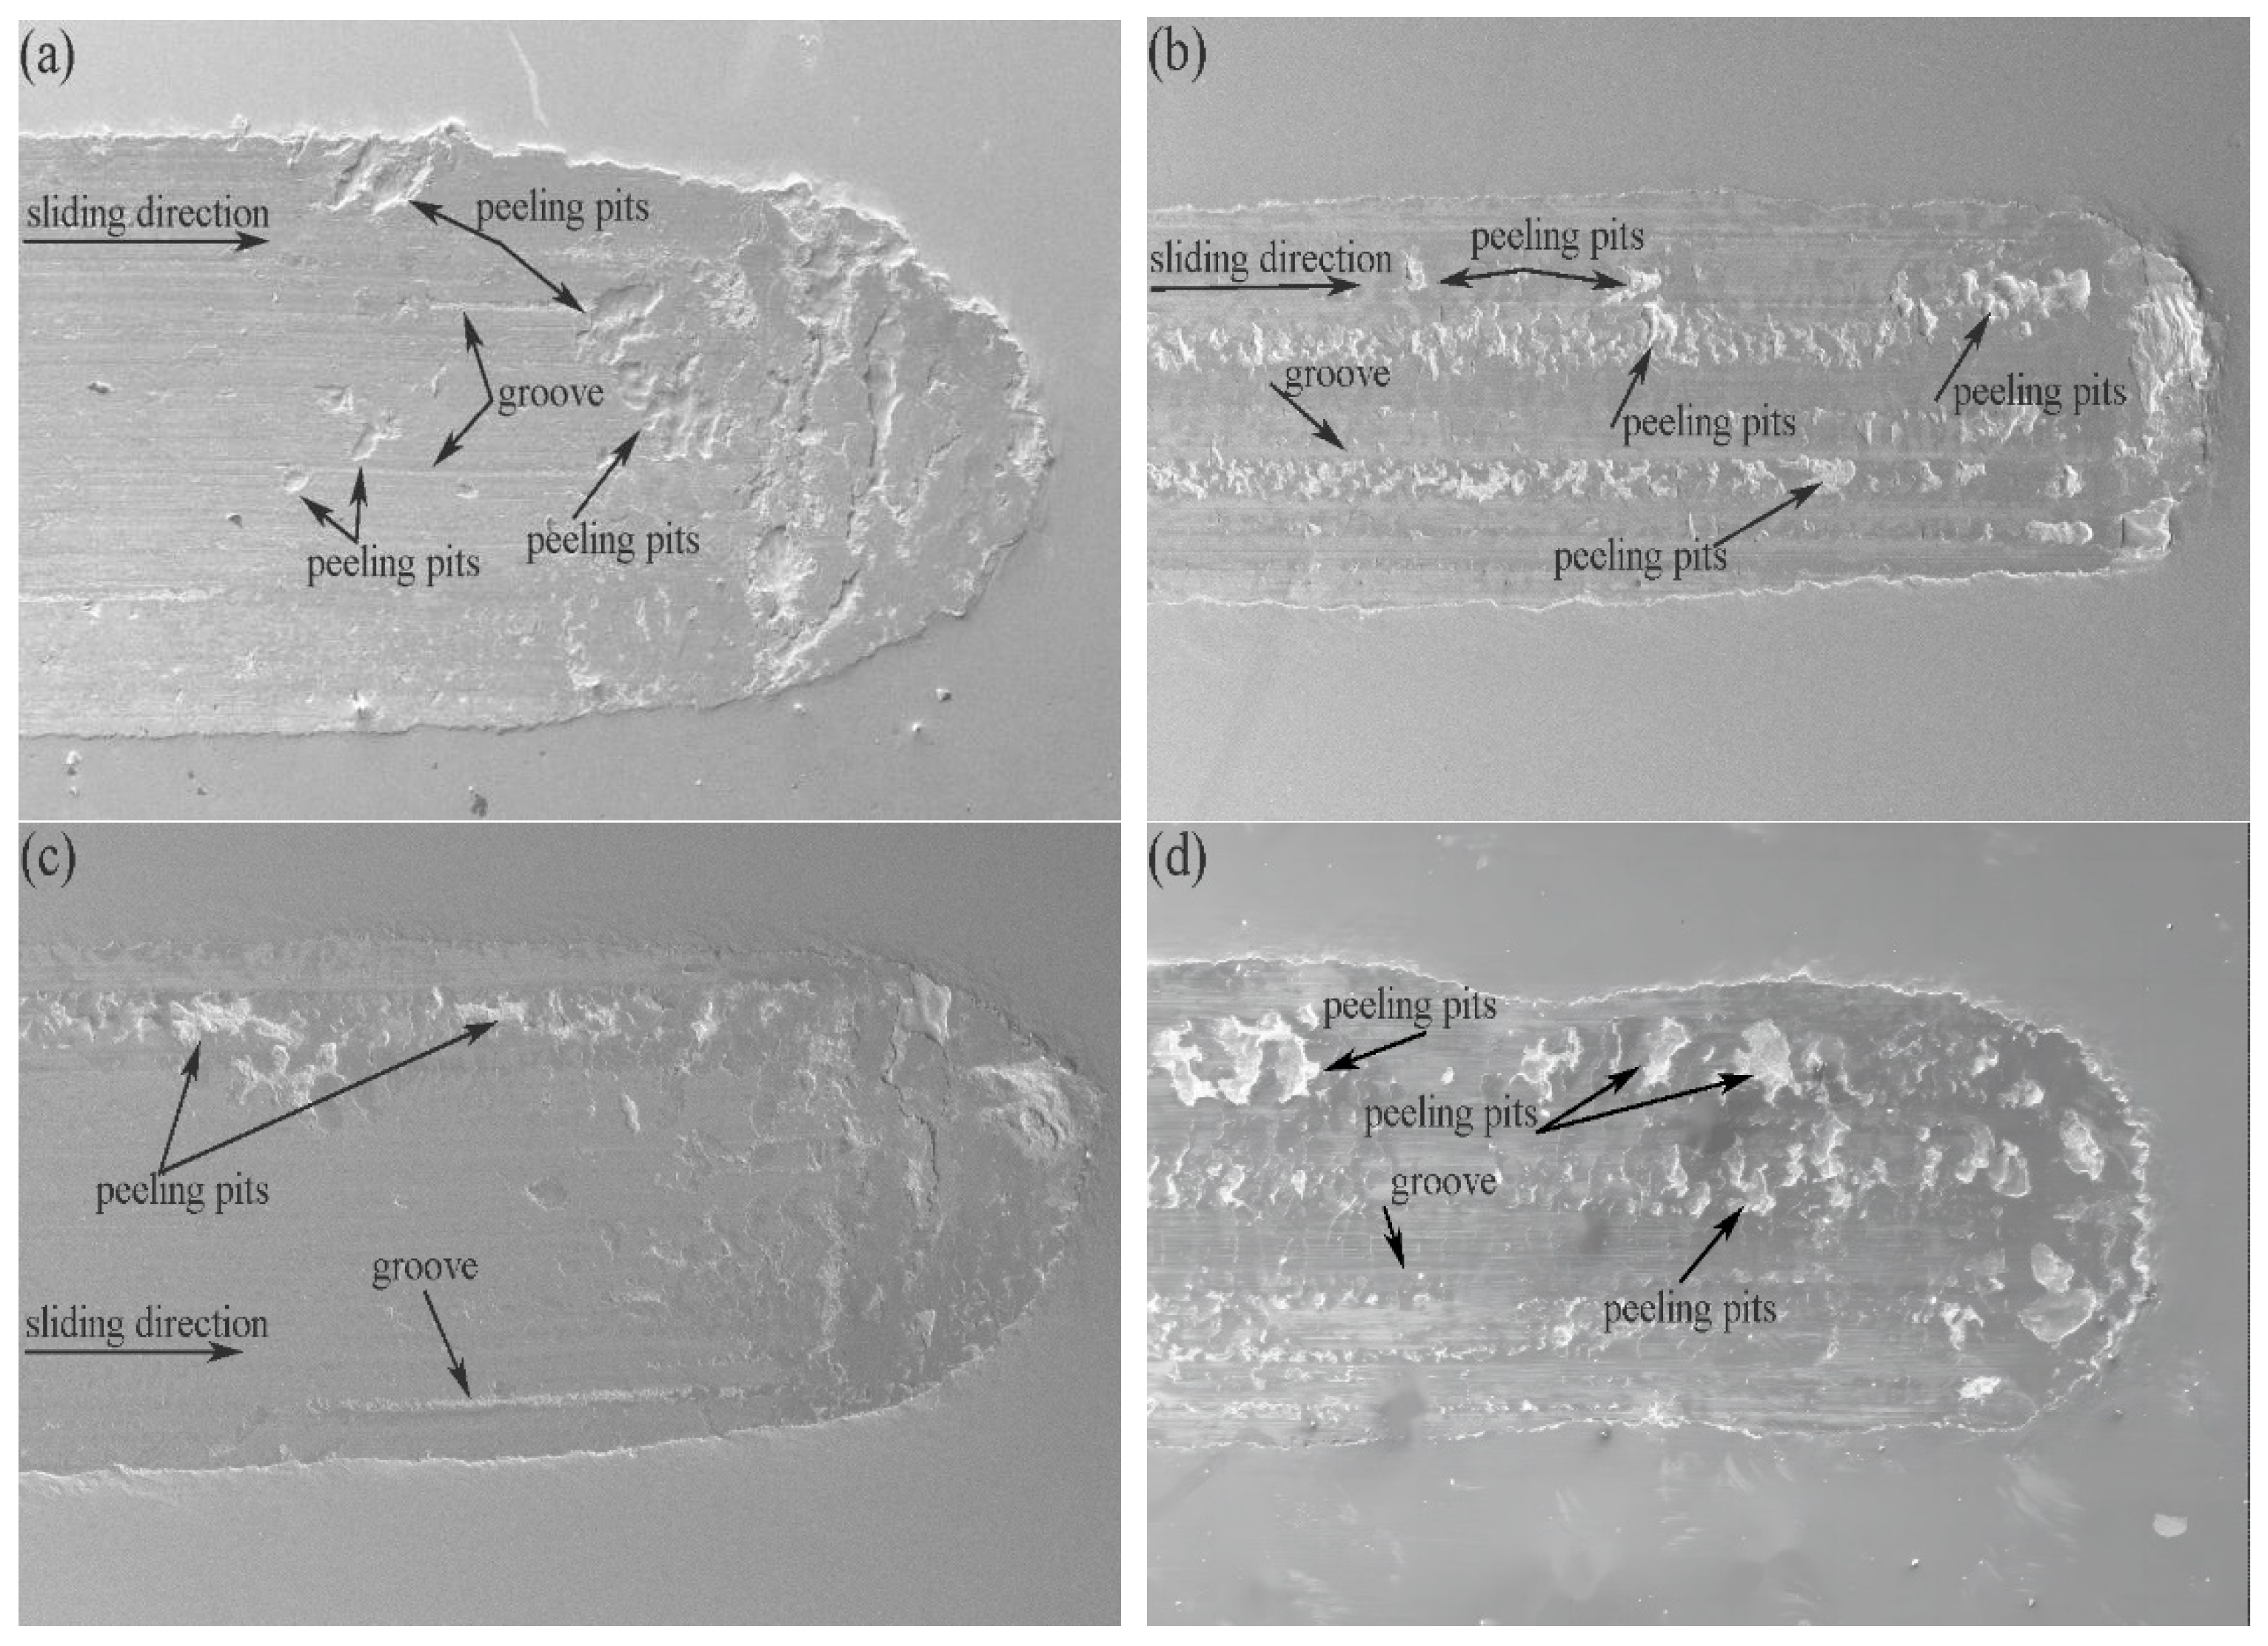
3.1.3. Analysis of Wear Morphology and Mechanism

Figure 4 shows SEM morphology photos of different specimens subjected to sliding friction wear under a load of 200 N at room temperature. As shown in Figure 4a, BTW1 without heat treatment had obvious plow-groove scratches and local peeling pits. The plow groove deepened and widened compared to the annealed sample, and there was a peeling layer at the edge of the scratch, with obvious layering. A portion of the debris generated during the friction process remained in the scratches. The debris cut into the surface under normal load and formed plow grooves during sliding. The peeling pits on the worn surface belonged to the characteristics of fatigue wear, which are the wear and peeling damage caused by local material fatigue under the action of contact force after an abrasive is pressed into the worn surface. It can be seen that the wear mechanism shifted from adhesive wear to plowing and fatigue wear. From Figure 4b–d, it can be seen that there were small furrow scratches and large peeling pits on the surface of the sample. This was due to the adhesion between the debris and the contact surface during the wear process, which then accumulated on the worn surface and participated in friction, leading to intensified wear and the occurrence of peeling. A small plow groove was formed by the micro-convex body between the contact surfaces and the abrasive debris cutting into the surface under normal force, and the high load provided a larger normal stress. When sliding, the surface produced cutting, thus forming a plow groove. The wear mechanism was mainly adhesive wear and fatigue wear.
In the early stage of wear, the micro-convex bodies between the friction pair surfaces formed local adhesion during the sliding process. Under the action of shear stress, the material in the adhesive part was sheared off. Due to the lack of lubrication, this adhesive wear was very severe in the early stage of wear. The debris increased to a certain extent and formed an intermediate layer. The debris and micro-convex bodies cut into the surface under normal load, and when sliding, a plow groove was formed on the surface. Repeated plow groove cutting caused plastic deformation wear on the surface. In addition, due to the repeated movement of the peeling material, plastic deformation and fatigue failure occurred, forming some transverse cracks in the shallow surface layer. The cracks gradually expanded to connect with the vertical cracks at the grain boundary, thus forming fatigue peeling wear. Therefore, the dry friction wear mechanism shifted from adhesive wear to plastic deformation wear and fatigue peeling wear [4].

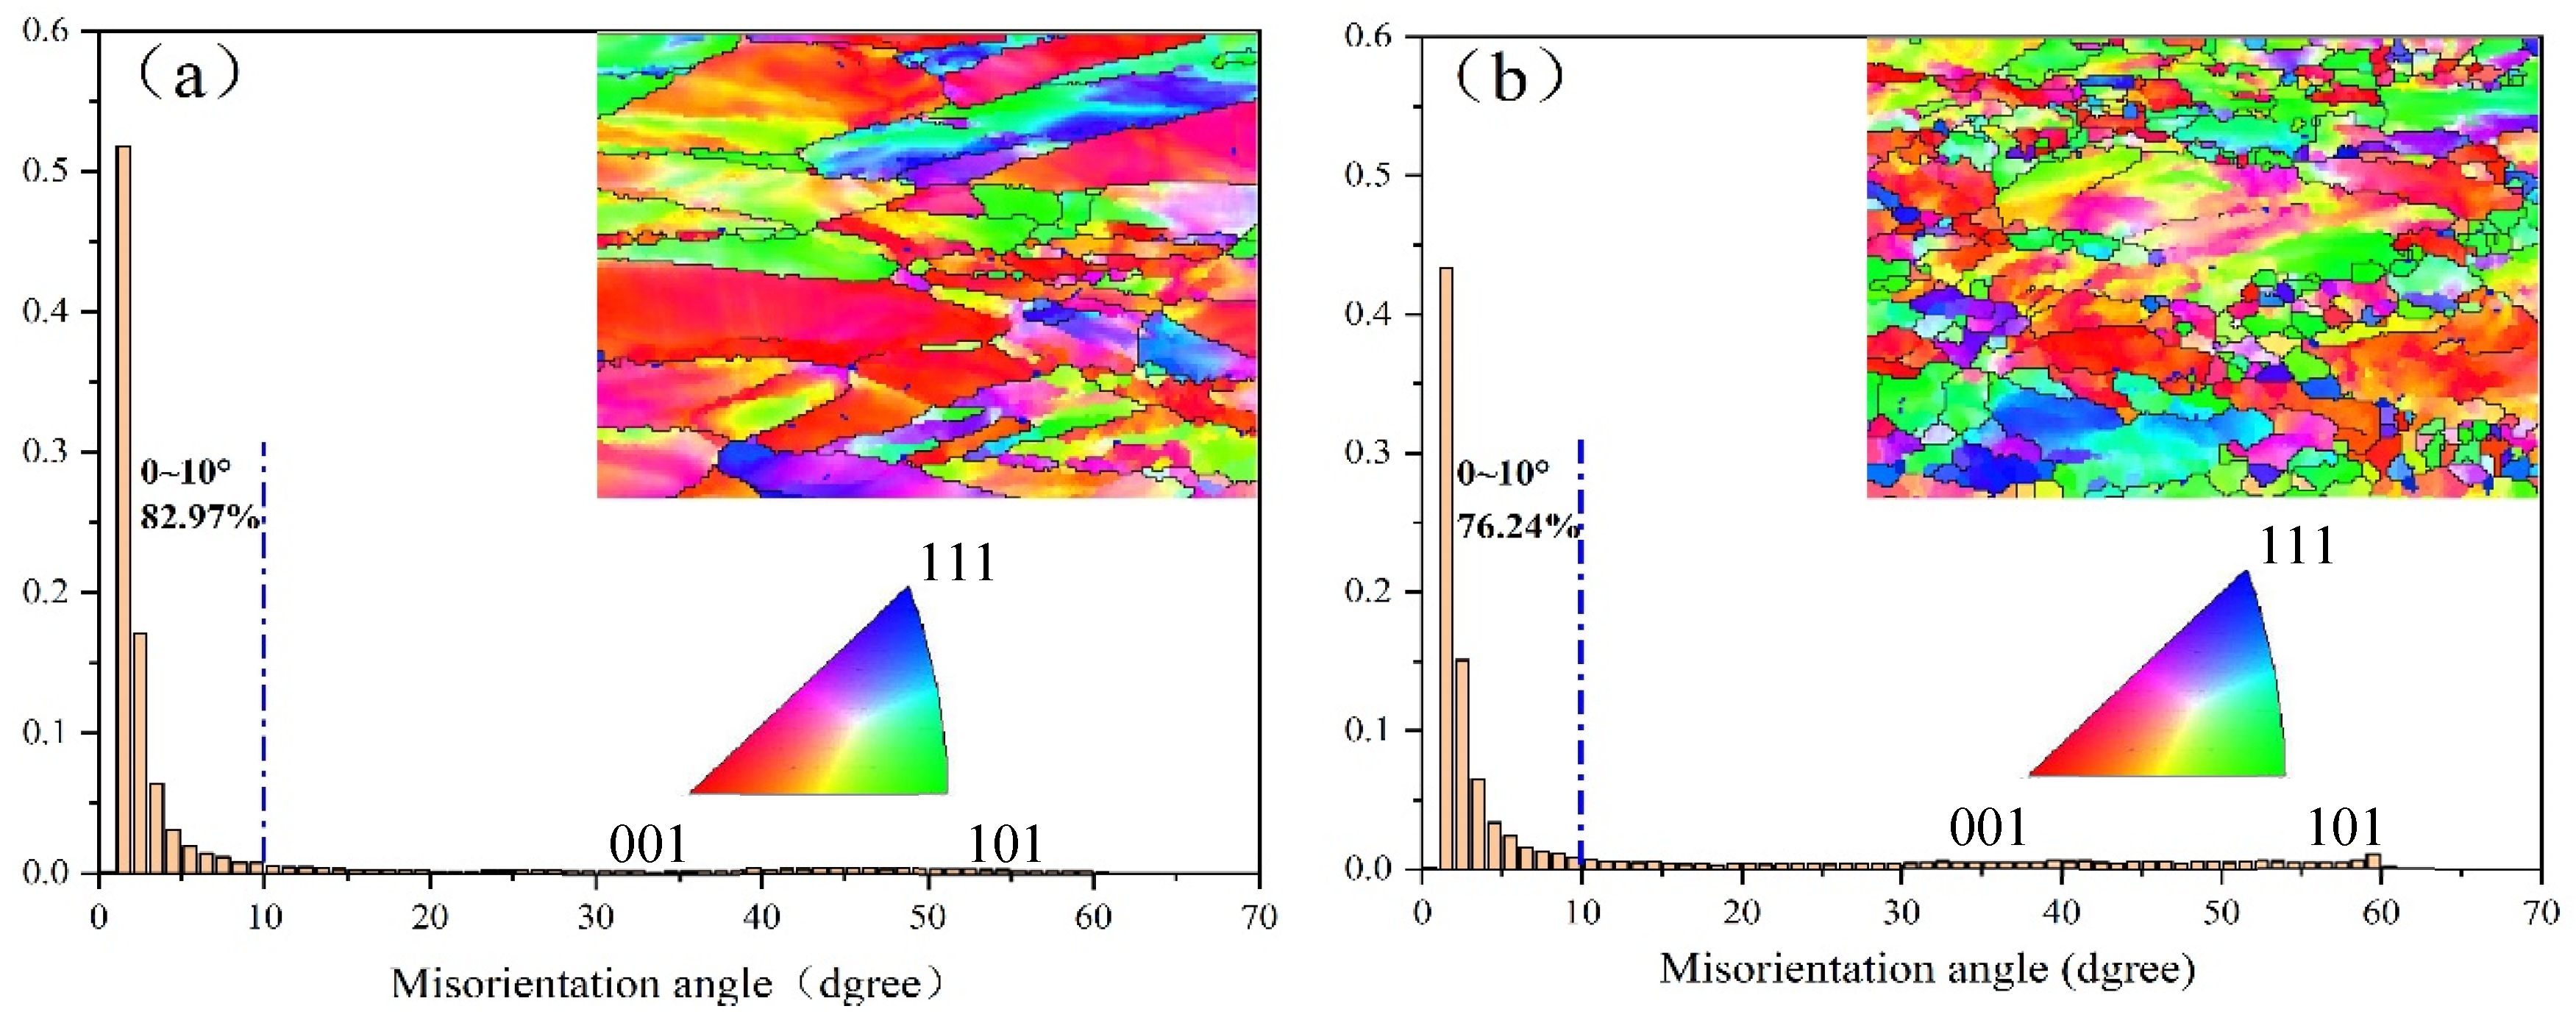
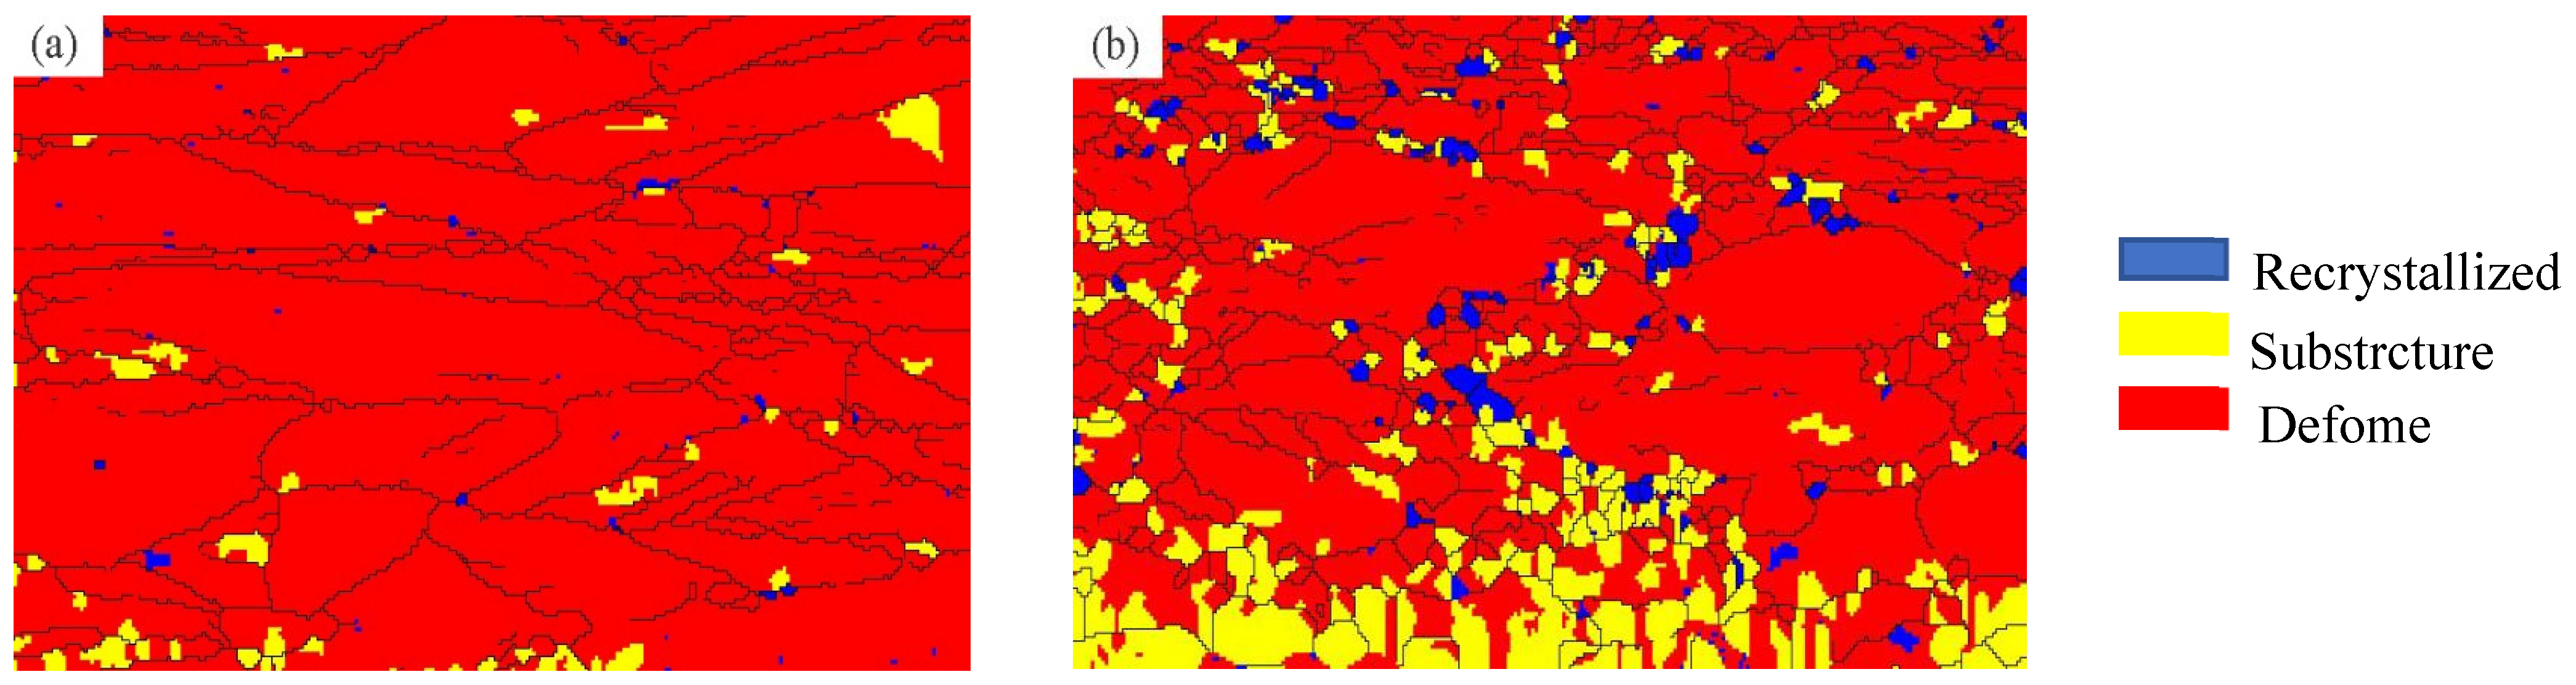
3.2. Evolution of Microstructure after Wear

Figure 5 shows the distribution of grain orientation differences at various angles and the IPF (normal) direction in the vicinity of scratches in the original sample and after 860 °C heat treatment. IPF is the inverse pole figure distribution map, which can show the crystal orientation and help researchers to analyze the microstructure and crystal orientation of materials. The surface of the specimen is defined as the RD-TD plane, and the direction perpendicular to this plane is ND. Among them, RD is the x-axis, TD is the y-axis, and ND is the z-axis. In these IPF diagrams, different colors represent different crystal orientations. The red color indicates grains with an orientation <001>, which are parallel to the ND axis of the specimen coordinate system. Green represents grains with an orientation of <101>, parallel to the ND axis, while blue represents grains with an orientation of <111>, parallel to the ND axis of the specimen coordinate. In the original sample and the 860 °C heat-treated sample, the main color range of the original sample was red–green, accompanied by some blue and purple particles. The results indicated that austenite mainly exhibited preferential orientation along the 001 and 101 directions. It can be observed that compared with the sample heat-treated at 860 °C, the red particles in the sample annealed at 860 °C were significantly reduced, with a larger proportion of green particles, accompanied by some blue particles. The dispersed blue particles indicated a certain degree of preferred orientation along the 111 directions. The results indicate that as the heat treatment temperature increased, the preferred orientation of grains changed, which was reflected macroscopically as a change in the main crystal orientation.
Based on the statistical results in Figure 5, the occurrence frequency of the grain boundary of the original manganese steel sample and the 860 °C grain boundary of BTW austenite in the range of 0~10° were 82.97% and 76.24%, respectively. It was found that most grain boundaries near the wear mark were concentrated in the small-angle range of 0~10°. With the increase in the annealing temperature, the proportion of the small-angle grain boundary gradually decreased, and the proportion of the large-angle grain boundary gradually increased, which was caused by the increase in the annealing temperature and recrystallization state. It was also found that the percentage of orientation difference at 60° for BTW increased with the increasing annealing temperature. This angle can be seen as a typical twin structure produced by the annealing process for a face-centric cubic crystal structure. With the increase in the twin structure, the metal matrix was cut into more small pieces. The greater the twin boundary is, the greater the sliding resistance is, and the more the metal is reinforced [27].
Figure 6 shows the nuclear average orientation difference (KAM) plot for the sample. The KAM value represents the local orientation difference, which is used to measure the average orientation difference between a point in the material and its 24 nearest neighboring points. The KAM value (Kernel Average Misorientation) can reflect the degree of plastic deformation and defect density of the material. The higher the value, the greater the degree of plastic deformation, or the higher the defect density in the region. These plots were generated by calculating the orientation deviation between adjacent particles. The KAM value can quantify the geometric dislocation density theoretically and reflect the uniformity degree of plastic deformation. Higher values indicate increased plastic deformation or increased defect density. In the KAM diagram, the darker the color, the higher the defect density. Blue represents a value of 0, and red a maximum distortion value of 5. In contrast, the color of the original sample was dominated by green, and the high value of the nuclear average orientation difference (KAM) means that more dislocation formation was induced during rolling. At the annealing temperature of 860 °C, the color was mainly blue–green, and the average orientation difference (KAM) value of the core was lower than that of the original sample. The results showed that the dislocation density of annealed samples was lower than that of original samples. From Figure 6, it can be seen that when the sample was not annealed and the load was 200 N, the residual stress of the sample was high, the dislocation was easy to accumulate, and the KAM value was high. The KAM value of the sample decreased and the residual stress value was small after annealing.
Figure 7 shows the recrystallization distribution in the area near the scratch. In the figure, red represents deformed grain, yellow represents recovered grain, and blue represents recrystallized grain. It can be seen that in the original and annealed samples, the red deformed grains accounted for most of the area, and the blue recrystallized grains accounted for a small proportion in the original samples. When the annealing temperature was 860 °C, the proportion of blue recrystallized grain and yellow recovered grain was higher than that of the original sample, and the proportion of red deformed grain was lower than that of the original sample, so the recrystallization degree of the sample was better. A large amount of dislocation will be introduced into the matrix after the rolling of medium-manganese steel, which makes it easy for the medium-manganese steel to induce recrystallization in the annealing process, forming the equiaxed duplex structure composed of ultra-fine grain ferrite and residual austenite [28,29]. Through the recrystallization regulation at different temperatures, the formation of diversified residual austenite can make the medium-manganese steel achieve higher work-hardening performance [30].
The statistical distribution of EBSD grain size can reflect the statistical distribution of grains of each size. Through it, the distribution ratio of grains in each size can be clearly seen. It is of great significance to control the grain size and microstructure uniformity. Figure 8 shows the statistical distribution of grain size of the original sample and the sample annealed at 860 °C. It was clearly seen that the grain refinement process corresponded to the change in annealing temperature: the proportion of small grains in the original sample without annealing treatment was small, and the proportion of small grains in the original sample was higher when the annealing temperature was 860 °C. The average grain size without annealing was 8.67 μm, and the average grain size after annealing at 860 °C was 6.40 μm. Based on the recrystallization structure diagram in Figure 6, it can be concluded that as the annealing temperature increased, the grains were continuously refined, and the microstructure uniformity was significantly improved. The crystal interface is an obstacle to dislocation motion. Therefore, with the grain refinement, the number of grain boundaries increased, which improved the strength of the crystal. Grain refinement improved the work-hardening performance of manganese steel, and the surface layer showed better wear resistance [31].

4. Conclusions

The effect of different annealing treatments on the wear performance of hot-rolled wear-resistant steel BTW1/Q345 composite plates was studied. The results indicated that:
(1)
The friction coefficient change in the wear-resistant BTW1 layer in the friction and wear test was divided into three stages. The friction coefficient increased rapidly at the initial stage of running-in, and then dropped to some extent. Finally, in the third stage, the friction coefficient fluctuated within a certain range.
(2)
During the experiment, the wear mechanism changed somewhat, mainly for adhesive wear and fatigue wear. When the annealing temperature was 860 °C, the maximum depth and the minimum width were 20 μm and 0.825 mm, respectively, with the best wear resistance.
(3)
With the increase in the annealing temperature, the orientation difference in the BTW1 wear layer varied. Compared with the original sample, the small-angle grain boundary angle ratio of the annealed sample decreased, and the large-angle grain boundary angle ratio increased. The small-angle grain boundary angle decreased with the increasing annealing temperature.
(4)
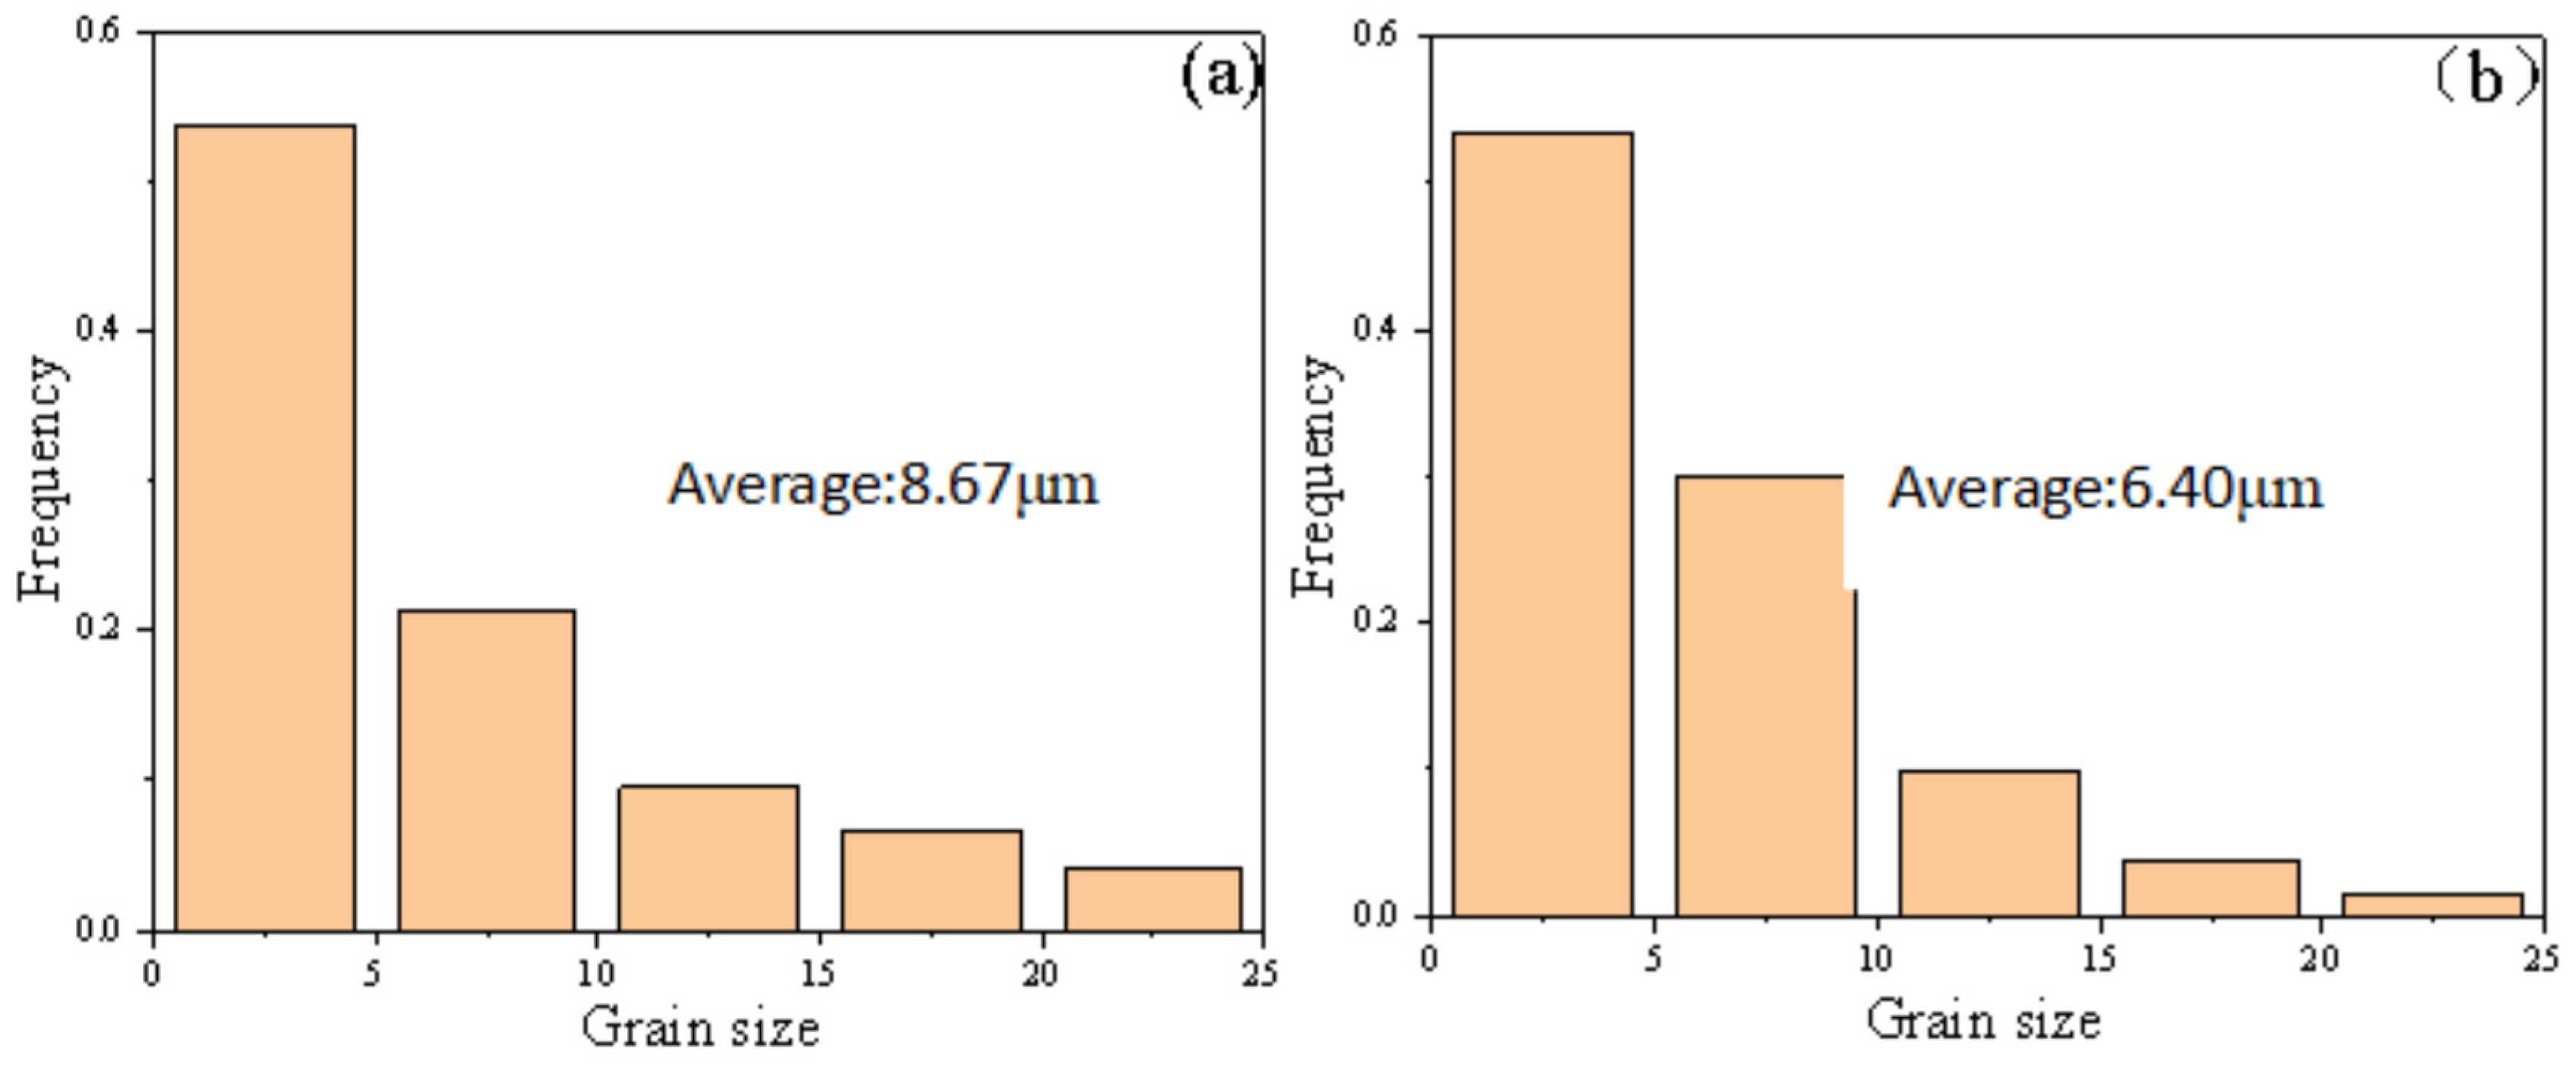
With the increase in the annealing temperature, the recrystallization state and grain size of the sample changed. The recrystallization degree of the annealed sample was higher than that of the original sample, the proportion of small grain increased, the microstructure of the wear-resistant layer was refined, and the work-hardening property of the wear-resistant layer was improved.

Author Contributions

Conceptualization, P.L.; methodology, formal analysis, investigation, writing—original draft, and resources, P.L.; formal analysis, investigation, and writing—original draft, L.H.; resources, K.W.; conceptualization, W.M.; resources, Z.W.; validation, L.H. All authors have read and agreed to the published version of the manuscript.

Funding

This study was financially supported by the Fundamental Research Program of Shanxi Province (20210302124446), the Taiyuan University of Science and Technology Scientific Research Initial Funding (20212008), and the Excellent Doctor Award Fund for Working in Shanxi (20212073).

Data Availability Statement

The original contributions presented in the study are included in the article, further inquiries can be directed to the corresponding author/s.

Acknowledgments

The authors gratefully acknowledge the technical support of the Taiyuan University of Science and Technology.

Conflicts of Interest

The authors declare no conflicts of interest.

References

  1. Tang, L.-l. Performance characteristics and application field of high chromium wear composite plate. Opencast Min. Technol. 2011, 27, 82–83. [Google Scholar]
  2. Zhang, J.-z.; Mi, G.-f.; Guan, X.-z. Application and research on low-alloyed wear resistant cast steel. MW Met. Form. 2009, 15, 29–31. [Google Scholar]
  3. Zhao, G.; Zhang, J.; Song, Y.; Li, J.; Li, H.Y.; Shuai, M.R. Friction and Wear Properties of Wear-Resistant Layer of NM500/Q345 Composite Plates at Different Quenching Temperature. J. Netshape Form. Eng. 2021, 13, 35–41. [Google Scholar]
  4. Wang, F. Study on the Tribology Performance of BTW Medium Manganese Wear Resisting Steel. China Univ. Min. Technol. 2015, 25, 21–42. [Google Scholar]
  5. de Andrés, C.G.; Capdevila, C.; San Martín, D.; Caballero, F.G. Effect of titanium on the allotriomorphic ferrite transformation kinetics in medium carbon–manganese steels. Mater. Sci. Eng. 2002, 328, 156–160. [Google Scholar] [CrossRef]
  6. Xu, B.-s.; Liu, S.-c. New Technologies for Surface Engineering; National Defense Industry Press: Beijing, China, 2002; Volume 32, pp. 1–12. [Google Scholar]
  7. Qiu, X.-w.; Zhang, Y.-P.; Chun, G.-l. Study on Ware Resistance of Laser Hardening Rolling Mill Liner. Appl. Mech. Mater. 2012, 121–126, 3551–3554. [Google Scholar] [CrossRef]
  8. Wang, s.; Zhi, B.-z.; Jun, L.-j. Recent advances in wear-resistant steel matrix composites: A review of reinforcement particle selection and preparation processes. J. Mater. Res. Technol. 2024, 1779–1797, 2238–7854. [Google Scholar] [CrossRef]
  9. Li, L.; Chen, M.-y. Production Technologies and Industrial Application of Wear Resistant Clad Steel Plate. Wide Heavy Plate 2016, 22, 38–43. [Google Scholar]
  10. Arlazarov, A.; Gouné, M.; Bouaziz, O. Evolution of microstructure and mechanical properties of medium Mn steels during double annealing. Mater. Sci. Eng. 2012, 542, 31–39. [Google Scholar] [CrossRef]
  11. Luo, H.; Shi, J.; Wang, C. Experimental and numerical analysis on formation of stable austenite during the intercritical annealing of 5Mn steel. Acta Mater. 2011, 59, 4002–4014. [Google Scholar] [CrossRef]
  12. Cai, Z.-h.; Ding, H.; Xue, X. Microstructural evolution and mechanical properties of hot-rolled 11% manganese TRIP steel. J. Mater. Sci. Eng. 2013, 560, 388–395. [Google Scholar] [CrossRef]
  13. Zhao, J.; Xi, Y.; Shi, W. Microstructure and Mechanical Properties of High Manganese TRIP Steel J. J. Iron Steel Res. Int. 2012, 19, 57–62. [Google Scholar] [CrossRef]
  14. Yang, Y.-g.; Luo, X. Microstructure evolution and strengthening mechanism of air-hardening steel subjected to the austenitizing annealing treatment. Mater. Res. Express 2023, 10, 106502. [Google Scholar] [CrossRef]
  15. Emmanuel, D.M.; Gordon, S.J.; Kidder, M.D. Effect of Carbon and Manganese on the Quenching and Partitioning Response of CMnSi Steels. Isij Int. 2011, 51, 137–144. [Google Scholar]
  16. Dong, W.S.; Ryu, J.H.; Min, S.J. Medium-Alloy Manganese-Rich Transformation-Induced Plasticity Steels. J. Meta Llurgical Mater. Trans. 2013, 44, 286–293. [Google Scholar]
  17. Li, N.; Shi, J.; Chen, W.-l. Effect of Carbon Content on Microstructure and Mechanical Properties of Cold-rolled Medium Manganese Steel. Hot Work. Technol. 2012, 41, 5–8. [Google Scholar]
  18. Grajcar, A.; Kwany, W. Microstructural study on retained austenite in advanced highstrength multiphase 3Mn-1.5Al and 5Mn-1.5Al steels. J. Achiev. Mater. Manuf. Eng. 2012, 54, 168–177. [Google Scholar]
  19. Aydin, H.; Essadiqi, E.; Jung, I.H. Development of 3rd generation AHSS with medium Mn content alloying compositions. Mater. Sci. Eng. A Struct. Mater. Prop. Microstruct. Process. 2013, 564, 501–508. [Google Scholar] [CrossRef]
  20. Zhi, C.-c.; Ma, L.-f.; Huang, Q.-x. Effect of Reduction on Bonding Interface of Hot-rolled Wear-resistant Steel BTW1/Q345R Cladding Plate. J. Wuhan Univ. Technol. Mater Sci. 2018, 33, 952–958. [Google Scholar] [CrossRef]
  21. Bai, Z.-x.; Su, N.; Hang, Y. Wear characteristics of austenitic steel and martensitic steel at high temperature. Mater. Res. Express 2022, 9, 086504. [Google Scholar] [CrossRef]
  22. Ge, S.-r.; Wang, J.-x.; Wang, Q.-l. Self-strengthening wear resistant mechanism and application of medium manganese steel applied for the chute of scraper conveyor. J. China Coal Soc. 2016, 41, 2373–2379. [Google Scholar]
  23. Miao, C.-w.; GUO, Z.-w.; Yuan, C.-q. Coupling Mechanism and Friction Reduction Performance of Textured Cylinder-Piston Ring. Surf. Technol. 2020, 49, 124–133. [Google Scholar]
  24. Mo, D.-y.; Gong, M.-f.; Wu, H.-b. Surface Modification of 5Cr5MoWSi Steel and Tribological Properties. Mach. Des. Manuf. 2020, 12, 95–99. [Google Scholar]
  25. Zhang, H.-m. Study on friction and wear characteristics of GCr15/45# steel under lubrication conditions. Southwest Jiaotong Univ. 2010, 35, 5525. [Google Scholar]
  26. Liu, P.-t.; Huang, Q.-x. Characterization of hot deformation behavior of wear-resistant steel BTW1 using processing maps and constitutive equations. J. Iron Steel Res. Int. 2018, 25, 1054–1061. [Google Scholar] [CrossRef]
  27. Chen, H. Study on the wear properties and strengthening mechanism of manganese steel in deformation-induced hardening austenite. China Univ. Min. Technol. Y 2023, 36, 11–30. [Google Scholar]
  28. Astafurova, E.-G.; Tukeeva, M.-S.; Zakharova, G.-G. The role of twinning on microstructure and mechanical response of severely deformed single crystals of high-manganese austenitic steel. Mater. Charact. 2011, 62, 588–592. [Google Scholar] [CrossRef]
  29. Karaman, I.; Sehitoglu, H.; Gall, K. Deformation of single crystal Hadfield steel by twinning and slip. Acta Mater. 2015, 48, 1345–1359. [Google Scholar] [CrossRef]
  30. Hu, B.-j.; Zhen, Q.-y.; Lu, T. Recrystallization Controlling in a Cold-Rolled Medium Mn Steel and Its Effect on Mechanical Properties. Acta Metall. Sin. 2024, 60, 189–200. [Google Scholar]
  31. Xia, W.-z.; Patil, P.-P.; Chang, L. A novel microwall sliding test uncovering the origin of grain refined tribolayers. Acta Mater. 2023, 246, 118670. [Google Scholar] [CrossRef]
Figure 1. The schematic diagram of the wear scar sample.
Crystals 14 00772 g001
Figure 2. Sliding friction factor of the BTW1/Q345 wear-resistant layer annealed at different temperatures at the 50% reduction rate: I Run-in Stage; II Rapid Wear Stage; III Stable Stage.
Crystals 14 00772 g002
Figure 3. Three-dimensional morphology and section curves of the abrasion-resistant layer under different annealing temperatures: (a) original, (b) 860 °C, (c) 900 °C, and (d) 940 °C. (e) the depth and width of the scratch at different annealing temperatures.
Crystals 14 00772 g003
Figure 4. Dry friction and wear morphology of the BTW1 wear layer at different annealing temperatures: (a) original, (b) 860 °C, (c) 900 °C, and (d) 940 °C.
Crystals 14 00772 g004
Figure 5. Grain orientation difference diagram (IPF): (a) original and (b) 860 °C.
Crystals 14 00772 g005
Figure 6. Average orientation difference of the nucleus (KAM): (a) original and (b) 860 °C.
Crystals 14 00772 g006
Figure 7. Distribution of recrystallization: (a) original and (b) 860 °C.
Crystals 14 00772 g007
Figure 8. Grain size statistics: (a) original and (b) 860 °C.
Crystals 14 00772 g008
Table 1. Chemical composition of BTW1 and Q345 (mass fraction) (%).
CMnCrVMoPSi
BTW10.998.301.580.240.350.0180.18
Q3450.151.400.0130.35
Table 2. Non-annealed BTW1 grain size information (%).
Grain Size (μm)<10 μm10~20 μm>20 μm
BTW175.1%16.2%8.7%
Table 3. Mechanical properties of BTW1 and Q345 steels.
Yield StrengthTensile StrengthElongationImpact ToughnessOriginal HardnessHardness after Use
BTW1400–480 MPa650–800 MPa≥20%≥30 J≤250 HBW≥450 HBW
Q345265–345 MPa450–630 MPa≥21%≥34 J150–170 HBW
Disclaimer/Publisher’s Note: The statements, opinions and data contained in all publications are solely those of the individual author(s) and contributor(s) and not of MDPI and/or the editor(s). MDPI and/or the editor(s) disclaim responsibility for any injury to people or property resulting from any ideas, methods, instructions or products referred to in the content.

