Article

Ab Initio Study of the Crystalline Structure of HgS under Low and High Pressure

by
Ahmed Amine Aidouni
1,2,
Abdelkader Aissat
1,3,*,
Mounir Ould-Mohamed
2,
Mohamed El Amine Benamar
1,
Samuel Dupont
3 and
Jean Pierre Vilcot
3
1
Department of Material Science, Faculty of Material Science, Mathematics and Computer Science, University of Ahmed Draya, Adrar 01000, Algeria
2
LPTHIRM-Physics Department, Faculty of Sciences, University of Blida 1, P.O. Box 270, Blida 09000, Algeria
3
Institute of Electronics, Microelectronics and Nanotechnology (IEMN)—UMR CNRS 8520, University of Sciences and Technologies of Lille 1, Avenue Poincare, BP 60069, 59652 Villeneuve of Ascq, France
*
Author to whom correspondence should be addressed.
Crystals 2024, 14(9), 780; https://doi.org/10.3390/cryst14090780
Submission received: 12 July 2024 / Revised: 28 July 2024 / Accepted: 29 August 2024 / Published: 31 August 2024
(This article belongs to the Section Inorganic Crystalline Materials)

Abstract

:
This study analyzes the lattice dynamics of HgS under various pressures using ab initio self-consistent calculations based on the plane-wave method (PW) and generalized gradient approximation (GGA). The static study, performed by enthalpy calculations, predicts that the transition from the cinnabar phase (α-HgS) to the zinc-blende B3 (β-HgS) or wurtzite (2H) structures occurs at very low pressures, at 0.65 or 0.70 GPa, respectively. Furthermore, the transition from β-HgS to the rocksalt (B1) phase occurs at 7 GPa, and at high pressure, specifically at 110 GPa, HgS can adopt the CsCl (B2) phase. The mechanical study confirms the stability of the β and 2H phases at 0 GPa. Phonon calculations corroborate the results of the static and mechanical studies regarding stability ( α 0.7 GPa 2 H 0.9 GPa β ) , and the results indicate that the instabilities of the transverse acoustic (TA) modes, induced by the application of pressures of 10.5 GPa, 21 GPa, and 190 GPa, are responsible for the observed phase transitions in part of the Brillouin.

1. Introduction

Binary Hg-X systems (where X = S, Se, Te) have garnered significant interest in electronic and optical technologies [1,2,3,4,5]. While HgS typically crystallizes in the trigonal cinnabar structure (α-HgS), it may also be found in the β phase (metacinnabar), either naturally or in the laboratory [6,7]. However, the existence of a hexagonal close-packed (HCP) modification of HgS is still debated, and there is insufficient theoretical work on this topic in the existing literature. Experimental investigations have discussed the presence or absence of the hexagonal phase at high or low pressures, but with mixed results [8,9]. In this article, we present new theoretical findings on the structural properties of HgS, specifically focusing on the potential existence of an HCP modification. Our study provides insights into the nature of HgS and could have significant implications for its electronic and optical applications.
At high pressures up to 20 GPa, no sign of phase transition is mentioned in studies carried out using X-rays and Raman spectroscopy [10]. In parallel, Bridgeman failed in the compression of cubic HgS (β-HgS), which transformed into the cinnabar form at only 5 GPa [11]. However, using energy dispersive X-ray diffraction, Huang et al. were able to determine that in a pressure range between 13 and 30 GPa, the cinnabar structure of HgS changes to the rocksalt structure (B1) [12]. Nelmes et al. found 20.57 GPa to be the transition pressure [13].
Theoretically, all calculations based on density functional theory (DFT) (the majority of which are based on static calculations of Gibbs free enthalpy, which do not take into account the vibrations of the atoms in the crystal (dynamic study of phonons)) show the appearance of the rocksalt phase at different pressures: 20 GPa [14], 19.9 GPa [15], 16.1 GPa [16], and 26.75 GPa [17]. Using first-principles calculations, Yang et al. [18] determined that at very low pressure (3.4 GPa), the transition of the β-HgS (B3) phase (space group F 4 ¯ 3 m ) to cinnabar α-HgS (space group P 3 1 21 ) occurs, followed by a transition to the NaCl (B1) structure (space group F m 3 ¯ m ) at a pressure of approximately 14.3 GPa. Recently, Cihan et al. [14] showed that a phase transition can occur from the NaCl phase to the CsC l phase (B2) (space group P m 3 ¯ m ) at a pressure of 28 GPa, using calculations based on DFT (density functional theory), with the prediction of hydrostatic pressure conducted using enthalpy calculations.
In summary, the experimental study of the structural properties of HgS is not really rich, particularly in terms of the presence or absence of the hexagonal phase at low pressure, as well as the phase transitions at high pressure. First-principle studies on the structural properties of HgS are primarily based on static calculations (the Murnaghan equation of state EOS and Gibbs free energy), not accounting for phonon vibrations. Recent work has addressed HgS’s dynamic properties, providing vibrational frequency data [19]. We sought the most stable phase among candidate structures (cinnabar α-HgS, wurtzite (2H), and β-HgS zinc blende) and determined transition pressures using enthalpy calculations under high pressure. To ensure structural stability, we conducted a dynamic study, confirming static results. This method, used in Zunger’s work [20], helps identify new phases at various pressures. This work focuses on exploring the structural and dynamic properties of HgS, with an emphasis on its hexagonal phase at low pressure. Understanding these characteristics is crucial for optoelectronic applications, due to the unique electronic and optical properties of HgS. This material is promising for high-sensitivity sensors and detectors, owing to its phase transitions. The knowledge gained could also foster technological innovations in various fields, such as energy and communication technologies.

2. Materials and Methods

In this study, we used the linear response of the pseudopotentials method (PWscf) implemented in the Quantum Espresso code [21]. The exchange and correlation effects were treated using the generalized gradient approximation (GGA) of the PBE (Perdew–Burke–Ernzerhof) type [22]. The dynamical matrix is obtained by modifying the electron density through the inverse of the dielectric matrix, which describes the response of the valence electron density to a periodic lattice perturbation. The dielectric matrix is calculated from the eigenfunctions and energy levels of the unperturbed system [21].
For the dynamical properties, we used ultra-soft Rappe–Rabe–Kaxiras–Joannopoulos (rrkjus) pseudopotentials [23], developed for the PWscf code [21]. The electron wave functions were expressed using a plane-wave basis set with a cutoff for kinetic energy that varies between 70 and 100 Ry and a cutoff energy of charge density worth 10 times the ecutwfc. The standard method of Monkhorst and Pack (MP) [24] special k-points was employed to perform accurate Brillouin-zone integrations. We used 8 × 8 × 8 MP meshes for the zinc-blende (B3) phase, rocksalt phase (B1) and theCsCl phase (B2); 9 × 9 × 4 MP meshes for the cinnabar phase; and 8 × 8 × 6 MP meshes for the wurtzite phase.
The corresponding integrating points covering the irreducible Brillouin zone were 29 k points for the B3 and B1 phase, 35 k-points for the B2 phase, 163 k-points for the cinnabar phase, and 60 k-points for the B1 phase. The self-consistent electronic iterations were kept until the calculated total energy of the crystal converged with a tolerance less than 10 7 Ryd. The lattice dynamics properties were calculated using the density functional perturbation theory (DFTP) [25] by means of a 4 × 4 × 4 q-point MP mesh for cubic systems and 4 × 4 × 2 q-point MP mesh for noncubic systems. A Fourier interpolation of these matrices allowed for obtaining the phonon dispersion curves. The convergence of the total energy in relation to the k-points and basis was tested and found to be adequate to ensure convergence.

3. Results and Discussion

3.1. Structural Properties

The initial calculations focused on the structural parameters of HgS, namely the equilibrium lattice parameter, bulk modulus, and its pressure derivative. These structural properties are studied in the following different structures: the cinnabar α-HgS structure, which corresponds to space group P 3 1 21 ; the zinc-blende B 3 structure corresponding to space group F 4 ¯ 3 m (No.: 216); the wurtzite ( 2 H ) phase with space group P 6 3 m c ; the rocksalt ( B 1 ) phase corresponding to space group F m 3 ¯ m ; and finally the CsCl ( B 2 ) phase in space group P m 3 ¯ m . Figure 1 illustrates the total energy (Ryd) as a function of the volume (Bohr) E(V) ofHgS, using GGA for the cinnabar, zinc-blende, wurtzite, rocksalt, and CsCl phases. The calculated total energies are adjusted using Murnaghan’s equation of state to obtain the structural parameters.
In Table 1 are listed the calculated structural parameters for the ground-state phase, namely the equilibrium lattice parameter (a), the bulk modulus (B) and its pressure derivative (B0), along with available theoretical and experimental values [14,15,19,26,27,28]. According to Table 1, our calculated values align well with the available experimental and theoretical values. The E(V) curves in Figure 1 clearly show that, under ambient conditions, the cinnabar structure is the fundamental phase of HgS. It is also evident that three structures (cinnabar, B3, and 2H) exhibit almost equal minimal energies, with a difference of a few meV. Although the hcp structure of HgS is not observed in nature, its study is justified by several aspects, including the structural analogy between sphalerite and metacinnabar, as well as the reference to a natural form of HgS (hypercinnabar) with hexagonal symmetry [7]. In high-pressure conditions, the NaCl structure would be favored, which is consistent with experimental findings [12,13]. With greater compression, a transition to the CsCl structure can occur, which aligns well with theoretical calculations [14,15].
The structural phase transition occurs at the pressure where the Gibbs free energies of the two structures are equal. Given that all our calculations are conducted at T = 0 K, the Gibbs free energy G = E 0 + P V T S   simplifies to the enthalpy H = E 0 + P V . Therefore, the pressure at which the phase transition takes place is identified when the enthalpies of the two phases are the same. Figure 2 illustrates the enthalpy H as a function of pressure p, indicating that the static phase transition from the cinnabar phase to the zinc-blende (or wurtzite) phase of HgS occurs at 0.65 (0.70) GPa.
It turns out that the α-HgS cinnabar phase has the same enthalpy as the β-HgS zinc-blende phase and the hexagonal phase (within a few meV), which explains the possibility of obtaining both phases in the laboratory (the cinnabar phase and one of the other two phases), although this requires the addition of a very small amount of iron [29] to promote the growth of the zinc-blende phase. However, the zinc-blende (wurtzite) phase is calculated to be stable at zero pressure with a very slight enthalpy difference compared to the cinnabar phase. Therefore, this cubic phase must be stable from 0.7 GPa until the appearance of another cubic phase—the rocksalt phase. Although there are many experimental measurements of these transitions (α-HgS-β-HgS) at very low pressures (see Introduction), no theoretical calculation seems to have been reported, except for that of Cordona et al. [15], who found the same transition pressure value of 0.7 GPa, although they did not study the hexagonal structure.
The values obtained by the Gibbs static method using the first-principles pseudopotential method are given in Table 2. At a high pressure, the transition goes to the rocksalt phase. The value obtained seems far from the values obtained dynamically in our phonon calculations (discussed in the phonon section) and other theoretical and experimental values. This difference is due to the fact that the B3 to B1 transition starts at 6 GPa but can only occur beyond 20 GPa. In mercury compounds, the series of phase transitions (B3-cinnabar-to-B1) suggests that the sp3 bond first transitions to the spbond, then to the NaCl structure, unlike other IB-VI compounds that transform directly from sp3 to the NaCl structure [12]. This transition might involve a change in the coordination or bonding environment from a more complex geometry (such as tetrahedral, found in sp3 hybridization) to a simpler, linear one before finally transitioning to the NaCl structure.
HgS can adopt the CsCl (B2) phase from 112 GPa, which does not agree with the theoretical value also obtained by a statistical enthalpy calculation [14]; however, it confirms the result obtained by [30], which predicts that HgS will transition to a simple cubic structure beyond 100 GPa. The Cmcm and Pmmn structures were subjected to calculations. This confirms the stability of the Cmcm phase compared to Pmmn. These results are in agreement with the conclusions of Nelmes and McMahon (52 GPa), who suggested “a distortion of the RS structure, possibly to Cmcm” [31]. Lastly, Biering predicted a transition from the Pmmn structure to the CsCl structure at a pressure of 210 GPa [30].

3.2. Elastic Properties

The mechanical properties of the binary HgS compound have been calculated for the cubic (zinc blende) and hexagonal (wurtzite) phases. For these structures, the elastic constants C 11 , C 12 ,   C 13 , C 33 and C 44 were used to determine the shear modulus (G), Young’s modulus (E), Poisson’s ratio (ν) and Debye temperature. The mechanical stability of a cubic system necessitates that three independent elastic constants—C11, C12, and C44—satisfy the Born conditions [32,33,34,35,36] as follows:
C 11 > 0 ,     C 44 > 0 ,     C 11 C 12 > 0 ,     C 11 + 2 C 12 > 0 ,   C 12 < B < C 11
For a hexagonal structure, the stability criteria are
C 11 > c 12 , C 44 > 0 ,   C 11 + C 12 C 33 > 2 C 13 2
In the case of the B 3 structure, the elastic constants satisfy these conditions, which reveal stability at zero pressure. For the hexagonal structure, the elastic constants also meet these criteria, which show that it is a metastable phase at ambient pressure. The mechanical properties calculated for these two structures are reported in Table 3.

3.3. Dynamical Stability

In order to statically and mechanically study the stable phase discussed earlier, we conducted a dynamic study based on phonon calculations at different pressures. The phonon dispersions along the high-symmetry lines in different structural phases illustrate the various symmetries of the phonon branches. The point groups can have up to 12 irreducible representations, which are differentiated in the phonon dispersion plots by distinct colors. Figure 3 illustrates the phonon dispersion along the high-symmetry lines for the cinnabar phase at 0 GPa (a), the wurtzite phase at 0.7 GPa (b), and the zinc-blende phase at 0.9 GPa (c).
It is evident that HgS is dynamically stable in the α phase, with a first transition to the hexagonal phase at 0.7 GPa. At 0.9 GPa, HgS stabilizes in the β phase. These structures differ only slightly in volume and energy, as the zinc blende can be considered as an ABCABC stacking and wurtzite as an ABAB stacking. These results are consistent with the experimental observations of hexagonal stacking in the works of KovácsKis and Pandey [8,9].
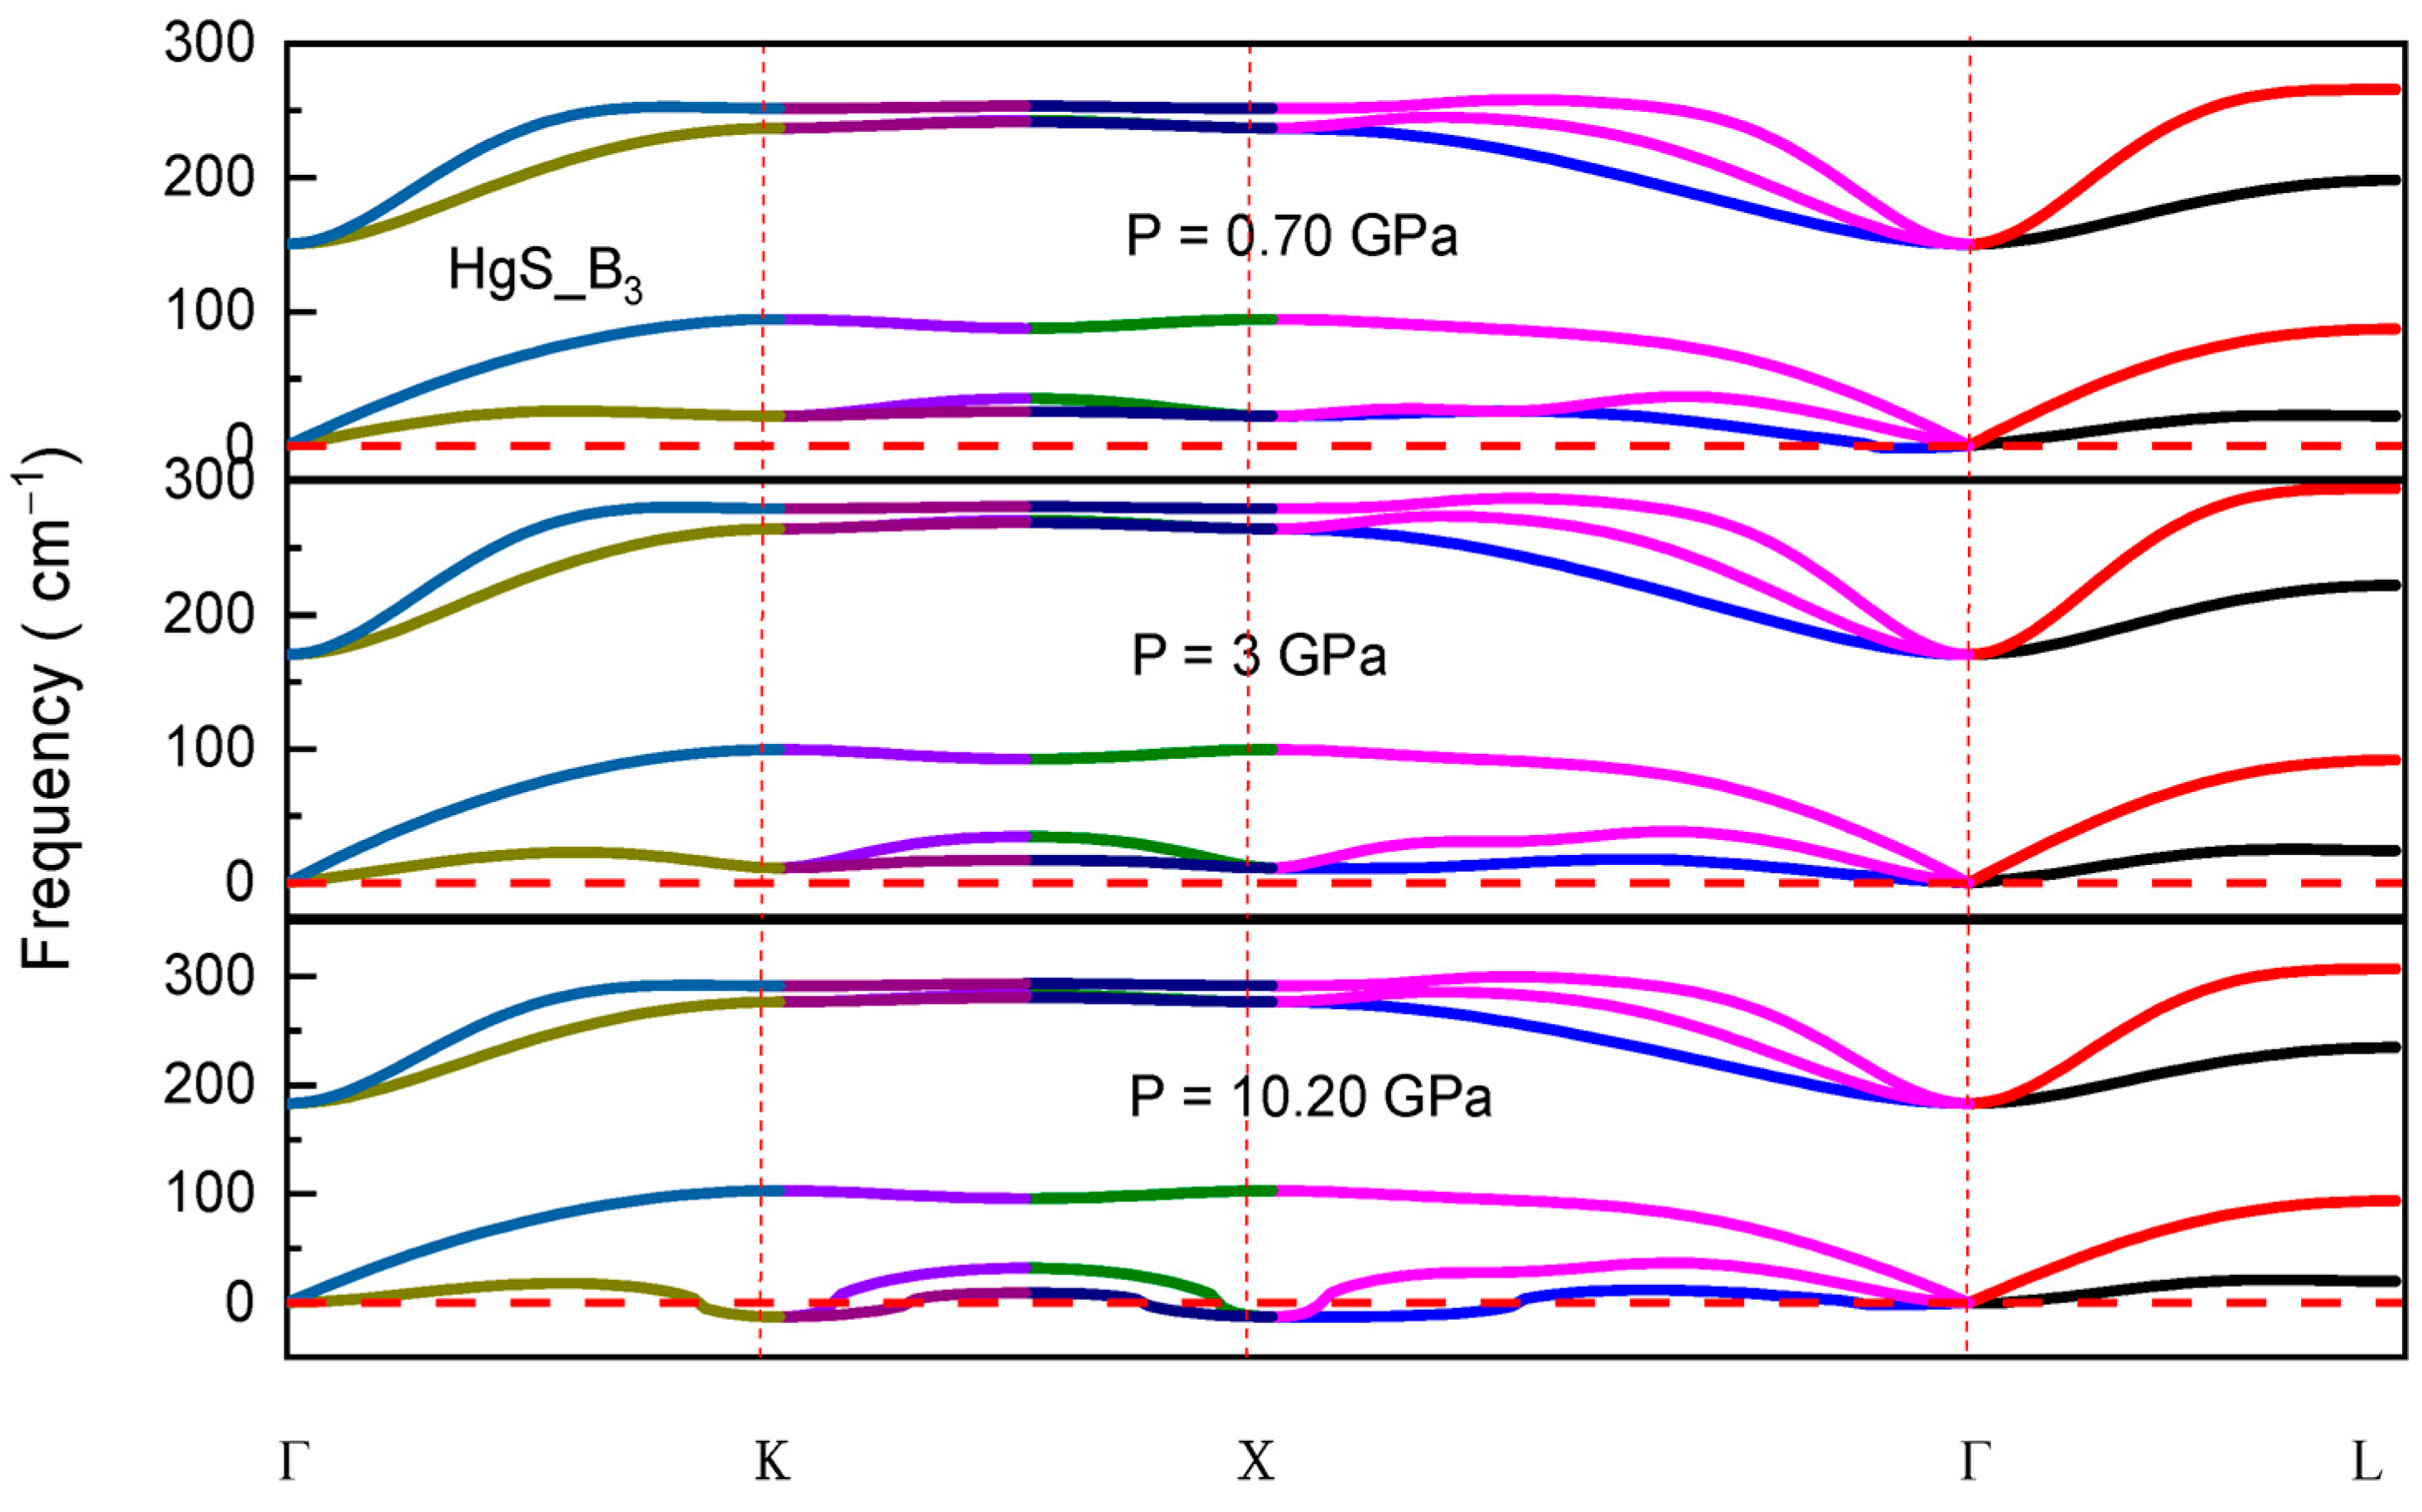
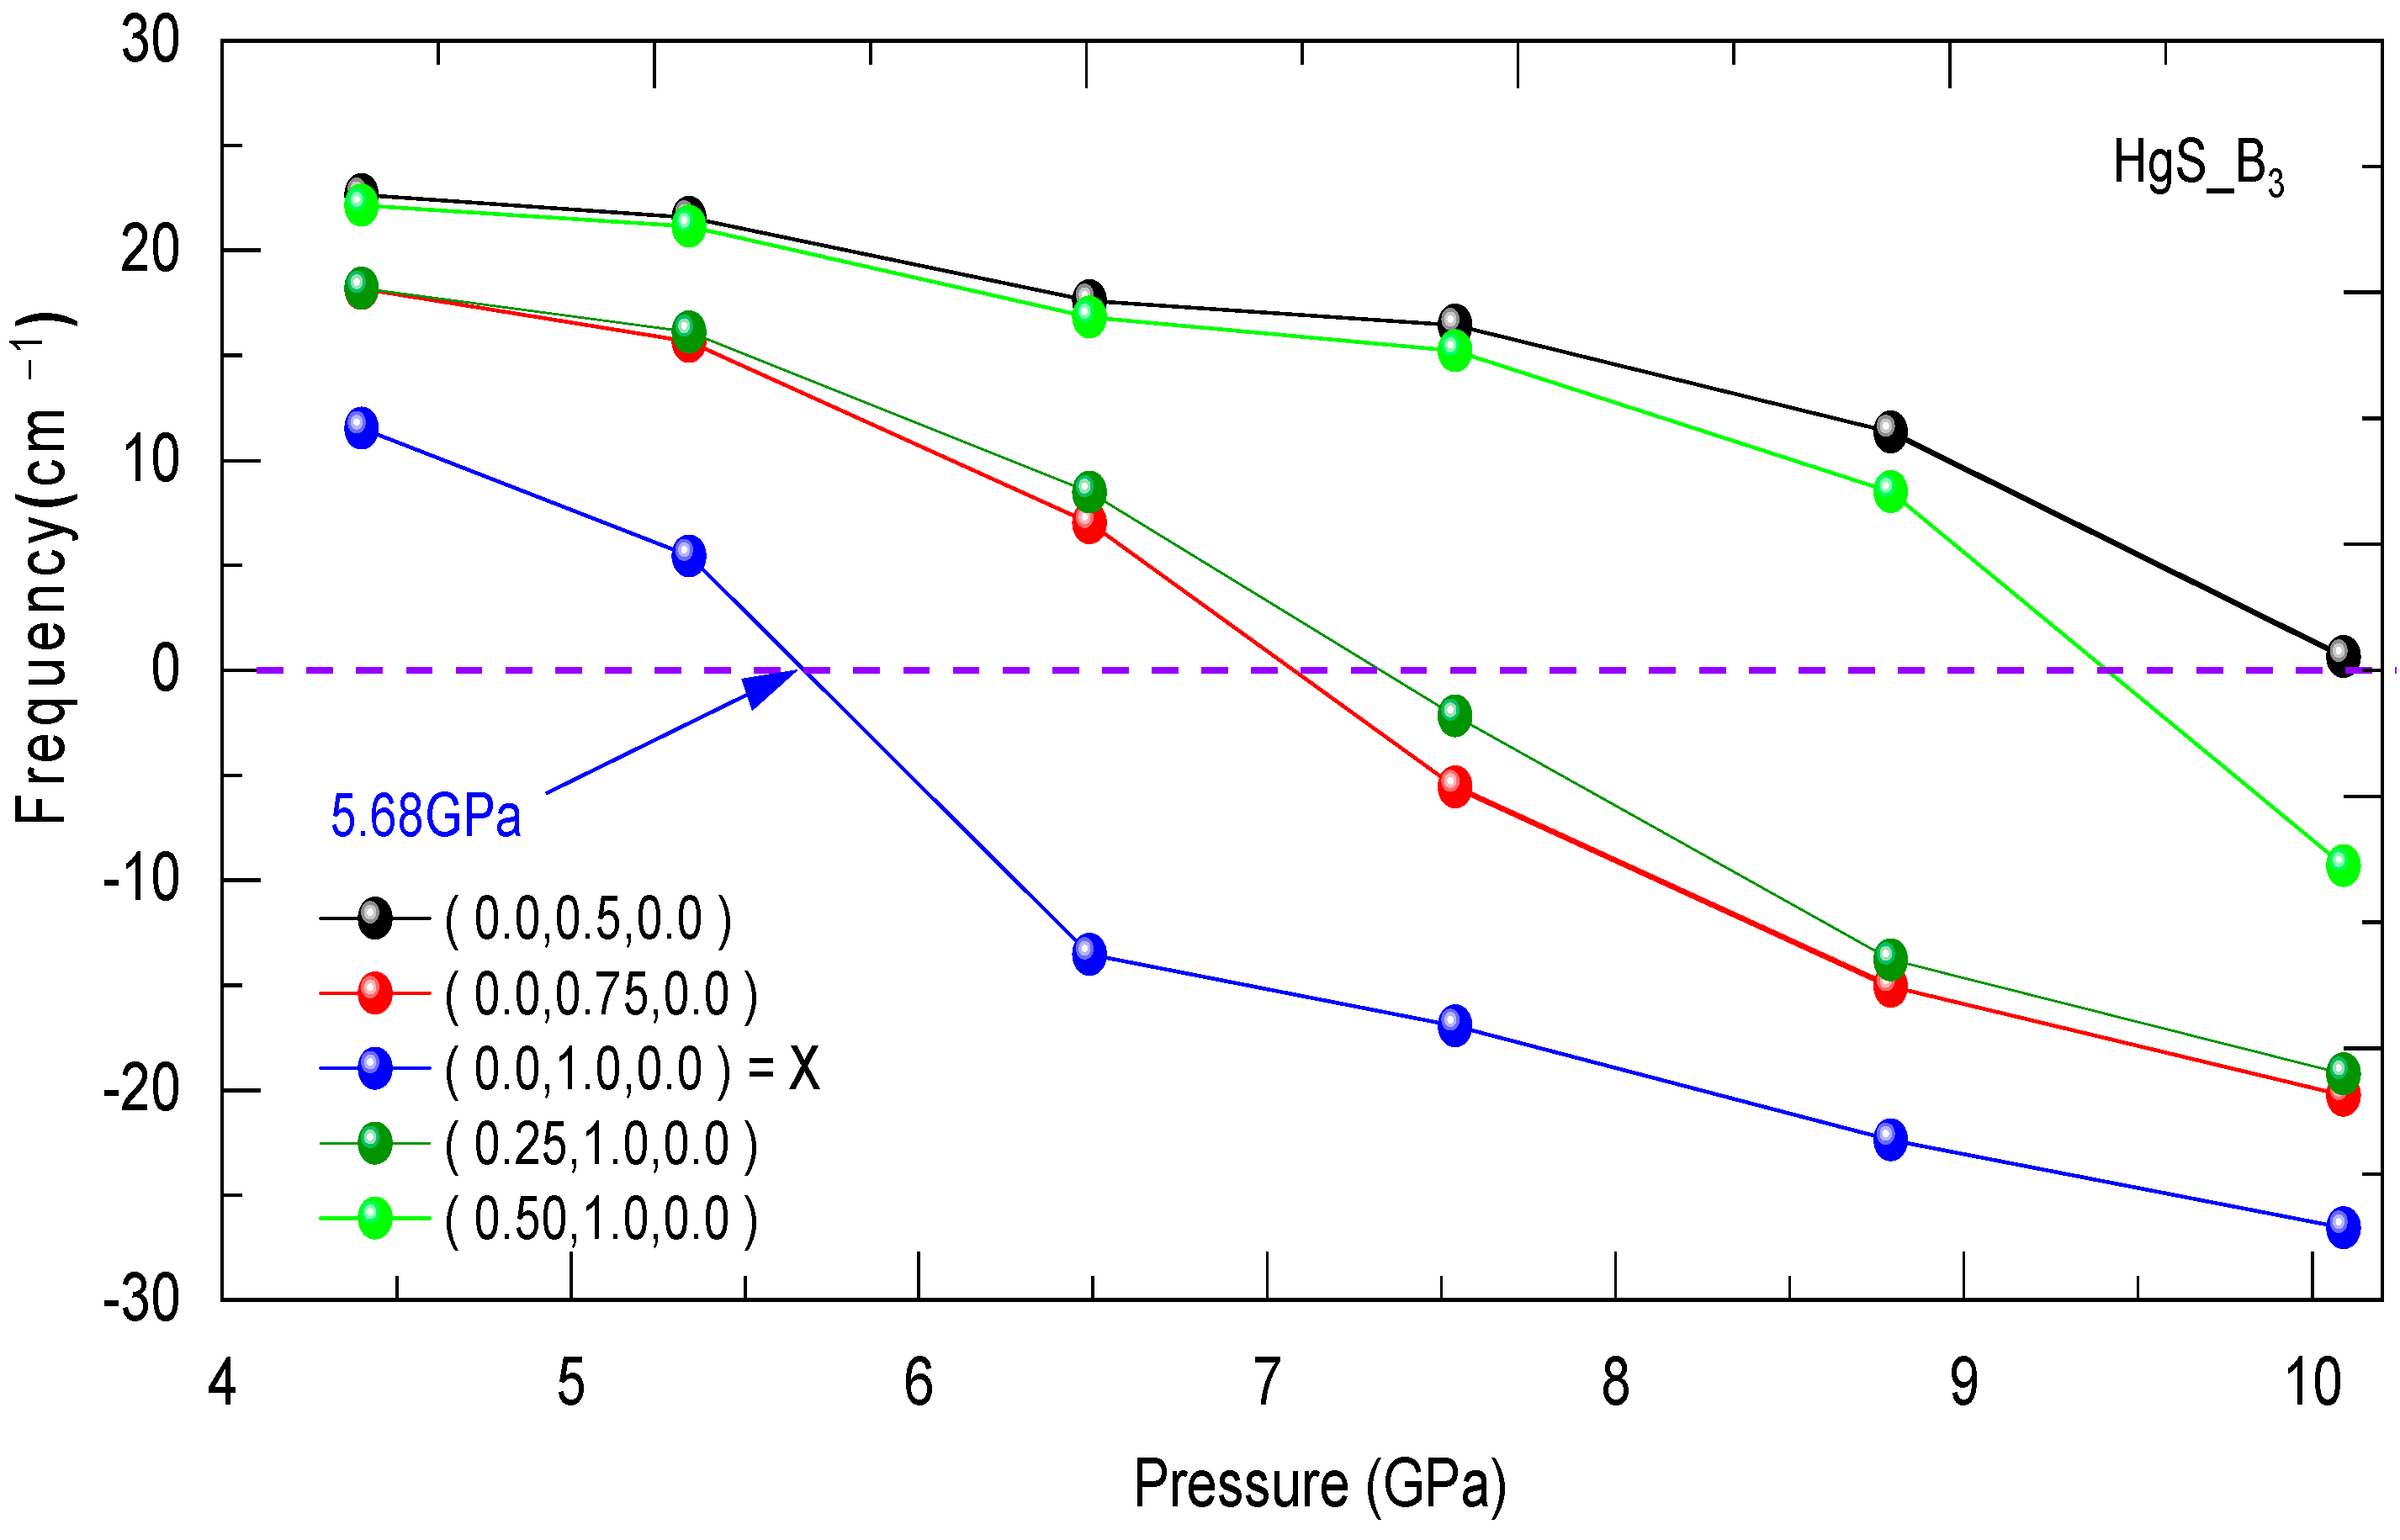
Figure 4 illustrates the phonon dispersion in the zinc-blende phase of HgS for various pressure values. As the volume decreases, the TO and LO phonon modes of the zinc-blende phase increase in frequency, while the TA mode decreases. At a volume of 0.909 V 0 (where V 0 indicates the calculated equilibrium volume of β H g S ), corresponding to a pressure of 10.2 GPa, the phonon modes along the [0e0] direction become imaginary, indicating the dynamic instability of the zinc-blende phase. To properly identify these instabilities and obtain accurate pressure values, the frequency dependence of the phonons TA for pressures between 4 and 10.50 GPa and for several points ( q i ) of the direction [e00] were studied.
Figure 5 shows that all TA (qi) modes decrease sharply with increasing pressure, with an imaginary TA phonon mode identified at a pressure of 5.7 GPa. This TA phonon mode begins to become imaginary only at point X at a pressure of around 10.2 GPa, indicating the start of the B 3 phase transition to phase B 1 of HgS. The instabilities of the TA modes at points qi, particularly at point X, are accountable for the phase transition. The instabilities of the phonons predicted at a pressure of 10.2 GPa are consistent with the transition pressure of 13 GPa measured by Huang [12].
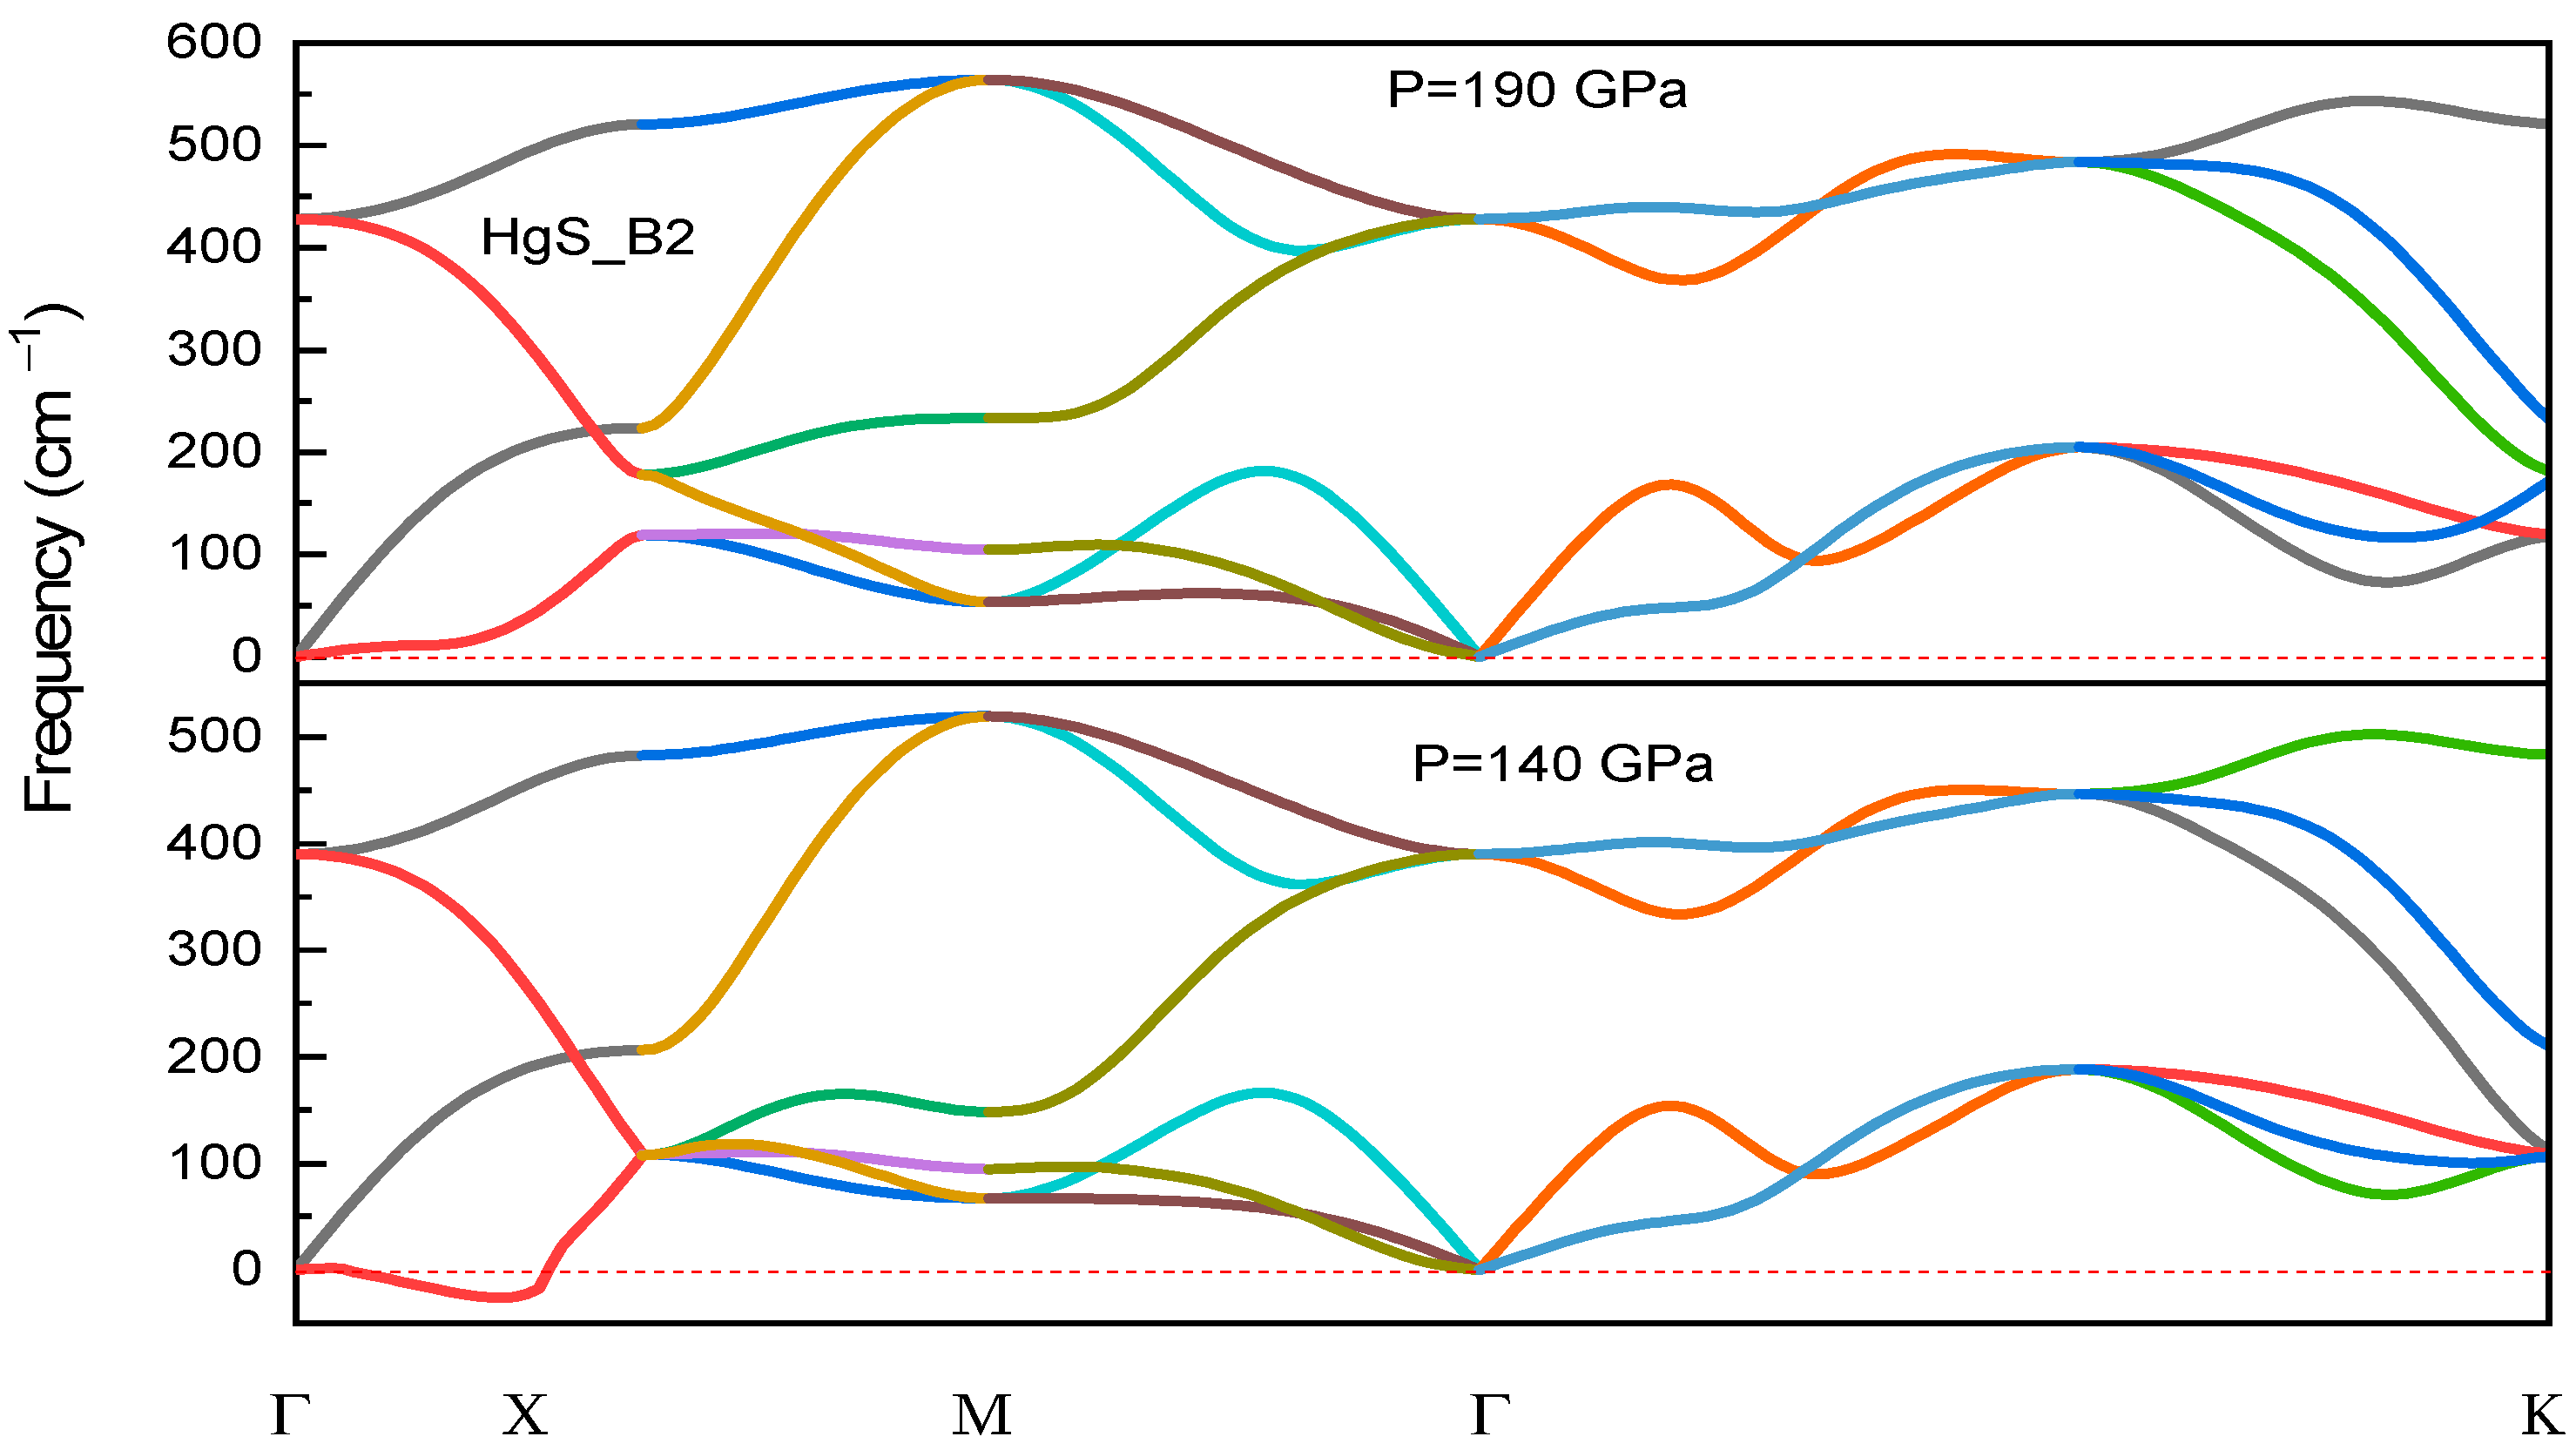
Additionally, Figure 6 demonstrates that HgS is dynamically stable in phase B 1 only from a pressure of 21 GPa, which aligns with the value obtained from experimental measurements [13] and ab initio calculations [14]. At very high pressure, HgS is stable in the CsCl phase (B2). By studying the TA modes of phase B1 at various pressures, the instabilities of these modes at points qi, specifically at point X, are the cause of the phase transition at a pressure of 96 GPa. This value marks the beginning of the phase transition to another structure. Although theoretical simulations (static method) suggest that the transition from the NaCl structure to the CsCl structure could occur at a pressure of 28 GPa [14] and from B 1 57.9 G P a P m m n 210 G P a B 3 [30], experimental studies have not yet examined HgS at very high temperatures and pressures above 60 GPa.
Figure 7 and Figure 8 show that our dynamic calculations predicted a value around 109 GPa, which aligns well with [30]. However, the static method founded on enthalpy calculations [14] cannot confirm this stabilization since it does not account for atomic vibrations. Additionally, it is possible that another structure with lower total energy could exist but hasnot yet been investigated.

4. Conclusions

In this study, the static, mechanical, and dynamic properties of HgS were investigated using first-principles calculations. The results of the static study showed that HgS can crystallize in the cinnabar, wurtzite, or zinc-blende structures with a difference of a few meV. At a high pressure, the NaCl and CsCl structures are favored. The study of mechanical properties confirmed the stability of the cubic and hexagonal phases. The dynamic analysis, carried out through phonon calculations, confirmed the previous results on the existence of the hexagonal phase between the alpha and beta phases and indicated that a phase transition occurs towards the NaCl structure and that at very high pressure (>190 GPa), HgS will adopt the CsCl phase. Our results are in agreement with experimental measurements and theoretical data. Our study represents the first theoretical proposal of the existence of the hexagonal phase and the first dynamic analysis at high pressure.

Author Contributions

Conceptualization, A.A.A. and A.A.; methodology, A.A.A.; software, A.A.A.; validation, A.A.; formal analysis, A.A.A. and A.A.; investigation, A.A.A. and A.A.; resources, J.P.V.; data curation, A.A.A. and A.A.; writing—original draft preparation, A.A.; writing—review and editing, A.A. and J.P.V.; visualization, A.A., M.O.-M., M.E.A.B. and S.D.; supervision, A.A., M.O.-M., J.P.V. and S.D.; project administration, M.E.A.B.; funding acquisition, A.A. All authors have read and agreed to the published version of the manuscript.

Funding

This research received no external funding.

Data Availability Statement

The original contributions presented in the study are included in the article.

Acknowledgments

The authors would like to thank the optoelectronics team, Institute of Electronics, Microelectronics and Nanotechnology (IEMN), UMR CNRS 8520. University of Sciences and Technologies of Lille 1, Avenue Poincare, 60069, 59652 Villeneuve of Ascq, France, for the helpful support during the accomplishment of this work.

Conflicts of Interest

The authors declare that they have no known competing financial interests or personal relationships that could have appeared to influence the work reported in this paper.

References

  1. Wissmann, H.; Anh, T.T.; Rogaschewski, S.; Von Ortenberg, M. Self-organized MBE growth of II–VI epilayer son patterned GaSb substrates. J. Cryst. Growth 1999, 201, 619–622. [Google Scholar] [CrossRef]
  2. Hu, T.-J.; Cui, X.-Y.; Li, X.-F.; Wang, J.-S.; Yang, J.-H.; Gao, C.-X. In Situ Electrical Resistivity and Hall Effect Measurement of beta-Hg Sunder High Pressure. Chin. Phys. Lett. 2015, 32, 3. [Google Scholar] [CrossRef]
  3. Ren, T.; Xu, S.; Zhao, W.-B.; Zhu, J.-J. A surfactant-assisted photochemical route to single crystalline HgS nanotubes. J. Photochem. Photobiol. A Chem. 2005, 173, 93–98. [Google Scholar] [CrossRef]
  4. Kershaw, S.V.; Yiu, W.K.; Sergeev, A.; Rogach, A.L. Development of synthetic methods to grow long-wavelength infrared-emitting HgTe quantum dots in dimethyl form amide. Chem. Mater. 2020, 32, 3930–3943. [Google Scholar] [CrossRef]
  5. Mews, A.; Kadavanich, A.V.; Banin, U.; Alivisatos, A.P. tructural and spectroscopic investigations of CdS/HgS/CdS quantum-dot quantum wells. Phys. Rev. B 1996, 53, R13242. [Google Scholar] [CrossRef]
  6. Zallen, R.; Michael, E.S. Plasma edge and band structure of cubic HgS. Solid State Commun. 1970, 8, 1291–1294. [Google Scholar] [CrossRef]
  7. Szuszkiewicz, W.; Witkowska, B.; Jouanne, M.; Balkanski, M. Raman spectroscopy of cubic Hg1-xFexS. Mater. Sci. Forum. 1995, 182–184, 711–714. [Google Scholar] [CrossRef]
  8. Kovácskis, V.; Dódony, I. Structural disorder in natural cubic HgS. Acta Mineral. Petrogr. 1999, 40, 3–10. [Google Scholar]
  9. Chatterjee, P.M.; Pandey, D.; Raval, R.; Dubey, A.K. Coherent Aspects of Multifaceted Eco-friendly Biopolymer-Polyglutamic Acid from the Microbes. J. Pure Appl. Microbiol. 2019, 13, 741–756. [Google Scholar] [CrossRef]
  10. Werner, A.; Hochheimer, H.D.; Strössner, K.; Jayaraman, A. High-pressure X-ray diffraction studies on HgTe and HgS to 20GPa. Phys. Rev. B 1983, 28, 3330. [Google Scholar] [CrossRef]
  11. Bridgman, P.W. The Compression of 46 Substances to 50,000 kg/cm2; American Academy of Arts& Sciences: Boston, MA, USA, 1940; pp. 21–51. [Google Scholar]
  12. Huang, T.; Ruoff, A.L. Pressure induced phase transition of HgS. J. Appl. Phys. 1983, 54, 5459–5461. [Google Scholar] [CrossRef]
  13. Nelmes, R.J.; McMahon, M.I. Structural transitions in the group IV, III-V, and II-VI semiconductors under pressure. Semicond. Semimet. 1998, 54, 145–246. [Google Scholar]
  14. Kürkçü, C.; Selgin, A.L.; Merdan, Z.; Yamçiçier, Ç.; Öztürk, H. Investigation of structural and electronic properties of β-HgS: Molecular dynamics simulations. Chin. J. Phys. 2018, 56, 783–792. [Google Scholar] [CrossRef]
  15. Ullah, N.; Murtaza, G.; Khenata, R.; Wong, K.M. Phase transition, electronic and optical properties of mercury chalcogenides under pressure. Phase Transit. 2014, 87, 571–581. [Google Scholar] [CrossRef]
  16. Saini, P.K.; Ahlawat, D.S.; Singh, D. Structural, electronic and optical properties of HgS under pressure using FP-LAPW method. Int. Res. J. Eng. Technol. (IRJET) 2017, 4, 1080–1086. [Google Scholar]
  17. Vodolazov, D.Y.; Peeters, F.M. Superconducting rectifier based on the asymmetric surface barrier effect. Phys. Rev. B 2005, 72, 172508. [Google Scholar] [CrossRef]
  18. Yang, X.C.; Yang, J.; Zhang, E.-J.; Gao, C.-X. Study of electronic and elastic properties of beta-HgS under high pressure viafirst-principles calculations. Phys. Status Solidi C Curr. Top. Solid State Phys. 2011, 8, 1703–1707. [Google Scholar]
  19. Cardona, M.; Kremer, R.K.; Lauck, R.; Siegle, G.; Muñoz, A.; Romero, A.H. Electronic, vibrational, and thermodynamic properties of metacinnabar β-HgS, HgSe, and HgTe. Phys.Rev. 2009, B 80, 195204. [Google Scholar] [CrossRef]
  20. Ozoliņš, V.; Zunger, A. The oryofsy stematicabsence of NaCl-Type(β-Sn–Type)high pressure phases in covalent(ionic) semiconductors. Phys. Rev. Lett. 1999, 82, 767. [Google Scholar] [CrossRef]
  21. Baroni, S.; de Gironcoli, S.; Stefano; Corso, D. Phonons and related crystal properties from density functional perturbationtheory. Rev. Mod. Phys. 2001, 73, 515–562. [Google Scholar] [CrossRef]
  22. Perdew, J.P.; Burke, K.; Ernzerhof, M. Matthias, Generalized gradient approximation made simple. Phys. Rev. Lett. 1996, 77, 3865. [Google Scholar] [CrossRef] [PubMed]
  23. Andrew, M.R.; Karin, M.R.; Kaxiras, E.; Joannopoulos, J.D. Optimised pseudopotential. Phys. Rev. B 1990, 41, 1227, Erratum in Phys. Rev. 1991, 44, 13175–13176. [Google Scholar]
  24. Pack, J.D.; Hendrik, M.J. Special points for Brillouin-zone integrations, a reply. Phys. Rev. B 1977, 16, 1748. [Google Scholar] [CrossRef]
  25. Dominic, F.M. The compressibility of media under extreme pressures. Proc. Natl. Acad. Sci. USA 1944, 30, 244–247. [Google Scholar]
  26. Madelung, O. Landolt Bornste: Numerical Data and Functional Relationships in Science and Technology; New Series, Group III; Springer: Berlin/Heidelberg, Germany, 1982; Volume 22, pp. 244–247. [Google Scholar]
  27. Strobel, S.; Schleid, T. Quaternäre Caesium-Kupfer(I)-Lanthanoid (III)-Selenide Vom Typ CsCu3M2Se5(M=Sm, GdLu). Z. Für Anorg. Und Allg. Chem. 2014, 630, 706–711. [Google Scholar] [CrossRef]
  28. Földvári, M. Hand book of Thermogravimetric System of Minerals and Its Use in Geological Practice; Geological Institute of Hungary: Budapest, Hungary, 2011. [Google Scholar]
  29. Biering, S.; Schwerdtfeger, P.A. comparative density functional study of the high-pressure phases of solid ZnX, CdX, and HgX (X=S, Se, and Te): Trends and relativistic effects. J. Chem. Phys. 2012, 137, 034705. [Google Scholar] [CrossRef] [PubMed]
  30. Nelmes, R.J.; Mc Mahon, M.I. High Pressure Semiconductor Physics I; Suski, T., Paul, W., Eds.; Academic Press: Cambridge, MA, USA, 1998; pp. 145–247. [Google Scholar]
  31. McMahon, M.I.; Nelmes, R.J. Observation of a cinnabar phase in GaAs at high pressure. Phys. Rev. Lett. 1997, 19, 3697. [Google Scholar] [CrossRef]
  32. Born, M.; Huang, K. Dynamical Theory of Crystal Lattices; Oxford University Press: Oxford, UK, 1954. [Google Scholar]
  33. Eshelby, J.D. The determination of the elastic field o fan ellipsoidal inclusion, and related problems. Proc. R. Soc. A 1957, 241, 376–396. [Google Scholar]
  34. Reuss, A. Berechnung Der Fließgrenzen Mischkristallen Aufgrund Der Plastizität Bedingung Für Einkristalle. ZAMM-J. Appl. Math. Mech./Zeitschriftfür Angewandte Mathematik und Mechanik 1929, 9, 49–58. [Google Scholar] [CrossRef]
  35. Morse, P.M. The elastic constants of isotropic materials. Phys. Rev. 1929, 34, 57–64. [Google Scholar] [CrossRef]
  36. Nayfeh, A.H. Introduction to Perturbation Techniques; John Wiley&Sons: Hoboken, NJ, USA, 1981. [Google Scholar]
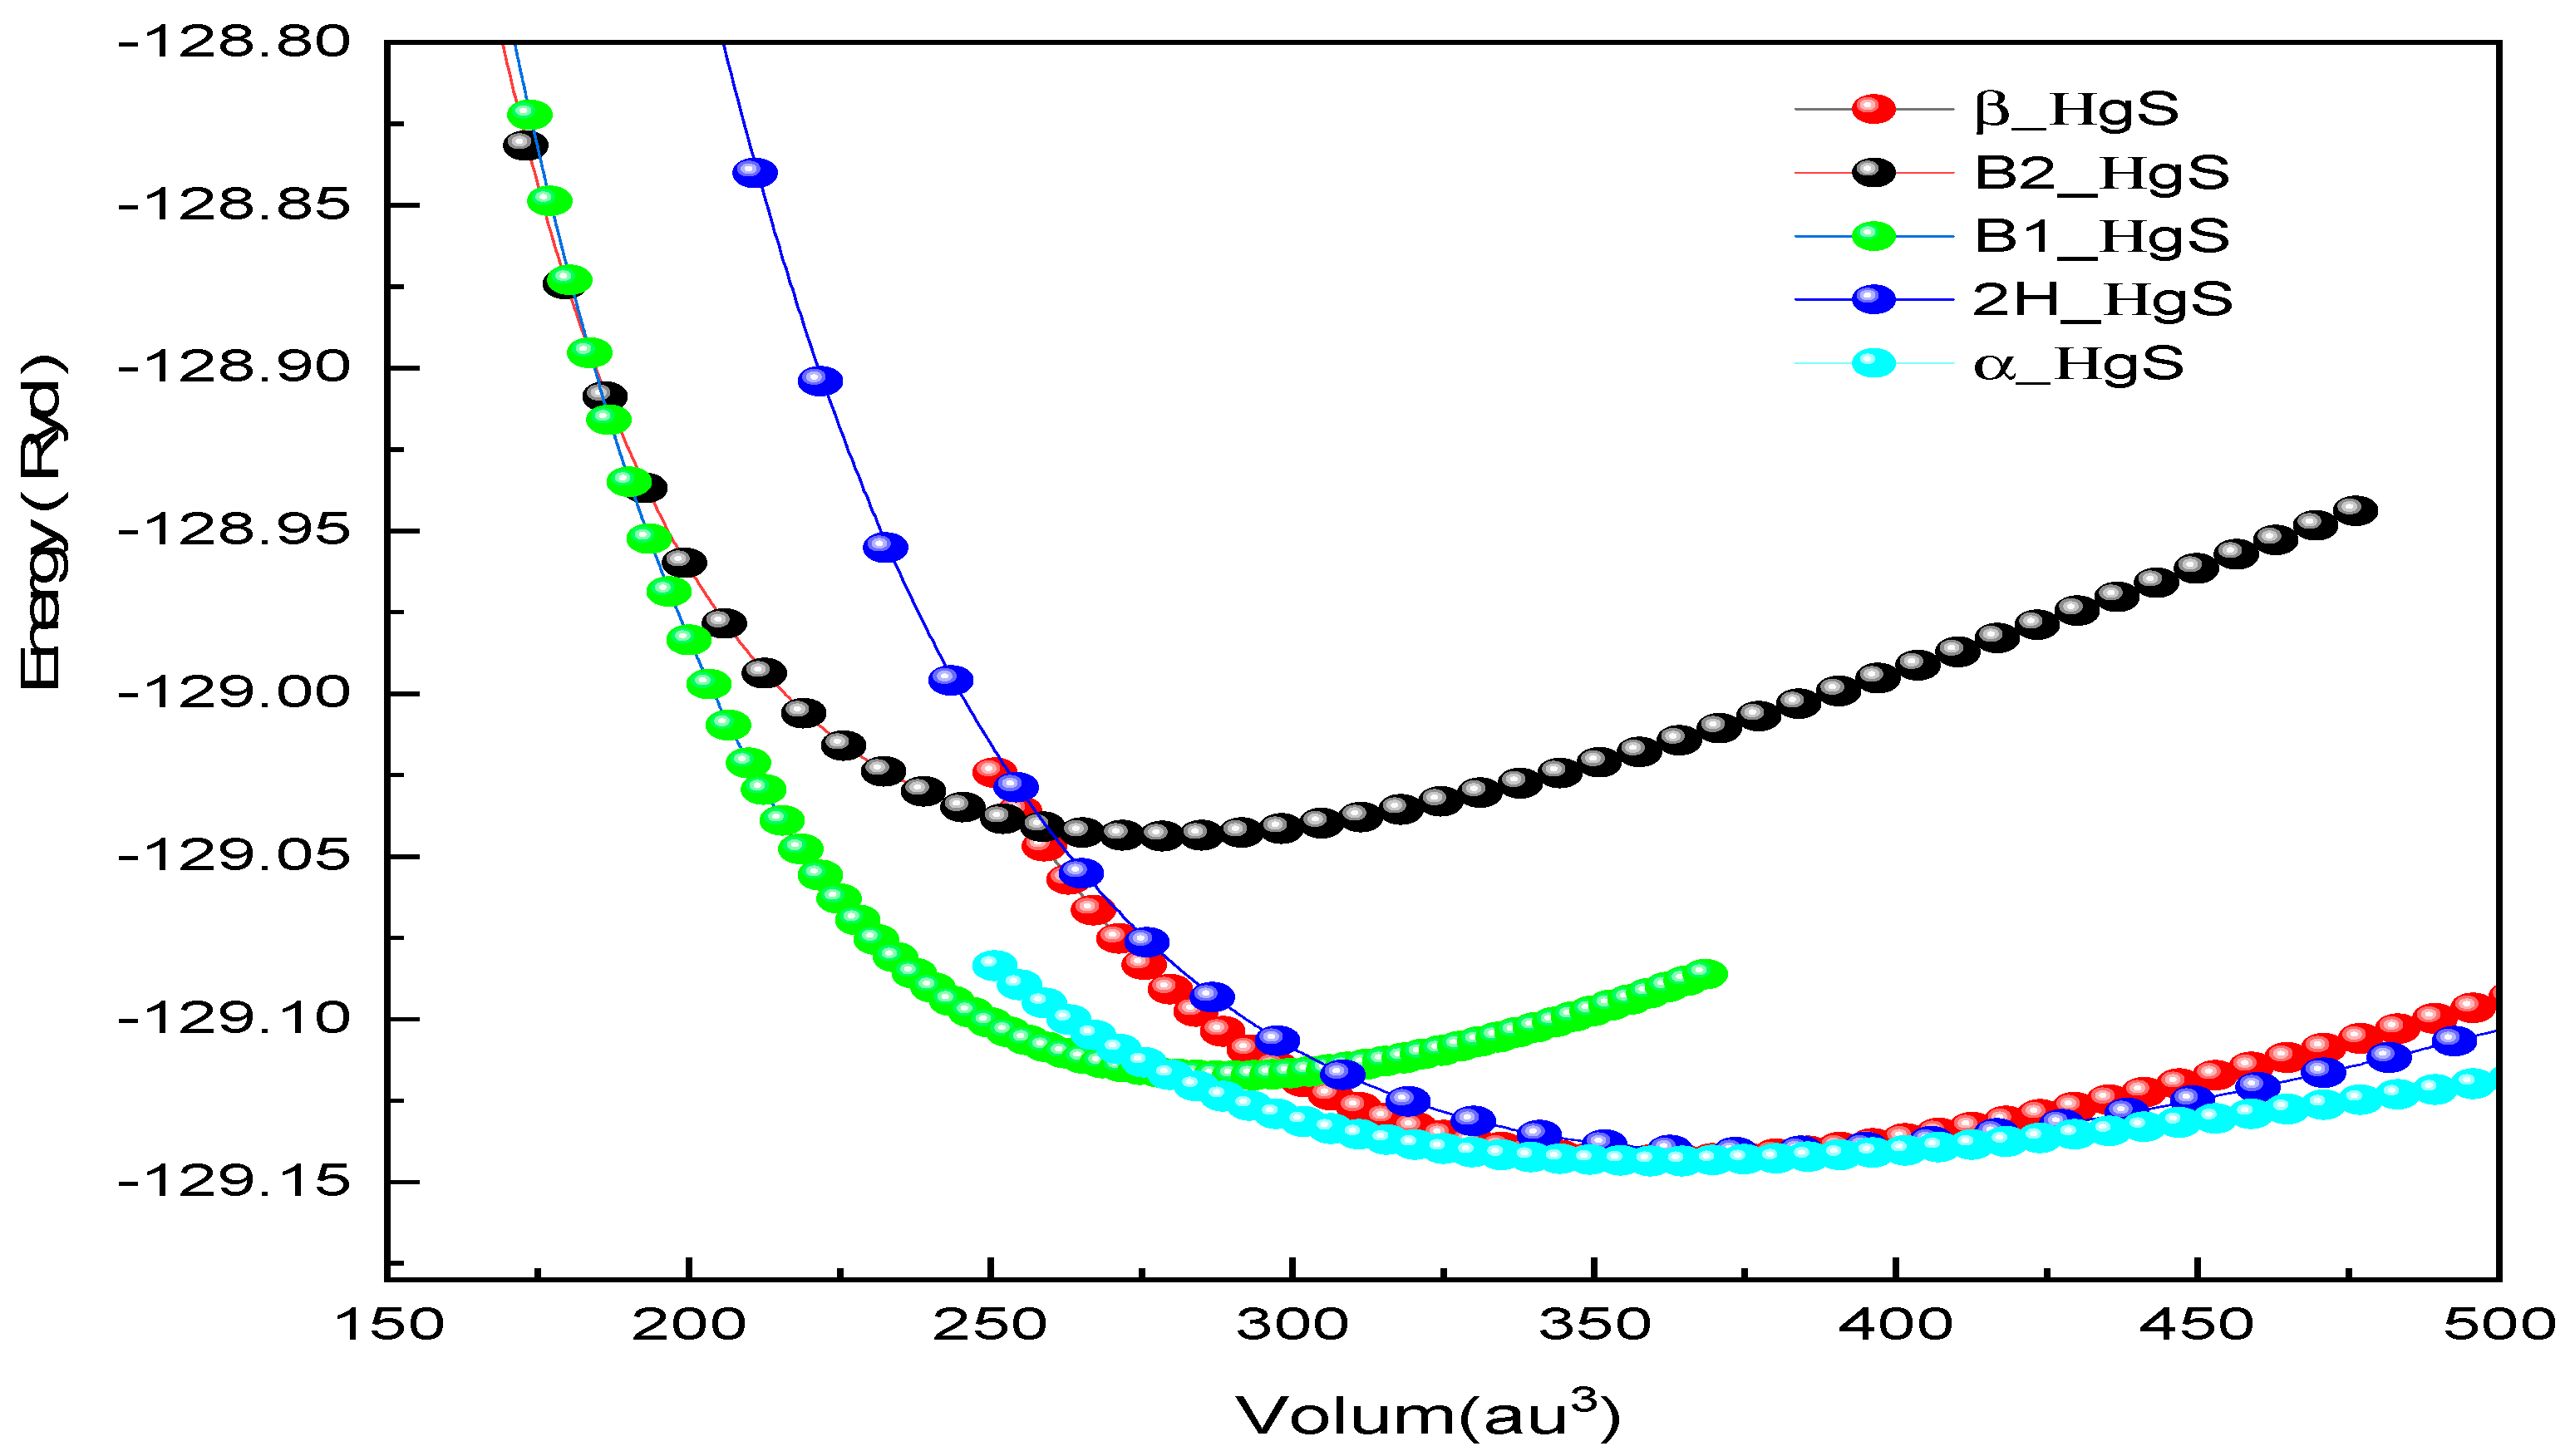
Figure 1. Total energy (Ryd) as a function of volume (au3) for HgS.
Crystals 14 00780 g001
Figure 2. Enthalpy as a function of pressure (P) for HgS.
Crystals 14 00780 g002
Figure 3. Dispersion of vibrational modes in the cinnabar, wurtzite and zinc-blende phases of HgS.
Crystals 14 00780 g003
Figure 4. Phonons dispersion curve of the zinc-blende phase of HgS at different pressures.
Crystals 14 00780 g004
Figure 5. Calculated TA phonons frequencies at the q i ( e ,   0 ,   0 ) points for the B 3 phase of HgS as a function of pressure.
Crystals 14 00780 g005
Figure 6. Phonon dispersion curve of the NaCl phase of HgS at different pressures.
Crystals 14 00780 g006
Figure 7. Calculated TA phonons frequencies at the q i ( e ,   0 ,   0 ) points for the B 1 phase of HgS as a function of pressure.
Crystals 14 00780 g007
Figure 8. Phonon dispersion curve of the CsCl phase of HgS at different pressures.
Crystals 14 00780 g008
Table 1. The calculated equilibrium lattice parameter (a), bulk modulus (B0), and the pressure derivative of the bulk modulus (B’) for HgS are compared with various experimental and theoretical values.
StructureReferencea (Å)C (Å)B (GPa)B0 (GPa)
α-HgSThis work4.289.7163.963.73
Exp [28]4.159.50-4.00
Cal [19]4.369.7016.005.40
Cal [19]4.299.6922.504.80
β-HgSThis work6.00 70.014.91
Exp [27]5.85 68.60
Cal [15]5.97 65.40
Cal [14]6.04 59.084.69
WurtziteThis work4.226.9150.504.93
B1This work5.52 92.303.58
Cal [14]5.59 98.904.65
Cal [15]5.49 86.30
B2This work3.45 53.805.00
Cal [14]3.43 94.315.44
Cal [15]3.52 67.404.80
Table 2. Comparison of transition pressures (Pt) between Gibbs statistical method and dynamic method with experimental measurements and theoretical calculations.
StructureReferencePt (GPa)
α-HgSStat0
Dyn0
Exp [28]0
Cal [19]0
β-HgSStat0.65
Dyn0
Exp [28]0
Cal-LDA [19]0.70
WurtziteStat0.70
Dyn0
B1Stat6.07
Dyn21
Exp [12,13]13, 20.57
Cal-GGA [14,15,16,17]20, 19.9, 16.1, 26.75
Cal-LDA [19]22.2
B2Dyn190
Exp-
Cal-GGA [14,30]28, 210
Table 3. Elastic constant in GPa, Shear modulus, G (GPa), Young’s modulus E (GPa), Poisson’s ratio ν and Debye temperature θ D (K).
Ref.C11C12C13C33C44EGν θ D
This work82.5071.10--18.2032.7011.400.42138
[16]70.4046.50--43.3076.9030.300.26-
[32]61.8044.90--25.2044.10-0.33213
This work86.7037.8027.6093.8016.8059.5023.400.27196
Disclaimer/Publisher’s Note: The statements, opinions and data contained in all publications are solely those of the individual author(s) and contributor(s) and not of MDPI and/or the editor(s). MDPI and/or the editor(s) disclaim responsibility for any injury to people or property resulting from any ideas, methods, instructions or products referred to in the content.