Article

The Effect of Hatch Spacing on the Electrochemistry and Discharge Performance of a CeO2/Al6061 Anode for an Al-Air Battery via Selective Laser Melting

School of Mechanical Engineering, Wuxi Institute of Technology, Wuxi 214121, China
*
Author to whom correspondence should be addressed.
Crystals 2024, 14(9), 797; https://doi.org/10.3390/cryst14090797
Submission received: 17 August 2024 / Revised: 3 September 2024 / Accepted: 6 September 2024 / Published: 9 September 2024
(This article belongs to the Section Materials for Energy Applications)

Abstract

:
To improve the electrochemical activity and discharge performance of an aluminum-air (Al-air) battery, a commercial 6061 alloy (Al6061) was selected as the anode, and CeO2 was also added inside the anode to enhance its performance. The CeO2/Al6061 composite was prepared using selective laser melting (SLM) technology. The influence of hatch spacing on the forming quality, corrosion resistance, and discharge performance of the anode was studied in detail. The results showed that with an increase in hatch spacing, the density, corrosion resistance, and discharge performance of the anode first increased and then decreased. When the hatch spacing is 0.13 mm, the anode has the best forming quality. At this point, the density reaches 98.39%, and the self-corrosion rate (SCR) decreases to 2.596 × 10⁻⁴ g·cm−2·min−1. Meanwhile, the anode exhibits its highest electrochemical activity and discharge voltage, which is up to −1.570 V. The change in anode performance is related to the defects generated during the SLM forming process. For samples with fewer defects, the anode can dissolve uniformly, while for samples with more defects, the electrode solution is prone to penetrate the defects, causing uneven corrosion and reducing electrochemical and discharge activity.

1. Introduction

An aluminum-air (Al-air) battery is a semi-fuel cell that converts chemical energy into electrical energy through electrochemical reactions [1,2,3]. It has the advantages of high efficiency, low cost, and environmental friendliness, making it an attractive candidate for modern power applications [4,5]. However, the commercialization of Al-air batteries still faces many challenges. The adhesion of passivation film and corrosion products on the anode surface can lead to a decrease in electrochemical activity, a decrease in the anode utilization rate, and a lag in discharge voltage, which seriously restricts the development and application of Al-air batteries [6,7]. Therefore, how to improve the discharge activity of aluminum anodes is currently one of the key and difficult issues in research.
At present, the traditional processing methods for preparing aluminum matrix composites mainly include powder metallurgy and squeeze casting. Due to insufficient temperature during the manufacturing process of traditional processing methods, the composite materials prepared are prone to component segregation, resulting in a coarse grain size and uneven microstructure distribution of the formed parts, which affects the forming quality. Moreover, the process is complex, and the production cycle is relatively long for traditional processing methods [8,9]. Selective laser melting (SLM) technology uses laser as an energy source to melt and fuse powder material, following a predetermined scanning path, and prepare parts with excellent mechanical properties, high-quality surfaces, and complex geometric shapes in a near-net forming manner [10,11]. When forming by SLM, the appropriate laser process parameters can reduce the number of defects, improve the microstructure, and have a significant impact on material properties [12,13].
Hatch spacing, as an important parameter of SLM technology, has been extensively studied in Ti-6Al-4V, Inconel 718, 316L stainless steel, Ni-Ti alloys, and so on [14,15,16,17]. Hacisalihoglu et al. studied the effects of hatch spacing on the static mechanical and impact properties of medical Ti-6Al-4V alloys and found that as hatch spacing increased, the ultimate tensile strength decreased, but the elongation showed different trends. The highest elongation value was obtained when the hatch spacing was 67.5 μm [18]. Mao et al. investigated the effect of hatch spacing on the forming quality of an Inconel 718 alloy, including its properties, such as micro-hardness, wear resistance, and porosity density. The results indicate that as the hatching distance decreases, the overlap rate increases, leading to the formation of pores in the melt pool. When the distance between the hatches is too large, the overlapping area will decrease, and the strength of the specimen will be insufficient. When the distance between the hatches is 0.06 mm, parts with a better comprehensive performance can be obtained [19]. Dong et al. studied the effect of hatch spacing on the microstructure and forming quality of 316L stainless steel and found that the microstructure became coarser with increased hatch spacing. When the hatch spacing was 100 µm, a fully dense part with a smooth surface could be obtained [20]. Feng et al. investigated the effect of hatch spacing on pore defects, phase transformation, mechanical properties, and the shape memory effect of Ni-Ti alloys. They found that as the hatch spacing increased, the main pore defects inside the sample evolved from keyholes to non-fused pores. The sample with a hatch spacing of 110 μm exhibited the best tensile properties and shape recovery rate [21].
In addition to the above-mentioned alloys, aluminum alloys have also been studied to some extent [22,23,24]. Hu et al. studied the evolution of top surface roughness in Al-Cu alloys and found that the spacing between hatches affects the fluctuation of powder thickness in subsequent layers, leading to instability in the melt pool [25]. Bi et al. explored the effect of hatch spacing on densification, microstructure, and tensile properties, and found that hatch spacing affected the overlap rate of monorails, which, in turn, affected the internal molding quality of the sample. Under the same conditions, the densification that increased first and then decreased with an increase in hatch spacing. At a hatch spacing of 80 mm, a sample with a tensile strength of 452 MPa and a density of 98.7% can be obtained [26]. However, there are few reports on the effect of hatch spacing on commercial aluminum alloys, let alone their use as anodes for Al-air batteries.
Based on this, a commercial 6061 alloy (Al6061) was selected, and CeO2 was also added inside to enhance its performance. The CeO2/Al6061 composite was prepared as the anode, using SLM technology for the Al-air battery, with a focus on investigating the influence of hatch spacing on the forming quality of the anode, including density, self-corrosion, and electrochemical and discharge behavior, in order to promote the commercial application of Al-air batteries.

2. Experiment

2.1. Materials and Equipment

Due to their excellent characteristics in reducing corrosion and improving electrochemical activity, the Al6061 and CeO2 powders were used as raw materials for preparing the anodes [27,28,29,30]. The particle size distribution of the Al6061 powder is within 15~53 μm, and was purchased from the Avimetal Powder Metallurgy Technology Co., Ltd., Beijing, China. The CeO2 powder, with a purity of 99.50%, comes from the Bangrui New Material Technology Co., Ltd., Fuyang, China. A mixed powder of 1.0 wt.% CeO2/Al6061 was prepared by ball milling, with a time of 1 h and a rotation speed of 100 rpm, the morphology of the processed metal powder is shown in Figure 1.
Samples with a size of 10 mm × 10 mm × 10 mm were prepared using SLM technology as the anode for the Al-air battery; the SLM equipment was provided by the Suzhou XDM 3D Printing Technology Co., Ltd., Suzhou, China. The laser process parameters used in this work are listed in Table 1. It should be noted that, except for hatch spacing (which is referred to as D in this work), all other parameters were constant. During the forming process, set the oxygen content below 100 ppm to prevent high-temperature oxidation reactions in the powder, and use argon as the inert protective gas.

2.2. Experiment and Testing Methods

A metallographic microscope (DM2700M, LEICA Instrument Company, Solms, Germay) was applied to observe the microstructure and surface of different specimens. Before metallographic testing, all samples were processed by sandpaper, of which the grade varied from 200 to 2000 on an integrated grinding and polishing machine.
The volume porosity of the SLM-produced specimens were measured by the drainage method. First, the samples were weighed with a precision balance (XS205-DU, METTLER TOLEDO, Zurich, Switzerland) and recorded as M. The volume of deionized water in the graduated cylinder, before and after the samples were put in, was noted as V0 and V1, respectively. Finally, the volume porosity can be calculated by the following equation
θ = M ρ ( V 1 V 0 ) × 100 %
where θ is the volume porosity; and ρ is the density of the sample.
The weight loss method was applied to describe the self-corrosion rate. All the samples with a size of 10 mm × 10 mm × 10 mm were first polished by different grades of sandpaper (from 200, 400, 800, 1200 to 2000) and ultrasonically cleaned in an ethanol solution for 0.5 h, then immersed in a 4 mol/L NaOH + 8 g/L ZnO + 2 g/L PAAS solution for 1 h at room temperature. After that, the samples were immersed in a solution of 2% CrO3 and 5% H3PO4 at 80 °C for 5 min to remove the corrosion products. By recording the weight of the samples before and after soaking as M0 and Mi (i = 1, 2, 3, 4, 5, 6) every 10 min, the self-corrosion rate (SCR) can be calculated according to the following formula:
S C R = M 0 M i S · T ( i = 1 , 2 , 3 , 4 , 5 , 6 )
where M0 and Mi are the weight of the samples before and after soaking, S is the surface area of the sample, and T is the test time.
The test sample was sealed and insulated with an epoxy resin, except for one working surface with an area of 10 mm × 10 mm. Before testing, all the samples were polished by sandpaper and ultrasonically cleaned, which is the same process as the SCR test. The electrochemical tests were carried out by the CHI750E electrochemical workstation (Shanghai Chenhua Instrument Co., Ltd., Shanghai, China). In the test, a Pt sheet as the counter electrode, a Hg/HgO as the reference electrode, with the CeO2/Al6061 sample work electrode, formed a three-electrode system in a 4 mol/L NaOH + 8 g/L ZnO + 2 g/L PAAS solution. The open-circuit potential of the working electrode was measured first, until it reached a steady state, and then the electrochemical impedance spectroscopy (EIS) measurements were conducted. The frequency of the EIS test ranged from 105 Hz to 10−1 Hz. Finally, the potentiodynamic polarization test was measured at a 1 mV/s scanning rate. Zsimpwin software was also used for data analysis.
The discharge performance of the Al-air battery is determined by constant-current discharge testing at current densities of 10 mA/cm2, utilizing the CT3001AU Land battery testing system. The anode is the CeO2/Al6061 sample, while the cathode is the gas diffusion layer, with a MnO2 catalytic active layer with an effective area of 25 cm2, the electrolyte solution is a 4 mol/L NaOH + 8 g/L ZnO + 2 g/L PAAS solution, and the discharge time was 1 h. A scanning electron microscope (SEM, su1510), produced by Hitachi, Ltd., Tokyo, Japan, was also applied to observe and analyze the surface morphology of the anode after discharge.
It should be pointed out that in order to reduce errors and ensure accuracy, all tests in this work were repeated three times, and the average value was used as the data in this article.

3. Results and Discussion

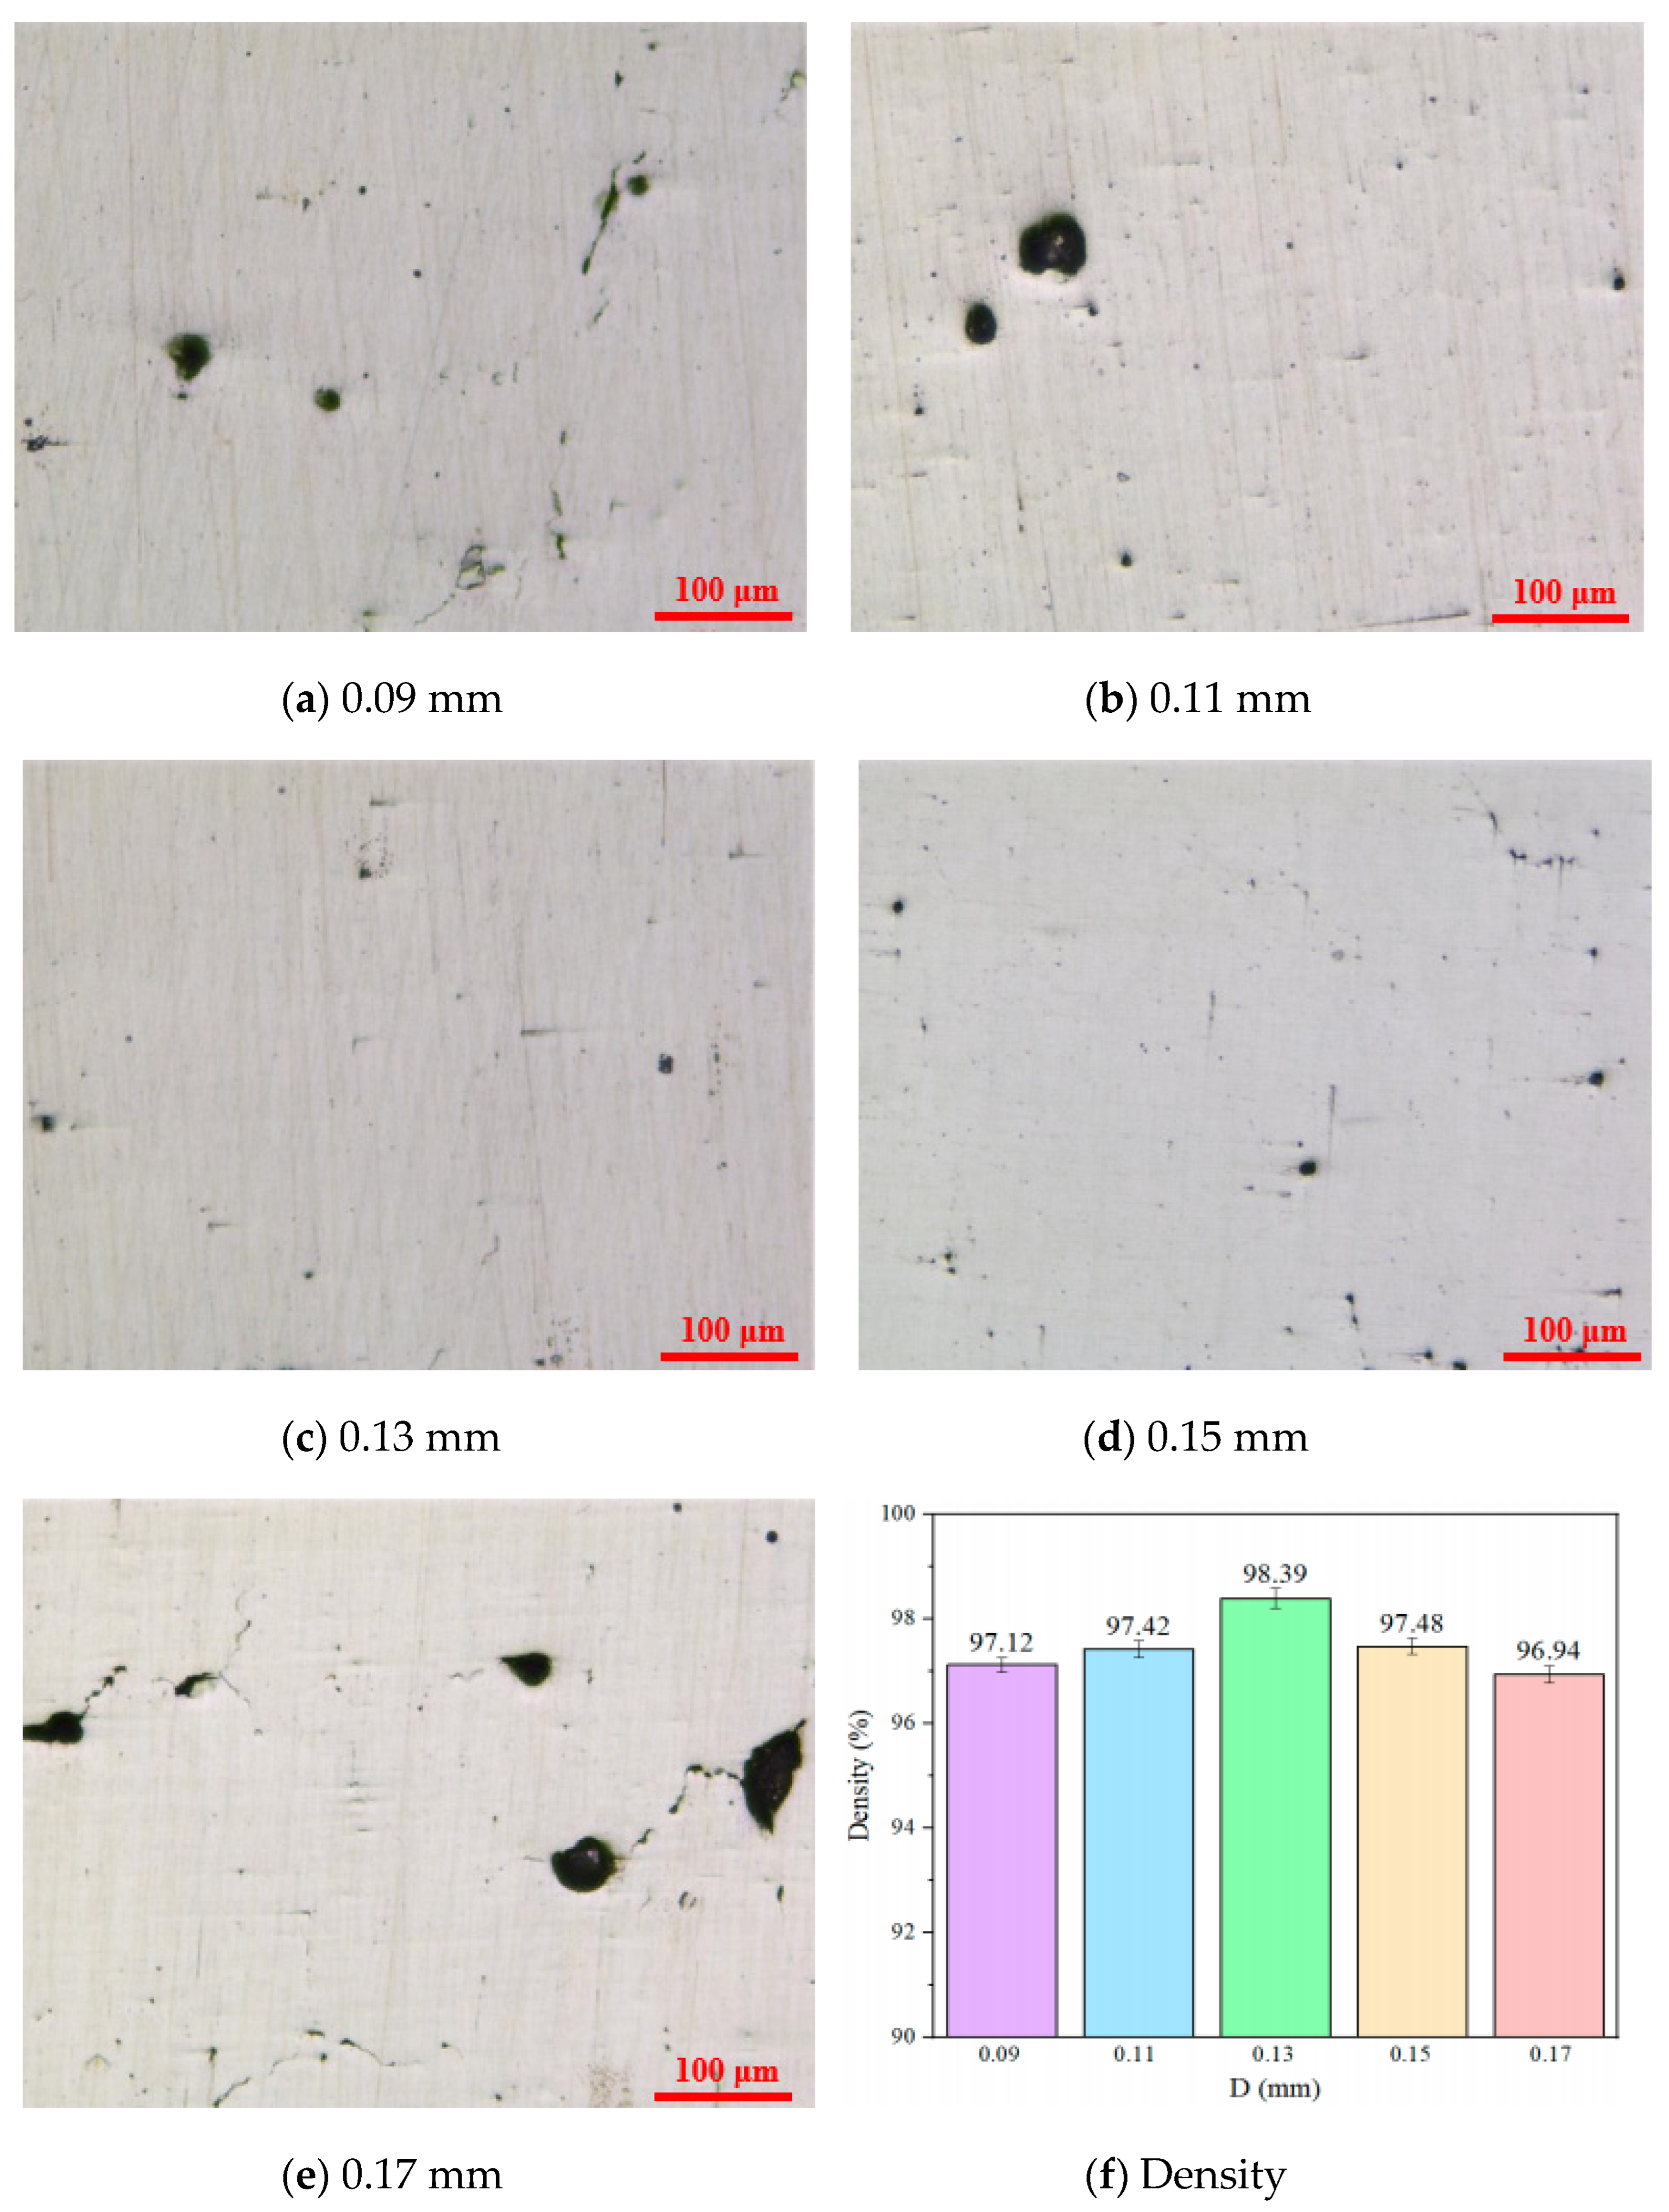
3.1. Surface Morphology and Density

The effect of hatch spacing on the surface morphology and density of the anode is shown in Figure 2. It can be observed that, as the hatch spacing gradually increases within the range of 0.09 to 0.17 mm, the number of surface defects shows a trend that first decreases and then increases, and the corresponding density shows a trend that first increases and then decreases. When the hatch spacing is small, the distance between adjacent laser scanning trajectories is too close, and there are too many overlapping areas in the melt, resulting in an increase in the height of some of the melt. In the process of processing the next layer, it is not possible to achieve uniform powder spreading, and the uneven distribution of powder will directly affect the forming quality of that layer. The accumulation of layers ultimately leads to the deterioration of the forming quality. Increasing the hatch spacing will exacerbate the spheroidization effect of the powder, and with the presence of surface tension, the liquid melt pool will absorb nearby unmelted powder, resulting in an uneven surface after solidification. In addition, when the hatch spacing is too large, adjacent melt channels cannot achieve complete and effective overlap, and the surface becomes uneven after solidification. Due to the cumulative effect of SLM and layer-by-layer scanning, the height error of the forming plane gradually increases, ultimately affecting the surface quality and performance of the formed part. When the hatch spacing is 0.13 mm, the scanning line height of the two adjacent molten channels is reasonable, and the substrate surface obtains an appropriate laser energy. The sample surface is relatively flat, with a surface roughness of 11.14 μm, and there are fewer pore defects, with a density of 98.39%. When the hatch spacing increases to 0.17 mm, larger pore defects appear on the surface of the sample, resulting in a decrease in density to 96.94%, and a surface roughness value of 15.98 μm. Based on the above analysis, it can be found that the laser process parameters can be appropriately adjusted to reduce the number of defects and improve the forming quality of the sample.

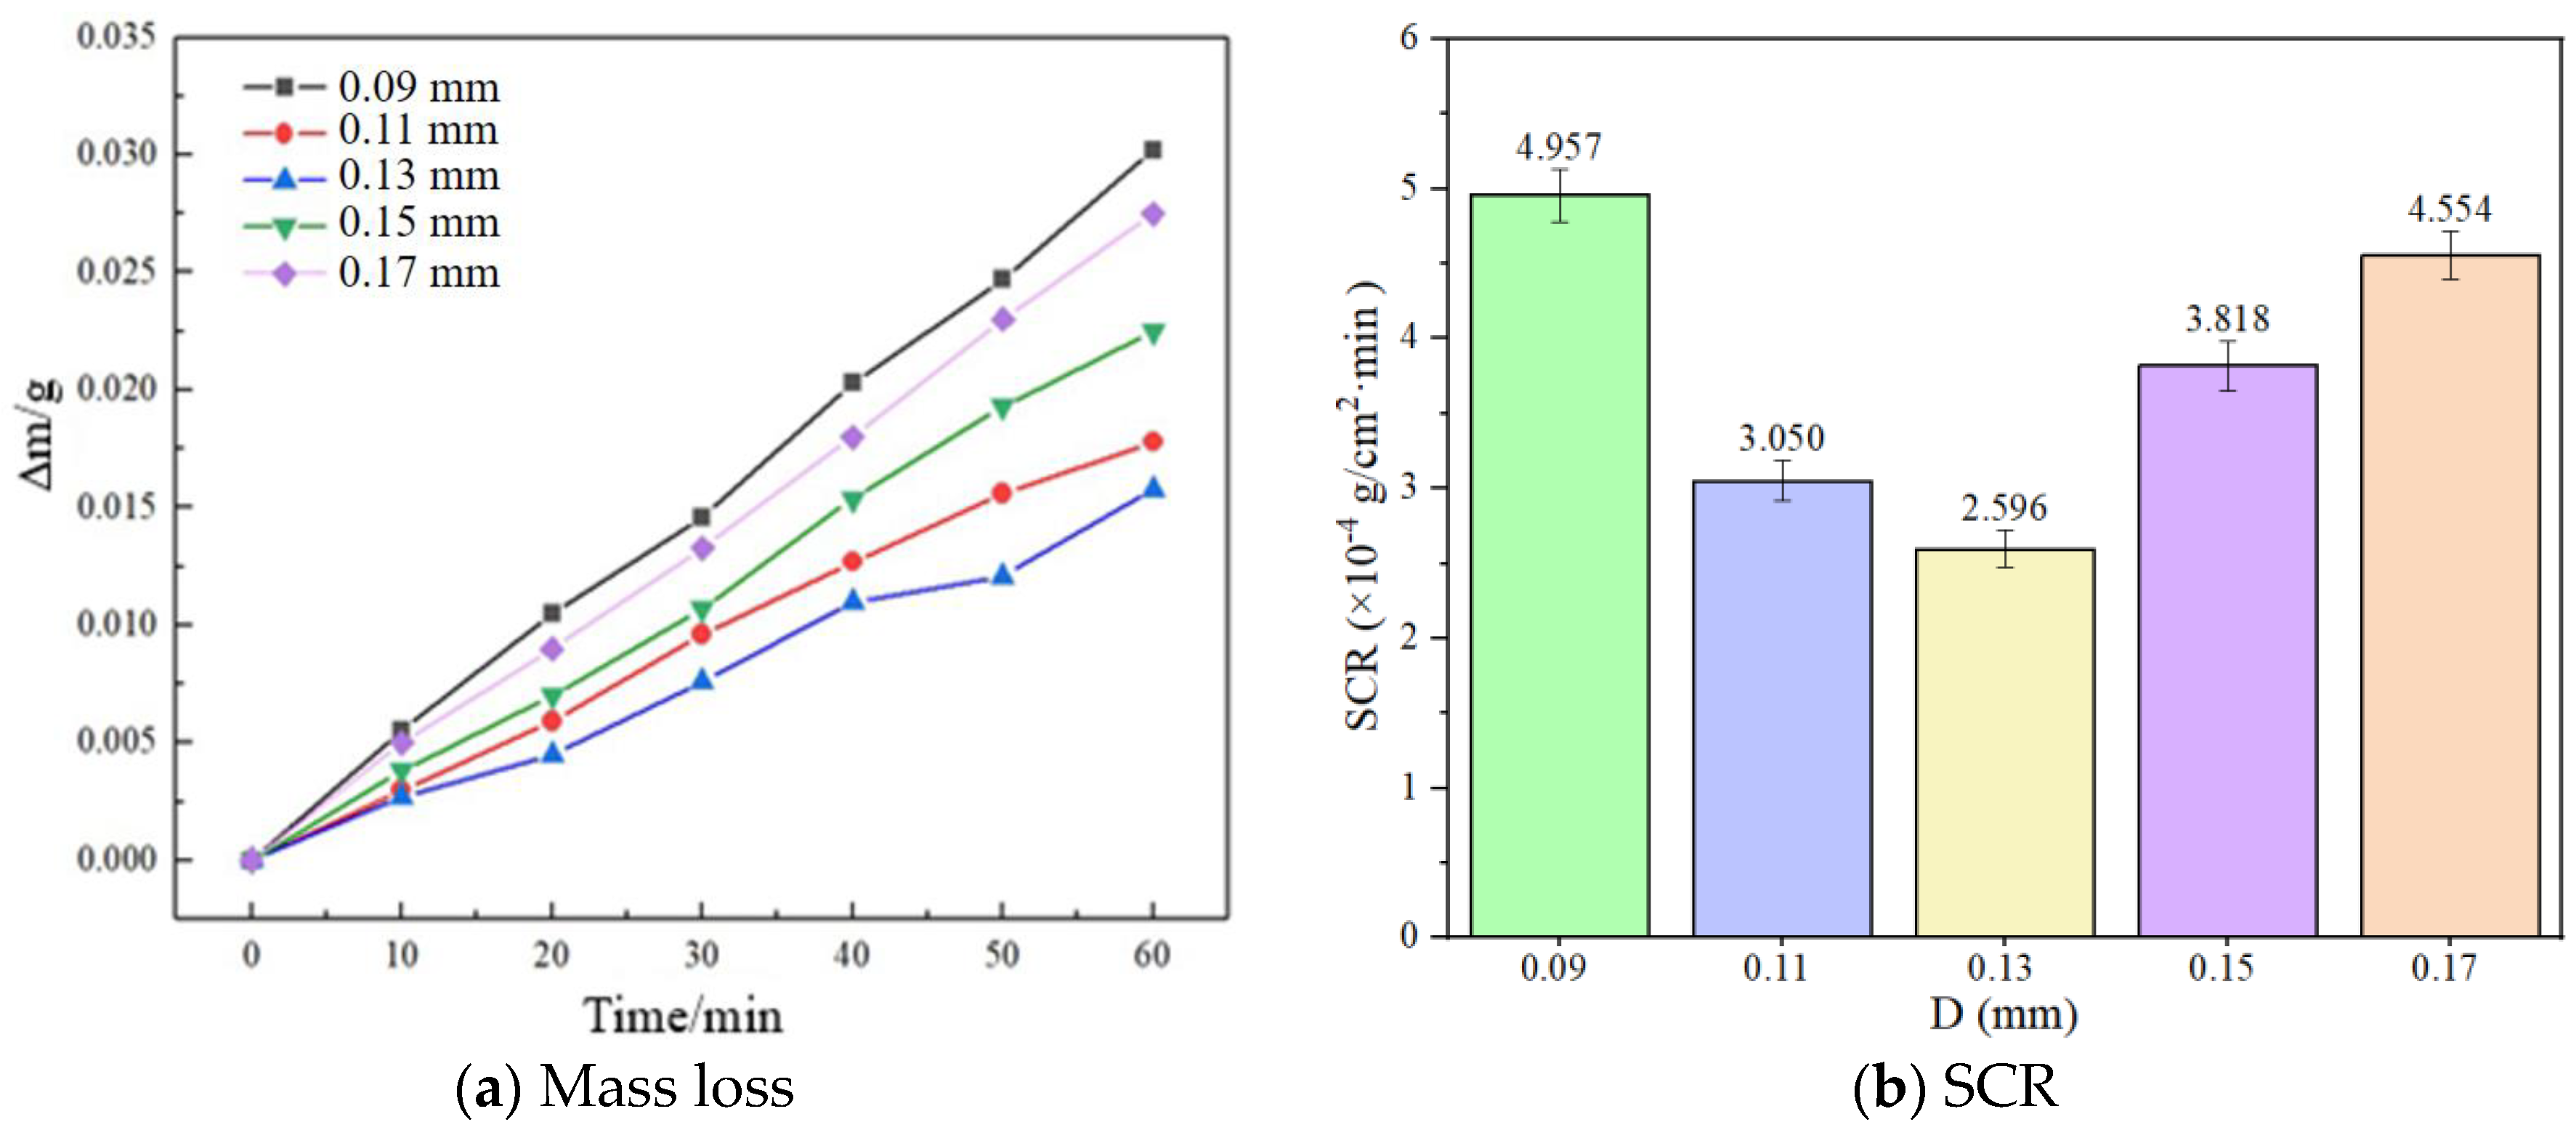
3.2. Self-Corrosion Rate

The self-corrosion performance of samples under different hatch spacing is shown in Figure 3. As can be seen, with the increase of corrosion time, the weight loss of the sample increases. However, within the same time frame, the weight loss of the sample is not linear, which may be due to the adhesion of corrosion products on the surface of the sample, as shown in Figure 3a. As it increases from 0.09 to 0.17 mm, there is a significant change in the weight loss of the sample. When it is 0.09 mm, there is not enough overlap between adjacent melt channels, resulting in the poor forming quality of the sample and maximum weight loss, and the corresponding SCR is 4.957 × 10⁻⁴ g·cm−2·min−1. When it increases to 0.13 mm, the overlap between adjacent melt channels is appropriate, and the sample has fewer pore defects, so its corrosion resistance is strong, and the corresponding SCR is 2.596 × 10⁻⁴ g·cm−2·min−1. However, as the hatch spacing further increases to 0.15 and 0.17 mm, the forming quality of the sample deteriorates, resulting in an increase in weight loss and a corresponding increase in SCR, as shown in Figure 3b.

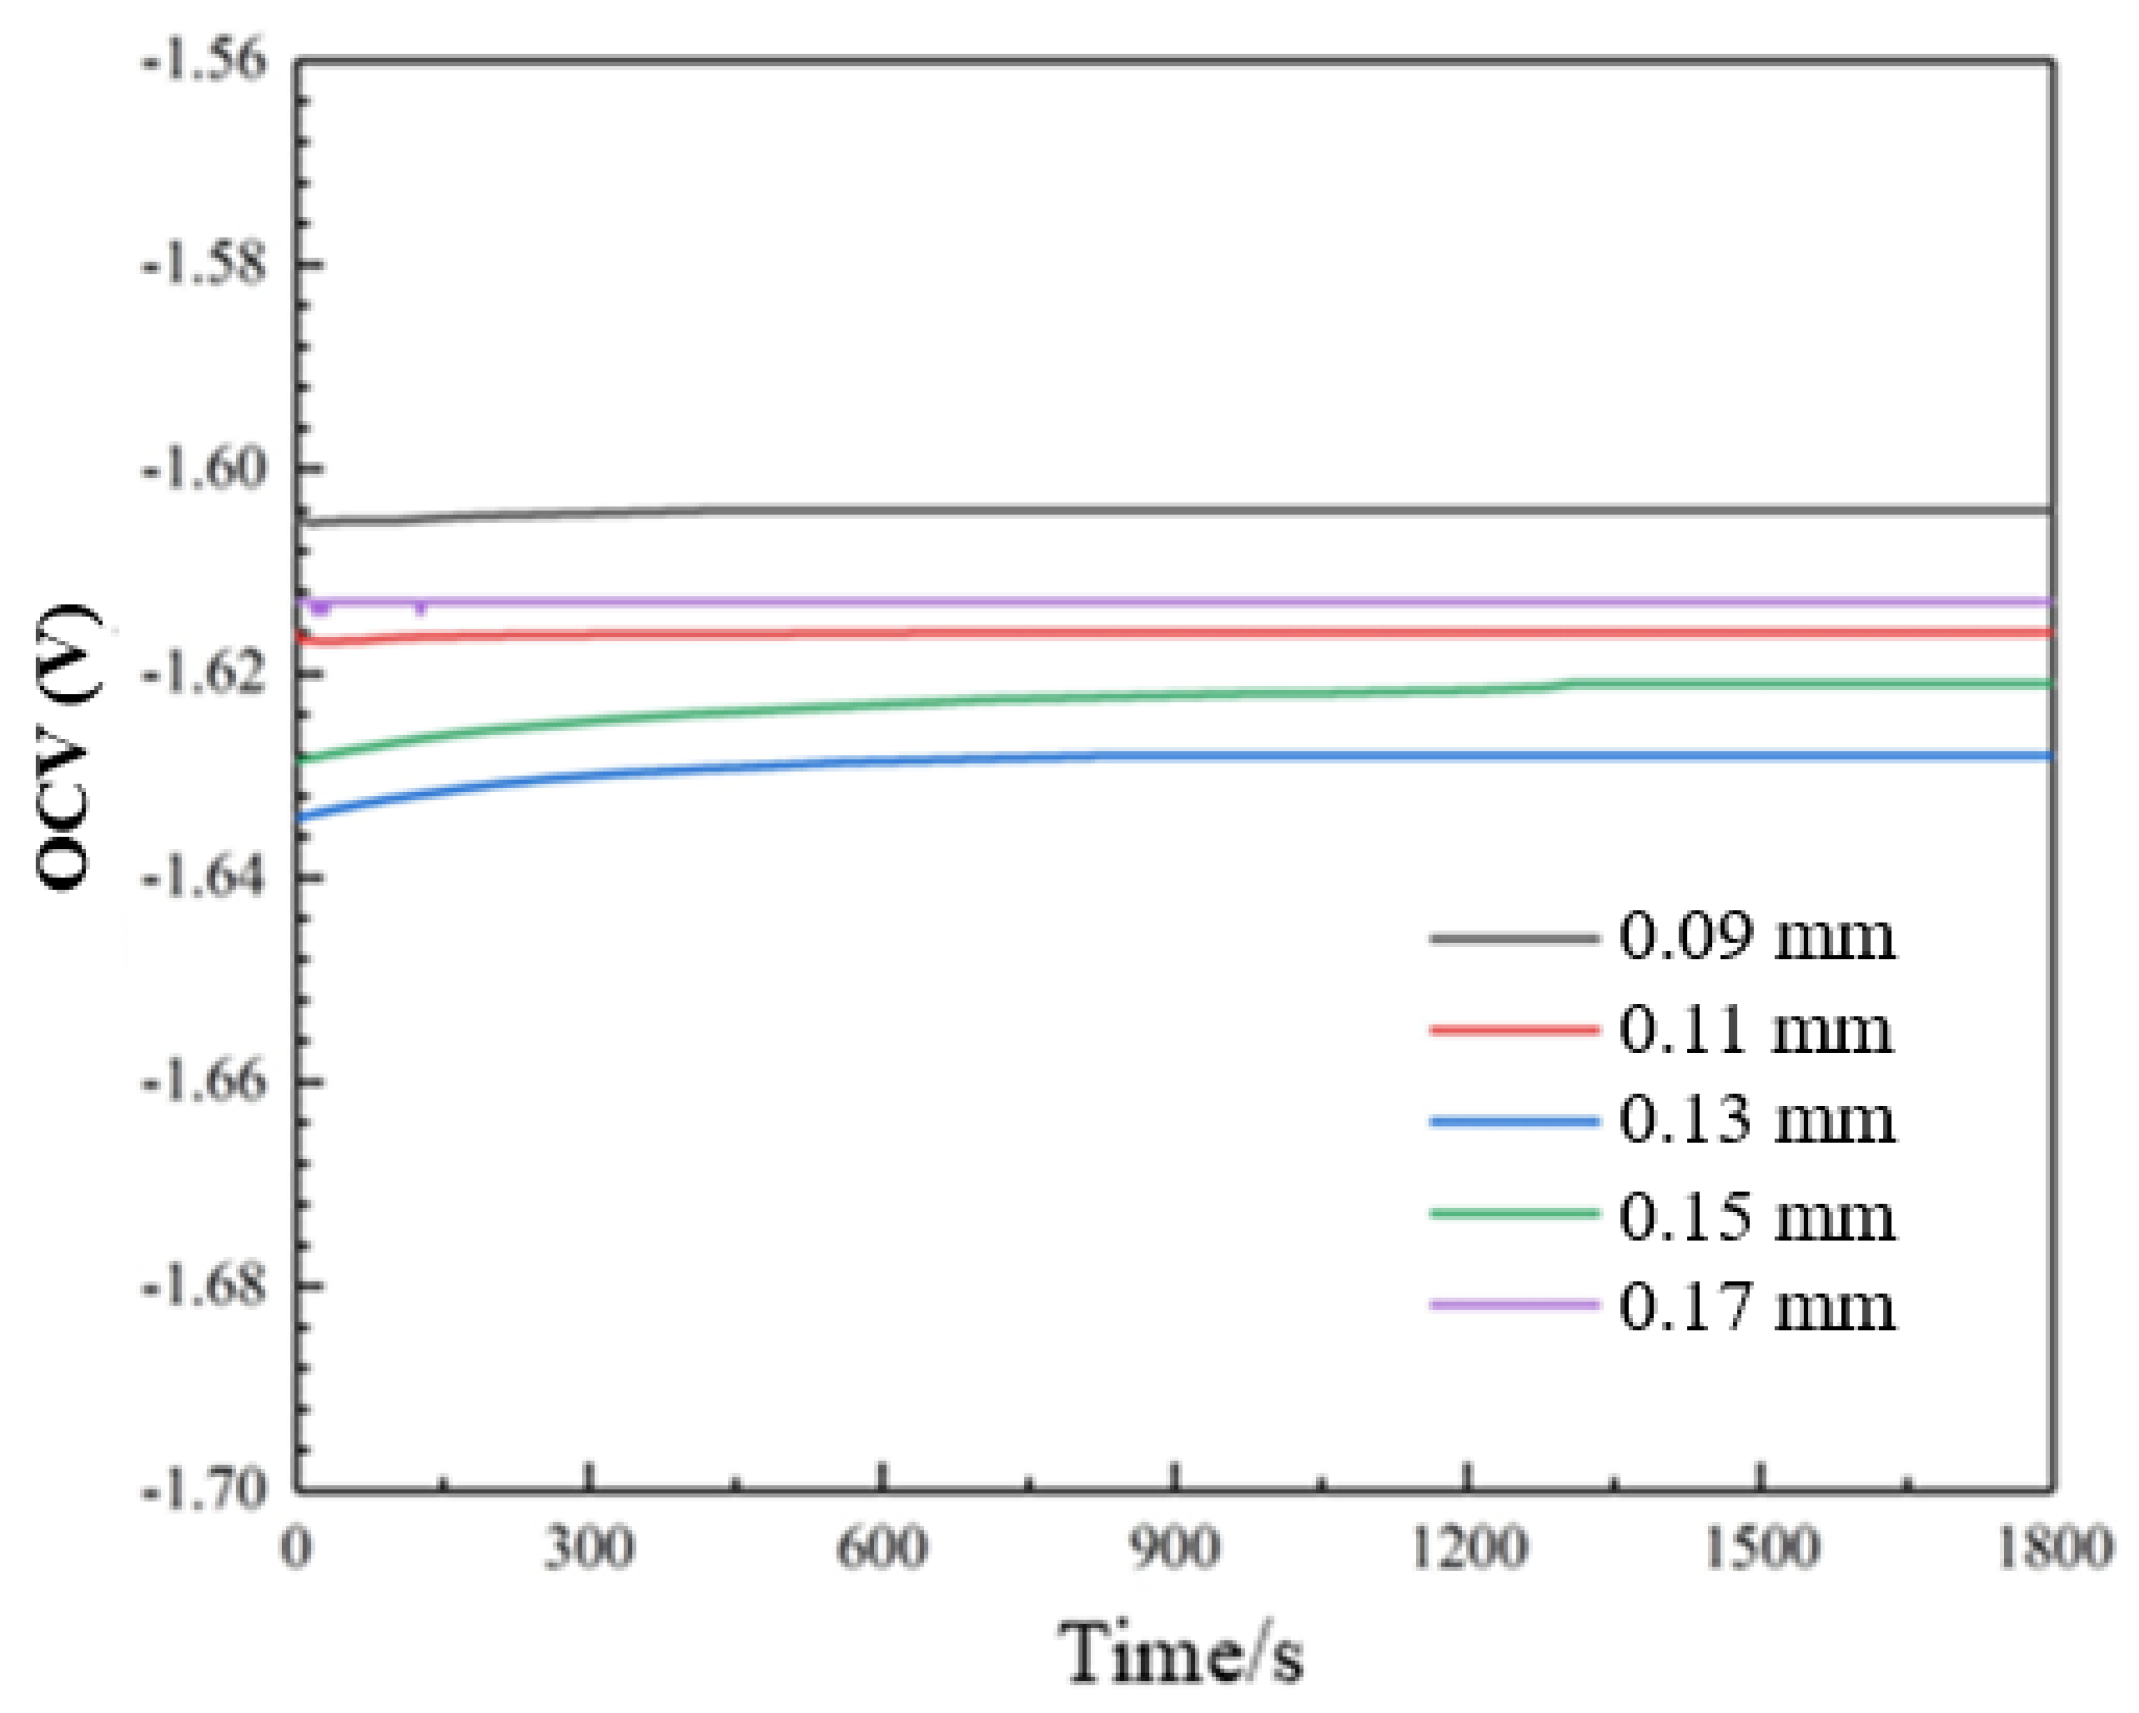
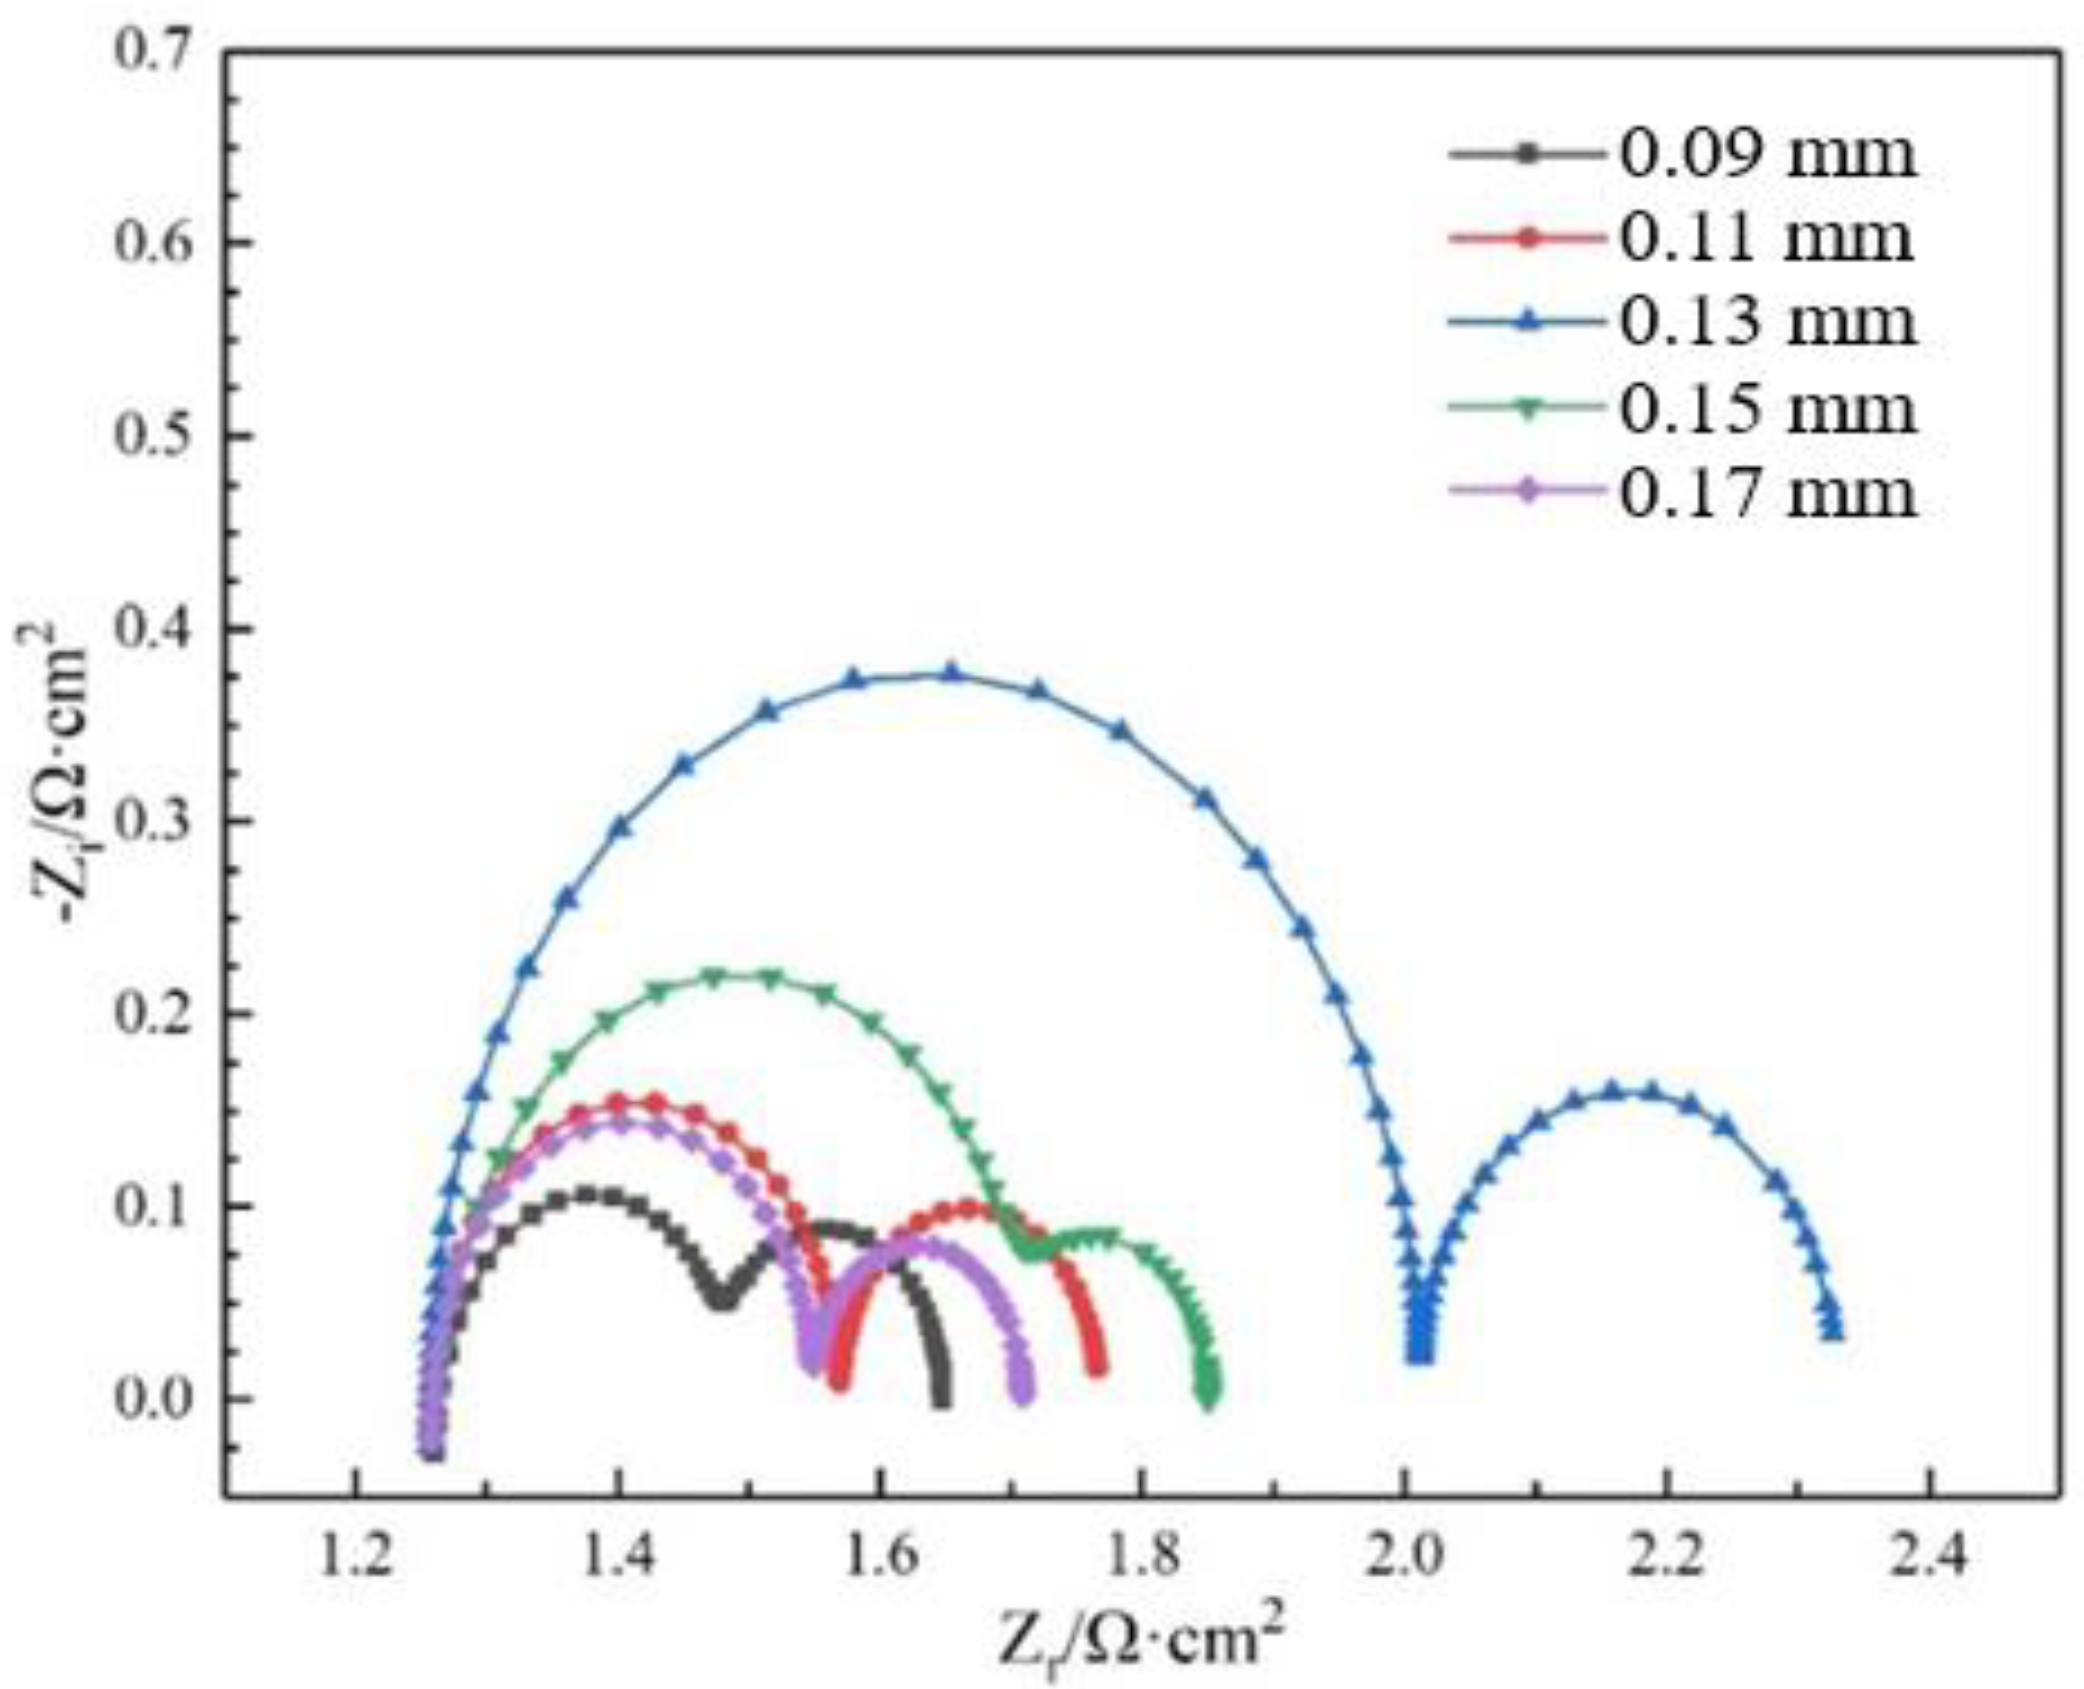
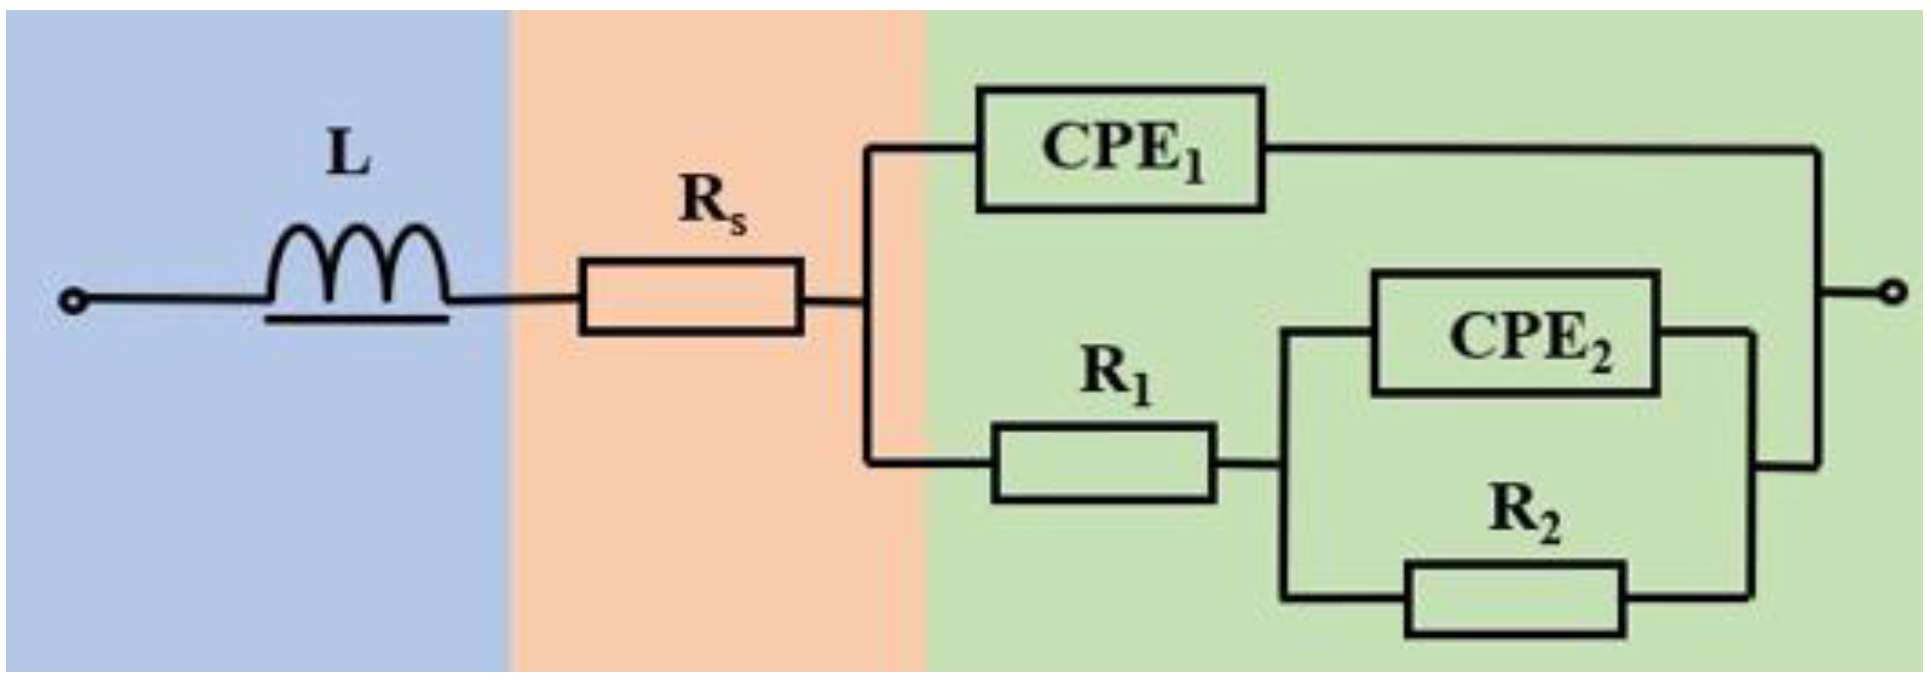
3.3. Electrochemical Behavior

The trend of OCV (open-circuit voltage) in the sample over time and at a different hatch spacing is shown in Figure 4. It can be seen that although the surface of the anode has been polished and cleaned before the experiment, the material’s surface still has a certain roughness, resulting in a small fluctuation in the OCV. For hatch spacing, when it is 0.13 mm, the overlap between the melt channels is relatively reasonable, the material has a high density and forming quality, and the microstructure is uniformly refined, thus possessing the most negative open-circuit potential. When it is 0.09 mm, the forming quality of the sample is poor and the OCV is positive. As an anode material for the Al-air battery, it is prone to polarization during discharge, which seriously affects the overall discharge performance of the battery.
The polarization curves and electrochemical fitting parameters in the samples of different hatch spacing are shown in Figure 5 and Table 2, where the symbols E, Icorr, and Rp represent corrosion potential, corrosion current density, and polarization resistance, respectively. It can be seen that the corrosion potential in the samples changes significantly with increased hatch spacing. When the hatch spacing is 0.09 mm, 0.11 mm, 0.13 mm, 0.15 mm, and 0.17 mm, the corrosion potentials are −1.613 V, −1.624 V, −1.634 V, −1.628 V, and −1.620 V, respectively. It can be seen that when the hatch spacing is 0.09 mm, the corrosion potential is the most positive, indicating that the polarization degree of the sample is relatively high, which affects the electrochemical dissolution of the anode, thereby affecting its discharge reaction process. However, when the hatch spacing is 0.13 mm, the corrosion potential is the most negative, indicating that the electrochemical activity is high.
In addition, from the perspective of corrosion current density, the corrosion current density of anodes is 2.422 × 10⁻² A/cm2, 2.199 × 10⁻² A/cm2, 2.012 × 10⁻² A/cm2, 2.245 × 10⁻² A/cm2, and 2.326 × 10⁻² A/cm2, respectively, at the hatch spacing of 0.09 mm, 0.11 mm, 0.13 mm, 0.15 mm and 0.17 mm, showing an overall trend that decreases first and then increases. The corrosion current density can represent the corrosion rate, while in the electrochemical test the anode did not undergo any discharge reaction, so the corrosion rate is the SCR of the anode. The trend of the change in corrosion current density in this part is consistent with the conclusion in the self-corrosion experiment. When the hatch spacing is 0.13 mm, the sample has both the most negative corrosion potential and the minimum corrosion current density, indicating that the sample has high electrochemical activity and a low SCR, which has the possibility of improving the anode discharge performance of the Al-air battery.
Summarizing the influence of hatch spacing on the electrochemical activity and corrosion current density of the samples, it can be concluded that when the hatch spacing is small, the two adjacent laser scanning trajectories are too close to each other, resulting in too many overlapping areas in the melt channel, and the height of some melt channels increases accordingly. In the next powder laying, there may be uneven powder lying between layers, which accumulates, layer by layer, and affects the forming quality. In addition, excessive overlap in the melt channel can lead to remelting in some areas, resulting in element burnout. Rare-earth elements are difficult to form sufficient heterogeneous nucleation agents, and cannot fully refine the grain size. When the hatch spacing is large, adjacent melt paths cannot be effectively overlapped, powder melting is insufficient, and rare-earth elements cannot fully play the role of purifying the melt pool and refining the grains. At the micro level, the microstructure of the sample is unevenly distributed, with coarse grains. At the macro level, it has poor formation density and many pore defects. The refinement of the grain size of composite materials enables them to have more grain boundaries, which can provide more reaction channels during electrochemical reactions and discharge processes, and are beneficial for improving the discharge voltage. In addition, the surface quality of anodes also has an impact on their discharge performance. Corrosion often occurs first at the pore defects. When there are many pore defects in the shape of the component, the solution can easily penetrate the cracks or pores, increasing the effective area of the self-corrosion reaction, leading to an increase in corrosion current density and a decrease in anode utilization rate.
Figure 6 shows the EIS of the samples with different hatch spacing, and the equivalent circuit diagram is shown in Figure 7. The fitting parameters are shown in Table 3. It can be seen from Figure 6, EIS consists of two capacitive arcs in the high-frequency and low-frequency regions. The capacitive arc in the high-frequency region is related to the dissolution reaction of aluminum, and the larger the diameter of the capacitive arc in this region, the lower the corrosion rate of the alloy. The capacitance arc in the low-frequency region is related to the growth reaction of passivation film on the alloy surface. In Figure 7, L is the inductance, Rs represents the solution resistance, R1 and CPE1 represent the transfer charge resistance and double-layer capacitance on the alloy surface, and R2 and CPE2 represent the transfer charge resistance and double-layer capacitance in the passivation film on the alloy surface. When the hatch spacing is 0.09, 0.11, 0.13, 0.15, and 0.17 mm, the polarization resistance R1 is 2.309 × 10⁻¹, 3.132 × 10⁻¹, 7.555 × 10⁻¹, 4.581 × 10⁻¹, and 2.935 × 10⁻¹ Ω·cm2, respectively. Obviously, when the hatch spacing is 0.09 mm, it has the smallest R1, indicating the worst corrosion resistance. The value of the inductance resistance L caused by the hydrogen evolution reaction is 1.012 × 10⁻⁶ Ω·cm2, which is the maximum value among all inductive resistances, indicating that the hydrogen evolution corrosion phenomenon of the sample is more severe at this hatch spacing, which is consistent with the experimental results of the hydrogen evolution reaction rate in self-corrosion testing. When it is 0.13 mm, the polarization resistance is the highest and the inductance resistance is the lowest, indicating that it has the lowest hydrogen evolution. The appropriate hatch spacing ensures a suitable overlap rate between adjacent melt channels, which can promote the reaction between CeO2 and the matrix to form more heterogeneous nucleation agents, resulting in better forming density, surface quality and electrochemical performance of the sample.

3.4. Discharge Property

At different hatch spacings, there are significant differences in the discharge performance, as shown in Figure 8. When it is 0.09, 0.11, 0.13, 0.15, and 0.17 mm, the discharge voltages are 1.434 V, 1.500 V, 1.570 V, 1.549 V, and 1.459 V, respectively. It can be seen that the overall discharge voltage shows a trend that increases first and then decreases, with the anode alloy discharge voltage range reaching 136 mV at different hatch spacings. In addition, it can be observed that the trend in anode utilization is also the same as that of discharge voltage. When it is 0.13 mm, the anode utilization rate is the highest, reaching 71.2%. Therefore, it is possible to reduce defects in the formed parts and improve the discharge performance of the anode by adjusting the hatch spacing reasonably.
From the discharge morphology, as shown in Figure 9, it can be seen that when the hatch spacing is 0.09 mm, the corrosion morphology is rough, with large corrosion pits, and the length and width of the corrosion pits are about 40 μm and 23 μm. Deeper corrosion pits will cause corrosion to develop longitudinally, increasing the self-corrosion reaction area and rate of the anode, and reducing the anode utilization rate.
In addition, uneven corrosion affects the long-term discharge capacity of the anode, and as the discharge time increases, the discharge voltage will fluctuate sharply, affecting the service life of the Al-air battery. When it is 0.13 mm, there are no obvious corrosion pits or crevices on the surface, and the surface is relatively flat, indicating that its dissolution is more uniform during the discharge process, thus having a high discharge voltage and anode utilization rate. However, as it further increases, the forming quality and corrosion resistance of the sample decrease, and there are also many corrosion crevices and pits on the corroded surface, which are also the reason for the decrease in the discharge voltage and anode utilization rate.

4. Conclusions

This article mainly investigates the influence of hatch spacing on the forming quality, corrosion resistance, and discharge performance of a 1.0 wt.% CeO2/Al6061 composite. The main conclusions are as follows:
(1) When the hatch spacing varies within the range of 0.09~0.17 mm, the density, corrosion resistance, and discharge performance of the anode show a trend that first increases and then decreases with an increase in hatch spacing.
(2) When the hatch spacing is 0.13mm, the anode has the best forming quality. At this point, the density can reach 98.39%, and the SCR decreases to 2.596 × 10⁻⁴ g·cm−2·min−1. Meanwhile, the anode exhibits the highest electrochemical activity and discharge voltage, reaching −1.570 V.
(3) The hydrogen evolution corrosion accompanying the discharge process often occurs at the pore defects first, so the forming quality is directly related to the uniform dissolution of the anode. In samples with fewer forming defects, there are fewer active sites for a self-corrosion reaction, and the phenomenon of hydrogen evolution is weakened. When there are many defects, the electrolyte can easily penetrate cracks or pores, increasing the area where corrosion reactions occur, and leading to an increase in corrosion current density and corrosion rate.

Author Contributions

Conceptualization, W.D.; methodology, Y.L. and W.D.; software, Y.L.; validation, Y.L. and W.D.; formal analysis, Y.L.; investigation, W.D.; resources, Y.L. and W.D.; data curation, W.D.; writing-original draft preparation, Y.L.; writing-review and editing, W.D.; visualization, Y.L.; supervision, W.D.; project administration, Y.L. and W.D. All authors have read and agreed to the published version of the manuscript.

Funding

This research received no external funding.

Data Availability Statement

Data are contained within the article.

Acknowledgments

This study was supported by the National Center of Supervision and Inspection on Additive Manufacturing Products Quality.

Conflicts of Interest

The authors declare no conflicts of interest.

References

  1. Liu, C.; Lai, G.; Gu, J.; Liu, Z.; Wang, J. High specific capacity microfluidic Al-air battery with the double-side reactive anode. J. Power Sources 2024, 611, 234764. [Google Scholar] [CrossRef]
  2. Wu, G.X.; Wei, Z.S.; Li, S.Q.; Cui, L.Y.; Zhang, G.X.; Zeng, R.C. Corrosion inhibition of polyelectrolytes to the Al anode in Al-air battery: A comparative study of functional group effect. J. Power Sources 2024, 592, 233907. [Google Scholar] [CrossRef]
  3. Wan, H.; Wang, W.; Bu, L.X. Investigations on Mn shielding the negative effect of Fe in the aluminum alloy anodes used for Al-air batteries. J. Solid State Electrochem. 2024, 28, 2547–2560. [Google Scholar] [CrossRef]
  4. Kahveci, O.; Kaya, M.F.; Erol, H. Investigation of the AlB2 intermetallic phases effect on A-Zn-B alloys’ electrochemical performance in Al-air battery anodes. Appl. Phys. A 2023, 129, 234. [Google Scholar] [CrossRef]
  5. Wei, M.; Wang, K.; Pei, P.; Zhong, L.; Zuttel, A.; Pham, T.H. Zinc carboxylate optimization strategy for extending Al-air battery system’s lifetime. Appl. Energy 2023, 15, 350. [Google Scholar] [CrossRef]
  6. Huang, Y.; Shi, W.; Guo, L.; Zhang, Q.; Wang, K.; Zheng, X. Corrosion inhibition of L-tryptophan on Al-5052 anode for Al-air battery with alkaline electrolyte. J. Power Sources 2023, 564, 232866. [Google Scholar] [CrossRef]
  7. Zhao, R.; He, P.; Yu, F.; Yang, J.; Sun, Z.; Hu, W. Performance improvement for aluminum-air battery by using alloying anodes prepared from commercially pure aluminum. J. Energy Storage 2023, 73, 108985. [Google Scholar] [CrossRef]
  8. Gürkan, K.; Fatih, Y.; İlyas, H. Characterization of the structural and tribological properties of medical Ti6Al4V alloy produced in different production parameters using selective laser melting. 3D Print. Addit. Manuf. 2019, 6, 253–261. [Google Scholar]
  9. Zhang, X.Z.; Chen, L.; Zhou, J.; Ren, N.F. Simulation and experimental studies on process parameters, microstructure and mechanical properties of selective laser melting of stainless steel 316L. J. Braz. Soc. Mech. Sci. Eng. 2020, 42, 402. [Google Scholar] [CrossRef]
  10. Zhang, T.; Zhang, K.; Pang, C.Y. Study on the effects of the processing parameters on the single tracks and the block support structures fabricated by selective laser melting. J. Laser Appl. 2024, 36, 012024. [Google Scholar] [CrossRef]
  11. Nandhakumar, R.; Venkatesan, K. A process parameters review on selective laser melting-based additive manufacturing of single and multi-material: Microstructure, physical properties, tribological, and surface roughness. Mater. Today Commun. 2023, 35, 105538. [Google Scholar] [CrossRef]
  12. Qin, S.; Zhan, J.; Lu, Y.; Lin, J. Effect of energy input on the density and shape memory effect of NiTi alloy by selective laser melting in different hatch spacing. Mater. Technol. 2021, 37, 1263–1275. [Google Scholar] [CrossRef]
  13. Kaya, G.; Erguder, T.O.; Hacisalihoglu, E.Y. Wear and thermal behavior of TiAlN thin films onto Ti6Al4V alloy manufactured by selective laser melting method. 3D Print. Addit. Manuf. 2023, 10, 650–660. [Google Scholar] [CrossRef] [PubMed]
  14. Lo, Y.L.; Liu, B.Y.; Tran, H.C. Optimized hatch space selection in double-scanning track selective laser melting process. Int. J. Adv. Manuf. Technol. 2019, 105, 2989–3006. [Google Scholar] [CrossRef]
  15. Li, Z.; Takano, N.; Mizutani, M. Material properties of selective laser melting additive-manufactured Ti6Al4V alloys with different porosities. Precis. Eng. 2023, 83, 142–151. [Google Scholar] [CrossRef]
  16. Enneti, R.K.; Morgan, R.; Atre, S.V. Effect of process parameters on the selective laser melting (SLM) of tungsten. Int. J. Refract. Met. Hard Mater. 2018, 71, 315–319. [Google Scholar] [CrossRef]
  17. Greco, S.; Gutzeit, K.; Hotz, H. Selective laser melting (SLM) of AISI 316L-impact of laser power, layer thickness, and hatch spacing on roughness, density, and microhardness at constant input energy density. Int. J. Adv. Manuf. Technol. 2020, 108, 1551–1562. [Google Scholar] [CrossRef]
  18. Hacisalihoglu, I.; Yiliz, F.; Celik, A. The effects of build orientation and hatch spacing on mechanical properties of medical Ti-6Al-4V alloy manufactured by selective laser melting. Mater. Sci. Eng. A 2021, 802, 140649. [Google Scholar] [CrossRef]
  19. Mao, Y.; Gao, Y.; Hu, J.; Shen, X.; Zhou, H. Effect of hatch spacing on the quality of Inconel 718 alloy part. Materials 2024, 17, 452. [Google Scholar] [CrossRef]
  20. Dong, Z.; Liu, Y.; Wen, W.; Ge, J.; Liang, J. Effect of hatch spacing on melt pool and as-built quality during selective laser melting of stainless Steel: Modeling and experimental approaches. Materials 2019, 12, 50. [Google Scholar] [CrossRef]
  21. Feng, B.; Wan, C.; Zhang, Q.Q.; Ren, Y.; Cui, L.S.; Yang, Q.; Hao, S.J. Effect of laser hatch spacing on the pore defects, phase transformation and properties of selective. Mater. Sci. Eng. A 2022, 840, 142965. [Google Scholar] [CrossRef]
  22. Hu, Z.; Nie, X.; Qi, Y.; Zhang, H.; Zhu, H. Cracking criterion for high strength Al-Cu alloys fabricated by selective laser melting. Addit. Manuf. 2021, 37, 101709. [Google Scholar] [CrossRef]
  23. Pan, W.; Ye, Z.; Zhang, Y.; Liu, Y.; Liang, B.; Zhai, Z. Research on microstructure and properties of AlSi10Mg fabricated by selective laser melting. Materials 2022, 15, 2528. [Google Scholar] [CrossRef]
  24. Pekok, M.A.; Setchi, R.; Ryan, M.; Han, Q.Q.; Gu, D.D. Effect of process parameters on the microstructure and mechanical properties of AA2024 fabricated using selective laser melting. Int. J. Adv. Manuf. Technol. 2021, 112, 175–192. [Google Scholar] [CrossRef]
  25. Hu, Z.; Qi, Y.; Nagarajan, B.; Nie, X.; Zeng, X. Top surface roughness evolution during selective laser melting of AlCu5MnCdVA aluminum alloy. J. Manuf. Process. 2021, 64, 1180–1195. [Google Scholar] [CrossRef]
  26. Bi, J.; Chen, Y.B.; Chen, X.; Starostenkov, M.D.; Dong, G.J. Densification, microstructural features and tensile properties of selective laser melted AlMgSiScZr alloy from single track to block specimen. J. Cent. South Univ. 2021, 28, 1129–1143. [Google Scholar] [CrossRef]
  27. Katsoufis, P.; Mylona, V.; Politis, C.; Avgouropoulos, G.; Lianos, P. Study of some basic operation conditions of an Al-air battery using technical grade commercial aluminum. J. Power Sources 2020, 450, 227624. [Google Scholar] [CrossRef]
  28. Wang, T.; Zhu, Y.; Li, Y.F.; Yang, K.; Lu, W.Y.; Peng, K.; Tian, Z.L. Investigation of commercial aluminum alloys as anode materials for alkaline aluminum-air batteries. Sustain. Energy Fuels 2022, 7, 300–309. [Google Scholar] [CrossRef]
  29. Pancrecious, J.K.; Deepa, J.P.; Jayan, V. Nanoceria induced grain refinement in electroless Ni-B-CeO2 composite coating for enhanced wear and corrosion resistance of Aluminium alloy. Surf. Coat. Technol. 2018, 356, 29–37. [Google Scholar] [CrossRef]
  30. Du, J.; Wang, Z.; Wei, Z.; Yao, J.; Song, H. An environmental friendly self-healing coating with Silane/Ce-ZSM-5 zeolite structure for corrosion protection of aluminum alloy. Surf. Coat. Technol. 2022, 436, 128290. [Google Scholar] [CrossRef]
Figure 1. Morphology diagram of powder: (a) Al6061 (×500); and (b) CeO2/Al6061 (×3.0 k).
Crystals 14 00797 g001
Figure 2. Surface morphology and density in samples of different hatch spacing.
Crystals 14 00797 g002
Figure 3. Self-corrosion in samples of different hatch spacing.
Crystals 14 00797 g003
Figure 4. OCV of samples at different hatch spacing.
Crystals 14 00797 g004
Figure 5. Polarization curves in samples of different hatch spacing.
Crystals 14 00797 g005
Figure 6. EIS of samples under different hatch spacing.
Crystals 14 00797 g006
Figure 7. Equivalent circuit of aluminum anode with different hatch spacing.
Crystals 14 00797 g007
Figure 8. Discharge parameters of samples of different hatch spacing: (a) real-time discharge voltage; (b) discharge voltage and anode utilization rate.
Crystals 14 00797 g008
Figure 9. Surface morphology after discharge of anode of different hatch spacing.
Crystals 14 00797 g009
Table 1. The laser process parameters used in this work.
ParameterLaser PowerScanning SpeedHatch
Spacing
Layer ThicknessScanning Strategy
Value300 W1000 mm/s0.09, 0.11, 0.13,
0.15, 0.17 mm
30 μmIsland
Table 2. Electrochemical parameters in samples of different hatch spacing.
Hatch SpacingElectrochemical Parameters
E (v)Icorr (A/cm2)Rp (Ω∙cm2)
0.09 mm−1.6132.422 × 10−21.8
0.11 mm−1.6242.199 × 10−22.0
0.13 mm−1.6342.012 × 10−22.2
0.15 mm−1.6282.245 × 10−22.0
0.17 mm−1.6202.326 × 10−21.9
Table 3. EIS fitting parameters of samples at different hatch spacings.
Hatch Spacing0.09 mm0.11 mm0.13 mm0.15 mm0.17 mm
L/Ω·cm21.012 × 10−69.472 × 10−74.721 × 10−79.525 × 10−79.550 × 10−7
Rs/Ω·cm21.2251.3571.5081.2541.349
CPE1/F·cm−24.394 × 10−31.445 × 10−31.134 × 10−32.453 × 10−41.169 × 10⁻³
R1/Ω·cm22.309 × 10−13.132 × 10−17.555 × 10−14.581 × 10−12.935 × 10−1
CPE2/F·cm−23.271 × 10−26.7035.4173.140 × 10−21.262
R2/Ω·cm21.140 × 10−11.980 × 10−13.182 × 10−11.377 × 10−11.586 × 10−1
22.742 × 10−49.622 × 10−44.863 × 10−44.872 × 10−46.972 × 10⁻⁴
Disclaimer/Publisher’s Note: The statements, opinions and data contained in all publications are solely those of the individual author(s) and contributor(s) and not of MDPI and/or the editor(s). MDPI and/or the editor(s) disclaim responsibility for any injury to people or property resulting from any ideas, methods, instructions or products referred to in the content.

