Abstract
In order to study the mechanism of microcrack generation in the process of pulsed laser polishing of zirconia ceramics and the influence of laser polishing process parameters on the surface temperature and surface stress, this paper establishes a finite element computational model of pulsed laser polishing of zirconia ceramics based on the COMSOL Multiphysics multi-physics field simulation software. Firstly, in the process of establishing the finite element model, the temperature field and stress field coupling is used to analyze the temperature field and stress field changes during the laser polishing process, which reveals the microcrack generation mechanism and size characteristics of zirconia ceramics in the process of pulsed laser polishing. Secondly, through parameterized scanning, the variation rules of surface temperature and surface stress were studied under different process parameters of laser power, scanning speed, pulse frequency and pulse width. Finally, the validity of the finite element calculation model is verified by the pulsed laser polishing zirconia ceramics experiment. The results show that, in a certain energy range, the high-energy laser beam can effectively reduce the surface roughness of the material, and with the increase in the time of laser action on the surface layer of the material, it will cause the temperature and thermal stress of the surface layer of the material to continue to accumulate, and when the stress value exceeds the yield limit of the material, cracks will form in the surface layer of the material; because the laser power, scanning speed, pulse frequency and pulse width are used to affect the laser energy density, and then, the pulse width will be affected by the process parameters of the laser energy density, and thus the surface temperature and thermal stress of the surface layer of the material. Because the laser power, scanning speed, pulse frequency and pulse width all affect the thermal stress on the material surface by influencing the laser energy density acting on the material surface, the laser energy density is the main influencing factor of the dimensional characteristics of the microcracks. In addition, the microcrack width and depth will increase when the laser energy density acting on the material surface layer increases.
1. Introduction
Zirconia ceramics are widely used in fields such as medicine and modern industry due to their good biocompatibility and mechanical properties [1,2,3]. The surface properties of zirconia materials are strictly required due to their practical applications. Therefore, the selection of suitable surface processing methods to reduce the surface roughness and improve the surface quality of zirconia ceramics is of great importance in modern industrial production [4,5,6]. So far, the commonly used polishing methods include the mechanical polishing method, chemical polishing method, chemical mechanical polishing method and ion beam polishing method [7]. Among them, Guo Meijian et al. [8] attempted to improve the material removal rate of zirconia ceramics by adopting the magnetorheological polishing method with a large polishing die; although the nanometer-scale surface roughness was obtained in this study, this polishing method is quite complicated. Dai et al. [9] found that, through the chemical–mechanical polishing of zirconia ceramic wafers, although it can be effective to improve the material removal rate and reduce the surface roughness in an acid environment, the acid environment will make the ceramic wafers more difficult to polish. However, the acidic environment will make the ceramic wafer produce corrosion pits, thus affecting the surface quality after polishing. In addition, with the development of laser technology, laser polishing, as a non-contact polishing process, can achieve the effect of reducing surface roughness in a short time and has received the attention of many researchers [10,11]. Among them, Yamamuro et al. [12] investigated the feasibility of V-groove microstructure fabrication using femtosecond pulsed laser irradiation of yttria-stabilized zirconia (YSZ). The results of studies show that precise and complex microstructures can be generated on the surface of YSZ with high functionality and low subsurface damage, which has great potential for a wide range of applications in industry. BAbdo et al. [13] investigated the effect of each laser parameter on the surface morphology of zirconia ceramics by using a Nd:YAG laser and found, through experiments, that Nd:YAG laser can effectively reduce the surface roughness. G Ergun Kunt et al. [14] analyzed the surface roughness of yttria-stabilized tetragonal polycrystalline zirconia (Y-TZP) ceramics after treatment with different lasers (carbon dioxide lasers and ER:YAG lasers) concluded that the range of variation in surface roughness depends on the energy density of the laser radiation and found that the effect of CO2 pulsed lasers on the surface roughness of zirconia is more significant. However, the CO2 pulsed laser polishing process is a material in a short period of time that will undergo a surface melting and re-solidification process, due to the process of the material surface layer temperature changing dramatically, and accompanied by the internal material phase transition, the material and the surface layer of the residual stress will be generated, which will lead to polished surface layer microcracks, which seriously reduces the use of the polished parts of the performance. As a result, this paper, based on COMSOL Multiphysics multi-physics field simulation software, established a pulse laser polishing zirconia ceramics finite element calculation model and analyzed the zirconia ceramics pulse laser polishing process of the temperature field, stress field and zirconia ceramic microcracks generation mechanism, studied in different process parameters, the material surface temperature and the surface stress of the change rule.
2. Experimental Conditions and Methods
2.1. Experimental Materials
The samples used in the laser polishing experiment are high-temperature sintered yttrium stable zirconia ceramics provided by Shenzhen Haide Precision Ceramics Co., Ltd. (Shenzhen, China), which basic chemical components are shown in Table 1. Zirconia ceramics processed into the size of a 102 mm × 102 mm × 4 mm sample plate, the zirconia ceramic plate into a solution of industrial alcohol into the ultrasonic cleaning device for 15 min after the experimental samples are taken out, with a dust-free cloth wiped clean and stored in a sealed bag of specimens to be used.

Table 1.
Main components of yttria-stabilized zirconia ceramic plates (wt%).
2.2. Experimental Equipment
In this paper, the laser polishing test platform based on a CO2 pulsed laser is shown in Figure 1. The laser used in the laser polishing test is a CO2 pulsed laser (FSTi100SWC, SYNRAD) produced by Jason Hongda Technology, Ltd. (Jiasheng Hongda Technology Co., Shenzhen, China), and the energy distribution of the laser is a flat-top distribution. The laser pulse frequency is 0~100 kHz, and the focal length of the internal dynamic focusing galvanometer (RF8330-3D-1200, Zhenjiang, China) is 550 mm, which receives a laser beam of 10,600 nm wavelength and has a maximum scanning speed of 4000 mm/s. The diameter of the laser spot at the focal position is 0.314 mm, and the maximum scanning range is 400 mm × 400 mm. In the polishing experiments in this paper, the influence of the laser defocusing amount on the polishing results was not considered, because the samples were placed on a three-dimensional moving platform to ensure that the distance between the sample surface and the bottom of the galvanometer was constant at 550 mm. Because laser polishing involves a complex physical process, it is difficult to detect its polishing process in real time. Therefore, in this paper, the polishing trajectory of single-pass laser polishing is obtained by laser confocal microscopy and compared with the numerical simulation results to verify the accuracy of the model. In addition, in this paper, we measure the single-pass laser profile width by using a laser confocal microscope, MarSurf CM mobile (Mahr Length Gauge, Goettingen, Germany), obtain the material surface profile data by using a white light interferometer to obtain the material surface profile surface and characterize the micromorphology of the surface of the material by using a GeminiSEM 300 (ZEISS, Oberkochen, Germany) field emission scanning electron microscope.
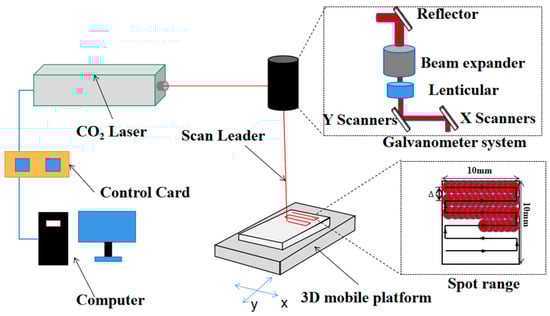
Figure 1.
Schematic diagram of the laser polishing equipment.
2.3. Experimental Principles and Methods
The polishing principle of laser polishing is shown in Figure 2a. When the high-energy laser beam acts on the surface of the material, the material surface will be heated and melted, and the molten liquid material will flow under its own gravity and surface tension, flowing from the “peak” into the “peak valley”, and finally achieve the effect of reducing the surface roughness. For the laser polishing experiment, the zirconia ceramic plate is placed on a three-dimensional carrier platform, and the distance between the material surface and the laser and the scanning range of the laser are adjusted, so that the zirconia ceramic plate is subjected to a regionalized laser polishing process. The polishing path is shown in Figure 1, and the laser scans along the “bow” path. The size of each polishing area is 10 mm × 10 mm, and the surface morphology of the zirconia samples before and after polishing is observed by portable roughness measuring instrument, confocal microscope and optical microscope, and the surface roughness Ra before and after polishing is measured.
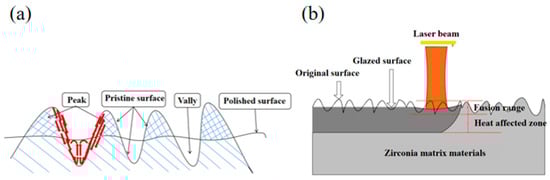
Figure 2.
Schematic diagram of the laser polishing mechanism: (a) laser polishing “melting peaks and filling valleys”; (b) laser polishing mechanism.
In the laser polishing process, the energy density of the pulsed laser beam influences the depth of the material melt pool and the smoothing effect of the melt pool, and the spot overlap rate influences the size of the melt pool and the effect of the superposition of internal stresses. The energy density of the pulsed laser is determined by the laser power, the spot radius at the focal point of the laser beam and the laser frequency [15]:
where E is the laser energy density of the pulsed laser beam; P is the laser power (W); f represents the laser pulse frequency (kHz); r is the spot radius of the laser beam (mm).
According to the laser scanning path, the spot overlap rate can be categorized into the transverse spot overlap rate and longitudinal spot overlap rate, and generally, the transverse spot overlap rate is greatly affected by the pulse frequency and scanning speed, while the longitudinal spot overlap rate is mainly affected by the scanning spacing [16]. The specific formula is
where is the transverse overlap rate; is the longitudinal overlap rate; d is the spot diameter; is the scanning pitch (mm); is the scanning speed (mm/s).
2.4. Experimental Results and Analysis
Zirconia ceramics were surface-treated using the combination of laser process parameters shown in Table 2, and the resulting surface morphology is shown in Figure 3, as shown in Figure 3a, where the data of the surface profile curves were obtained by measuring the surface profile of the material using a white light interferometer. From the surface profile in Figure 3a, it can be seen that the laser polishing process can achieve the effect of reducing the surface roughness of the samples when the laser power is 50 W and 75 W. However, compared with the laser power of 50 W, the laser power of 75 W can reduce the surface roughness of the samples. However, compared with the case of a laser power of 50 W, the polishing effect is better when the laser power is 75 W. Therefore, it can be inferred that the CO2 pulsed laser can effectively reduce the surface roughness value, and appropriately increasing the laser power will further improve the laser polishing effect. However, by observing the SEM surface topography, it was found that microscopic cracks appeared on the polished surface of the material after polishing with a laser power of 75 W. Therefore, the generation mechanism of microcracks in pulsed laser polished zirconia ceramic materials needs to be further analyzed.
Table 2.
Process parameters of the laser polished zirconia ceramics.
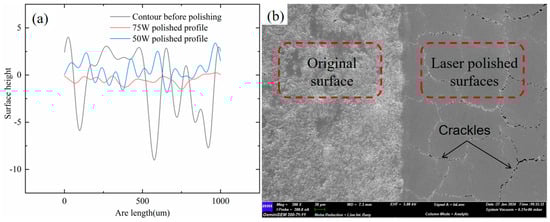
Figure 3.
Surface topography of zirconia ceramics: (a) surface profile graph; (b) SEM surface topography before and after polishing with a laser power of 75 W.
The zirconia ceramic material was polished using a CO2 pulsed laser, and the surface morphology and cross-section morphology after polishing are shown in Figure 4. Figure 4a,b show the SEM images of the polished surface and cross-section at a laser power of 50 W, a laser scanning speed of 320 mm/s, a laser pulse frequency of 3 kHz and a scanning spacing of 0.08 mm, respectively. From the figure, it can be seen that the surface layer of the material will produce vertical and transverse cracks after the laser action, and the cracks are concentrated in the area after the pulsed laser polishing, which is basically an irregular distribution. Figure 4c,d show the SEM images of the polished surface and cross-section when the laser power is 75 W, the laser scanning speed is 320 mm/s, the laser pulse frequency is 3 kHz and the scanning spacing is 0.08 μm, respectively. By comparing the zirconia ceramic surface and cross-section after polishing with different laser powers, it can be clearly seen that the transverse crack width after polishing with a laser power of 75 W is slightly wider than that after polishing with a laser power of 50 W, and this phenomenon also occurs in the cross-sectional crack, and the cross-sectional crack depth after polishing with a laser power of 75 W is slightly deeper than that after polishing with a laser power of 50 W. This may be due to the fact that the higher laser power causes a rapid accumulation of heat on the surface of the material, resulting in a higher value of thermal stress. Secondly, because the higher the laser power, the deeper the remelt layer formed by the remelting of the material, the depth of the cracks formed after remelting and solidification also increases.
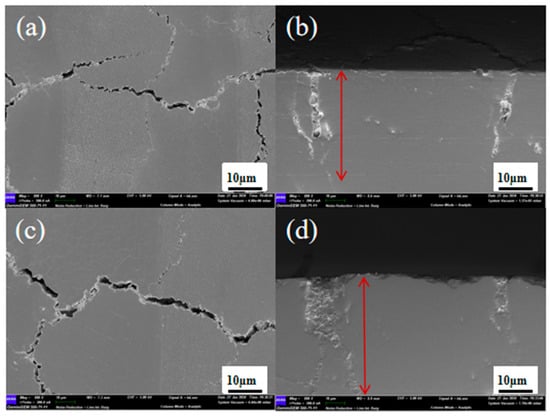
Figure 4.
SEM surface topography: (a) laser power of a 50 W surface crack; (b) laser power of a 50 W cross-section crack; (c) laser power of a 75 W surface crack; (d) laser power of a 75 W cross-section crack.
3. Numerical Simulation
3.1. Controlling Equations for the Temperature Field
In order to make the simulation results more in line with the actual situation, the following assumptions are made in advance for the model establishment when simulating the pulsed laser polishing of zirconia ceramic materials.
- (1)
- In order to simplify the model, the model material is uniform and homogeneous.
- (2)
- The entire laser polishing process is only affected by the specified laser heat source, without considering the role of internal heat sources and so on.
- (3)
- The absorption rate of the laser heat source by the surface material is constant and does not change with changes in temperature or time of action.
In view of the above assumptions, the expression equation for the heat transfer process involved in this model is
where Cp and ρ refer to the specific heat capacity and material density of zirconia ceramic material, respectively; T is the temperature function of the material surface; k is the thermal conductivity coefficient of the material; u is the velocity vector.
Considering the actual polishing process, the polishing surface will be a convective heat transfer phenomenon with the environment, so the convective heat transfer boundary conditions are introduced into the model to represent the heat dissipated by convection between the material surface and the outside world per unit volume. The specific expression is as follows:
where α is the absorption rate of laser energy by the surface material; T0 is the initial ambient temperature of the material surface; h the convective heat transfer coefficient between the laser polishing boundary and the environment; δ is the Stefan–Boltzmann constant; ε is the radiance of the material surface to the environment.
3.2. Controlling Equations for the Stress Field
During the pulsed laser polishing process, we coupled the solid mechanics interface to simulate the real-time variation of the stress field and to explore the effect of different laser process parameters on the stress field. This correspondence is [17]
where FV is the force per unit volume of deformation; ∇ is the gradient operator; σ is the Cauchy stress tensor.
3.3. Control Equations for Laser Heat Sources
In order to simplify the model, we use a flat-top heat source as the laser simulation heat source and set the corresponding heat source control equation:
where step1 is a step function from 0 to 1, which is used to improve the convergence of the entire heat source control equation; R0 is the spot diameter of the laser beam at the focal point; PPK is the peak laser power, which can be expressed as [18]
β1 is a square wave function of the simulated pulsed laser with the expression
r_dis is the control equation for the laser movement, and its specific expression is
where x_t and y_t are the trajectory function of the laser spot in the xy-plane about time t.
This model is used to simulate the variation in the material surface temperature and stress during pulsed laser polishing of zirconia ceramics. In order to simulate the actual pulsed laser polishing effect, the pulse variation of the laser beam is simulated by loading a square wave function in the laser heat source, as shown in Figure 5. A complete unit pulse time represented by the square wave function is 1/f. In a unit pulse, the laser heating time is P_W, and the remaining is the cooling time.
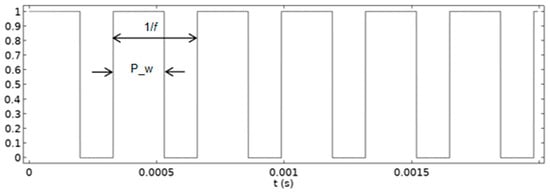
Figure 5.
Illustration of a square wave pulse.
3.4. Computational Domain of the Model and Initial Model Building
Although zirconia ceramics involve thermal radiation, thermal convection and micromorphological evolution during the laser polishing process, the initial roughness of zirconia ceramics was not taken into account when constructing the model of zirconia ceramics for laser polishing, in view of the fact that the purpose of this model is to investigate the mechanism of microcracks in the process of zirconia ceramics polishing by pulsed laser and to study the influence of laser process parameters on the temperature and stress fields on the surface of the material. The initial roughness of zirconia ceramics was not taken into account when constructing the laser-polished zirconia ceramic model. The laser-polished zirconia ceramic model is shown in Figure 6, with a model size of 3200 μm × 1000 μm × 400 μm. In order to more accurately track the temperature and stress variations on the laser-polished surface, the model is delineated with a more stable free tetrahedral mesh, and the laser-polished region is calibrated by extremely fine grid sizes for common physics. In order to save computational time, the remaining solution domains are calibrated by a finer grid size for ordinary physics.
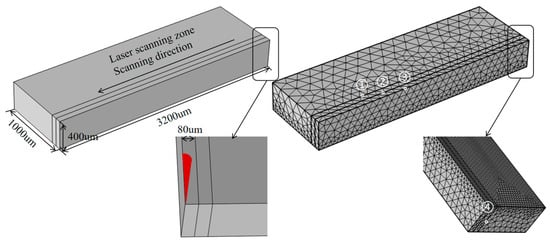
Figure 6.
Model geometry, ① ② ③ ④ is Number the boundary.
3.5. Material Properties
The material used in this study is zirconia ceramic material; in order to make the simulation results better match with the experimental results, the thermophysical parameters of the material are simulated using the interpolation function in COMSOL 5.6 software. Figure 7 shows the variation in specific heat capacity and thermal conductivity with the temperature. The specific material properties and laser polishing parameters of zirconia ceramics are shown in Table 3.
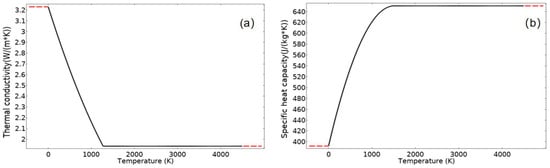
Figure 7.
Variation of the material thermal material coefficient with the temperature: (a) thermal conductivity; (b) specific heat capacity [19].
Table 3.
Zirconia ceramic material parameters and process parameters for laser polishing [20,21,22,23].
3.6. Mechanism of Microcrack Generation in Pulsed Laser Polished Zirconia Ceramics
The laser polishing process parameters used in this model simulation: laser power of 75 W, scanning speed of 320 mm/s, pulse frequency of 3 kHz, scanning distance of 0.08 mm and pulse width of 0.2 ms. This model calculation follows the actual laser polishing operation, the laser beam on the material surface in a “bow” zigzag polishing process, so there will be the scanning path overlap phenomenon, which will cause heat accumulation and stress accumulation on the material surface. The laser beam polishes the surface of the material in a “bow” shape, so the scanning paths will overlap during the laser scanning process, which leads to heat accumulation and stress accumulation on the surface of the material. As shown in Figure 8, pulsed laser polishing zirconia ceramics numerical simulation results, the temperature curve and stress curve in the figure will be 10 ms as the cycle of the regular accumulation of growth, and from the figure, it can be seen that the highest temperature of the surface layer of the material is basically in the 2500 °C or more, and the highest stress value of the surface layer of the material is basically 400 MPa or more. However, the fracture strength of engineering ceramics such as alumina, silicon nitride and silicon carbide is basically below 360 MPa [24], so it can be inferred that, when the laser beam just acted on the surface layer of the material to form a molten pool, the value of the stress generated within the material exceeds the fracture strength of the material itself, resulting in the generation of microcracks.
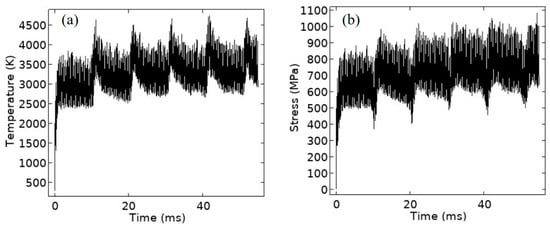
Figure 8.
Numerical simulation results of pulsed laser polishing of zirconia ceramics. Plot of (a) the maximum temperature of the surface at the moment t; (b) the maximum stress value of the surface at the moment.
In order to further analyze the reasons for the generation of microcracks, the present model characterizes the cloud diagram of the stress distribution in the surface layer after being treated by a combination of laser process parameters with a laser power of 75 W, a scanning speed of 320 mm/s and a pulse frequency of 3 kHz. As can be seen in Figure 9a,c, surface microcracks were generated in the zirconia ceramics after laser polishing, and the depth of the microcracks extended downward to the material matrix organization. This is because, in the process of laser polishing, the laser heat source makes the zirconia ceramic surface material undergo rapid melting and solidification in a short period of time, and residual tensile stresses are generated in the surface layer of the material due to the large temperature gradient, so the material surface releases tensile stresses by generating cracks when the numerical size of the tensile stresses exceeds the fracture limit of the material itself. In the scanning electron microscope image, marked with a red line is the zirconia ceramic surface layer of the crack region, and combined with the simulation results of Figure 9b,c, the high-energy laser beam scanned areas showed a more obvious thermal stress concentration, and the closer to the center of the laser spot, the greater the value of the thermal stress. Secondly, in the scanning electron microscope images, the surface cracks and cross-section cracks of zirconia ceramics filled the entire remelted layer. By comparing the experimental and simulation results, it can be inferred that the thermal stress generated when the high-energy laser beam acts on the surface layer of the material is the main reason for the cracks on the surface of the material.
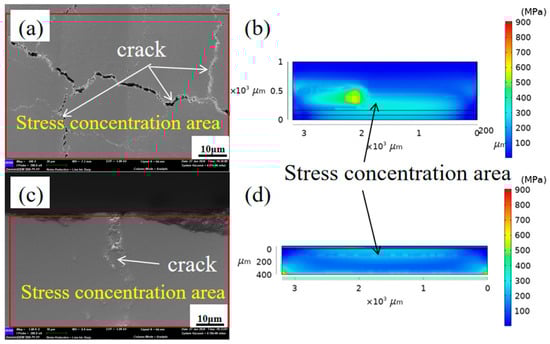
Figure 9.
Comparison between experimental and simulation results: (a) SEM image of the sample surface; (b) stress distribution cloud of the surface; (c) SEM image of the sample cross-section; (d) stress distribution cloud of the cross-section.
Figure 10 shows the temperature and stress curves at the time of t = 30 ms obtained by the model, from which it can be seen that the change trend of the material surface temperature curve is basically the same as that of the stress curve, which also indirectly explains the phenomenon that the width and length of the microcracks produced in the laser polishing experiments are larger than that of the microcracks generated at a laser power of 75 W and a laser power of 50 W. The characterization of the model boundary 4 (refer to Figure 6) shows that the laser-polished surface generates large thermal stress, and then, the value of the thermal stress gradually decreases to zero along the z-axis. This is because, when the laser acts on the surface layer of the material, it only causes the phenomenon of remelting in the surface material, and for the substrate material further down the layer, the energy transfer receives an obstruction, so that the thermal impact of the laser on it will be smaller. It can be deduced that, when the laser spot leaves a certain area, the melted material in that area starts to solidify and undergoes volume changes due to phase transitions, while the area that has not been exposed to the laser radiation maintains its original volume and state, and the molten liquid material is inhibited by the surrounding material, which restricts its free contraction and expansion [25,26,27]. As a result, residual tensile stresses are generated within the surface layer of the material, and when the residual tensile stresses exceed the fracture limit of the material, microcracks are generated within the material.
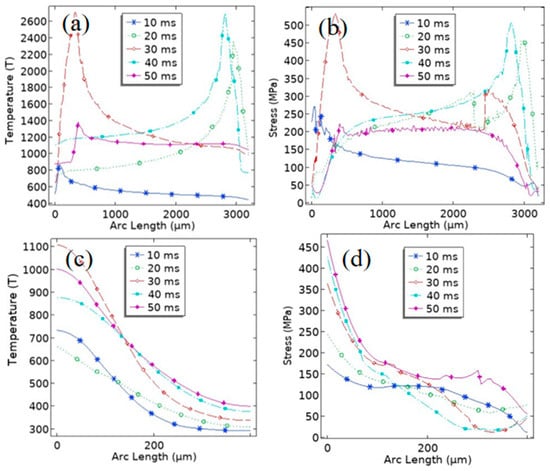
Figure 10.
Temperature stress line plots at t = 30 ms: (a,b) are boundary 1; (c,d) are boundary 4.
3.7. Influence of Laser Parameters on the Laser Polishing Process
In the process of pulsed laser polishing of zirconia ceramic materials, the laser polishing process parameters have a more important influence on the generation of microcracks. In order to investigate the effect, the temperature profile and stress profile plots formed at boundary 2 (refer to Figure 6) at 35 ms for different laser process parameters are studied and analyzed by characterizing them. From Figure 11a,b, it can be observed that the temperature and stress values of the zirconia ceramic surface layer increase with the increase in the laser power, which is because, when the laser power increases, the laser energy density acting on the surface layer of the material increases, and so, the temperature gradient of the surface layer of the material also increases gradually. This also verifies the phenomenon that the microcracks on the polished surface at higher laser power are slightly wider than those on the polished surface at lower laser power. Since the curves are characterized at 35 ms, when the laser spot is scanned to the middle of the arc length, the stress vs. temperature curves will increase and then decrease with the increase of the arc length. From Figure 11c,d, it can be observed that the temperature and stress values of the zirconia ceramic surface layer show a gradual decrease with the increase of the laser pulse frequency. This is because, when other laser parameters are constant, the higher the laser pulse frequency, the value of the laser energy density per unit time decreases, and the energy accumulation on the material surface decreases. Therefore, the temperature gradient at the surface of the material decreases instead when the laser pulse frequency increases. As can be seen in Figure 11e,f, the values of the temperature and stress in the surface layer of zirconia ceramics are also increasing with the increase of the pulse width. This is because, when the laser frequency is constant and the laser pulse width is increased, the laser action time within a single pulse becomes longer, so the energy accumulation on the material surface is higher. From Figure 11g,h, it can be seen that the temperature and stress values of the zirconia ceramic surface layer gradually decrease as the laser scanning speed increases. This is because, when other laser parameters remain constant, the increase in the laser scanning speed makes the time for the laser spot to act on the surface of the material shorter, so the energy accumulation on the surface of the material will be lower.
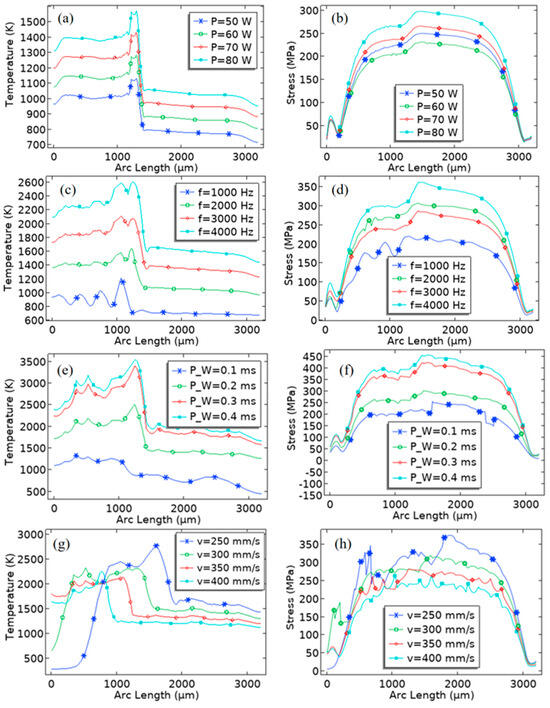
Figure 11.
Temperature vs. stress graphs of boundary 2 at 35 ms: (a,b) represent the surface temperature vs. stress graphs when the laser power is 50, 60, 70 and 80 W; (c,d) represent the surface temperature vs. stress graphs when the pulse frequency is 1000 Hz, 2000 Hz, 3000 Hz and 4000 Hz; (e,f) represent the surface temperature vs. stress graphs when the pulse width (e,f) represents the pulse width of 0.1 ms, 0.2 ms, 0.3 ms and 0.4 ms when the surface temperature and stress curve; (g,h) represents the scanning speed of 250 mm/s, 300 mm/s, 350 mm/s and 400 mm/s when the surface temperature and stress curve.
3.8. Experimental Validation
In order to verify the simulation results, laser polishing experiments were carried out using a CO2 pulsed laser with an output power range of 0–150 W. The polishing process was carried out under the process parameter combinations of a laser power of 75 W and 50 W, scanning speed of 320 mm/s, pulse frequency of 3 kHz and pulse width of 0.2 ms, respectively, and the processed surfaces were scanned using a confocal microscope, and the resulting surface molten pool widths are shown in Figure 12b,d. Figure 12a,c show the numerical simulation results for a laser power of 75 W and a laser power of 50 W, respectively. By comparing the melt pool width obtained from experimental results and numerical simulation, it is found that, when the laser power is 75 W, the melt pool track width photographed by confocal microscope is 258.8 μm, and after numerical simulation, the melt pool width at 10 ms is 245.3 μm, with an error of about 5.2%. When the laser power is 50 W, the melt pool track width taken by confocal microscope is 211.8 μm, and the melt pool width at 10 ms is 218.2 μm after numerical simulation, with an error of about 3%. In summary, the error range between the simulation results and the actual experimental results is within 5.2%, so it is considered that the numerical simulation using this model has a certain degree of accuracy.
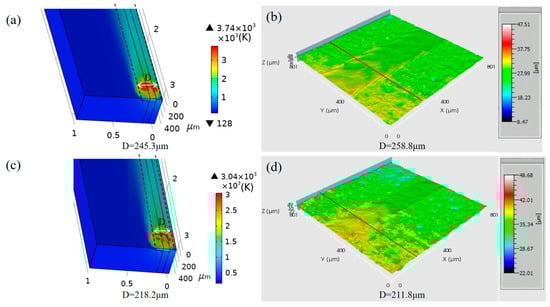
Figure 12.
Comparison of melt pool widths on the surface of zirconia ceramics: (a) simulated melt pool topography at a laser power of 75 W; (b) experimental melt pool topography at a laser power of 75 W; (c) simulated melt pool topography at a laser power of 50 W; (d) experimental melt pool topography at a laser power of 50 W.
4. Conclusions
This paper section adopts the method of combining experimental research and simulation, fitting the actual working conditions, simulating the scanning path of the laser beam. The pulsed laser polishing zirconia ceramic material microcrack generation mechanism is analyzed, and the influence of the laser polishing process parameters on the material surface layer temperature field and stress field law is obtained.
- According to the experimental results of the pulsed laser polishing zirconia ceramics table shows that, under the premise of other laser polishing process parameters remain unchanged, the appropriate reduction in laser power can not only reduce the surface roughness to play the effect of polishing but also to avoid the cracks from further expansion.
- Pulsed laser polishing zirconia ceramics, because of the “bow”-shaped polishing path, so, with the movement of the laser polishing, the surface layer of the material will form in the accumulation of heat, and the resulting thermal stress will also increase. When the laser acts on the surface layer of the material, the thermal stress and the stress generated by the phase transition of the material are the main reasons for cracks in the material.
- In the process of pulsed laser polishing zirconia ceramics, laser power and pulse frequency are through the influence of laser energy density, which, in turn, affects the formation of the temperature field and stress field of the material surface layer. When the laser power increases or the pulse frequency decreases, the laser acts on the material surface layer of the temperature field and the stress field value will also increase. The pulse width and scanning speed affect the temperature and stress fields formed in the surface layer of the material by controlling the action time of the spot in the surface layer of the material. When the pulse width is decreased or the scanning speed is increased, the values of the temperature and stress fields formed by the laser in the surface layer of the material will be decreased. Finally, by comparing the experimental results and the melt pool width obtained from numerical simulation, it is found that the error range between the simulation results and the actual experimental results is within 5.2%, so it is considered that the numerical simulation using this model has a certain degree of accuracy.
Author Contributions
Conceptualization, Z.Z. (Zhanwang Zhou); methodology, Z.Z. (Zhanwang Zhou); formal analysis, Z.Z. (Zhanwang Zhou); investigation, Z.Z. (Zhenyu Zhao), J.H. and R.S.; resources, Z.Z. (Zhanwang Zhou); writing—original draft preparation, Z.Z. (Zhenyu Zhao) and J.H.; writing—review and editing, R.S. and Z.Z. (Zhanwang Zhou); funding acquisition, Z.Z. (Zhenyu Zhao). All authors have read and agreed to the published version of the manuscript.
Funding
This research was funded by Shenzhen Science and Technology Plan Project (No. JCYJ20170817112445033), Guangdong Province Laser Additive and Polishing Technology Innovation Team (No. 2018GKCXTD001), Technology Innovation Platform Project of Shenzhen Institute of Information Technology 2020 (PT2020E002), Shenzhen Science and Technology Plan Project (GJHZ20180416164715805), Guangdong Laser Intelligent Manufacturing Equipment and Precision Processing Engineering Technology Research Center (No. PT2021B001) and Guangdong Province Precision Manufacturing and Intelligent Industry Education Integration Innovation Platform (No. 2022CJPT019).
Data Availability Statement
The data presented in this study are available on request from the corresponding author due to these data may still be part of an ongoing research project or collaboration, and premature disclosure may compromise their integrity.
Acknowledgments
The authors are grateful to the project support received from the Technology Innovation Platform Project of Shenzhen Institute of Information Technology, the Guangdong Province Higher Vocational Colleges and Schools Pearl River Scholar Funded Scheme (2015, 2018), the Department of Science and Technology of Guangdong Province, the Natural Science Foundation of Hunan Province, the Education Department of Hunan Province and the Guangdong Province Precision Manufacturing and Intelligent Production Education Integration Innovation Platform.
Conflicts of Interest
The authors declare no conflicts of interest.
References
- Malzbender, J.; Steinbrech, R.W. Threshold fracture stress of thin ceramic components. J. Eur. Ceram. Soc. 2007, 28, 247–252. [Google Scholar] [CrossRef]
- Li, C.; Liu, D.; Liu, G.; Liu, S.; Jin, X.; Bai, Y. Surface characteristics enhancement and morphology evolution of selective-laser-melting (SLM) fabricated stainless steel 316L by laser polishing. Opt. Laser Technol. 2023, 162, 109246. [Google Scholar] [CrossRef]
- Richhariya, V.; Guimarães, B.; Miranda, G.; Silva, F. Laser Machining of Zirconia Green Compacts to Produce Cavities and Blocks: Parametric Optimization and Patterning. Mater. Proc. 2022, 8, 29. [Google Scholar] [CrossRef]
- Alsafi, S.M.; Abed, J.I. Effect of Milling Parameters on Surface Characteristics and Mechanical Properties of Presintered Zirconia Ceramic. Revue des Composites et des Matériaux Avancés. J. Compos. Adv. Mater. 2023, 33, 243–252. [Google Scholar]
- Souza, L.F.B.; Soares, P.M.; Ribeiro, V.F.; Scotti, N.; Kleverlaan, C.J.; Bacchi, A.; Pereira, G.K.R. Influence of coloring techniques on the surface characteristics and color stability of a monolithic zirconia ceramic. J. Prosthet. Dent. 2023, 130, 392.e1–392.e9. [Google Scholar] [CrossRef]
- Nakazawa, K.; Nakamura, K.; Harada, A.; Shirato, M.; Inagaki, R.; Örtengren, U.; Kanno, T.; Niwano, Y.; Egusa, H. Surface properties of dental zirconia ceramics affected by ultrasonic scaling and low-temperature degradation. PLoS ONE 2018, 13, e0203849. [Google Scholar] [CrossRef]
- Sagsoz, O.; Demirci, T.; Demirci, G.; Sagsoz, N.P.; Yildiz, M. The effects of different polishing techniques on the staining resistance of CAD/CAM resin-ceramics. J. Adv. Prosthodont. 2016, 8, 417–422. [Google Scholar] [CrossRef] [PubMed]
- Guo, M.J.; Luo, H.; Wang, C.B. Experimental study on magnetorheological polishing of large polished die of zirconia ceramics. Surf. Technol. 2018, 47, 28–34. [Google Scholar]
- Dai, S.; Fu, J.; Lei, H.; Chen, Y. Study on the interaction between SiO2 and ZrO2 in the chemical mechanical polishing of zirconia ceramic with colloidal silica. Ceram. Int. 2021, 47, 21642–21649. [Google Scholar] [CrossRef]
- Zhao, S.; Wang, D.; Liu, J.; Yu, M.; Yan, R.; Cui, E.; Liu, S.; Lei, C. Analysis of molten pool dynamics and surface smoothing time scale in laser polishing alloy materials. Opt. Laser Technol. 2023, 161, 109183. [Google Scholar] [CrossRef]
- Mushtaq, R.T.; Wang, Y.; Khan, A.M.; Rehman, M.; Li, X.; Sharma, S. A post-processing laser polishing method to improve process performance of 3D printed new Industrial Nylon-6 polymer. J. Manuf. Process. 2023, 101, 546–560. [Google Scholar] [CrossRef]
- Yamamuro, Y.; Shimoyama, T.; Yan, J. Microscale Surface Patterning of Zirconia by Femtosecond Pulsed Laser Irradiation. Int. J. Precis. Eng. Manuf.-Green Technol. 2021, 9, 619–632. [Google Scholar] [CrossRef]
- Abdo, B.; Ahmed, N.; El-Tamimi, A.M.; Anwar, S.; Alkhalefah, H.; Nasr, E.A. Laser beam machining of zirconia ceramic: An investigation of micro-machining geometry and surface roughness. J. Mech. Sci. Technol. 2019, 33, 1817–1831. [Google Scholar] [CrossRef]
- Goknil, E.K.; Ibrahim, D. Effects of laser treatments on surface roughness of zirconium oxide ceramics. BMC Oral Health 2018, 18, 222. [Google Scholar]
- Li, D.; Wang, T.; Yang, Z.; Li, Y.; Wang, S. Optimization of parameters and analysis of polished layer properties of 304 stainless steel laser polishing. China Laser 2023, 50, 219–228. [Google Scholar]
- Liu, S. Experimental Study on the Mechanism and Process of Nanosecond Pulse Laser Rust Removal. Master’s Thesis, Guangzhou Guangdong University of Technology, Guangzhou, China, 2018. [Google Scholar]
- Wang, M.; Mei, W.; Yang, L.; Wang, Y. Study of sapphire etching based on nanofemtosecond double-pulse laser. Sci. China Phys. Mech. Astron. 2020, 50, 54–64. [Google Scholar]
- Zhao, A.-A.; Zhang, H.-S.; Yan, G.-Q.; Guo, Y.-W. Thermal stress coupling analysis of aluminum alloying milling protective adhesive laser etching. Laser Technol. 2023, 47, 419–424. [Google Scholar]
- Wang, C.; Zhao, Z.; Zhou, H.; Zeng, J.; Zhou, Z. Numerical Simulation and Validation of Laser Polishing of Alumina Ceramic Surface. Micromachines 2023, 14, 2012. [Google Scholar] [CrossRef]
- Liu, G. Research on Laser-Assisted Thermal Cutting Machining Process of Zirconia Ceramics. Master’s Thesis, Shandong University of Technology, Zibo, China, 2019. [Google Scholar]
- Ma, Z.; Wang, Q.; Liang, Y.; Cui, Z.; Meng, F.; Chen, L.; Wang, Z.; Yu, T.; Liu, C. The mechanism and machinability of laser-assisted machining zirconia ceramics. Ceram. Int. 2023, 49, 16971–16984. [Google Scholar] [CrossRef]
- Sucharita, S. Nanosecond laser irradiation of Yttria stabilized Zirconia: Pulsed laser ablation and surface treatment. Hybrid Adv. 2023, 2, 100029. [Google Scholar]
- Hao, L.; Lawrence, J. Numerical modelling of the laser surface processing of magnesia partially stabilized zirconia by the means of three-dimensional transient finite element analysis. Proc. R. Soc. A Math. Phys. Eng. Sci. 2006, 462, 43–57. [Google Scholar] [CrossRef]
- Eremin, M.; Deryugin, E.; Schmauder, S. Evaluation of fracture toughness of ZrO2−3.0mol%Y2O3 ceramics utilizing wedge splitting loading of double cantilever specimen with a chevron notch. Eng. Fail. Anal. 2020, 110, 104409. [Google Scholar] [CrossRef]
- Wang, J.; Tian, X.; Zhang, B.; Wang, P. Influence law of surface polishing on grinding fracture strength of engineering ceramics. China Surf. Eng. 2013, 26, 81–85. [Google Scholar]
- Chen, W.; Hu, D.; Gu, H.; Xing, J. Characterization of phase transition microstructure of rare earth stabilized tetragonal polycrystalline zirconia ceramics. J. Silic. 2019, 47, 1057–1064. [Google Scholar]
- Lugovy, M.; Slyunyayev, V.; Teixeira, V. Residual stress relaxation processes in thermal barrier coatings under tension at high temperature. Surf. Coat. Technol. 2003, 184, 331–337. [Google Scholar] [CrossRef]
Disclaimer/Publisher’s Note: The statements, opinions and data contained in all publications are solely those of the individual author(s) and contributor(s) and not of MDPI and/or the editor(s). MDPI and/or the editor(s) disclaim responsibility for any injury to people or property resulting from any ideas, methods, instructions or products referred to in the content. |
© 2024 by the authors. Licensee MDPI, Basel, Switzerland. This article is an open access article distributed under the terms and conditions of the Creative Commons Attribution (CC BY) license (https://creativecommons.org/licenses/by/4.0/).