

Kinetics of Reduction of Iron Ore Powder by Industrial Lignin from Pulping and Papermaking Waste Biomass Energy

Abstract
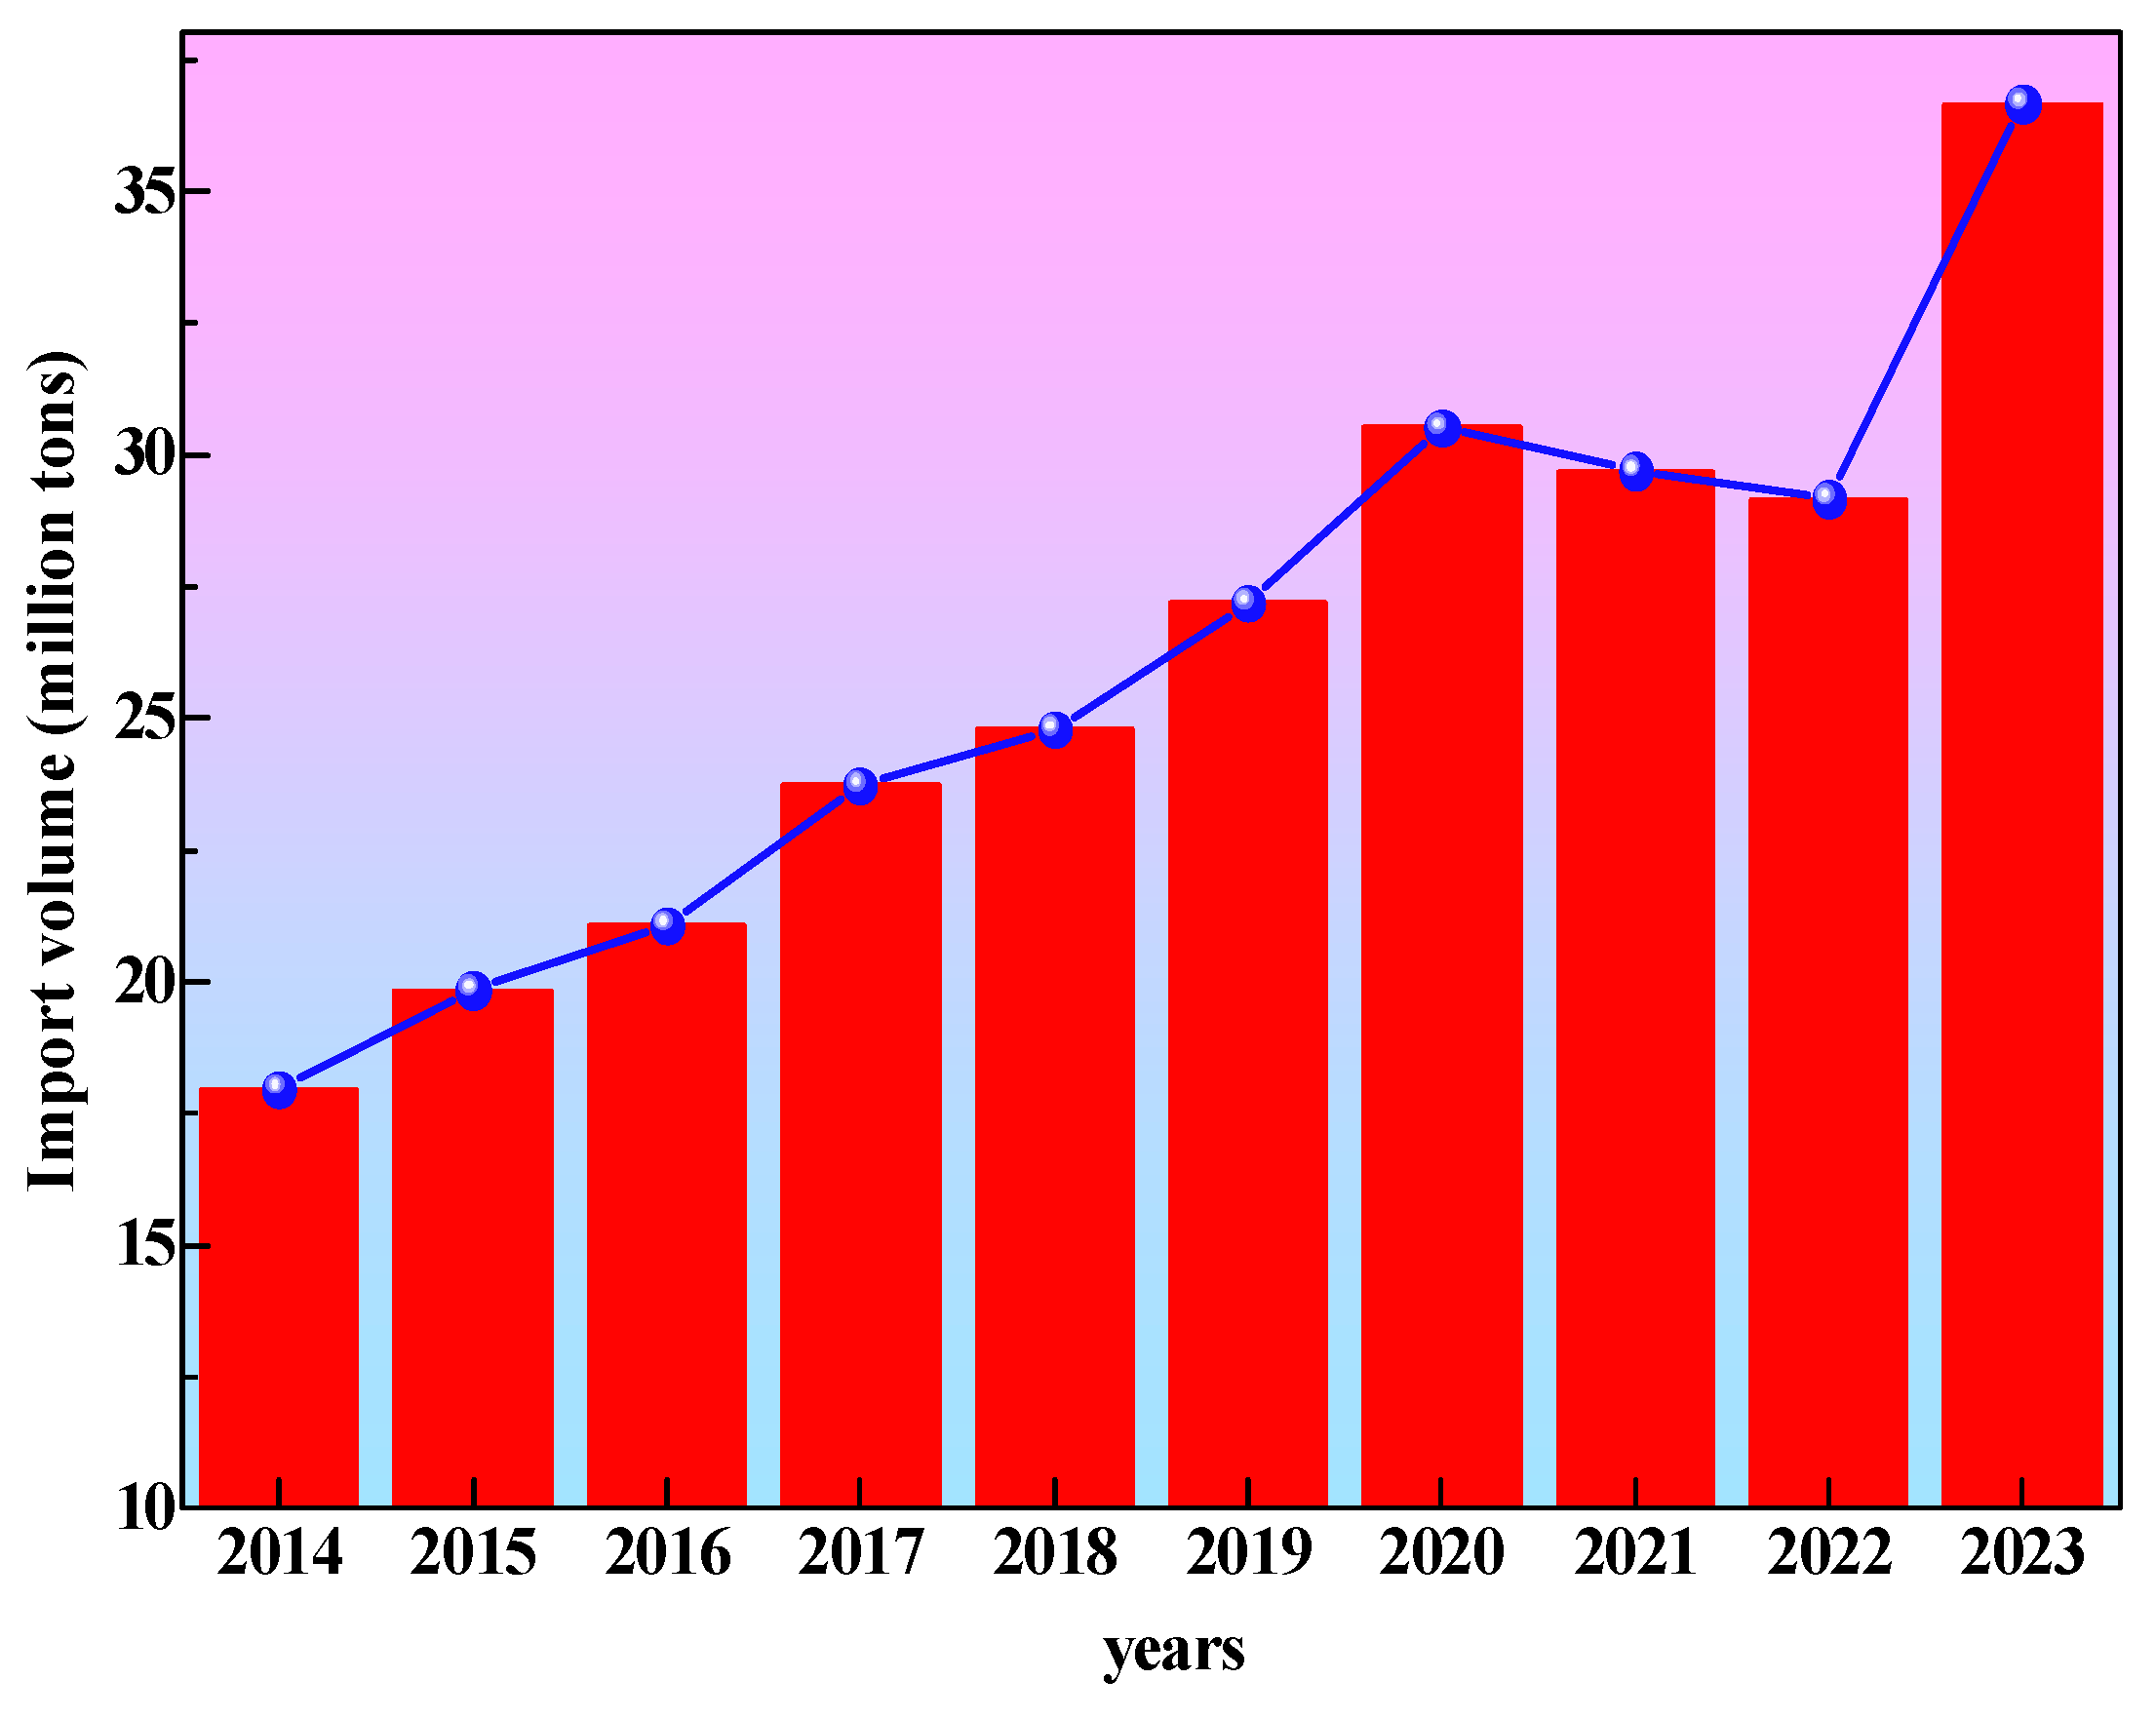
1. Introduction
2. Materials and Methods
2.1. Materials
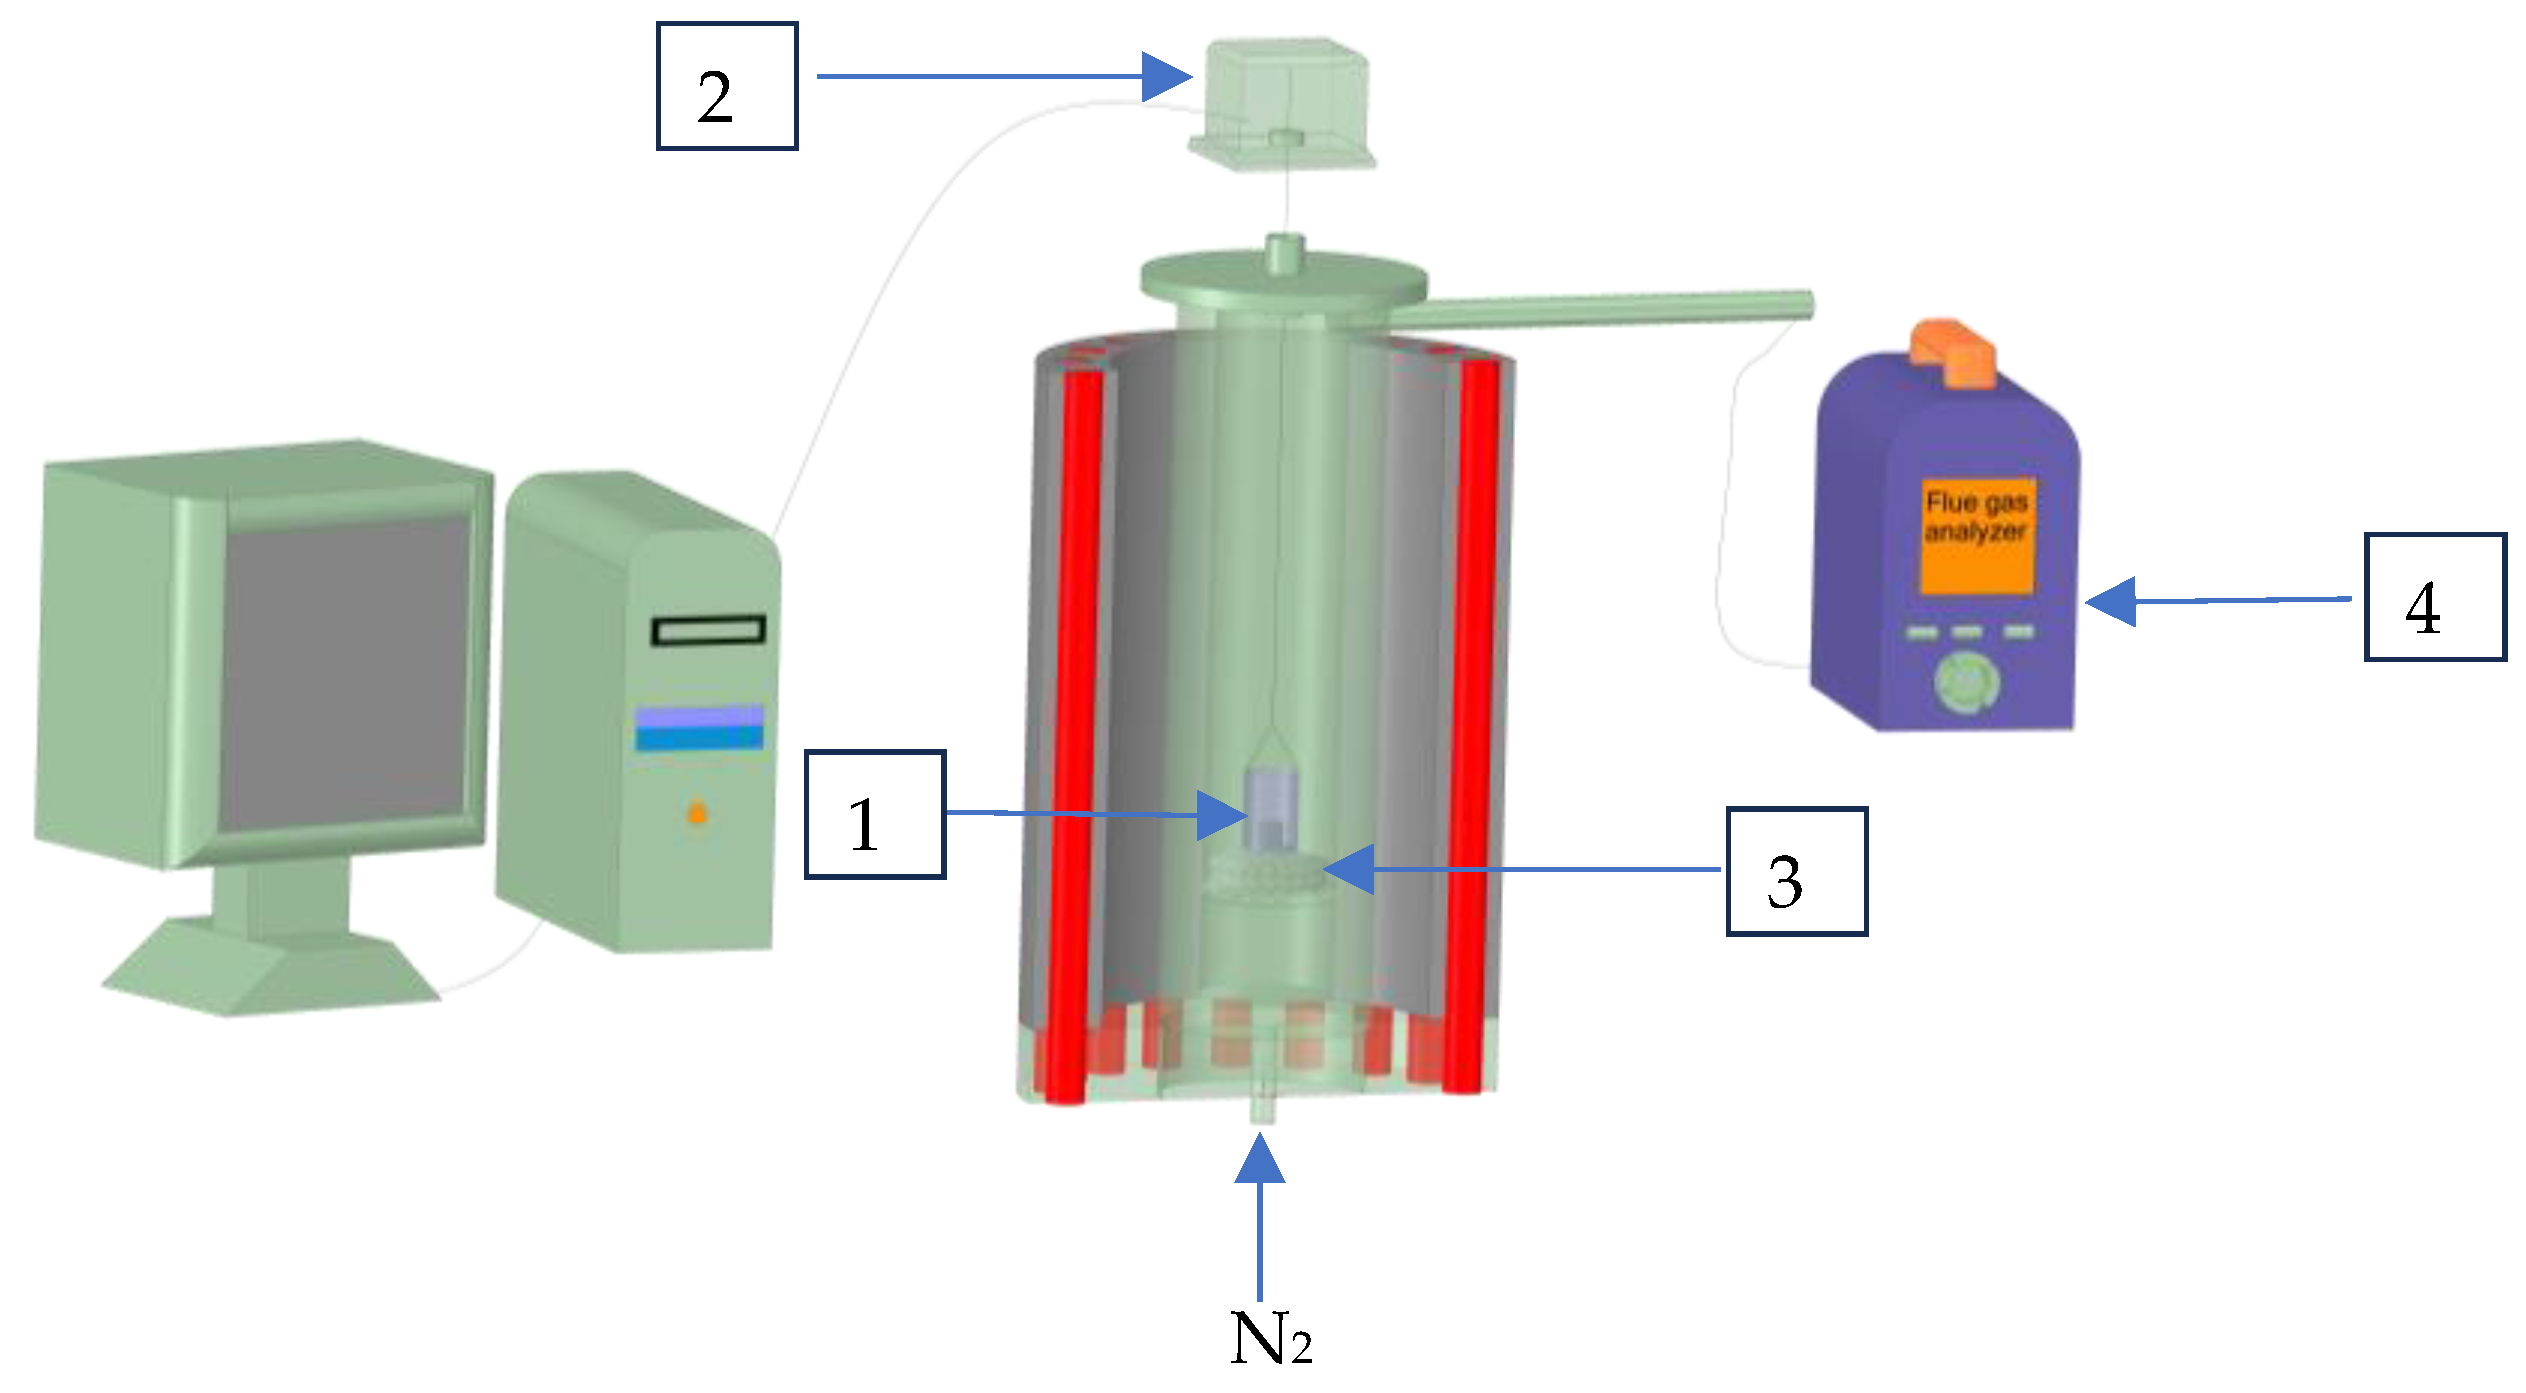
2.2. Methods
3. Results and Discussion
3.1. Comparison of Reducing of Iron Ore Powder with Different Reducing Agents
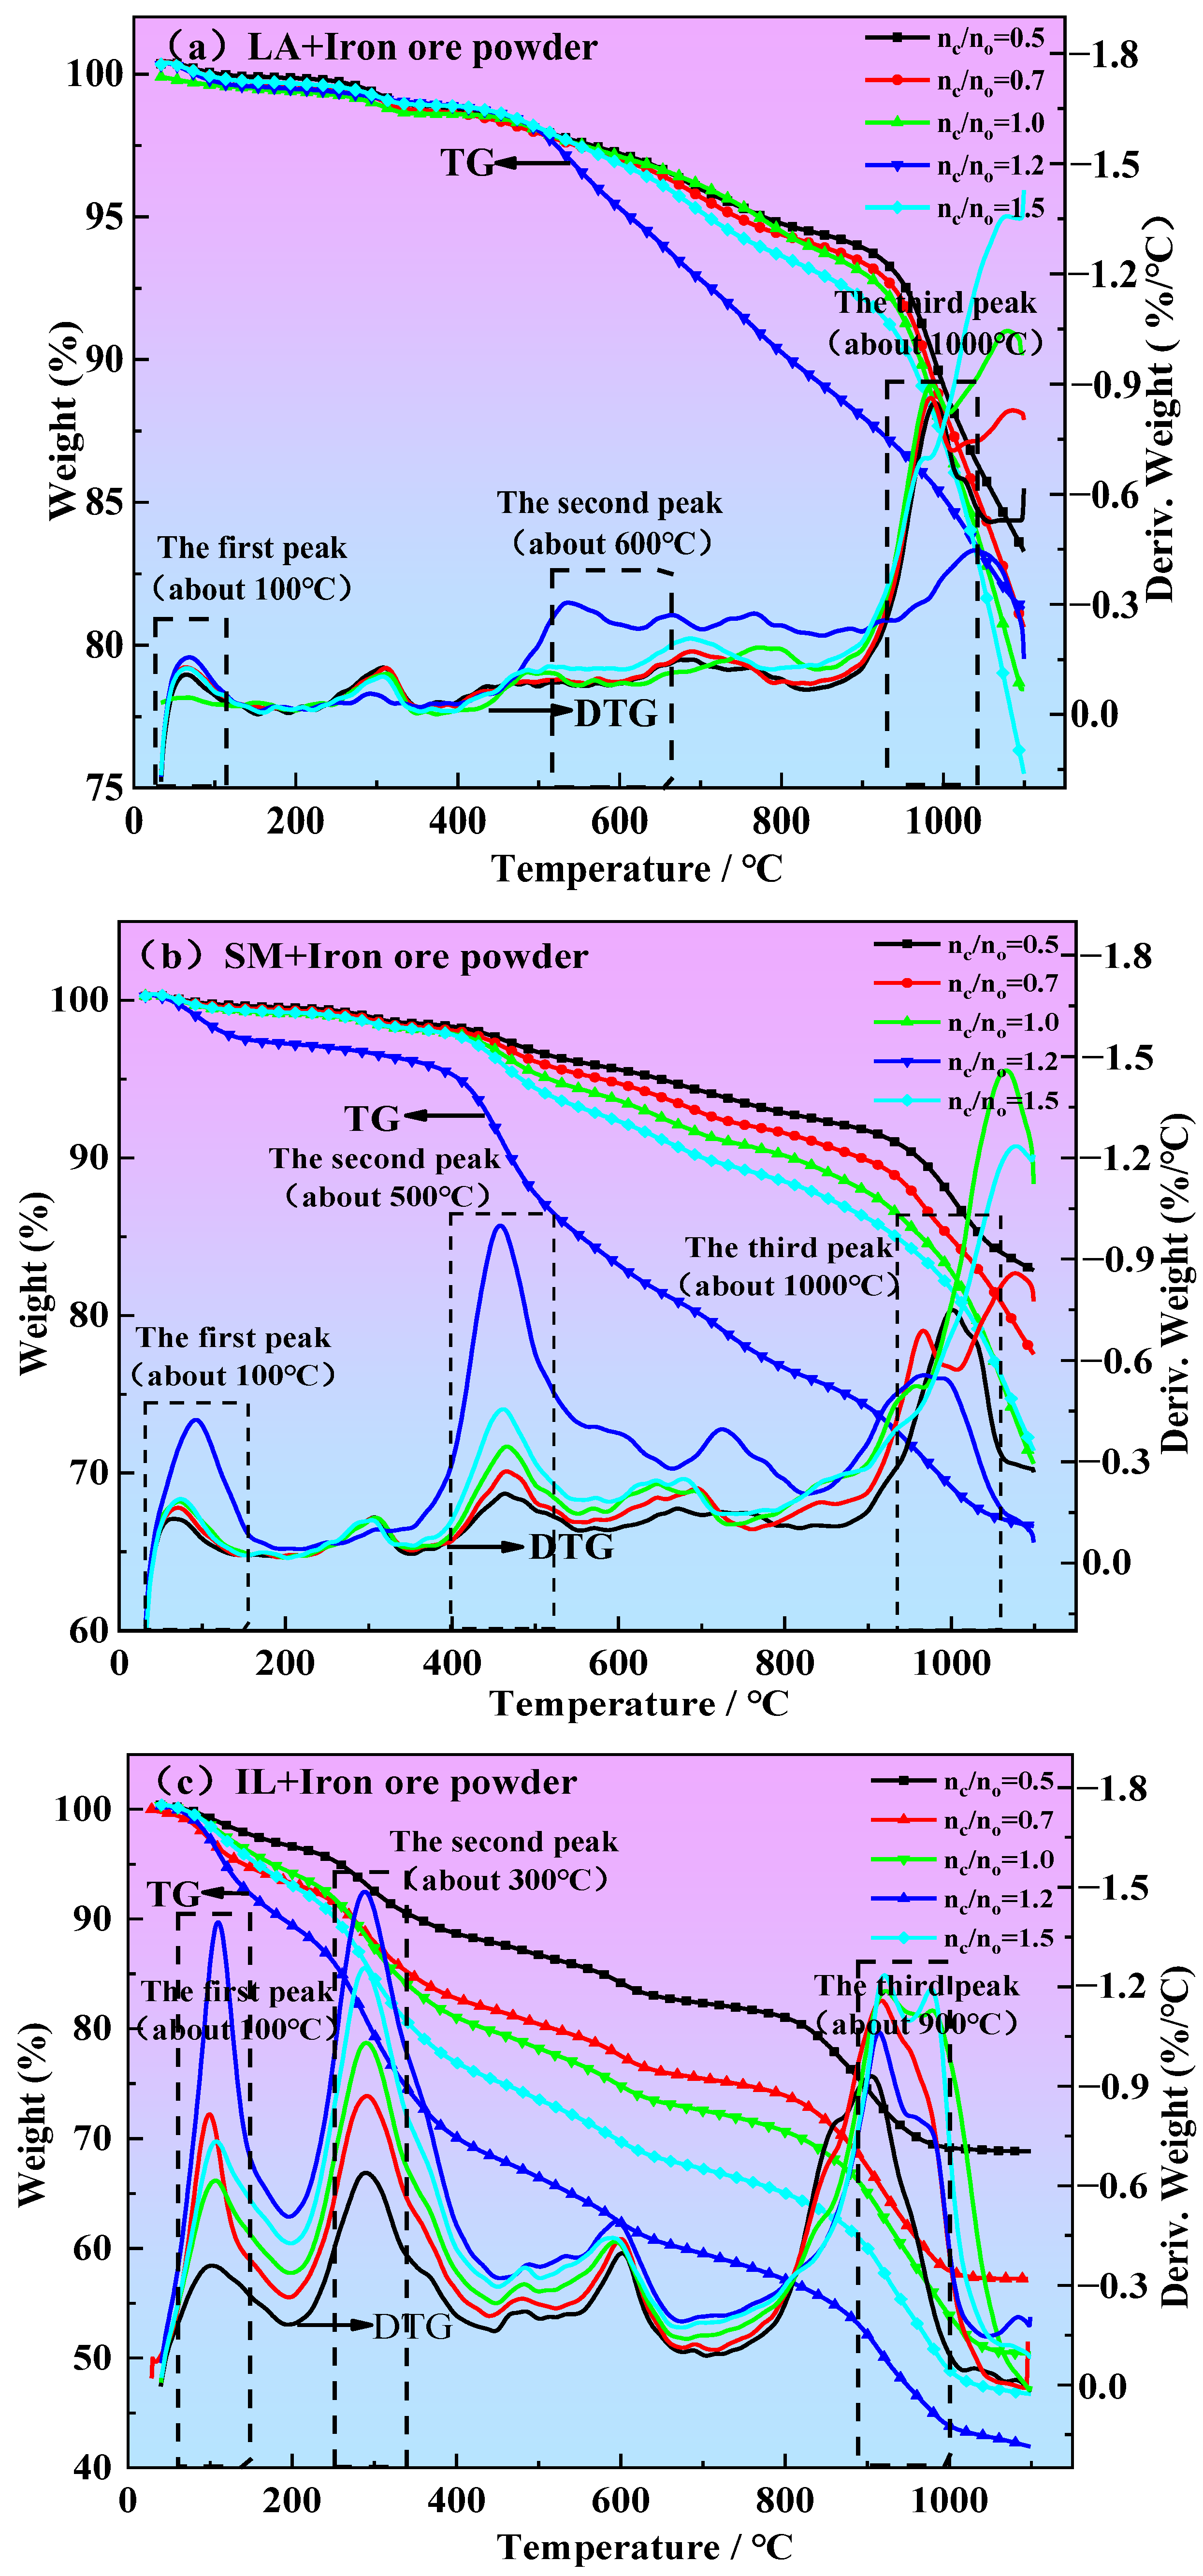
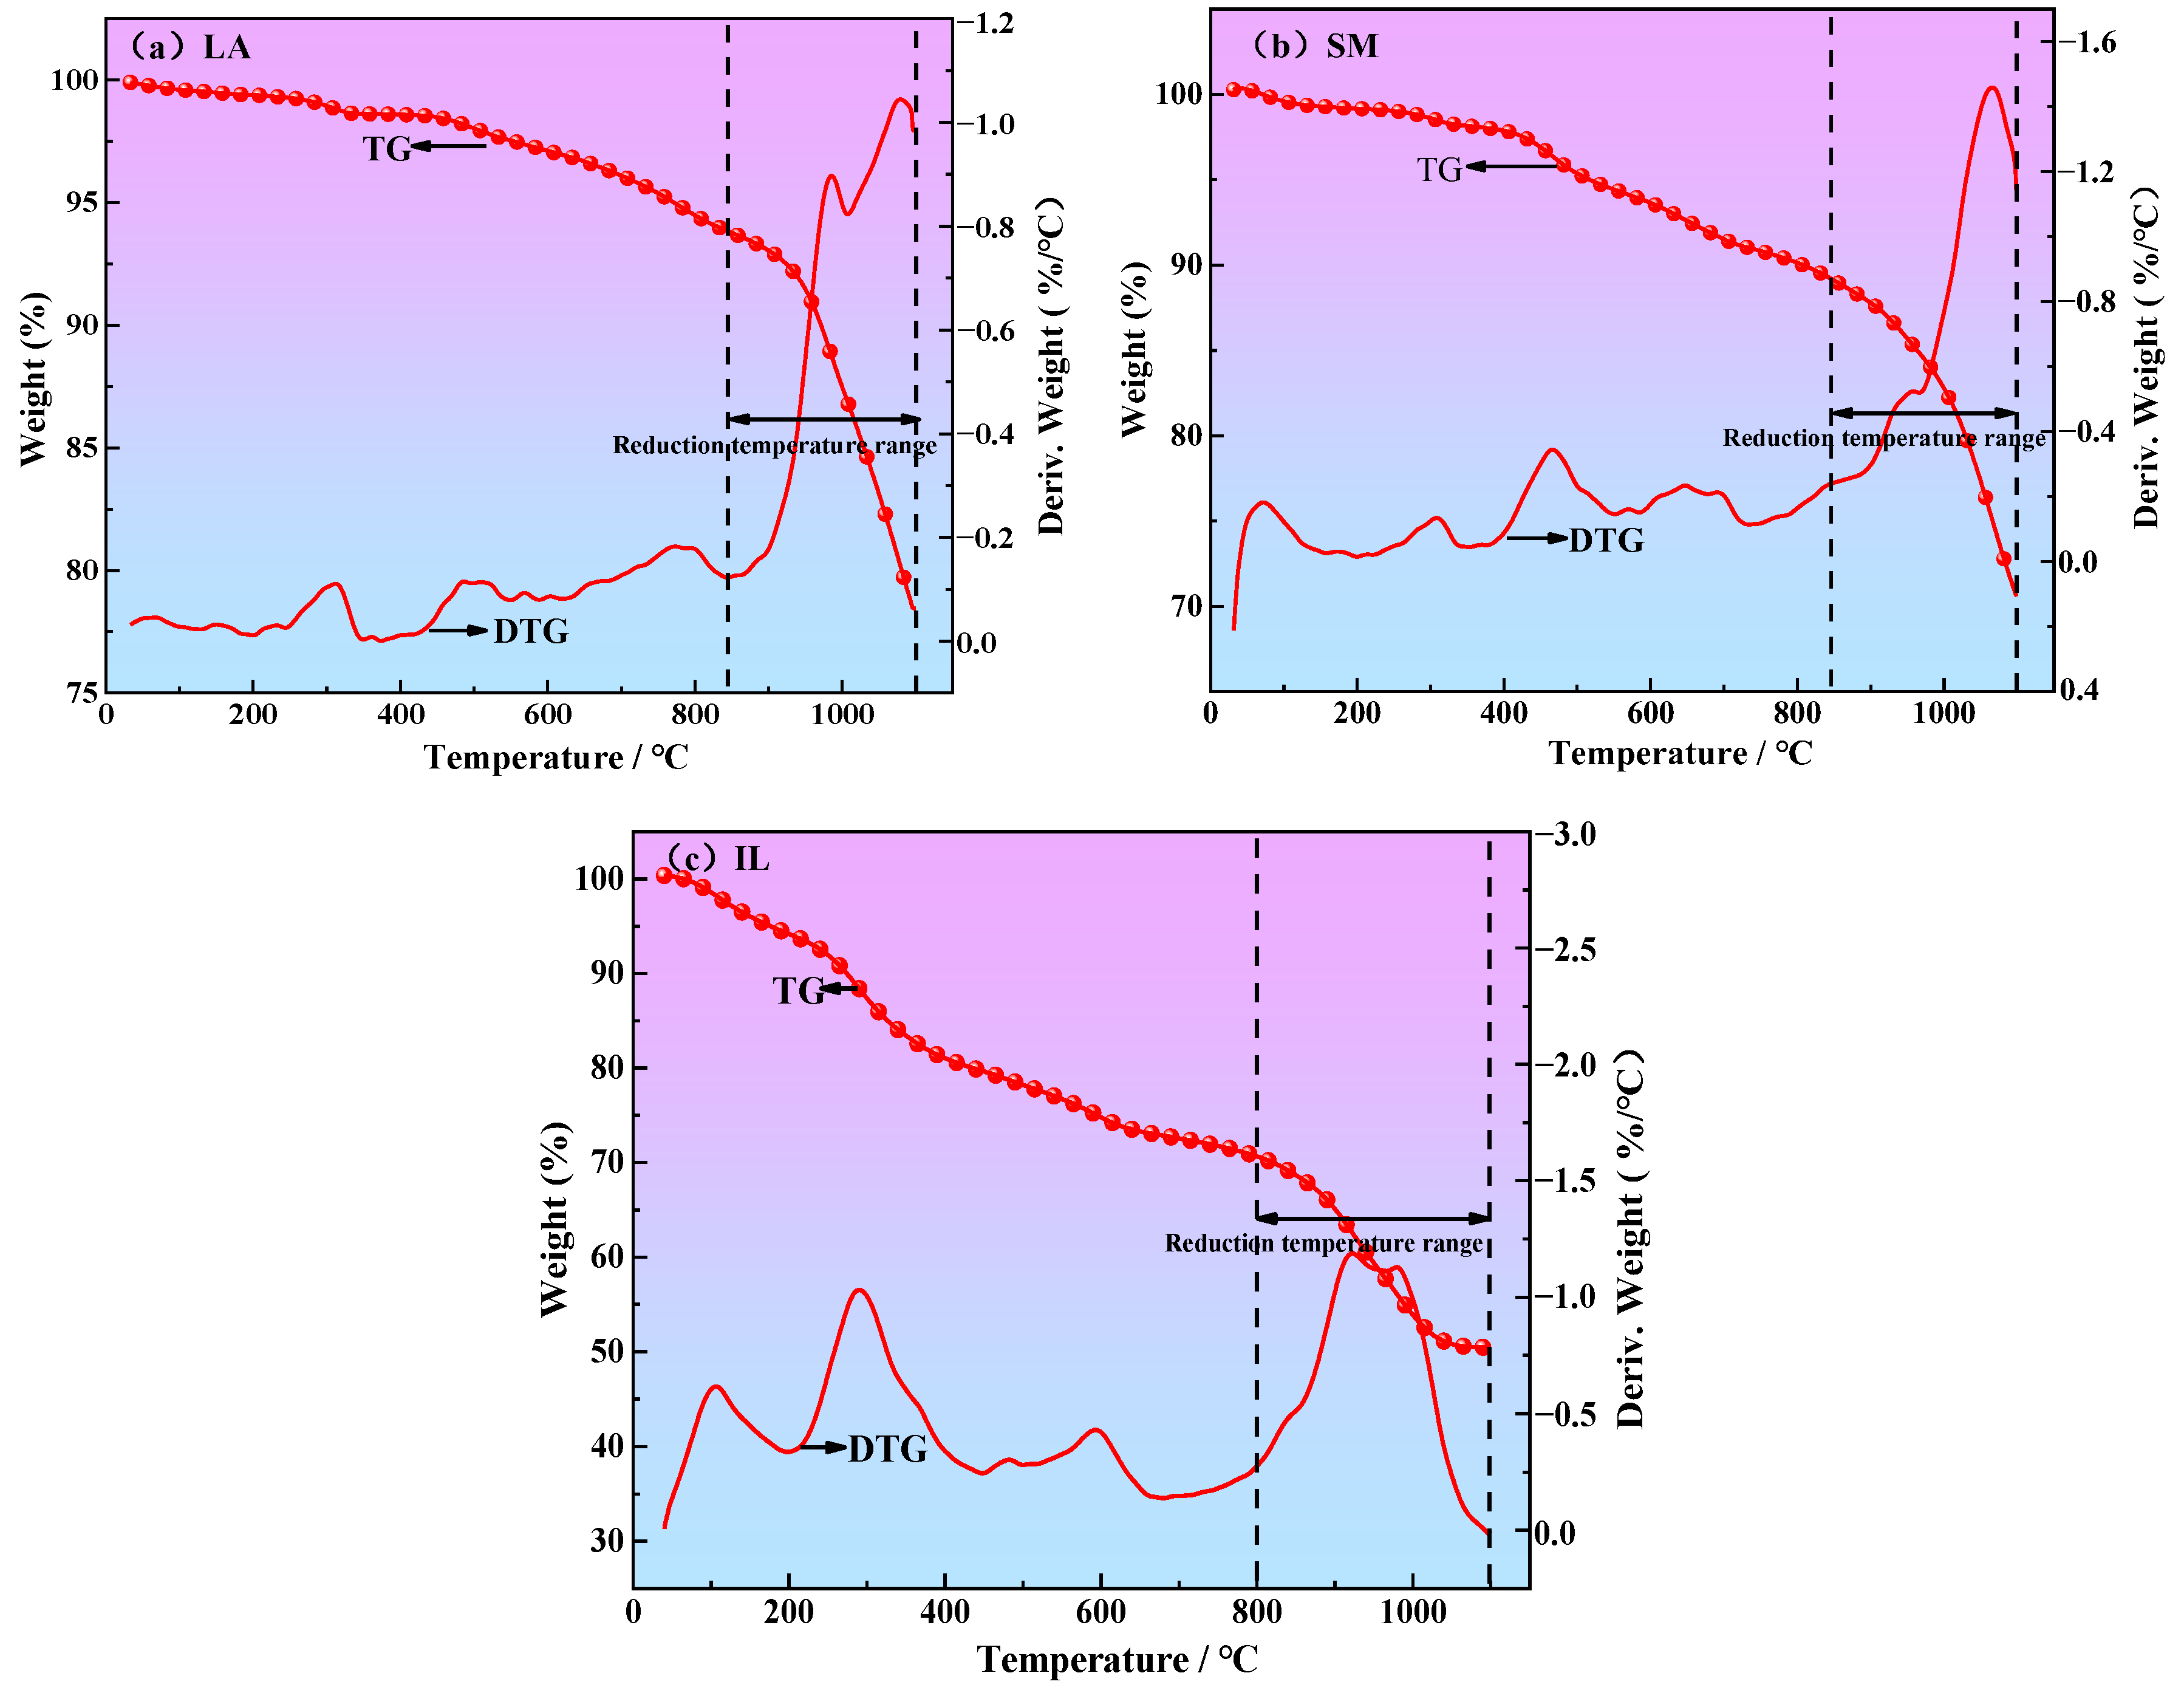
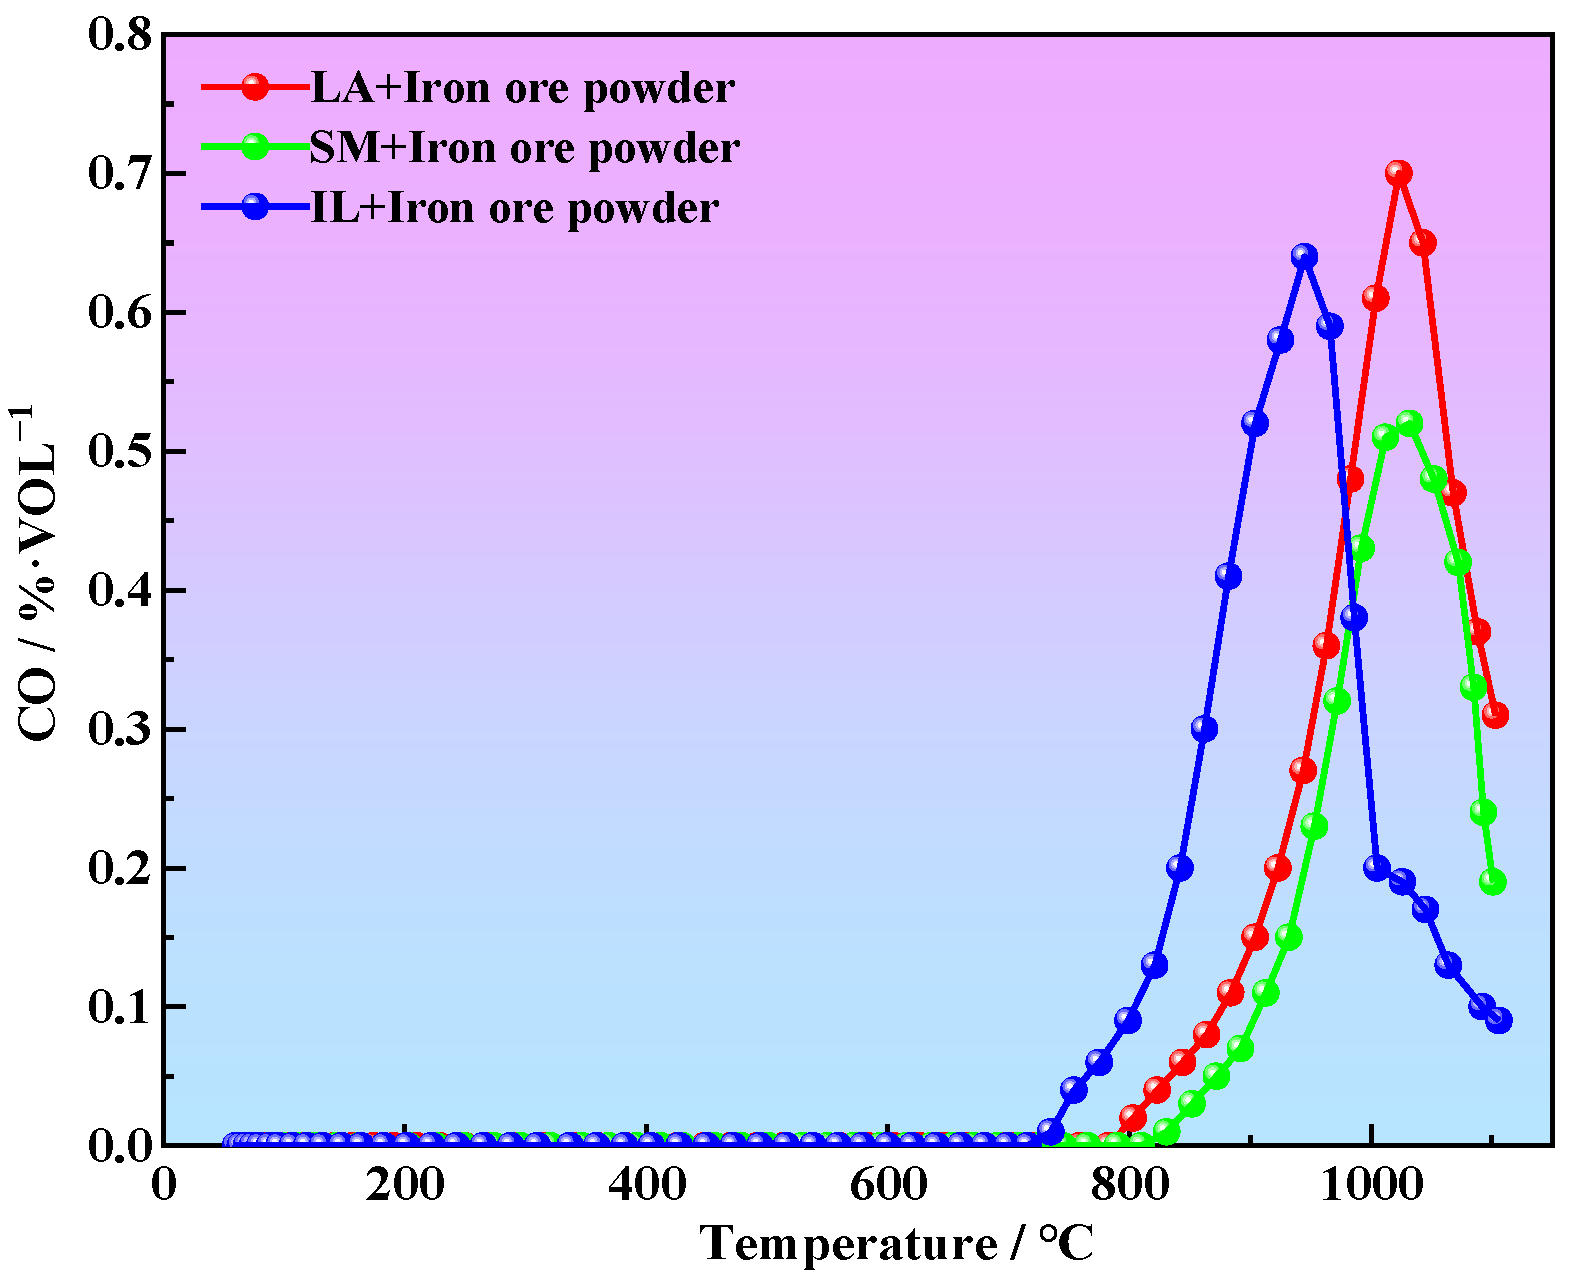
3.2. Determination of Reduction Temperature Range
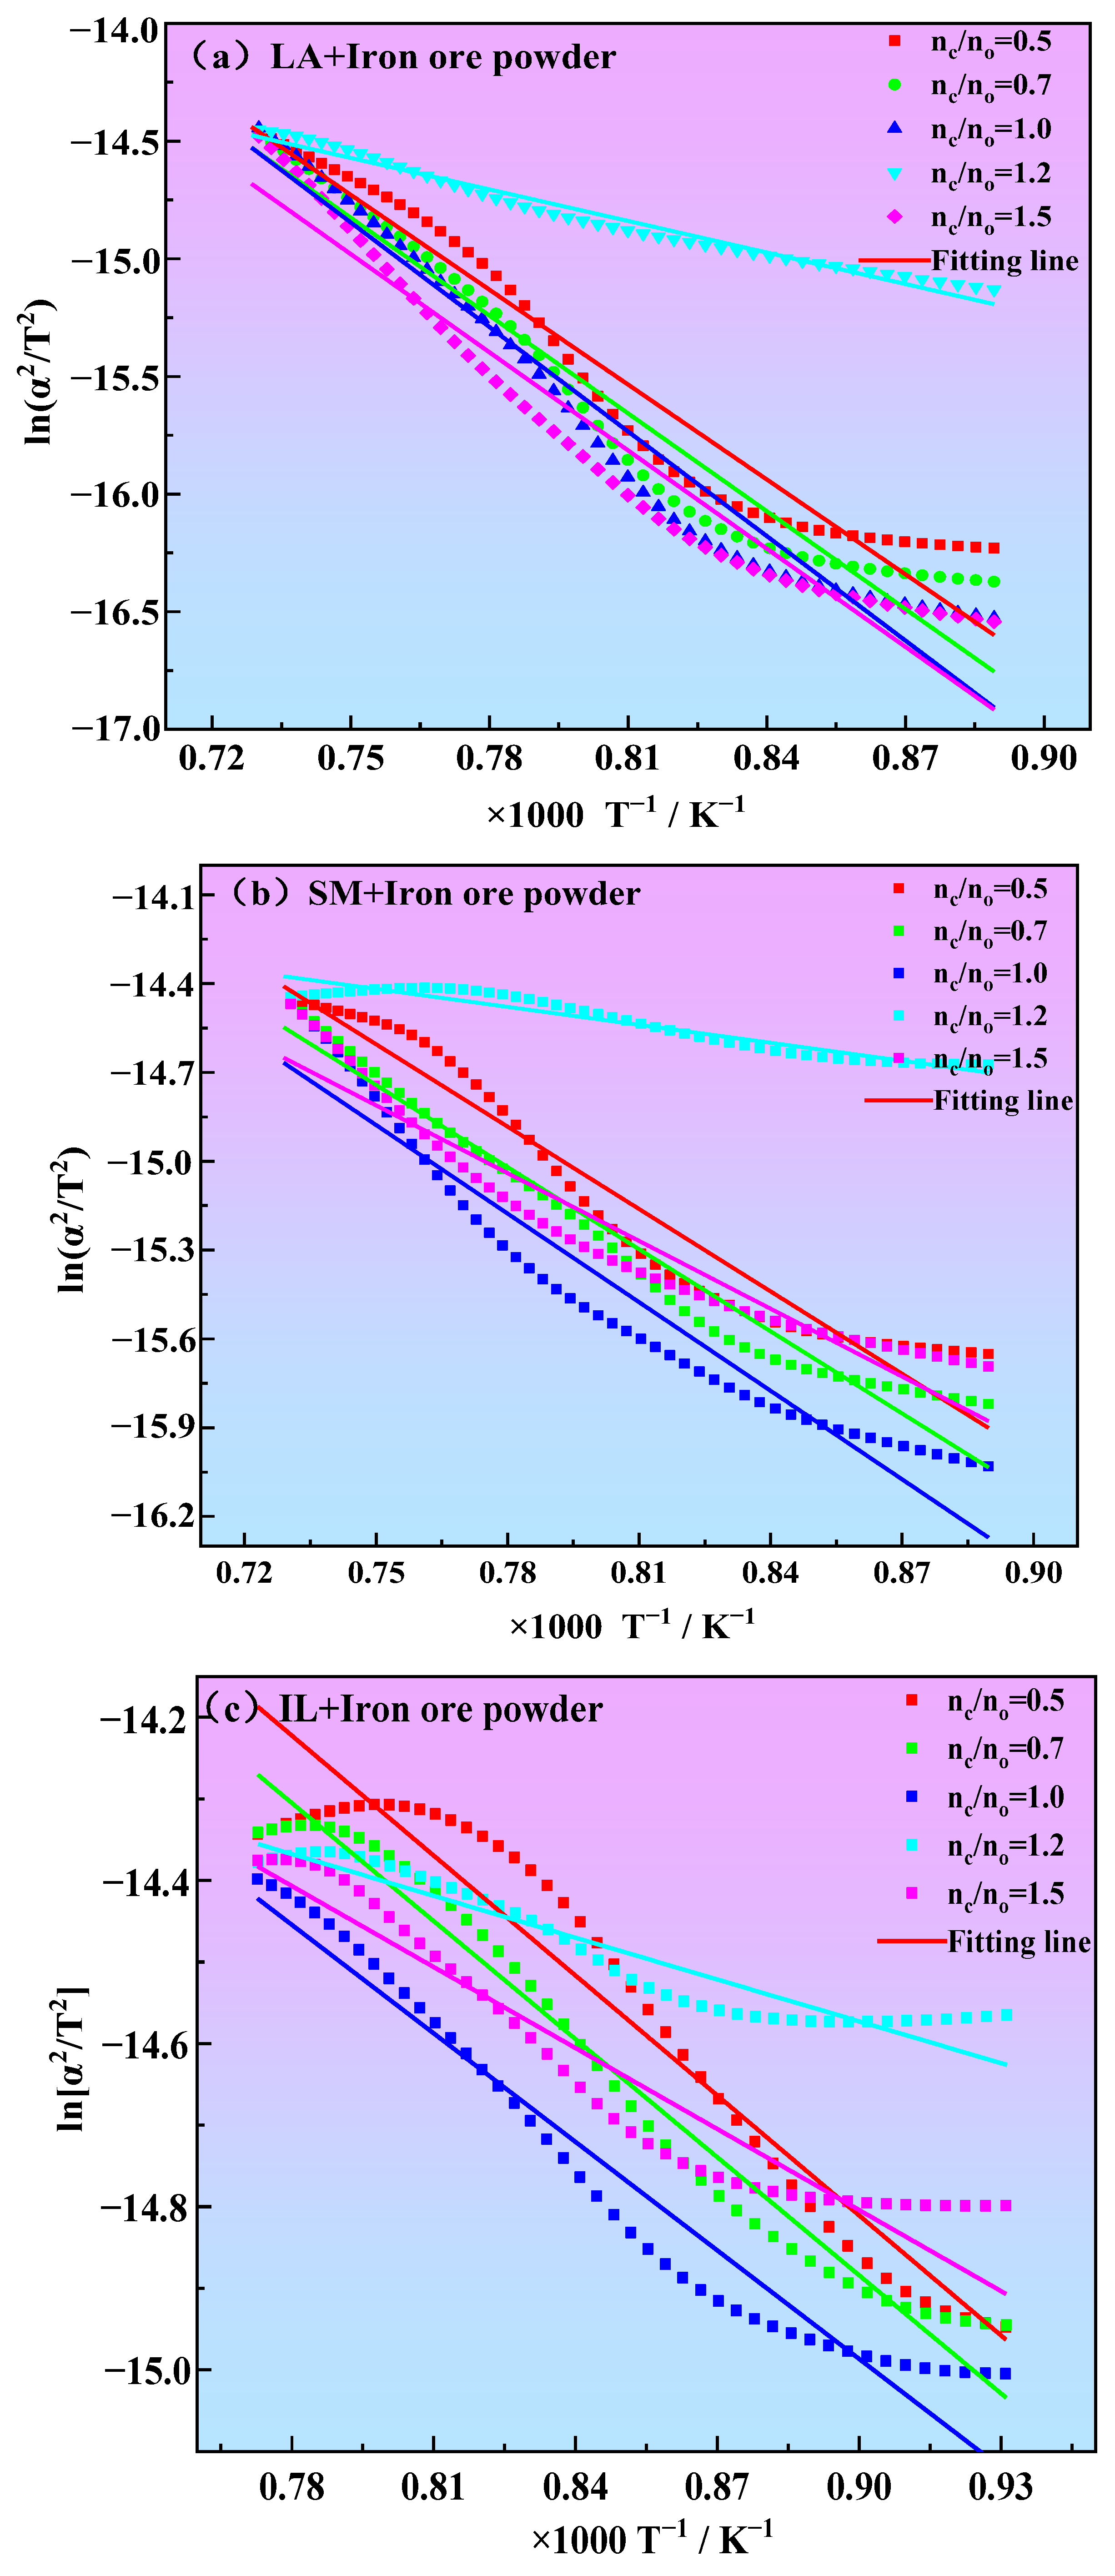
3.3. Kinetics of Iron Ore Powder Reduction
4. Conclusions
- (1)
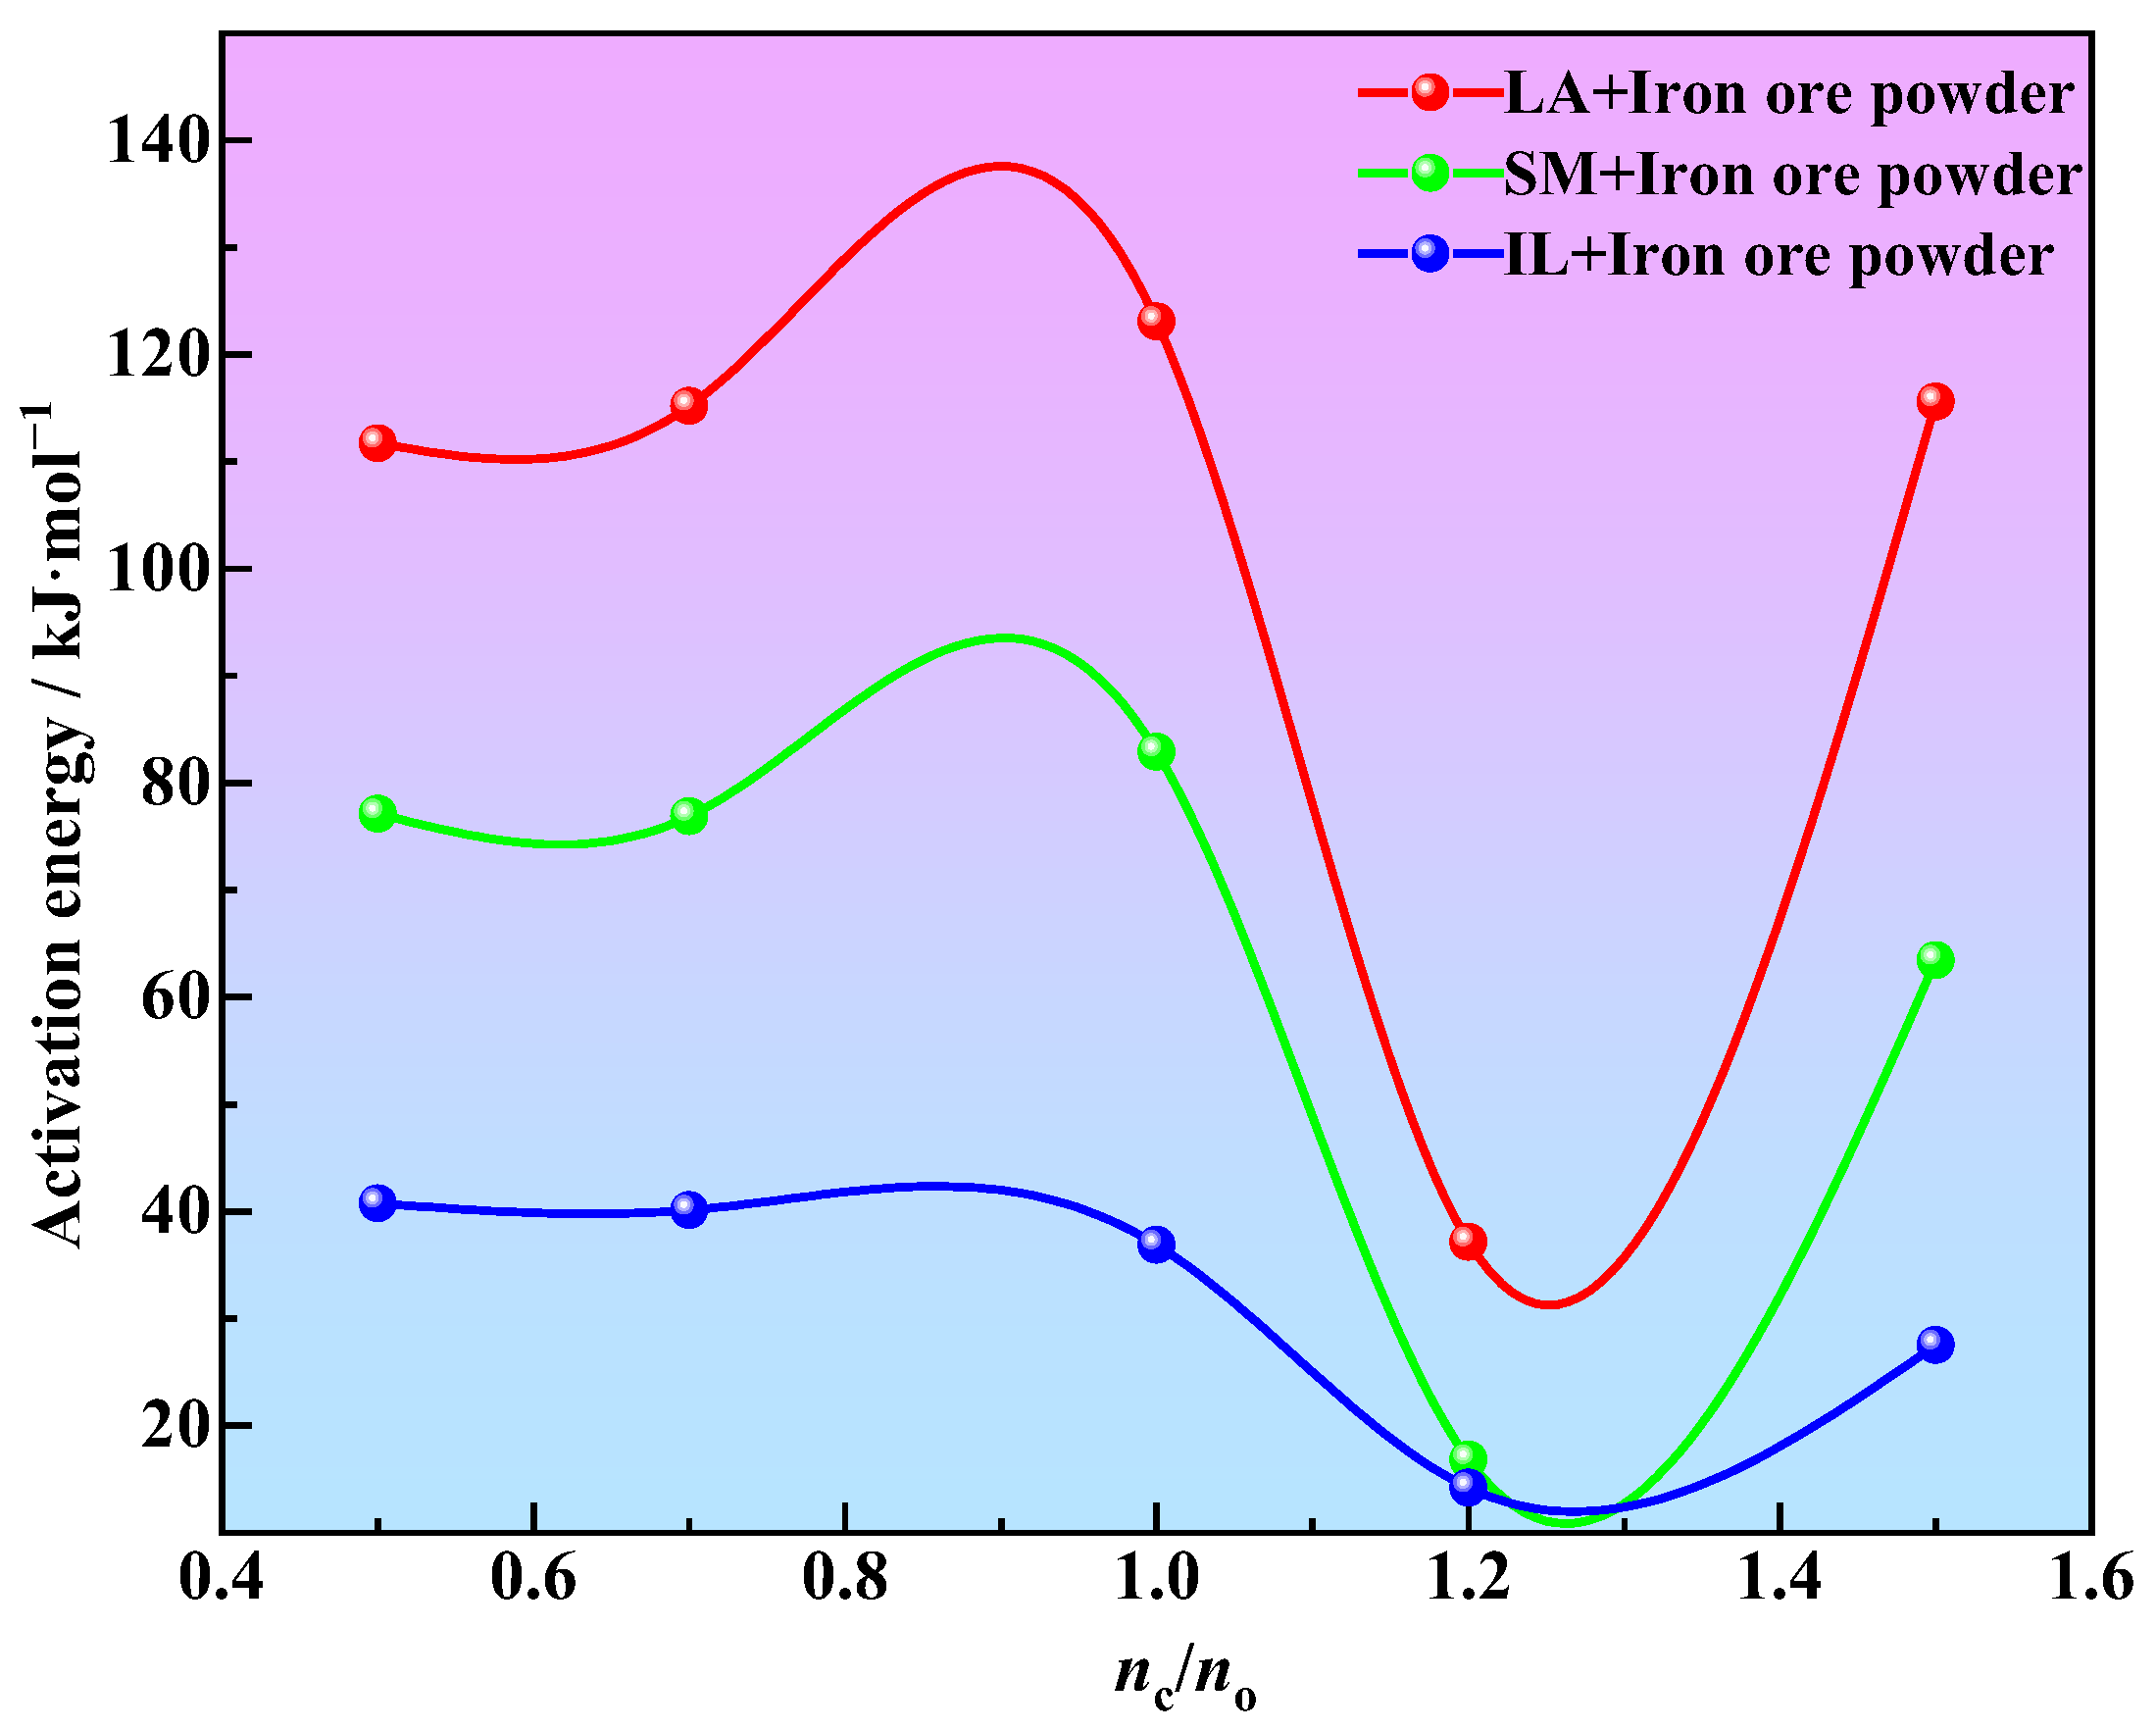
- Under the same carbon–oxygen molar ratio, the activation energy of iron ore powder reduction by pulverized coal (16.81~123.10 kJ·mol−1) is higher than that of industrial lignin (14.21~40.75 kJ·mol−1). Industrial lignin is expected to be used as a reducing agent in the ironmaking process. The process of iron ore powder reduction by industrial lignin and pulverized coal conforms to the one-dimensional Jander model, and the kinetic equation is .
- (2)
- According to the thermogravimetric curves of iron ore powder reduced by different reductants (LA, SM, and IL) and the change in CO content in the reduction process, the reduction temperature ranges of LA, SM, and IL reduced iron ore powder were determined to be 850~1100 °C, 850~1100 °C, and 800~1020 °C, respectively.
- (3)
- Under the condition of ensuring both sufficient reduction and reduction efficiency, the optimum carbon–oxygen molar ratio for the reduction of iron ore powder by industrial lignin is 1.2.
Author Contributions
Funding
Data Availability Statement
Conflicts of Interest
References
- World Steel Association. 2024 World Steel in Figures. Available online: https://worldsteel.org/wp-content/uploads/WSIF-2024_CN.pdf (accessed on 10 December 2024).
- Liu, Q.; Zhang, F. Research process of carbon reduction and CO2 resource technology utilization in iron and steel industry. Iron Steel 2024, 59, 13–24. [Google Scholar] [CrossRef]
- Zhu, D.; Li, X.; Pan, J.; Guo, Z.; Yang, C. Review of decarbonization pathways and progress for main iron ore mining companies. Iron Steel 2024, 59, 1–8. [Google Scholar] [CrossRef]
- Zhang, S.; Shao, J.; Lan, C.; Bi, Z.; Lv, Q. Application status and prospect of biomass energy in ironmaking process. Iron Steel 2022, 57, 13–22. [Google Scholar] [CrossRef]
- Zheng, W.; Xu, C.; Wei, R.; Qian, L.; Long, H.; Li, J. Injection of biochar into blast furnace: Progress and prospects. J. Iron Steel Res. 2021, 33, 1–8. [Google Scholar] [CrossRef]
- Luo, S.Y.; Ma, C.; Sun, P.P. Reduction behavior and reaction kinetics of iron ore-biomass composite pellets. Chin. J. Eng. 2015, 37, 150–156. [Google Scholar] [CrossRef]
- Srivastava, U.; Kawatra, S.K.; Eisele, T.C. Production of pig iron by utilizing biomass as a reducing agent. Int. J. Miner. Process. 2013, 119, 51–57. [Google Scholar] [CrossRef]
- Ueda, S.; Watanabe, K.; Yanagiya, K.; Inoue, R.; Ariyama, T. Improvement of Reactivity of Carbon Iron Ore Composite with Biomass Char for Blast Furnace. ISIJ Int. 2009, 49, 1505–1512. [Google Scholar] [CrossRef]
- Fu, J.-X.; Zhang, C.; Hwang, W.-S.; Liau, Y.-T.; Lin, Y.-T. Exploration of biomass char for CO2 reduction in RHF process for steel production. Int. J. Greenhouse Gas Control 2012, 8, 143–149. [Google Scholar] [CrossRef]
- Wang, T.Y.; Li, H.Y.; Diao, X.Y.; Lu, X.B.; Ma, D.G.; Ji, N. Lignin to dispersants, adsorbents, flocculants and adhesives: A critical review on industrial applications of lignin. Ind. Crops Prod. 2023, 199, 116715. [Google Scholar] [CrossRef]
- Wild, P.; Huijgen, W.; Gosselink, R. Lignin pyrolysis for profitable lignocellulosic biorefineries. Biofuels Bioprod. Biorefin. 2014, 8, 645–657. [Google Scholar] [CrossRef]
- Huang, C.; Peng, Z.; Li, J.; Li, X.; Jiang, X.; Dong, Y. Unlocking the role of lignin for preparing the lignin-based wood adhesive: A review. Ind. Crops Prod. 2022, 187, 115388. [Google Scholar] [CrossRef]
- Chakar, F.S.; Ragauskas, A.J. Review of current and future softwood kraft lignin process chemistry. Ind. Crops Prod. 2004, 20, 131–141. [Google Scholar] [CrossRef]
- Bouffard, S.C.; Tshilombo, A.; West-Sells, P.G. Use of lignosulfonate for elemental sulfur biooxidation and copper leaching. Miner. Eng. 2009, 22, 100–103. [Google Scholar] [CrossRef]
- Tribot, A.; Amer, G.; Abdou Alio, M.; de Baynast, H.; Delattre, C.; Pons, A.; Mathias, J.-D.; Callois, J.-M.; Vial, C.; Michaud, P.; et al. Wood-lignin: Supply, extraction processes and use as bio-based material. Eur. Polym. J. 2019, 112, 228–240. [Google Scholar] [CrossRef]
- Kazzaz, A.; Hosseinpour Feizi, Z.; Fatehi, P. Grafting strategies for hydroxy groups of lignin for producing materials. Green Chem. 2019, 21, 5714–5752. [Google Scholar] [CrossRef]
- Aro, T.; Fatehi, P. Production and Application of Lignosulfonates and Sulfonated Lignin. ChemSusChem 2017, 10, 1861–1877. [Google Scholar] [CrossRef] [PubMed]
- Feizi, Z.H.; Kazzaz, A.E.; Kong, F.; Fatehi, P. Evolving a flocculation process for isolating lignosulfonate from solution. Sep. Purif. Technol. 2019, 222, 254–263. [Google Scholar] [CrossRef]
- John, M.J.; Lefatle, M.C.; Sithole, B. Lignin fractionation and conversion to bio-based functional products. Sustain. Chem. Pharm. 2022, 25, 100594. [Google Scholar] [CrossRef]
- Sugiarto, S.; Leow, Y.; Tan, C.L.; Wang, G.; Kai, D. How far is Lignin from being a biomedical material? Bioact. Mater. 2021, 8, 71–94. [Google Scholar] [CrossRef]
- Gigli, M.; Crestini, C. Fractionation of industrial lignins: Opportunities and challenges. Green Chem. 2020, 22, 4722–4746. [Google Scholar] [CrossRef]
- Crestini, C.; Lange, H.; Sette, M.; Argyropoulos, D.S. On the structure of softwood kraft lignin. Green Chem. 2017, 19, 4104–4121. [Google Scholar] [CrossRef]
- Liao, J.; Latif, N.; Trache, D.; Brosse, N.; Hussin, M.H. Current advancement on the isolation, characterization and application of lignin. Int. J. Biol. Macromol. 2020, 162, 985–1024. [Google Scholar] [CrossRef]
- National Bureau of Statistics. Import and Export Volume of Major High Energy Consuming Products [DB/OL]. 2023. Available online: https://data.stats.gov.cn/easyquery.htm?cn=C01&zb=A0708&sj=2023 (accessed on 30 October 2024).
- China Paper Association. 2023 Annual Report of China’s Paper Industry [EB/OL]. 2024. Available online: http://www.chinappi.org/reps/20240506185450120665.html (accessed on 30 October 2024).
- Wang, C.; Zhu, R.; Wang, G. Feasibility analysis of biomass hydrochar injection for blast furnace. Iron Steel 2022, 57, 22–30. [Google Scholar] [CrossRef]
- He, Z. Chemical Modification of Technical Lignin from Different Sources and the Dispersion Performance in Pesticide WP and WG Formulation. Master’s Thesis, South China University of Technology, Guangzhou, China, 2015. Available online: https://kns.cnki.net/kcms2/article/abstract?v=E03vRC1N_I-1hslWu6ypI3i3NGKXBAn_4BT6N6Pw--yW55tW7JKQxiX7lhkcsaSKYeKSTB0rBxV-CG2PyiZBK4iszjrPBIiEMDRcGimg1ce2vWno6_Sl7VwiqokyjQLz_W6bAzYLeIeDhKZU_cVfXJ-2gGDVjVNE-s3WQcoiXIgYK-td5BKZAc6I4kvTmxwz70a4zeinYdY=&uniplatform=NZKPT&language=CHS%WCNKI (accessed on 10 December 2024).
- Don, D.M.; Fabritius, T.; Omran, M. The Reduction Reaction Behavior of Steelmaking Dusts with Lignin under Different Atmospheres. Materials 2024, 17, 3106. [Google Scholar] [CrossRef] [PubMed]
- Wang, W.-L.; Ren, X.-Y.; Li, L.-F.; Chang, J.-M.; Cai, L.-P.; Geng, J. Catalytic effect of metal chlorides on analytical pyrolysis of alkali lignin. Fuel Process. Technol. 2015, 134, 345–351. [Google Scholar] [CrossRef]
- Sameni, J.; Krigstin, S.; Sain, M. Characterization of Lignins Isolated from Industrial Residues and their Beneficial Uses. Bioresources 2016, 11, 8435–8456. [Google Scholar] [CrossRef]
- Wei, R.; Xiang, D.; Long, H.; Xu, C.; Li, J. Reduction of iron oxide by lignin: Characteristics, kinetics and superiority. Energy 2020, 197, 117203. [Google Scholar] [CrossRef]
- Wei, R.; Feng, S.; Long, H.; Li, J.; Yuan, Z.; Cang, D.; Xu, C. Coupled biomass (lignin) gasification and iron ore reduction: A novel approach for biomass conversion and application. Energy 2017, 140, 406–414. [Google Scholar] [CrossRef]
- Coats, A.W.; Redfern, J.P. Kinetic Parameters from Thermogravimetric Data. Nature 1964, 201, 68–69. [Google Scholar] [CrossRef]
- Xiang, D.; Shen, F.; Jiang, X.; An, H.; Zheng, H.; Gao, Q. Pyrolysis Characteristics of Industrial Lignin for Use as a Reductant and an Energy Source for Future Iron Making. ACS Omega 2021, 6, 3578–3586. [Google Scholar] [CrossRef]
- Abdullah, H.; Wu, H. Biochar as a Fuel: 1. Properties and Grindability of Biochars Produced from the Pyrolysis of Mallee Wood under Slow-Heating Conditions. Energy Fuels 2009, 23, 4174–4181. [Google Scholar] [CrossRef]
- Yaman, S. Pyrolysis of biomass to produce fuels and chemical feedstocks. Energy Convers. Manag. 2004, 45, 651–671. [Google Scholar] [CrossRef]
- Meng, K.; Wei, R.; Xu, C. Application Status and Prospect of Biomass in Steel Metallurgy. J. Anhui Univ. Technol. 2023, 40, 250–260. [Google Scholar] [CrossRef]
- Yang, H. Study on the Pyrolysis of Oil-Brown Waste and Its Mechanism. Doctoral Thesis, Huazhong University of Science and Technology, Wuhan, China, 2005. [Google Scholar] [CrossRef]
- Wang, T.; Chang, J.; Lv, P.; Zhu, J. Novel Catalyst for Cracking of Biomass Tar. Energy Fuels 2005, 19, 22–27. [Google Scholar] [CrossRef]
- Hassan, H.; Lim, J.K.; Hameed, B.H. Recent progress on biomass co-pyrolysis conversion into high-quality bio-oil. Bioresour. Technol. 2016, 221, 645–655. [Google Scholar] [CrossRef]
- Hu, H.; Zhou, Q.; Zhu, S.; Meyer, B.; Krzack, S.; Chen, G. Product distribution and sulfur behavior in coal pyrolysis. Fuel Process. Technol. 2004, 85, 849–861. [Google Scholar] [CrossRef]

| Types of Industrial Lignin | C (%) | H (%) | O (%) | N (%) | S (%) |
|---|---|---|---|---|---|
| wheat straw alkaline lignin [27] | 54.75 | 5.407 | 35.35 | 3.75 | 0.743 |
| pine alkali lignin [27] | 65.36 | 5.836 | 25.928 | 0.08 | 2.796 |
| enzymatic hydrolysis lignin [27] | 56.06 | 5.599 | 36.939 | 1.15 | 0.252 |
| hydrolysis lignin [28] | 61 | 6.1 | 31.9 | 0.69 | 0.12 |
| alkali lignin [29] | 62.40 ± 0.14 | 6.14 ± 0.00 | 29.43 ± 0.23 | 0.26 ± 0.03 | 1.77 ± 0.06 |
| lignin (isolated from lignocellulosic bioethanol residues) [30] | 62.36 | 5.89 | 31.22 | 0.49 | 0.03 |
| lignin (isolated from hardwood kraft black liquor) [30] | 59.51 | 5.79 | 32.03 | 0.13 | 2.54 |
| kraft softwood lignin [30] | 66.10 | 6.37 | 25.30 | 0.67 | 1.57 |
| soda non-wood lignin [30] | 65.41 | 6.53 | 27.09 | 0.59 | 0.38 |
| Samples | Proximate Analysis (ad.) | Elemental Analysis (ad.) | |||||||
|---|---|---|---|---|---|---|---|---|---|
| Fixed Carbon | Ash | Volatile | Moisture | C | H | O | N | S | |
| IL | 18.01 | 12.32 | 57.82 | 11.85 | 32.57 | 4.86 | 42.42 | 0.45 | 9.39 |
| LA | 75.90 | 10.01 | 13.38 | 0.71 | 82.00 | 3.41 | 8.50 | 1.79 | 0.20 |
| SM | 62.41 | 7.46 | 28.28 | 1.85 | 75.90 | 4.14 | 16.50 | 1.38 | 0.63 |
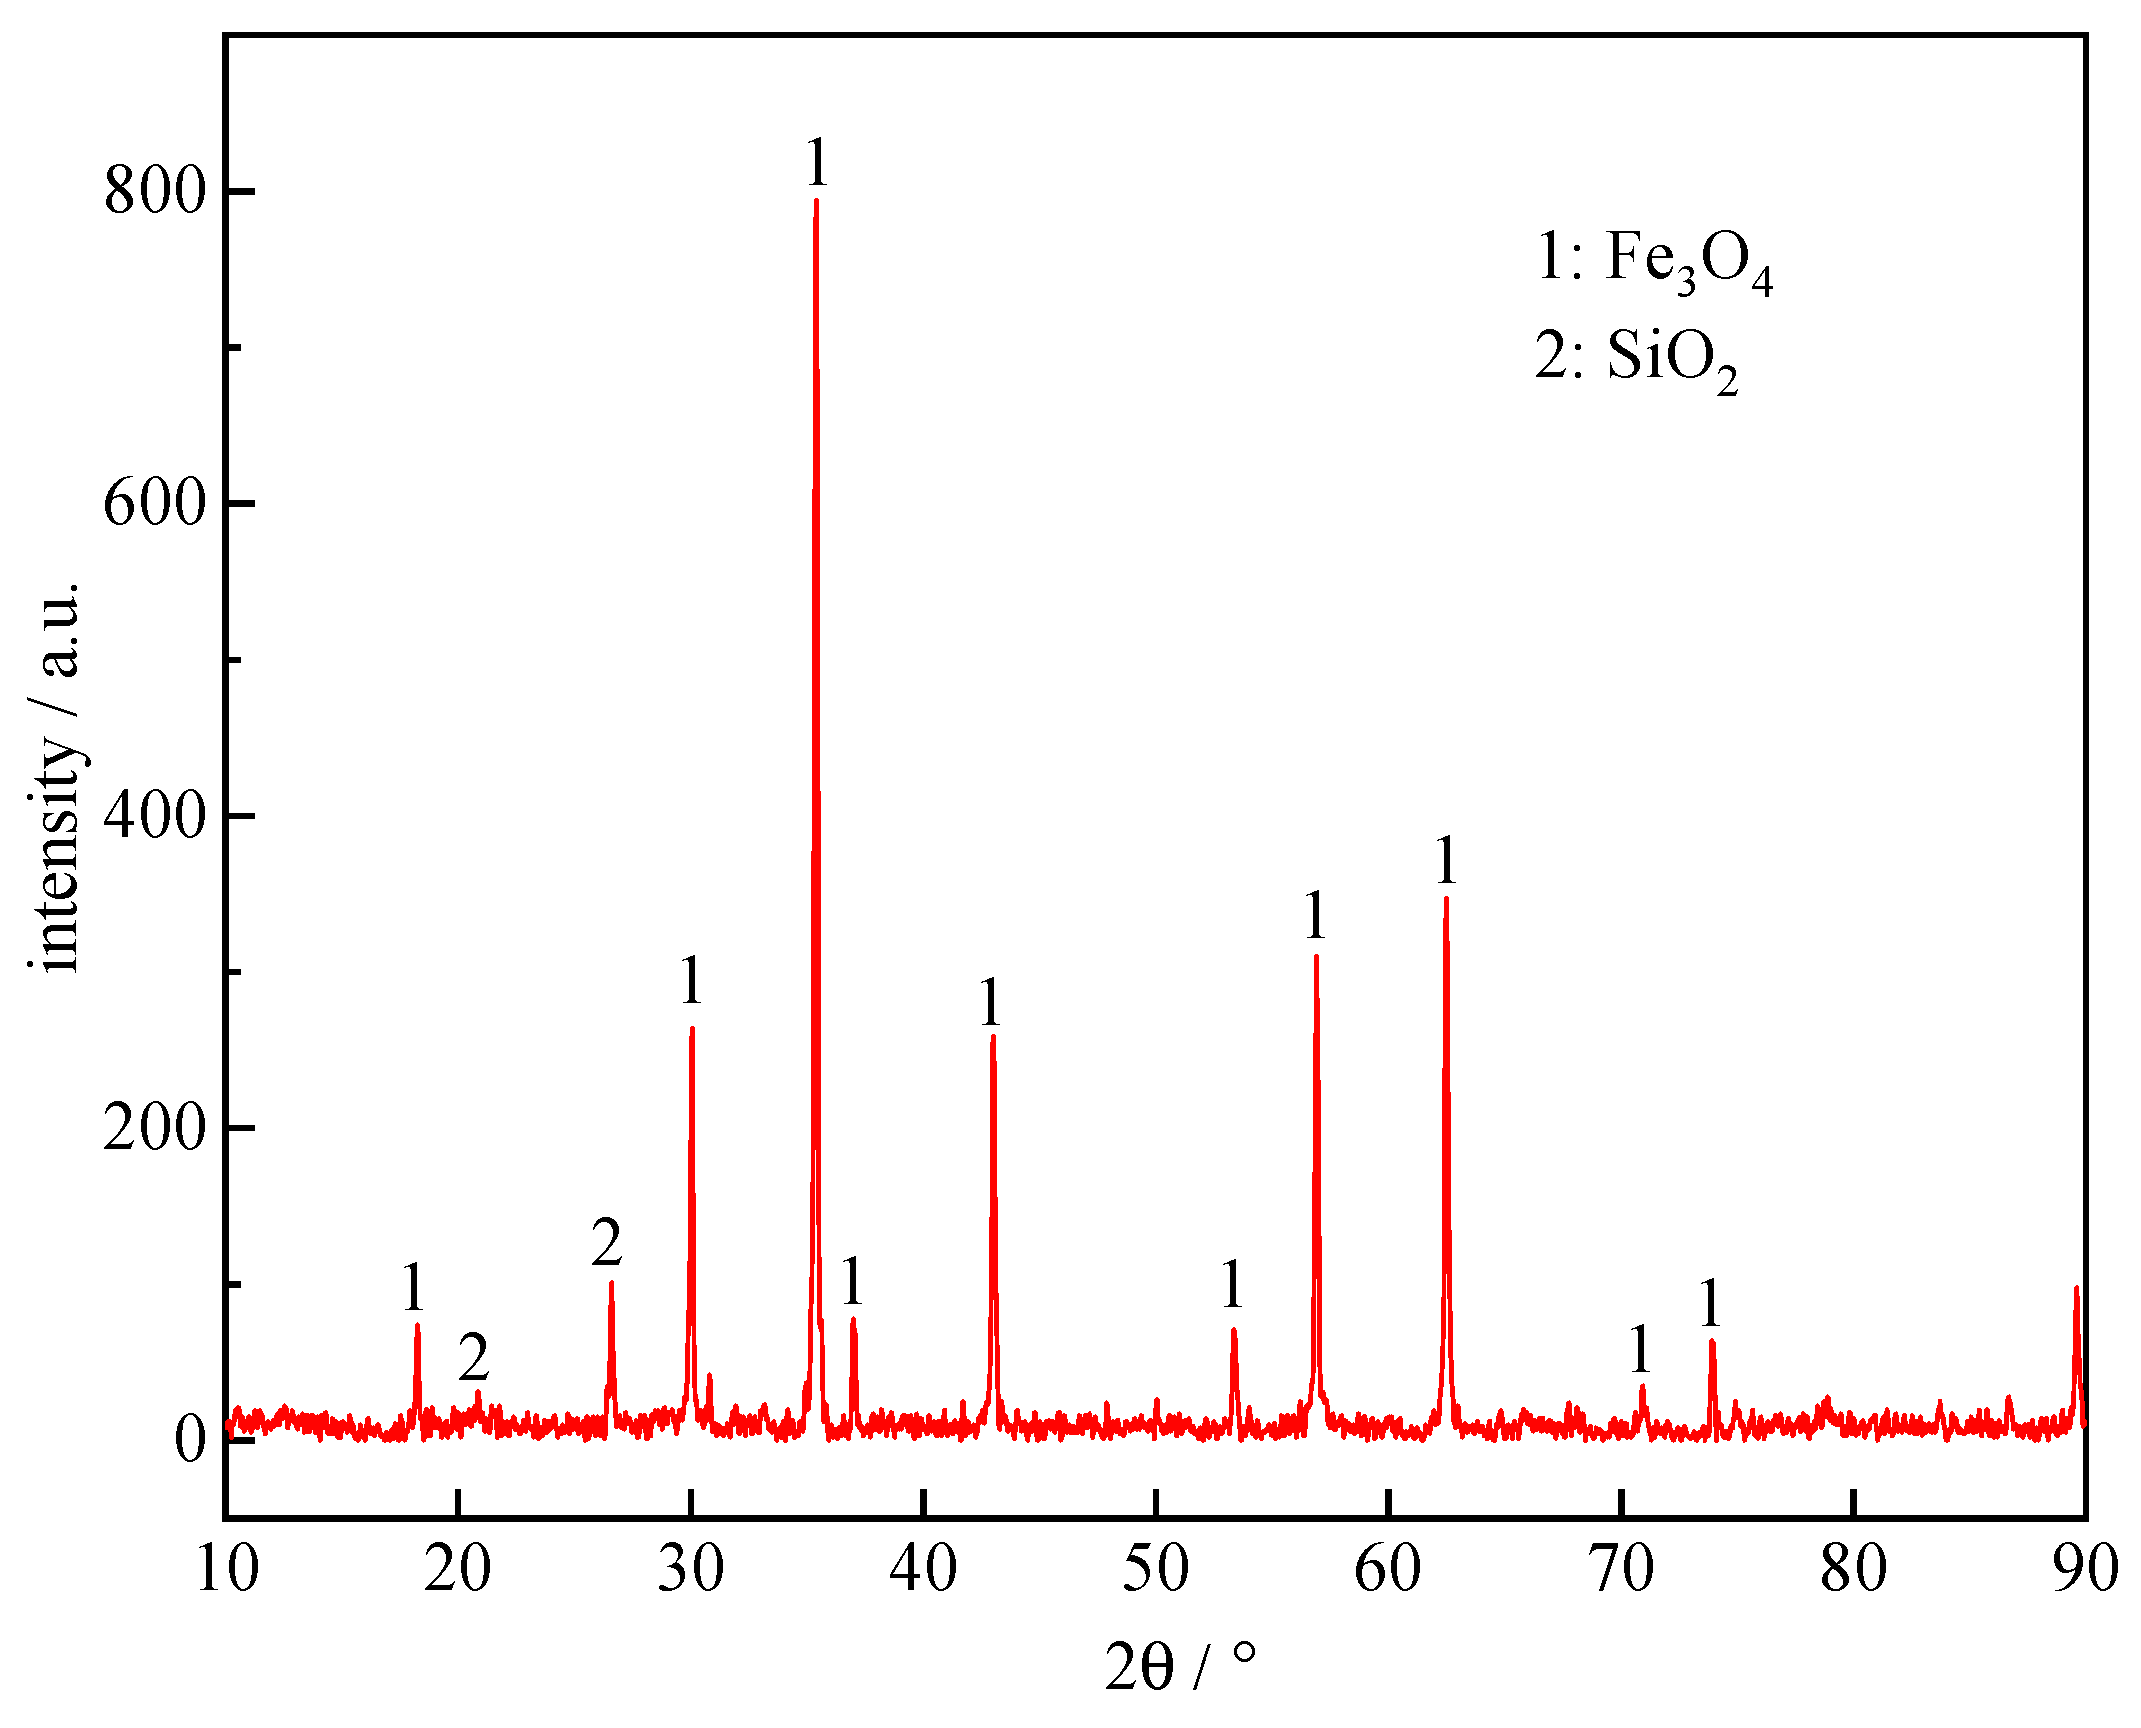
| TFe | FeO | SiO2 | CaO | Al2O3 | MgO | Others |
|---|---|---|---|---|---|---|
| 68.04 | 24.88 | 5.50 | 0.14 | 0.28 | 0.36 | 0.8 |
| Samples | Reduction Temperature Range (°C) |
|---|---|
| LA + Iron ore powder (nc:no = 0.5, 0.7, 1.0, 1.2, 1.5) | 850~1100 |
| SM + Iron ore powder (nc:no = 0.5, 0.7, 1.0, 1.2, 1.5) | 850~1100 |
| IL + Iron ore powder (nc:no = 0.5, 0.7, 1.0, 1.2, 1.5) | 800~1020 |
| Shorthand | Reaction Model | Integral Formula G(α) | Differential Formula f(α) |
|---|---|---|---|
| Nucleation models | |||
| P1 | Mampel power | α | 1 |
| P2 | Mampel power | α1/2 | 2α1/2 |
| P3 | Mampel power | α1/3 | 3α2/3 |
| P4 | Mampel power | α1/4 | 4α3/4 |
| A1 | Avaramie Erofeev | [−ln(1 − α)]3/2 | |
| A2 | Avaramie Erofeev | [−ln(1 − α)]2 | |
| A3 | Avaramie Erofeev | [−ln(1 − α)]3 | |
| A4 | Avaramie Erofeev | [−ln(1 − α)]4 | |
| Chemical reaction | |||
| F1 | First order | −ln(1 − α) | 1 − α |
| F2 | Second order | (1 − α)−1 − 1 | (1 − α)2 |
| F3 | Third order | [(1 − α)−2 − 1]/2 | (1 − α)3 |
| Geometrical contractions | |||
| R2 | Contracting area | 1 − (1 − α)1/2 | 2(1 − α)1/2 |
| R3 | Contracting volume | 1 − (1 − α)1/3 | 3(1 − α)2/3 |
| Jandere quation | |||
| D1 | One-dimensional | α2 | |
| D2 | Two-dimensional | [1 − (1 − α)1/2]1/2 | |
| D3 | Three-dimensional | [1 − (1 − α)1/3]1/2 |
| Reduction Temperature Range (°C) | nc/no | Fitting Formula | Activation Energy (kJ·mol−1) | Correlation Coefficient |
|---|---|---|---|---|
| 850~1100 | 0.5 | y = −13438.68x − 4.65 | 111.73 | 0.9495 |
| 850~1100 | 0.7 | y = −13857.81x − 4.43 | 115.21 | 0.9521 |
| 850~1100 | 1.0 | y = −14806.28x − 3.74 | 123.10 | 0.9579 |
| 850~1100 | 1.2 | y = −4465.76x − 11.22 | 37.13 | 0.9768 |
| 850~1100 | 1.5 | y = −13906.33x − 4.55 | 115.62 | 0.9446 |
| Reduction Temperature Range (°C) | nc/no | Fitting Formula | Activation Energy (kJ·mol−1) | Correlation Coefficient |
|---|---|---|---|---|
| 850~1100 | 0.5 | y = −9275.81x − 7.65 | 77.12 | 0.9453 |
| 850~1100 | 0.7 | y = −9246.24x − 7.81 | 76.87 | 0.9675 |
| 850~1100 | 1.0 | y = −9972.79x − 7.40 | 82.91 | 0.9360 |
| 850~1100 | 1.2 | y = −2022.47x − 12.90 | 16.81 | 0.9232 |
| 850~1100 | 1.5 | y = −7633.14x − 9.09 | 63.46 | 0.9297 |
| Reduction Temperature Range (°C) | nc/no | Fitting Formula | Activation Energy (kJ·mol−1) | Correlation Coefficient |
|---|---|---|---|---|
| 800~1020 | 0.5 | y = −4901.83x − 10.40 | 40.75 | 0.9373 |
| 800~1020 | 0.7 | y = −4824.54x − 10.54 | 40.11 | 0.9760 |
| 800~1020 | 1.0 | y = −4434.55x − 11.00 | 36.87 | 0.9546 |
| 800~1020 | 1.2 | y = −1709.18x − 13.03 | 14.21 | 0.9105 |
| 800~1020 | 1.5 | y = −3310.17x − 11.82 | 27.52 | 0.9203 |
Disclaimer/Publisher’s Note: The statements, opinions and data contained in all publications are solely those of the individual author(s) and contributor(s) and not of MDPI and/or the editor(s). MDPI and/or the editor(s) disclaim responsibility for any injury to people or property resulting from any ideas, methods, instructions or products referred to in the content. |
© 2025 by the authors. Licensee MDPI, Basel, Switzerland. This article is an open access article distributed under the terms and conditions of the Creative Commons Attribution (CC BY) license (https://creativecommons.org/licenses/by/4.0/).
Share and Cite
Zhou, W.; Xiang, D.; Zhang, Q.; Wu, G.; Wang, Y.; Li, D.; Zhang, Q.; Hu, H. Kinetics of Reduction of Iron Ore Powder by Industrial Lignin from Pulping and Papermaking Waste Biomass Energy. Crystals 2025, 15, 193. https://doi.org/10.3390/cryst15020193
Zhou W, Xiang D, Zhang Q, Wu G, Wang Y, Li D, Zhang Q, Hu H. Kinetics of Reduction of Iron Ore Powder by Industrial Lignin from Pulping and Papermaking Waste Biomass Energy. Crystals. 2025; 15(2):193. https://doi.org/10.3390/cryst15020193
Chicago/Turabian StyleZhou, Wendi, Dongwen Xiang, Qiang Zhang, Guoqing Wu, Yajie Wang, Dong Li, Qinghua Zhang, and Huaxin Hu. 2025. "Kinetics of Reduction of Iron Ore Powder by Industrial Lignin from Pulping and Papermaking Waste Biomass Energy" Crystals 15, no. 2: 193. https://doi.org/10.3390/cryst15020193
APA StyleZhou, W., Xiang, D., Zhang, Q., Wu, G., Wang, Y., Li, D., Zhang, Q., & Hu, H. (2025). Kinetics of Reduction of Iron Ore Powder by Industrial Lignin from Pulping and Papermaking Waste Biomass Energy. Crystals, 15(2), 193. https://doi.org/10.3390/cryst15020193