Review

Recent Developments in Transmission Electron Microscopy for Crystallographic Characterization of Strained Semiconductor Heterostructures

1
College of Electrical Engineering, Southwest Minzu University, State Ethnic Affairs Commission, Chengdu 610041, China
2
Key Laboratory of Radiation Physics and Technology of Ministry of Education, Institute of Nuclear Science and Technology, Sichuan University, Chengdu 610064, China
3
College of Electronics and Information, Southwest Minzu University, State Ethnic Affairs Commission, Chengdu 610041, China
4
Pico Center, SUSTech Core Research Facilities, Southern University of Science and Technology, Shenzhen 518055, China
5
Department of Electronic and Electrical Eng., University College London, London WC1E 7JE, UK
6
School of Electrical & Electronic Engineering, University of Sheffield, Mappin St., Sheffield S1 3JD, UK
*
Authors to whom correspondence should be addressed.
Crystals 2025, 15(2), 192; https://doi.org/10.3390/cryst15020192
Submission received: 30 December 2024 / Revised: 7 February 2025 / Accepted: 13 February 2025 / Published: 17 February 2025
(This article belongs to the Section Inorganic Crystalline Materials)

Abstract

:
With recent electronic devices relying on sub-nanometer features, the understanding of device performance requires a direct probe of the atomic arrangement. As an ideal tool for crystallographic analysis at the nanoscale, aberration-corrected transmission electron microscopy (ACTEM) has the ability to provide atomically resolved images and core-loss spectra. Herein, the techniques for crystallographic structure analysis based on ACTEM are reviewed and discussed, particularly ACTEM techniques for measuring strain, dislocations, phase transition, and lattice in-plane misorientation. In situ observations of crystal evolution during the application of external forces or electrical fields are also introduced, so a correlation between crystal quality and device performance can be obtained.

1. Introduction

Semiconductor materials such as silicon (Si), silicon–germanium (SiGe), gallium arsenide (GaAs), and indium arsenide (InAs) serve as foundational building blocks in the fabrication of nanoscale electronic devices. These materials exhibit exceptional electronic properties, including the compatibility and strain-engineering potential of Si and SiGe, as well as the high electron mobility and direct bandgap characteristics of GaAs and InAs. These attributes enable their widespread application in high-performance logic circuits, high-speed electronic devices, and optoelectronic systems [1,2,3]. These attributes make semiconductors indispensable for a range of advanced applications [4], from high-speed transistors to quantum well lasers and infrared detectors. However, achieving high-performance optoelectronic devices using semiconductors requires navigating complex fabrication processes that can introduce structural imperfections. Initially, the basic multilayer structure is grown using Metal–Organic Chemical Vapor Deposition (MOCVD) or Molecular Beam Epitaxy (MBE), which are a growth technique rather than a fabrication step [5]. Following this, the fabrication process includes etching, doping, and other critical steps of lateral structuring before wafer dicing. Doping typically occurs during epitaxial growth, introducing strain fields that can impact device performance [6]. Alternatively, ion implantation, another doping method, can generate interstitial and vacancy clusters that alleviate strain but may also increase dislocation density [7]. Additionally, oxidation, an essential process for surface passivation, often leads to interfacial defects, further promoting dislocation formation [8]. These complex fabrication processes are indispensable for realizing high-performance optoelectronic devices. Yet, they frequently introduce defects that degrade device performance, reduce efficiency, and shorten operational lifetimes [9].
In the field of materials science, strain is often described using the concepts of engineering stress and engineering strain. Engineering stress refers to the applied load per initial cross-sectional area of a material, while engineering strain measures the relative change in length of a material under an applied load. These terms are widely used in describing macroscopic deformation behavior under external forces. Strain in semiconductors, such as GaAs and InAs, typically arises from the lattice mismatch between the epitaxial layer and the substrate. The lattice constant of GaAs is 5.653 Å at room temperature, while that of InAs is 6.058 Å. The growth of InAs on GaAs buffer layers could lead to a 7.2% biaxial strain [10]. This strain can lead to two primary outcomes: if the epitaxial layer’s thickness remains below the critical thickness, the strain is elastically accommodated; however, once the critical thickness is exceeded, strain relaxation occurs, often through the formation of dislocations. This process typically follows the Stranski–Krastanow (SK) growth mode, where a uniform wetting layer first forms on the substrate surface, followed by the nucleation of island structures on the wetting layer due to lateral indium segregation [11]. As the island structures further grow, the accumulation of strain promotes the formation of dislocations at the edges of these islands, thereby facilitating additional strain relaxation [12]. These dislocations often act as recombination centers for trapping carriers, thereby reducing the efficiency of electronic and optoelectronic devices [13]. In Si/SiGe systems, strain relaxation primarily occurs through the formation of misfit dislocations once the critical thickness is exceeded. Unlike the Stranski–Krastanow growth mode observed in III-V semiconductors, Si/SiGe systems typically exhibit a two-dimensional layer-by-layer growth during the initial stages, followed by strain-induced dislocation formation at the interface [14]. To address these challenges, studies have explored defect filter layers to mitigate dislocation density in strained-layer superlattices [15]. Advanced techniques, such as high-resolution TEM, further reveal how misfit dislocations accommodate strain at the atomic scale [16]. Thermodynamic studies support that strain relaxation through dislocation formation is essential for maintaining the structural integrity of semiconductor devices [17].
Consequently, the understanding of the local crystallography of semiconductors is crucial for preventing or optimizing the formation of dislocations, which benefits the improvement of the reliability and performance of the devices. In this context, transmission electron microscopy (TEM) has emerged as a powerful and indispensable tool for crystallographic characterization. TEM offers atomic resolution, allowing researchers to obtain crystallographic information at the sub-nanometer scale, such as the identification of strain, dislocations, phase transitions, and lattice in-plane misorientation [18,19]. When compared to traditional characterization techniques, such as X-ray diffraction (XRD) [20] or atomic force microscopy (AFM) [21], TEM provides unparalleled spatial resolution and the ability to directly visualize atomic-scale defects and their impact on material properties. Over the past decade, TEM has achieved significant advancements, substantially enhancing its capabilities. The advent of aberration-corrected high-resolution scanning TEM (HRSTEM) [22] has driven spatial resolution down to nearly 50 picometers, enabling the direct imaging of atomic arrangements and dislocation cores with unparalleled precision. Concurrently, high-angle annular dark field (HAADF) imaging provides Z-contrast [23], facilitating the detection of subtle variations in elemental composition at heterointerfaces, which are crucial for optimizing semiconductor device performance [24]. In semiconductor applications, differential phase contrast imaging and energy-dispersive spectroscopy are used in combination with STEM for the structural and chemical analysis of nanostructures, offering enhanced visualization of complex device geometries [25]. Additionally, TEM is not confined to static imaging, and in situ TEM methods allow for real-time analysis of nanostructure growth dynamics, providing insights into strain relaxation and defect formation during growth processes [26]. In situ TEM techniques [27] have been developed to monitor crystal evolution in real time under various external conditions, such as the application of thermal, mechanical, or electrical fields [28,29]. These in situ observations are critical for understanding how external forces impact crystal quality during actual device operation. By directly visualizing the response of crystal structures to external stimuli, researchers can establish a physical correlation between crystal quality and external forces or electrical fields. This is particularly valuable when contrasted with other non-TEM-based in situ techniques, such as Raman spectroscopy or electrical measurements, which often lack spatial resolution and direct correlation between structural and electrical properties [30]. Understanding these correlations is essential for replicating real operating conditions and optimizing material processing techniques to mitigate degradation effects. In situ TEM techniques can reveal how strain fields or electric fields influence dislocation dynamics or phase transitions, providing insights for enhancing device stability and performance under operational stress [31,32,33,34,35].

2. Characterization Methods in TEM

The existing techniques in TEM for crystallographic analysis can be divided into the following three main categories:
1. Electron diffraction techniques: (a) Selected Area Electron Diffraction (SAED) [36], (b) Convergent Beam Electron Diffraction (CBED) [36,37], (c) Nanobeam Electron Diffraction (NBD) [38], and (d) Precession Electron Diffraction (PED) [39,40] are fundamental for determining crystal symmetry, lattice parameters, and strain distribution in materials. SAED is widely used for obtaining diffraction patterns from specific areas of a sample, while CBED offers high spatial resolution, enabling precise measurements of strain and crystal symmetry. NBD provides a focused, localized approach to crystallographic analysis, particularly useful for nanoscale structures, and PED improves measurement accuracy by reducing multiple scattering effects, making it indispensable for complex material systems.
2. Defect visualization and imaging techniques: (a) Weak Beam Dark Field (WBDF) [41] imaging and (b) imaging under Two-Beam Conditions (TBC) improve defect visibility by selecting diffracted beams with optimum excitation error, allowing for high-resolution analysis of defect structures. (c) High-angle annular dark field (HAADF) [42] imaging provides Z-contrast, which reveals heavy atoms in atomic-scale defects and compositional variations, while (d) bright-field (BF) and dark-field (DF) imaging [43,44] use transmitted and diffracted electrons, respectively, to highlight crystal defects such as dislocations and stacking faults.
3. Multidimensional data acquisition and phase contrast techniques: (a) 4D-scanning transmission electron microscopy (4D-STEM) [45] and (b) differential phase contrast (DPC) [46] acquire diffraction patterns or parts thereof at each probe position, providing nanoscale insights into the physical properties of materials. (c) Ptychography retrieves phase and amplitude information by scanning overlapping regions in a series of diffractive images and reconstructing high-resolution 2D and 3D images. (d) Tomography [47] reconstructs 3D structures from a series of 2D projection images, offering a detailed view of internal geometries such as nanoparticle distributions and pore structures. Finally, (e) electron holography [48] reconstructs the phase of the electron wavefront from measured interference patterns, enabling the direct measurement of internal electric and magnetic fields, making it particularly valuable for studying electromagnetic properties within materials.

2.1. Electron Diffraction Techniques

Electron diffraction techniques in TEM are fundamental tools used to investigate the crystallographic structure of materials. These techniques are indispensable for obtaining detailed information about lattice parameters, crystal symmetry, and strain distribution, which are crucial for understanding and optimizing the properties of materials and are also applied in the semiconductor industry. The primary electron diffraction methods employed in TEM-SAED, CBED, NBD in scanning transmission electron microscopy (STEM), and PED each operate on distinct principles but are related, collectively providing a comprehensive understanding of materials properties. SAED (Figure 1a) is widely utilized for obtaining diffraction patterns from regions selected by an aperture in the conjugated image plane, enabling the analysis of crystal orientation [49] and lattice structure refinement of crystallites down to a few 10 nm in size [50]. CBED (Figure 1c), with its high spatial resolution, is valuable in measuring strain and crystal symmetry precisely, particularly in semiconductor materials [51]. NBD (Figure 1b) allows for targeted, localized diffraction analysis, ideal for nanoscale structures such as strained Si layers [52]. PED, by reducing multiple scattering, enhances measurement accuracy and is particularly useful in complex crystal systems [53].

2.1.1. Selected Area Electron Diffraction

SAED is a diffraction technique in TEM, which is widely used for crystallographic analysis of local regions [54]. To understand how SAED functions, it is essential to first consider the basic diffraction theory. In SAED, diffraction patterns are primarily the result of elastic scattering where the incident electron beam interacts with the atomic planes of the crystal without losing energy [55]. Elastic scattering, as opposed to inelastic scattering (which changes the energy and phase of electrons), is responsible for producing coherent diffraction patterns. Since elastic scattering preserves the phase relationship of electrons, the scattered waves can constructively interfere, resulting in increased beam intensity and the formation of distinct diffraction spots. The high coherence of the electron source, such as a field emission gun, further ensures that the elastically scattered beam remains phase-coherent with the transmitted beam, which is crucial for constructive interference [56]. With a very small (5 µm) aperture, SAED is capable of acquiring diffraction patterns from particle regions with diameters of 20–30 nm, thereby allowing researchers to precisely target and analyze specific regions of interest. These diffraction patterns arise from the constructive interference of electrons scattered by the atomic planes of the crystal. As the electron beam interacts with the periodic atomic structure, electrons are scattered in specific directions. Whether the scattered waves reinforce or cancel each other depends on their phase relationship, which is governed by Bragg’s Law [57]. This principle dictates that constructive interference occurs when the path difference between waves scattered from adjacent atomic planes equals an integer multiple of the electron wavelength. In essence, Bragg’s Law provides the conditions under which diffraction can occur, based on the angle of scattering, the spacing between atomic planes, and the wavelength of the electron beam [58]. The resulting diffraction pattern can consist of spots or rings, depending on the symmetry and orientation of the crystal lattice. Single crystals produce distinct diffraction spots due to their uniform atomic arrangement, whereas polycrystalline and amorphous materials generate ring structures because of their randomly oriented grains or lack of long-range order [59]. Each diffraction spot or ring corresponds to a specific set of crystal planes, and the spacing between these features is directly related to the interplanar distances in the crystal, enabling the determination of crystal type, orientation, and lattice constants.
SAED is a standard tool for providing local structural information, particularly in the analysis of crystal structures. Through SAED, researchers can obtain diffraction patterns from the zeroth-order Laue zone (ZOLZ) [60,61]. While ZOLZ diffraction patterns offer key insights into the fundamental structure of materials, the reflection information they provide is limited, making it challenging to fully resolve the three-dimensional crystal structure. This limitation underscores the importance of combining diffraction data from multiple crystal axes to obtain a more comprehensive understanding of the crystal structure [62]. Ponce et al. [63] optimized the optical configuration of the microscope to efficiently capture ZOLZ diffraction information while also, for the first time, obtaining more complex higher-order Laue zone (HOLZ) diffraction patterns. HOLZ diffraction data play a critical role in revealing crystal symmetry and more intricate three-dimensional structures. This advancement significantly enhanced the ability to investigate complex nanostructures, particularly in the characterization of nanomaterials and thin films. To further improve the accuracy and reliability of SAED data, Ponce and colleagues combined SAED with other electron diffraction methods, such as PED. The use of PED, with a conically oscillating electron beam, effectively reduced dynamic scattering effects and significantly enhanced reflection signals. This enabled more precise quantitative analysis of three-dimensional structures. The integration of SAED and PED not only expanded the application range of SAED but also greatly improved the quantitative resolution of complex nanostructures, especially in cases where multiple scattering effects were prominent.
Recently, Czigány and colleagues [64] proposed a standardized procedure that significantly improved the accuracy and reproducibility of SAED measurements by precisely controlling experimental conditions and optimizing parameters. Their research demonstrated that, by carefully adjusting the sample height, illumination conditions, and lens currents, the absolute accuracy of SAED could be decreased to 0.1% without the need for internal standards, with reproducibility reaching down to 0.03%. This method performed exceptionally well when analyzing multi-component nanocomposites or materials with complex diffraction rings, significantly reducing the influence of instrument errors on diffraction patterns and thus optimizing further nanostructural analysis. The results showed that the method achieved camera length (CL) reproducibility of up to 0.03% across different experiments, with a diffraction ring diameter measurement accuracy of 0.1%. This technique opens new possibilities for structural characterization of complex materials, particularly multi-component systems with overlapping diffraction rings. Moreover, the method was successfully applied to the characterization of biological apatite in dental enamel, demonstrating its broad potential in low-symmetry structured materials.
Shukla et al. [65] analyzed the SAED images of GaN thin films grown by low-temperature hollow-cathode plasma atomic layer deposition (HCP-ALD). As shown in Figure 2, the SAED images reveal a polycrystalline structure consisting of diffraction rings generated by various crystal planes. The primary diffraction rings are located at 7.95 nm−1 and 12.88 nm−1, corresponding to the [ 0002 ] and [ 11 2 ¯ 0 ] planes of hexagonal GaN, respectively. The [ 0002 ] diffraction ring is particularly intense, indicating a strong [ 0002 ] preferred orientation in the GaN thin films. This [ 0002 ] orientation suggests anisotropic growth along the c-axis, a result consistent with X-ray diffraction (XRD) measurements. Preferential c-axis orientation is critical for optoelectronic applications as it enhances carrier mobility and reduces defect density [66].
The SAED (Figure 2b) patterns reflect the influence of deposition parameters on crystallinity. When the substrate temperature is below 200 °C, the diffraction rings are broad and indistinct, indicating poor crystallinity and the presence of amorphous regions. At substrate temperatures of 200 °C and above, the diffraction rings become sharper, indicating a transition from amorphous to well-crystallized hexagonal structures. This highlights the crucial role of substrate temperature in improving crystallinity. Additionally, weaker { 10 1 ¯ 0 } and { 10 1 ¯ 2 } diffraction rings suggest the presence of minor orientations within the film. The arc-like features in the diffraction pattern imply small grain sizes and textured growth, a typical characteristic of polycrystalline films grown under moderate temperature conditions.
SAED plays an irreplaceable role in large-scale crystallographic analysis, but it faces significant limitations in certain critical aspects, particularly when dealing with nanoscale details. SAED lacks sufficient spatial resolution to capture subtle distortions and localized crystal defects, limiting its effectiveness for high-resolution and precise local analysis. These limitations are particularly evident in complex crystalline materials, where it struggles to effectively characterize local distortions and defects [67]. Furthermore, SAED is inadequate for quantitative analysis of three-dimensional lattice information, especially in strain measurements and the characterization of crystal defects, making it difficult to provide highly accurate results [68]. These shortcomings render it less ideal for studying the local crystal structure of complex materials [69].

2.1.2. Convergent-Beam Electron Diffraction

To address the limitations of SAED in localized high-resolution analysis, CBED offers a more detailed examination of a crystal’s internal structure, including its symmetry, lattice parameters, and strain within small, localized regions of the sample [70]. CBED operates by focusing a convergent electron beam onto a specific area of the specimen, producing a diffraction pattern composed of a series of disks rather than the spots seen in SAED. If the sample is sufficiently thick, these disks contain structural details known as higher-order Laue zone (HOLZ) lines that are particularly informative as they reflect the dynamic diffraction of electrons within the crystal. In CBED of thicker samples, multiple scattering events occur as the electron beam interacts with the crystal lattice, resulting in a diffraction pattern that provides detailed information about the crystal’s internal structure. The widest use of CBED is for space group determination, although it also offers the ability to measure strain with high precision. By analyzing the intensity and position of the HOLZ lines, researchers can extract precise measurements of lattice parameters and identify even subtle distortions in the crystal structure [71]. This capability is particularly crucial in the semiconductor industry, where even minute strains can significantly affect the electronic properties of materials [72].
One of the most significant advancements in CBED has been the introduction of direct electron detectors, which have revolutionized the field by improving the signal-to-noise ratio (SNR) [73] and enabling higher-resolution data acquisition. These detectors, particularly Hybrid Photon Counting (HPC) [74] systems, enhance sensitivity by directly capturing electrons without the need for intermediate scintillators, reducing noise and boosting contrast. Studies by Schulze-Briese and Decarlo have shown that direct electron detectors can increase the SNR by up to 60% compared to traditional charge-coupled camera (CCD) detectors, enabling the detection of weak diffraction signals that were previously difficult to observe [75]. This improvement is particularly valuable for studying superlattice structures and materials with subtle lattice distortions, where precise measurement of strain and phase transitions is critical.
In addition to the improvements in detector technology, advances in data processing algorithms have expanded CBED’s analytical power. The integration of machine learning and deep learning techniques into CBED workflows has automated the interpretation of diffraction patterns, significantly reducing the time required for data analysis. These algorithms are especially effective in recognizing and classifying complex patterns in multi-phase materials, providing near real-time feedback during experiments [76]. A notable example is the combination of CBED with four-dimensional scanning transmission electron microscopy (4D-STEM), which enables simultaneous acquisition of diffraction and real-space information. This powerful integration allows for precise mapping of local strain and symmetry-breaking phenomena in materials like quantum dots and heterostructures, offering new insights into nanoscale inhomogeneities [77].
Additionally, Saitoh et al. [78] introduced orbital angular momentum-resolved (OAM-resolved) electron beams with unique phase structures, providing enhanced control over the properties of the electron beams. By precisely tuning the OAM states of these beams, researchers can manipulate the interaction between the electron beam and the sample, enabling a higher degree of customization of diffraction conditions for detailed material characterization (Table 1). In their study, Saitoh and colleagues demonstrated the remarkable advantages of OAM-resolved electron beams in imaging lattice defects such as dislocations, vacancies, and stacking faults. The experimental results showed that by tuning the orbital angular momentum of the electron vortex beam, they could achieve more refined imaging of dislocation structures at the nanoscale, with a resolution improvement of approximately 40% compared to traditional CBED methods. This technique significantly enhances the ability to resolve complex crystal defects, symmetries, and dynamic processes without compromising the strengths of conventional CBED. It also holds great potential for applications in the characterization of nanomaterials, semiconductors, and complex alloys.
CBED offers significant advantages over SAED in high-resolution strain analysis and local crystallographic characterization, particularly for precise analysis of localized regions in materials. However, its application is subject to several limitations. CBED is highly sensitive to both sample thickness and orientation. Thicker samples often produce complex multiple scattering diffraction patterns, complicating data interpretation, especially for quantitative analysis of thicker or multi-phase materials [79]. The technique also imposes stringent requirements on sample orientation, particularly the need to align the sample along specific zone axes, which adds to the experimental complexity. Even minor misalignments can lead to data ambiguity [80]. At the nanoscale level, particularly in complex multi-phase materials or localized strain regions, the spatial resolution of CBED is constrained by the initial beam diameter and the broadening of the imaging cone, which is given by twice the product of the sample thickness and the semi-angle of convergence. For instance, a 10 nm beam focused on a 200 nm thick sample with a convergence semi-angle of 30 mrad results in a spatial resolution of 22 nm [81]. This limitation makes it challenging to achieve fine characterization of microstructures at extremely small scales. Additionally, CBED cannot perform scanning analysis over large areas of the sample; its field of view is typically confined to localized regions, restricting its application to cases when large-scale materials or polycrystalline structures need to be examined.

2.1.3. Nanobeam Electron Diffraction

Nanobeam Electron Diffraction (NBD) addresses many of the limitations of CBED in localized nanoscale analysis, offering higher spatial resolution, reduced sensitivity to sample thickness and orientation, and greater adaptability to more complex material systems [82]. NBD has thus become an essential tool for high-precision characterization of nanostructures. In NBD, a highly focused electron beam, typically with a diameter in the nanometer range (e.g., 1 nm), is scanned across the sample to acquire localized diffraction patterns. While the underlying principle of NBD is similar to conventional electron diffraction, the use of a nanometer-scale probe allows for the analysis of strain and crystal structure at much smaller scales in real space, enabling the resolution of features within individual grains or across interfaces with high precision, achieved by using an initially 1 nm electron beam. NBD is particularly effective for strain mapping in semiconductor materials, where precise strain control is critical for device performance [83]. By collecting diffraction patterns at each scan position, NBD enables the construction of detailed maps of crystallographic properties across the sample [84].
Li et al. [85] used a combination of NBD and geometric phase analysis (GPA) to investigate strain distribution within SiGe/Si nanosheet structures. NBD was employed with a 4 nm electron beam to scan the sample and obtain diffraction patterns from defined regions, enabling high-resolution analysis of lattice deformation. By combining NBD with geometric phase analysis (GPA), detailed strain maps were generated, revealing strain accumulation between different layers, particularly at the SiGe/Si interface (Figure 3). The strain distribution displayed a layered pattern, with high strain regions indicated in red—mainly concentrated near the interfaces—and low strain regions in blue. These areas of strain concentration are likely to affect the mechanical performance and stability of the material, potentially leading to the formation of dislocations. This approach provided critical insights into lattice mismatch in nanosheets and demonstrated how such strain impacts material properties, offering a foundation for optimizing their application in electronic devices.
In recent years, NBD has seen remarkable advancements through its integration with other cutting-edge techniques, significantly enhancing its capabilities in strain measurement and crystallographic analysis [86]. The combination of NBD with PED improves both strain precision and spatial resolution. This method has achieved strain precision better than 2 × 10⁴ with a probe size approaching 1 nm [87]. S. Kryvyi et al. [88] combined NBD with three-dimensional strain mapping to accurately reconstruct the strain fields in asymmetric core–shell nanowires with high defect densities, achieving strain precision on the order of 10⁴. A. Sakai et al. [89] utilized synchrotron nano-beam X-ray diffraction in conjunction with NBD to detect strain variations in AlGaN/GaN high electron mobility transistor (HEMT) devices. Their research demonstrated that even a 10% change in gate voltage induces significant local strain variations, directly impacting device performance.
NBD addresses many of the limitations of CBED in localized nanoscale analysis, offering higher spatial resolution, reduced sensitivity to sample thickness and orientation, and greater adaptability to more complex material systems. However, multiple scattering effects in NBD are primarily influenced by the specimen’s thickness and orientation, which can complicate data interpretation, particularly in complex multi-phase materials. To mitigate this issue, Precession Electron Diffraction (PED) provides an effective solution. By allowing the electron beam to precess around the optic axis in a conical path, PED significantly reduces multiple scattering effects, thereby greatly improving the accuracy of lattice parameter and strain measurements [90]. This enhancement makes PED an essential tool for analyzing complex material systems, especially in scenarios that demand high-precision quantitative characterization [91]. Additionally, PED’s ability to minimize multiple scattering facilitates more reliable interpretation of diffraction data, further solidifying its role in advanced materials characterization.

2.1.4. Precession Electron Diffraction

A key innovation in PED lies in the continuous rotation of the electron beam around the optic axis during diffraction pattern acquisition [92]. This rotation creates a conical scanning motion, allowing the electron beam to strike the sample from multiple angles in rapid succession. As a result, PED effectively averages out dynamical diffraction effects, which occur when electrons undergo multiple scattering events within the crystal lattice near a zone axis orientation [93]. These effects often lead to complex, non-linear diffraction patterns that are challenging to interpret using traditional methods, particularly in materials with intricate crystallographic structures such as multi-phase systems, superlattices, or heavily strained materials [94,95]. By averaging these effects, PED allows the diffraction pattern to be dominated by kinematic scattering, where electrons interact with only a single atomic plane. This significantly improves the precision of lattice parameter and strain measurements, providing more reliable data in situations where conventional diffraction techniques encounter difficulties in capturing subtle structural details due to multiple scattering influences [96].
Zhao et al. [97] introduced a reference-area-free strain mapping method that takes full advantage of PED’s enhanced precision. This approach enables highly accurate strain measurements in semiconductor materials, such as GaN and SiC, without the need for a strain-free reference area. By allowing direct strain measurement with high resolution, this method offers a substantial improvement in accuracy for applications where even slight strain deviations can critically affect material performance.
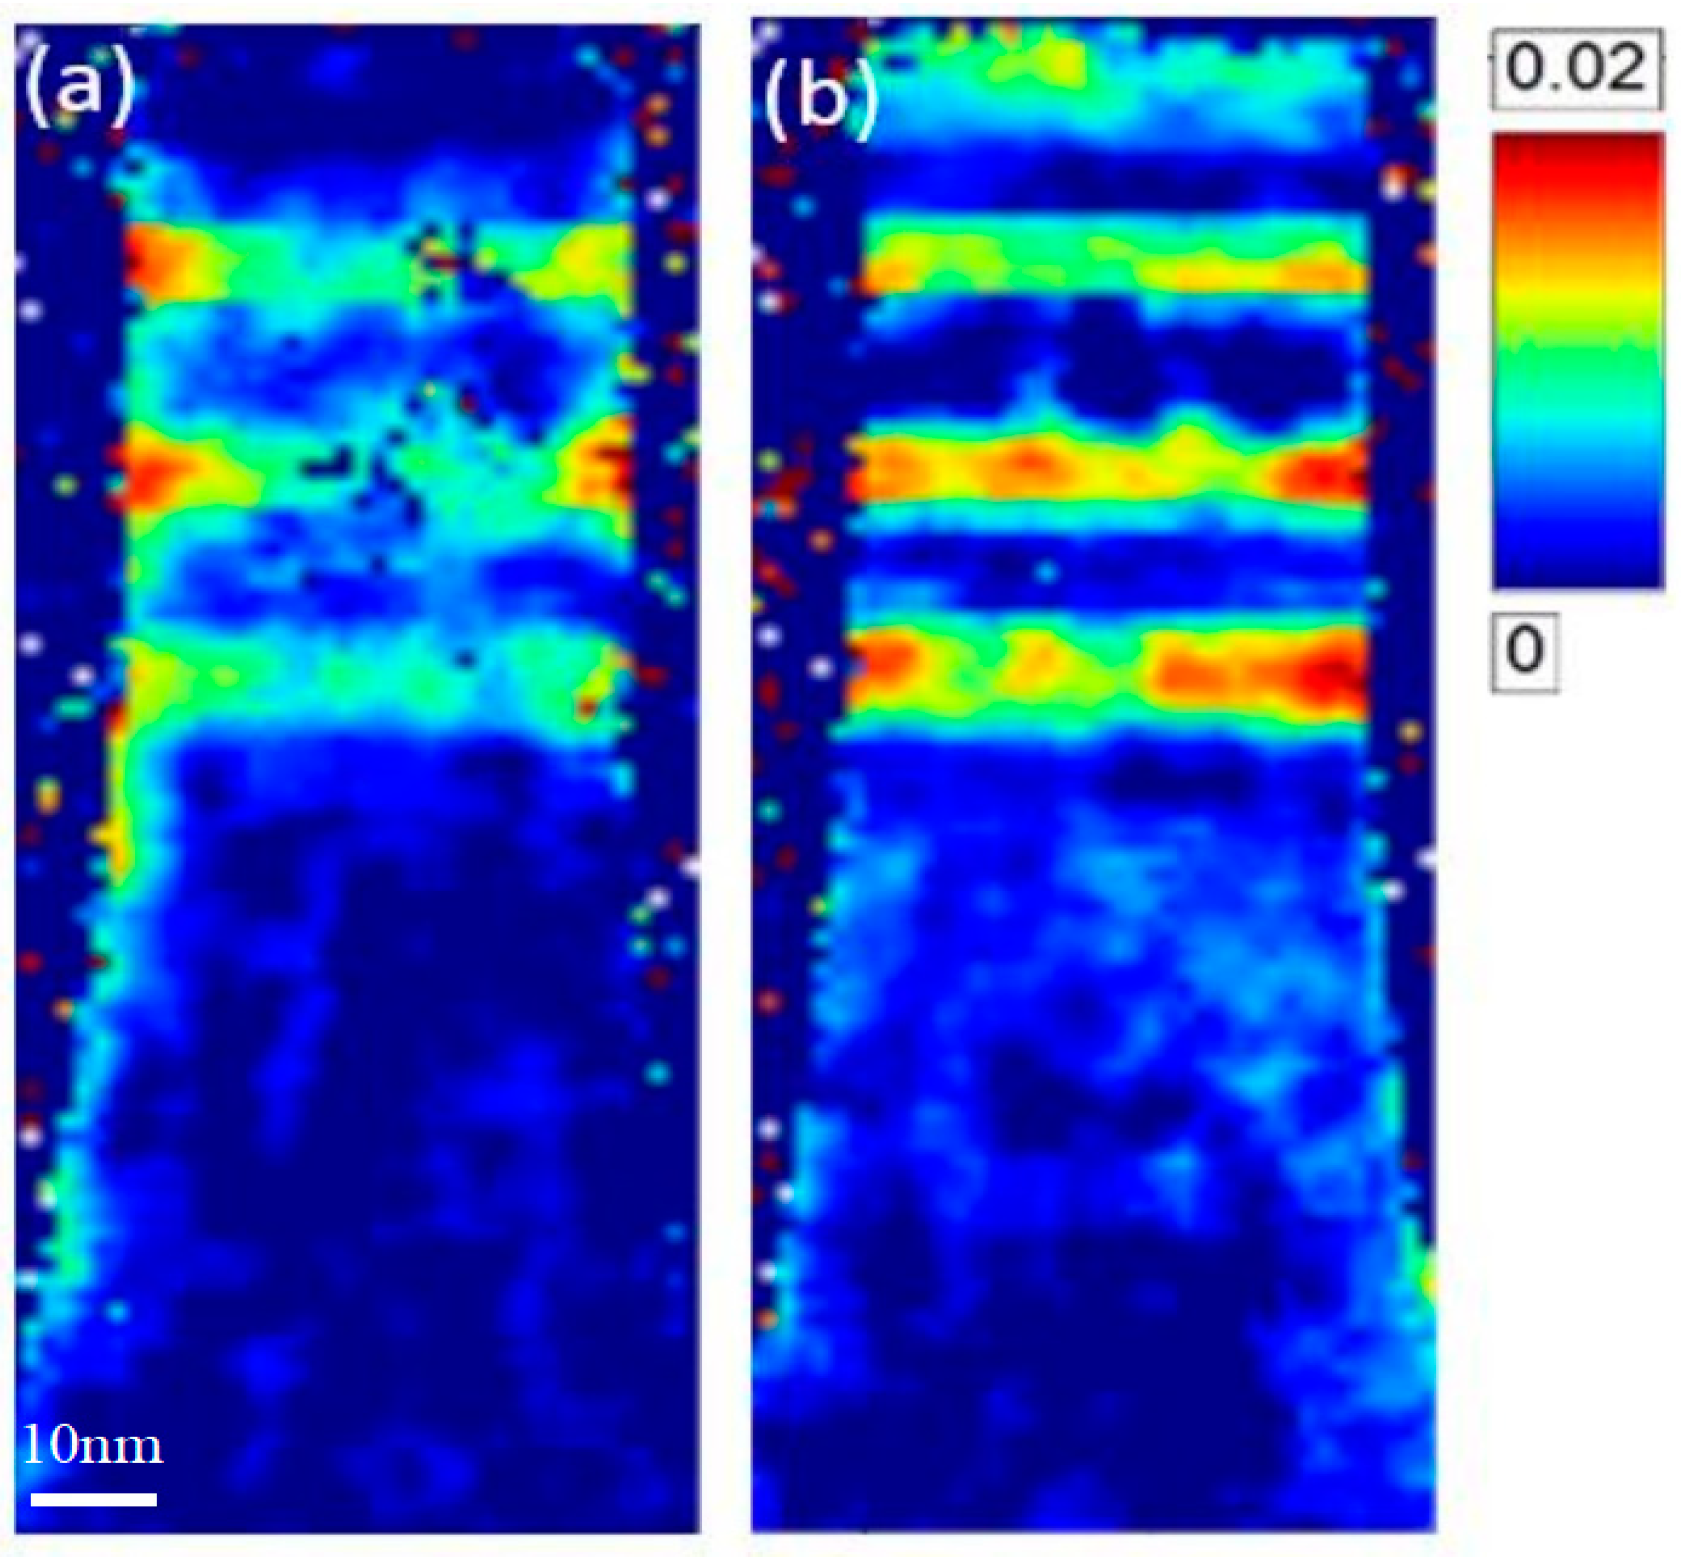
Li et al. [98] used PED to investigate strain in stacked nanosheet devices, aiming to explore the structural stress distribution. Through cross-sectional dark-field STEM imaging and PED measurements, they revealed the strain distribution within the Si/SiGe multilayer nanosheet stack structure (Figure 4). The results demonstrated that the SiGe layers were initially fully strained relative to the unstrained Si substrate. However, subsequent partial strain relaxation in the SiGe layers induced tensile strain in the Si layers. Additionally, the study illustrated the evolution of strain during various fabrication steps, such as the development of compressive strain after metal gate formation. These findings highlight the high spatial resolution and strain sensitivity that PED offers for strain analysis in nanosheet semiconductor materials.
Figure 5 further compares the results from PED measurements with finite element method (FEM) simulations [95,96,97]. Figure 5a,b shows the in-plane and out-of-plane strain distributions obtained via PED, indicating significant edge strain relaxation in the SiGe layers, while the Si layers experience tensile strain. Figure 5c,d displays the corresponding FEM simulation results, which align well with the experimental data, confirming the PED measurements, particularly at the edges of the SiGe layers, where both FEM and PED results consistently show strain relaxation.
In addition, Jeong et al. [99] demonstrated that the integration of PED with four-dimensional scanning transmission electron microscopy (4D-STEM) significantly improves the accuracy of automated crystal orientation mapping. Their work shows that PED-assisted 4D-STEM enhances image quality and reduces false indexing, allowing for more reliable orientation mapping at the nanoscale. This integration facilitates real-time, high-resolution strain analysis. Further advancing PED’s capabilities, Corrêa et al. [100] demonstrated that the quantitative analysis of diffracted intensities from 4D-STEM PED data provides high-precision orientation mapping in multi-phase systems and allows researchers to resolve the structural details of complex materials with minimal interference from overlapping signals, making it particularly useful for analyzing heterostructures and nanomaterials.
Electron diffraction techniques, including SAED, CBED, NBD, and PED, are essential for crystallographic analysis, offering detailed insights into crystal symmetry, lattice parameters, and local strain [101]. Despite their utility, these methods rely on diffraction patterns, which inherently provide indirect information and lack the spatial resolution needed to visualize atomic structures and defects at an atomic level (Table 2) [102]. To overcome these limitations, imaging techniques have been developed, providing a more direct and intuitive approach to examining material features with high spatial resolution [103].

2.2. Weak Beam Dark Field and Two-Beam Condition Imaging

2.2.1. Imaging Under Two-Beam Condition (TBC)

The TBC in TEM is a technique rooted in Bragg’s Law, which describes the diffraction of electron waves by crystallographic planes. Although multiple planes in a sample may simultaneously satisfy the Bragg condition, the visibility of diffraction spots depends significantly on the structure factor, which reflects the atomic arrangement within the unit cell [104]. Notably, while under kinematic scattering conditions, crystallographic planes with a structure factor of zero (F = 0) do not produce observable diffraction spots, this scenario is more complex under dynamical scattering along zone axes. In such cases, the phenomenon known as “Umweganregung” allows for interference-mediated intensity at reciprocal lattice vectors (g1 ± g2) that can give rise to diffraction spots even when individual structure factors vanish. This complexity must be considered when interpreting microstructural features, especially in regions containing defects such as dislocations or stacking faults [105]. The TBC simplifies the diffraction process by ensuring that only two beams—the direct (unscattered) beam and one strongly diffracted beam—are predominantly excited. This method employs imaging with a crystal reflection of type g when the crystal is oriented into a two-beam condition, with the Ewald sphere [106] intersecting the direct beam and one diffracted beam. By tilting the electron beam to align with one specific set of crystallographic planes, the TBC minimizes contributions from other planes, reducing interference from multiple diffracted beams and enhancing clarity in visualizing the material’s internal structure [107].
The theoretical foundation of TBC lies in dynamical diffraction theory, which explains how electron beams interact with the periodic potential of the crystal lattice. In areas with local disruptions, such as dislocations or stacking faults, the periodicity is disturbed, altering the diffraction condition. These defects generate local strain fields that affect both the amplitude and phase of the diffracted beam. Under TBC, these variations become more pronounced, providing stronger contrast between defective and defect-free regions. The contrast mechanism was initially explained using kinematic diffraction theory, later extended by Howie and Whelan’s dynamic theory [108,109]. As a result, TBC is particularly effective for investigating the microstructure of materials, offering enhanced sensitivity to the presence of structural imperfections.
The introduction of advanced beam-shaping techniques [110,111], such as electron vortex beams, has significantly impacted TBC imaging, particularly in studying dislocation dynamics and other crystal defects. Electron vortex beams, possessing a helical phase structure, offer a notable advantage over traditional electron beams by providing greater control over diffraction conditions during imaging [112]. These beams, with their unique phase properties, enhance selective interaction with crystal defects, such as dislocations and strain fields. The study showed that electron vortex beams with topological charge exhibited higher sensitivity to dislocation cores, allowing for clearer visualization of dislocation structures compared to conventional beams. This enhanced interaction increases sensitivity to specific defect types, revealing details often overlooked by traditional beam shapes. Similarly, Thirunavukkarasu et al. [113] explored the potential of electron vortex beams with complex radial structures for phase contrast imaging. They found that these beams improved dislocation contrast by 30% compared to traditional imaging techniques, enabling more precise tracking of dislocation migration and annihilation under stress conditions. This advancement underscores the effectiveness of beam shaping in enhancing defect visualization.
Bonef et al. [114] utilized TEM (with g1 = 0, g2 = 200) to successfully visualize threading dislocations in InGaAs/GaAs/Ge/Si epitaxial layers. By optimizing diffraction conditions, the TBC significantly enhanced the contrast of these dislocations, enabling clear identification and analysis of defect behavior (Figure 6). Complementary atom probe tomography (APT), guided by electron channeling contrast imaging (ECCI), further unveiled the segregation of germanium and indium at dislocation sites. Combined with quantitative compositional analysis using APT, this study highlights the profound impact of dislocations on material properties, offering valuable insights for optimizing semiconductor device performance. These findings underscore the significant value of TBC in high-resolution characterization of extended defects.
The issue with TBC is that it does not account for the excitation error, so the contrast between the ideal crystal and the defect region solely relies on the crystal distortion caused by the defect. This makes TBC less capable of visualizing small distortions, such as low-angle crystal distortions [115]. Additionally, TBC is highly sensitive to sample orientation, which must be precisely aligned to achieve optimal two-beam diffraction conditions, significantly increasing experimental complexity, especially in multi-phase materials or heterogeneous structures. In thicker samples, TBC is further affected by multiple scattering effects [116], which reduce contrast.

2.2.2. Weak Beam Dark Field Imaging

To address the limitations of TBC, WBDF imaging was introduced as a more precise tool for defect analysis. WBDF operates under large excitation error conditions, significantly enhancing defect contrast, particularly excelling in the characterization of complex crystal defects. Compared to TBC, WBDF offers superior spatial resolution in resolving subtle crystal distortions around dislocations. WBDF leverages the principle of diffraction contrast by selecting diffraction beams with large excitation error, minimizing the background signal, and enhancing defect contrast. By deliberately tilting the electron beam by approximately 0.1° from the Bragg condition [117], the diffraction signal from perfect crystal regions can be effectively suppressed, making the contrast of defect regions more pronounced. Studies have shown that when the misalignment is 0.04°, the diffraction intensity from non-defective regions decreases approximately 12 times, whereas the diffraction intensity from defect regions only decreases 1.8 times [118]. This selective enhancement allows close dislocations to be imaged separately, even when their distance is only a few nanometers. The suppression of background signals from non-defective areas means that dislocations can now be observed with enhanced contrast [119].
Qiu et al. [120] utilized WBDF imaging with g = (004) to compare the behavior of non-melted, partially melted, and fully melted Si+ ion-implanted samples (the bulk is n-type CZ-grown (001) silicon) under different laser annealing conditions (Figure 7). The results demonstrated a direct correlation between the defect locations and the laser-induced molten or non-molten states. Similarly, Wu et al. employed WBDF imaging to capture dislocation distribution in the active regions of GaN/AlGaN multiple quantum wells (MQWs) when investigating the improvement of internal quantum efficiency (IQE). The study showed that the dislocation densities were similar between the samples, and the significant differences in IQE were not due to changes in the non-radiative recombination rate caused by defects [121].
WBDF in TEM mode faces several notable limitations. One of the primary challenges is its sensitivity to sample thickness. In thicker samples, multiple scattering effects can interfere with defect contrast, thereby reducing image resolution. This issue becomes particularly prominent in polycrystalline or complex materials [122]. Furthermore, WBDF is highly sensitive to the orientation of the sample. Even slight deviations from the Bragg condition can significantly weaken defect contrast, which limits its application in analyzing complex heterogeneous materials [123]. Another challenge is the limited sensitivity of TEM detectors, which makes it difficult to capture weak diffraction signals, hindering the clear observation of certain small defects [124].
Miao et al. introduced improvements to the WBDF technique in scanning transmission electron microscopy (STEM) [125], enabling higher resolution imaging with the use of an annular dark field detector. This combined method addresses some of the limitations in traditional TEM, such as restrictions related to beam convergence angles and camera length, allowing for high-precision imaging in more complex material systems. In 2020, Miao et al. [126] proposed a novel method of combining WBDF with STEM, successfully achieving high-resolution dislocation imaging with enhanced contrast.
In more recent research, Lin et al. [117] optimized WBDF STEM imaging conditions by reducing the incidence angle and beam intensity, as well as adjusting the condenser aperture of the diffraction beam. Compared to conventional TEM (Table 3), WBDF STEM demonstrated superior performance in suppressing dynamic diffraction effects, such as thickness fringes and bend contours, resulting in a cleaner image background. This improvement enabled clearer identification of small dislocation loops and other crystal defects. The study tested three different condenser lens (CL) apertures (10 µm, 50 µm, and 70 µm) and found that the 50 µm CL aperture provided the best performance in suppressing background contrast. Furthermore, the research introduced and compared three different WBDF STEM imaging methods to enhance the detection and analysis of dislocation loops (Table 2). The results showed that Method 3 offered significant advantages in terms of image contrast and ease of operation.
While WBDF and TBC have greatly contributed to defect analysis, their resolution and sensitivity remain limited for applications requiring extremely high precision. To address these challenges, high-resolution scanning transmission electron microscopy (HRSTEM) has emerged as a powerful solution [129,130,131].

2.3. High-Resolution Scanning TEM (HRSTEM)

HRSTEM serves as a crucial tool for characterizing the microstructure of materials. By integrating high-resolution imaging with various advanced detection techniques, HRSTEM allows researchers to conduct in-depth analyses of the atomic-scale structure and chemical composition of materials [132]. The core imaging modes of HRSTEM include high-angle annular dark-field (HAADF) imaging, bright-field (BF), and annular dark-field (ADF) imaging. These imaging modes have seen significant advancements in spatial resolution, contrast, and data acquisition capabilities [133,134].

2.3.1. High-Angle Annular Dark-Field Imaging

HAADF imaging is one of the most impactful techniques in HRSTEM, based on the principle of high-angle scattering of the electron beam. By utilizing an annular detector to capture only the electrons scattered through high angles, HAADF generates Z-contrast images the intensity of which is almost proportional to the square of the atomic number for sufficiently high inner detection angles [135]. This makes HAADF particularly well-suited for chemical composition analysis within materials, especially in studies of complex heterogeneous structures and interfaces [136]. Compared to conventional TEM, HAADF effectively suppresses background noise caused by low-angle scattering, significantly enhancing image contrast for heavy atoms [137]. With advancements in aberration-correction technology, HAADF has achieved sub-angstrom spatial resolution, solidifying its role as a critical tool for investigating the microstructure of materials [138].
One of the most significant advancements in HAADF microscopy is the incorporation of aberration-corrected STEM, which eliminates distortions in the electron beam and enables sub-angstrom resolution. This breakthrough allows for direct imaging and tracking of individual atoms within materials if the specimen is thin enough. Under appropriate accelerating voltage, aberration-corrected STEM has improved imaging resolution from approximately 2 Å to below 0.7 Å, allowing for direct observation of single atoms. In one study, Wang and Cai used this technology to dynamically observe and track individual gold atoms on an amorphous carbon film. With a probe size of 0.7 Å, they captured real-time atomic movements at 10 frames per second, revealing that the motion of these atoms was primarily beam-induced. This ability to visualize atomic-scale behavior under electron-beam irradiation opens new avenues for understanding atomic processes and designing materials for applications such as catalysis, nanomanufacturing, and sensors [138], while the role of possible beam-induced radiation damage needs to be kept in mind.
The combination of high-angle annular dark field (HAADF) imaging and valence electron energy loss spectroscopy (VEELS) [139] represents a significant advancement in HAADF technology. By integrating these two techniques, researchers can simultaneously capture high-resolution atomic structure images and probe local electronic structures, chemical bonds, and elemental distributions. This synergy greatly enhances the ability to characterize complex materials at the nanoscale, providing a deeper understanding of their physical and chemical properties. In the study by Ma et al. [140] HAADF and VEELS were employed to investigate gallium ion beam-induced damage in materials such as Al2O3, InP, and InGaAs (Figure 8). HAADF imaging allowed for the clear visualization of nanoclusters, while VEELS provided insight into their chemical composition. Plasmon energy maps generated by VEELS identified the formation of metallic gallium clusters in Ga+ implanted Al2O3 and indium-rich clusters in InGaAs, confirming the ion-induced segregation of these elements. The combined use of VEELS and HAADF was pivotal in distinguishing different bonding environments within the same sample, with HAADF offering detailed structural clarity and VEELS providing compositional data. For example, Figure 8 shows HAADF imaging of gallium implantation into Al2O3, where VEELS analysis of the 14 eV plasmon reveals the presence of metallic gallium in the nanoclusters.

2.3.2. Low-Angle Annular Dark-Field (LAADF) Imaging

HAADF imaging primarily relies on scattering intensity contrast, providing excellent Z-contrast; however, it is not suitable for revealing all types of material defects and microstructures. BF and low-angle annular dark-field (LAADF) imaging are classical HRSTEM modes based on electron scattering principles and are widely used in materials science.
LAADF imaging complements both HAADF and BF imaging by capturing electrons scattered at medium angles, typically around Bragg angles, but within a relatively small angular range. This technique is particularly sensitive to subtle variations in strain, defects, and low-Z elements within a material, providing enhanced contrast for features that might be invisible in HAADF imaging. LAADF imaging allows highlighting regions with slight differences in mass-thickness or strain [141]. The detector placement in LAADF is crucial, as it determines the angular range of electrons collected, which in turn affects the sensitivity to different features. For example, recent studies have demonstrated that LAADF imaging can reveal subtle strain distributions in heterostructures and interfaces. This capability makes it an indispensable tool in high-resolution STEM for applications in materials science, particularly when investigating nanoscale defects or strain-induced phenomena. When integrated with other imaging modes, such as HAADF or BF, LAADF provides complementary information that enriches the structural and compositional understanding of materials [141].
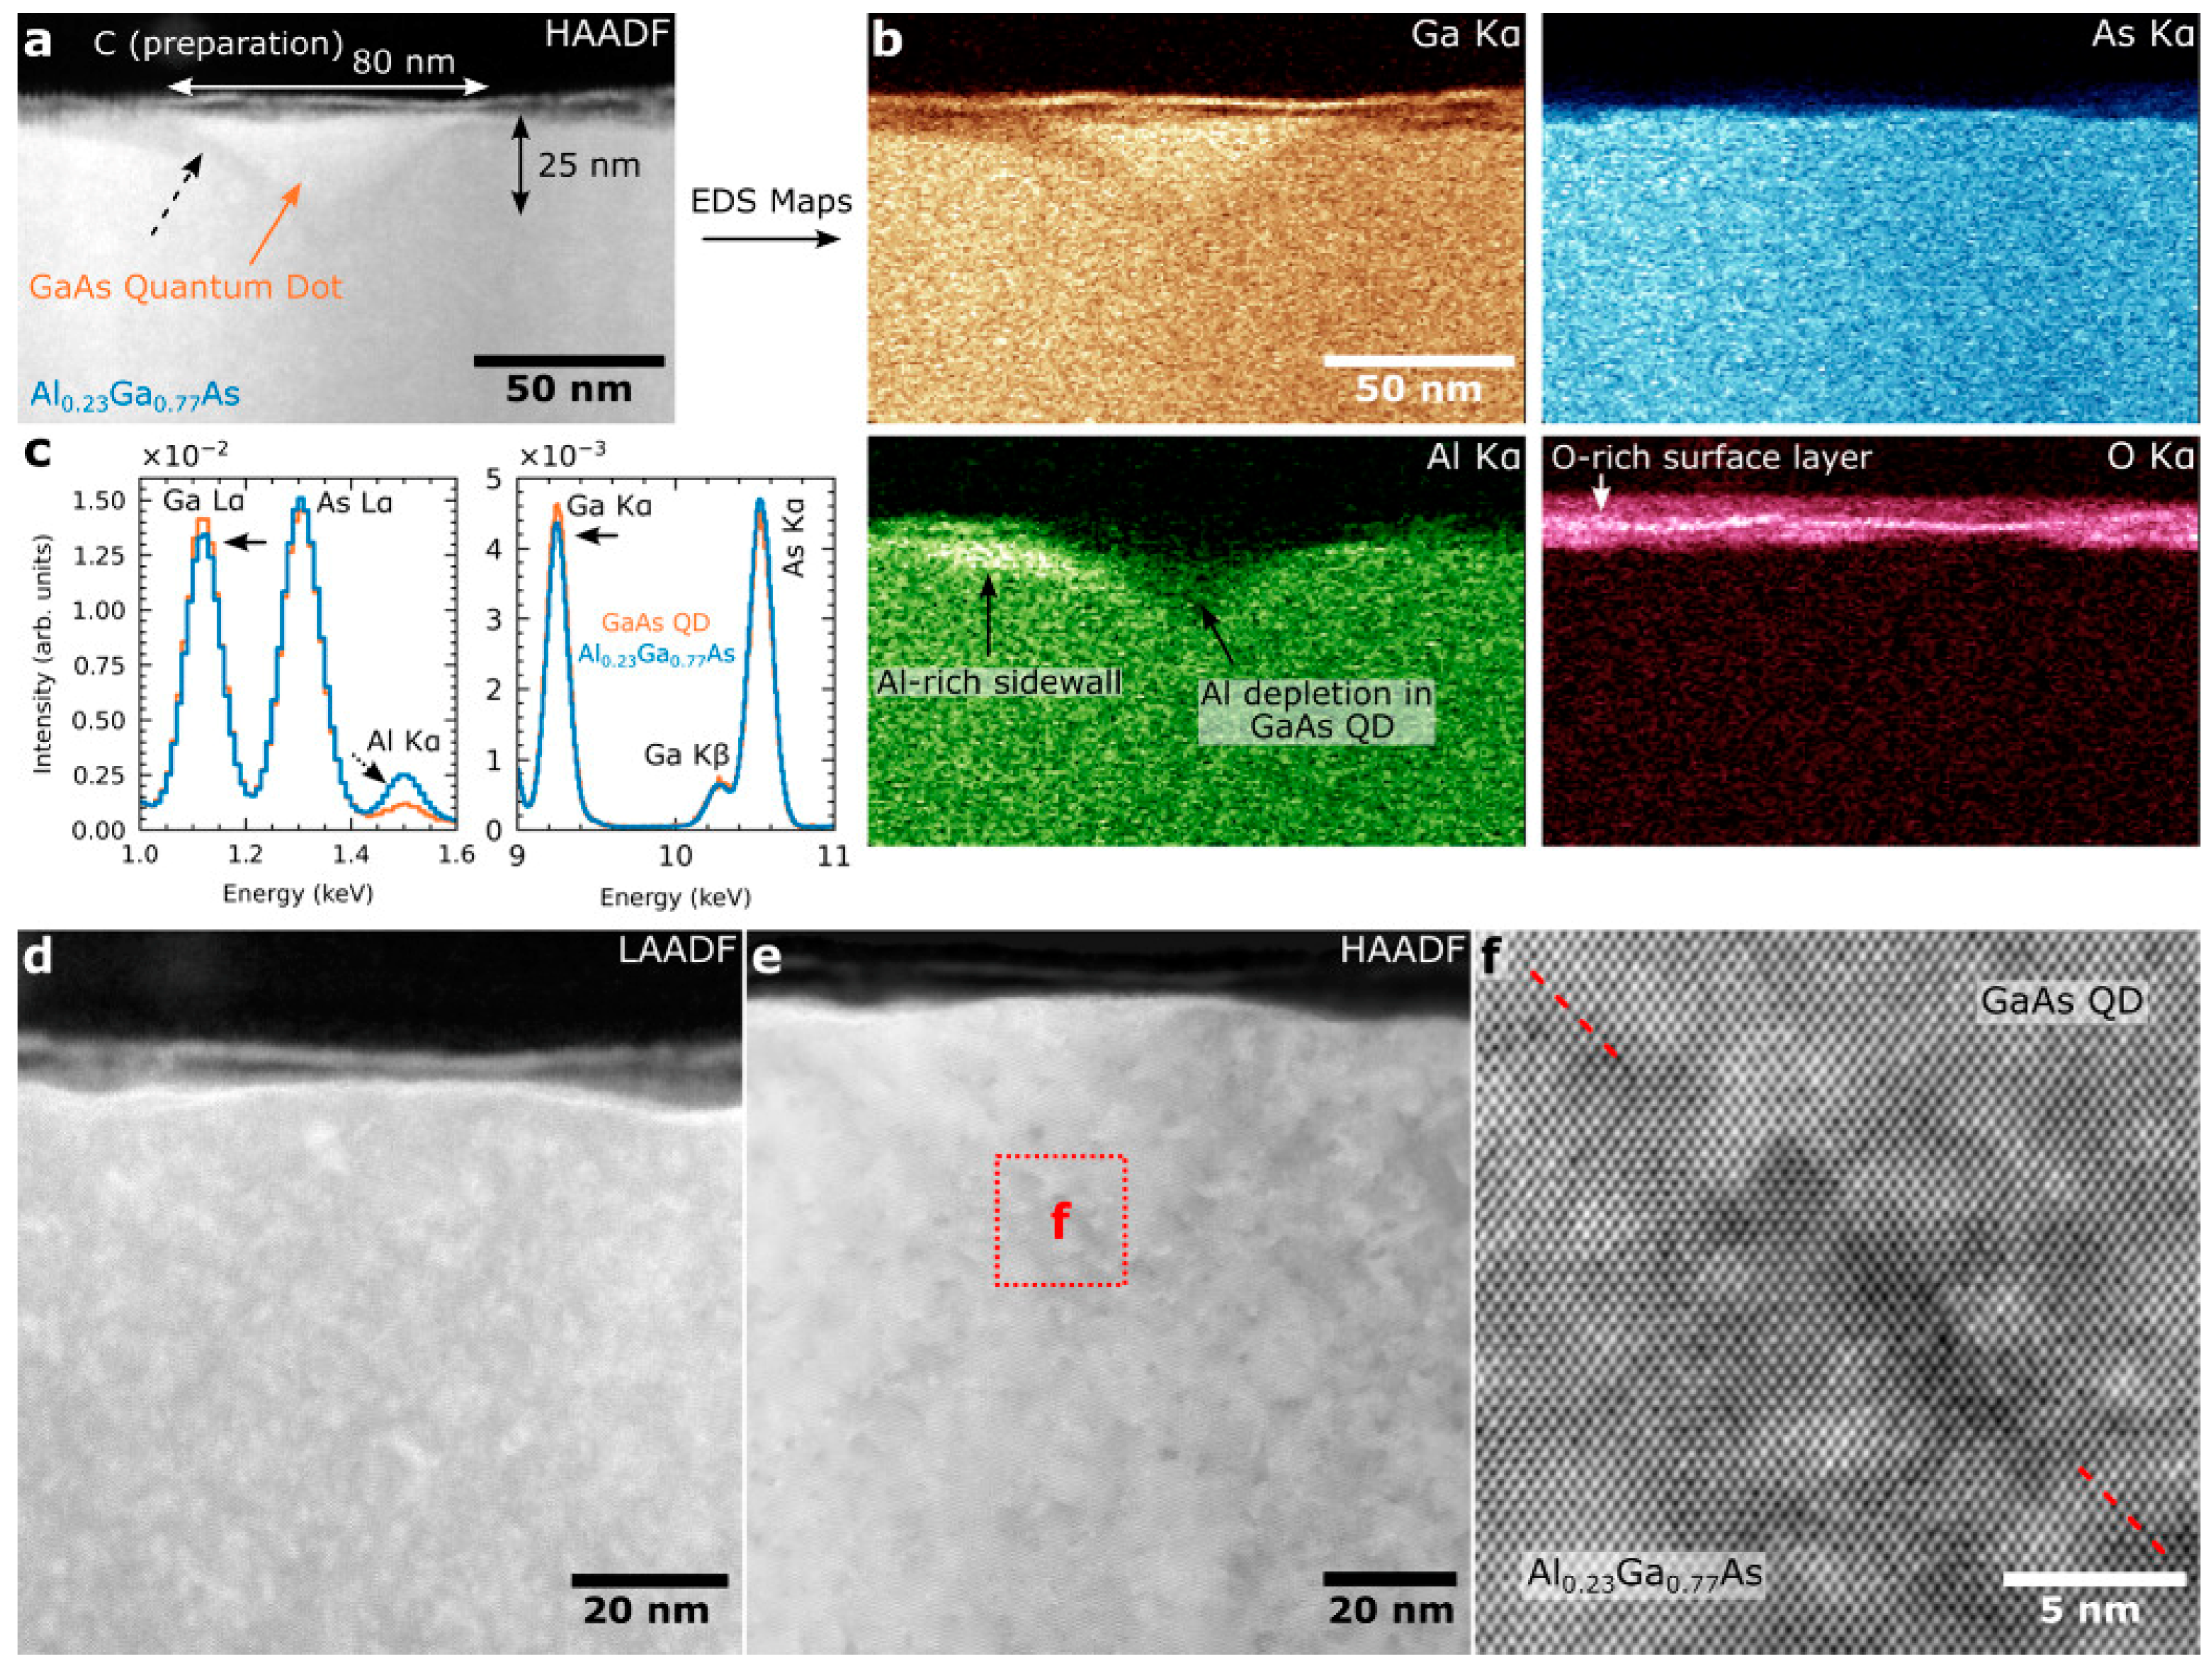
In a recent study, Zhang et al. [142] conducted a comprehensive analysis of the morphology and composition of GaAs/AlGaAs quantum dots (QDs) [143] using low-angle annular dark-field scanning transmission electron microscopy (LAADF-STEM) and atomic force microscopy (AFM). The GaAs/AlGaAs QDs were fabricated via the droplet etching and nanohole infilling (DENI) method, with a particular focus on the morphological characteristics, interfacial structures, and heterogeneity in material distribution.
Through LAADF STEM imaging (Figure 9), the study revealed the absence of significant strain fields or crystalline defects at the interface between the GaAs QDs and the Al0.23Ga0.77As matrix, indicating that the QDs maintained a high degree of coherence during growth within the AlGaAs matrix. Furthermore, energy-dispersive X-ray spectroscopy (EDS) [144] analysis showed a marked enrichment of Ga within the QD region, while Al was concentrated in the Al-rich sidewall areas. These findings unveiled a distribution gradient of Ga and Al within the QDs, with Ga concentration being higher at the top and Al concentration increasing towards the bottom along the vertical axis of the QDs. Further LAADF-STEM analysis demonstrated that the Al-rich layer surrounding the QDs exhibited an asymmetrical distribution, consistent with the conical morphology of the nanoholes. This asymmetry likely impacts the overall symmetry and optical properties of the QDs. Notably, no significant intensity variations were observed at the interface between the QDs and the Al0.23Ga0.77As matrix, underscoring the uniformity and strain-free nature of the interfacial structure. This finding highlights the coherent growth of GaAs QDs within the Al0.23Ga0.77As matrix and the high structural consistency of the interface.

2.3.3. Bright-Field (BF) Imaging

BF imaging generates images using directly transmitted electron beams, making it ideal for observing the overall morphology and crystal structure of a sample. In BF imaging, the detector is positioned in the path of the transmitted electron beam, capturing electrons that have not been diffracted, which is well-suited for examining the crystal structure and imaging relatively uniform areas of the sample [145].
BF imaging produces images that are sensitive to variations in atomic number and sample thickness. Recent improvements in aberration-correction technology have enabled BF imaging to achieve atomic-scale resolution, even for light elements that were previously difficult to visualize. For instance, optimized bright-field scanning transmission electron microscopy (OBF-STEM) represents an advanced extension of traditional bright-field imaging, incorporating aberration correction and enhanced detector technologies to achieve superior resolution and contrast. This approach involves the precise tuning of critical imaging parameters, such as the electron beam’s convergence angle and detector positioning, to minimize noise and maximize signal acquisition efficiency. Such optimizations are particularly advantageous for imaging beam-sensitive materials and low atomic number (low-Z) specimens, where conventional methods often struggle to provide adequate contrast and resolution [146]. In the study of zeolite materials using OBF-STEM, Ooe et al. [147] resolved atomic structures at a resolution of ~0.9 Å using a low electron dose, critical for preserving the integrity of beam-sensitive materials like zeolites. This technique has greatly enhanced our ability to study local atomic structures without damaging the material.
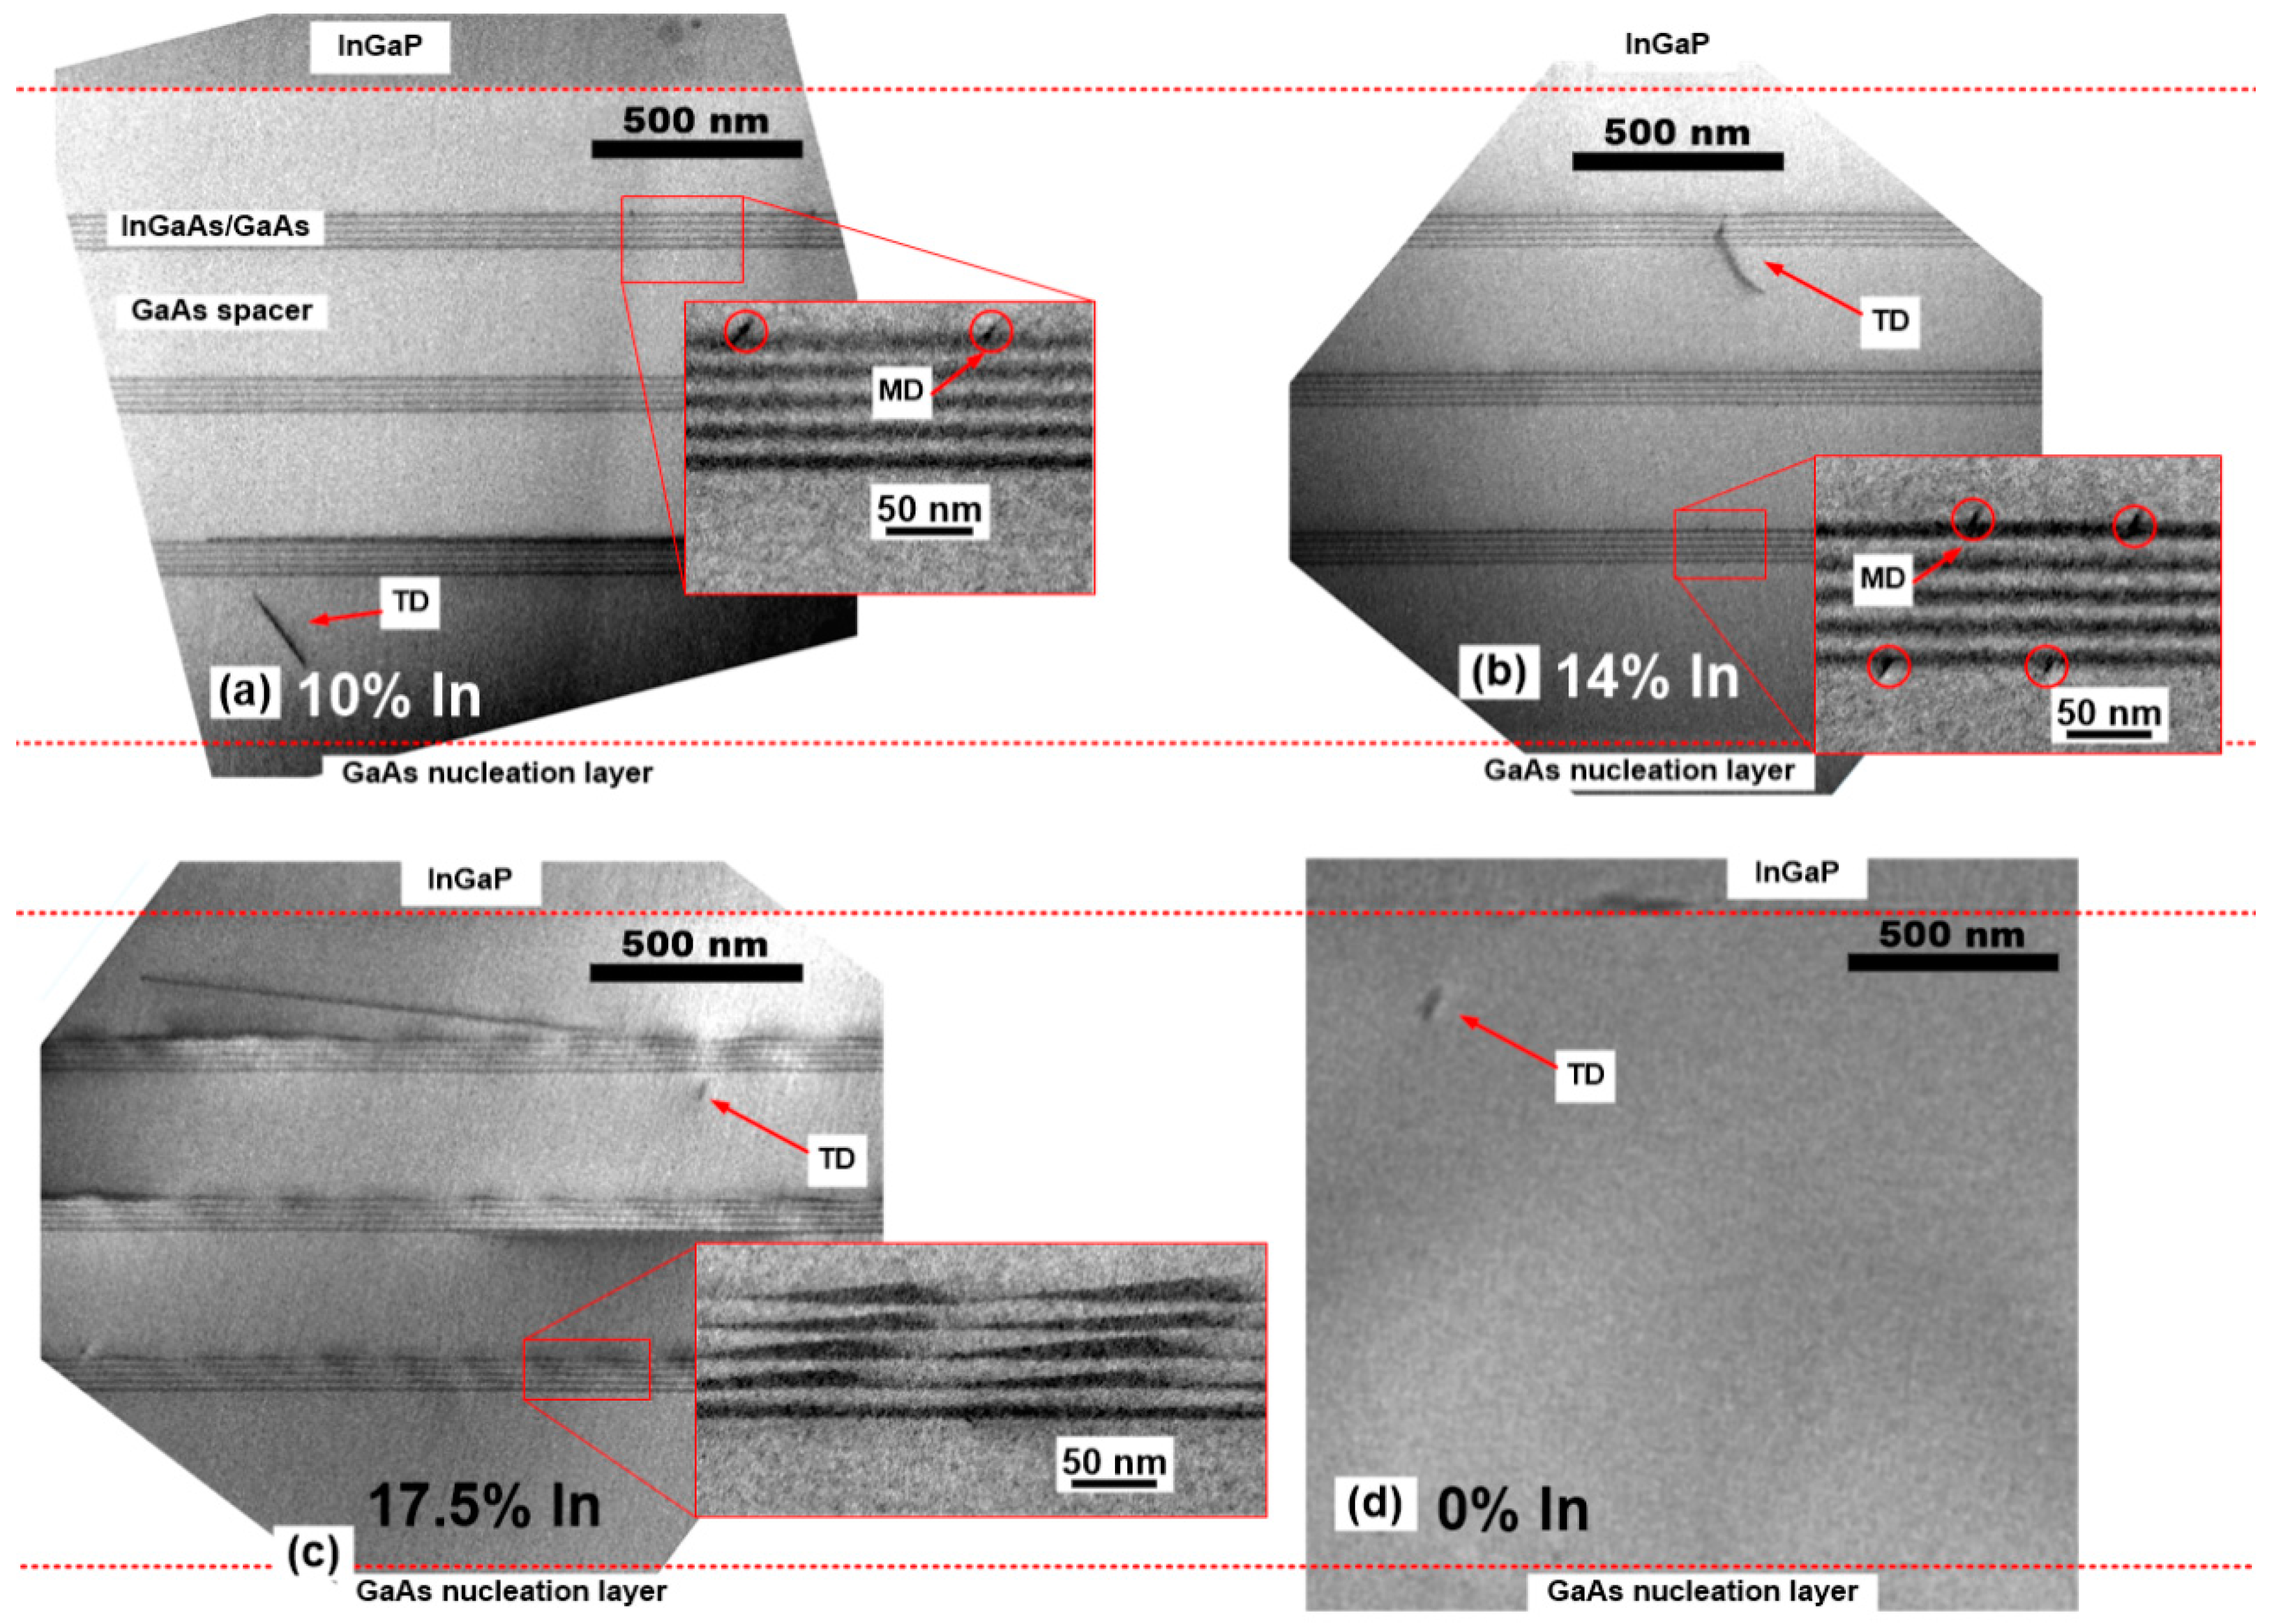
Wang et al. [148] investigated the effectiveness of dislocation filtering layers (DFLs) [149,150] in reducing threading dislocation density (TDD) [151,152,153,154] in GaAs thin films (Table 4), grown epitaxially on 200 mm silicon substrates with InGaAs/GaAs superlattices. The study was conducted under conditions with and without a Ge buffer layer, aiming to explore the impact of DFLs on TDD in the GaAs epitaxial layer. The results showed no significant difference in the final TDD in the InGaP layer when a Ge buffer was used, compared to the reference sample. In contrast, without the Ge buffer layer, dislocation filtering effects were observed. Additionally, all samples exhibited noticeable wafer bowing and film cracking that would indicate tensile strain, posing challenges for practical application.
The analysis of Figure 10 suggests that although the superlattice layers effectively reduce the number of threading dislocations, excessive strain may degrade the quality of the superlattice, reducing the effectiveness of dislocation filtering. Particularly under high indium content, the superlattice growth mode changes. Wafer 3 (x = 0.175) shows the onset of island growth (see inset of Figure 10c for the InGaAs layers). This limits dislocation filtering capability. These findings further demonstrate that the effectiveness of DFLs depends on careful control of the strain field, as excessive strain can have adverse effects. This is crucial for improving device performance.
Although HRSTEM has made significant advances in resolution, it remains primarily a two-dimensional imaging technique, lacking the capability for comprehensive analysis of multidimensional structures, stress fields, and electric fields within samples. These limitations could be overcome by the development of four-dimensional scanning transmission electron microscopy (4D-STEM) [156,157].

2.4. 4D-STEM, Ultrafast Pump-Probe TEM, and Differential Phase Contrast (DPC)

2.4.1. 4D-STEM

The fundamental principle of 4D-STEM involves capturing complete diffraction patterns of the sample at each scan position. Traditional STEM detectors record only a single integrated signal intensity for each scan point, while modern 4D-STEM uses fast pixelated detectors capable of capturing more than 1000 diffraction patterns per second, generating a four-dimensional dataset comprising two spatial dimensions and two reciprocal space dimensions [158]. Analysis of these datasets enables researchers to reveal the distribution of internal strain fields, lattice orientation variations, and local structural changes within samples. A key advantage of 4D-STEM technology lies in its ability to measure strain with sub-picometer precision, achieved through detailed analysis of minute changes in Bragg reflections. As the electron beam passes through a crystalline structure, even slight strain variations can cause shifts or changes in the intensity of Bragg reflections. By systematically recording these changes, 4D-STEM can generate highly accurate strain maps [159].
The development of new detectors, such as the Electron Microscope Pixel Array Detector (EMPAD), has greatly enhanced 4D-STEM performance. EMPAD, with its extremely high dynamic range and sensitivity, is capable of capturing large-scale datasets, significantly improving time resolution for strain and orientation mapping [160]. By integrating real-time processing techniques, such as Nion Swift software (version is 16.14.0) combined with the Dectris Electron-Loss Angle detector, real-time data processing at up to 15,000 frames per second has been achieved. This enables real-time acquisition and analysis of 4D-STEM data, particularly in high-resolution mapping of complex samples [161].
The introduction of compressed sensing technology represents a breakthrough in 4D-STEM. Traditional 4D-STEM faces the challenge of long acquisition times, even with advanced high-frame-rate detectors. These methods remain limited by frame rates and data processing capabilities. However, Robinson et al. [162] proposed a compressed sensing-based probe subsampling method that effectively reduces the number of measurements required, thereby increasing the frame rate and mitigating beam effects associated with overlapping electron probes. This innovation significantly accelerates 4D-STEM data acquisition and, with the help of GPU-accelerated image reconstruction algorithms, enables real-time data processing comparable to conventional STEM. This advancement allows users to adjust their 4D-STEM experimental setup during data collection, ensuring alignment with ADF-STEM, and demonstrates the potential for high-resolution analysis of complex nanostructures under low-dose conditions [163].
Data processing techniques utilizing machine learning and high-performance computing have become crucial for handling large-scale 4D-STEM datasets. Through the use of unsupervised learning algorithms, researchers can automatically extract meaningful information from complex sets of diffraction patterns. Chuqiao Shi et al. [164] proposed a method for rapid and semi-automated analysis of large 4D-STEM datasets using unsupervised learning techniques. Han et al. [165] explored the application of fast, semi-automated unsupervised machine learning to assist in 4D-STEM data processing, demonstrating how this technology simplifies and enhances the efficiency of large-scale 4D dataset analysis. Specifically, machine learning improves the speed and accuracy of diffraction pattern interpretation, which is particularly important in materials research. Unsupervised learning techniques can effectively classify strain and lattice distortions without requiring pre-trained models, providing new possibilities for identifying subtle deformations across large sample areas.
Shi et al. [166] introduced a method that combines machine learning with 4D-STEM to rapidly and semi-automatically reveal material deformation. This approach, utilizing an unsupervised hierarchical clustering algorithm, can automatically uncover multi-scale deformations in materials without requiring prior knowledge of the sample. Han advanced the application of unsupervised learning methods in 4D-STEM-enabled strain mapping. This improvement enhances the ability to analyze strain fields in multilayer heterostructures and nanocomposites [167]. In addition, the introduction of Exit Wave Power Cepstrum (EWPC) transform and automated phase extraction algorithms has further accelerated imaging processing efficiency [168].
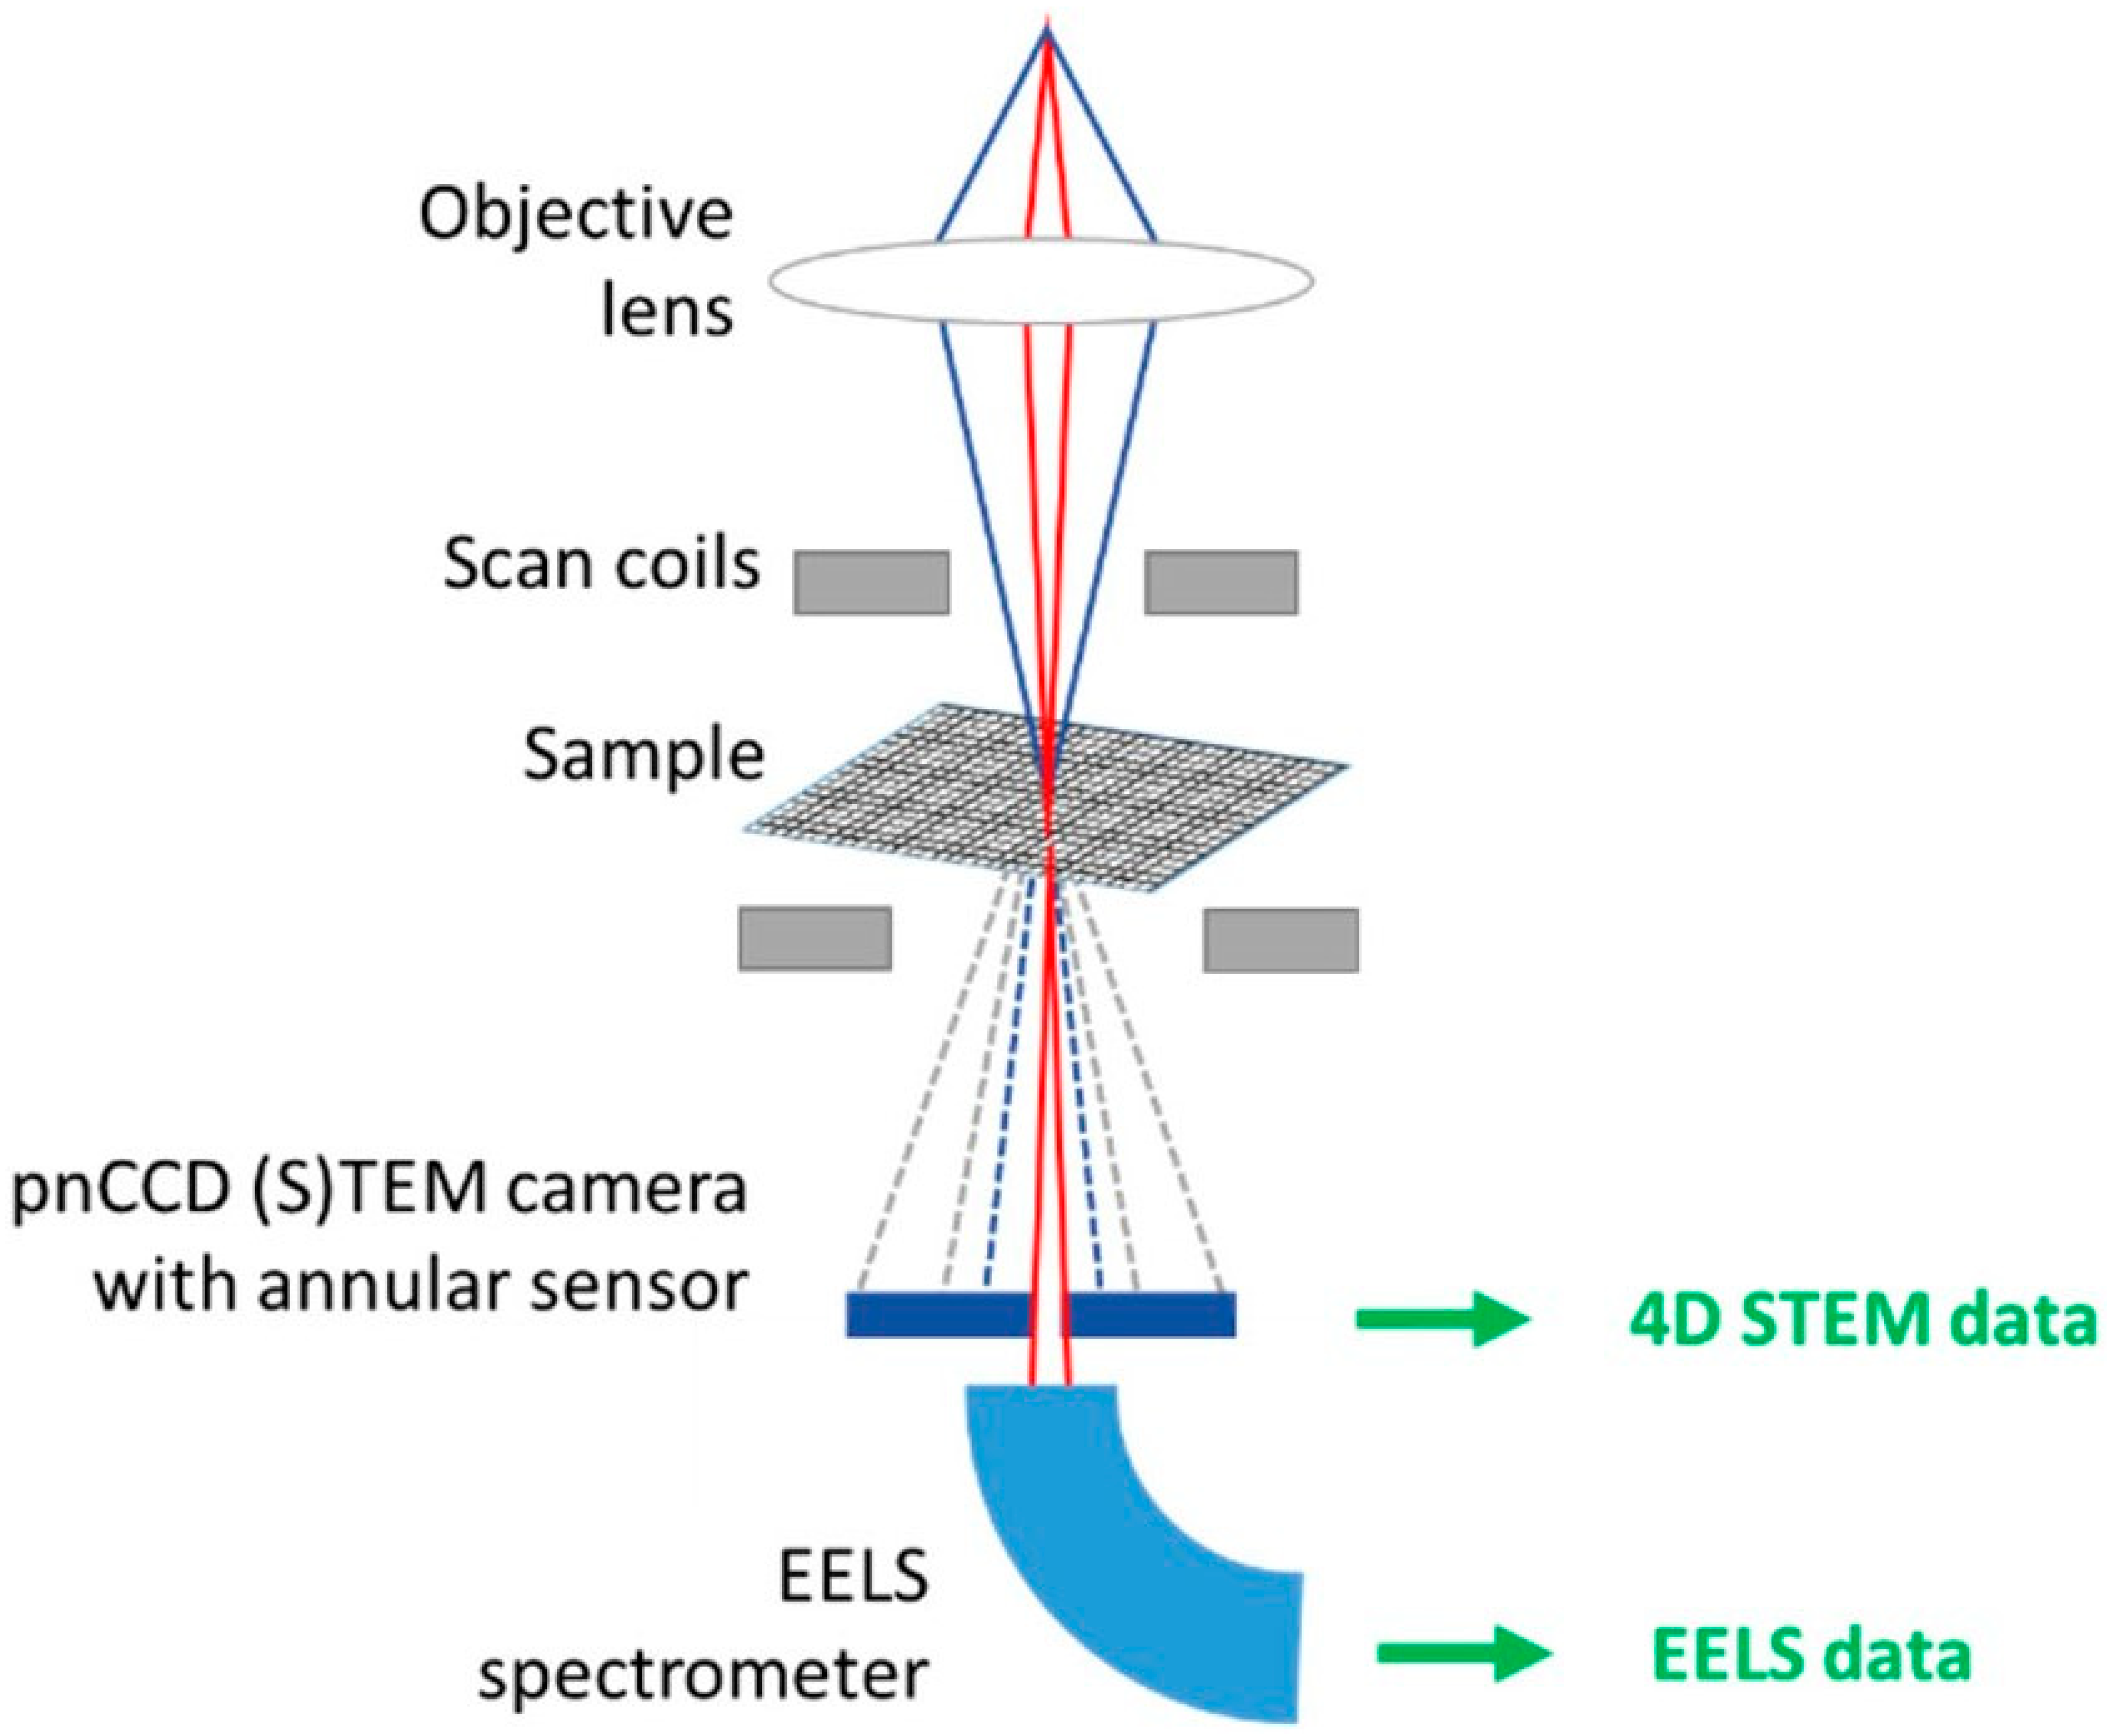
The integration of 4D-STEM with advanced spectroscopic techniques, such as energy-dispersive X-ray spectroscopy (EDS) and electron energy-loss spectroscopy (EELS), has seen significant progress. Huth et al. presented a fast pixelated direct detector with a central hole, which allows simultaneous acquisition of 4D-STEM and EELS data. This design ensures that the central part of the electron beam passes into the EELS spectrometer, while the pixelated 4D-STEM detector captures diffraction signals (Figure 11), enabling coherent phase contrast imaging and other applications [169]. Similarly, Sagawa and colleagues developed a new pixelated STEM detector that can simultaneously capture 4D-STEM and EELS data. This system was tested on a semiconductor sample, successfully providing high-contrast elemental maps alongside diffraction patterns [170]. Craig et al. further demonstrated that using 4D-STEM combined with EELS achieved sub-Ångstrom resolution in strain analysis, with precision down to 0.1% in complex multilayer heterostructures [171].
Motoki et al. [172] used 4D-STEM to investigate Al0.3In0.7N grown on GaN. They obtained images of the AlInN/GaN interface (Figure 12a,b) and strain maps by analyzing the movement of diffraction spots between adjacent diffraction patterns (Figure 12e,f). The study revealed that interface-generated dislocations lead to sudden strain relaxation, resulting in higher-quality film growth. They concluded that compared to traditional MBE or Metal–Organic Vapor Phase Epitaxy (MOVPE) [173] deposition techniques, metal modulated epitaxy (MME) [174] would be ideal for growing high-quality indium-rich AlInN films.
4D-STEM is capable of capturing multidimensional data, but its data processing and analysis are relatively complex, particularly when dealing with large-scale electron diffraction data. Integrated Differential Phase Contrast (IDPC) offers a more straightforward and simplified approach to data acquisition.

2.4.2. Ultrafast TEM

Ultrafast TEM (UTEM) is an advanced technique designed to study dynamic processes on femtosecond to picosecond timescales [175,176]. This typically involves the use of pump laser pulses to excite the sample, inducing transient structural or electronic changes, followed by synchronized electron pulses as the probe to capture the evolving state of the sample at different time delays. Such a setup allows for atomic-scale snapshots of dynamic processes with femtosecond temporal resolution, enabling the reconstruction of transient structural information. The pump laser serves to excite electrons or lattice vibrations within the sample through optical energy, creating a transient nonequilibrium state, such as carrier relaxation, strain release, or phase transitions in semiconductor heterostructures. The probe electron pulses, precisely synchronized with the pump pulses, enable snapshot imaging of the sample at specific time points. By recording these snapshots frame by frame, the temporal evolution mechanisms of dynamic processes can be resolved [177].
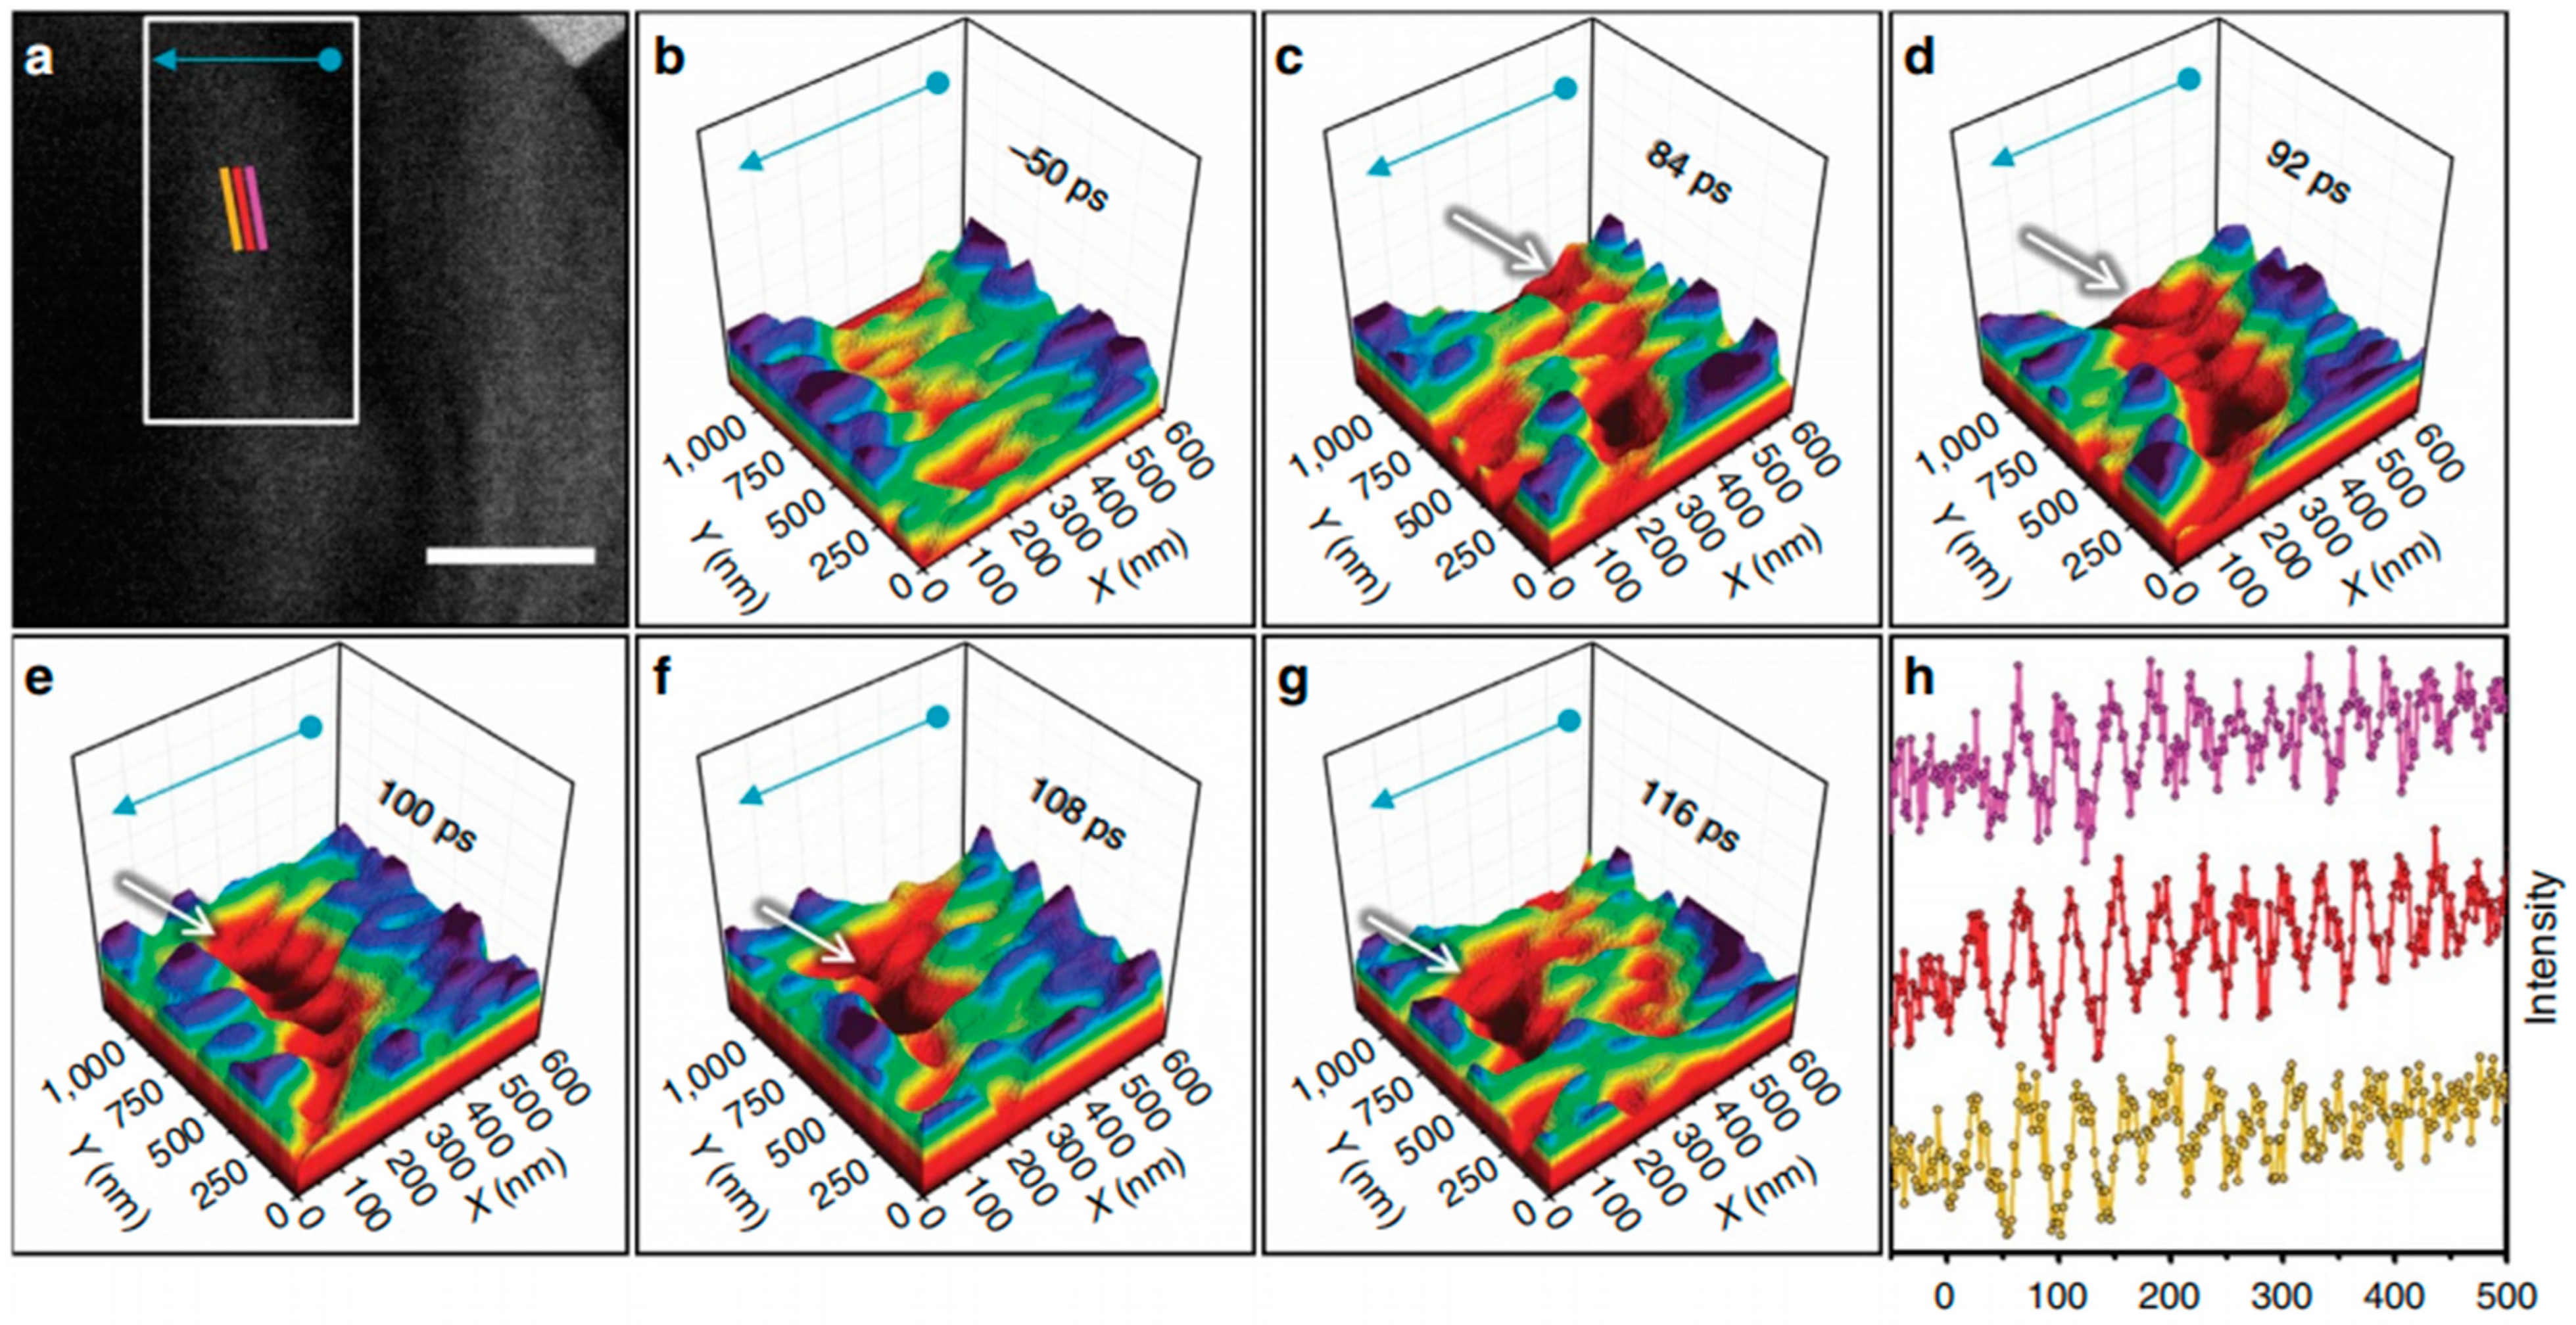
In addition to the conventional approach of using optical pump lasers and synchronized electron pulses for probing, fast electron pulses can also be directly utilized for both the pump and probe stages. One possible approach is the use of single electron pulses generated from a GaAs photocathode, pumped by a femtosecond laser, as shown by Ropers et al. [178] in Göttingen. These electron pulses, generated by the photoemission process, can be used to either excite or probe the sample with femtosecond precision. Another approach involves repeated electron pulses produced by modulating an electron beam with a high-frequency (HF) cavity [179]. This method generates a series of periodic electron pulses, which allows high-precision time-resolved movies. In addition, due to the excellent spatial resolution provided by TEM, the development of UTEM has advantages in the study of structural and electronic dynamics in both space and time with atomic resolution. One example to show the power of UTEM is the research on phonon wave propagation at the graphene edge [180], where the spatial and temporal evolution of the strain field was quantitatively reconstructed, revealing the coupling dynamics between shear modes at the edge and the out-of-plane breathing modes. Cremons et al. [181]. Used UTEM to directly observe the nucleation (Figure 13) and propagation of phonon wavefronts (Figure 14) at step defects in WSe2 and Ge. Through surface mapping, they found that the phonon velocity (5.5–6.5 nm/ps) was consistent with the bulk material velocity, and the wavefront propagation was modulated by the local strain field, presenting a characteristic static bent profile. This study evidenced thermal transport modulation at the atomic scale, which can be expected to benefit defect engineering for enhancing the material performance.
UTEM offers significant advantages in temporal resolution; however, the limitations of UTEM are also clear: most UTEM experiments rely on the extra optical pump during the electron probe, where the photon-matter and electron-matter interaction may cause complex Bose-Einstein and Fermion condensation, creating an obstacle for measuring the physical properties of single particles. Unfortunately, possible particle condensation phenomena during optical-pumped UTEM measurements have not been properly discussed so far.
According to Heisenberg’s uncertainty principle, the accurate measurement of time is energy are forbidden. Therefore, for probing particles within the range of fs or ps, one would expect to introduce a huge error bar in the quantification of particle energy.
In this regard, material research based on UTEM is still in the preliminary stage, where plenty of new condensed matter physics remains to be discovered.

2.4.3. Differential Phase Contrast (DPC)

Compared to traditional electron microscopy imaging techniques, the DPC technique excels at enhancing image contrast, particularly in the imaging of light elements. Traditional electron microscopes struggle to produce clear images of atomic columns with light elements due to their low atomic number, resulting in weak scattering signals. In contrast, DPC captures differential phase signals to generate high-contrast images, significantly improving the visibility of light elements [182]. By using detector arrays to measure the phase shift in the electron wavefront as it passes through the sample, DPC reconstructs the internal electrostatic potential distribution, producing high-contrast images [183]. This method not only enhances the imaging quality of light elements but also can give high-resolution images under lower electron doses, minimizing radiation damage to samples. It is particularly well-suited for studying materials dominated by light elements, such as lithium and oxygen, as well as radiation-sensitive materials like graphene and cadmium sulfide [184].
In recent years, advancements in DPC technology have aimed at enhancing imaging efficiency and resolution while minimizing sample damage. On the hardware front, the introduction of multi-sector detectors has significantly improved image contrast and clarity. Li et al. demonstrated that a 12-sector detector improved the contrast of structural features by approximately 30% compared to the conventional quadrant detector, thereby enhancing the visibility of light elements in thick samples exceeding 50 nm in thickness. This multi-sector approach has been shown to modify the anisotropy in the contrast transfer function (CTF), achieving more isotropic behavior at certain frequencies but introducing azimuthal anisotropy depending on defocus and sector configuration [185,186]. These modifications markedly improve imaging performance for thick samples by balancing resolution and contrast. Additionally, DPC technology enables the generation of potential maps for thin samples. Theoretical assessments indicate that adjusting the focal point based on sample thickness can significantly optimize imaging for thicker specimens. Simulations indicated that using a quadrant detector at high defocus introduced substantial CTF anisotropy, resulting in uninterpretable images. In contrast, a multi-sector detector yielded an almost isotropic CTF, leading to much clearer images [187]. Further simulations confirmed that increasing the number of detector sectors effectively eliminated CTF anisotropy, thereby enhancing both image contrast and resolution.
In a proof-of-principle experiment, Li et al. [187] prepared samples, including InGaN/GaN quantum well structures, by grinding, polishing, and ion milling to achieve a minimum foil thickness of approximately 30 nm. Imaging was performed under two-beam diffraction conditions to minimize interference from other beams. The results demonstrated that increasing the number of detector sectors significantly reduced anisotropy in the CTF, thereby enhancing the clarity of image details, especially in thick samples. Compared to the quadrant detector, the simulated 12-sector detector in the DPC mode showed a marked improvement in imaging contrast for InGaN/GaN quantum wells. Figure 15 presents experimental STEM images of the sampled region, where the contrast arises from the InGaN/GaN quantum well structures and the glue layer between the face-to-face bonded samples. The glue interface is particularly evident as a bright region in the DPC images and is marked by arrows in Figure 15b. The images were obtained using the DPC mode with a fixed quadrant detector (Figure 15a), DPC mode with a virtual 12-sector detector (Figure 15b), and HAADF mode (Figure 15c,d). The DPC images use the same grayscale map, with the lowest intensity shown as black and the highest as white. However, the same map cannot be applied to the HAADF image, as its intensity range differs. In Figure 15c, the HAADF image is displayed using the DPC grayscale map, scaled by a factor of 10−3. This scaling results in low contrast due to the inclusion of negative values. By using a grayscale map adjusted to the HAADF intensity range, Figure 15d is obtained.
At 20 nm underfocus, the DPC image in Figure 15a is affected by CTF anisotropy, making it uninterpretable. In contrast, the virtual 12-sector detector in Figure 15b provides improved resolution and contrast, revealing phase details not visible in the HAADF images. Notably, the glue line (arrowed in Figure 15b) and the InGaN/GaN layers, magnified below Figure 15b, are resolved in the DPC but not in the HAADF images. The low magnification leads to contrast loss in the HAADF images due to the camera’s modulation-transfer function (MTF) [188].
Seifer et al. [189] introduced a flexible scanning system with a scalable eight-channel, non-multiplexed analog-to-digital converter array for recording complex STEM data. This system is integrated with SerialEM software (version is 4.0), enabling automated acquisition protocols, including tomography. Using a solid-state quadrant detector with additional annular rings, the researchers explored the generation and detection of various STEM contrast modes. Notably, by comparing images obtained from different off-axis detector elements, lateral shifts in the STEM images were observed, which varied systematically with the objective lens defocus. Compensation for this parallax effect allowed DPC images to be decomposed into distinct contributions related to projected potential and defocus. A single scan could thus yield both a computationally refocused phase contrast image and a second image where the signed intensity—representing the polarity of the image contrast—indicates the directional contrast shifts in the image caused by defocus deviations. In this scanning mode, variations in defocus create regions with contrasting brightness, highlighting shifts relative to the focal plane. These do not represent absolute intensity changes but relative contrast that depends on spatial defocus gradients, consistent with fringes at interfaces, respectively, reflecting the quantitative shift from the focal plane. The combination of this scanning mode with advanced data processing significantly enhanced the potential of IDPC-STEM for imaging complex samples.
Both 4D-STEM and DPC techniques have significantly enhanced the characterization of internal strain fields, electric fields, and magnetic fields in materials by capturing multidimensional diffraction and phase information [190]. Although these techniques can acquire multidimensional data in two- or three-dimensional space, they are still limited in resolution and imaging capabilities for certain applications. To overcome these limitations, techniques such as ptychography, tomography, and electron holography provide higher-dimensional phase information, enabling 3D reconstruction and the observation of complex internal structures in materials [191,192].

2.5. Ptychography, Tomography, and Electron Holography

2.5.1. Ptychography

Ptychography is a high-resolution coherent diffractive imaging technique that relies on scanning a coherent beam (such as X-rays, electron beams, or light) across overlapping regions of a sample and capturing diffraction patterns from each of those areas. Its working principle is based on phase retrieval techniques: in traditional imaging, the intensity of the diffraction pattern can be measured directly, but direct phase information cannot be obtained, and this phase information is crucial for reconstructing the structure of the object [193]. Ptychography addresses this by collecting multiple diffraction data from overlapping regions and using iterative phase retrieval algorithms to recover the phase, thereby reconstructing a complete image of the sample from sets of diffraction patterns. This method not only retrieves both amplitude and phase information from the sample but also avoids aberrations inherent to conventional lens-based imaging, significantly enhancing resolution and even surpassing the traditional diffraction limit [194]. Ptychography has also been described to excel in low-dose imaging, allowing high-resolution images to be obtained without increasing the radiation dose, making it particularly suitable for studying radiation-sensitive materials, such as biological tissues or nanostructures [195]. By controlling the intensity of the scanning electron or photon beam and optimizing acquisition parameters, ptychography can achieve high-precision imaging of samples at the atomic scale. Ptychography has found widespread application in materials science and biological imaging. It is capable of observing crystal structures, mapping strain distributions, analyzing defects, and achieving ultra-high-resolution imaging of samples. This technique holds great promise for future applications in nanotechnology.
Ptychography-based reconstruction algorithms have seen remarkable improvements in computational efficiency. Traditional gradient descent algorithms tend to be slow when handling large datasets. However, Valzania et al. introduced a spectral method that processes data in the frequency domain, significantly accelerating the reconstruction process. In their study, this spectral method not only reduced the reconstruction time by a factor of three but also maintained high-quality reconstructions even with a signal-to-noise ratio (SNR) of 10, whereas traditional methods often suffer from severe reconstruction artifacts under such noise levels [196]. This approach requires no additional computational cost and can be integrated into existing large-scale iterative reconstruction algorithms, allowing ptychography to handle increasingly larger datasets.
As ptychography technology evolves, the increasing size of datasets generated has posed higher demands on computational resources. Yu et al. [197] leveraged multi-core Graphical Processing Units (GPU) parallel computing technology to significantly accelerate the processing speed of large-scale ptychographic reconstructions. In their experiments, the use of a multi-GPU architecture reduced computation time to one-third compared to that of a single-GPU system, especially when processing datasets larger than 1 TB. Their proposed workflow, which also leverages the capabilities of high-performance computing (HPC) and edge computing to address the substantial data and computational demands of real-time ptychographic imaging, involves processing data at rates up to 640 Gbps. By utilizing surrogate models at the edge, they reduced both latency and computation time, enabling real-time phase retrieval even at high data acquisition rates, such as those from detectors operating at 2 kHz. Additionally, Babu et al. [198] developed a method combining GPU parallel computing and artificial intelligence algorithms, also enabling data processing at a rate of 2 kHz. In their edge computing environment, the entire process from detector data transmission to processing could be completed in real time, making on-site imaging applications feasible.
Hill et al. [199] employed multi-angle Bragg projection ptychography to characterize 3D strain and structural defects in individual InGaAs nanowires. The study focused on wurtzite-phase nanowires, supported on silicon substrates, using focused coherent X-rays to measure reciprocal space [200] Bragg diffraction patterns. These patterns were then numerically reconstructed into a real-space volume, revealing variations in lattice orientation along the length of the nanowires and the spatial distribution of stacking faults. For instance, reconstructed images from the ( 2 1 ¯ 1 ¯ 0 ) Bragg peak (Figure 16) displayed significant lattice twisting along the nanowire axis, while the strain field across the cross-section remained stable, with variations smaller than ±3 × 10⁻⁴. This indicated minimal impact on the bandgap structure.
Conversely, reconstructed images from the ( 01 1 ¯ 0 ) Bragg peak (Figure 17) revealed detailed stacking fault distributions, with clear phase changes at stacking faults, highlighting differences in stacking sequences across regions. These images demonstrated that stacking faults form distinct planar boundaries within the nanowires, significantly affecting charge carrier scattering behavior. Through high-resolution image reconstruction and analysis, Hill et al. successfully imaged strain and defects from the micron scale to the nanoscale within the nanowires. These results underscore the potential of ptychography for complex nanostructure characterization, particularly for in-operando strain and defect imaging in nanodevices.
Ptychography exhibits strong advantages in 2D phase retrieval but still has limitations in resolving complex 3D structures, especially when precise reconstruction of the sample’s overall geometry is required. Tomography offers a more comprehensive solution by acquiring a series of projection images from multiple angles, enabling the precise reconstruction of the sample’s 3D structure. This allows researchers to analyze the internal complexity of materials, such as nanoparticles and pore structures [201]. Unlike ptychography, tomography specializes in the 3D reconstruction of geometric morphology, making it suitable for a full analysis of a material’s internal structure, providing more complete spatial information [202].

2.5.2. Tomography

A single (S)TEM image is essentially a 2D projection of a 3D object, which fails to capture structural details in amorphous or polycrystalline samples due to irregular atomic arrangements along the projection direction. Tomography is an effective technique for reconstructing a sample’s 3D structure by acquiring 2D projection images at different tilt angles. Its principle is similar to X-ray computed tomography (CT) used in medicine, but with a key difference: in X-ray CT, both the X-ray source and detector are tilted while the sample remains stationary, whereas in electron tomography, the sample holder is tilted while the electron beam and detector remain fixed [203]. During the tomography process, the sample is gradually tilted, and a series of high-resolution images are captured at each tilt angle. By computationally overlaying the information from these projection images, the 3D structure of the sample can be accurately reconstructed [204]. Commonly used algorithms include filtered back projection (FBP), which is computationally efficient and based on the Radon transform, a mathematical technique that reconstructs a 3D object from its 2D projections by integrating data along various angles. In contrast, iterative approaches like the simultaneous iterative reconstruction technique (SIRT) and algebraic reconstruction techniques (ART) rely on iterative optimization methods to refine the 3D reconstruction by minimizing discrepancies between measured projections and reconstructed projections. These iterative methods are effective in handling noise, incomplete data, and artifacts, which are common in electron tomography, thus ensuring more accurate reconstructions of the sample’s true 3D structure. This method is particularly useful for studying complex material structures at the nanoscale, such as the distribution of active nanoparticles in catalysts, the 3D structure of biomolecules, the internal pore structure of porous materials, or complex semiconductor devices such as non-planar field-effect transistors.
One major drawback of electron tomography is the long acquisition time for tilt series, which results in a higher electron dose. Vanrompay et al. [205] proposed a fast tilt series acquisition approach, which holds promise for in situ tomography applications. When tilt series acquisition is not feasible, time-resolved projection series can reveal the evolution of 4D molecular structures [206]. Cryo-STEM tomography has been performed to map the accessibility of fuel cell catalyst nanostructures [207]. Electron tomography can also be combined with depth slicing to achieve high-resolution and wide-field 3D reconstructions [208]. More recently, by combining atomic counting methods with local minima search algorithms or molecular dynamics relaxation, it has been demonstrated that even a single 2D HAADF-STEM image can be reconstructed in 3D for catalyst nanoparticles under certain conditions, such as homogeneous chemistry [209,210,211,212]. These techniques are expected to open new possibilities for in situ 3D characterization, such as in gas or liquid cells [213,214,215,216].
Nicolai et al. [217] comprehensively characterized the 3D structure of III-V semiconductor interfaces using electron tomography, with a focus on interface roughness. In their study, chemically sensitive high-angle annular dark-field scanning transmission electron microscopy (HAADF-STEM) was employed to perform tomographic reconstructions of (Al,Ga)As/GaAs multilayer structures. These reconstructions generated topographic height and width maps of iso-concentration surfaces, allowing for a detailed analysis of interface roughness and chemical properties. The analysis revealed interesting features in both the morphology and chemical composition of the interfaces. Through 3D reconstructed images (Figure 18) and height maps, Nicolai et al. found that inverted interfaces (AlAs layer grown on top of a GaAs layer) exhibited higher root-mean-square (RMS) roughness values compared to direct interfaces (GaAs layer grown on top of an AlAs layer). The spatial distribution of width variations also exhibited considerable anisotropy, indicating that the chemical extension of the interface regions varied significantly. These data and image analyses provide in-depth insights into the microstructure of III-V heterojunction interfaces and their potential impact on carrier behavior, which are critical for optimizing semiconductor device performance [218].
Tomography cannot retrieve the subtle phase shifts in the electron wavefront induced by a sample’s internal electric and magnetic fields. To address this limitation, electron holography directly measures these phase shifts, enabling precise quantification of internal electromagnetic fields and potential differences [219]. By overcoming the constraints of tomography in characterizing such fields, electron holography also broadens the scope for investigating a material’s intrinsic physical properties [220].

2.5.3. Electron Holography

Electron holography is an imaging technique based on the phase information of electron waves, capable of directly measuring and reconstructing the phase changes that occur as electron waves pass through a sample. The basic principle of electron holography involves splitting the electron wave into a reference wave and an object wave. The reference wave bypasses the sample and directly propagates to the detector, while the object wave passes through the sample and is influenced by its internal structure [221]. These two waves then overlap at the detector, forming an interference pattern or hologram. The hologram contains information about the amplitude and phase of the sample, and through digital processing, the complex wavefunction of the sample can be extracted from the hologram, allowing the reconstruction of the internal potential and magnetic field distribution within the sample [222]. Electron holography excels in studying the electromagnetic properties of materials, particularly when investigating the internal field distribution in nanoscale magnetic materials, semiconductor devices, and ferroelectric materials [223].
In recent research, Anada et al. enhanced the quality of electron holograms through mathematical and machine learning-based denoising techniques, which are especially useful for low-dose and high-speed imaging. They introduced three denoising methods: sparse coding (SC), wavelet hidden Markov model (WHMM), and tensor decomposition (TD). The study showed that applying SC to simulated holograms reduced the phase error from 0.10 rad to 0.02 rad, demonstrating significant denoising performance. WHMM similarly reduced the phase error from 0.09 rad to 0.02 rad, with both methods performing comparably. TD excelled in multi-dimensional data processing, reducing the phase error from 1.33 rad to 0.02 rad through denoising. These methods provide effective tools for improving the imaging quality and measurement precision in electron holography [224].
Li et al. [225] further detailed the application of off-axis electron holography in elemental, compound, and two-dimensional semiconductor nanostructures, revealing structure-property relationships at the nanoscale. Their study quantitatively measured charge accumulation in Ge/Si quantum dots and Ge/Si nanowires, finding hole densities of 0.03 holes/nm3 and 0.4 ± 0.2 holes/nm3, respectively (Figure 19). This indicates that one-dimensional structures have stronger charge confinement capabilities compared to zero-dimensional structures [226]. Additionally, they examined GaAs nanowires modified with InAs quantum dots, revealing electron accumulation at the quantum dot apex region (Figure 20) [227]. This resulted in a pronounced radial polarization field, explaining the observed enhancement in photoluminescence intensity [228].
Ptychography, tomography, and electron holography (Table 5) are transformative tools for materials characterization, providing detailed insights into nanoscale structural, chemical, and functional properties. Yet, their application is constrained by computational demands, experimental challenges, and rigorous sample preparation. Addressing these limitations through advancements in algorithms, integration of complementary techniques, and improved hardware design is essential to fully leverage their potential in multidisciplinary research. By tackling these barriers, these methods can expand their role in probing nanoscale phenomena with precision and clarity. Wider adoption will depend on simplifying workflows and increasing accessibility without sacrificing performance or resolution.

2.6. TEM and Application

The growth processes, such as MBE and MOCVD, largely determine the microstructure of materials. However, the complexity of these processes and the control of their parameters have varying impacts on interface quality, strain distribution, and crystalline defects. TEM plays a crucial role in revealing the effects of different growth techniques on material quality by precisely characterizing interface sharpness, defect distribution, and strain states. TEM has become indispensable in evaluating and optimizing semiconductor growth processes.
For example, Yan et al. [229] utilized TEM to analyze InAs/GaSb heterostructure nano-ridges grown on Si substrates via MOCVD (Figure 21). Cross-sectional TEM imaging clearly revealed defect-free interface quality achieved by optimizing precursor switching sequences and precisely controlling the V/III ratio. These findings directly linked interface quality to the performance of tunneling devices, demonstrating the advantages of MOCVD in growing III-V materials on Si substrates. Similarly, Gourishetty et al. [230] used TEM to investigate the effects of Rapid Thermal Processing (RTP) on MBE-grown InAs quantum dots and sub-monolayer (SML) structures. TEM imaging provided quantitative data on atomic diffusion and structural changes during annealing. Combined with photoluminescence (PL) measurements, these studies showed that RTP significantly improves quantum dot uniformity and reduces defect density, highlighting the importance of post-growth thermal treatment in optimizing MBE-grown structures.
By accurately characterizing defect density, interface sharpness, and material uniformity, TEM not only enables direct comparison of different growth techniques but also provides practical feedback for optimizing process parameters. Furthermore, integrating TEM with complementary techniques such as atomic force microscopy (AFM) and PL further enhances its value in semiconductor material research.
TEM is effective in its ability to resolve structural and electronic features at the atomic scale; its application to semiconductor heterostructures, such as those exhibiting Fabry–Perot resonances [231], has certain limitations. Fabry–Perot oscillations, which are optical interference phenomena, require coherent light to probe the optical response of a cavity formed by heterostructures. Conventional TEM, using high-energy electrons with de Broglie wavelengths several orders of magnitude smaller than the relevant optical wavelengths, cannot directly measure these oscillations. However, TEM indirectly supports such studies by confirming critical structural properties. The thickness and uniformity of layers, key parameters for achieving Fabry–Perot resonance conditions, can be measured with atomic precision using TEM. Advanced techniques such as scanning transmission electron microscopy-electron energy loss spectroscopy (STEM-EELS) [232] and electron holography enable mapping of high dopant distributions and potential profiles, providing insights into the local electrostatic environments that influence optical properties. However, caution is required when interpreting these measurements, as spatial resolution in electron microscopy far exceeds the coherence length of light involved in Fabry–Perot oscillations, potentially leading to an overestimation of the role of structural imperfections. Furthermore, standard dopant concentrations often fall below the detection limit of these techniques, and the uncertainty in potential profile measurements remains substantial (≫0.1 eV), limiting their direct applicability in quantitative electrostatic analysis.
To address these limitations, complementary optical techniques such as Fourier transform infrared spectroscopy (FTIR) and PL spectroscopy are essential for directly probing optical phenomena and validating structural insights provided by TEM. The integration of PL data with TEM-based structural analysis has been demonstrated to effectively bridge the gap between nanoscale structure and macroscopic optical performance. Walther et al. [233] correlated HRTEM-measured AlAs/GaAs interface widths (e.g., reduced from 3.2 ML to 1.9 ML with growth interruptions) and step distances measured between terraces with PL linewidths (narrowed to <1.0 ML), directly linking atomic-scale roughness to quantized optical responses, demonstrating how combined TEM and PL analysis bridges nanoscale structure with device-scale performance.
TEM remains an indispensable tool for analyzing semiconductor heterostructures, particularly for understanding the impacts of growth processes such as MBE and MOCVD on material quality. Its role in elucidating the microstructural origins of macroscopic optical phenomena, when paired with complementary optical and topographical techniques, underscores its critical position in semiconductor research. However, a more integrated and cautious approach, combining structural and functional measurements, is essential for fully leveraging the capabilities of TEM in optimizing both growth processes and device performance.

2.7. Summary

TEM has become a central tool in crystallographic analysis. Electron diffraction techniques can measure lattice parameters, strain, and crystal symmetry with high precision and are effective for examining local crystallographic features in complex material systems. At the same time, high-resolution imaging methods—such as HAADF, BF, and LAADF in HRSTEM—offer spatial resolution surpassing that of conventional XRD or AFM, allowing direct visualization of the microscopic structures of crystal defects. Recent advances in 4D-STEM and DPC imaging further enable multidimensional strain mapping and light-element imaging under low-dose conditions, thereby advancing the study of compound semiconductors. These approaches, however, are not without limitations. Although electron diffraction methods are highly accurate, they impose strict requirements on sample thickness and orientation, and thicker specimens are prone to artifacts from multiple scattering. Techniques such as WBDF and TBC excel at highlighting defect contrast, yet their sensitivity to sample orientation and limited spatial resolution narrow their scope of application. Even the latest methods, such as 4D-STEM and DPC, remain constrained by demanding hardware specifications and complex data processing. Achieving consistent imaging conditions poses additional challenges, particularly when examining heterogeneous materials, e.g., strain relaxation and dislocation formation in III-arsenide thin films. Integrating multiple TEM techniques offers one promising route to surmount these obstacles.
Future developments will concentrate on automation (e.g., machine-learning-based data analysis) and hardware improvements (e.g., ultrafast detectors) to improve usability and broaden the range of applications. By overcoming current technical bottlenecks, TEM will play an increasingly important role in optimizing the structure and performance of semiconducting nanostructures and will guide the design and fabrication of next-generation electronic and optoelectronic devices.

3. In Situ TEM

In situ TEM enables the real-time observation of materials under various external stimuli, such as temperature, pressure, mechanical stress, and chemical environments. The core principle of in situ TEM lies in its ability to manipulate the sample environment while observing it, allowing the study of the material’s behavior under dynamic conditions [234]. To achieve this, researchers integrate specialized sample holders and environmental control systems into the TEM setup. For example, heating or cooling stages provide precise temperature control, enabling the study of phase transitions and crystal growth at different temperatures. Gas cells introduce specific gases into the TEM chamber, allowing real-time observation of chemical reactions or catalytic processes under controlled atmospheric conditions. Mechanical actuators apply external stress or strain to the sample, enabling the observation of deformation and fracture behaviors at the nanoscale. Liquid cells facilitate the study of materials in liquid environments, such as tracking the movement of nanoparticles in solution or monitoring changes in electrochemical systems. By combining these environmental control devices with TEM high-resolution imaging capabilities, researchers can induce and monitor dynamic changes in the sample, providing a more realistic view of its behavior under conditions that closely resemble its actual working environment. This dynamic observation is critical for understanding processes such as crystal growth, phase transitions, defect evolution, and surface reactions—phenomena that are difficult to capture with traditional static techniques.
In situ TEM provides advantages for the real-time observation of dynamic processes and structural transformations in materials. However, its application is fundamentally limited by electron beam-induced damage. Furthermore, the vacuum conditions typically achievable in most (S)TEM in situ setups fail to meet the stringent UHV standards required for direct comparisons with MBE, thereby constraining the use of such environments for growth studies. High-dose electron beam irradiation can cause structural damage to samples, particularly those sensitive to electron beams. A key challenge in current in situ TEM techniques is obtaining clear images under low-dose electron beam conditions without compromising the integrity of the sample. Katsuno et al. [235] addressed this issue by leveraging deep learning techniques, employing convolutional neural networks (CNNs) to rapidly enhance low-dose electron microscopy images (Figure 22). Their approach not only minimized beam-induced sample damage but also preserved image quality, providing new insights for real-time observation of electron beam-sensitive materials.
Zhao et al. employed pressure-controlled cells in conjunction with an on-chip gas reaction nanolab, achieving precise control over the gas environment surrounding the sample in TEM. The design involved an advanced polymer membrane sealing technique and a nanofluidic control system, enabling adjustable pressures between 0.1 and 4 bar within the reaction cell. This setup allowed real-time atomic-resolution imaging during catalytic reactions. The system demonstrated exceptional stability, with ultra-low thermal drift during high-temperature operations up to 1300 °C, ensuring precise observation of dynamic structural transformations [236].
In situ TEM, combined with pressure-controlled cells and low-intensity electron beams, is gradually approaching the capabilities of other in situ techniques. To minimize sample damage while ensuring sufficient resolution, researchers lower the electron beam intensity or use lower primary accelerating voltages. These measures help reduce the impact of the electron beam while maintaining image quality and avoiding excessive damage to the sample. Additionally, shortening the exposure time or reducing the total electron dose is an effective means of preserving the integrity of the sample. Repeating experiments under different accelerating voltages, beam flux densities, and exposure times is crucial for understanding and assessing the impact of the electron beam on the sample. By carefully tuning these experimental parameters and utilizing advanced image processing techniques, such as deep learning, to enhance low-dose imaging, we can minimize electron beam-induced damage, making in situ observations under high voltage more accurate and reliable. However, continuous improvements and refinements are still needed to ensure its broad applicability and accuracy in studying dynamic processes and material transformations.

3.1. Sample Preparation and Mounting for In Situ TEM

The success of in situ TEM experiments heavily depends on the preparation and mechanical fixation of samples. To achieve precise in situ observations within the microscope, samples must be meticulously processed, typically maintaining a thickness in the range of tens of nanometers to ensure that the electron beam can effectively penetrate and produce clear imaging. Focused ion beam (FIB) technology is one of the most commonly used methods for sample preparation. FIB milling is commonly employed to produce such ultrathin specimens with nanometer-scale precision [237]. Although this approach can preserve overall crystallinity, the process invariably introduces point defects and can alter doping profiles due to gallium ion implantation. At higher ion doses, localized amorphization and the formation of gallium-rich droplets may occur, necessitating careful optimization of milling parameters and post-processing treatments [238]. Such meticulous preparation is particularly crucial for studying complex microstructures and heterogeneous materials.
During sample preparation, protective strategies are often employed to minimize damage. Prior to FIB milling, a thin layer of carbon or a noble metal (e.g., platinum) is frequently deposited onto the sample surface to reduce ion-induced sidewards scattering, curtaining, and ion implantation [239]. For heat-sensitive materials, such as biological samples or organic compounds, low-temperature preparation techniques may be employed to reduce thermal effects [240]. The prepared samples need to be mounted in specially designed in situ sample holders. These holders not only support the samples but also enable the application of external conditions, such as mechanical stress, temperature variations, or electric fields, within the microscope [241]. The critical aspect of designing these in situ sample holders lies in maintaining the stability of the sample under high vacuum and with minimal temperature drift, while allowing for real-time observation during the experiment. These holders are typically equipped with multi-axis positioning systems, enabling precise adjustments of the sample’s position and angle to achieve optimal imaging results.
During focused ion beam (FIB) processing, exposure to high-voltage ion beams can induce damage to sample surfaces, leading to various issues, such as point defects, surface amorphization, gallium enrichment, and droplet formation. To mitigate these problems, the following strategies are commonly employed:
(a) Reduced ion current and voltage: By lowering the ion current and voltage during FIB processing, especially in the final cleaning steps, it is possible to decrease surface damage. For instance, a low current and low voltage beam (around 500 V) can effectively remove residual ion contamination resulting from the high-voltage process, thereby reducing point defects and amorphization [242].
(b) Post-FIB treatments: Subsequent annealing or other post-processing methods applied after FIB can help heal point defects and restore crystalline order disrupted by gallium ion implantation [243].
(c) Alternative ion sources: Replacing conventional gallium (Ga) ions with other ion species, such as cesium (Cs) or xenon (Xe), can minimize gallium-related contamination and enrichment. Owing to their higher mass, these alternative ions are slower at the same kinetic energy and so may inflict less damage to the sample [244].
(d) Protective surface coatings: Prior to FIB processing, coating the sample surface with a thin layer of carbon or a noble metal (e.g., platinum or gold) can shield the underlying material from direct ion-beam impact, thus reducing the extent of surface damage [245].
(e) Low-energy ion scanning at the final stage: Employing low-energy ion beams (on the order of 50–500 eV) during the final stages of FIB processing can further decrease surface damage and reduce amorphization [246].
(f) Parameter optimization: Fine-tuning FIB parameters—such as ion beam energy, focus quality, and scanning speed—significantly lessens damage induced by high-voltage ion beams [247].
Gardener et al. [248] developed a FIB preparation method for high-temperature in situ TEM experiments, improving the mechanical stability of samples during heating while reducing contamination. Similarly, Zhong et al. [249] proposed the use of Xe plasma FIB as an alternative to conventional Ga-based FIB, which speeds up thinning, eliminates gallium contamination, and may provide better imaging quality, particularly in high-temperature experiments. In another study, Radić et al. highlighted FIB optimization methods for in situ thermal and electrical TEM experiments, especially under applied bias, demonstrating improvements in controlling contamination and ensuring sample stability [250]. Moreover, Minenkov et al. introduced a method for preparing plan-view samples using FIB, particularly suited for in situ heating experiments, which enhanced sample quality and enabled real-time observation of structural evolution [251].

3.2. In Situ Technology and Application

3.2.1. Thermal Dynamics of Strain and Dislocations

During heat treatment, the internal strain fields and dislocation behavior of materials play a crucial role in determining their final properties. In situ TEM technology allows researchers to directly observe and quantify the internal strain distribution and dislocation dynamics of materials under high-temperature conditions. This technology enables the capture of local variations in strain fields at the sub-nanometer scale, revealing how strain drives the generation, glide, climb, and interaction of dislocations [252]. Additionally, through techniques such as GPA, in situ TEM can perform quantitative analysis of the evolution of strain fields at high temperatures, providing a detailed description of strain concentration in certain regions and their changes over time [253].
In situ TEM also reveals the specific mechanisms of strain release and dislocation annihilation during heat treatment, particularly concerning the dynamic evolution of microstructures at high temperatures. When the temperature reaches a certain threshold, internal strain may be partially relieved through dislocation climb, which reduces residual stress within the material. This process directly impacts the material’s creep resistance and long-term performance at high temperatures, making it critical for maintaining stability under such conditions [254]. By observing these dynamic processes in real time, researchers can gain a deeper understanding of the microstructural behavior of materials during heat treatment, providing theoretical support for the development of high-performance materials [255].
Chen and colleagues [256] conducted a detailed study using in situ TEM to investigate the phase transformation between nickel and InGaAs nanowires, revealing the dynamic behavior of atomic ledges and dislocations during the process. Their findings indicated that under in situ heating at 320 °C, a nickelide phase forms at the InGaAs interface, accompanied by the movement of double-bilayer ledges. The formation of misfit dislocations plays a central role in relieving the strain caused by lattice mismatch. Specifically, the interface between In0.53Ga0.47As and Ni2In0.53Ga0.47As is described by the planes [111] In0.53Ga0.47As and [0001] Ni2In0.53Ga0.47As, with an in-plane rotation vector in the Ni2In0.53Ga0.47As [ 01 1 ¯ 0 ] direction. In situ TEM images clearly show ledges moving along the [1010] direction with a ledge height of 10.17 Å, while the Burgers vector of the misfit dislocations is 2/3 [0001]. These dislocations are key to mitigating shear stress at the interface, highlighting the formation and evolution of the “disconnection” structure. This process illustrates how lattice strain is dynamically adjusted during phase transformations in III-V semiconductor nanowires.
Further experimental data provided insight into stress release at the interface between the nickelide phase and InGaAs. Fast Fourier transform (FFT) analysis revealed the atomic structure of the interface, showing a lattice mismatch of 5.5% (In0.53Ga0.47As || Ni2In0.53Ga0.47As) and nickelide volume expansion of 34%. This high-resolution atomic observation offers insight into the nanoscale phase transformation mechanism, elucidating how the interaction between ledges and dislocations contributes to the stabilization of the newly formed nickelide phase by relieving lattice strain.
As illustrated in Figure 23, the experiments depict the mechanism of atomic ledge formation and dislocation generation. The images show that within 0.05 s, the movement of the ledge significantly slows down, indicating the completion of stress release. In particular, the height of the double-bilayer ledge (10.17 Å) and its interaction with misfit dislocations signal a lattice rearrangement during the phase transformation. The results suggest that, in the metallization of nanowires, precise control over ledge formation and dislocation movement can effectively enhance contact performance and material stability by optimizing stress release at the interface.
This high-resolution in situ TEM study provides insights into the phase transformation of nanowire-metal contacts, offering significant implications for the design and optimization of contact engineering in nanoscale semiconductor devices. The understanding gained from this work paves the way for improving the reliability and performance of future nanoelectronics.

3.2.2. Stress-Induced Deformation and Phase Transformation

When a material is subjected to external stress, it may undergo elastic strain relief, plastic deformation, or even stress-induced phase transformation. These structural changes are typically accompanied by the generation and movement of dislocations. In situ TEM can reveal the microstructural changes induced by stress, such as how dislocations begin to form within the crystal and propagate along specific slip planes, ultimately leading to plastic deformation of the material [257]. By observing these dynamic processes in real time, researchers can gain insight into the effects of different types of stress (tensile stress, compressive stress, shear stress) on the microstructure of materials. In situ TEM can also reveal the specific mechanisms of stress-induced phase transformations. In certain high-entropy alloys or shape memory alloys (e.g., NiTi, AlCoCrFeNi alloys), the application of external stress can prompt the material to transform from one crystalline phase to another, a process often accompanied by volume changes and the evolution of phase boundaries [258]. In situ TEM is capable of monitoring the atomic rearrangements during these phase transformations in real time and quantifying the stress distribution before and after the transformation.
Wang et al. conducted an in situ TEM study to explore the mechanism of deformation-induced crystal-to-amorphous transition (CAT) in silicon. Using a novel core–shell structure, they achieved real-time monitoring of large plastic deformation and of the CAT process in sub-micron silicon pillars. The results demonstrated that diamond-structured silicon undergoes a direct transition to an amorphous phase through the generation and accumulation of stacking faults (SFs) mediated by slip, without any formation of intermediate crystalline phases.
High-resolution TEM characterization shown in Figure 24 revealed the microstructural evolution during the CAT process. At small plastic deformation (εp = 1%), slip bands containing stacking faults and dislocations appeared in crystalline silicon (c-Si) (Figure 24b,c). As the strain increased to εp = 5%, the regions with stacking faults began to amorphize (Figure 24d). With further deformation up to εp = 18%, the amorphous regions expanded along the [111] direction, forming “amorphous pockets” coexisting with crystalline segments (Figure 24e). Finally, at εp = 25%, nearly all crystalline structures had transitioned to the amorphous phase, with adjacent amorphous regions merging (Figure 24f). No intermediate crystalline phases were observed throughout the process, indicating that the CAT is directly driven by slip-mediated defect accumulation. These findings provide new insights into deformation-induced phase transitions in other brittle solids [259].

3.3. Challenges for In Situ TEM Applications

Despite the promising applications of in situ TEM in materials science, its practical implementation still faces several significant challenges that must be addressed in future research and technological development.
First, in situ or in-operando measurements aim to evaluate properties under conditions that closely mimic real growth or device operation environments. However, the presence of free surfaces in electron-transparent specimens can influence and potentially distort the measurements as follows:
(a) Semiconductor materials typically possess nanoscale feature dimensions and are thus highly sensitive to electron beams. The high electron-beam current densities required for high-resolution imaging can induce defect formation, interfacial damage, or even phase transitions, thereby preventing the observed behavior from accurately reflecting the material’s performance under real operating conditions. This imposes stringent controls on imaging at high beam currents and voltages, making it a critical challenge to mitigate electron-beam damage while maintaining high spatial resolution [260].
(b) During sample preparation via FIB techniques, issues such as gallium ion incorporation, point defects, and gallium precipitation can be readily introduced, resulting in modified sample properties. Moreover, semiconductor materials impose stricter requirements on sample thickness control: samples that are too thick reduce electron-beam penetration and degrade imaging quality, whereas samples that are too thin may introduce surface strain or inhomogeneity, compromising the accuracy of experimental results [139].
Second, retaining the balance between spatial resolution and temporal resolution remains a major challenge in in situ TEM. Under dynamic conditions, especially in high-temperature or high-stress environments, the microstructure of materials can change rapidly. To capture these transient phenomena, in situ TEM must achieve high temporal resolution. However, as imaging speed increases, the signal-to-noise ratio decreases, limiting the ability to resolve fine microstructural details. Therefore, maintaining high spatial resolution while further improving temporal resolution is a key technical issue that requires attention [261].
Third, the complexity of sample preparation significantly increases the difficulty of in situ TEM experiments. Samples used in these experiments must not only have sufficient mechanical stability to withstand external conditions but must also retain their original structural characteristics. The thickness of the sample must be controlled within a precise range: overly thick samples can hinder electron beam penetration, degrading image quality, while overly thin samples may undergo artificial changes under experimental conditions due to surface effects, including surface oxidation. Moreover, the design of sample holders is particularly complex, especially when external conditions such as electric fields, stress, or temperature variations need to be applied, making sample preparation more time-consuming and costly [262].
Fourth, environmental control presents another major challenge for in situ TEM technology. Typically, in situ TEM experiments are conducted in a high-vacuum environment, which differs significantly from the environments in which many materials are applied in practice, such as those involving atmospheric corrosion or humidity effects. Therefore, accurately simulating the complex chemical and physical conditions of actual working environments under high-vacuum conditions remains a significant challenge. Additionally, unexpected reactions may occur in samples under high-temperature, high-pressure, or strong electric field conditions, posing further challenges to precise experimental control [263].
Fifth, the complexity of data processing and analysis limits the widespread application of in situ TEM technology. In situ TEM experiments often generate large volumes of high-resolution dynamic image sequences (movies), and processing and analyzing these data requires powerful computational capabilities and sophisticated algorithms. Although there have been advances in artificial intelligence and machine learning in this area, large-scale application still faces challenges, including the high reliability required for algorithms and the dependence on large datasets for training [264].

3.4. Summary of This Section

In situ TEM techniques play a key role in the real-time observation of atomic-scale changes in materials under external stimuli, particularly in studies of strain release, dislocation motion, and phase transformations. By integrating aberration-corrected imaging, high-speed detectors, and advanced data processing, both spatial and temporal resolution have improved, closing the gap between static structural analyses and device behavior under operational conditions. Nevertheless, in situ TEM still faces certain obstacles. High electron-beam intensity can induce beam damage, affecting material properties and complicating the interpretation of results. A restricted field of view and the inability to replicate some operating environments, such as high-pressure or corrosive conditions, also limit its scope. These issues point to the need for complementary techniques, such as Raman spectroscopy or molecular dynamics simulations, to achieve more comprehensive insights.
In the future, progress in low-dose imaging methods and new detector designs is expected to reduce beam damage and broaden the applicability of in situ TEM. Developments in environmental TEM and multi-modal analysis may further overcome existing constraints, enabling the study of more complex conditions. This expansion will support materials science and technological innovation by providing a more complete understanding of how materials behave under realistic working environments.

4. Conclusions and Outlook

TEM remains a critical technique for investigating semiconductor materials, offering high spatial resolution to examine various structural defects, such as grain boundaries, interfaces, vacancy clusters, dislocations, and quantum dots. These defects play a pivotal role in determining the electrical, thermal, and mechanical properties of semiconductor materials. Advanced imaging methods, including high-resolution TEM (HRTEM), scanning TEM (STEM), and electron energy loss spectroscopy (EELS), provide in-depth insights into the atomic-scale features of these defects, contributing to a better understanding of material behavior and guiding the optimization of semiconductor devices. Despite its capabilities, TEM remains time-intensive, particularly in the analysis of complex defect structures and the preparation of high-quality samples. While TEM offers unparalleled resolution, the need for meticulous sample preparation and extended imaging times can limit its widespread use in routine industrial applications. Recent advancements, such as automated TEM systems and the incorporation of artificial intelligence (AI) into image analysis, have begun to address these challenges. AI-based approaches can accelerate the identification and classification of defects, thereby improving both the efficiency and accuracy of defect characterization.
Looking forward, the integration of in situ TEM techniques is expected to offer significant advances in the study of semiconductor materials under real-world operating conditions. In situ TEM enables the observation of dynamic processes, such as defect migration, phase transitions, and material behavior under external stimuli (e.g., temperature, stress, or electric fields). This development provides a deeper understanding of defect evolution and material stability, which are crucial for the design of more reliable semiconductor devices. Further, the combination of AI with TEM holds promise for enhancing the analysis of large datasets, allowing for more precise defect characterization and predictive modeling of material behavior. Machine learning algorithms can optimize image processing and facilitate the extraction of meaningful data from complex TEM images, potentially leading to faster and more comprehensive analyses. Additionally, advancements in multi-modal imaging, combining TEM with complementary techniques such as X-ray diffraction and in situ thermodynamic measurements, will expand the capability of TEM in semiconductor research.
These innovations are expected to drive significant progress in the development of next-generation semiconductor materials and devices, contributing to the continued advancement of electronics, optoelectronics, and quantum technologies.

Supplementary Materials

The following are available online at: https://www.mdpi.com/article/10.3390/cryst15020192/s1, Movie S1: High-resolution TEM recording of nickelide reactions in a [110] oriented In0.53Ga0.47As nanowire [256].

Author Contributions

Conceptualization, T.G.; investigation, T.G. and Z.Y.; resources, X.W., Y.Q., H.L. and T.W.; writing—original draft preparation, T.G.; writing—review and editing, X.W., Y.Q., H.L. and T.W.; supervision, L.C., X.W. and Y.Q.; funding acquisition, L.C., X.W. and Y.Q. All authors have read and agreed to the published version of the manuscript.

Funding

This research was funded the Sichuan University-Luzhou Joint Fund (No. 2023CDLZ-7).

Conflicts of Interest

The authors declare no conflict of interest.

References

  1. Dayeh, S.A. Electron transport in indium arsenide nanowires. Semicond. Sci. Technol. 2010, 25, 024004. [Google Scholar] [CrossRef]
  2. Yoon, J.; Jo, S.; Chun, I.S.; Jung, I.; Kim, H.-S.; Meitl, M.; Menard, E.; Li, X.; Coleman, J.J.; Paik, U. GaAs photovoltaics and optoelectronics using releasable multilayer epitaxial assemblies. Nature 2010, 465, 329–333. [Google Scholar] [CrossRef] [PubMed]
  3. Lee, M.L.; Fitzgerald, E.A.; Bulsara, M.T.; Currie, M.T.; Lochtefeld, A. Strained Si, SiGe, and Ge channels for high-mobility metal-oxide-semiconductor field-effect transistors. J. Appl. Phys. 2005, 97, 011101. [Google Scholar] [CrossRef]
  4. Shi, B.; Zhao, H.; Wang, L.; Song, B.; Suran Brunelli, S.T.; Klamkin, J. Continuous-wave electrically pumped 1550 nm lasers epitaxially grown on on-axis (001) silicon. Optica 2019, 6, 1507–1514. [Google Scholar] [CrossRef]
  5. Fujii, T.; Hiraki, T.; Aihara, T.; Nishi, H.; Takeda, K.; Sato, T.; Kakitsuka, T.; Tsuchizawa, T.; Matsuo, S. Development of an epitaxial growth technique using iii–v on a si platform for heterogeneous integration of membrane photonic devices on Si. Appl. Sci. 2021, 11, 1801. [Google Scholar] [CrossRef]
  6. Lee, S.-M.; Kwong, A.; Jung, D.; Faucher, J.; Biswas, R.; Shen, L.; Kang, D.; Lee, M.L.; Yoon, J. High performance ultrathin GaAs solar cells enabled with heterogeneously integrated dielectric periodic nanostructures. ACS Nano 2015, 9, 10356–10365. [Google Scholar] [CrossRef] [PubMed]
  7. Kim, T.-J.; Holloway, P.H. Ohmic contacts to II–VI and III–V compound semiconductors. In Processing of Wide Band Gap Semiconductors; Elsevier: Amsterdam, The Netherlands, 2000; pp. 80–150. [Google Scholar]
  8. Sammak, A. Silicon-Based Integration of Groups III, IV, V Chemical Vapor Depositions in High-Quality Photodiodes. Ph.D. Thesis, University of Tehran, Tehran, Iran, 2012. [Google Scholar]
  9. Das, S.R. Advances in InSb and InAs Nanowire Based Nanoelectronic Field Effect Transistors. In Nanoelectronics; Elsevier: Amsterdam, The Netherlands, 2019; pp. 355–373. [Google Scholar]
  10. Biermanns, A.; Rieger, T.; Bussone, G.; Pietsch, U.; Grützmacher, D.; Ion Lepsa, M. Axial strain in GaAs/InAs core-shell nanowires. Appl. Phys. Lett. 2013, 102, 043109. [Google Scholar] [CrossRef]
  11. Walther, T.; Cullis, A.; Norris, D.; Hopkinson, M. Nature of the Stranski-Krastanow transition during epitaxy of InGaAs on GaAs. Phys. Rev. Lett. 2001, 86, 2381–2384. [Google Scholar] [CrossRef] [PubMed]
  12. Riedl, T.; Kunnathully, V.S.; Trapp, A.; Langer, T.; Reuter, D.; Lindner, J.K. Size-dependent strain relaxation in InAs quantum dots on top of GaAs (111)A nanopillars. Adv. Mater. Interfaces 2022, 9, 2102159. [Google Scholar] [CrossRef]
  13. Jallipalli, A.; Balakrishnan, G.; Huang, S.; Khoshakhlagh, A.; Dawson, L.; Huffaker, D. Atomistic modeling of strain distribution in self-assembled interfacial misfit dislocation (IMF) arrays in highly mismatched III–V semiconductor materials. J. Cryst. Growth 2007, 303, 449–455. [Google Scholar] [CrossRef]
  14. Hirashita, N.; Moriyama, Y.; Sugiyama, N.; Toyoda, E.; Takagi, S.-i. Misfit strain relaxation in strained-Si layers on silicon-germanium-on-insulator substrates. Appl. Phys. Lett. 2006, 89, 091916. [Google Scholar] [CrossRef]
  15. Shilkrot, L.E.; Srolovitz, D.J.; Tersoff, J. Morphology evolution during the growth of strained-layer superlattices. Phys. Rev. B 2000, 62, 8397–8409. [Google Scholar] [CrossRef]
  16. Vullum, P.E.; Nord, M.; Vatanparast, M.; Thomassen, S.F.; Boothroyd, C.; Holmestad, R.; Fimland, B.-O.; Reenaas, T.W. Quantitative strain analysis of InAs/GaAs quantum dot materials. Sci. Rep. 2017, 7, 45376. [Google Scholar] [CrossRef]
  17. Ohtani, H.; Kobayashi, K.; Ishida, K. Thermodynamic study of phase equilibria in strained III–V alloy semiconductors. J. Phase Equilibria 2001, 22, 276–286. [Google Scholar] [CrossRef]
  18. Chen, C.-C.; Zhu, C.; White, E.R.; Chiu, C.-Y.; Scott, M.; Regan, B.; Marks, L.D.; Huang, Y.; Miao, J. Three-dimensional imaging of dislocations in a nanoparticle at atomic resolution. Nature 2013, 496, 74–77. [Google Scholar] [CrossRef]
  19. Kaiser, U. TEM Characterization of Nanostructured Materials-Opportunities and Challenges. Microsc. Microanal. 2003, 9, 218. [Google Scholar] [CrossRef]
  20. Epp, J. X-ray diffraction (XRD) techniques for materials characterization. In Materials Characterization Using Nondestructive Evaluation (NDE) Methods; Elsevier: Amsterdam, The Netherlands, 2016; pp. 81–124. [Google Scholar]
  21. Trache, A.; Meininger, G.A. Atomic force microscopy (AFM). Curr. Protoc. Microbiol. 2008, 8, 2C.2.1–2C.2.17. [Google Scholar] [CrossRef] [PubMed]
  22. Rouvière, J.L.; Mouti, A.; Stadelmann, P. Measuring strain on HR-STEM images: Application to threading dislocations in Al0.8In0.2N. J. Phys. Conf. Ser. 2011, 326, 012022. [Google Scholar] [CrossRef]
  23. Nellist, P.; Pennycook, S. The principles and interpretation of annular dark-field Z-contrast imaging. In Advances in Imaging and Electron Physics; Elsevier: Amsterdam, The Netherlands, 2000; Volume 113, pp. 147–203. [Google Scholar]
  24. Knyazev, S.N.; Kudrya, A.V.; Komarovskiy, N.Y.; Parkhomenko, Y.N.; Molodtsova, E.V.; Yushchuk, V.V. Methods of dislocation structure characterization in AIII BV semiconductor single crystals. Mod. Electron. Mater. 2022, 8, 131–140. [Google Scholar] [CrossRef]
  25. Bender, H.; Bosch, E.G.; Richard, O.; Mendez, D.; Favia, P.; Lazić, I. 3D characterization of nanowire devices with STEM based modes. Semicond. Sci. Technol. 2019, 34, 114001. [Google Scholar] [CrossRef]
  26. Jo, J.; Tchoe, Y.; Yi, G.-C.; Kim, M. Real-time characterization using in situ RHEED transmission mode and TEM for investigation of the growth behaviour of nanomaterials. Sci. Rep. 2018, 8, 1694. [Google Scholar] [CrossRef]
  27. Fan, Z.; Zhang, L.; Baumann, D.; Mei, L.; Yao, Y.; Duan, X.; Shi, Y.; Huang, J.; Huang, Y.; Duan, X. In situ transmission electron microscopy for energy materials and devices. Adv. Mater. 2019, 31, 1900608. [Google Scholar] [CrossRef]
  28. Guo, H.; Tan, X.; Zhang, S. In situ TEM study on the microstructural evolution during electric fatigue in 0.7 Pb (Mg1/3Nb2/3) O3–0.3 PbTiO3 ceramic. J. Mater. Res. 2015, 30, 364–372. [Google Scholar] [CrossRef]
  29. Kaoumi, D.; Gautier, T.; Adamson, J.; Kirk, M. Using In-Situ TEM to Characterize the Microstructure Evolution of Metallic Systems under External Solicitation. Microsc. Microanal. 2015, 21, 111–112. [Google Scholar] [CrossRef]
  30. Cheng, Z.; Wang, C.; Wu, X.; Chu, J. Review in situ transmission electron microscope with machine learning. J. Semicond. 2022, 43, 081001. [Google Scholar] [CrossRef]
  31. Shen, Y.; Sun, L. Setting up a nanolab inside a transmission electron microscope for two-dimensional materials research. J. Mater. Res. 2015, 30, 3153–3176. [Google Scholar] [CrossRef]
  32. Xu, Z.; Tan, X.; Han, P.; Shang, J. In situ transmission electron microscopy study of electric-field-induced microcracking in single crystal Pb (Mg 1/3 Nb 2/3)O3–PbTiO 3. Appl. Phys. Lett. 2000, 76, 3732–3734. [Google Scholar] [CrossRef]
  33. Fan, Z.; Tan, X. Dual-stimuli in-situ TEM study on the nonergodic/ergodic crossover in the 0.75 (Bi1/2Na1/2) TiO3–0.25 SrTiO3 relaxor. Appl. Phys. Lett. 2019, 114, 212901. [Google Scholar] [CrossRef]
  34. Nielsen, M.H.; Aloni, S.; De Yoreo, J.J. In situ TEM imaging of CaCO(3) nucleation reveals coexistence of direct and indirect pathways. Science 2014, 345, 1158–1162. [Google Scholar] [CrossRef]
  35. Dong, J.; Bai, H.; Deng, Y.; Liu, S.; Wang, X.; Qiu, Y.; Shi, Y.; Walther, T. Transmission electron microscopy of epitaxial semiconductor materials and devices. J. Phys. D Appl. Phys. 2024, 58, 043001. [Google Scholar] [CrossRef]
  36. Weirich, T.E.; Zou, X.; Ramlau, R.; Simon, A.; Cascarano, G.L.; Giacovazzo, C.; Hovmöller, S. Structures of nanometre-size crystals determined from selected-area electron diffraction data. Acta Crystallogr. Sect. A 2000, 56, 29–35. [Google Scholar] [CrossRef] [PubMed]
  37. Tanaka, M.; Tsuda, K. Convergent-beam electron diffraction. J. Electron Microsc. 2011, 60, S245–S267. [Google Scholar] [CrossRef] [PubMed]
  38. Armigliato, A.; Frabboni, S.; Gazzadi, G.C. Electron diffraction with ten nanometer beam size for strain analysis of nanodevices. Appl. Phys. Lett. 2008, 93, 161906. [Google Scholar] [CrossRef]
  39. Rauch, E.F.; Portillo, J.; Nicolopoulos, S.; Bultreys, D.; Rouvimov, S.; Moeck, P. Automated nanocrystal orientation and phase mapping in the transmission electron microscope on the basis of precession electron diffraction. Z. Krist. 2010, 225, 103–109. [Google Scholar] [CrossRef]
  40. Eggeman, A.S.; Midgley, P.A. Precession electron diffraction. In Advances in Imaging and Electron Physics; Elsevier: Amsterdam, The Netherlands, 2012; Volume 170, pp. 1–63. [Google Scholar]
  41. Williams, D.B.; Carter, C.B.; Williams, D.B.; Carter, C.B. Weak-beam dark-field microscopy. In Transmission Electron Microscopy: A Textbook for Materials Science, 2nd ed.; Springer: New York, NY, USA, 2009; pp. 463–481. [Google Scholar]
  42. Klenov, D.O.; Stemmer, S. Contributions to the contrast in experimental high-angle annular dark-field images. Ultramicroscopy 2006, 106, 889–901. [Google Scholar] [CrossRef] [PubMed]
  43. Mitsuishi, K.; Hashimoto, A.; Takeguchi, M.; Shimojo, M.; Ishizuka, K. Imaging properties of bright-field and annular-dark-field scanning confocal electron microscopy. Ultramicroscopy 2010, 111, 20–26. [Google Scholar] [CrossRef]
  44. Davydova, N.; Finders, J.; McNamara, J.; van Setten, E.; van Lare, C.; Franke, J.-H.; Frommhold, A.; Capelli, R.; Kersteen, G.; Verch, A. Fundamental understanding and experimental verification of bright versus dark field imaging. In Proceedings of the Extreme Ultraviolet Lithography, Virtual Conference, 7 June 2020; pp. 40–57. [Google Scholar]
  45. Mireles, A.; Shi, C.; Park, J.; Shin, B.; Sung, S.H.; Ophus, C.; Hovden, R.; Kang, K.; Han, Y. Using 4D-STEM to Map 3D Morphologies of 2D Materials. Microsc. Microanal. 2023, 29, 262–263. [Google Scholar] [CrossRef]
  46. Lazić, I.; Bosch, E.G.; Lazar, S. Phase contrast STEM for thin samples: Integrated differential phase contrast. Ultramicroscopy 2016, 160, 265–280. [Google Scholar] [CrossRef] [PubMed]
  47. Buzug, T.M. Computed tomography. In Springer Handbook of Medical Technology; Springer: Berlin/Heidelberg, Germany, 2011; pp. 311–342. [Google Scholar]
  48. Dunin-Borkowski, R.E.; Kovács, A.; Kasama, T.; McCartney, M.R.; Smith, D.J. Electron Holography. In Springer Handbook of Microscopy; Hawkes, P.W., Spence, J.C.H., Eds.; Springer: Cham, Switzerland, 2019; pp. 767–818. [Google Scholar]
  49. Tivol, W.F. Selected area electron diffraction and its use in structure determination. Microsc. Today 2010, 18, 22–28. [Google Scholar] [CrossRef]
  50. Ayoola, H.O.; House, S.D.; Bonifacio, C.S.; Kisslinger, K.; Saidi, W.A.; Yang, J.C. Evaluating the accuracy of common γ-Al2O3 structure models by selected area electron diffraction from high-quality crystalline γ-Al2O3. Acta Mater. 2020, 182, 257–266. [Google Scholar] [CrossRef]
  51. Clément, L.; Pantel, R.; Kwakman, L.F.T.; Rouvière, J.L. Strain measurements by convergent-beam electron diffraction: The importance of stress relaxation in lamella preparations. Appl. Phys. Lett. 2004, 85, 651–653. [Google Scholar] [CrossRef]
  52. Williamson, M.; van Dooren, P.; Flanagan, J. Quantitative analysis of the accuracy and sensitivity of strain measurements from nanobeam electron diffraction. In Proceedings of the 2015 IEEE 22nd International Symposium on the Physical and Failure Analysis of Integrated Circuits, Hsinchu, Taiwan, 29 June–2 July 2015; pp. 197–200. [Google Scholar]
  53. Mugnaioli, E.; Gorelik, T.; Kolb, U. “Ab initio” structure solution from electron diffraction data obtained by a combination of automated diffraction tomography and precession technique. Ultramicroscopy 2009, 109, 758–765. [Google Scholar] [CrossRef] [PubMed]
  54. Champness, P.E. Electron Diffraction in the Transmission Electron Microscope; Garland Science: New York, NY, USA, 2020. [Google Scholar]
  55. Nakajima, H.; Kotani, A.; Harada, K.; Mori, S. Electron diffraction covering a wide angular range from Bragg diffraction to small-angle diffraction. Microscopy 2018, 67, 207–213. [Google Scholar] [CrossRef]
  56. Cowley, J.M.; Goodman, P.; Vainshtein, B.K.; Zvyagin, B.B.; Dorset, D.L. Electron diffraction and electron microscopy in structure determination. In International Tables for Crystallography Volume B: Reciprocal Space; Shmueli, U., Ed.; Springer: Dordrecht, The Netherlands, 2001; pp. 276–345. [Google Scholar]
  57. Pooch, A.; Seidling, M.; Kerker, N.; Röpke, R.; Rembold, A.; Chang, W.-T.; Hwang, I.-S.; Stibor, A. Coherent properties of a tunable low-energy electron-matter-wave source. Phys. Rev. A 2018, 97, 013611. [Google Scholar] [CrossRef]
  58. Kacher, J.; Landon, C.; Adams, B.L.; Fullwood, D. Bragg’s Law diffraction simulations for electron backscatter diffraction analysis. Ultramicroscopy 2009, 109, 1148–1156. [Google Scholar] [CrossRef] [PubMed]
  59. Playford, H.; Keen, D.; Tucker, M. Local structure of crystalline and amorphous materials using reverse Monte Carlo methods. Neutron News 2016, 27, 17–21. [Google Scholar] [CrossRef]
  60. Wen, J.; Wang, R.; Lu, G. Distortion of the zeroth-order Laue-zone pattern caused by dislocations in a silicon crystal. Acta Crystallogr. Sect. A 1989, 45, 422–427. [Google Scholar] [CrossRef]
  61. Kattan, N.; Hou, B.; Fermín, D.J.; Cherns, D. Crystal structure and defects visualization of Cu2ZnSnS4 nanoparticles employing transmission electron microscopy and electron diffraction. Appl. Mater. Today 2015, 1, 52–59. [Google Scholar] [CrossRef]
  62. Morniroli, J.-P.; Ji, G.; Jacob, D. A systematic method to identify the space group from PED and CBED patterns part I—Theory. Ultramicroscopy 2012, 121, 42–60. [Google Scholar] [CrossRef] [PubMed]
  63. Ponce, A.; Aguilar, J.A.; Tate, J.; Yacamán, M.J. Advances in the electron diffraction characterization of atomic clusters and nanoparticles. Nanoscale Adv. 2021, 3, 311–325. [Google Scholar] [CrossRef]
  64. Czigány, Z.; Kis, V.K. Acquisition and evaluation procedure to improve the accuracy of SAED. Microsc. Res. Tech. 2023, 86, 144–156. [Google Scholar] [CrossRef] [PubMed]
  65. Shukla, D.; Mohammad, A.; Ilhom, S.; Willis, B.G.; Okyay, A.K.; Biyikli, N. Real-time in situ process monitoring and characterization of GaN films grown on Si (100) by low-temperature hollow-cathode plasma-atomic layer deposition using trimethylgallium and N2/H2 plasma. J. Vac. Sci. Technol. A 2021, 39, 022406. [Google Scholar] [CrossRef]
  66. Takashiri, M.; Miyazaki, K.; Tsukamoto, H. Structural and thermoelectric properties of fine-grained Bi0.4Te3.0Sb1.6 thin films with preferred orientation deposited by flash evaporation method. Thin Solid Film. 2008, 516, 6336–6343. [Google Scholar] [CrossRef]
  67. Rosenkranz, S.; Krogstad, M.; Osborn, R. New Developments in the Use of Single Crystal Diffuse Scattering to Probe Nanoscale Correlations in Crystalline Materials. In Proceedings of the Acta Crystallographica A—Foundation and Advances, Portland, OR, USA, 29 July–3 August 2022; p. A216. [Google Scholar]
  68. Saha, A.; Pattison, A.; Mecklenburg, M.; Brewster, A.; Ercius, P.; Rodriguez, J.A. Beyond Microed: Ab Initio Crystal Structures Using 4D-STEM. Available online: https://escholarship.org/uc/item/2qs6x5s1 (accessed on 4 February 2025).
  69. Abbasi, P.; Fenning, D.P.; Pascal, T.A. Investigation of local distortion effects on X-ray absorption of ferroelectric perovskites from first principles simulations. Nanoscale 2023, 15, 5193–5200. [Google Scholar] [CrossRef] [PubMed]
  70. Toda, A.; Ikarashi, N.; Ono, H. Local lattice strain measurements in semiconductor devices by using convergent-beam electron diffraction. J. Cryst. Growth 2000, 210, 341–345. [Google Scholar] [CrossRef]
  71. Nucci, J.A.; Keller, R.R.; Krämer, S.; Volkert, C.A.; Gross, M.E. Localized Measurement of Strains in Damascene Copper Interconnects by Convergent-Beam Electron Diffraction. MRS Online Proc. Libr. (OPL) 2000, 612, D8.5.1. [Google Scholar] [CrossRef]
  72. Akaogi, T.; Tsuda, K.; Terauchi, M.; Tanaka, M. Lattice parameter determination of a strained area of an InAs layer on a GaAs substrate using CBED. Microscopy 2004, 53, 11–19. [Google Scholar] [CrossRef]
  73. Johnson, D.H. Signal-to-noise ratio. Scholarpedia 2006, 1, 2088. [Google Scholar] [CrossRef]
  74. Förster, A.; Brandstetter, S.; Schulze-Briese, C. Transforming X-ray detection with hybrid photon counting detectors. Philos. Trans. R. Soc. A 2019, 377, 20180241. [Google Scholar] [CrossRef] [PubMed]
  75. Schulze-Briese, C.; DeCarlo, S. A new electron-counting detector for electron diffraction. Acta Crystallogr. A—Found. Adv. 2017, 73, C1350. [Google Scholar] [CrossRef]
  76. Munshi, J.; Rakowski, A.M.; Savitzky, B.; Ophus, C.; Henderson, M.L.; Cholia, S.; Chan, M.K. 4D> Crystal: Deep Learning Crystallographic Information From Electron Diffraction Images. Microsc. Microanal. 2021, 27, 2774–2776. [Google Scholar] [CrossRef]
  77. Friedrich, T.; Yu, C.-P.; Verbeeck, J.; Van Aert, S. Phase object reconstruction for 4D-STEM using deep learning. Microsc. Microanal. 2023, 29, 395–407. [Google Scholar] [CrossRef]
  78. Saitoh, K.; Yonezawa, T.; Nambu, H.; Tanimura, S.; Uchida, M. Orbital angular momentum-resolved convergent-beam electron diffraction by the post-selected injection of electron beam. Microscopy 2022, 71, 374–379. [Google Scholar] [CrossRef]
  79. Zeltmann, S.E.; Müller, A.; Bustillo, K.C.; Savitzky, B.H.; Minor, A.M.; Ophus, C. Improved 4D-STEM strain mapping precision using patterned probes. Microsc. Microanal. 2019, 25, 1958–1959. [Google Scholar] [CrossRef]
  80. Morikawa, D.; Tsuda, K. Local crystal symmetry and structure at CaTiO3 twin boundaries. Appl. Phys. Lett. 2021, 118, 092901. [Google Scholar] [CrossRef]
  81. Tsuda, K.; Sagawa, R.; Hashiguchi, H.; Kondo, Y. Local structural study of ferroelectric domain boundaries using STEM-CBED with a fast pixelated STEM detector. Microsc. Microanal. 2019, 25, 1996–1997. [Google Scholar] [CrossRef]
  82. Ozdol, V.; Gammer, C.; Jin, X.; Ercius, P.; Ophus, C.; Ciston, J.; Minor, A. Strain mapping at nanometer resolution using advanced nano-beam electron diffraction. Appl. Phys. Lett. 2015, 106, 253107. [Google Scholar] [CrossRef]
  83. Yamanaka, J.; Oguni, T.; Sano, Y.; Ohshima, Y.; Onogawa, A.; Hara, K.O.; Arimoto, K. Evaluation of Lattice-Spacing of SiGe/Si by NBD using Two-condenser-lens TEM. Microsc. Microanal. 2022, 28, 2812–2813. [Google Scholar] [CrossRef]
  84. Pekin, T.C.; Gammer, C.; Ciston, J.; Minor, A.M.; Ophus, C. Optimizing disk registration algorithms for nanobeam electron diffraction strain mapping. Ultramicroscopy 2017, 176, 170–176. [Google Scholar] [CrossRef]
  85. Li, J.; Reboh, S.; Chao, R.; Loubet, N.; Guillorn, M.; Yamashita, T.; Gaudiello, J. Nanobeam diffraction and geometric phase analysis for strain measurements in Si/SiGe nanosheet structures. Microsc. Microanal. 2016, 22, 1528–1529. [Google Scholar] [CrossRef]
  86. Rouviere, J.-L.; Sarigiannidou, E. Theoretical discussions on the geometrical phase analysis. Ultramicroscopy 2005, 106, 1–17. [Google Scholar] [CrossRef] [PubMed]
  87. Baumann, F.H. High precision two-dimensional strain mapping in semiconductor devices using nanobeam electron diffraction in the transmission electron microscope. Appl. Phys. Lett. 2014, 104, 262102. [Google Scholar] [CrossRef]
  88. Kryvyi, S.; Kret, S.; Domagala, J.Z.; Wojnar, P. Reconstruction of three-dimensional strain field in an asymmetrical curved core–shell hetero-nanowire. Nanotechnology 2023, 34, 445705. [Google Scholar] [CrossRef] [PubMed]
  89. Sakai, A. Operando analysis of local strain induced by inverse piezoelectric effect in AlGaN/GaN HEMT using synchrotron radiation nanobeam x-ray diffraction. In Proceedings of the Gallium Nitride Materials and Devices XVI, Virtual Conference, 6–11 March 2021; p. 1168629. [Google Scholar]
  90. Zhao, D.; Xie, K.Y. Dislocation imaging by precession electron diffraction. Microsc. Microanal. 2020, 26, 226–227. [Google Scholar] [CrossRef]
  91. Bashir, A.; Millar, R.W.; Gallacher, K.; Paul, D.J.; Darbal, A.D.; Stroud, R.; Ballabio, A.; Frigerio, J.; Isella, G.; MacLaren, I. Strain analysis of a Ge micro disk using precession electron diffraction. J. Appl. Phys. 2019, 126, 235701. [Google Scholar] [CrossRef]
  92. Midgley, P.A.; Eggeman, A.S. Precession electron diffraction–a topical review. IUCrJ 2015, 2, 126–136. [Google Scholar] [CrossRef]
  93. Sinkler, W.; Marks, L.D. Characteristics of precession electron diffraction intensities from dynamical simulations. Z. Krist. 2010, 225, 47–55. [Google Scholar] [CrossRef]
  94. Ciston, J.; Deng, B.; Marks, L.; Own, C.; Sinkler, W. A quantitative analysis of the cone-angle dependence in precession electron diffraction. Ultramicroscopy 2008, 108, 514–522. [Google Scholar] [CrossRef]
  95. Own, C.; Sinkler, W.; Marks, L. Rapid structure determination of a metal oxide from pseudo-kinematical electron diffraction data. Ultramicroscopy 2006, 106, 114–122. [Google Scholar] [CrossRef] [PubMed]
  96. Dorset, D.L.; Gilmore, C.J.; Jorda, J.L.; Nicolopoulos, S. Direct electron crystallographic determination of zeolite zonal structures. Ultramicroscopy 2007, 107, 462–473. [Google Scholar] [CrossRef] [PubMed]
  97. Zhao, D.; Patel, A.; Barbosa, A.; Hansen, M.H.; Wang, A.L.; Dong, J.; Zhang, Y.; Umale, T.; Karaman, I.; Shamberger, P. A reference-area-free strain mapping method using precession electron diffraction data. Ultramicroscopy 2023, 247, 113700. [Google Scholar] [CrossRef]
  98. Li, J.; Mochizuki, S.; Stuckert, E.; Tierney, L.; Toole, K.; Conte, R.; Loubet, N. Precession electron diffraction (PED) strain characterization in stacked nanosheet FET structure. In Proceedings of the International Symposium for Testing and Failure Analysis, Pasadena, CA, USA, 30 October–3 November 2022; pp. 74–77. [Google Scholar]
  99. Jeong, J.; Cautaerts, N.; Dehm, G.; Liebscher, C.H. Automated crystal orientation mapping by precession electron diffraction-assisted four-dimensional scanning transmission electron microscopy using a scintillator-based CMOS detector. Microsc. Microanal. 2021, 27, 1102–1112. [Google Scholar] [CrossRef]
  100. Corrêa, L.M.; Ortega, E.; Ponce, A.; Cotta, M.A.; Ugarte, D. High precision orientation mapping from 4D-STEM precession electron diffraction data through quantitative analysis of diffracted intensities. Ultramicroscopy 2024, 259, 113927. [Google Scholar] [CrossRef] [PubMed]
  101. Vijayalakshmi, M.; Saroja, S.; Mythili, R. Convergent beam electron diffraction—A novel technique for materials characterisation at sub-microscopic levels. Sadhana 2003, 28, 763–782. [Google Scholar] [CrossRef]
  102. Bekarevich, R.; Mitsuishi, K.; Ohnishi, T.; Uesugi, F.; Takeguchi, M.; Inaguma, Y.; Ohno, T.; Takada, K. Two-dimensional Gaussian fitting for precise measurement of lattice constant deviation from a selected-area diffraction map. Microscopy 2018, 67, i142–i149. [Google Scholar] [CrossRef]
  103. Ghamarian, I.; Liu, Y.; Samimi, P.; Collins, P.C. Development and application of a novel precession electron diffraction technique to quantify and map deformation structures in highly deformed materials—As applied to ultrafine-grained titanium. Acta Mater. 2014, 79, 203–215. [Google Scholar] [CrossRef]
  104. Fultz, B.; Howe, J.M. Transmission Electron Microscopy and Diffractometry of Materials; Springer Science & Business Media: Cham, Switzerland, 2012. [Google Scholar]
  105. Balogh, L.; Ribárik, G.; Ungár, T. Stacking faults and twin boundaries in fcc crystals determined by x-ray diffraction profile analysis. J. Appl. Phys. 2006, 100, 023512. [Google Scholar] [CrossRef]
  106. Loh, Y.L. The Ewald sphere construction for radiation, scattering, and diffraction. Am. J. Phys. 2017, 85, 277–288. [Google Scholar] [CrossRef]
  107. Dub, P.; Litzman, O. The Ewald dynamical diffraction theory–ninety years later. Acta Crystallogr. Sect. A 2005, 61, 209–222. [Google Scholar] [CrossRef] [PubMed]
  108. Howie, A.; Whelan, M.J. Diffraction contrast of electron microscope images of crystal lattice defects—II. The development of a dynamical theory. Proc. R. Soc. Lond. Ser. A Math. Phys. Sci. 1961, 263, 217–237. [Google Scholar]
  109. Howie, A.; Whelan, M.J. Diffraction contrast of electron microscope images of crystal lattice defects—III. Results and experimental confirmation of the dynamical theory of dislocation image contrast. Proc. R. Soc. Lond. Ser. A Math. Phys. Sci. 1962, 267, 206–230. [Google Scholar]
  110. Dickey, F.M. Laser Beam Shaping: Theory and Techniques; CRC Press: Boca Raton, FL, USA, 2018. [Google Scholar]
  111. Dickey, F.M.; Weichman, L.S.; Shagam, R.N. Laser beam shaping techniques. In Proceedings of the High-Power Laser Ablation III, Santa Fe, NM, USA, 24–28 April 2000; pp. 338–348. [Google Scholar]
  112. Saitoh, K.; Nambu, H.; Tanaka, N.; Uchida, M. Propagation properties of electron vortex beams. Microsc. Microanal. 2015, 21, 671–672. [Google Scholar] [CrossRef]
  113. Thirunavukkarasu, G.; Mousley, M.; Babiker, M.; Yuan, J. Even-odd effect in higher-order holographic production of electron vortex beams with nontrivial radial structures. Phys. Rev. A 2019, 99, 013608. [Google Scholar] [CrossRef]
  114. Bonef, B.; Shah, R.D.; Mukherjee, K. Fast diffusion and segregation along threading dislocations in semiconductor heterostructures. Nano Lett. 2019, 19, 1428–1436. [Google Scholar] [CrossRef]
  115. Munshi, J.; Rakowski, A.; Savitzky, B.H.; Zeltmann, S.E.; Ciston, J.; Henderson, M.; Cholia, S.; Minor, A.M.; Chan, M.K.; Ophus, C. Disentangling multiple scattering with deep learning: Application to strain mapping from electron diffraction patterns. npj Comput. Mater. 2022, 8, 254. [Google Scholar] [CrossRef]
  116. Estakhri, N.M.; Norris, T.B. Coherent Two-photon Backscattering and Induced Angular Quantum Correlations in Multiple-Scattered Two-Photon States of the Light. arXiv 2024, arXiv:2401.13176. [Google Scholar]
  117. Lin, Y.R.; Li, Y.; Zinkle, S.J.; Arregui-Mena, J.D.; Burke, M.G. Application of Weak-Beam Dark-Field STEM for Dislocation Loop Analysis. Microsc. Microanal. 2024, 30, 681–691. [Google Scholar] [CrossRef] [PubMed]
  118. Mawson, T.; Nakamura, A.; Petersen, T.; Shibata, N.; Sasaki, H.; Paganin, D.; Morgan, M.; Findlay, S. Suppressing dynamical diffraction artefacts in differential phase contrast scanning transmission electron microscopy of long-range electromagnetic fields via precession. Ultramicroscopy 2020, 219, 113097. [Google Scholar] [CrossRef]
  119. Fultz, B.; Howe, J. Diffraction contrast in TEM images. In Transmission Electron Microscopy and Diffractometry of Materials; Springer: Berlin/Heidelberg, Germany, 2013; pp. 349–427. [Google Scholar]
  120. Qiu, Y.; Cristiano, F.; Huet, K.; Mazzamuto, F.; Fisicaro, G.; La Magna, A.; Quillec, M.; Cherkashin, N.; Wang, H.; Duguay, S. Extended defects formation in nanosecond laser-annealed ion implanted silicon. Nano Lett. 2014, 14, 1769–1775. [Google Scholar] [CrossRef] [PubMed]
  121. Wu, F.; Sun, H.; AJia, I.A.; Roqan, I.S.; Zhang, D.; Dai, J.; Chen, C.; Feng, Z.C.; Li, X. Significant internal quantum efficiency enhancement of GaN/AlGaN multiple quantum wells emitting at~ 350 nm via step quantum well structure design. J. Phys. D Appl. Phys. 2017, 50, 245101. [Google Scholar] [CrossRef]
  122. Donatelli, J.J.; Spence, J.C. Inversion of many-beam Bragg intensities for phasing by iterated projections: Removal of multiple scattering artifacts from diffraction data. Phys. Rev. Lett. 2020, 125, 065502. [Google Scholar] [CrossRef] [PubMed]
  123. Spence, J.; Donatelli, J. Inversion of many-beam Bragg intensities for phasing by iterated projections: Removal of multiple scattering artifacts. Microsc. Microanal. 2020, 26, 2456–2457. [Google Scholar] [CrossRef]
  124. MacLaren, I.; Frutos-Myro, E.; McGrouther, D.; McFadzean, S.; Weiss, J.K.; Cosart, D.; Portillo, J.; Robins, A.; Nicolopoulos, S.; Nebot del Busto, E. A comparison of a direct electron detector and a high-speed video camera for a scanning precession electron diffraction phase and orientation mapping. Microsc. Microanal. 2020, 26, 1110–1116. [Google Scholar] [CrossRef] [PubMed]
  125. Pennycook, S.J.; Nellist, P.D. Scanning Transmission Electron Microscopy: Imaging and Analysis; Springer Science & Business Media: Berlin/Heidelberg, Germany, 2011. [Google Scholar]
  126. Miao, J. High Resolution Imaging of Dislocations Using Weak Beam Dark Field STEM. Microsc. Microanal. 2020, 26, 1220–1222. [Google Scholar] [CrossRef]
  127. Miao, J.; Singh, S.; Tessmer, J.; Shih, M.; Ghazisaeidi, M.; DeGraef, M.; Mills, M. Dislocation characterization using weak beam dark field stem imaging. Microsc. Microanal. 2018, 24, 2202–2203. [Google Scholar] [CrossRef]
  128. Iwata, H.; Saka, H. Resolving individual Shockley partials of a dissociated dislocation by STEM. Philos. Mag. Lett. 2017, 97, 74–81. [Google Scholar] [CrossRef]
  129. Dennler, N.; Foncubierta-Rodriguez, A.; Neupert, T.; Sousa, M. Learning-based defect recognition for quasi-periodic HRSTEM images. Micron 2021, 146, 103069. [Google Scholar] [CrossRef] [PubMed]
  130. Stroppa, D.G.; Zagonel, L.F.; Montoro, L.A.; Leite, E.R.; Ramirez, A.J. High-Resolution Scanning Transmission Electron Microscopy (HRSTEM) techniques: High-resolution imaging and spectroscopy side by side. ChemPhysChem 2012, 13, 437–443. [Google Scholar] [CrossRef]
  131. Miao, L.; Chmielewski, A.; Mukherjee, D.; Alem, N. Picometer-precision atomic position tracking through electron microscopy. J. Vis. Exp. 2021, 173, 1–15. [Google Scholar] [CrossRef]
  132. Martinez, G.; Rosenauer, A.; De Backer, A.; Verbeeck, J.; Van Aert, S. Quantitative composition determination at the atomic level using model-based high-angle annular dark field scanning transmission electron microscopy. Ultramicroscopy 2014, 137, 12–19. [Google Scholar] [CrossRef] [PubMed]
  133. Robb, P.D.; Craven, A.J. Column ratio mapping: A processing technique for atomic resolution high-angle annular dark-field (HAADF) images. Ultramicroscopy 2008, 109, 61–69. [Google Scholar] [CrossRef] [PubMed]
  134. Santiago, P.; Rendón, L.; Germán, C.; Pal, U. HAADF Imaging: An effective technique for the study of nonhomogeneousnanostructures. J. Nanosci. Nanotechnol. 2005, 5, 1172–1176. [Google Scholar] [CrossRef] [PubMed]
  135. Walther, T. A new experimental procedure to quantify annular dark field images in scanning transmission electron microscopy. J. Microsc. 2006, 221, 137–144. [Google Scholar] [CrossRef] [PubMed]
  136. Abe, E. Atomic-scale characterization of nanostructured metallic materials by HAADF/Z-contrast STEM. Mater. Trans. 2003, 44, 2035–2041. [Google Scholar] [CrossRef]
  137. Cao, F.; Zheng, J.; Jiang, Y.; Chen, B.; Wang, Y.; Hu, T. Experimental and DFT characterization of η′ nano-phase and its interfaces in AlZnMgCu alloys. Acta Mater. 2019, 164, 207–219. [Google Scholar] [CrossRef]
  138. Wang, W.; Cai, W. Dynamic observation and motion tracking of individual gold atoms with HAADF-STEM imaging. RSC Adv. 2021, 11, 11057–11061. [Google Scholar] [CrossRef] [PubMed]
  139. Erni, R.; Browning, N.D. Valence electron energy-loss spectroscopy in monochromated scanning transmission electron microscopy. Ultramicroscopy 2005, 104, 176–192. [Google Scholar] [CrossRef] [PubMed]
  140. Ma, Z.; Zhang, X.; Liu, P.; Deng, Y.; Hu, W.; Chen, L.; Zhu, J.; Chen, S.; Wang, Z.; Shi, Y.; et al. Clustering in gallium ion beam sputtered compound materials driven by bond strength and interstitial/vacancy reaction. Appl. Phys. Lett. 2023, 123, 102101. [Google Scholar] [CrossRef]
  141. Phillips, P.J.; De Graef, M.; Kovarik, L.; Agrawal, A.; Windl, W.; Mills, M. Atomic-resolution defect contrast in low angle annular dark-field STEM. Ultramicroscopy 2012, 116, 47–55. [Google Scholar] [CrossRef]
  142. Zhang, Y.; Grünewald, L.; Cao, X.; Abdelbarey, D.; Zheng, X.; Rugeramigabo, E.P.; Verbeeck, J.; Zopf, M.; Ding, F. Unveiling the 3D Morphology of Epitaxial GaAs/AlGaAs Quantum Dots. Nano Lett. 2024, 24, 10106–10113. [Google Scholar] [CrossRef] [PubMed]
  143. Prabhakaran, P.; Kim, W.J.; Lee, K.-S.; Prasad, P.N. Quantum dots (QDs) for photonic applications. Opt. Mater. Express 2012, 2, 578–593. [Google Scholar] [CrossRef]
  144. Hodoroaba, V.-D. Energy-dispersive X-ray spectroscopy (EDS). In Characterization of Nanoparticles; Elsevier: Amsterdam, The Netherlands, 2020; pp. 397–417. [Google Scholar]
  145. Nesher, O.; Elkind, S.; Adin, A.; Palty, U.; Pelleg, O.; Jacobsohn, E.; Markovitz, T.; Szafranek, I.; Calahora, Z.; Schlesinger, J.O. Performance of BF focal plane array 320x256 InSb detectors. In Proceedings of the Infrared Technology and Applications XXVIII, Seattle, WA, USA, 7–11 July 2002; pp. 699–707. [Google Scholar]
  146. Seki, T.; Ooe, K.; Nogami, M.; Ikuhara, Y.; Shibata, N. Towards High-Throughput Low Dose Observation by OBF STEM. Microsc. Microanal. 2024, 30, ozae044.925. [Google Scholar] [CrossRef]
  147. Ooe, K.; Seki, T.; Yoshida, K.; Kohno, Y.; Ikuhara, Y.; Shibata, N. Direct imaging of local atomic structures in zeolite using optimum bright-field scanning transmission electron microscopy. Sci. Adv. 2023, 9, eadf6865. [Google Scholar] [CrossRef] [PubMed]
  148. Wang, B.; Syaranamual, G.J.; Lee, K.H.; Bao, S.; Wang, Y.; Lee, K.E.K.; Fitzgerald, E.A.; Pennycook, S.J.; Gradecak, S.; Michel, J. Effectiveness of InGaAs/GaAs superlattice dislocation filter layers epitaxially grown on 200 mm Si wafers with and without Ge buffers. Semicond. Sci. Technol. 2020, 35, 095036. [Google Scholar] [CrossRef]
  149. Kim, H.; Geum, D.-M.; Ko, Y.-H.; Han, W.-S. Effects of High-Temperature Growth of Dislocation Filter Layers in GaAs-on-Si. Nanoscale Res. Lett. 2022, 17, 126. [Google Scholar] [CrossRef] [PubMed]
  150. George, I.; Becagli, F.; Liu, H.; Wu, J.; Tang, M.; Beanland, R. Dislocation filters in GaAs on Si. Semicond. Sci. Technol. 2015, 30, 114004. [Google Scholar] [CrossRef]
  151. Yamamoto, Y.; Zaumseil, P.; Arguirov, T.; Kittler, M.; Tillack, B. Low threading dislocation density Ge deposited on Si(100) using RPCVD. Solid-State Electron. 2011, 60, 2–6. [Google Scholar] [CrossRef]
  152. Tang, M.; Chen, S.; Wu, J.; Jiang, Q.; Kennedy, K.; Jurczak, P.; Liao, M.; Beanland, R.; Seeds, A.; Liu, H. Optimizations of defect filter layers for 1.3-μm InAs/GaAs quantum-dot lasers monolithically grown on Si substrates. IEEE J. Sel. Top. Quantum Electron. 2016, 22, 50–56. [Google Scholar] [CrossRef]
  153. Arehart, A.; Moran, B.; Speck, J.; Mishra, U.; DenBaars, S.; Ringel, S. Effect of threading dislocation density on Ni∕n-GaN Schottky diode IV characteristics. J. Appl. Phys. 2006, 100, 023709. [Google Scholar] [CrossRef]
  154. Choi, D.; Ge, Y.; Harris, J.S.; Cagnon, J.; Stemmer, S. Low surface roughness and threading dislocation density Ge growth on Si (001). J. Cryst. Growth 2008, 310, 4273–4279. [Google Scholar] [CrossRef]
  155. Kaida, R.; Akiyama, T.; Nakamura, K.; Ito, T. Theoretical study for misfit dislocation formation at InAs/GaAs (001) interface. J. Cryst. Growth 2017, 468, 919–922. [Google Scholar] [CrossRef]
  156. Johnston-Peck, A.C.; Herzing, A.A. Four-Dimensional Scanning Transmission Electron Microscopy: Part I: Imaging, Strain Mapping, and Defect Detection. EDFA Tech. Artic. 2023, 25, 12–22. [Google Scholar] [CrossRef]
  157. Coupin, M.J.; Wen, Y.; Lee, S.; Saxena, A.; Ophus, C.; Allen, C.S.; Kirkland, A.I.; Aluru, N.R.; Lee, G.-D.; Warner, J.H. Mapping nanoscale electrostatic field fluctuations around graphene dislocation cores using four-dimensional Scanning Transmission Electron Microscopy (4D-STEM). Nano Lett. 2023, 23, 6807–6814. [Google Scholar] [CrossRef] [PubMed]
  158. Zeltmann, S.E.; Müller, A.; Bustillo, K.C.; Savitzky, B.; Hughes, L.; Minor, A.M.; Ophus, C. Patterned probes for high precision 4D-STEM Bragg measurements. Ultramicroscopy 2020, 209, 112890. [Google Scholar] [CrossRef]
  159. Han, Y.; Nguyen, K.; Cao, M.; Cueva, P.; Xie, S.; Tate, M.W.; Purohit, P.; Gruner, S.M.; Park, J.; Muller, D.A. Strain mapping of two-dimensional heterostructures with sub-picometer precision. Nano Lett. 2018, 18, 3746–3751. [Google Scholar] [CrossRef]
  160. Ophus, C. Four-dimensional scanning transmission electron microscopy (4D-STEM): From scanning nanodiffraction to ptychography and beyond. Microsc. Microanal. 2019, 25, 563–582. [Google Scholar] [CrossRef]
  161. Haas, B.; Mittelberger, A.; Meyer, C.; Plotkin-Swing, B.; Dellby, N.; Krivanek, O.; Lovejoy, T.; Koch, C. High-fidelity 4D-STEM enabled by live processing at 15,000 detector frames per second. Microsc. Microanal. 2021, 27, 994–997. [Google Scholar] [CrossRef]
  162. Haase, R.; Royer, L.A.; Steinbach, P.; Schmidt, D.; Dibrov, A.; Schmidt, U.; Weigert, M.; Maghelli, N.; Tomancak, P.; Jug, F. CLIJ: GPU-accelerated image processing for everyone. Nat. Methods 2020, 17, 5–6. [Google Scholar] [CrossRef] [PubMed]
  163. Robinson, A.W.; Wells, J.; Nicholls, D.; Moshtaghpour, A.; Kirkland, A.I.; Browning, N.D. Real-time Experimental 4-D STEM Using Compressive Sensing. Microsc. Microanal. 2024, 30, 1891–1893. [Google Scholar] [CrossRef]
  164. Shi, C.; Cao, M.; Muller, D.; Han, Y. Rapid and semi-automated analysis of 4D-STEM data via unsupervised learning. Microsc. Microanal. 2021, 27, 58–59. [Google Scholar] [CrossRef]
  165. Han, Y.; Shi, C.; Cao, M.; Jiang, Y. Assisting 4D-STEM Data Processing with Unsupervised Machine Learning. Microsc. Microanal. 2022, 28, 414–417. [Google Scholar] [CrossRef]
  166. Shi, C.; Cao, M.C.; Rehn, S.M.; Bae, S.-H.; Kim, J.; Jones, M.R.; Muller, D.A.; Han, Y. Uncovering material deformations via machine learning combined with four-dimensional scanning transmission electron microscopy. npj Comput. Mater. 2022, 8, 114. [Google Scholar] [CrossRef]
  167. Han, Y. Understanding Strain and Deformation in 2D Materials Via 4D-STEM and Cryo-EM. In Proceedings of the Electrochemical Society Meeting Abstracts 243, Hynes Convention Center and Sheraton, Boston, Boston, MA, USA, 28 May–2 June 2023; p. 1308. [Google Scholar]
  168. Harikrishnan, K.; Yoon, D.; Shao, Y.-T.; Mele, L.; Mitterbauer, C.; Muller, D. Dose-efficient strain mapping with high precision and throughput using cepstral transforms on 4D-STEM data. Microsc. Microanal. 2021, 27, 1994–1996. [Google Scholar] [CrossRef]
  169. Huth, M.; Eckert, B.; Aschauer, S.; Hedley, E.; Nellist, P.; Majewski, P.; Strüder, L.; Soltau, H. Combine 4D STEM and EELS Using a Fast Pixelated Direct Detector with Center Hole. Microsc. Microanal. 2023, 29, 401–402. [Google Scholar] [CrossRef]
  170. Sagawa, R.; Hashiguchi, H.; Nakamura, A.; Shibagaki, S.; Kazama, Y.; Muth, M.; Imari, Y.E.; Kroner, V.; Aschauer, S. Simultaneous Acquisition of 4D and EELS Data by Newly Developed Pixelated STEM Detector. Microsc. Microanal. 2024, 30. [Google Scholar] [CrossRef]
  171. Craig, I.M.; Van Winkle, M.; Ophus, C.; Bediako, D.K. Considerations for extracting moiré-level strain from dark field intensities in transmission electron microscopy. arXiv 2024, arXiv:2406.04515. [Google Scholar] [CrossRef]
  172. Motoki, K.; Engel, Z.; Matthews, C.M.; Ahmad, H.; McCrone, T.M.; Harada, K.; Doolittle, W.A. Observation of interfacial strain relaxation and electron beam damage thresholds in Al0.3In0.7N/GaN heterostructures by transmission electron microscopy. J. Vac. Sci. Technol. B 2022, 40, 052210. [Google Scholar] [CrossRef]
  173. Biefeld, R.M.; Koleske, D.D.; Cederberg, J.G. 3—The Science and Practice of Metal-Organic Vapor Phase Epitaxy (MOVPE). In Handbook of Crystal Growth (Second Edition); Kuech, T.F., Ed.; North-Holland: Boston, MA, USA, 2015; pp. 95–160. [Google Scholar]
  174. Xing, Z.; Yang, W.; Yuan, Z.; Li, X.; Wu, Y.; Long, J.; Jin, S.; Zhao, Y.; Liu, T.; Bian, L.; et al. Growth and Characterization of High In-content InGaN grown by MBE using Metal Modulated Epitaxy Technique (MME). J. Cryst. Growth 2019, 516, 57–62. [Google Scholar] [CrossRef]
  175. Arbouet, A.; Caruso, G.M.; Houdellier, F. Ultrafast transmission electron microscopy: Historical development, instrumentation, and applications. Adv. Imaging Electron Phys. 2018, 207, 1–72. [Google Scholar]
  176. Shimojima, T.; Nakamura, A.; Ishizaka, K. Development and applications of ultrafast transmission electron microscopy. Microscopy 2023, 72, 287–298. [Google Scholar] [CrossRef] [PubMed]
  177. Montgomery, E.; Leonhardt, D.; Roehling, J. Ultrafast transmission electron microscopy: Techniques and applications. Microsc. Today 2021, 29, 46–54. [Google Scholar] [CrossRef]
  178. Ropers, C.; Solli, D.R.; Schulz, C.P.; Lienau, C.; Elsaesser, T. Localized multiphoton emission of femtosecond electron pulses from metal nanotips. Phys. Rev. Lett. 2007, 98, 043907. [Google Scholar] [CrossRef]
  179. Mattes, M.; Volkov, M.; Baum, P. Femtosecond electron beam probe of ultrafast electronics. Nat. Commun. 2024, 15, 1743. [Google Scholar] [CrossRef] [PubMed]
  180. Feist, A.; Rubiano da Silva, N.; Liang, W.; Ropers, C.; Schäfer, S. Nanoscale diffractive probing of strain dynamics in ultrafast transmission electron microscopy. Struct. Dyn. 2018, 5, 014302. [Google Scholar] [CrossRef]
  181. Cremons, D.R.; Plemmons, D.A.; Flannigan, D.J. Femtosecond electron imaging of defect-modulated phonon dynamics. Nat. Commun. 2016, 7, 11230. [Google Scholar] [CrossRef] [PubMed]
  182. Lubk, A.; Zweck, J. Differential phase contrast: An integral perspective. Phys. Rev. A 2015, 91, 023805. [Google Scholar] [CrossRef]
  183. Shibata, N.; Findlay, S.D.; Kohno, Y.; Sawada, H.; Kondo, Y.; Ikuhara, Y. Differential phase-contrast microscopy at atomic resolution. Nat. Phys. 2012, 8, 611–615. [Google Scholar] [CrossRef]
  184. De Graaf, S.; Ahmadi, M.; Lazić, I.; Bosch, E.G.; Kooi, B.J. Imaging atomic motion of light elements in 2D materials with 30 kV electron microscopy. Nanoscale 2021, 13, 20683–20691. [Google Scholar] [CrossRef] [PubMed]
  185. Sheth, L.K.; Piotrowski, A.L.; Voss, N.R. Visualization and quality assessment of the contrast transfer function estimation. J. Struct. Biol. 2015, 192, 222–234. [Google Scholar] [CrossRef]
  186. Sorzano, C.; Jonic, S.; Núñez-Ramírez, R.; Boisset, N.; Carazo, J. Fast, robust, and accurate determination of transmission electron microscopy contrast transfer function. J. Struct. Biol. 2007, 160, 249–262. [Google Scholar] [CrossRef] [PubMed]
  187. Li, Z.; Biskupek, J.; Kaiser, U.; Rose, H. Integrated differential phase contrast (IDPC)-STEM utilizing a multi-sector detector for imaging thick samples. Microsc. Microanal. 2022, 28, 611–621. [Google Scholar] [CrossRef] [PubMed]
  188. Thust, A. High-resolution transmission electron microscopy on an absolute contrast scale. Phys. Rev. Lett. 2009, 102, 220801. [Google Scholar] [CrossRef] [PubMed]
  189. Seifer, S.; Houben, L.; Elbaum, M. Flexible STEM with simultaneous phase and depth contrast. Microsc. Microanal. 2021, 27, 1476–1487. [Google Scholar] [CrossRef]
  190. Cao, S.; Chi, M.; More, K.L. Electromagnetic field reconstructions of 4D-STEM datasets using ptychography and differential phase contrast imaging. Microsc. Microanal. 2019, 25, 66–67. [Google Scholar] [CrossRef]
  191. Li, G.; Zhang, H.; Han, Y. 4D-STEM ptychography for electron-beam-sensitive materials. ACS Cent. Sci. 2022, 8, 1579–1588. [Google Scholar] [CrossRef] [PubMed]
  192. Müller, K.; Krause, F.F.; Béché, A.; Schowalter, M.; Galioit, V.; Löffler, S.; Verbeeck, J.; Zweck, J.; Schattschneider, P.; Rosenauer, A. Atomic electric fields revealed by a quantum mechanical approach to electron picodiffraction. Nat. Commun. 2014, 5, 5653. [Google Scholar] [CrossRef] [PubMed]
  193. Hüe, F.; Rodenburg, J.; Maiden, A.; Sweeney, F.; Midgley, P. Wave-front phase retrieval in transmission electron microscopy via ptychography. Phys. Rev. B 2010, 82, 121415. [Google Scholar] [CrossRef]
  194. Pennycook, T.J.; Martinez, G.T.; Nellist, P.D.; Meyer, J.C. High dose efficiency atomic resolution imaging via electron ptychography. Ultramicroscopy 2019, 196, 131–135. [Google Scholar] [CrossRef] [PubMed]
  195. Pennycook, T.J.; Martinez, G.T.; Nellist, P.D.; Meyer, J.C. High dose efficiency atomic resolution phase imaging with electron ptychography. Microsc. Microanal. 2018, 24, 196–197. [Google Scholar] [CrossRef]
  196. Valzania, L.; Dong, J.; Gigan, S. Accelerating ptychographic reconstructions using spectral initializations. Opt. Lett. 2021, 46, 1357–1360. [Google Scholar] [CrossRef]
  197. Yu, X.; Bicer, T.; Kettimuthu, R.; Foster, I. Topology-aware optimizations for multi-gpu ptychographic image reconstruction. In Proceedings of the ACM International Conference on Supercomputing, Virtual Conference, 14–17 June 2021; pp. 354–366. [Google Scholar]
  198. Babu, A.V.; Zhou, T.; Kandel, S.; Bicer, T.; Liu, Z.; Judge, W.; Ching, D.J.; Jiang, Y.; Veseli, S.; Henke, S. Deep learning at the edge enables real-time streaming ptychographic imaging. Nat. Commun. 2023, 14, 7059. [Google Scholar] [CrossRef] [PubMed]
  199. Hill, M.O.; Calvo-Almazan, I.; Allain, M.; Holt, M.V.; Ulvestad, A.; Treu, J.; Koblmuller, G.; Huang, C.; Huang, X.; Yan, H. Measuring three-dimensional strain and structural defects in a single InGaAs nanowire using coherent X-ray multiangle Bragg projection ptychography. Nano Lett. 2018, 18, 811–819. [Google Scholar] [CrossRef] [PubMed]
  200. Fewster, P.F. Reciprocal space mapping. Crit. Rev. Solid State Mater. Sci. 1997, 22, 69–110. [Google Scholar] [CrossRef]
  201. Stockmar, M.; Hubert, M.; Dierolf, M.; Enders, B.; Clare, R.; Allner, S.; Fehringer, A.; Zanette, I.; Villanova, J.; Laurencin, J. X-ray nanotomography using near-field ptychography. Opt. Express 2015, 23, 12720–12731. [Google Scholar] [CrossRef]
  202. Aslan, S.; Liu, Z.; Nikitin, V.; Bicer, T.; Leyffer, S.; Gursoy, D. Deep priors for ptycho-tomography. Microsc. Microanal. 2020, 26, 2466. [Google Scholar] [CrossRef]
  203. Alpers, A.; Gardner, R.J.; König, S.; Pennington, R.S.; Boothroyd, C.B.; Houben, L.; Dunin-Borkowski, R.E.; Batenburg, K.J. Geometric reconstruction methods for electron tomography. Ultramicroscopy 2013, 128, 42–54. [Google Scholar] [CrossRef] [PubMed]
  204. Dahmen, T.; Kohr, H.; Lupini, A.R.; Baudoin, J.-P.; Kübel, C.; Trampert, P.; Slusallek, P.; de Jonge, N. Combined tilt-and focal-series tomography for HAADF-STEM. Microsc. Today 2016, 24, 26–31. [Google Scholar] [CrossRef]
  205. Vanrompay, H.; Bladt, E.; Albrecht, W.; Béché, A.; Zakhozheva, M.; Sánchez-Iglesias, A.; Liz-Marzán, L.M.; Bals, S. 3D characterization of heat-induced morphological changes of Au nanostars by fast in situ electron tomography. Nanoscale 2018, 10, 22792–22801. [Google Scholar] [CrossRef] [PubMed]
  206. Ke, X.; Turner, S.; Quintana, M.; Hadad, C.; Montellano-López, A.; Carraro, M.; Sartorel, A.; Bonchio, M.; Prato, M.; Bittencourt, C. Dynamic motion of Ru-polyoxometalate ions (POMs) on functionalized few-layer graphene. Small 2013, 9, 3922–3927. [Google Scholar] [CrossRef] [PubMed]
  207. Padgett, E.; Andrejevic, N.; Liu, Z.; Kongkanand, A.; Gu, W.; Moriyama, K.; Jiang, Y.; Kumaraguru, S.; Moylan, T.E.; Kukreja, R. Connecting fuel cell catalyst nanostructure and accessibility using quantitative cryo-STEM tomography. J. Electrochem. Soc. 2018, 165, F173–F180. [Google Scholar] [CrossRef]
  208. Hovden, R.; Ercius, P.; Jiang, Y.; Wang, D.; Yu, Y.; Abruña, H.D.; Elser, V.; Muller, D.A. Breaking the Crowther limit: Combining depth-sectioning and tilt tomography for high-resolution, wide-field 3D reconstructions. Ultramicroscopy 2014, 140, 26–31. [Google Scholar] [CrossRef] [PubMed]
  209. van den Bos, K.H.W.; Altantzis, T.; De Backer, A.; Van Aert, S.; Bals, S. Recent breakthroughs in scanning transmission electron microscopy of small species. Adv. Phys. X 2018, 3, 1480420. [Google Scholar] [CrossRef]
  210. Arslan Irmak, E.; Liu, P.; Bals, S.; Van Aert, S. 3D Atomic structure of supported metallic nanoparticles estimated from 2D ADF STEM images: A combination of atom-counting and a local minima search algorithm. Small Methods 2021, 5, 2101150. [Google Scholar] [CrossRef] [PubMed]
  211. Liu, P.; Irmak, E.A.; De Backer, A.; Lobato, I.; Béché, A.; Van Aert, S.; Bals, S. Three-dimensional atomic structure of supported Au nanoparticles at high temperature. Nanoscale 2021, 13, 1770–1776. [Google Scholar] [CrossRef]
  212. Albrecht, W.; Van Aert, S.; Bals, S. Three-dimensional nanoparticle transformations captured by an electron microscope. Acc. Chem. Res. 2021, 54, 1189–1199. [Google Scholar] [CrossRef] [PubMed]
  213. Hodnik, N.; Dehm, G.; Mayrhofer, K.J. Importance and challenges of electrochemical in situ liquid cell electron microscopy for energy conversion research. Acc. Chem. Res. 2016, 49, 2015–2022. [Google Scholar] [CrossRef]
  214. Bergmann, A.; Roldan Cuenya, B. Operando insights into nanoparticle transformations during catalysis. ACS Catal. 2019, 9, 10020–10043. [Google Scholar] [CrossRef]
  215. Yang, Y.; Zhou, J.; Zhu, F.; Yuan, Y.; Chang, D.J.; Kim, D.S.; Pham, M.; Rana, A.; Tian, X.; Yao, Y.; et al. Determining the three-dimensional atomic structure of an amorphous solid. Nature 2021, 592, 60–64. [Google Scholar] [CrossRef] [PubMed]
  216. Wang, Z.; Ke, X.; Sui, M. Recent progress on revealing 3D structure of electrocatalysts using advanced 3D electron tomography: A mini review. Front. Chem. 2022, 10, 872117. [Google Scholar] [CrossRef]
  217. Nicolai, L.; Biermann, K.; Trampert, A. Application of electron tomography for comprehensive determination of III-V interface properties. Ultramicroscopy 2021, 224, 113261. [Google Scholar] [CrossRef]
  218. Walther, T.; Gerthsen, D. Quantitative characterization of AlAs/GaAs interfaces by high-resolution transmission electron microscopy along the <100> and the <110> projection. Appl. Phys. A 1993, 57, 393–400. [Google Scholar]
  219. Lichte, H. Performance limits of electron holography. Ultramicroscopy 2008, 108, 256–262. [Google Scholar] [CrossRef]
  220. Dunin-Borkowski, R. Recent progress in electromagnetic field mapping at the nanoscale. Microscopy 2014, 63, i1. [Google Scholar] [CrossRef]
  221. Lichte, H.; Lehmann, M. Electron holography—Basics and applications. Rep. Prog. Phys. 2007, 71, 016102. [Google Scholar] [CrossRef]
  222. Tonomura, A. Fundamentals and applications of electron holography. In Holography, Research and Technologies; INTECH: Vukovar, Croatia, 2011; pp. 441–452. [Google Scholar]
  223. Hirayama, T.; Anada, S.; Nomura, Y.; Sasaki, H.; Saitoh, K.; Yamamoto, K. Accurate Measurement of Electric Potential Distributions at the Interfaces in Solids Using Phase-shifting Electron Holography. Microsc. Microanal. 2020, 26, 1956–1957. [Google Scholar] [CrossRef]
  224. Anada, S.; Nomura, Y.; Yamamoto, K. Enhancing performance of electron holography with mathematical and machine learning–based denoising techniques. Microscopy 2023, 72, 461–484. [Google Scholar] [CrossRef] [PubMed]
  225. Li, L.; Cheng, Y.; Liu, Z.; Yan, S.; Li, L.; Wang, J.; Zhang, L.; Gao, Y. Study of structure-property relationship of semiconductor nanomaterials by off-axis electron holography. J. Semicond. 2022, 43, 041103. [Google Scholar] [CrossRef]
  226. Li, L.; Ketharanathan, S.; Drucker, J.; McCartney, M.R. Study of hole accumulation in individual germanium quantum dots in p-type silicon by off-axis electron holography. Appl. Phys. Lett. 2009, 94, 232108. [Google Scholar] [CrossRef]
  227. Fry, P.; Itskevich, I.; Mowbray, D.; Skolnick, M.; Finley, J.; Barker, J.; O’Reilly, E.; Wilson, L.; Larkin, I.; Maksym, P. Inverted electron-hole alignment in InAs-GaAs self-assembled quantum dots. Phys. Rev. Lett. 2000, 84, 733. [Google Scholar] [CrossRef] [PubMed]
  228. Cheng, F.; Li, B.; Li, L.; Wang, X.; Shen, S.; Liu, W.; Zheng, H.; Jia, S.; Yan, X.; Zhang, X. Study of the polarization effect in InAs quantum dots/GaAs nanowires. J. Phys. Chem. C 2019, 123, 4228–4234. [Google Scholar] [CrossRef]
  229. Yan, Z.; Han, Y.; Lau, K.M. Multi-heterojunction InAs/GaSb nano-ridges directly grown on (001) Si. Nanotechnology 2020, 31, 345707. [Google Scholar] [CrossRef] [PubMed]
  230. Gourishetty, R.; Shriram, S.R.; Panda, D.P.; Chakrabarti, S. Analytical Model and Experimental Analysis to Estimate the Interdiffusion and Optoelectronic Properties of Coupled InAs Quantum Dots Post Rapid Thermal Processing. IEEE Trans. Electron Devices 2022, 69, 3775–3782. [Google Scholar] [CrossRef]
  231. Dorfmüller, J.; Vogelgesang, R.; Weitz, R.T.; Rockstuhl, C.; Etrich, C.; Pertsch, T.; Lederer, F.; Kern, K. Fabry-Pérot resonances in one-dimensional plasmonic nanostructures. Nano Lett. 2009, 9, 2372–2377. [Google Scholar] [CrossRef] [PubMed]
  232. Lovejoy, T.; Corbin, G.; Dellby, N.; Hoffman, M.; Krivanek, O. Advances in ultra-high energy resolution STEM-EELS. Microsc. Microanal. 2018, 24, 446–447. [Google Scholar] [CrossRef]
  233. Walther, T.; Gerthsen, D.; Carius, R.; Förster, A.; Urban, K. Correlation between the structural and optical properties of AlAs/GaAs quantum well structures. In: Proc. Microscopy of Semiconducting Materials: Oxford, 5—8 April 1993 (ed. by A.G. Cullis, A.E. Staton-Bevan, J.L. Hutchison). Inst. Phys. Conf. Ser. 1993, 134, 449–454. [Google Scholar]
  234. Yu, Q.; Legros, M.; Minor, A. In situ TEM nanomechanics. MRS Bull. 2015, 40, 62–70. [Google Scholar] [CrossRef]
  235. Katsuno, H.; Kimura, Y.; Yamazaki, T.; Takigawa, I. Fast improvement of TEM images with low-dose electrons by deep learning. Microsc. Microanal. 2022, 28, 138–144. [Google Scholar] [CrossRef] [PubMed]
  236. Zhao, T.; Jiang, Y.; Luo, S.; Ying, Y.; Zhang, Q.; Tang, S.; Chen, L.; Xia, J.; Xue, P.; Zhang, J.-J. On-chip gas reaction nanolab for in situ TEM observation. Lab A Chip 2023, 23, 3768–3777. [Google Scholar] [CrossRef] [PubMed]
  237. Wirth, R. Focused Ion Beam (FIB) combined with SEM and TEM: Advanced analytical tools for studies of chemical composition, microstructure and crystal structure in geomaterials on a nanometre scale. Chem. Geol. 2009, 261, 217–229. [Google Scholar] [CrossRef]
  238. Haswell, R.; McComb, D.; Smith, W. Preparation of site-specific cross-sections of heterogeneous catalysts prepared by focused ion beam milling. J. Microsc. 2003, 211, 161–166. [Google Scholar] [CrossRef]
  239. Pan, Y.; Zhao, Y.; Tan, P.K.; Mai, Z.; Rivai, F.; Lam, J. Problems of and solutions for coating techniques for tem sample preparation on ultra low-k dielectric devices after progressive-FIB cross-section analysis. In Proceedings of the 2018 IEEE International Symposium on the Physical and Failure Analysis of Integrated Circuits (IPFA), Singapore, 16–19 July 2018; pp. 1–5. [Google Scholar]
  240. Jublot, M.; Texier, M. Sample preparation by focused ion beam micromachining for transmission electron microscopy imaging in front-view. Micron 2014, 56, 63–67. [Google Scholar] [CrossRef] [PubMed]
  241. Novák, L.; Stárek, J.; Vystavěl, T.; Mele, L. MEMS-based heating element for in-situ dynamical experiments on FIB/SEM systems. Microsc. Microanal. 2016, 22, 184–185. [Google Scholar] [CrossRef]
  242. Saowadee, N.; Agersted, K.; Bowen, J.R. Effects of focused ion beam milling on electron backscatter diffraction patterns in strontium titanate and stabilized zirconia. J. Microsc. 2012, 246, 279–286. [Google Scholar] [CrossRef]
  243. Ko, D.-S.; Park, Y.M.; Kim, S.-D.; Kim, Y.-W. Effective removal of Ga residue from focused ion beam using a plasma cleaner. Ultramicroscopy 2007, 107, 368–373. [Google Scholar] [CrossRef] [PubMed]
  244. Stanford, M.G.; Lewis, B.B.; Iberi, V.; Fowlkes, J.D.; Tan, S.; Livengood, R.; Rack, P.D. In situ mitigation of subsurface and peripheral focused ion beam damage via simultaneous pulsed laser heating. Small 2016, 12, 1779–1787. [Google Scholar] [CrossRef]
  245. Schmied, R.; Chernev, B.; Trimmel, G.; Plank, H. New possibilities for soft matter applications: Eliminating technically induced thermal stress during FIB processing. RSC Adv. 2012, 2, 6932–6938. [Google Scholar] [CrossRef]
  246. Matsutani, T.; Kawasaki, T.; Kodama, T.; Hisaka, M.; Takai, Y.; Ikuta, T. Development of focused ion beam system attached to floating type low energy ion gun for surface finishing. Vacuum 2014, 110, 228–231. [Google Scholar] [CrossRef]
  247. Wolff, A.; Klingner, N.; Thompson, W.; Zhou, Y.; Lin, J.; Peng, Y.Y.; Ramshaw, J.A.; Xiao, Y. Modelling of focused ion beam induced increases in sample temperature: A case study of heat damage in biological samples. J. Microsc. 2018, 272, 47–59. [Google Scholar] [CrossRef] [PubMed]
  248. Gardener, J.; Akey, A.; Alsem, D.H.; Bell, D. Focused ion beam sample preparation for high temperature in-situ transmission electron microscopy experiments: Use carbon for now. Microsc. Microanal. 2020, 26, 3202–3203. [Google Scholar] [CrossRef]
  249. Zhong, X.; Wade, C.A.; Withers, P.J.; Zhou, X.; Cai, C.; Haigh, S.J.; Burke, M.G. Comparing Xe+ pFIB and Ga+ FIB for TEM sample preparation of Al alloys: Minimising FIB-induced artefacts. J. Microsc. 2021, 282, 101–112. [Google Scholar] [CrossRef] [PubMed]
  250. Radić, D.; Peterlechner, M.; Bracht, H. Focused ion beam sample preparation for in situ thermal and electrical transmission electron microscopy. Microsc. Microanal. 2021, 27, 828–834. [Google Scholar] [CrossRef] [PubMed]
  251. Minenkov, A.; Šantić, N.; Truglas, T.; Aberl, J.; Vukušić, L.; Brehm, M.; Groiss, H. Advanced preparation of plan-view specimens on a MEMS chip for in situ TEM heating experiments. MRS Bull. 2022, 47, 359–370. [Google Scholar] [CrossRef] [PubMed]
  252. Gröger, R.; Marchand, B.; Lookman, T. Dislocations via incompatibilities in phase-field models of microstructure evolution. Phys. Rev. B 2016, 94, 054105. [Google Scholar] [CrossRef]
  253. Levitas, V.I.; Javanbakht, M. Interaction between phase transformations and dislocations at the nanoscale. Part 1. General phase field approach. J. Mech. Phys. Solids 2015, 82, 287–319. [Google Scholar] [CrossRef]
  254. Phan, V.-T.; Zhang, X.; Li, Y.; Oskay, C. Microscale modeling of creep deformation and rupture in nickel-based superalloy IN 617 at high temperature. Mech. Mater. 2017, 114, 215–227. [Google Scholar] [CrossRef]
  255. Aba-Perea, P.-E.; Withers, P.J.; Pirling, T.; Paradowska, A.; Ma, D.; Preuss, M. In situ study of the stress relaxation during aging of nickel-base superalloy forgings. Metall. Mater. Trans. A 2019, 50, 3555–3565. [Google Scholar] [CrossRef]
  256. Chen, R.; Dayeh, S.A. Recordings and analysis of atomic ledge and dislocation movements in InGaAs to nickelide nanowire phase transformation. Small 2017, 13, 1604117. [Google Scholar] [CrossRef]
  257. Kröger, A.; Wernhardt, R.; Somsen, C.; Eggeler, G.; Wieck, A. In situ transmission electron microscopy-investigations on the strain-induced B19′-phase in NiTi shape memory alloys structured by focused ion beam. Mater. Sci. Eng. A 2006, 438, 513–516. [Google Scholar] [CrossRef]
  258. Frick, C.P.; Lang, T.W.; Spark, K.; Gall, K. Stress-induced martensitic transformations and shape memory at nanometer scales. Acta Mater. 2006, 54, 2223–2234. [Google Scholar] [CrossRef]
  259. Wang, Y.-C.; Zhang, W.; Wang, L.-Y.; Zhuang, Z.; Ma, E.; Li, J.; Shan, Z.-W. In situ TEM study of deformation-induced crystalline-to-amorphous transition in silicon. NPG Asia Mater. 2016, 8, e291. [Google Scholar] [CrossRef]
  260. Walther, T. What environmental transmission electron microscopy measures and how this links to diffusivity: Thermodynamics versus kinetics. J. Microsc. 2015, 257, 87–91. [Google Scholar] [CrossRef] [PubMed]
  261. Zheng, H.; Zhu, Y. Perspectives on in situ electron microscopy. Ultramicroscopy 2017, 180, 188–196. [Google Scholar] [CrossRef] [PubMed]
  262. Straubinger, R.; Beyer, A.; Volz, K. Preparation and loading process of single crystalline samples into a gas environmental cell holder for in situ atomic resolution scanning transmission electron microscopic observation. Microsc. Microanal. 2016, 22, 515–519. [Google Scholar] [CrossRef]
  263. Wagner, J.B.; Cavalca, F.; Damsgaard, C.D.; Duchstein, L.D.; Hansen, T.W. Exploring the environmental transmission electron microscope. Micron 2012, 43, 1169–1175. [Google Scholar] [CrossRef] [PubMed]
  264. Persson, A.R.; Tornberg, M.; Sjökvist, R.; Jacobsson, D. Time-resolved compositional mapping during in situ TEM studies. Ultramicroscopy 2021, 222, 113193. [Google Scholar] [CrossRef] [PubMed]
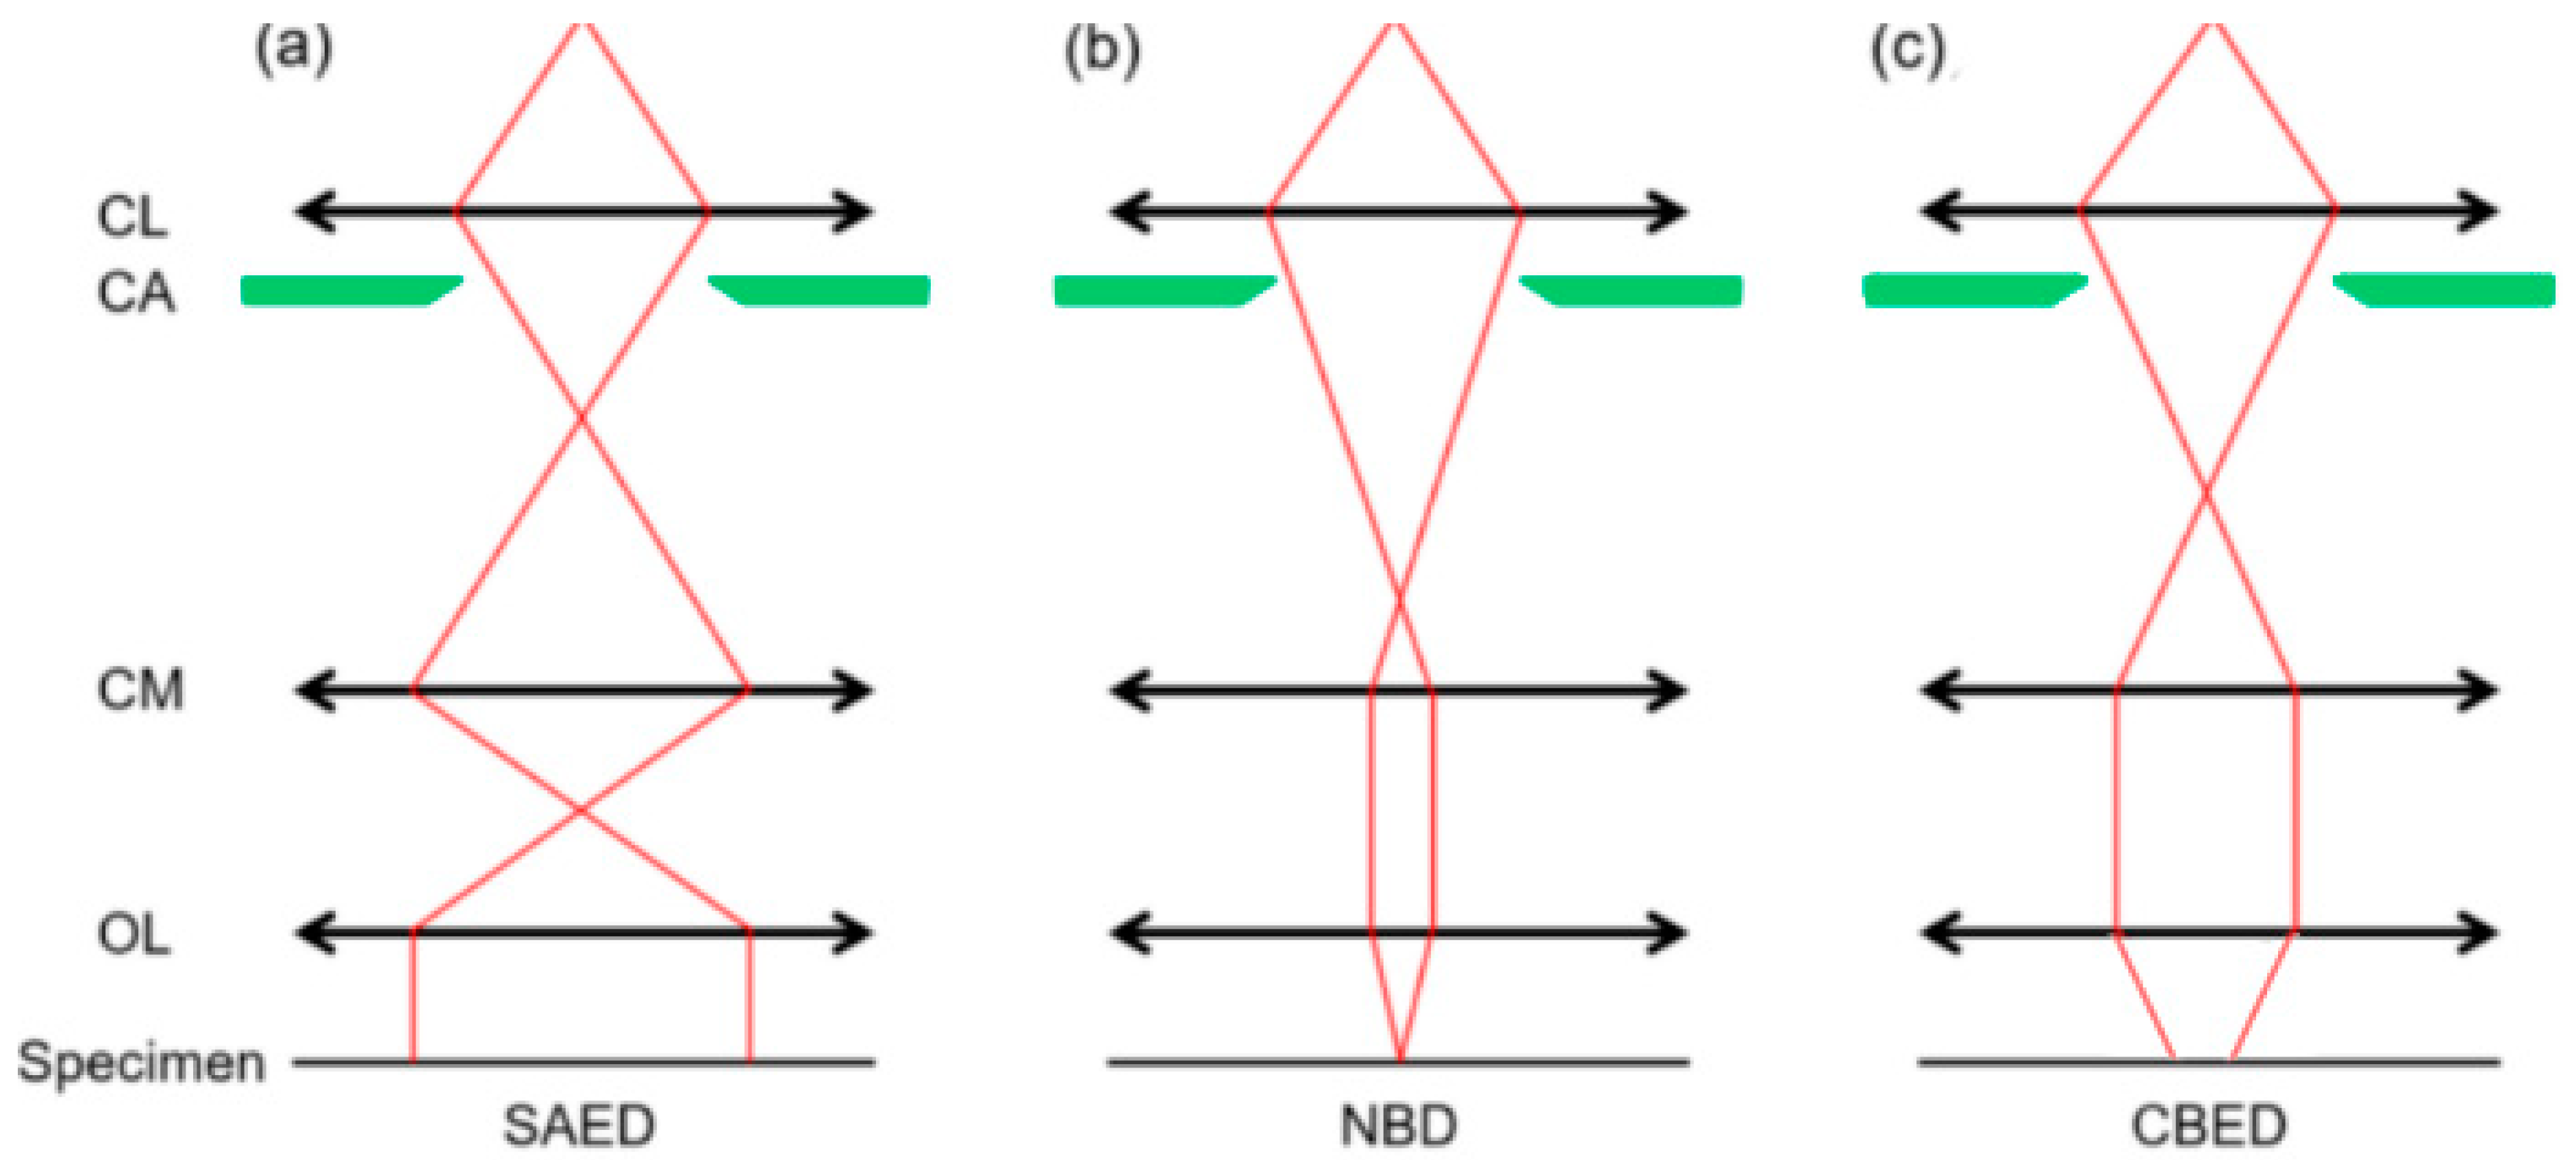
Figure 1. Comparison between (a) SAED, (b) NBD, and (c) CBED. CL: condenser lens; CA: condenser aperture; CM: condenser mini lens; OL: objective pre-field lens.
Crystals 15 00192 g001
Figure 2. (a) HR-TEM micrographs of HCP-ALD-grown GaN films depicting the film/substrate interface, which confirms the polycrystalline film structure and the native oxide layer. (b) SAED pattern from the GaN film region, which confirms its main five hexagonal crystal planes. Faint rings due to amorphous material both at the interface region and on the specimen surface are also visible [65].
Crystals 15 00192 g002
Figure 3. Two SiGe quantum wells embedded within silicon nanowires, forming a three-dimensional array. (a) In-plane (220) lattice deformation map and (b) out-of-plane (002) lattice strain map of SiGe/Si [85].
Crystals 15 00192 g003
Figure 4. The maps of a SiGe/Si fin structure were determined from nano-beam PED patterns acquired with a convergence semi-angle of 2.5 mrad, a beam precession at 200 Hz at an angle of 0.35°, and an exposure time of 50 ms. The unstrained Si reference is taken from the fin base further away from the nanosheet stacks. The precision of the measurement is about 3 × 10⁻⁴. Color maps show the relaxation in SiGe layers, especially from both SiGe edge locations. The SiGe strain relaxation also generates tensile strain in the Si layer. (a) Cross-sectional dark-field STEM image of nanosheet fin; (b) out-of-plane (002) lattice deformation map; (c) in-plane (220) lattice deformation map; (d) rotation map [98].
Crystals 15 00192 g004
Figure 5. Comparison of (a) in-plane and (b) out-of-plane lattice deformation maps obtained by PED with finite element simulation results for (c) in-plane and (d) out-of-plane SiGe/Si fins [98].
Crystals 15 00192 g005
Figure 6. (a) Cross-sectional bright-field TEM image of a semiconductor heterostructure showing p-In0.01Ga0.99As/n-In0.05Ga0.95As/GaAs/Ge layers deposited on a silicon substrate (not seen). A two-beam (g1 = 0, g2 = 200) diffraction condition is used. Threading dislocations are seen in the Ge/GaAs/InGaAs layers. (b) Plan view secondary electron image of the surface of the sample from a different area. (c) Corresponding plan view electron channeling contrast image (ECCI) where threading dislocations are seen as dots. The site chosen for APT analysis is also shown here, and the micron-sized growth defect is used as a fiducial marker since ECCI and APT preparation were performed on different microscopes [114].
Crystals 15 00192 g006
Figure 7. Cross-sectional WBDF TEM images (surfaces are indicated by the red dashed lines at the top) of a silicon-implanted Si sample annealed by (a) 10 pulses at 1.5 J/cm2 (non-melted), (b) 1 pulse at 2.6 J/cm2 (partially melted above Rp). The scale bar in the inset is 20 nm, (c) 1 pulse at 2.9 J/cm2 (partially melted below Rp). Inset: HREM image of a loop with (001) habit plane [120].
Crystals 15 00192 g007
Figure 8. (a) HAADF of Ga implantation into Al2O3. (b) Valence electron energy loss (VEEL) spectra of reference and ion-damaged regions in Al2O3. (cf) The plasmon energy maps extracted correspond to a mixture of Ga and Al2O3, with the metallic Ga plasmon resonance energy at 14.1 ± 0.1 eV (observed in the Ga nanocluster regions) and the Al2O3 plasmon energy range 25.3−25.9 eV (corresponding to the pure Al2O3 matrix regions). (g) Schematic diagram of interstitial/vacancy production and annihilation in Al2O3 [140].
Crystals 15 00192 g008
Figure 9. Microstructural characterization of GaAs QDs by TEM. (a) Overview cross-section HAADF-STEM image of a 25 nm thin GaAs QD at the surface of an Al0.23Ga0.77As matrix. The black dashed arrow represents an area of enhanced Al signals, and the yellow arrow points to the QD “core” region. The TEM sample thickness is about 75 nm. (b) Elemental maps of selected elements from the region shown in (a). The GaAs QD shows Al depletion, slight Ga enrichment, and no change in As signals. Oxidation of the sample leads to an oxidized surface layer. Al-rich asymmetric sidewalls on the left and right sides can be seen in the Al map. (c) Qualitative comparison of summed-up and normalized EDS spectra from the GaAs QD and Al0.23Ga0.77As regions. Note the depletion (enrichment) of the Al (Ga) signal in the QD region relative to the matrix, marked with dotted (solid) arrows. The EDS intensities were normalized to the total number of X-ray counts in each spectrum for easier comparison. (d) LAADF−STEM image of the QD showing no visible intensity changes at the QD-matrix interface, indicating no/low strain and no crystalline defects. (e,f) Overview and higher magnification HAADF−STEM image of the QD-matrix interface. The dashed line roughly marks the expected position of the interface [142].
Crystals 15 00192 g009
Figure 10. Cross-sectional bright field (BF) STEM images taken at the [110] zone axis of InxGa1−xAs/GaAs for (a) wafer 1 (x = 0.1), (b) wafer 2 (x = 0.14), (c) wafer 3 (x = 0.175), and (d) reference wafer 4 (x = 0). Misfit dislocations (MDs) [155] were observed in wafers 1 and 2. The intensity modulation for wafer 3 (x = 0.175) in (c) was due to higher strain in the SLs [148].
Crystals 15 00192 g010
Figure 11. Illustration of a simultaneously performed 4D STEM and EELS measurement with a pixelated direct detector with a central round hole [169].
Crystals 15 00192 g011
Figure 12. Strain-field map calculated from lattice expansion in 4D-STEM nano-beam diffraction patterns. (a) ADF STEM image close to the <11–20> pole with the rectangle showing the scanned area for 4D-STEM. (b) The scanned 4D-STEM region, including the AlInN/GaN interface. (c,d) Are diffraction patterns taken at points C and D in (b). (e,f) are strain maps calculated from local nanobeam diffraction patterns in (b) corresponding to u = [1–100] and v = [0002], respectively. (g,h) Are histograms of strain vs. the number of pixels of the corresponding strain map in (e,f), respectively [172].
Crystals 15 00192 g012
Figure 13. Morphological heterogeneity and atomic-scale order of the Ge specimen regions of interest. (a) a thin Ge crystal. The red, dashed circle denotes the position of the selected-area aperture used to generate the diffraction patterns shown in (b). Scale bars are 1 µm. (b) Corresponding selected-area diffraction patterns obtained approximately along the [110] zone axes for Ge, respectively, with several Bragg spots indicated. Scale bars are 2 nm−1. (c) Crystal structures of Ge, as viewed down the [110] zone axes [181].
Crystals 15 00192 g013
Figure 14. Real-space femtosecond electron imaging of single-phonon wavefronts in Ge. (a) Bright-field image of the Ge region shown in Figure 13, obtained at a 50 ps time delay. The images were acquired with a 25 kHz repetition rate and a 13 s integration time per frame. The three colored lines mark regions from which the mean intensity was quantified and used to generate the time traces in (h). (bg) Surface plots generated from an image series (region of interest = white rectangle in (a) highlighting approximately one period of wavetrain propagation, with a pre-time-zero frame included for reference. Motion of individual wavefronts, which appear as a continuous, deep-red depression, is indicated by the white arrows. The blue and orange arrows map the orientation to the two-dimensional image shown in (a). (h) Image-intensity measurements, obtained at the colored lines in (a), as a function of time delay (offset for clarity) [181].
Crystals 15 00192 g014
Figure 15. Experimental STEM images of InGaN/GaN quantum wells on a 1 μm thick GaN layer prepared in cross-section. Images were obtained at an accelerating voltage of 200 kV, and the probe was focused at a plane 20 nm away from the sample surface. Methods for acquiring the images include the following: (a) the DPC mode employing a fixed quadrant detector, (b) the DPC mode applying the described virtual 12-sector detector, and (c,d) the ADF mode. The HAADF image (c) is displayed by using the grayscale map of the DPC images scaled by a factor of 10−3, and the HAADF image (d) is the same image shown by applying a grayscale map adapted to its own intensity range. The illumination semi-angle is 10.5 mrad. The collection angle is 8–20 mrad for the DPC mode and 21–125 mrad for the ADF mode. The images were recorded with a sampling of 2 nm/pixel [187].
Crystals 15 00192 g015
Figure 16. Multi-angle Bragg projection ptychography (maBPP) reconstruction from the (21̅1̅0) diffraction peak of an InGaAs nanowire. A cut into the 3D reconstructed volume (a) and a 2D cut (b) taken from this volume. The cross-sectional cut was taken from the line marked (dashed white). This reconstruction gives sensitivity to lattice displacement along diffraction vector q21̅1̅0 (white arrow). The same 2D cross-sections converted to strain ( ε 11 ). (c) Pixels at which the strain-derivative wraps over in phase are not shown, as they are non-physical. Red arrows identify the NW facet connected to the Si substrate. All scale bars are 50 nm [199].
Crystals 15 00192 g016
Figure 17. maBPP reconstruction from the ( 01 1 ¯ 0 ) peak of the same InGaAs nanowire. A cut into the reconstructed volume (a) and a 2D slice (b) reveal rapidly varying phase features. A line cut of phase (c) and intensity (d) from the center of the nanowire compares two independent reconstructions with different starting guesses to test reproducibility. Correlation tables for every point in the two independent reconstructions show strong phase correlation (e). Note that the wrapping in phase around 2π results in a concentration of points at the top left and bottom right corners, which should fall along the correlation axis. The two reconstructions show a smaller degree of amplitude correlation (f). The red arrow identifies the NW facet connected to the Si substrate [199].
Crystals 15 00192 g017
Figure 18. Reconstruction of a multi-layered AlxGa1-xAs/GaAs structure. (a) 3D representation of the tomogram. (b) Slice of the reconstruction revealing the presence of a morphological roughness. (c) Line profile extracted from the center of the reconstruction [the red line in (b)]. (d) Line profile across the center of interface C [yellow line in (b)]. A, B, C, and D indicate different interfaces within the structure, where A and B represent direct AlAs/GaAs interfaces, while C and D correspond to inverted Al0.95Ga0.05A/GaAs interfaces [217].
Crystals 15 00192 g018
Figure 19. Electron hologram (a) and phase image (b) of Ge quantum dot sandwiched in Si. The bottom of the Ge dot shows extra positive phase shift, indicating holes accumulated in this region [226].
Crystals 15 00192 g019
Figure 20. Strain analysis and electron holographic characterization of InAs QD/GaAs NW. (a) GPA of the InAs QD/GaAs NW heterostructure. (b) Electron hologram of the heterostructure. (c) Reconstructed phase image of the same region in (b). (d) Phase profiles across the QD/NW region and pure NW region as indicated by the red dashed arrow and black dashed arrow in (c), respectively. [228].
Crystals 15 00192 g020
Figure 21. (a) Source switching sequence of InAs/GaSb heterojunction nano-ridges with one-step growth condition. (b) Global view cross-sectional TEM image of the InAs/GaSb nano-ridges with one-step growth. (c) Zoomed-in TEM image of the InAs/GaSb hetero-interface. (d) Source switch sequence of InAs/GaSb heterojunction nano-ridges with two-step growth. (e) Global view cross-sectional TEM image of the InAs/GaSb nano-ridges with two-step growth. (f) Zoomed-in TEM image of the InAs/GaSb hetero-interface. The yellow arrow indicates the growth direction [229].
Crystals 15 00192 g021
Figure 22. Illustration of instruments. (a) Schematic illustration of the in situ gas nanofluidic control system. (b) Schematic illustration of the gas flow holder with chips. (c) Temperature control equipment and software. (d) SEM image of the heating wire. (e) SEM image of the observation window. (f) Observation window of the top chip. (g) TEM image of the nanolab window [235].
Crystals 15 00192 g022
Figure 23. Atomic models that reveal the formation of interfacial disconnections during In0.53Ga0.47As to Ni2In0.53Ga0.47As phase transformation. (a) HRTEM images extracted at two different times from Movie S1 in the Supporting Information, giving a view of the In0.53Ga0.47As/Ni2In0.53Ga0.47As interface. The scale bar is 5 nm. (b) Lattice structures of In0.53Ga0.47As (zinc blende) and Ni2In0.53Ga0.47As (simple hexagonal). (c) Atomic arrangements in In0.53Ga0.47As (with [111] direction pointing upward) and Ni2In0.53Ga0.47As (with [0001] direction pointing upward), respectively. In In0.53Ga0.47As crystal, the atomic layers stack in an A-B-C-A-B-C… manner, while in Ni2In0.53Ga0.47As the stacking is A-A-A… In In0.53Ga0.47As crystal, an “atomic bilayer” usually refers to the bonded In (or Ga) monolayer and As monolayer. This is also used here for corresponding layers in Ni2In0.53Ga0.47As crystal after phase transformation. (d) Top view of two lattice planes in an A-B-C type of stacking, indicating that the top lattice plane has three possible in-plane gliding vectors in order to overlap with the bottom lattice plane. (e) Side view of how the A-B-C stacking of lattice planes shuffles into an A-A-A stacking manner by collective gliding of three lattice planes along three different gliding vectors as shown in (d). (f) The reconstructed atomic structures at the interface between In0.53Ga0.47As (top left) and Ni2In0.53Ga0.47As (bottom right). The nature of the single-bilayer nucleus and double-bilayer step height is depicted in this schematic, together with the labeled misfit dislocations. One monolayer of As atoms was removed at the interface of In0.53Ga0.47As side, which overlaps with the Ni atoms in Ni2In0.53Ga0.47As, in order to improve the clarity of this structure model [256].
Crystals 15 00192 g023
Figure 24. High-resolution TEM of the crystalline-to-amorphous transition process. (a) Engineering stress–strain curves of four core/shell-structured Si pillars compressed to different deformation levels εp. The loading direction is along [001], the axial direction of pillars. (b) Occurrence of many slip bands containing SFs upon plastic deformation (εp = 1%). (c) The zoomed-in image of the white-boxed region in (b) shows the detailed structure of the SF and the misfit dislocations around it. (d) Amorphization of the domains in or near the SFs is marked by the yellow arrows. (e) Many directional ‘amorphous pockets’, separated by the c-Si ones. (f) The final amorphous packets with texture-like stripes, indicated by the white dashed lines. The beam direction is [110]. a-Si: amorphous Si; c-Si: crystalline Si; SF: stacking fault [259].
Crystals 15 00192 g024
Table 1. Comparison between traditional CBED and improved CBED using electron vortex beams.
FeatureTraditional CBEDImproved CBED with Electron Vortex Beams
Beam typeconvergent electron beamelectron vortex beams (with orbital angular momentum)
Real space resolutionmoderateimproved phase and spatial precision
Contraststandard diffraction contrastenhanced by selective post-filtering
Applicationscrystal defects, strain analysischirality determination, detailed phase mapping
Setup complexitysimple, standard alignmentmore complex, requires vortex generation
Table 2. Comparative analysis of electron diffraction techniques.
TechniqueAdvantagesLimitationsApplications
SAEDSimple, quick crystal analysisLow resolution, limited defect analysisBasic crystallography, strain study
CBEDHigh-resolution, precise strain dataSensitive to thickness, complex interpretationLocal strain, crystal symmetry
NBDHigh-resolution strain mappingAffected by scattering, thickness limitsNanoscale and interface studies
PEDAverages dynamical effectsComplex data acquisitionPrecise lattice and strain analysis
Table 3. Comparison of three WBDF STEM imaging methods. Method 1, akin to the conventional WBDF setup in TEM mode, involved exciting the 3 g diffraction vector and detecting the transmitted beam on the BF detector and one diffracted beam on the ADF detector, with an objective aperture used to filter out information from other diffraction signals. Method 2 utilized a CBED pattern shifted via the projector system, moving the g disk onto the BF detector, which functioned as both a signal collector and an “aperture”. In Method 3, the sample was tilted to the standard two-beam condition by exciting the g beam with an excitation error near zero, and a proper objective aperture was inserted to allow only the −g beam to be detected on the ADF detector.
FeatureMethod 1 [127]Method 2 [128]Method 3 [117]
Image ContrastGood, but some dynamic diffraction persistsModerate, some image contrast reversal effectsBest contrast, effectively suppresses dynamic background
ResolutionModerate, influenced by thickness fringesModerate, minor resolution reductionHighest resolution, detailed visualization of dislocation core positions
Sample Tilting RequirementHigh, requires significant sample tiltingModerate, involves CBED pattern alignmentLow, minimal sample tilting needed
Background Noise SuppressionPartially effectiveModerate, residual noise remains presentMost effective, significantly reduced noise from non-defective areas
Operational ComplexityHigh, requires precise optical adjustmentsModerate, involves projector system adjustmentsLow, minimal tilting and aperture changes required
Table 4. Threading dislocation density (TDD) calculations based on plan-view TEM analysis. x represents the mole fraction of In in InxGa1-xAs/GaAs superlattice [148].
xBuffer LayerTDD (107 cm−2)TDD Reduction with Respect to x = 0 Wafer (%) for Same Buffer Type
0Ge5.90
0.1Ge4.3–28
0.14Ge3.9–34
0.175Ge5.0–15
0GaAs53.40
0.14GaAs17.9–66
Table 5. Comparison of ptychography, tomography, and electron holography.
TechniqueAdvantagesLimitationsApplications
ptychographyultra-high resolution, low-dosecomputationally intensivelow-dose, detailed imaging
tomography3D structure visualizationlong acquisition time, sampling limitationporous materials and nanoparticle studies
electron holographymeasures electric/magnetic fieldscomplex setup, high stability requiredelectromagnetic studies
Disclaimer/Publisher’s Note: The statements, opinions and data contained in all publications are solely those of the individual author(s) and contributor(s) and not of MDPI and/or the editor(s). MDPI and/or the editor(s) disclaim responsibility for any injury to people or property resulting from any ideas, methods, instructions or products referred to in the content.