Abstract
In this study, the high-temperature thermal deformation behavior of the TA4 alloy was investigated by thermal compression experiments. The effects of deformation temperature and strain rate on the rheological stress are described by analyzing the variation of stress–strain curves with different parameters and establishing the constitutive equation based on the dynamic material theory model. Thermal processing diagrams were established and plotted to analyze the optimal processing zone and the destabilization zone under different strains. From the thermal machining diagram, it can be concluded that the optimum machining zone at a strain of 0.9 is 1040~1133 K/0.01~0.7 s−1. The optimum machining zone at a strain of 0.6 is 940~1000 K/0.01~0.04 s−1. The optimum machining zone at a strain of 0.3 is 940~1000 K/0.01~0.08 s−1. The effects of different deformation conditions on the thermal deformation mechanism were analyzed in conjunction with EBSD characterization. The results showed that dynamic recrystallization (DRX) was the main deformation softening mechanism when at low strain rate (≤0.1 s−1). At higher strain rates (>0.1 s−1) and lower temperatures (<1083 K and ≥933 K), the main deformation softening mechanism was DRV; at higher temperatures (≥1083 K and ≤1133 K), the main deformation softening mechanism was DRX.
1. Introduction
Titanium, known as the “third metal” after iron and aluminum due to its abundant reserves in the Earth’s crust, has garnered significant attention. Titanium alloys, owing to their excellent comprehensive properties such as high specific strength, low density, low thermal expansion coefficient, high biocompatibility, and high corrosion resistance, are widely used in aerospace, petrochemical, automotive, shipbuilding, and biomedical fields [1,2,3,4]. In recent years, titanium alloys have gained strong momentum in the civil market, particularly as materials for consumer electronics. They have already been commercialized in electronic fabrication and aerospace industrial applications [5].
During the hot deformation process, the deformability of titanium alloys is influenced by both deformation parameters and material microstructure. Therefore, selecting appropriate deformation parameters such as strain rate, strain, and deformation temperature is crucial for the processing and mechanical performance of the final product [6,7]. These parameters interact with each other and jointly influence the hot mechanical processing of titanium alloys [8]. A constitutive model can be developed to represent the relationship between stress and strain under different loads, as well as to predict the hot processing performance under various deformation parameters. Additionally, the use of hot working diagrams allows for a more accurate determination of the material’s processing window, providing guidance for the optimization of deformation parameters during hot processing. Hao et al. [9] conducted hot compression experiments on near-α titanium alloys, studying their hot deformation behavior, microstructural evolution, and hot working diagrams; the flow behavior and flow softening mechanism evolution of the deformation under different phase fields are obtained. Wang et al. [10] used isothermal compression testing on the Ti-55511 titanium alloy to investigate the effects of various hot deformation parameters on the alloy’s properties and microstructural evolution; the heat deformation behavior and microstructure evolution of the Ti-55511 titanium alloy in the range of experimental parameters were obtained and the peak stress could be predicted. Lu et al. [11] analyzed the flow stress–strain curves of the TA10 titanium alloy under different strain rates and temperatures, developed a hot plasticity constitutive equation for pure titanium alloy based on a hyperbolic sine Arrhenius equation, and elucidated the flow-softening mechanism of this alloy. The evolution of the microstructure during the processing, such as the solidification process, subsequent heat treatment [12], thermal deformation behavior, dynamic recrystallization, and dynamic recovery [13], inevitably affects the machinability of the final product. Therefore, studying the influence of different deformation parameters on microstructural evolution during hot processing is essential for further exploring suitable manufacturing processes for the TA4 titanium alloy [14,15,16].
The selection of thermal processing parameters for the TA4 titanium alloy is investigated in this study based on real production requirements, with a focus on industrially relevant temperature ranges (933–1133 K) and strain rates (0.01–10 s−1). Hot compression tests were conducted on the alloy, and a hot plasticity constitutive equation was developed by integrating the hyperbolic sinusoidal Arrhenius equation with the dynamic material theory model. Thermal processing diagrams were then generated for different strain levels. Subsequently, optimal processing zones for the TA4 alloy were identified based on these diagrams. The effects of various parameters on the microstructural evolution, including dynamic recrystallization and dynamic recovery, were analyzed using Electron Backscatter Diffraction (EBSD). By examining the thermal deformation mechanisms, the optimal processing parameters for achieving the desired microstructure and properties were determined. This study provides valuable theoretical and practical insights into the manufacturing process, microstructure customization, and enhanced thermal processing techniques for the TA4 titanium alloy.
2. Materials and Methods
2.1. Experimental Materials
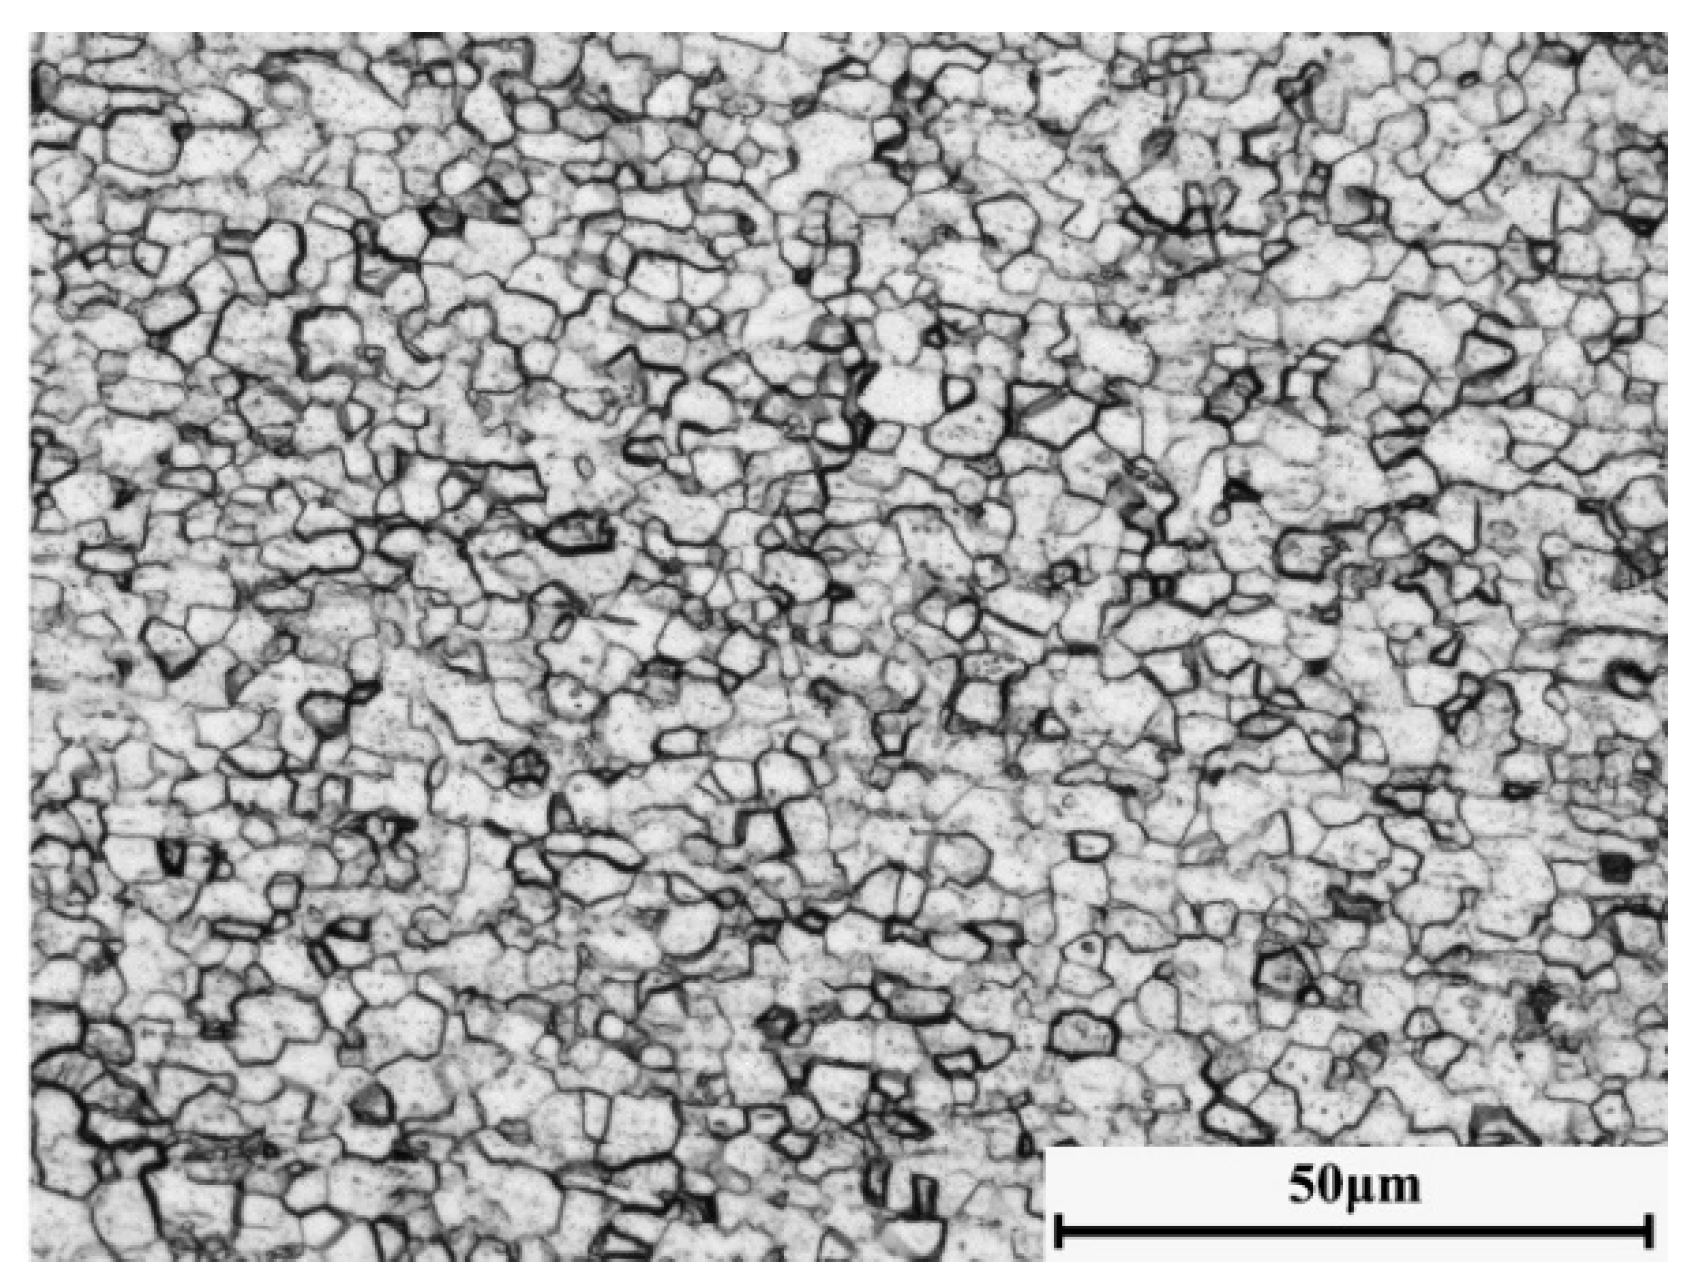
The experimental material used in this study is commercial-grade TA4 titanium wire (GB/T 3620.1) [17]. The titanium wire was processed through multiple vacuum remelting, followed by forging and high-line rolling. The TA4 titanium alloy is an α-type titanium alloy. Figure 1 is the metallographic microstructure of the alloy after full annealing, it can be seen that its micro structure after annealing is almost entirely equiaxial α-phase, the intergranular position will have a small amount of β-phase (dark), the distribution of grains is uniform, and the average grain size is about 10 μm. Table 1 also provides the elemental composition and content of the TA4 titanium alloy used in the experiment.

Figure 1.
Microstructure of the TA4 titanium alloy (LM).

Table 1.
Standard chemical composition (wt%) of the TA4 titanium alloy according to GB/T 3620.1.
2.2. High-Temperature Thermal Compression Test
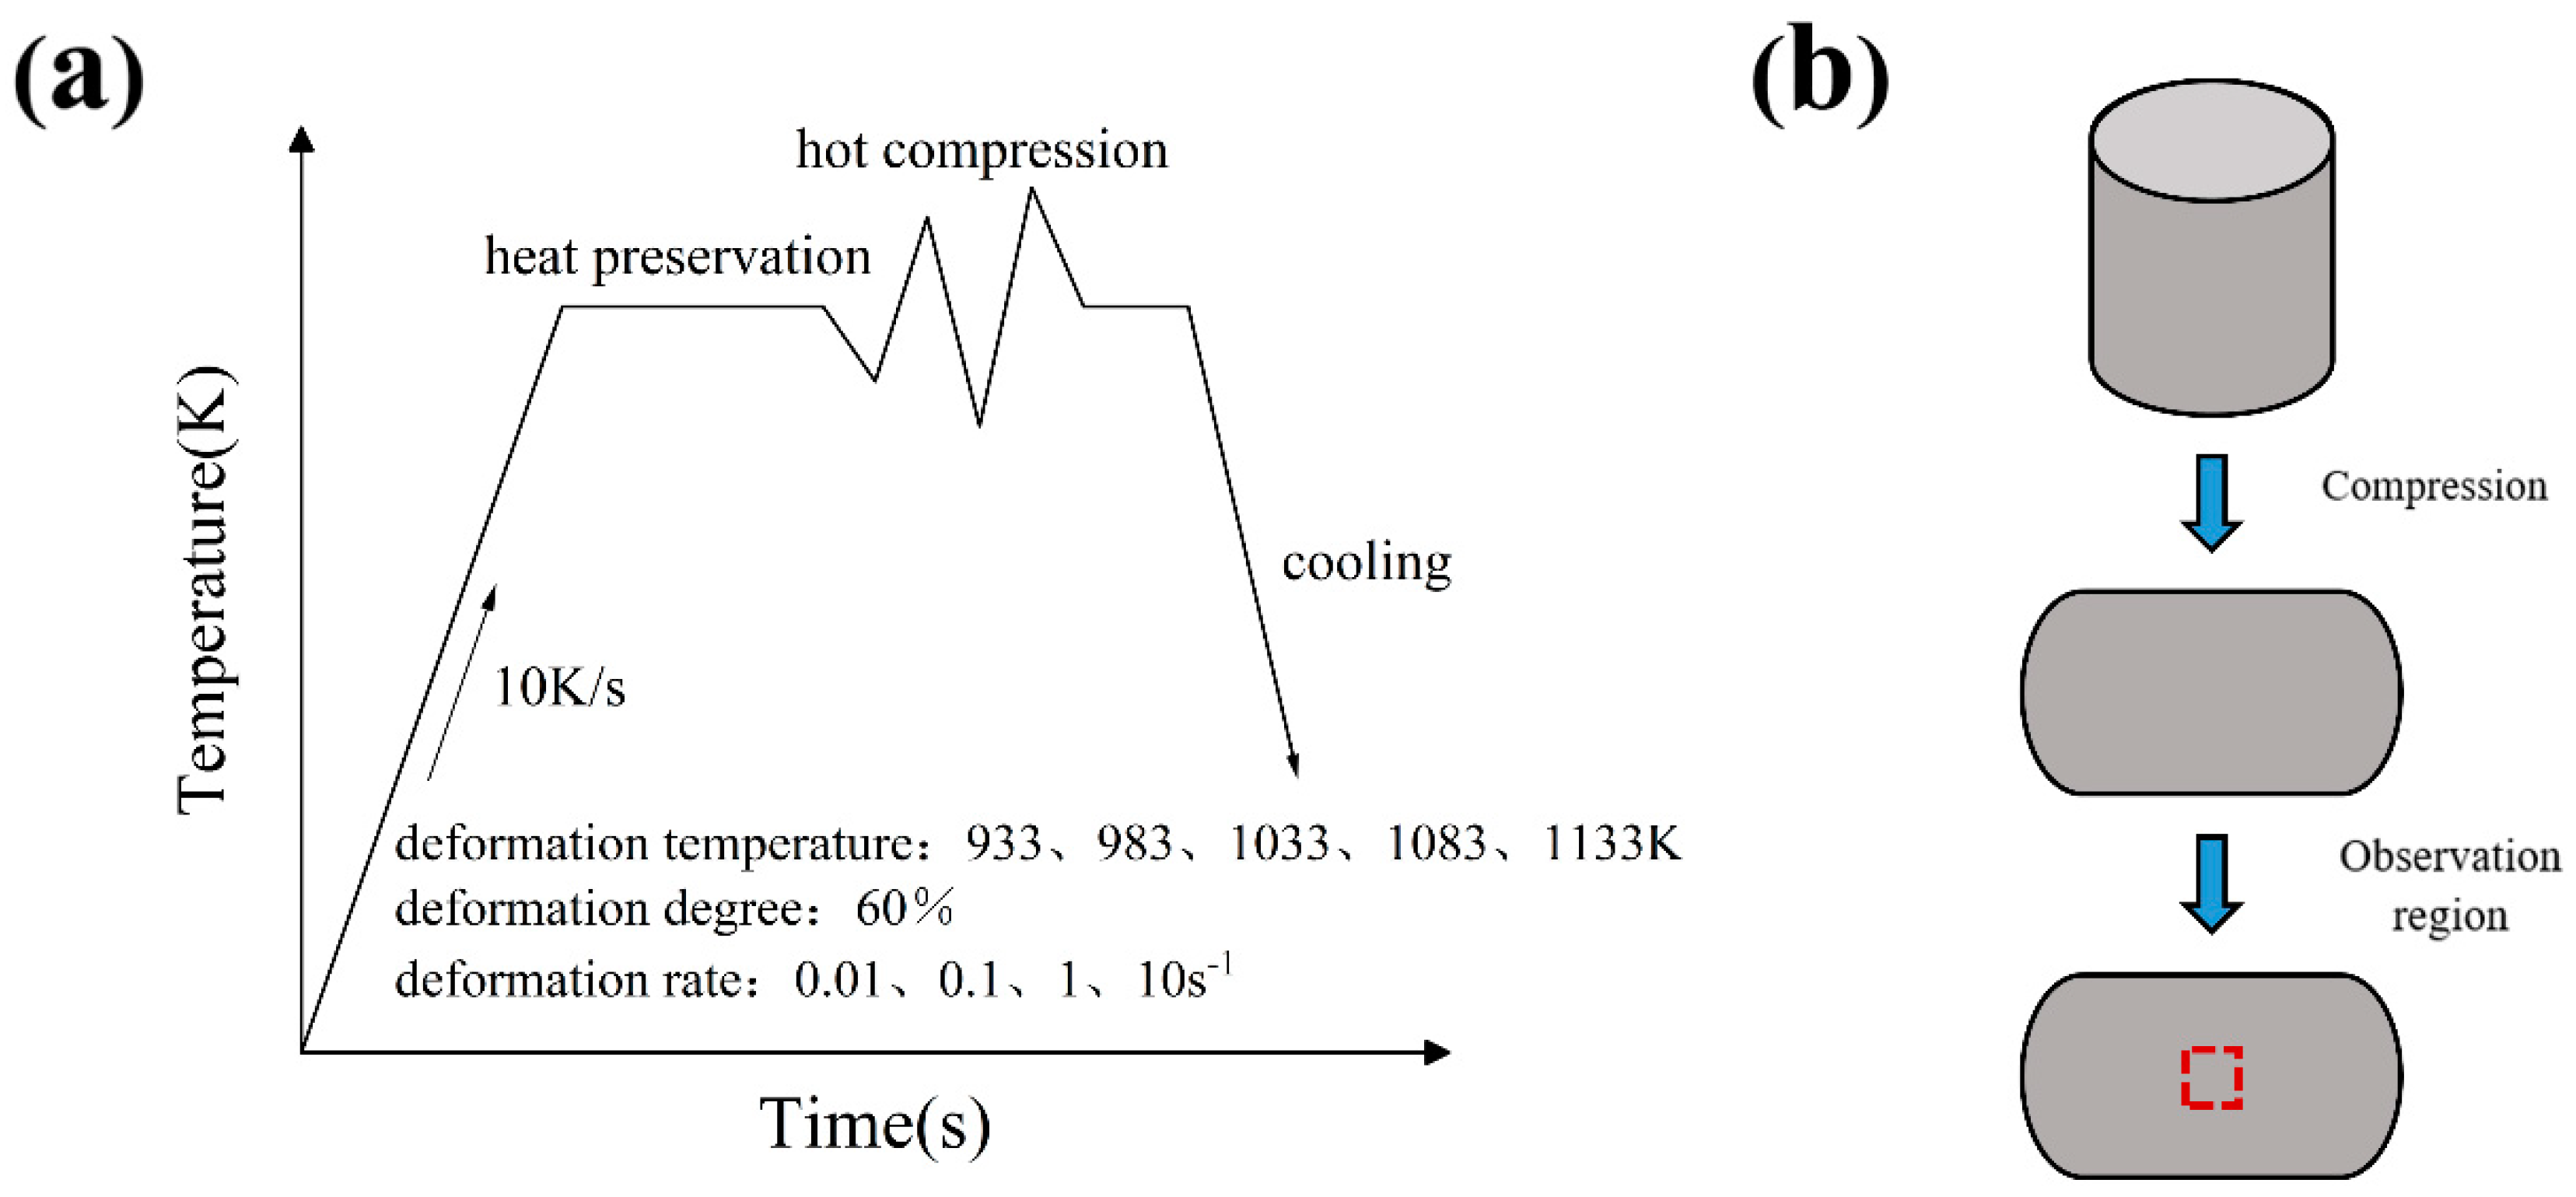
Hot compression tests were conducted using a Gleeble-3800 thermomechanical simulator (Dynamic Systems Inc., Poughkeepsie, NY, USA). The samples used in the experiments were TA4 alloy rods with dimensions of ϕ8.0 mm × 12.0 mm. The experimental procedure is shown in Figure 2a. The deformation temperatures of the samples were set at 933, 983, 1033, 1083, and 1133 K, with a deformation degree of 60%. The strain rates were 0.01, 0.1, 1, and 10 s−1. During the experiment, the samples were heated on the Gleeble-3800 simulation tester at a rate of 10 K/s to the specified compression deformation temperature and held at that temperature for 3 min to ensure uniform temperature distribution within the sample. The sample was then compressed to 60% strain at the specified constant strain rate, and water cooling was applied after the compression. At the end of the experiment, the Gleeble-3800 analog testing machine recorded the load and displacement during compression by means of a force transducer and a displacement transducer and generated a stress–strain curve.
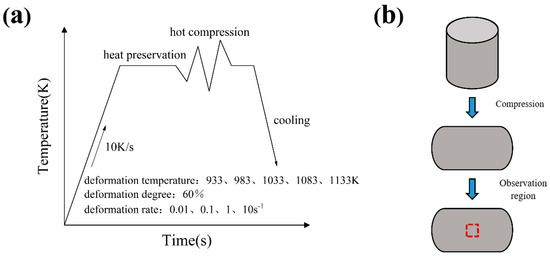
Figure 2.
Schematic diagram of thermal compression test of TA4 titanium alloy: (a) processing parameters; (b) compression diagram.
To minimize the influence of friction on the experiment, lubricant was applied to both ends of the sample in contact with the Gleeble-3800 simulator, and graphite sheets were attached. Additionally, the chamber was vacuumed and protected with gas before the experiment. To maintain uniform temperature during the entire hot compression process, a pair of S-type Pt/Rh thermocouples were spot-welded at the midpoint along the height of the sample. The force and displacement sensors in the simulator actively collected the load and displacement during deformation, and the internal program automatically converted these measurements into true stress–strain curves.
2.3. Microstructural Characterization
To examine the microstructure of the specimen after thermal deformation, the compressed specimen was cut along its axis. The central region of the cross-section, as shown in Figure 2b, was selected for observation. The cut specimens were ground with sandpaper and polished using silica abrasive and suspension. The specimens used for metallographic observation were etched with Kroll’s reagent and the prepared specimens were subsequently analyzed under a metallurgical light microscope (LM; Eclipse MA200, Nikon, Hong Kong, China) to observe the microstructure. To achieve the surface quality required for the EBSD examinations, the samples for EBSD research were electrolytically polished in a solution of 10% perchloric acid and 90% methanol, with a voltage of 20 V, a temperature of 30 °C, and a time of 30 s. The EBSD research was conducted using a Gemini SEM 500 field-emission scanning electron microscope equipped with EBSD Aztec Symmetry. The instrument operating voltage was 20 kV, the scanning step size was 0.15 μm. Finally, the subgrain boundary structure, grain morphology and local orientation were analyzed by Aztec Crystal software (version 6.1, Oxford Instruments, Abingdon, UK).
3. Results
3.1. Flow Stress Behavior
Stress–strain curves are fundamental in materials science and engineering, as they offer crucial insights into a material’s mechanical behavior under various loading conditions [18].
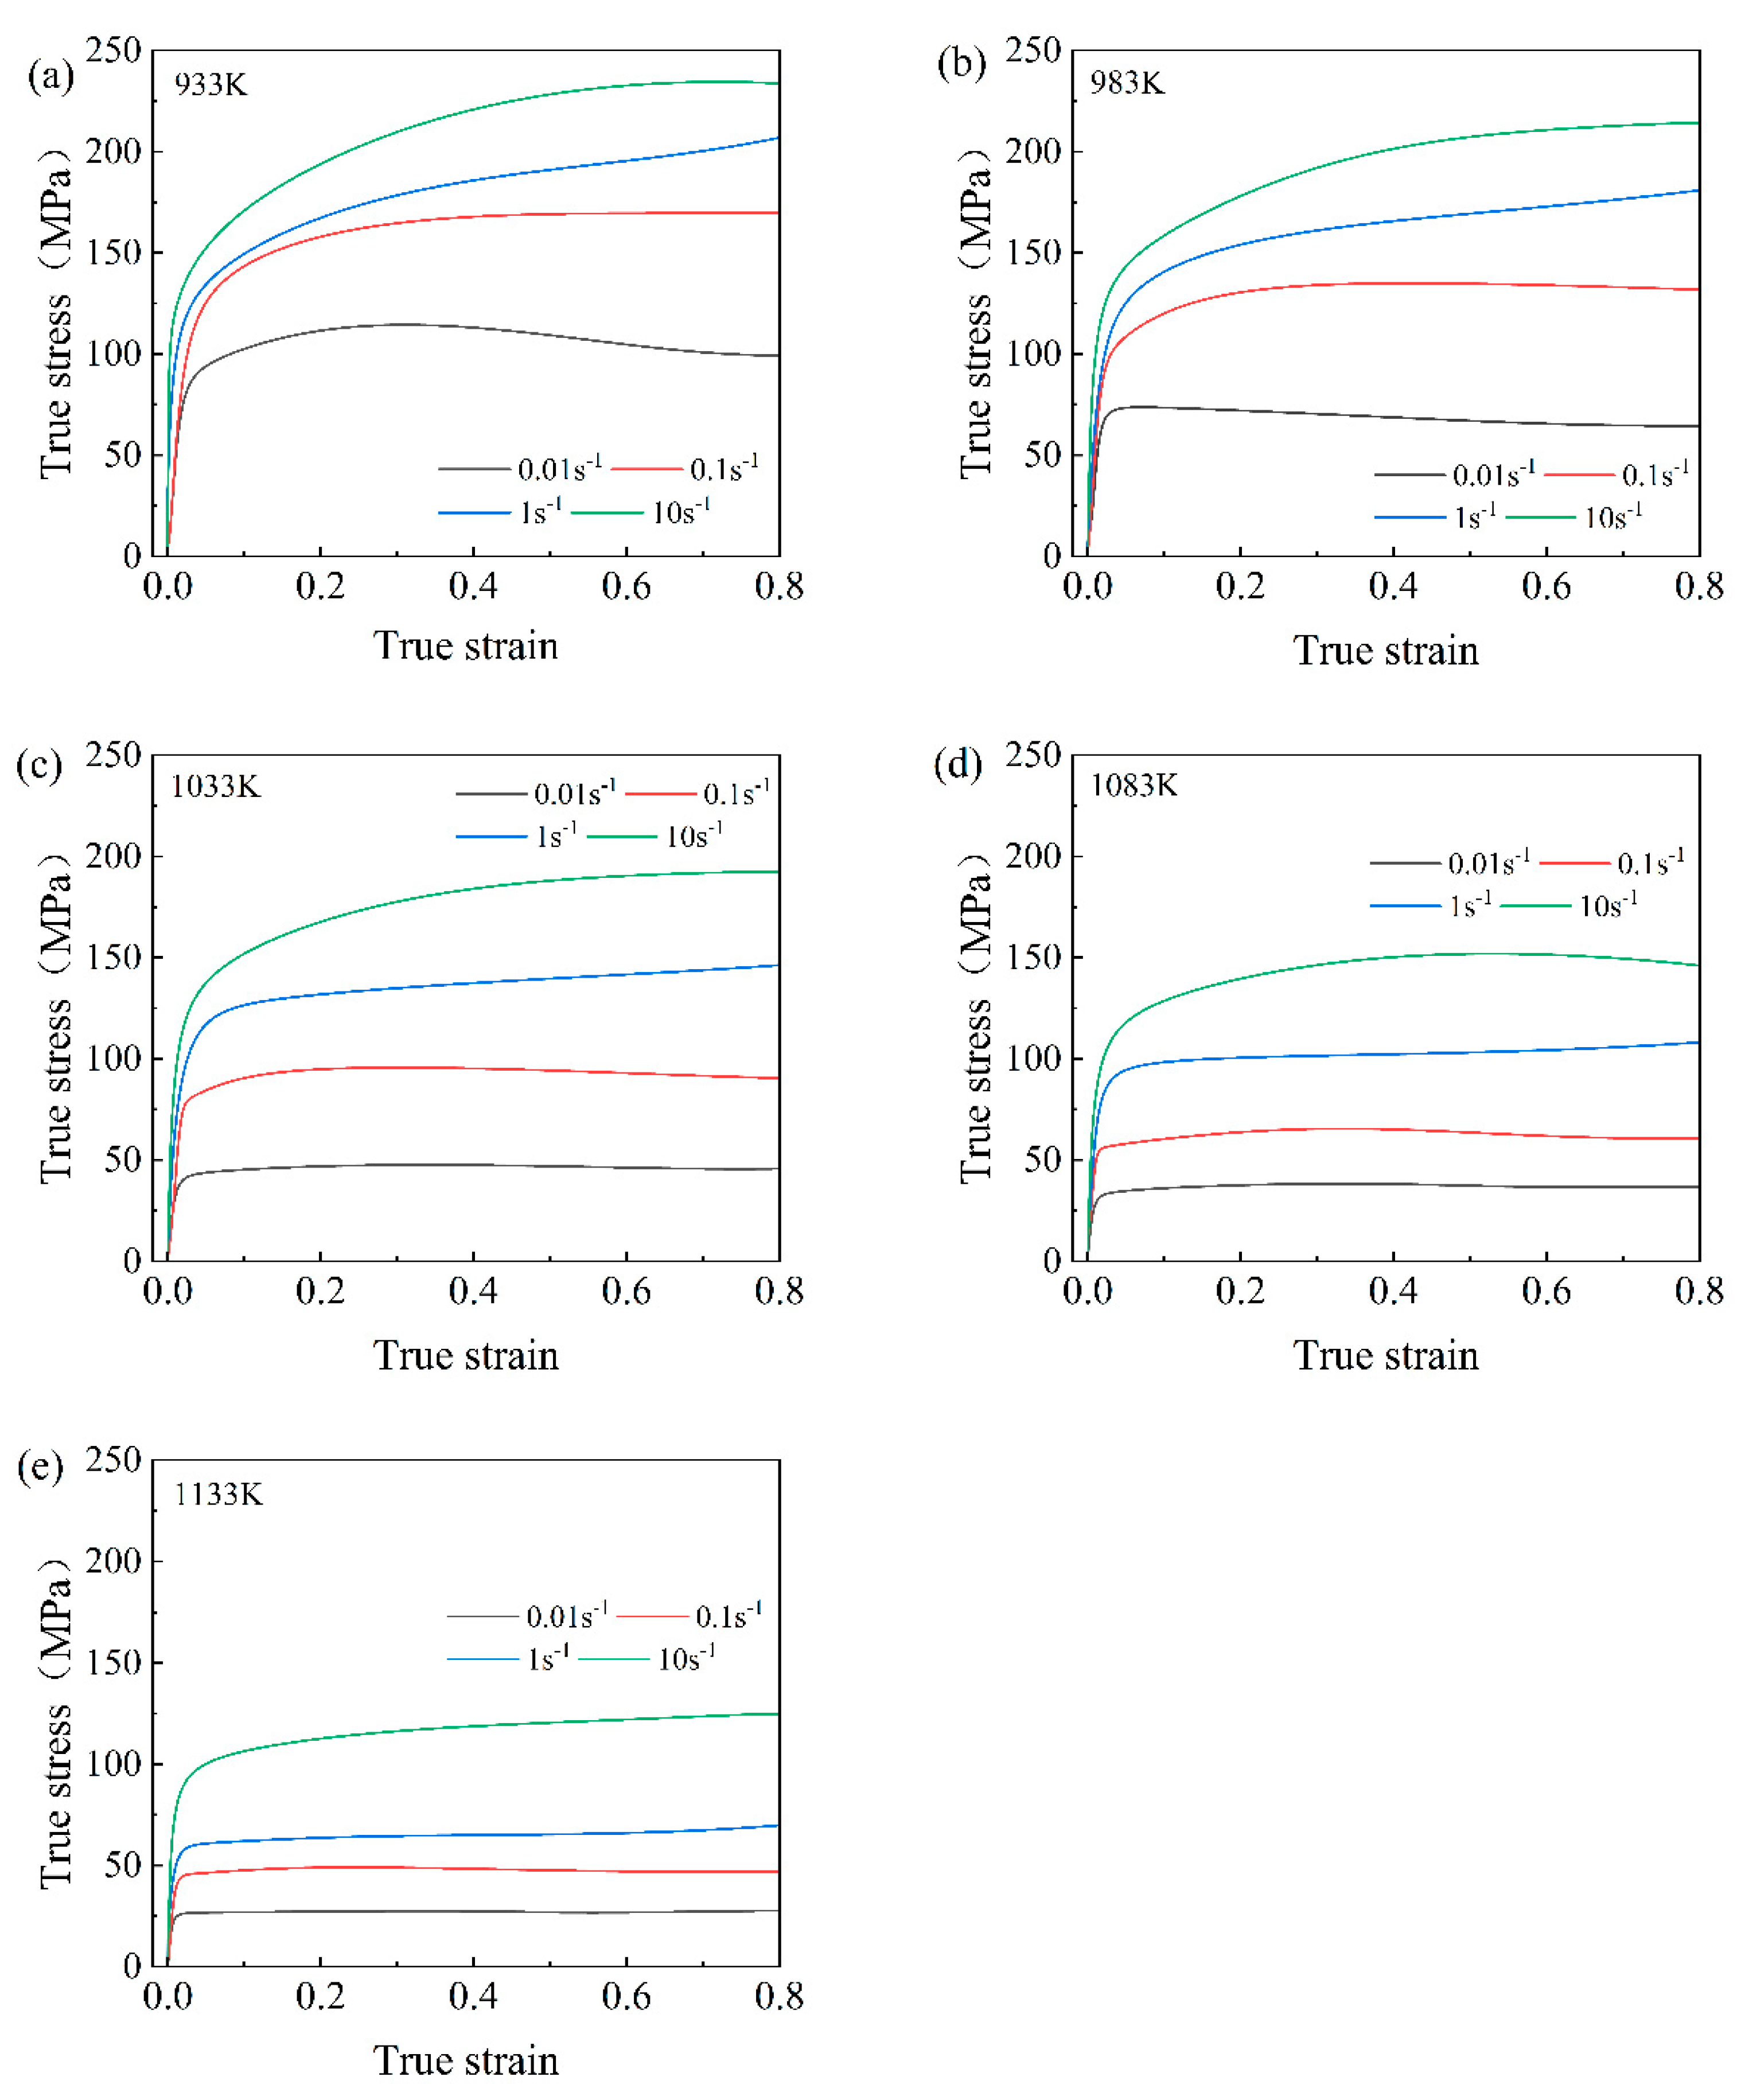
The hot deformation behavior of titanium alloys is commonly analyzed using true stress–strain curves. The true stress–strain curves of the TA4 titanium alloy under different deformation conditions are shown in Figure 3. From the figure, it can be observed that the flow stress of the TA4 titanium alloy generally increases rapidly at first and then stabilizes under different stress–strain curves. This is because, in the initial stage of compression, the alloy undergoes intense work hardening, leading to a rapid increase in flow stress, which is reflected in the continuous rapid increase in flow stress on the stress–strain curve. As compression time increases, softening mechanisms such as dynamic recovery and dynamic recrystallization begin to take effect. When a stable state is reached, these two effects counteract each other, resulting in the flow stress stabilizing [19,20,21].
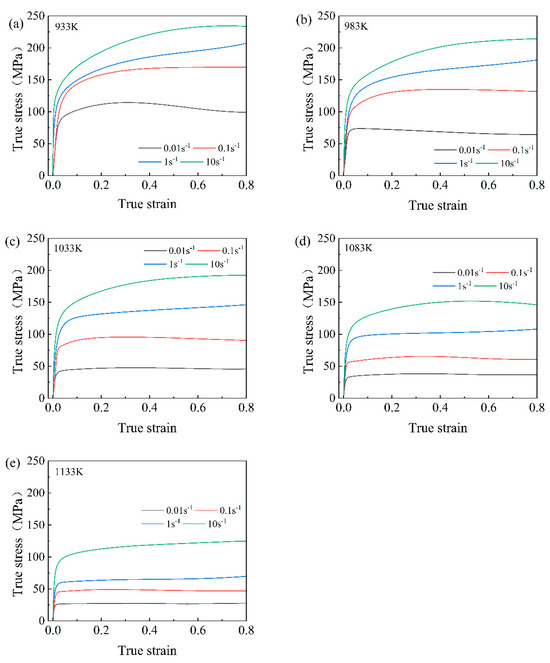
Figure 3.
When the strain rate is between 0.01 s−1 and 10 s−1, the true stress–strain curves of the TA4 alloy at different deformation temperatures are as follows: (a) 933 K; (b) 983 K; (c) 1033 K; (d) 1083 K; (e) 1133 K.
Figure 4 shows the peak stress values of the TA4 titanium alloy at different deformation parameters, in which it can be seen that the peak stress of the material decreases significantly with increasing deformation temperature and decreasing strain rate. From the analysis, it was found that firstly, the strain rate is proportional to the peak stress at the same deformation temperature. This is because the compression time of the material becomes shorter when the strain rate increases. When the deformation time of the material is not enough to allow the softening mechanisms such as dynamic restitution and dynamic recrystallization within the alloy to be fully activated, this is manifested by an increase in peak stress. Secondly, at lower temperatures (below 1033 K), the increase in peak stress with increase in strain rate is relatively modest, 113% versus 190%, respectively. This indicates that the change in strain rate at low temperatures has less effect on the heat distortion process of the TA4 titanium alloy. At higher temperatures (above 1033 K), the increase in peak stress rises to 304%, 296%, and 340%. This indicates that the thermal deformation process of the material becomes more sensitive to the strain rate with increasing temperatures. This is due to the fact that the higher the deformation temperature of the alloy, the higher the dislocation activity of the alloy, resulting in a higher deformation storage energy. At the same time, the nucleation and growth of dynamically recrystallized grains are more rapid with increasing temperature, leading to an increase in the softening mechanism of the alloy and a consequent decrease in its resistance to deformation.
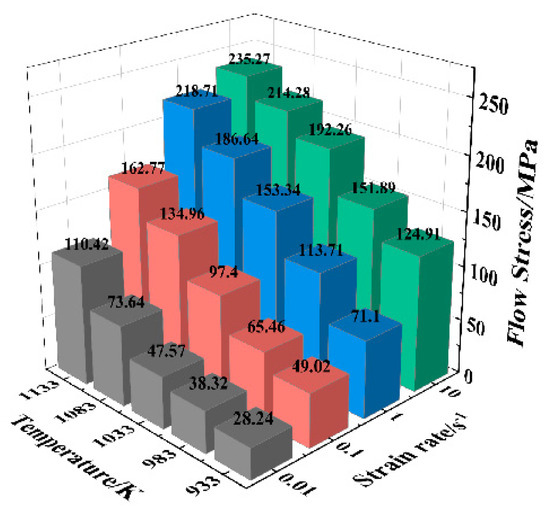
Figure 4.
Peak stresses of alloys in different deformation conditions.
3.2. Derivation of the Constitutive Equation
To study the relationship between stress, strain, and temperature during the deformation of metallic materials, a constitutive equation must be developed for the material. The Arrhenius model is commonly used to construct the constitutive equation for the hot deformation behavior of titanium alloys. This hyperbolic sine constitutive model is not only widely applicable but also offers high predictive accuracy. Considering these factors, this model was selected to construct the constitutive equation for the TA4 alloy at a strain of 0.5. The mathematical expression of this equation consists of three equations, as shown in Equation (1) [22,23]:
In Equation (1), is the strain rate; σ can represent the peak stress, steady state variable rheological stress, or the rheological stress of the specified strain; are temperature-independent stress indices; , , , and are material constants that are also temperature-independent; Q is the apparent activation energy of thermal deformation at different temperatures; T is the thermodynamic temperature at absolute temperature; R is the gas constant in the ideal state; α is a parameter characterizing the pressure level, and the relationship with other parameters is .
It has been shown that the third equation is usually used to construct the constitutive equations for different stress conditions. The hyperbolic sine form was proposed by Sellars and Tegart, which can express the constitutive equations more accurately under different stress conditions. It is well adapted for use and widely used, and is expressed as follows:
The Zener–Hollomon parameter Z [24], which expresses the relationship between the strain rate and the absolute temperature T, was used as follows:
According to Equations (2) and (3):
Equation (4), where Z is the temperature-compensated strain rate factor. The meanings of the other letters have been pointed out above.
According to the definition of hyperbolic sine function, the following is true:
According to Equations (3)–(5), the following can be obtained:
The natural logarithm can be obtained by solving for each side of Equation (1):
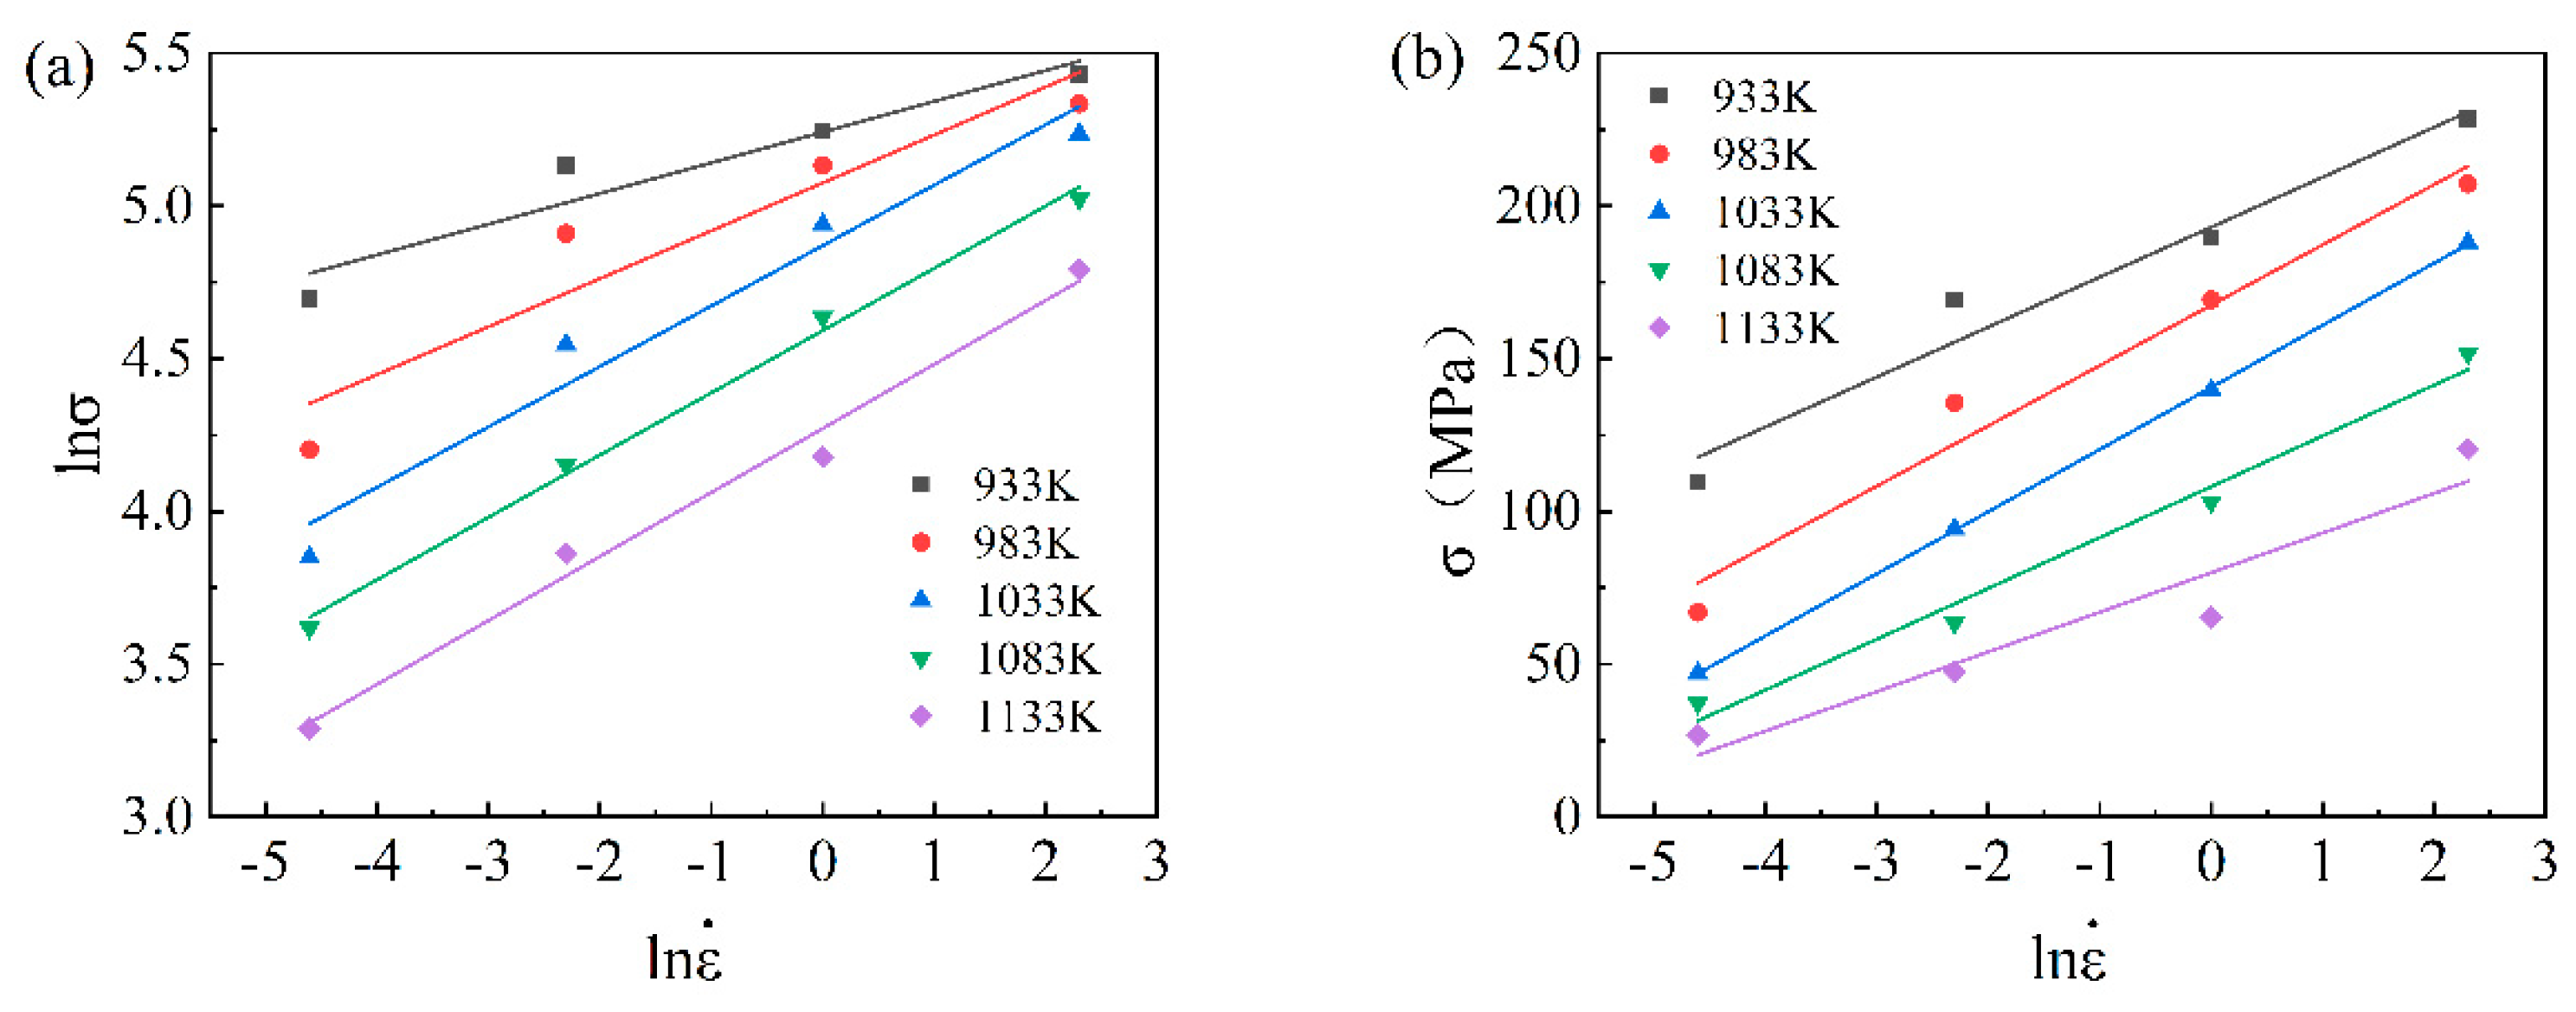
The steady-state stress and strain rates during deformation were taken, and according to Equations (7) and (8), the least-squares method was adopted for the linear regression process, and the relationship between and was plotted with the help of Origin data analysis software (Version 2023b, OriginLab Corporation, USA), and the results are shown in Figure 5 [25]. The fitting results show that the linear correlation coefficients of curves at 933 to 1133 K and curves at 933 to 1133 K are all greater than 0.99, indicating a good fitting reliability.
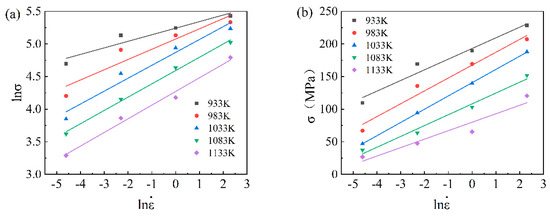
Figure 5.
The relationship between rheological stress and strain rate of TA4 alloy: (a) − ; (b) − .
Taking the average value of the inverse of the slope of the fitted straight line in Figure 5a for 933 to 1133 K as , there is = 4.9046; taking the average value of the inverse of the slope of the fitted straight line in Figure 5b for 933 to 1133 K as , there is = 0.0492 MPa−1; and according to the definition of α, we can obtain .
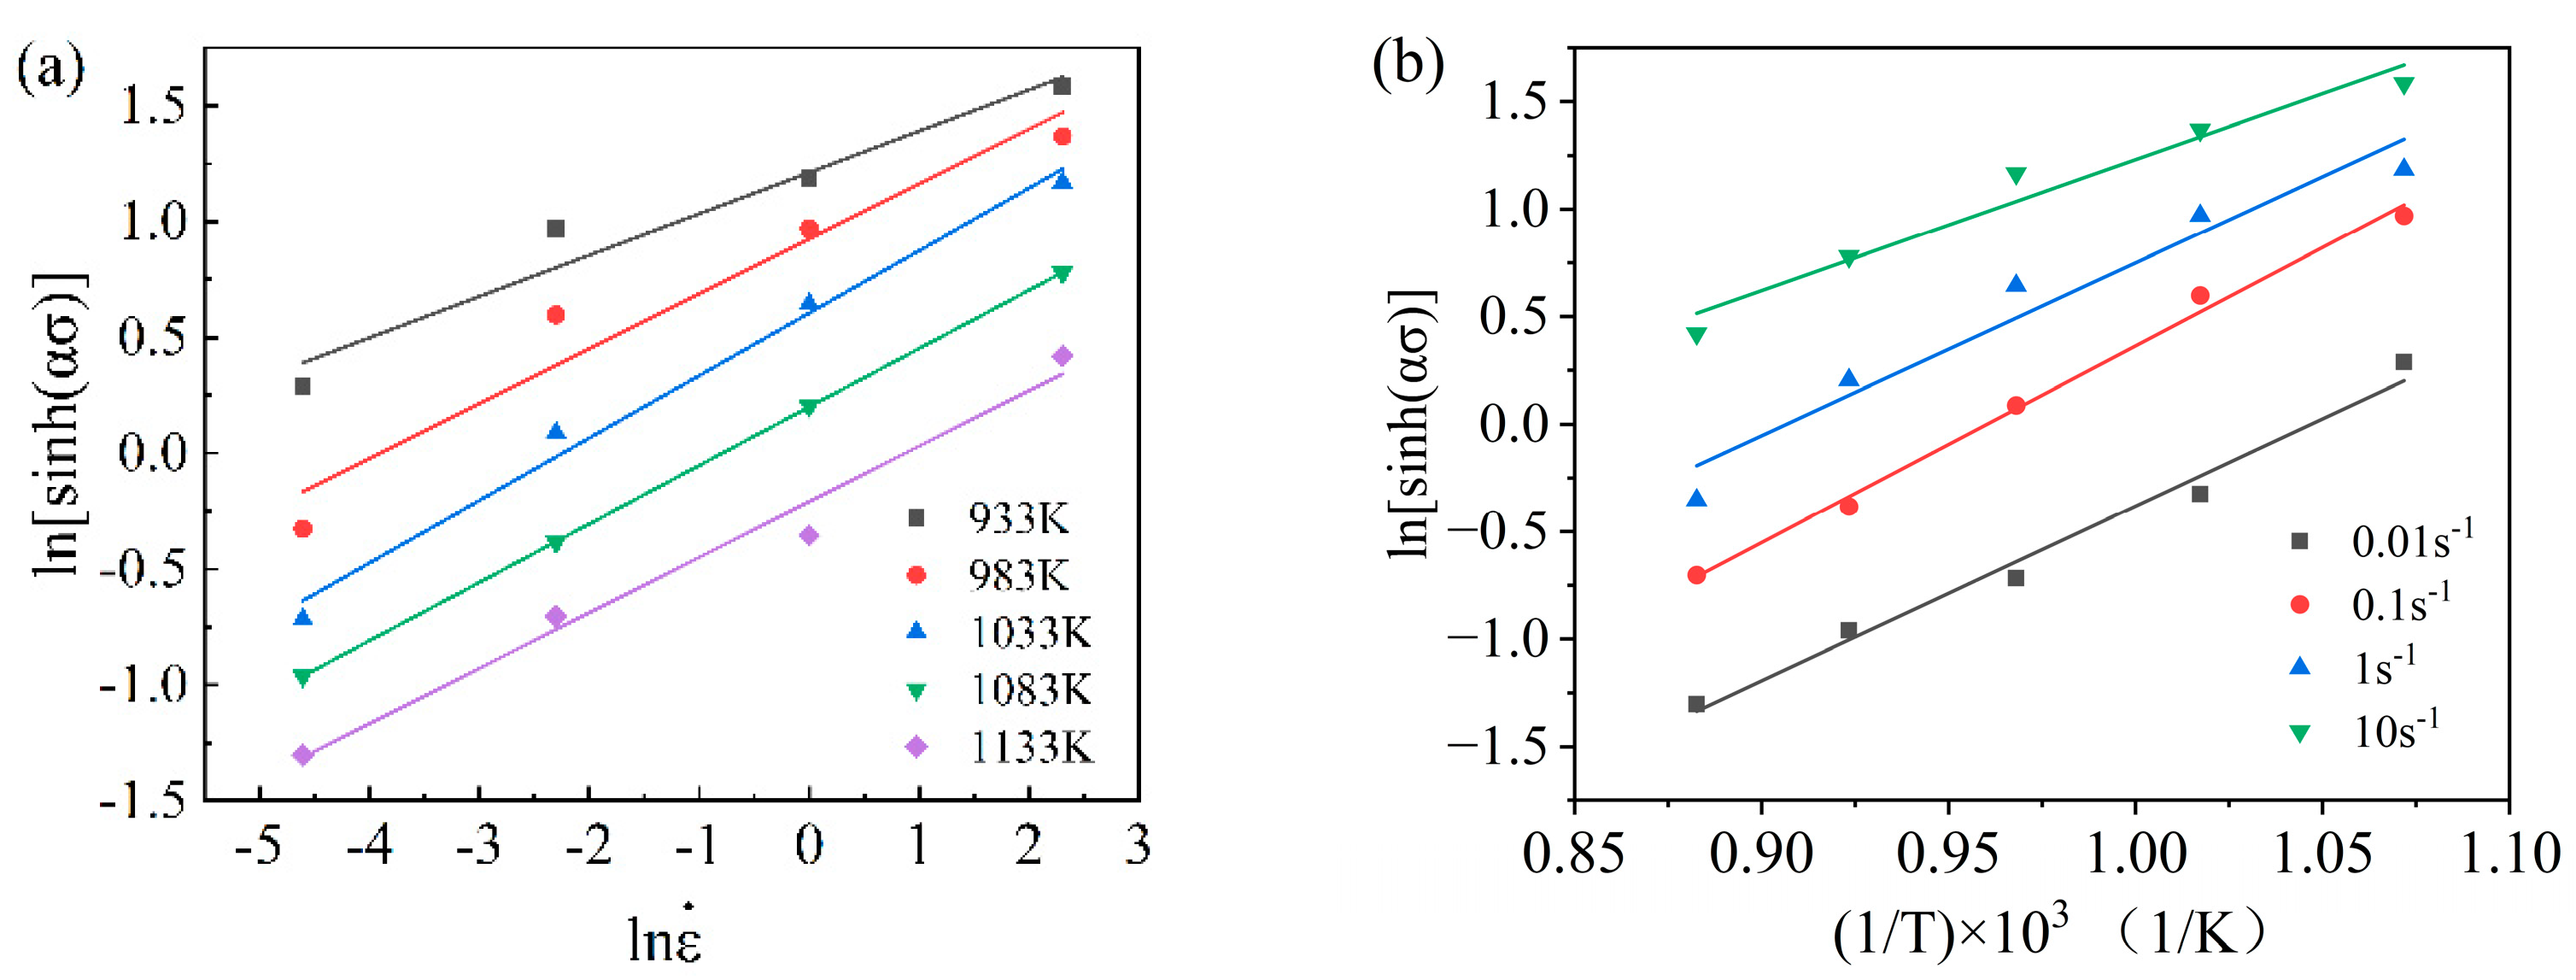
The strain stress and strain rates at different deformation temperatures were substituted according to Equation (9), the linear regression was fitted by the least-squares method, and the relationship was plotted with the help of Origin data analysis software, as shown in Figure 6. The fitting results show that the linear correlation coefficients of the curves at 933 to 1133 K are all greater than 0.99, indicating that the double logarithmic relationship between the hot deformation rheological stresses and the strain rate satisfies the linear relationship better. The results show that the relationship between the rheological stress and strain rates of the TA4 alloy at a constant deformation temperature can be described by a hyperbolic sine relationship.
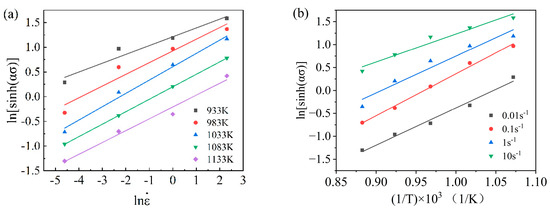
Figure 6.
(a) − fit curve; (b) − fit curve.
A certain temperature range, assuming constant Q at the same strain rate, is obtained according to Equation (9):
The strain rate , the stress σ, and the calculated α value were brought into Equation (10), while the least squares method was taken for the linear regression treatment to plot the relationship, as shown in Figure 6. The fitting results show that the linear correlation coefficients of the curves are greater than 0.99 at all strain rates, indicating that the relationship between the rheological stress and the temperature of the TA4 alloy at a high temperature and constant strain rate can be described by the hyperbolic sine relationship.
Taking the natural logarithm of the derivative on both sides of the third equation of Equation (1), the hot deformation activation energy equation can be obtained as follows:
According to the previous calculations, the three terms on the right side of Equation (11) are the gas constant in the ideal state, the inverse of the slope of the curve at a certain temperature, and the slope of the curve at a certain strain rate, and the values of the latter two are 3.9634 and 9.1436, respectively. Substituting into Equation (11) yields the value of the deformation activation energy Q as 301 KJ/mol.
Taking the logarithm of both sides of Equation (4), the following can be obtained:
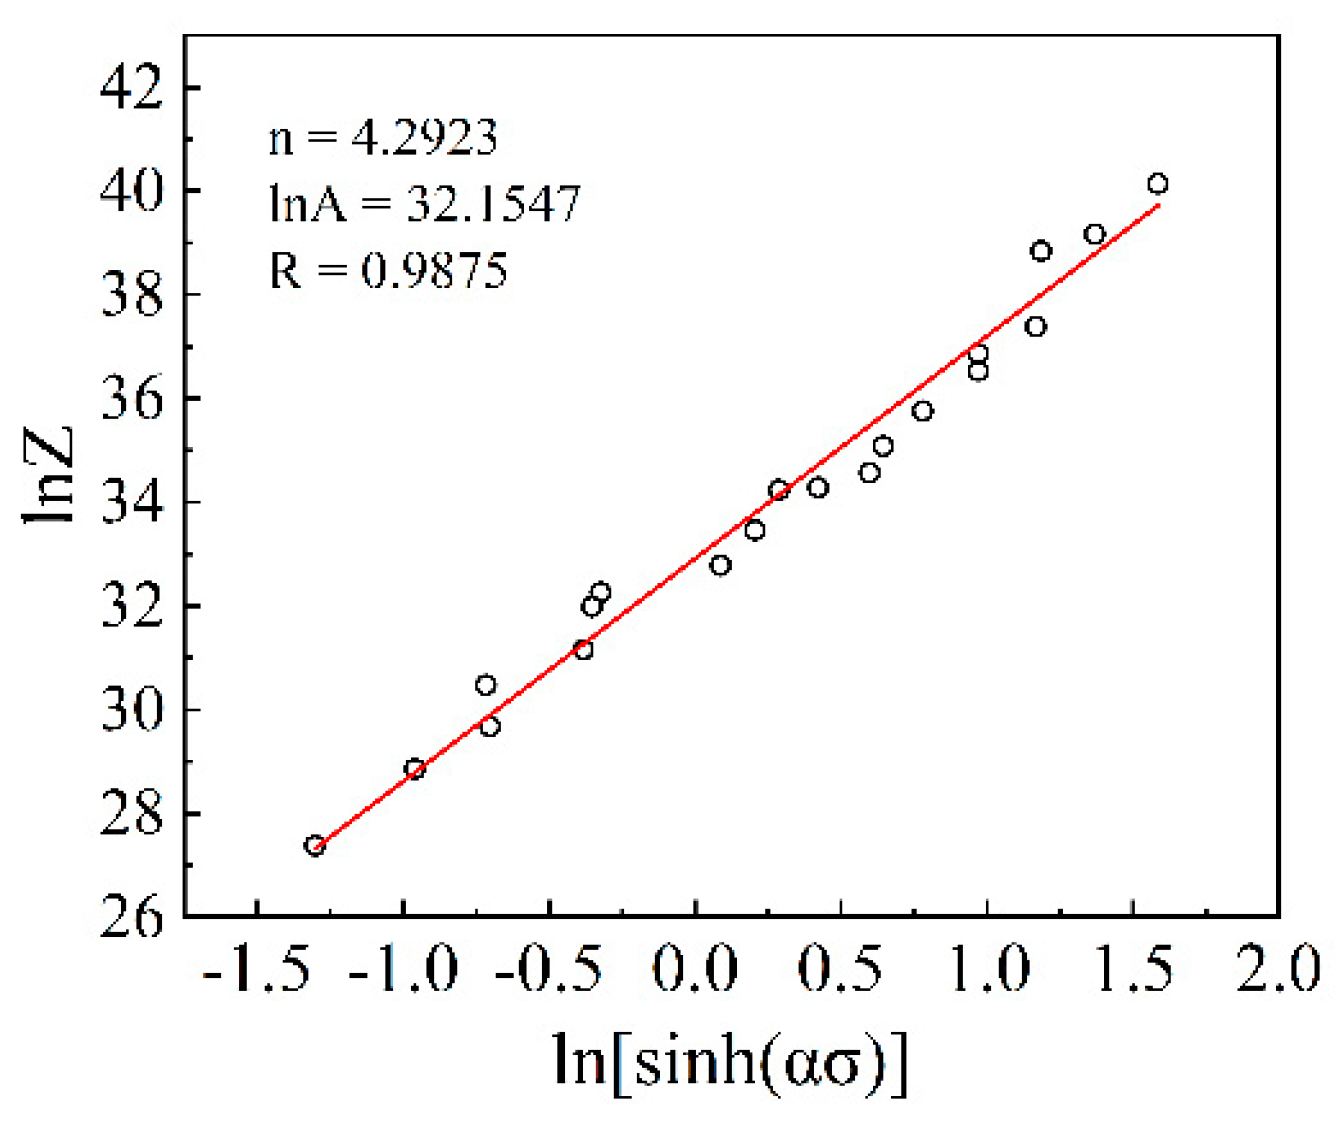
The obtained average deformation activation energy Q value, strain rate, and deformation temperature were substituted into Equation (12), and the plot of the relationship plotted by linear regression using the least squares method is shown in Figure 7. Since the linear correlation coefficient between the variables of the relationship plot is greater than 0.98, the stress index n can be expressed by the slope of this fitted curve, and lnA can be expressed by the intercept. The data processing can obtain and .
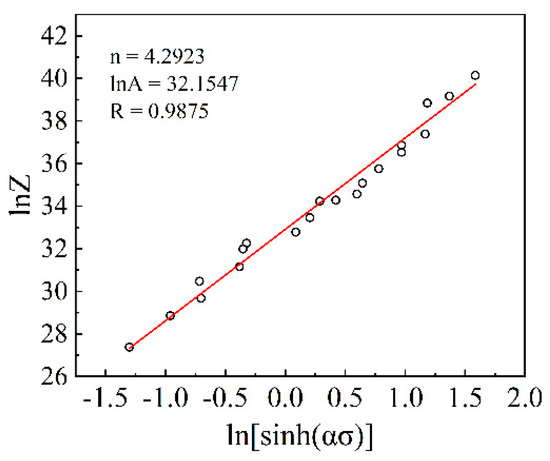
Figure 7.
Relationship diagram of − TA4 alloy.
Combined with the above calculation results, all the material parameters for constructing the constitutive equation of the TA4 alloy have been found, which are as follows: stress level factor , activation energy of deformation , stress exponent , and structure factor , respectively. Substituting the above parameters into Equation (2), the eigenstructural equation for a strain of 0.5 temperature range of 933–1133 K can be found as follows:
Similarly, the parameter data of Arrhenius model for different strain ranges and different deformation conditions can be calculated by the above method, as shown in Table 2.
Table 2.
Arrhenius model parameter.
However, Bani [26] argued that the important effect of strain on this process should be taken into account when analyzing the high temperature deformation of titanium alloys. The results showed that strain has a significant effect on the deformation activation energy and material constants (α, Q, n and lnA). Therefore, in order to investigate the intrinsic modeling of titanium alloys under different strains, the relationship of strain on deformation activation energy and material constants is constructed as a polynomial function as shown in Equation (14). The effect of strain on the constitutive equation is reflected by the application of the polynomial function in the constitutive equation.
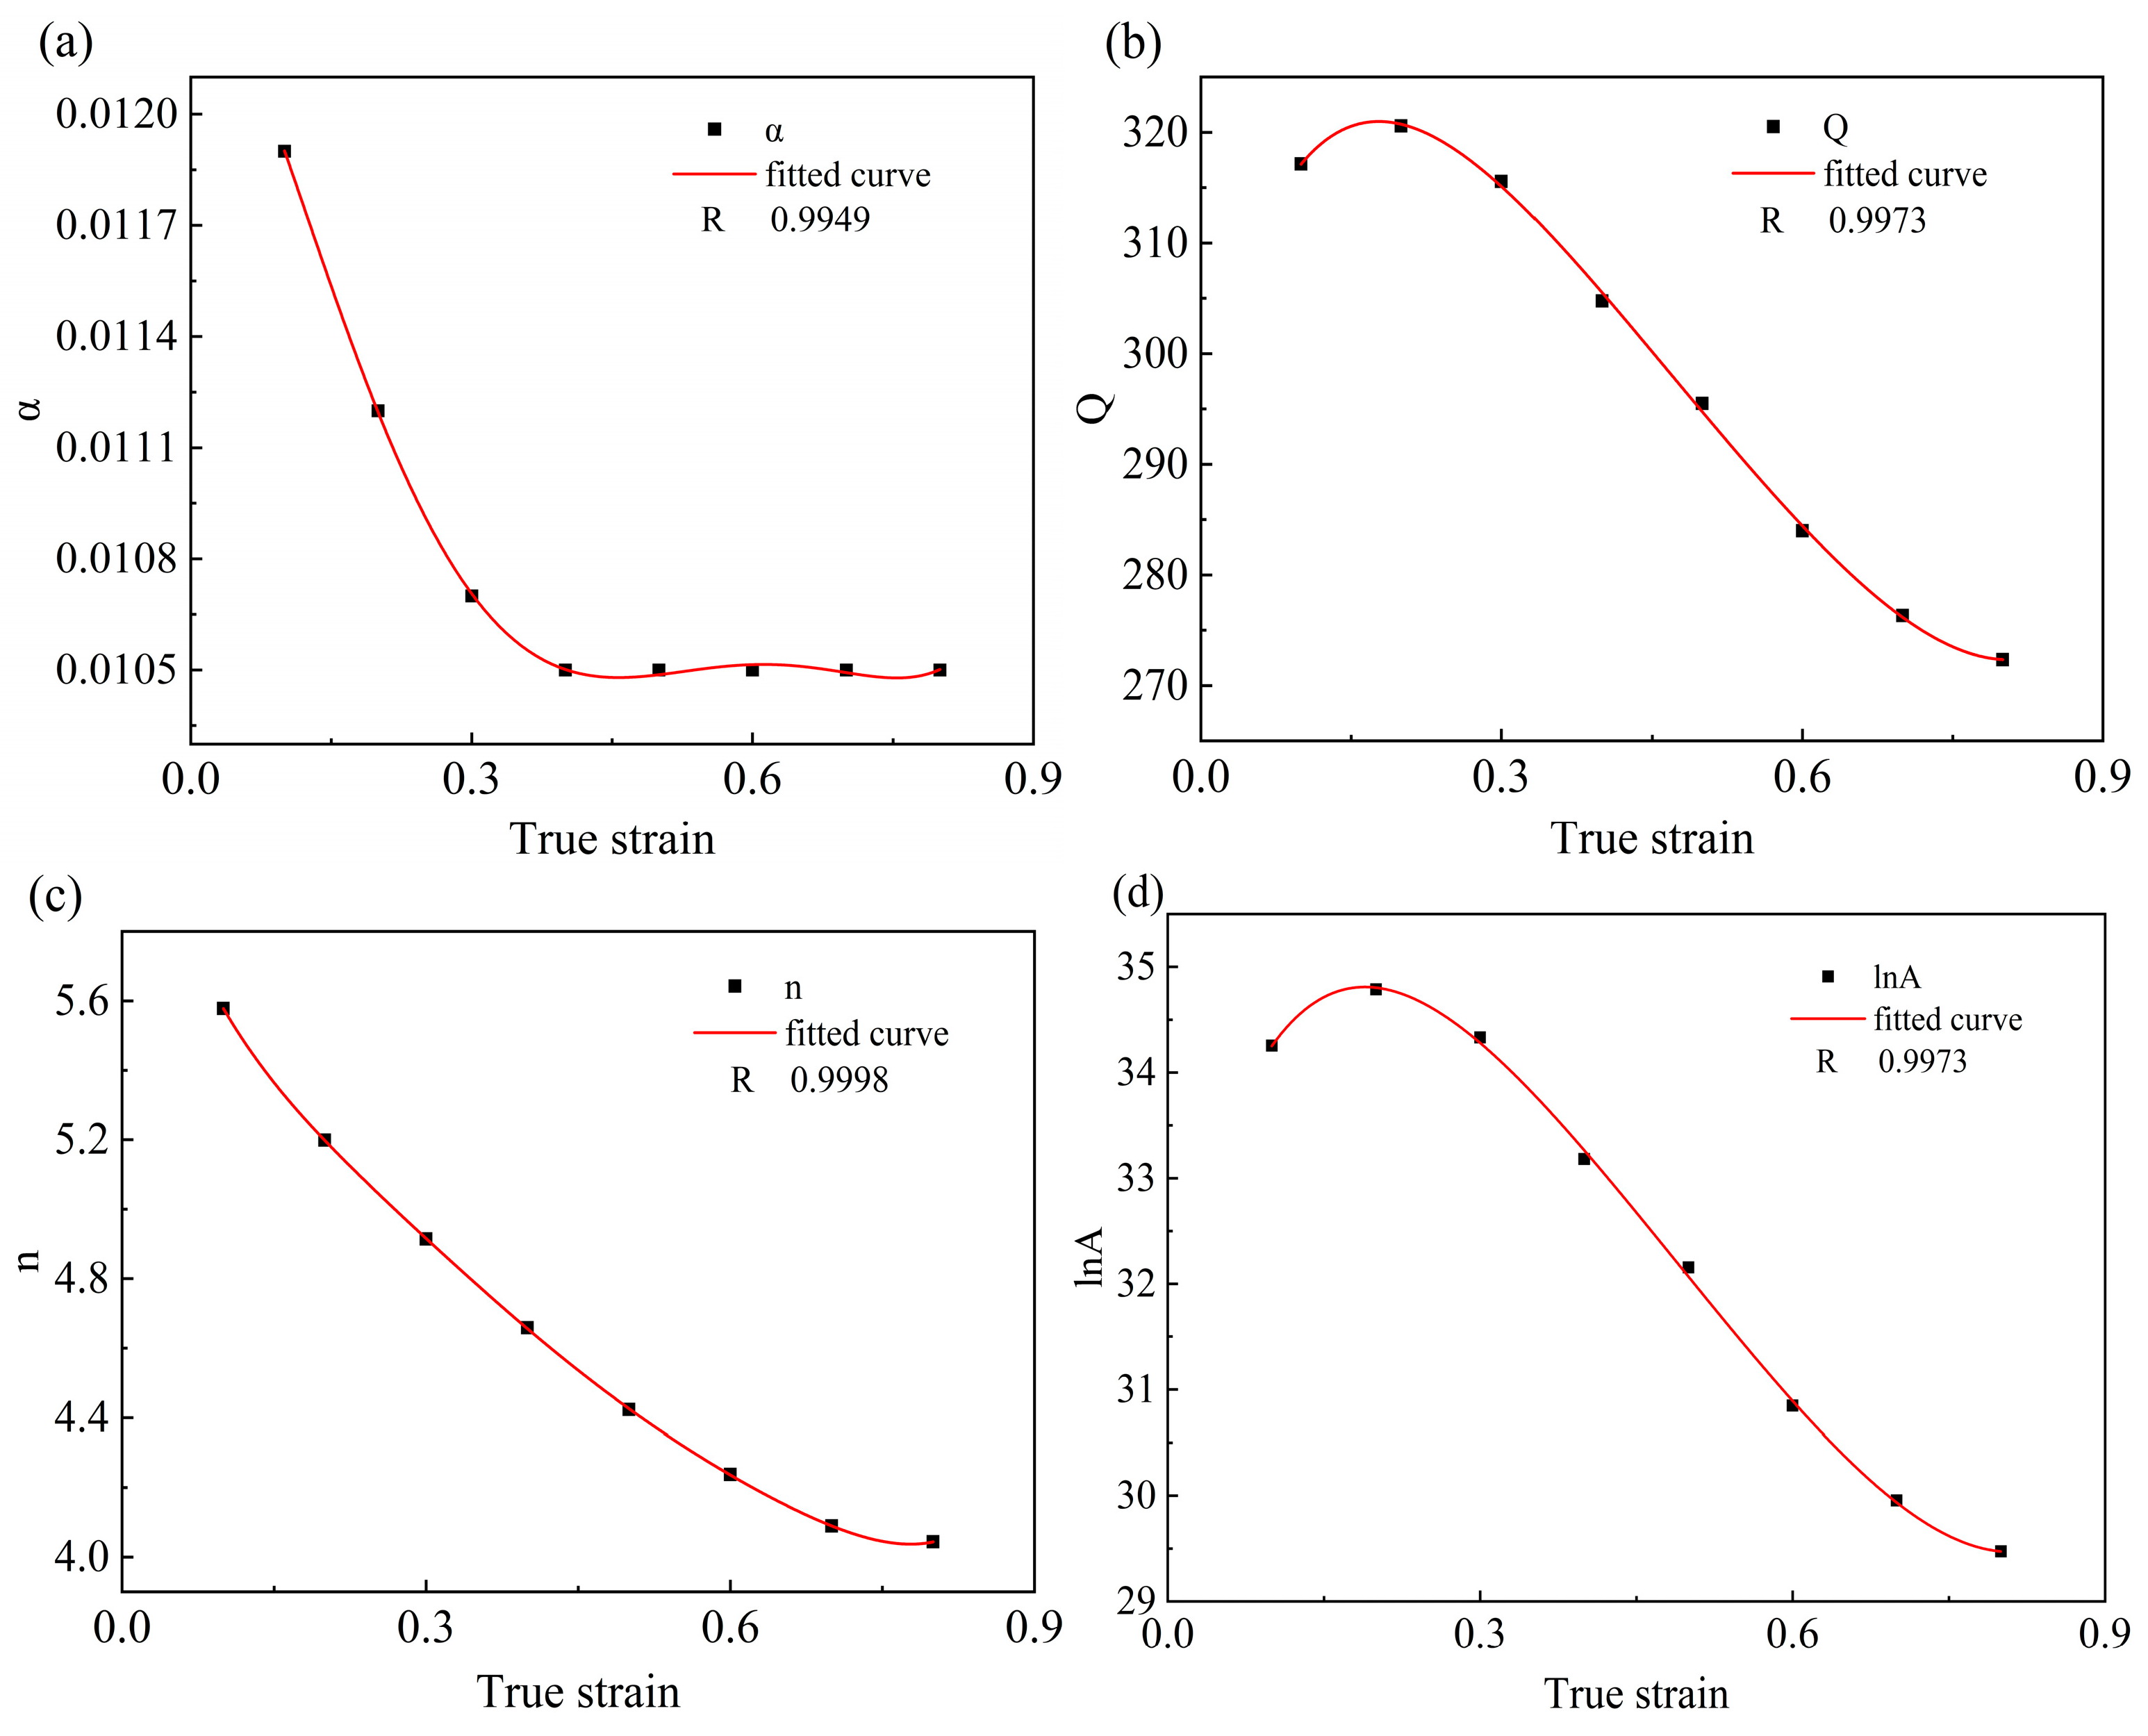
According to Equation (14), the correlations of , and are plotted, and the fitted curves are shown in Figure 8. From the figure, it can be found that the correlation coefficients of each fitted curve of strain versus material constants are greater than 0.99, which has a good reliability. It indicates that this polynomial function can be used to describe the strain-to-material constant relationship during high-temperature deformation of titanium alloys.
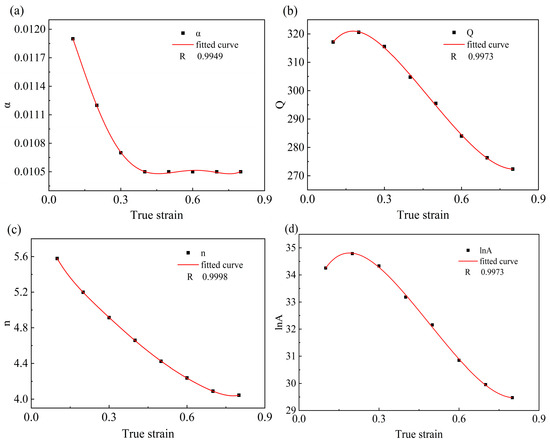
Figure 8.
Fitting the variation curve with (a) α, (b) Q, (c) n, and (d) ln A polynomials.
The data obtained from the experiments were substituted into Equation (14) and the equations were fitted using a nonlinear fitting algorithm to calculate the model material constants, the results of which are shown in Table 3.
Table 3.
Polynomial coefficient results for α, Q, n, ln A.
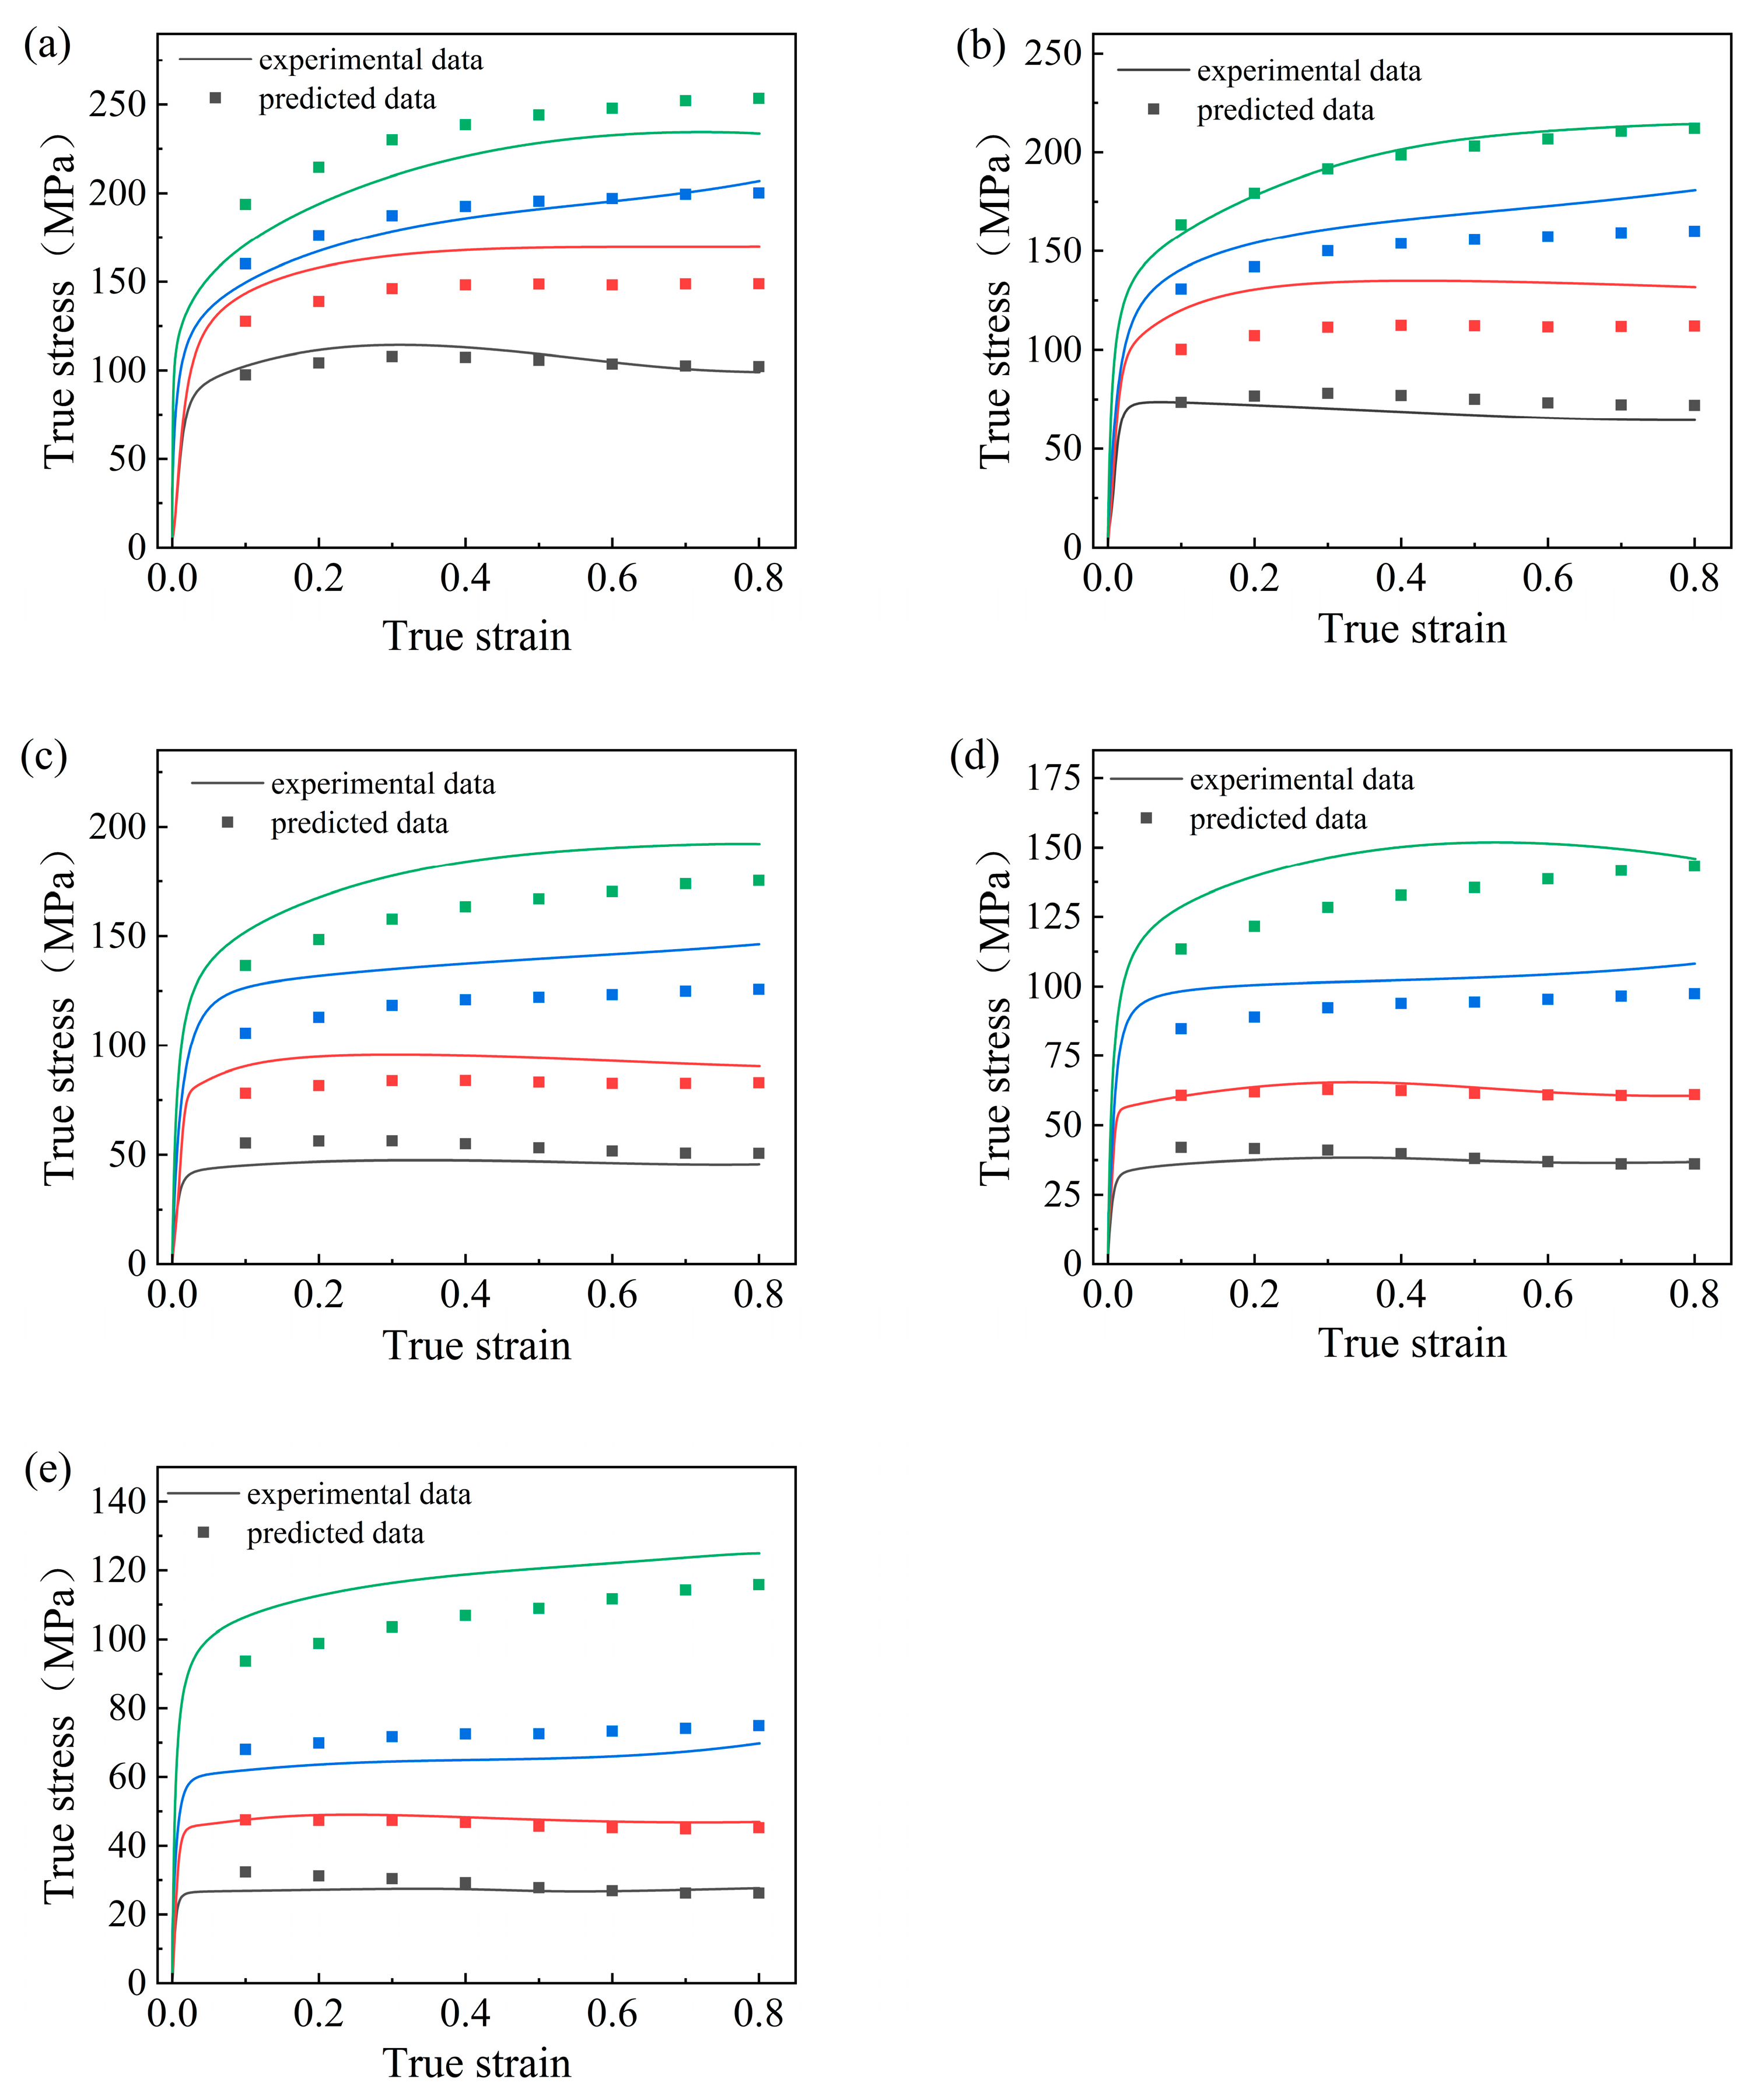
As a result, the Arrhenius model for strain compensation can be obtained, and the comparison between the predicted and experimental values of this model is shown in Figure 9.
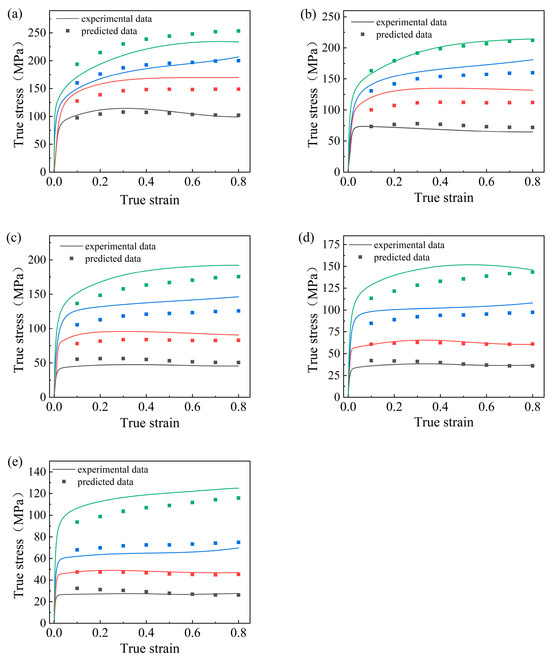
Figure 9.
Comparison between experimental stress values and predicted stress values: (a) 933 K; (b) 983 K; (c) 1033 K; (d) 1083 K; (e) 1133 K.
3.3. Evaluation of the Ontological Model
In order to be able to accurately evaluate the reliability of the predicted results of these constitutive equations, it is necessary to analyze the error between the experimental values and the predicted values of the constitutive equations. Here, the correlation coefficient (R), mean absolute percentage error (MAPE), and mean root mean square error (RMSE) are introduced to analyze the error numerically with the following expressions [27,28]:
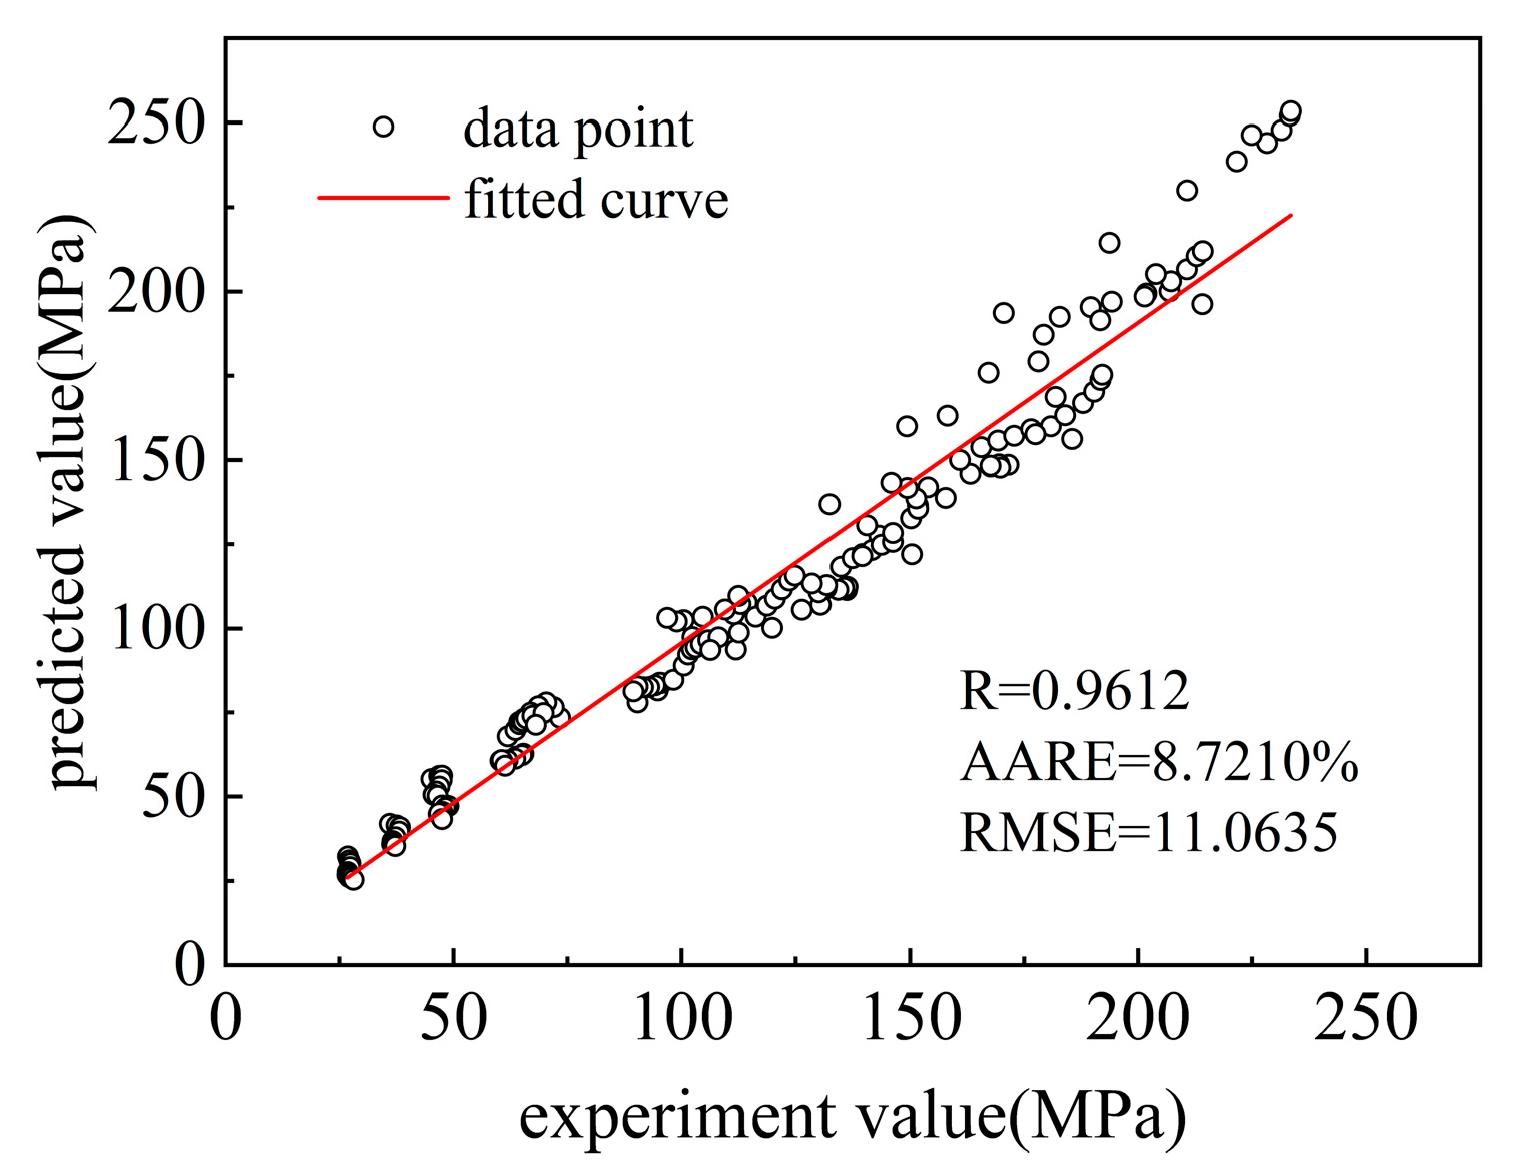
In the above equation, is the experimental stress value; is the predicted stress value; is the average of experimental and predicted values; N is the total amount of data. In general, the strength of the linear correlation between the model predicted data and the experimental measured data can be characterized by the correlation coefficient (R). However, for this intrinsic model, it is not always valid to rely solely on the correlation coefficient to characterize the correlation between the model data and the experimental data. Therefore, the MAPE and the RMSE need to be calculated here to accurately characterize the accuracy of the constitutive equations with unbiased statistical parameters. In order to explore the generalization ability of the proposed model, the corresponding MAPE and RMSE values were calculated and the linear relationship between the experimental values of the flow stresses and the predicted values of the model were plotted as shown in Figure 10.
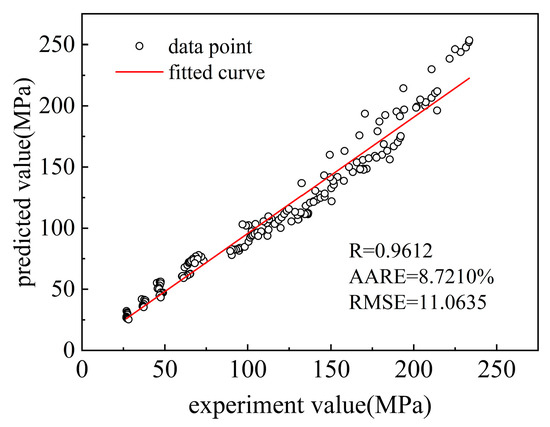
Figure 10.
The correlation between experimental and predicted values.
From the figure, it can be seen that the MAPE and RMSE values of the model are 8.7210% and 11.0635 MPa, respectively. The data values at the whole temperature are around the optimal regression line, which can indicate that the intrinsic model has a high accuracy. This indicates that the developed TA4 Arrhenius eigen structural equation has good accuracy and its correlation is high enough to be used in the calculation of deformation resistance for the actual rolling process [29].
3.4. Creation and Analysis of Thermal Processing Diagrams
In actual production, selecting the appropriate thermal processing parameters for the TA4 alloy requires not only constructing the constitutive equations but also establishing the corresponding thermal processing diagram to visualize the material’s processing and forming properties. The hot working diagram can delineate the safety zone and rheological instability zone of plastic processing, which can provide guidance for the selection of hot working process parameters and the control of microstructure and properties of metal materials.
Based on Prasad’s [30] instability criterion and its dynamic material model, the external energy P is mainly consumed in the dissipation G required for plastic deformation and the co-dissipation J required for microstructure evolution, which is given by Equation (18) as follows:
m is the strain rate sensitivity factor with the following Equation (19); η is the power dissipation factor of the processed material with the following Equation (20):
When the material presents an ideal linear dissipative state, the value of the strain rate sensitivity index m is 1, at which time the dissipation coefficient J reaches its maximum value , expressed as follows:
Therefore, the energy dissipation rate η can be expressed as follows:
In the above equation, m is the strain rate sensitivity index; η is the energy dissipation rate.
ξ is the destabilization parameter; when the destabilization parameter is less than 0, to judge the occurrence of rheological destabilization, Equation (21) is as follows:
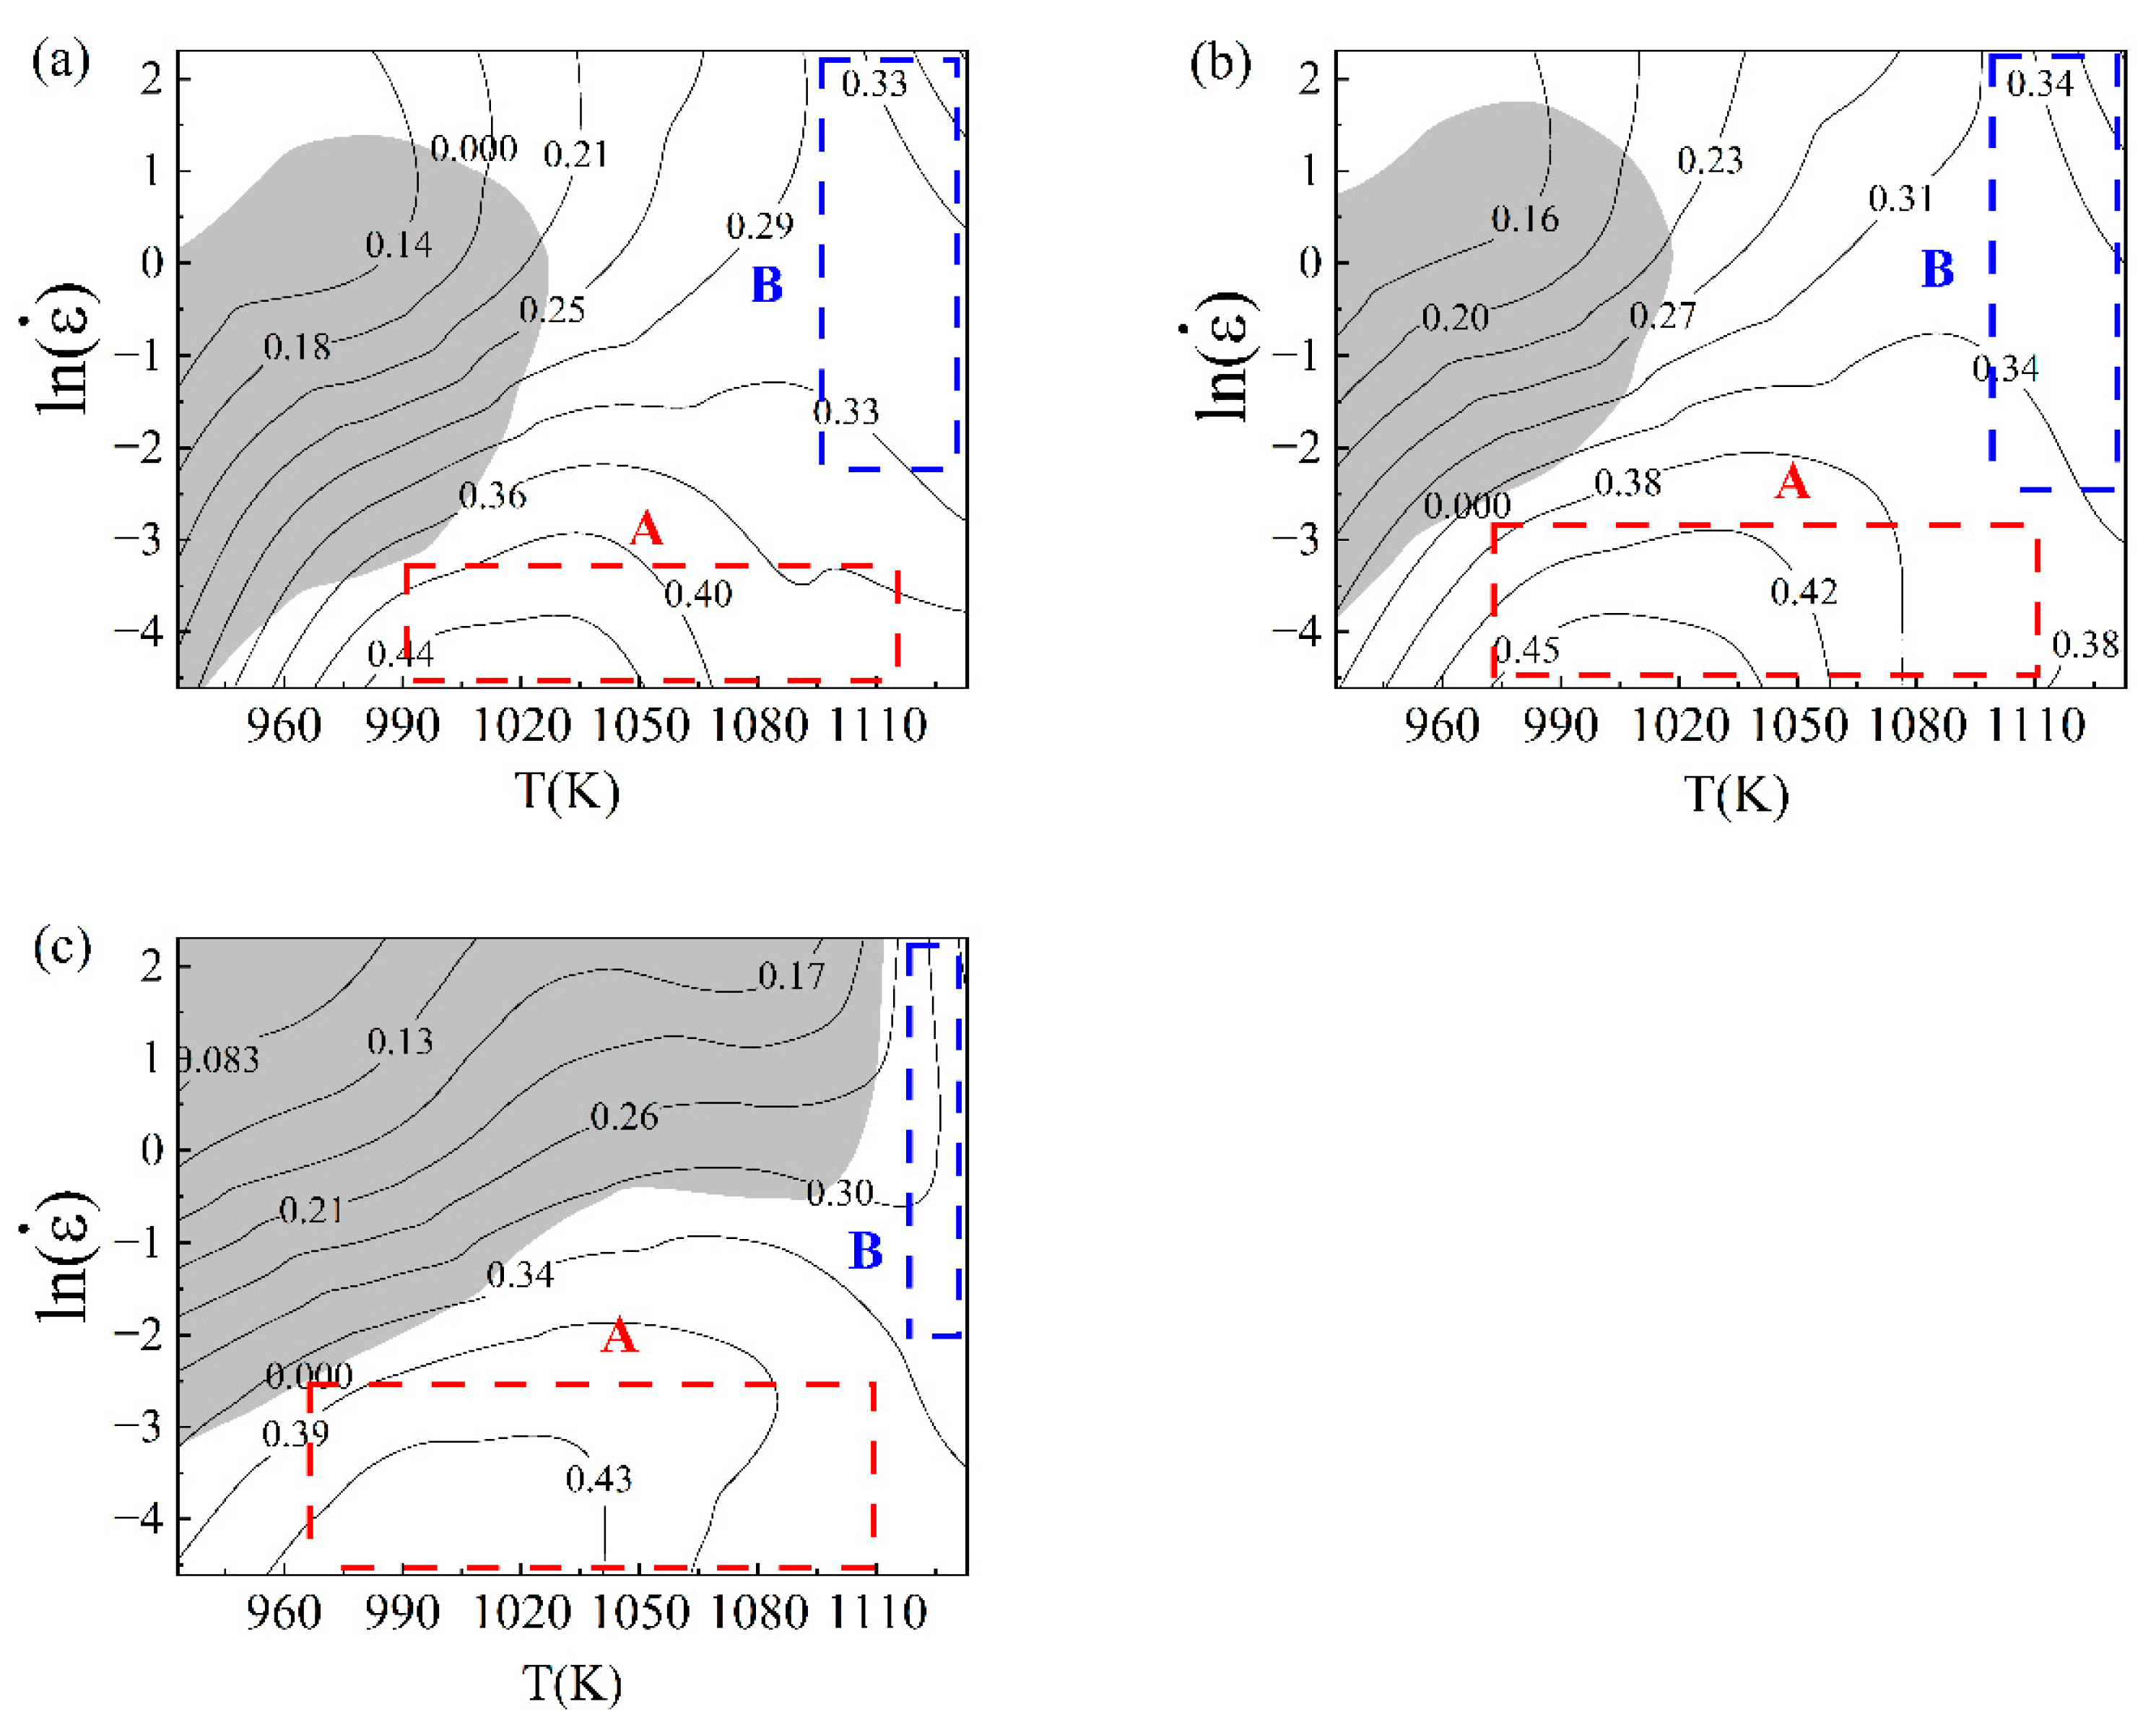
Different strains of the rheological instability parameter ξ value can be plotted as a contour map of the hot working diagram—that is, the instability map—and superimposed with the energy dissipation map. The contour lines in the map represent the values of the energy dissipation efficiency factor; the shaded area in the map represents the part where the instability parameter ξ is less than zero, i.e., the plastic rheological instability region. The thermal processing diagram of the TA4 titanium alloy at different real strains is shown in Figure 11. The destabilization zone at strain 0.3 is 933~1023 K/0.01~4 s−1. The destabilization zone at strain 0.6 is 933~1023 K/0.02~7 s−1. In this strain interval, the destabilization zone gradually moves to the high strain rate interval with the increase of strain, but the overall change of the destabilization zone is small. Among them, the destabilization zone at strain 0.9 is 933~1023 K/0.04~10 s−1, and the area of the destabilization zone at this time increases compared with that at low strain. With the increase in strain, the area of instability is gradually shifted from the location of low strain rate to the area of high strain rate and is gradually extended from the low-temperature region to the high-temperature region. Overall, the area of the destabilized region increases with the increase in strain.
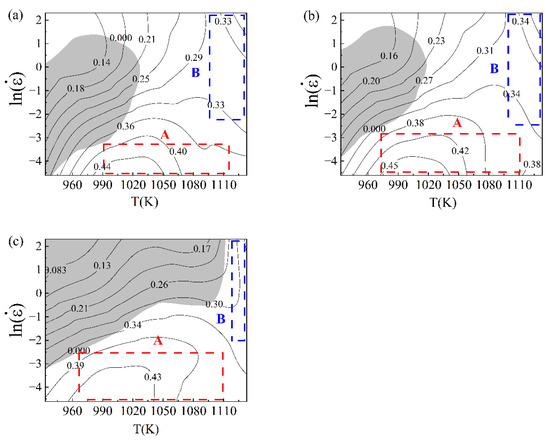
Figure 11.
Hot working diagram of TA4 alloy under different strains: (a) ε = 0.3; (b) ε = 0.6; (c) ε = 0.9.
The optimum processing region is divided into two regions: the medium-temperature low-strain region A and the high-temperature high-strain region B. Region B should be avoided when designing the thermal processing parameters due to the high temperature and strain rate required. It can be seen that the energy dissipation efficiency factor is closely related to the deformation temperature and strain rate, which increases and then decreases with the rise in temperature and strain rate. The maximum region of energy dissipation efficiency factor is located in the region of medium temperature and low strain rate, and the maximum value is near 0.44. The maximum value is around 0.44. The optimal processing region is at a strain of 0.9, 1040–1133 K/0.01–0.08 s−1. The optimal processing region is at a strain of 0.6, 940–1000 K/0.01–0.04 s−1. The optimal processing region is at a strain of 0.3, 940–1000 K/0.01–0.08 s−1.
3.5. EBSD Analyses
It is difficult to elucidate the specific deformation mechanism of the TA4 titanium alloy based on the stress–strain curves and thermal processing diagrams alone. In order to further investigate the effects of different thermal deformation parameters on the thermal deformation mechanism of the TA4 titanium alloy, its compression samples at different temperatures at the same strain rate (1 s−1) and at the same temperatures (1033 K) at different strain rates were subjected to EBSD analysis.
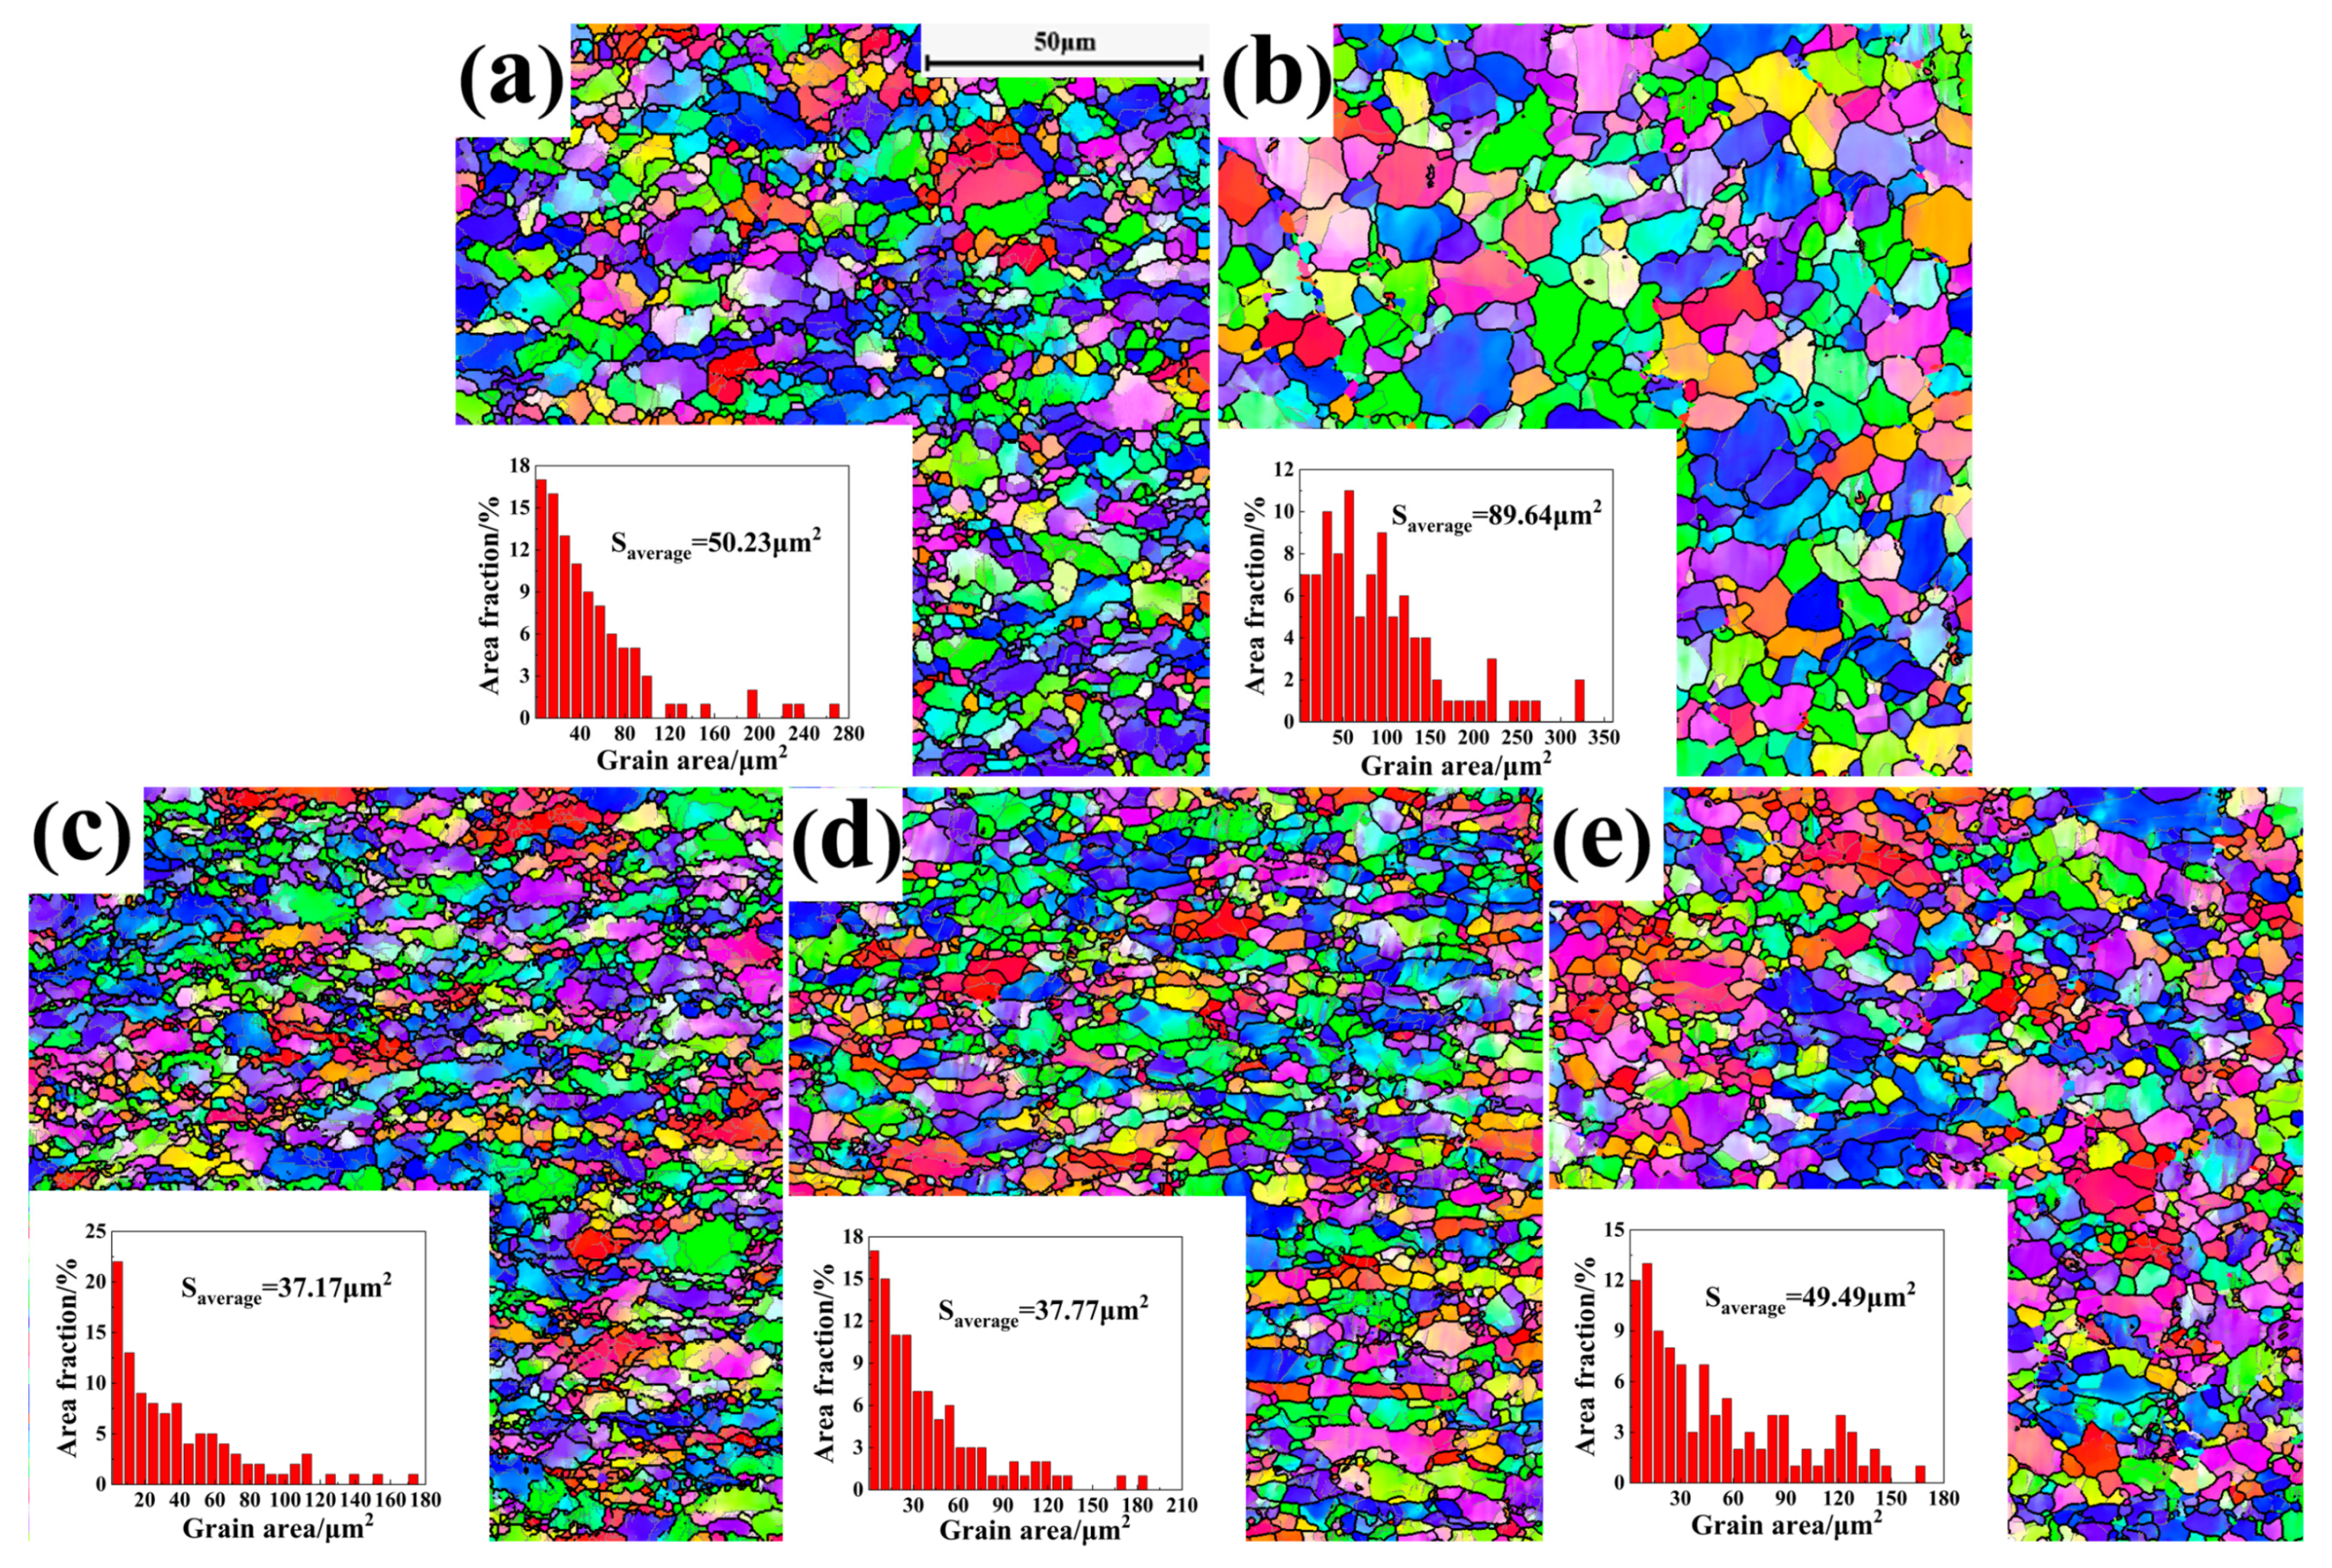
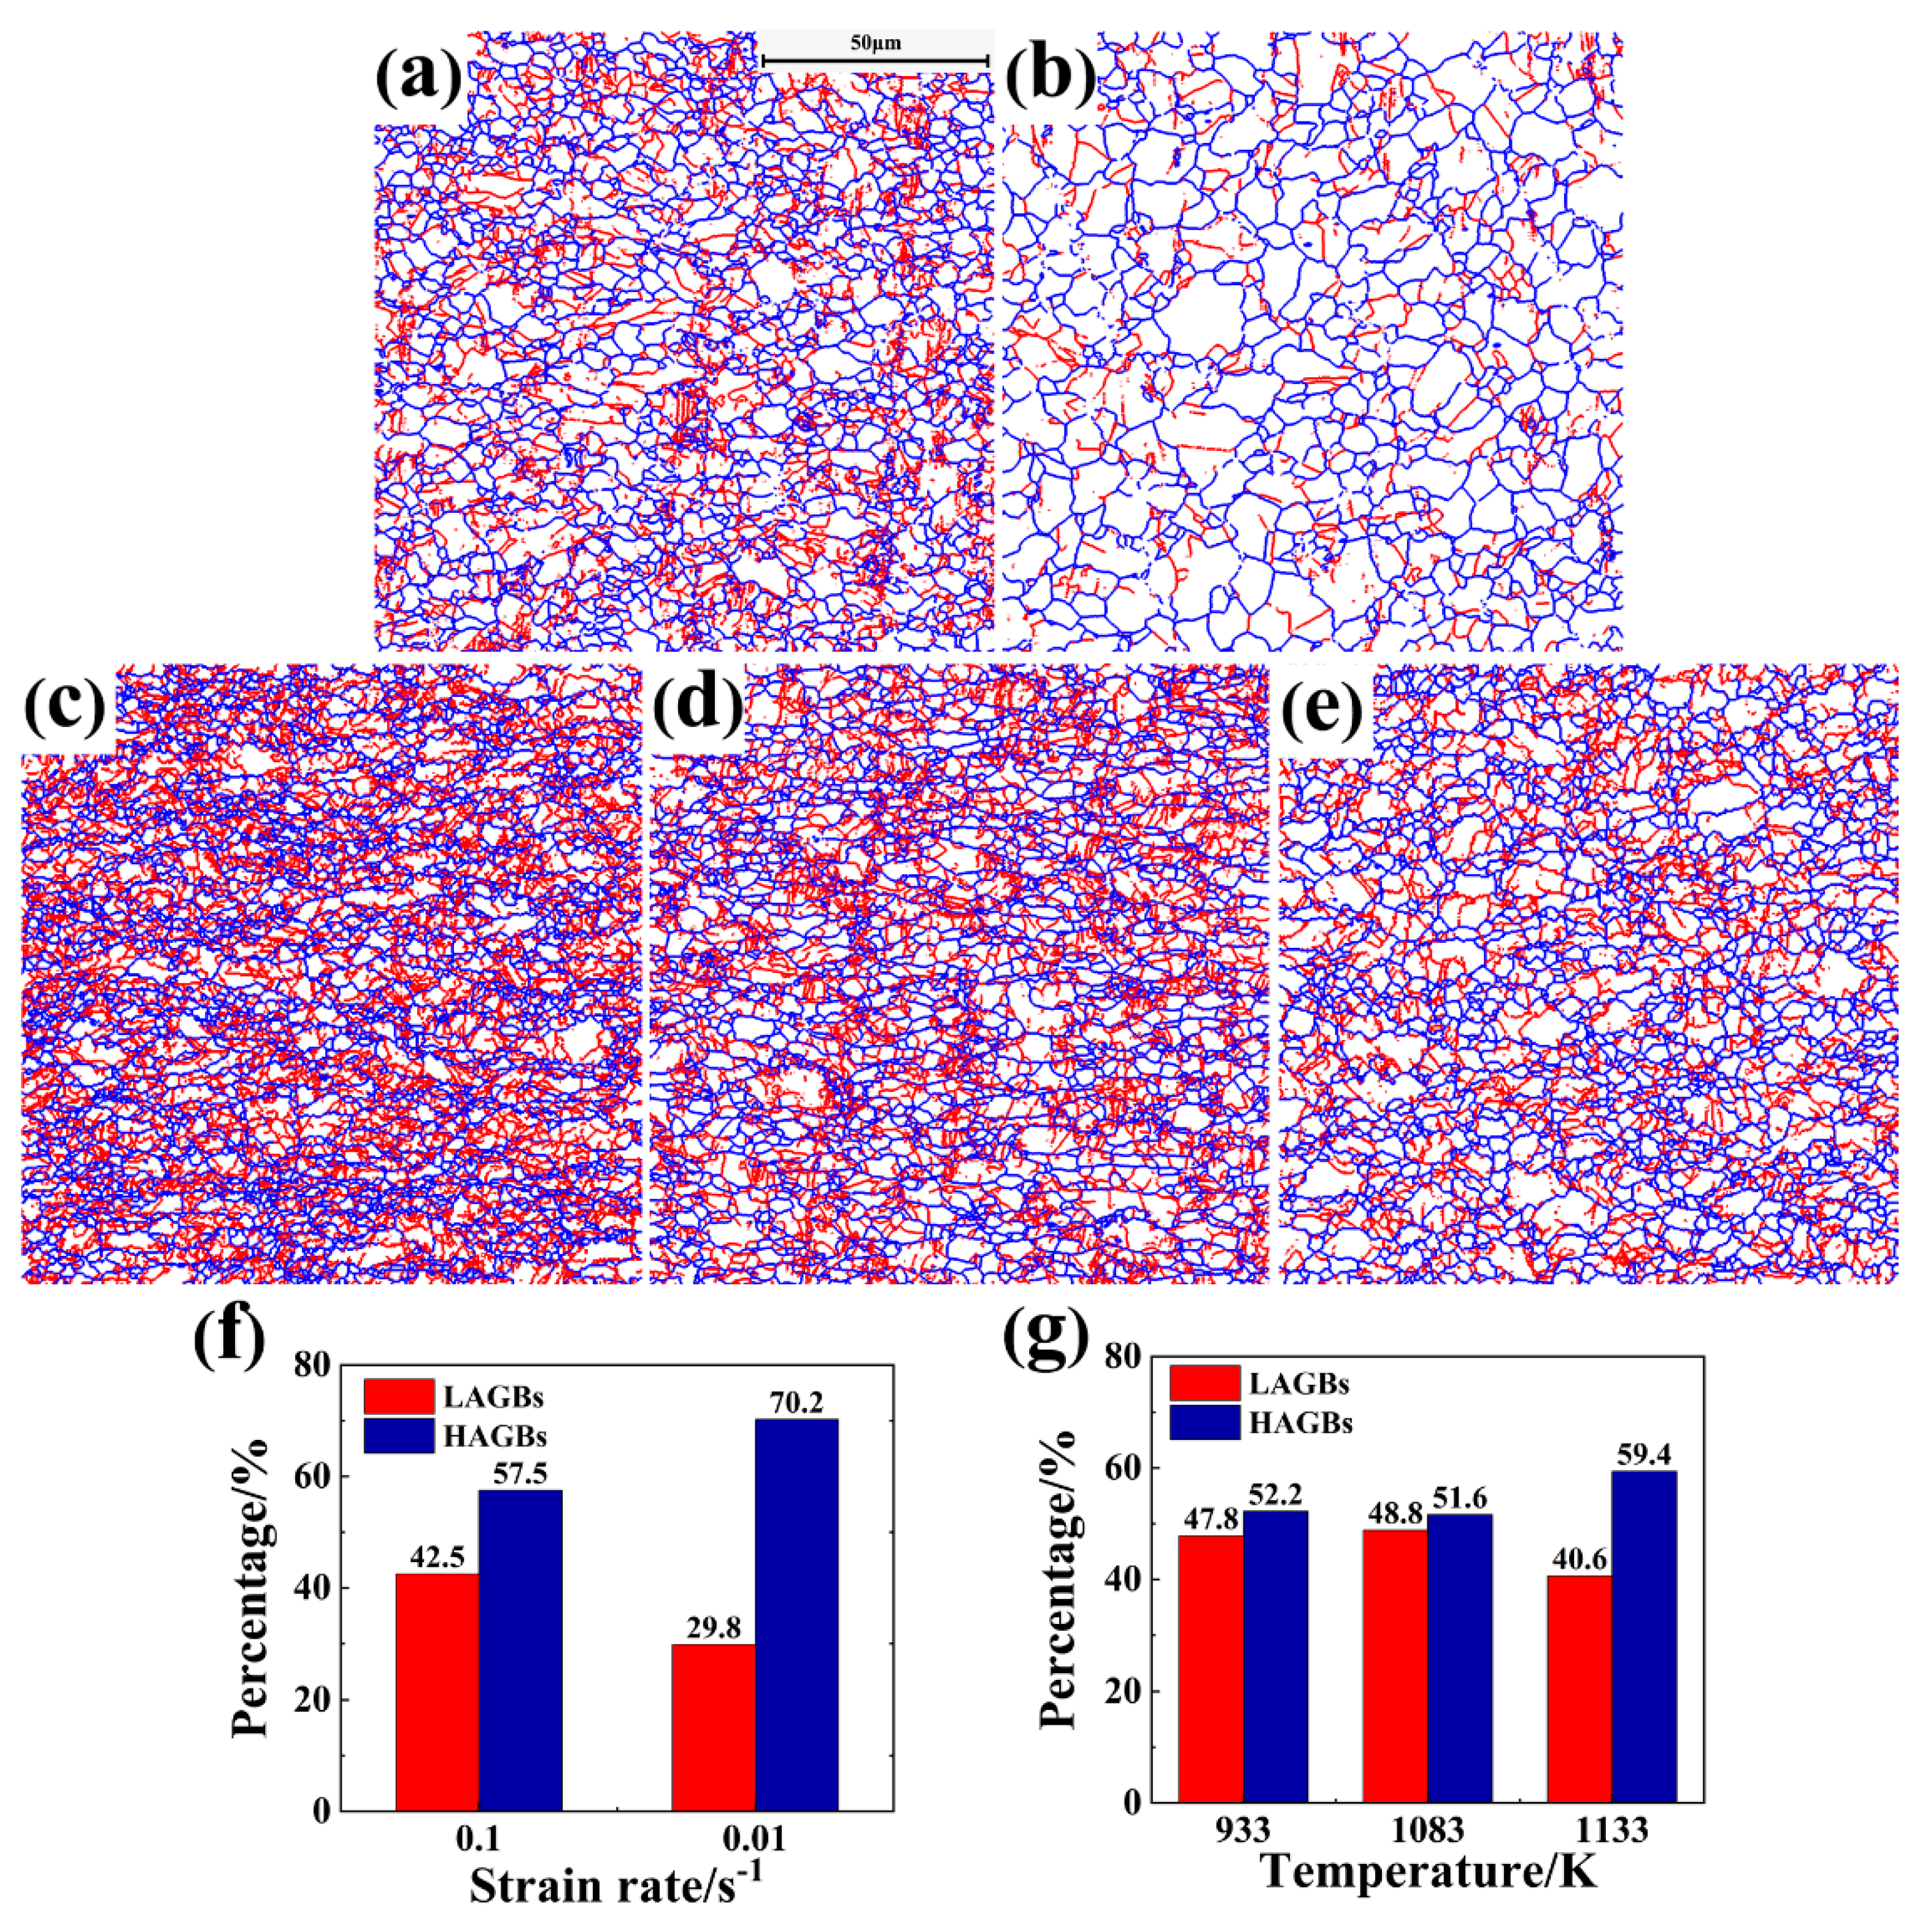
Figure 12 shows the grain size statistics of titanium alloys under different deformation parameters. From the Figure 12a,b, it can be seen that the average grain area of the alloy increases significantly with the decrease in the strain rate, from 50.23 to 89.64 μm2, and the grain shape tends to be more isometric. The orientation difference distribution graph indicates the proportion of the grain boundary orientation angle, and Figure 13 shows the orientation difference angle distribution of titanium alloys under different deformation parameters. The blue line in the figure represents the large-angle grain boundaries (HAGBs) with dislocation angles greater than 15°, and the red line represents the small-angle grain boundaries (LAGBs) with dislocation angle angles ranging from 2 to 15°. It can be obtained in Figure 13a,b,f that the percentage of LAGB decreases significantly from 42.5 to 29.8% as the strain rate decreases. The original small-angle grain boundaries formed by dislocations are transformed into large-angle grain boundaries due to the process of new grain generation and growth caused by the prolongation of deformation time with dynamic recrystallization (DRX). It is shown that the main thermal deformation mechanism of the TA4 titanium alloy at a low strain rate is DRX [31].
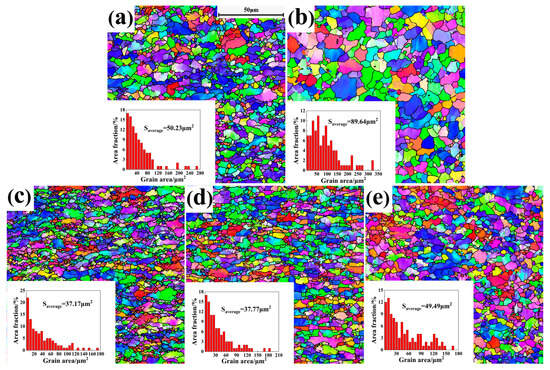
Figure 12.
Deformed alloy grain sizes: (a) 1033 K/0.1 s−1; (b) 1033 K/0.01 s−1; (c) 933 K/1 s−1; (d) 1083 K/1 s−1; (e) 1133 K/1 s−1.
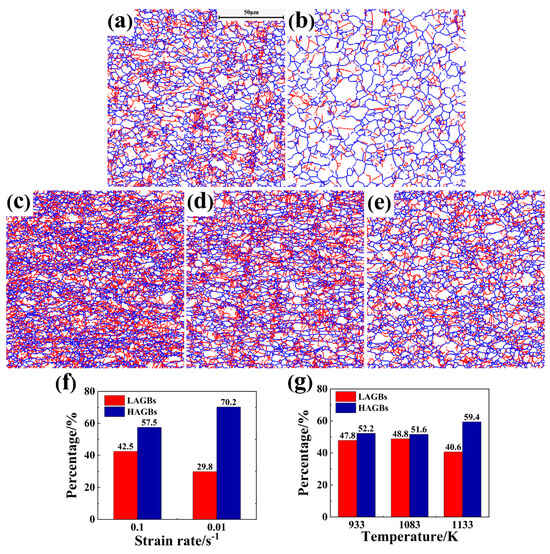
Figure 13.
Grain boundary ratio of titanium alloys with different parameters: (a) 1033 K/0.1 s−1; (b) 1033 K/0.01 s−1; (c) 933 K/1 s−1; (d) 1083 K/1 s−1; (e) 1133 K/1 s−1; (f,g) size angle grain boundary ratio.
In Figure 12c–e, it can be seen that the average grain area of titanium alloys increases with the increase in deformation temperature. The average grain area increases slightly from 37.17 to 37.77 μm2 when rising from a low temperature of 933 K to a high temperature of 1083 K, and the grain shape does not change much. When the heating temperature rises from 1083 to 1113 K, the average grain area increases significantly from 37.17 to 49.49 μm2, and the elongated grains to the equiaxial transformation trend. DRX is usually accompanied by significant changes in grain area, especially at high temperatures accompanied by grain recrystallization and the grain growth process [32]. Dynamic recovery (DRV) is the recovery process of the original grains, in which the grains are elongated and flattened, and the grain boundaries are widened, but the change of grain size is not obvious [33]. In Figure 13c–e,g, it is found that when the heating temperature increases from the low temperature 933 K to high temperature 1083 K, the titanium alloy LAGBs account for a slight increase from 47.8 to 48.4%. When the temperature increases from 1083 to 1113 K, the percentage of LAGBs starts to decrease, from 48.4 to 40.6%. In the DRX process, nascent recrystallized grains only partially exist, or even no LAGBs exist, and the boundaries between small grains will be reorganized by atomic diffusion during grain growth, resulting in the reduction in LAGBs, and a large portion of the LAGBs are generated in the DRV process. This means that the main thermal deformation mechanism during the heating of the TA4 titanium alloy from a low temperature (933 K) to high temperature (1083 K) is DRV, which leads to little change in grain size and a slight increase in the percentage of LAGBs. When the temperature is above 1083 K, the main thermal deformation mechanism is DRX, resulting in a significant increase in grain size and a decrease in the percentage of LAGBs [34].
To further discuss the thermal deformation mechanism of the TA4 titanium alloy, the percentage of dynamically recrystallized grains, substructures, and deformed grains in the typical characteristic regions of the TA4 titanium alloy were counted using the grain orientation spread (GOS) parameter as shown in Figure 14. In these microstructures, grains with GOS ≤ 2° are considered as recrystallized grains and are marked in a blue color. Grains with GOS > 7° are deformed grains and are marked in a red color. Grains with 2° < GOS ≤ 7° are substructured and are marked in a yellow color. In Figure 15, some equiaxed grains surrounded by HAGBs appear in the low dislocation region, which are recrystallized grains. There are also some irregularly shaped grains surrounded by LAGBs, which are substructures, and these grains are usually caused by the DRV process [35,36].
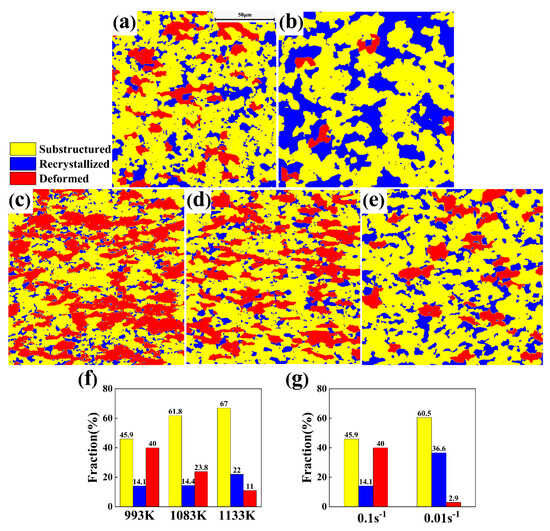
Figure 14.
Recrystallization, substructure and deformation grain of the alloys with different parameters: (a) 1033 K/0.1 s−1; (b) 1033 K/0.01 s−1; (c) 933 K/1 s−1; (d) 1083 K/1 s−1; (e) 1133 K/1 s−1; (f,g) the proportion of different grain types.
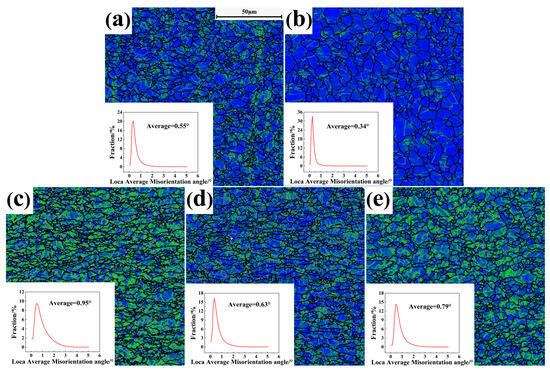
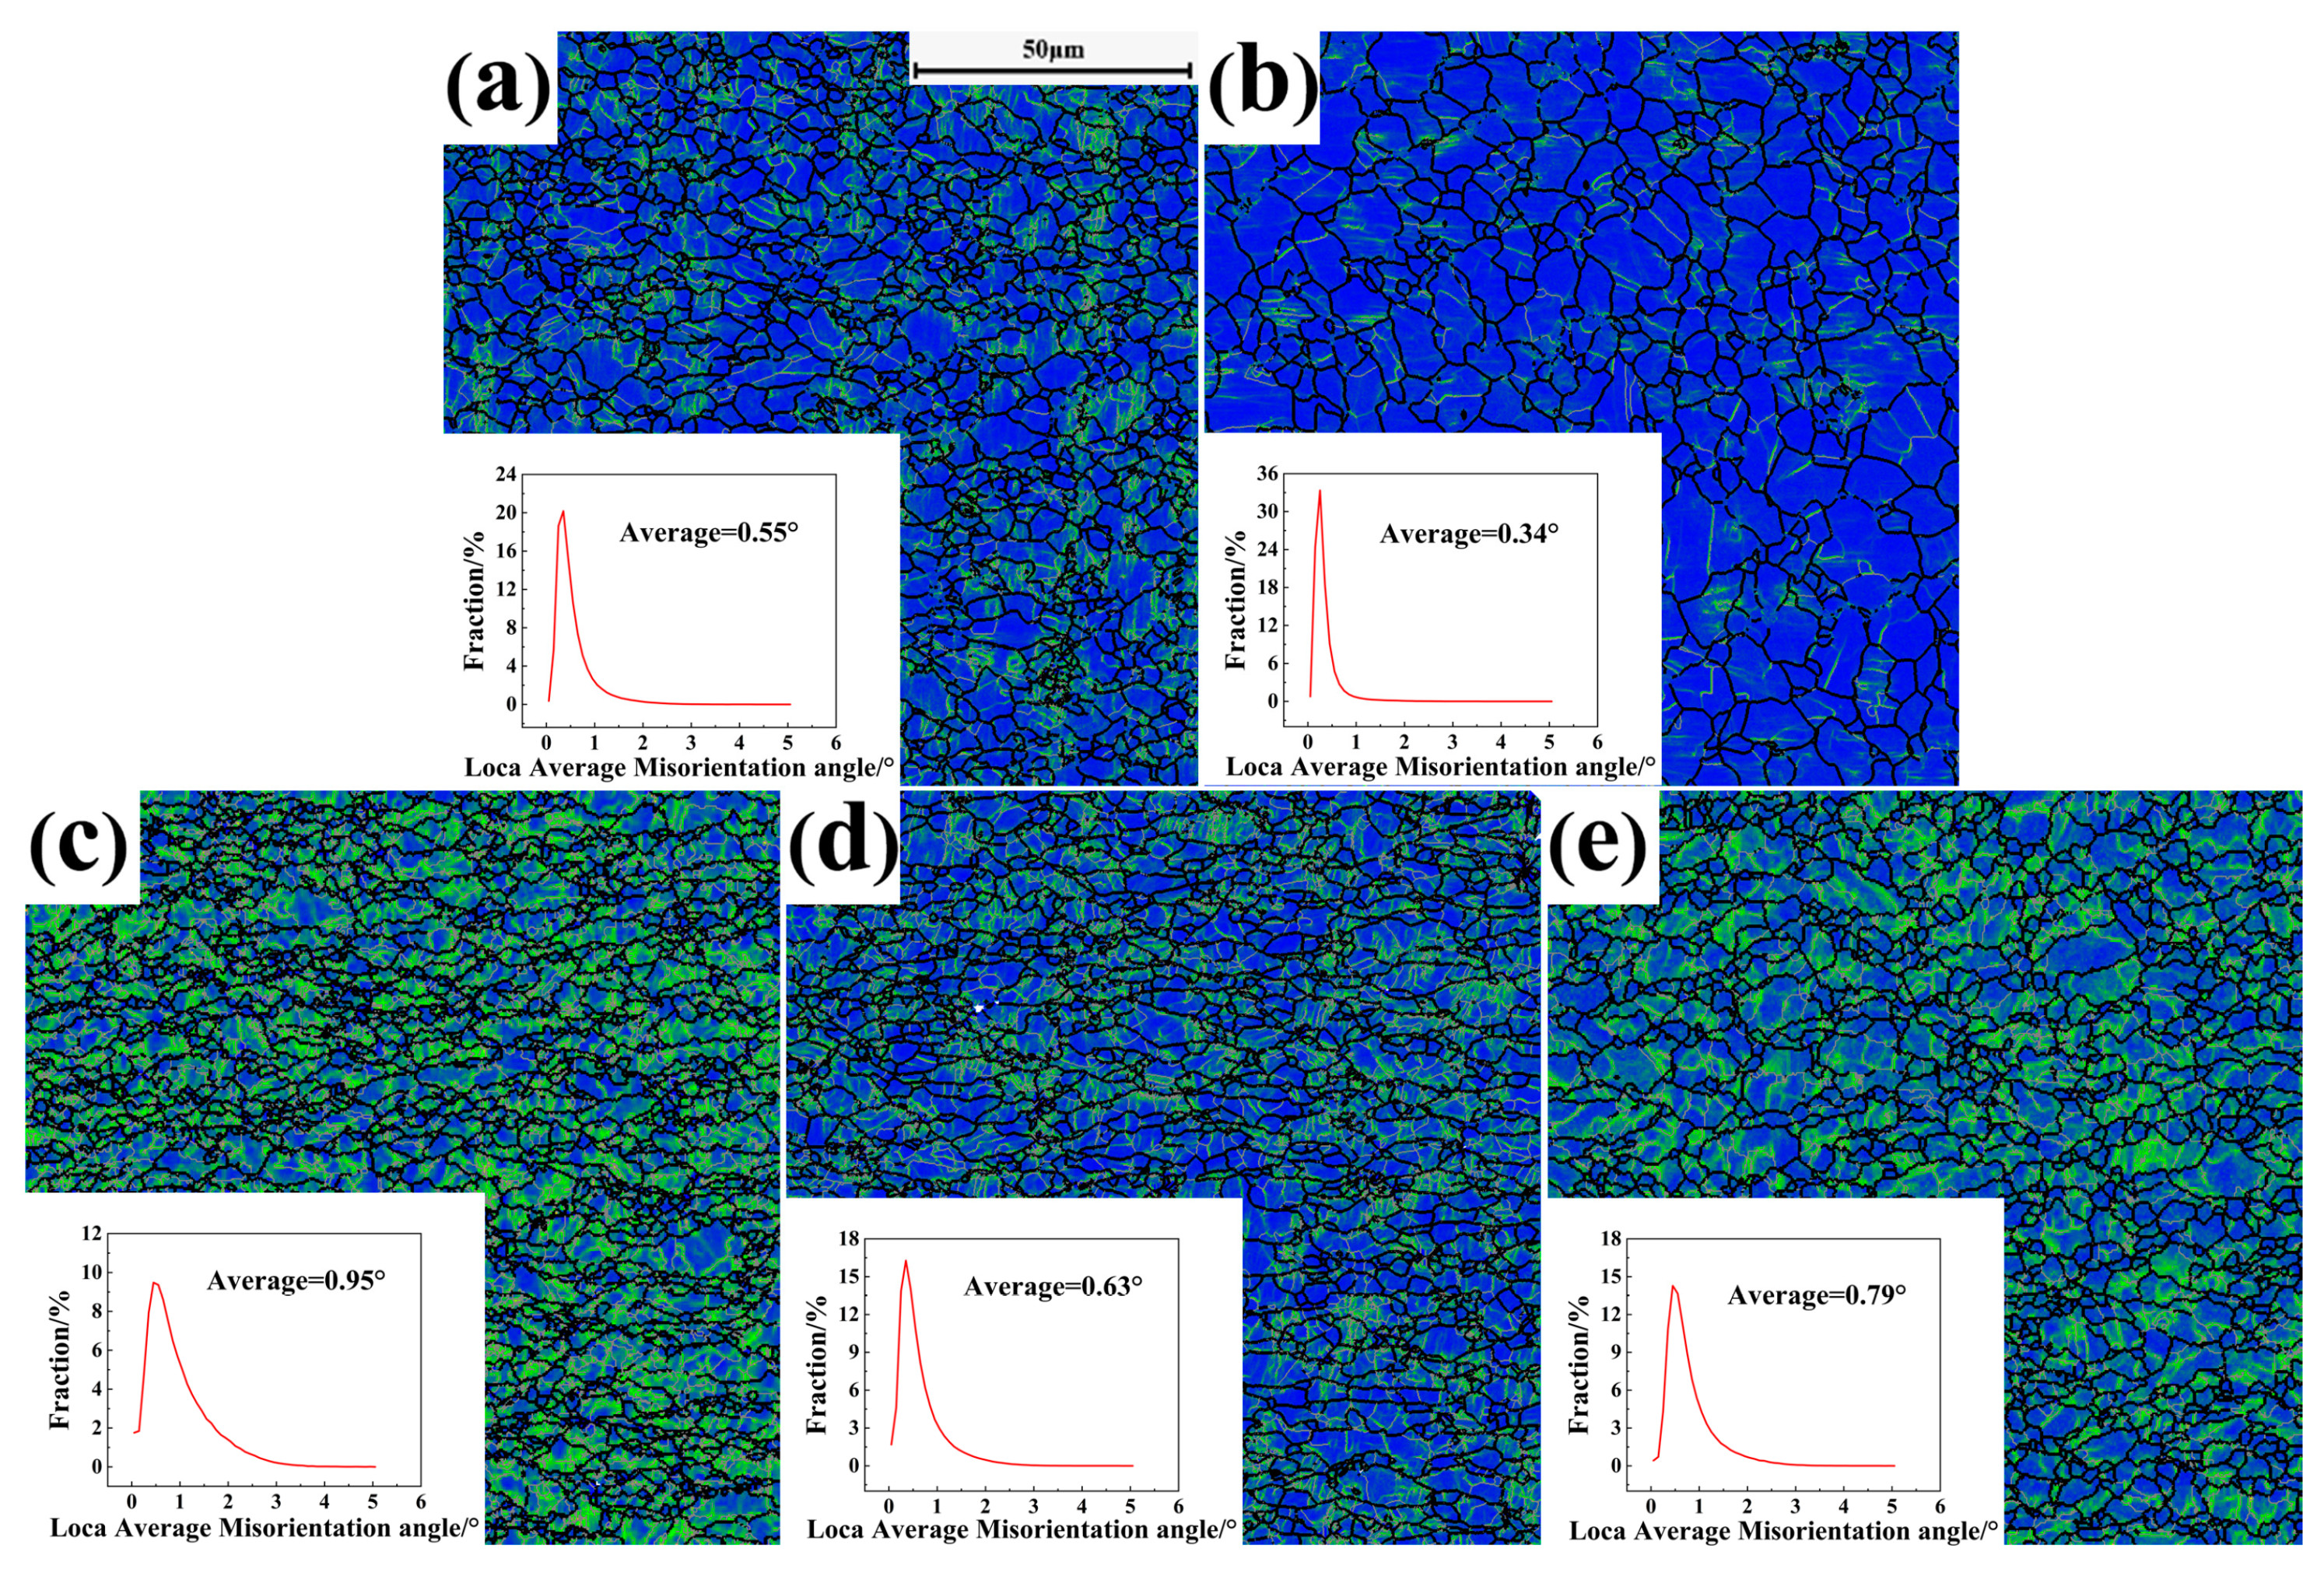
Figure 15.
KAM distributions: (a) 1033 K/0.1 s−1; (b) 1033 K/0.01 s−1; (c) 933 K/1 s−1, (d) 1083 K/1 s−1; (e) 1133 K/1 s−1.
It can be found in Figure 14a,b,g that the percentage of recrystallized grains increases significantly from 18.4 to 36.6% with the decrease in strain rate, and the percentage of substructures decreases from 66.5 to 60.5%. This indicates that a considerable portion of the substructure is transformed into recrystallized grains at this time, and this phenomenon is a hallmark feature of dynamic recrystallization. From Figure 15a,b, it can be obtained that the dislocation density decreases significantly with the decrease in strain rate, and the average value changes from 0.55 to 0.34. This indicates that with the decrease in strain rate, the recrystallization process has enough time to consume dislocations, form new grains, and reduce the dislocation density. It is also noted that 1033 K/0.01 s−1 is in the optimal processing zone A of Figure 11, when the grain size is the largest, the percentage of recrystallization is the largest, and the average orientation difference is the lowest value of only 0.49, which indicates that it has a better processing performance and is in agreement with the results obtained from the thermal processing diagram. When the deformation temperature is gradually increased, the percentage of both recrystallization and substructure increases [37]. However, it is worth noting that when the temperature increases from 933 to 1083 K, the percentage of recrystallization only increases from 14.1 to 14.4%, and the percentage of substructure increases significantly from 45.9 to 61.8% as shown in Figure 14c,d,f. From Figure 15c,d, we see that the dislocation density decreases significantly at this time, the average value changes from 0.95 to 0.63, and the kernel average misorientation (KAM) value near the grain boundary is larger than that in the grain. This indicates that a large number of dislocations generated inside the grains during the deformation process are rearranged and reorganized under the influence of DRV to form small-angle grain boundaries, which are also known as subgranular boundaries, and the most substructures surrounded by LAGBs are formed. At the same time, DRV is more likely to cause the dislocations inside the grains to slip, climb, and annihilate, which leads to a relatively low KAM value inside the grains. When the temperature increases from 1083 to 1133 K, the percentage of recrystallization increases from 14.4 to 22%, the percentage of substructure increases from 61.8 to 67%, and the percentage of deformed grains decreases from 23.8 to 11%. At this time, it can be seen from Figure 15d,e that its overall dislocation density increases, the average value changes from 0.63 to 0.79. The increase in the percentage of recrystallized grains in this temperature interval implies that the dynamic recrystallization process occurs further. However, the rise of the overall dislocations indicates that it occurs at this point in the process of initial recrystallization nucleation generation in DRX [38].
4. Discussion
Recent studies on the thermal deformation of α-titanium alloys have provided valuable insights into their behavior under various processing conditions. Ma et al. [39] conducted uniaxial tensile tests over a temperature range of 1173–1248 K and strain rates of 0.0005–0.01 s−1, establishing a theoretical basis for parameter selection during the superplastic deformation phase. Similarly, Wang et al. [40] examined the flow characteristics and dynamic recrystallization (DRX) mechanisms within a temperature range of 1073–1243 K and strain rates from 0.001 to 5 s−1. Their research resulted in a process map with three optimized processing windows and a destabilization zone, contributing further to the understanding of superplastic deformation. Yu et al. [41] explored the relationship between deformation mechanisms and microstructural evolution in the 1093–1193 K/0.01–10 s−1 parameter domain, developing an evolutionary model for thermal deformation mechanisms and defining a processing exclusion zone.
These studies share two key features: first, they focus primarily on temperatures near the critical phase transition temperature, mainly investigating phase-transition-induced microstructural changes; second, they lack a thorough analysis of broader temperature ranges, particularly with respect to dynamic recrystallization, microstructural evolution, and the quantitative relationships between process parameters in these regions.
Our study addresses these limitations by extending the investigation beyond the traditional phase transition temperature region, focusing on a processing window (933–1133 K/0.01–10 s−1) commonly used in industrial applications. We systematically examine the thermal deformation mechanisms and microstructural evolution of near-α titanium alloys within this parameter range, employing thermal simulation experiments and various characterization techniques. This research not only establishes a foundation for selecting processing parameters but also fills a critical gap in the theoretical framework for processing in this temperature range. Ultimately, it provides valuable insights to guide the precise shape control of titanium alloy components.
In this work, the influence of processing parameters on microstructural evolution is analyzed by modeling the competing mechanisms of dynamic recrystallization (DRX) and dynamic recovery (DRV) during the hot deformation of the TA4 titanium alloy. Experimental results reveal a strong sensitivity to strain rate: at a fixed temperature of 1033 K, the DRX volume fraction is only 18.4% at a strain rate of 0.1 s−1 but increases to 36.6% when the strain rate is reduced to 0.01 s−1. Statistical analysis shows that when the strain rate is ≤0.1 s−1, recrystallized grains are broadly distributed in the microstructure (with an average orientation difference of <0.55°), confirming DRX as the dominant softening mechanism. However, when the strain rate exceeds 0.1 s−1, a temperature-sensitive behavior emerges in the deformation mechanism. Further analysis reveals that at lower temperatures (933–1083 K), DRV, characterized by dislocation cell wall remicrostructure, is the primary softening mechanism, with a larger average orientation difference and a combined ratio of subcrystalline and deformed grains exceeding 78%. At higher temperatures (1083–1133 K), while DRX remains the dominant softening mechanism, the average orientation difference remains >0.63°, indicating that DRX is still inhibited by high strain rates. Based on these findings, the optimal processing window is determined to be a heating temperature of 1033 ± 20 K combined with a strain rate of 0.01–0.05 s−1.
5. Conclusions
In this paper, isothermal compression tests were carried out on the TA4 titanium alloy specimens using the Gleeble-3800 thermal simulation testing machine to study the thermal deformation behavior of the TA4 titanium alloy in the processing range of 933–1133 K/0.01–10 s−1, and the following conclusions were drawn:
(1) The constitutive equation based on the strain-compensated Arrhenius model was established for the TA4 titanium alloy. After analysis, the correlation coefficient between the predicted and experimental values of this constitutive model is 0.9612, the average absolute percentage error is 8.7210%, and the average root mean square error is 11.0635 MPa, which indicates that this constitutive equation has a better prediction ability for the rheological stresses in the temperature interval of 933–1133 K and the interval of strain rate of 0.01–10 s−1 for the TA4 titanium alloy.
(2) The optimal processing region of the TA4 titanium alloy is mainly divided into two regions, in which the region with the largest energy dissipation efficiency factor is located in the region of medium temperature and low strain rate, with the maximum value of 0.44. The optimal processing region with the larger energy dissipation efficiency factor is as follows at different strains: the optimum machining zone at a strain of 0.9 is 1040~1133 K/0.01~0.7 s−1. The optimum machining zone at a strain of 0.6 is 940~1000 K/0.01~0.04 s−1. The optimum machining zone at a strain of 0.3 is 940~1000 K/0.01~0.08 s−1.
(3) With the decrease of strain rate and the increase of deformation temperature, the grain area increases, the proportion of large-angle grain boundaries increases, and the proportion of dynamic recrystallization increases. The dislocation density increases with decreasing strain rate, and shows a tendency of decreasing and then increasing with increasing deformation temperature.
(4) The main deformation softening mechanism of the TA4 titanium alloy during thermal deformation is DRV at a low temperature and high strain rate, at a high temperature and high strain rate, and at a low strain rate. The optimal process window is determined to be a 1033 ± 20 K heating temperature matched to 0.01–0.05 s−1 strain rate combination.
Author Contributions
Conceptualization, L.M. and W.L.; methodology, Y.Z.; software, L.Q; validation, W.L. and Y.Z.; formal analysis, W.L.; investigation, J.Z.; resources, Y.Z.; data curation, J.Z.; writing—original draft preparation, W.L.; writing—review and editing, Y.Z.; supervision, L.M.; project administration, L.M.; funding acquisition, L.Q. All authors have read and agreed to the published version of the manuscript.
Funding
This work was supported by the National Natural Science Foundation of China (No. 52375363), (No. B2408100.W12), (No. 52205400), and (No. 52375362), the Applied Basic Research Project of Shanxi Province (No. 202203021211208), and the Technological Innovation Talent Team Special Plan of Shanxi Province (202204051002002).
Data Availability Statement
Data will be made available on request.
Conflicts of Interest
The authors declare no conflict of interest.
References
- Wang, Z.B.; Hu, H.X.; Zheng, Y.G.; Ke, W.; Qiao, Y.X. Comparison of the corrosion behavior of pure titanium and its alloys in fluoride-containing sulfuric acid. Corros. Sci. 2016, 103, 50–65. [Google Scholar] [CrossRef]
- Shahmir, H.; Pereira, P.H.R.; Huang, Y.; Langdon, T.G. Mechanical properties and microstructural evolution of nanocrystalline titanium at elevated temperatures. Mater. Sci. Eng. A 2016, 669, 358–366. [Google Scholar] [CrossRef]
- Yuan, B.; Zheng, Y.; Wang, Y.; Chen, Q.; Gong, L.; Lv, M. Effect of temperature on hydrogen absorption characteristic and microstructural evolution of TC21 alloy. J. Alloys Compd. Interdiscip. J. Mater. Sci. Solid-State Chem. Phys. 2015, 648, 794–802. [Google Scholar]
- Zhao, H.; Shan, X.; Tang, Y.; Wang, B.; Tian, Y. Hot deformation behavior and dynamic recrystallization mechanism of Ti2ZrTa0.75 refractory complex concentrated alloy. Mater. Charact. 2023, 203, 113061. [Google Scholar]
- Després, A.; Mithieux, J.D.; Sinclair, C.W. Modelling the relationship between deformed microstructures and static recrystallization textures: Application to ferritic stainless steels. Acta Mater. 2021, 219, 117226. [Google Scholar]
- Fan, X.G.; Yang, H.; Gao, P.F. Prediction of constitutive behavior and microstructure evolution in hot deformation of TA15 titanium alloy. Mater. Des. 2013, 51, 34–42. [Google Scholar] [CrossRef]
- Momeni, A.; Abbasi, S.M. Effect of hot working on flow behavior of Ti–6Al–4V alloy in single phase and two phase regions. Mater. Des. 2010, 31, 3599–3604. [Google Scholar] [CrossRef]
- Yang, Y.; Xu, D.; Cao, S.; Wu, S.; Zhu, Z.; Wang, H.; Li, L.; Xin, S.; Qu, L.; Huang, A. Effect of strain rate and temperature on the deformation behavior in a Ti-23.1Nb-2.0Zr-1.0O titanium alloy. J. Mater. Sci. Technol. 2021, 73, 52–60. [Google Scholar] [CrossRef]
- Hao, F.; Xiao, J.; Feng, Y.; Wang, Y.; Ju, J.; Du, Y.; Wang, K.; Nie, Z.; Tan, C. Tensile deformation behavior of a near-α titanium alloy Ti-6Al-2Zr-1Mo-1V under a wide temperature range. J. Mater. Res. Technol. 2020, 9, 2818–2831. [Google Scholar]
- Wang, X.; Liu, P.; Liang, C.; Lu, T.; Feng, T.; Niu, H.; Dong, Y.; Liu, X. Investigation on the thermal deformation mechanisms and constitutive model of Ti-55511 titanium alloy. J. Mater. Res. Technol. 2024, 33, 6780–6797. [Google Scholar] [CrossRef]
- Li, L.; Ma, G.; Huang, H.; Xiao, H.; Yuan, Z.; Li, Y.; Zhou, R. Flow behavior analysis and prediction of flow instability of a lamellar TA10 titanium alloy. Mater. Charact. 2022, 194, 112403. [Google Scholar] [CrossRef]
- Zhang, Y.; Huang, T.; Zhou, Z.; Li, M.; Tan, L.; Gan, B.; Jie, Z.; Qin, L.; Zhang, J.; Liu, L. Variation of Homogenization Pores during Homogenization for Nickel-Based Single-Crystal Superalloys. Adv. Eng. Mater. 2021, 23, 2001547. [Google Scholar] [CrossRef]
- Ji, R.; Zhu, K.; Zhang, H.; Luo, H.; Mao, J. Microstructure evolution, mechanical response and strengthening models for TA15 titanium alloy during thermal processes: A brief review. J. Mater. Res. Technol. 2024, 28, 1644–1656. [Google Scholar] [CrossRef]
- Abbasi, S.M.; Momeni, A.; Lin, Y.C.; Jafarian, H.R. Dynamic softening mechanism in Ti-13V-11Cr-3Al beta Ti alloy during hot compressive deformation. Mater. Sci. Eng. A 2016, 665, 154–160. [Google Scholar] [CrossRef]
- Xiang, Y.; Xiang, W.; Yuan, W. Flow softening and microstructural evolution of near β titanium alloy Ti-55531 during hot compression deformation in the α + β region. J. Alloys Compd. 2023, 955, 170165. [Google Scholar] [CrossRef]
- Wang, Y.; Yang, G.; Zhang, S.; Xiu, S. Effect of crystal orientation on micro-stress distribution in a damage-tolerant titanium alloy TC21. J. Alloys Compd. Interdiscip. J. Mater. Sci. Solid-State Chem. Phys. 2022, 924, 166637. [Google Scholar]
- Si-Wei, D.; Xiang-Long, D. Interpretation of the Latest Edition of ⟪GB/T 3620.1-2016 Titanium and Titanium Alloy Grades and Chemical Compositions⟫. Science & Technology Vision 2019.
- Xie, H.; Wang, J.; Li, Y.; Song, J.; Hu, H.; Qin, L.; Zhao, H.; Li, C.; Cui, Y.; Tan, Z. Fast shot speed induced microstructure and mechanical property evolution of high pressure die casting Mg-Al-Zn-RE alloys. J. Mater. Process. Technol. 2024, 331, 118523. [Google Scholar] [CrossRef]
- Han, L.; Zhang, H.; Cheng, J.; Zhou, G.; Wang, C.; Chen, L. Thermal Deformation Behavior of Ti-6Mo-5V-3Al-2Fe Alloy. Crystals 2021, 11, 1245. [Google Scholar] [CrossRef]
- Chai, Y.; Zhu, Y.; Qin, L.; Luo, Y.; Niu, Y.; Shao, Z. High-temperature hot deformation behavior and processing map of Ti-22Al-25Nb alloy. Mater. Today Commun. 2024, 41, 110599. [Google Scholar] [CrossRef]
- Prasad, Y.V.R.K.; Gegel, H.L.; Doraivelu, S.M.; Malas, J.C.; Morgan, J.T.; Lark, K.A.; Barker, D.R. Modeling of dynamic material behavior in hot deformation: Forging of Ti-6242. Metall. Trans. A 1984, 15, 1883–1892. [Google Scholar]
- Shokry, A.; Gowid, S.; Kharmanda, G. An improved generic Johnson-Cook model for the flow prediction of different categories of alloys at elevated temperatures and dynamic loading conditions. Mater. Today Commun. 2021, 27, 102296. [Google Scholar] [CrossRef]
- Zhao, Y.; Sun, J.; Li, J.; Yan, Y.; Wang, P. A comparative study on Johnson-Cook and modified Johnson-Cook constitutive material model to predict the dynamic behavior laser additive manufacturing FeCr alloy. J. Alloys Compd. 2017, 723, 179–187. [Google Scholar] [CrossRef]
- Chen, W.; Guan, Y.; Wang, Z. Modeling of Flow Stress of High Titanium Content 6061 Aluminum Alloy Under Hot Compression. J. Mater. Eng. Perform. 2016, 25, 4081–4088. [Google Scholar] [CrossRef]
- Liao, H.; Wu, Y.; Zhou, K.; Yang, J. Hot deformation behavior and processing map of Al–Si–Mg alloys containing different amount of silicon based on Gleebe-3500 hot compression simulation. Mater. Des. 2015, 65, 1091–1099. [Google Scholar] [CrossRef]
- Abbasi-Bani, A.; Zarei-Hanzaki, A.; Pishbin, M.H.; Haghdadi, N. A comparative study on the capability of Johnson–Cook and Arrhenius-type constitutive equations to describe the flow behavior of Mg–6Al–1Zn alloy. Mech. Mater. 2014, 71, 52–61. [Google Scholar] [CrossRef]
- Wang, Y.; Peng, J.; Zhong, L.; Pan, F. Modeling and application of constitutive model considering the compensation of strain during hot deformation. J. Alloys Compd. 2016, 681, 455–470. [Google Scholar] [CrossRef]
- Zhou, Z.; Fan, Q.; Xia, Z.; Hao, A.; Yang, W.; Ji, W.; Cao, H. Constitutive Relationship and Hot Processing Maps of Mg-Gd-Y-Nb-Zr Alloy. J. Mater. Sci. Technol. 2017, 33, 637–644. [Google Scholar] [CrossRef]
- Mandal, S.; Rakesh, V.; Sivaprasad, P.V.; Venugopal, S.; Kasiviswanathan, K.V. Constitutive equations to predict high temperature flow stress in a Ti-modified austenitic stainless steel. Mater. Sci. Eng. A 2009, 500, 114–121. [Google Scholar] [CrossRef]
- Robi, P.S.; Dixit, U.S. Application of neural networks in generating processing map for hot working. J. Mater. Process. Technol. 2003, 142, 289–294. [Google Scholar] [CrossRef]
- Long, F.-W.; Jiang, Q.-W.; Xiao, L.; Li, X.-W. Compressive Deformation Behaviors of Coarse- and Ultrafine-Grained Pure Titanium at Different Temperatures: A Comparative Study. Mater. Trans. 2011, 52, 1617–1622. [Google Scholar] [CrossRef]
- Li, L.; Li, M.Q.; Luo, J. Flow softening mechanism of Ti–5Al–2Sn–2Zr–4Mo–4Cr with different initial microstructures at elevated temperature deformation. Mater. Sci. Eng. A 2015, 628, 11–20. [Google Scholar] [CrossRef]
- Hou, Z.; Liu, H.; Lu, L.; Li, W.; Zhang, Z.; Lu, W.; Feng, Q.; Jia, B.; Song, K. Effect of rare earth yttrium and the deformation process on the thermal deformation behavior and microstructure of pure titanium for cathode rolls. J. Mater. Res. Technol. 2024, 33, 4192–4205. [Google Scholar] [CrossRef]
- Xu, G.; Tao, J.; Deng, Y.; Zheng, B.; Zhang, Y.; Jiang, Y. Multi-stage hot deformation and dynamic recrystallization behavior of low-cost Ti–Al–V–Fe alloy via electron beam cold hearth melting. J. Mater. Res. Technol. 2022, 20, 1186–1203. [Google Scholar] [CrossRef]
- Al-Samman, T. Modification of texture and microstructure of magnesium alloy extrusions by particle-stimulated recrystallization. Mater. Sci. Eng. A 2013, 560, 561–566. [Google Scholar] [CrossRef]
- Qu, F.S.; Zhou, Y.H.; Zhang, L.Y.; Wang, Z.H.; Zhou, J. Research on hot deformation behavior of Ti-5Al-5Mo-5V-1Cr-1Fe alloy. Mater. Des. 2015, 69, 153–162. [Google Scholar] [CrossRef]
- Xu, J.; Zeng, W.; Zhang, X.; Zhou, D. Analysis of globularization modeling and mechanisms of alpha/beta titanium alloy. J. Alloys Compd. 2019, 788, 110–117. [Google Scholar] [CrossRef]
- Yang, Y.; Wang, H.; Feng, Z.; Shi, Q.; Yang, B.; Chen, M.; Qi, H.; Wang, X. Study on the warm deformation behavior and microstructure evolution of the MDIFed Ti–6Al–4V titanium alloy. J. Mater. Res. Technol. 2024, 33, 8929–8943. [Google Scholar] [CrossRef]
- Ma, L.; Wan, M.; Li, W.; Shao, J.; Bai, X.; Zhang, J. Superplastic deformation mechanical behavior and constitutive modelling of a near-α titanium alloy TNW700 sheet. Mater. Sci. Eng. A 2021, 817, 141419. [Google Scholar] [CrossRef]
- Wang, Y.; Li, Z.; Wang, H.; Hou, M.; Yu, K.; Xu, Y.; Xiao, H. Flow behavior and dynamic recrystallization mechanism of a new near-alpha titanium alloy Ti-0.3 Mo-0.8 Ni-2Al-1.5 Zr. J. Mater. Res. Technol. 2024, 30, 3863–3876. [Google Scholar] [CrossRef]
- Yu, J.; Li, Z.; Qian, C.; Huang, S.; Xiao, H. Investigation of deformation behavior, microstructure evolution, and hot processing map of a new near-α Ti alloy. J. Mater. Res. Technol. 2023, 23, 2275–2287. [Google Scholar]


Disclaimer/Publisher’s Note: The statements, opinions and data contained in all publications are solely those of the individual author(s) and contributor(s) and not of MDPI and/or the editor(s). MDPI and/or the editor(s) disclaim responsibility for any injury to people or property resulting from any ideas, methods, instructions or products referred to in the content. |
© 2025 by the authors. Licensee MDPI, Basel, Switzerland. This article is an open access article distributed under the terms and conditions of the Creative Commons Attribution (CC BY) license (https://creativecommons.org/licenses/by/4.0/).