Article

High-Pressure Laser Reactive Synthesis Within Diamond Anvil Cells of Carbon Allotropes from Methanol

by
Mohamad E. Alabdulkarim
1 and
James L. Maxwell
1,2,*
1
EεMC2Labs, Department of Engineering, La Trobe University, Bendigo, VIC 3550, Australia
2
Maxwell Laboratories PTY LTD., Heathcote, VIC 3523, Australia
*
Author to whom correspondence should be addressed.
Crystals 2025, 15(4), 292; https://doi.org/10.3390/cryst15040292
Submission received: 10 February 2025 / Revised: 16 March 2025 / Accepted: 20 March 2025 / Published: 24 March 2025
(This article belongs to the Special Issue Laser–Material Interaction: Principles, Phenomena, and Applications)

Abstract

:
This work targets a knowledge gap in the high-pressure decomposition of methanol, complementing prior moderate-pressure diamond anvil studies below 4 GPa and hyperbaric-pressure laser chemical vapour deposition (HP-LCVD) experiments below 0.01 GPa. Localised decomposition of methanol into various carbon allotropes was investigated at pressures of up to 15 GPa. Diamond anvil cell (DAC) pressures were monitored in real-time using ruby fluorescence and a high-resolution spectrometer. Selective saser reactive synthesis within diamond anvil cells (LRS-DAC) was achieved using a 20-micron 1/e2 laser beam focus—one order of magnitude smaller than the diamond anvil chamber dimensions. Confocal Raman spectroscopy and electron microscopy were employed to investigate the deposit’s local microstructure. Various carbon allotropes were synthesised selectively, including single-crystal diamond, nanocrystalline diamond, multi-walled carbon nanotubes (MWCNTs), single-walled carbon nanotubes (SWCNTs), and amorphous carbons. At least two unknown Raman signatures were observed and unlikely to be harmonics or combinations of ordinary Raman peaks, the closest known Raman spectra being that of catechol and polycatechol. Potential side reactions are proposed, where polymerisation and/or ring-formation may occur during high-pressure moderate-temperature (HPMT) conditions.

Graphical Abstract

1. Introduction

For over seven decades, diamond anvil cells (DACs) have been utilised to modify materials under extreme conditions of pressure and temperature [1,2,3,4]. Since the advent of the laser in 1968, laser-heated diamond anvil cells (LH-DACs) have played an increasing role in high-pressure research, enabling extreme temperatures to be achieved (>7000 K) without excessively damaging the anvils or adjacent mounts [5,6,7,8]. Through the use of LH-DACs, the high-pressure high-temperature (HPHT) phase diagram of carbon has been mapped up to its melting point, including the all-important phase transition between diamond and graphite [9,10,11,12].
Less widely known is the laser reactive synthesis within diamond anvil cells (LRS-DAC), wherein a tightly-focused laser is used to intentionally induce chemical reactions within a DAC. Typically, a precursor like methanol is converted to products such as carbon and hydrogen, and a solid deposit forms locally, at/near the centre of the laser focus. Various products/allotropes can be realised at different sites within the DAC, depending on local processing conditions. Diffusion, thermodiffusion, and (sometimes) convection play a role in the transport of materials within the LRS-DAC system—and ultimately influence the final composition of the product(s) [13]. LRS-DAC experiments have realised a wide variety of novel materials [13], such as metal hydrides [14,15,16,17], carbides [18,19], nitrides [20,21,22,23], oxides [24,25,26], and intermetallic compounds [27,28,29]. Although extensively investigated using LH-DAC systems at high pressures [30,31,32], selective micro-scale chemical reactions to synthesise carbon allotropes have been less common [13]. Selectivity can indeed change the equilibrium of a reaction, as it allows certain by-products to transport outside the zone where a reaction is occurring.
At significantly lower pressures, hyperbaric-pressure laser chemical vapour deposition (HP-LCVD) has been employed to deposit carbon allotropes, such as diamond-like carbon (DLC), amorphous carbon (a-C), conical helicoidal graphite (CHG), and other forms of graphite [33,34,35]; this process also uses a focused laser to decompose precursors selectively. However, the highest experimental pressures achieved thus far have only been 180 bar (0.018 GPa) [35], which is somewhat above the critical point of methanol (82 bar).
Although significant experimental effort has gone into diamond synthesis using hydrocarbons with hydrogen, there are comparatively few experimental investigations using alcohols as precursors for diamond growth [36,37,38]. A novel route to diamond within the C-H-O system appears to exist that does not require hot-wire or plasma activation [34,35,39], where alcohols (or hydrocarbons in mixtures with water) are used, and the potential role of the hydroxyl group and/or oxygen in the formation of diamond is, at present, poorly understood [38]. For this reason, the present authors previously grew DLC coatings from methanol and water mixtures using HP-LCVD [35]; Figure 1 identifies the HP-LCVD experimental conditions completed to date with pure methanol and methanol-water mixtures (see orange box).
At higher pressures, Fomin et al. suggest that further experimental datasets are needed for computational models of methanol decomposition—as reliable experimental data of methanol’s properties/reactions are limited to <6 GPa [40]. Accordingly, there is an apparent gap in data for the decomposition of methanol between 1.6 GPa and 5 GPa, as well as above 6 GPa. This work attempts to (at least partially) fill this gap and explores the synthesis of novel carbon allotropes at various pressures using an LRS-DAC system. Figure 1 provides the pressures investigated in this study (blue box); several important microstructural phases are synthesised, including diamond, carbon nanotubes (CNTs) and amorphous diamond.
Further to being a useful precursor for diamond synthesis [41,42], methanol at high pressures is interesting for its role in many natural and industrial processes; it is present in ocean depths, inside the Earth’s crust, and within dwarf planets, gas giants, and even the atmosphere of brown dwarfs [43,44,45,46,47,48]. It impacts phase behaviour of water, hydrocarbons, and other polar molecules, as well as hydrogen bonding in many aqueous and non-aqueous systems. For example, methanol can depress the freezing point of hydrates and plays an important role in clathrate hydrate formation in the deep ocean [46]. It also influences the cryogeological processes of moons and dwarf planets, such as Titan, Enceladus, Arrokoth, and Pluto [48,49]. Finally, high-pressure methanol can affect the flow of oil and gas in pipelines [46].

2. Materials and Methods

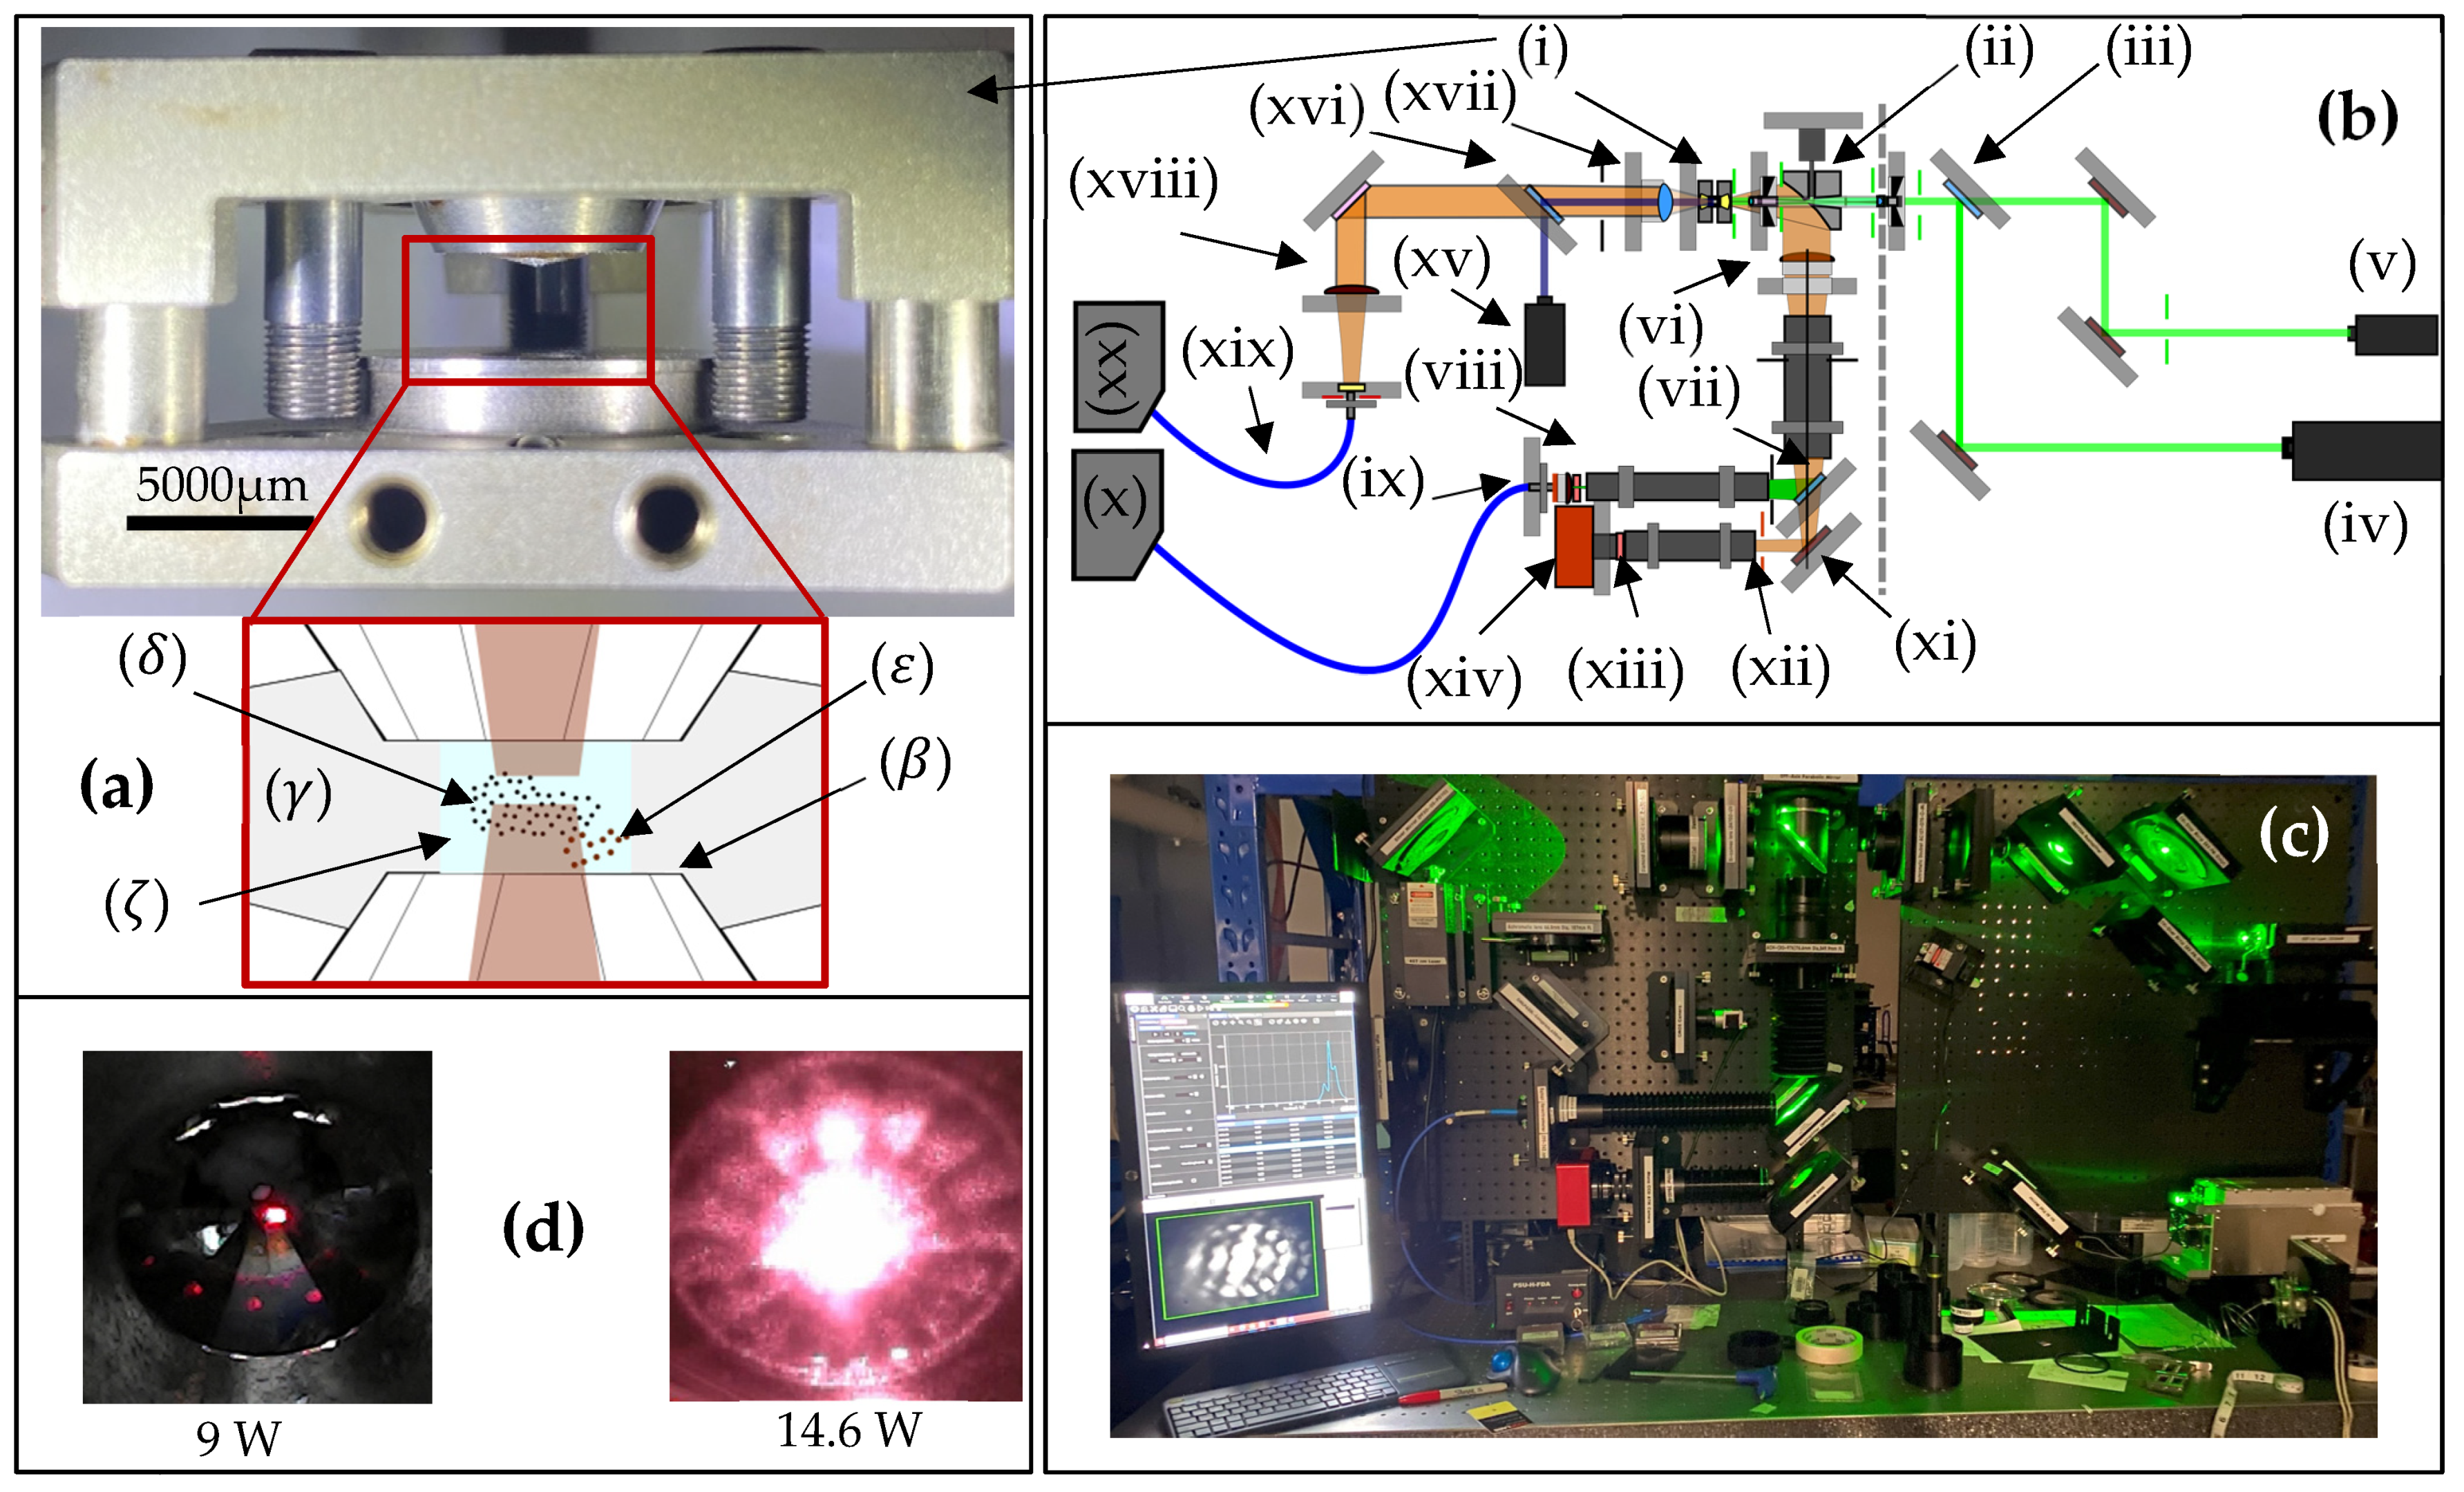
The diamond anvil cell (DAC) employed for these experiments was a Bragg-Mini unit from Almax easyLab Inc. manufactured in Diksmuide, Belgium. It featured two opposing anvils with a 0.50 mm cutlet ( β ), as shown in Figure 2a, allowing gasket chambers of about 300 µm in diametre (laterally) and 260 µm in thickness prior to compression ( γ ). The anvils were tightened using a precision torque wrench. Where diamond was employed as the anvil material, the Bragg-Mini DAC could generate a maximum of approximately 20 GPa without damage. Inconel 718 (Nr-Fe-Cr alloy) gaskets were used throughout these experiments, as they had the potential to catalyse the decomposition of methanol and growth of graphene/nanotubes.
The diamond anvil cell was placed within a custom-built LRS-DAC system (see Figure 2b). The DAC was held within a standard 3-inch Thorlabs lens tube using a custom 3D-printed part, which, in turn, was mounted inside a 4″ Edmund Optics mirror mount for ease of adjustment. This arrangement allowed the DAC (i) to be nominally positioned along the centre of the optical axis, aiding in laser beam alignment to the DAC. A 40 mm focal length achromat was used to focus the laser beam into the DAC; this had a (1/e2) beam waist of approximately 20 µm, resulting in beam intensities of 2865 and 4647 kW/cm2 at 9 W and 14.6 W, respectively. The lens was positioned in the middle of the beam path using a 3D-printed spider assembly within a 3-inch Thorlabs lens tube.
The laser beam was delivered through a hole in a reflective mirror (ii), allowing the reaction to be observed along the axis of the incident beam. A beam combiner (iii) enabled two different laser sources to be employed, either 1064 nm (iv) or 532 nm (v). For all LRS-DAC experiments described herein, 1064 nm wavelengths were used in the continuous-wave (cw) mode.
The light reflected by mirror (ii) in Figure 2 was focused with a 3-inch diametre achromat (vi) to collect as much light as possible, and this was subsequently divided into two optical paths by a long-pass beamspitter (vii) at a cut-on wavelength of 700 nm. Shorter wavelengths between 200 nm and 700 nm were passed to a meniscus lens (viii) and focused into a 600 µm diametre fibre optic (ix); this light was further carried to an Ocean Optics Maya Pro Raman Spectrometer with H2 Grating (x), allowing for the real-time Raman spectroscopic analysis of the materials produced within the reaction zone. Light passing through the beamsplitter (vii) was also reflected off a flat mirror (xi), through an iris (xii) and notch filter (xiii), and onto the focal plane of an ATIK Mono CCD camera (xiv). In this way, reactions occurring within the DAC chamber were monitored in real-time at red and near-IR wavelengths. These wavelengths were useful in determining when the reaction zone was being heated.
On the backside of the DAC, another optical path allowed for real-time monitoring of the chamber pressure. A laser source at 457 nm (xv) was reflected into this optical path using a long-pass beamsplitter (xvi) with a cut-on wavelength of 638 nm and then focused into the DAC with a 60 mm focal length achromat (xvii). Light emanating from the chamber passed back through the beamsplitter and was focused with an achromat (xviii) onto a 600 µm diametre fibre optic (xix); then, this light was passed to an Ocean Optics high-resolution HR-4000 spectrometer with H11 Grating (xx). The spectrometer was designed to precisely analyse fluorescence emissions from Ruby particles in the DAC chamber, providing a measurement of the internal chamber pressure through a linear shift in the ruby fluorescence peak (nominally 694.29 nm) [23,24]. The 457 nm laser was used to excite the ruby fluorescence. The fully operational LRS-DAC system can be seen in Figure 2c, while closeups of the DAC chamber are shown in Figure 2d.
Both fine graphite powder, <20 μm in average particle size ( δ ), obtained from NanoX, Richmond, VIC, Australia, and micro-particles of crushed ruby ( ε ) were injected into the chamber with the methanol precursor using a 250 µm diametre needle/syringe. The purpose of the graphite particles was to aid in seeding growth, and the ruby particles provided the aforementioned pressure measurements. The methanol precursor was obtained from Chem Supply Australia PTY LTD, Gillman, SA, Australia, with a purity of >99% ( ζ ).
The carbon nanotube microstructures were examined using a high-resolution Hitachi SU7000 field emission Scanning Electron Microscope (SEM), and all the samples were characterised using a Renishaw InVia confocal Raman spectrometer, with a laser excitation beam waist of ~1 µm, wavelength of 532 nm, and 50× or 100× objectives.

3. Results and Discussion

Multiple LRS-DAC experiments were conducted using pure methanol as the precursor—at pressures of (i) 0.01 GPa (100 bar), (ii) 2.2 GPa (22,000 bar), (iii) 4.0 GPa (40,000 bar), and (iv) 15 GPa (150,000 bar). The first of these experiments, (i), was designed to overlap prior HP-LCVD results to evaluate whether comparable materials could be reproduced. Pressures (ii) and (iii) were chosen because 3–6 GPa is roughly the known threshold for diamond synthesis in HPHT DAC experiments [50,51,52,53], while pressure (iv) was chosen as it lies well above 6 GPa (where additional data is needed).
Below 8W incident laser power, little decomposition was observed for experiments (i)–(iv); for reference, this is 1–2 orders of magnitude higher in laser power than necessary for the comparable HP-LCVD experiments. Higher laser power was required to achieve the same temperature rise, due to the thermal conductivity (and proximity) of the diamond anvils. The laser powers employed for experiments (i), (ii), (iii) and (iv) were 9.0 W, 9.0 W, 14.6 W, and 14.6 W, respectively; these are beam power incidents at the diamond anvils, accounting for optical losses. Note that as the pressure increased and the space between the anvils was compressed, greater heat losses to the diamond anvils were anticipated—hence the increased powers for experiments (iii) and (iv).
For nearly all LRS-DAC samples, a central region was apparent where synthesis was lacking/diminished. As mentioned in prior publications, thermal diffusion may suppress reactions at the hottest region of the laser focus, where small-molecular-mass by-products often concentrate. Thermal diffusion has been observed by other authors during LH-DAC experiments [29]. In this case, molecular hydrogen, -OH groups, water, and other by-products are released during methanol decomposition, and these may accumulate at the centre of the reaction zone. The final result is a displacement of methanol molecules to cooler regions and a lack of deposition at the centre of the laser focus. With an increased concentration of molecular hydrogen, etching may also occur in the central region.
Images of as-grown LRS-DAC samples are shown in Figure 3a–f. Note that in all cases, laser-reactive synthesis occurred within a subset of the LRS-DAC chamber so that significant temperature gradients were present and all growth samples were localised and selective. Due to the lateral temperature gradient, it was anticipated that the samples would not uniformly be a single material phase, but rather rings of multiple phases/allotropes, depending on the local temperature. For this reason, multiple confocal Raman measurements were taken across each sample. In Figure 3a–f, key positions where local Raman spectra were collected are indicated by orange arrows, with a description of their likely allotropes and processing conditions.
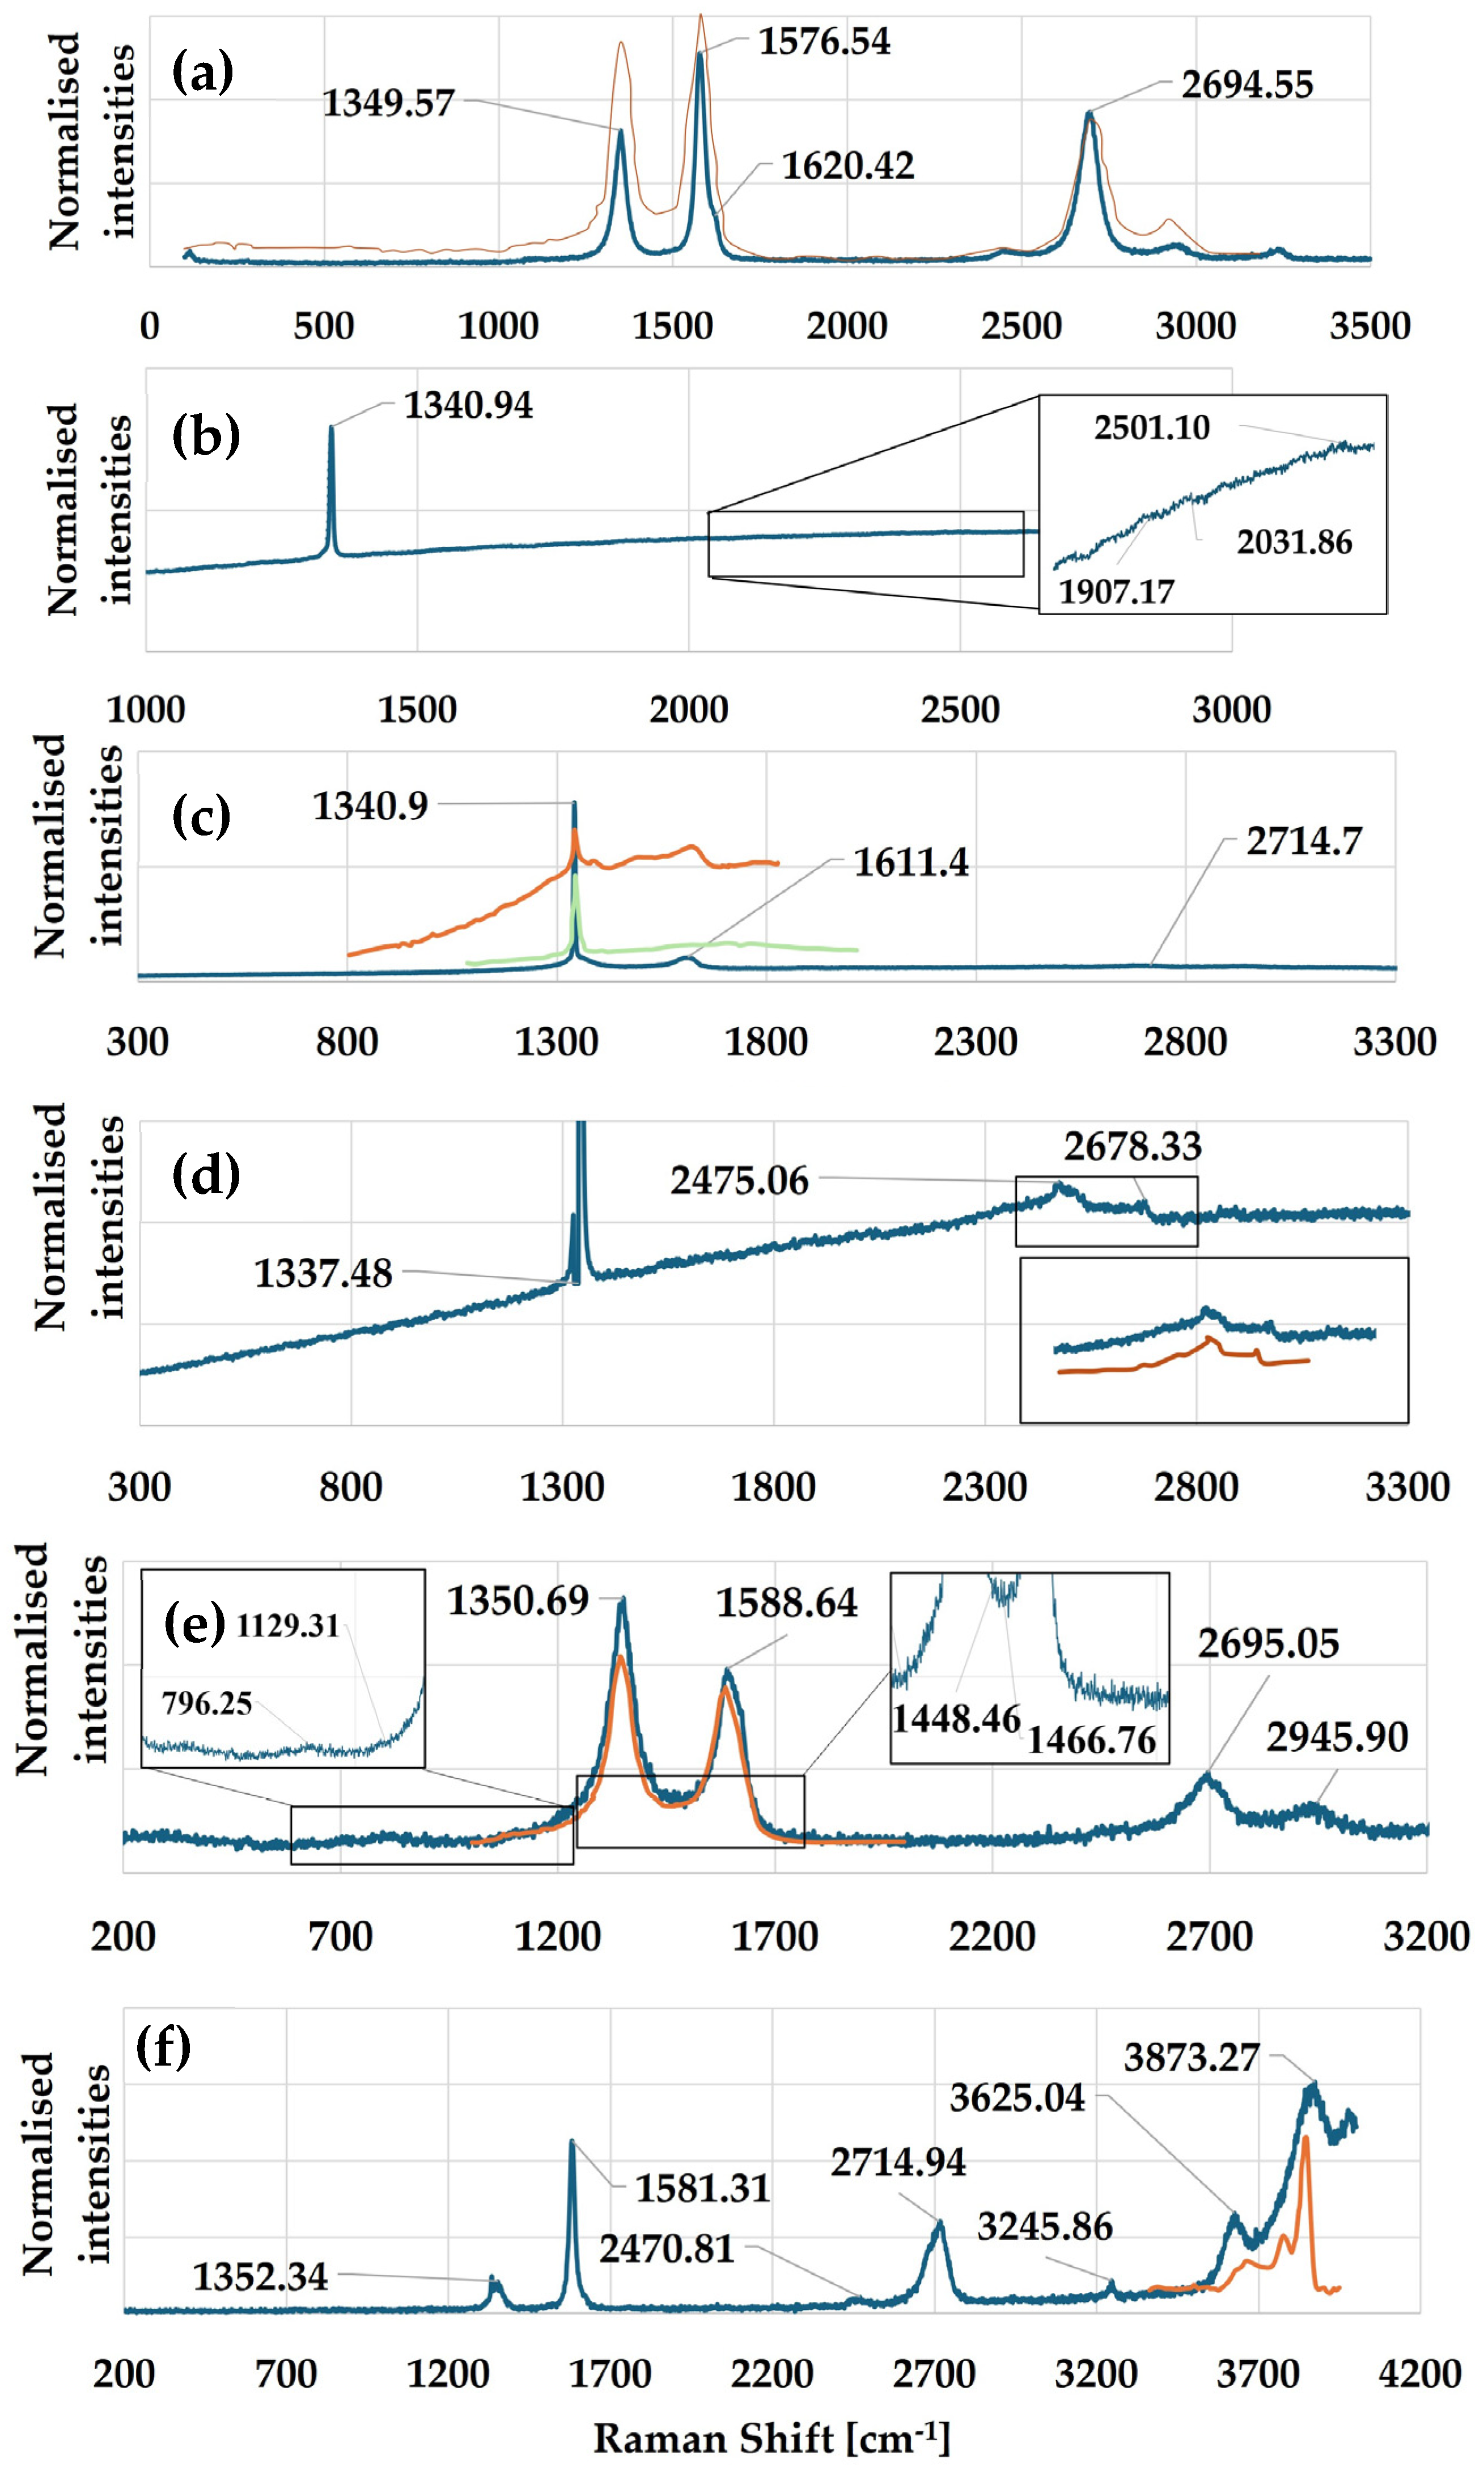
Furthermore, Figure 4a–f displays collected Raman spectra with an excitation source of 532 nm for the locations/allotropes displayed in Figure 3 (blue curves). Where similar spectra for each allotrope were available in the literature, these curves were plotted as well for ready comparison. Each of these major carbon allotropes will be discussed in more detail below.

3.1. Multi-Walled Carbon Nanotubes

Experiment (i) yielded nanoporous diamond deposits similar to those observed in prior HP-LCVD experiments at comparable pressures (~100 bar) [35], along with randomly oriented multi-walled and single-walled carbon nanotubes (MWCNTs and SWCNTs). One HR-SEM example of nanotubes is displayed in Figure 5, where CNTs grew from the DAC’s Inconel compression gasket at a site where the laser beam partially intersected it; the axis of the laser focus was approximately 50 microns from the gasket wall. It appears the methanol precursor etched the gasket slightly, freeing small metallic grains that subsequently catalysed the growth of CNTs. Such catalytic reactions, employing Ni, Cr, or Ni-Cr nanoparticles, represent a common method of depositing nanotubes [54,55,56] and/or graphene in various forms [57,58,59]. Methanol was used as a precursor for nanotubes in this manner [60,61].
The Raman spectrum for the CNTs in experiment (i) is shown in Figure 4a [blue curve]. This spectrum is characteristic of MWCNTs, with a D-peak at ~1350 cm−1 and a strong G-peak at approximately 1577 cm−1. A shoulder around 1620 cm−1 is apparent to the right of the G-peak, while a strong D’-peak—a second-order Raman mode—is located at 2695 cm−1. The G-band shoulder is a high-energy mode that typically appears in MWCNT Raman spectra and is a key feature distinguishing MWCNTs from SWCNTs; it arises from the increased structural disorder and interlayer interactions present in MWCNTs [62,63]. Finally, a Gaussian fit reveals that the full width at half maximum (FWHM) of the D-peak is 38.8 cm−1, aligning with commonly reported ranges for MWCNTs (30–50 cm−1) [64]. Notably, the intensity ratio of ID/IG is 0.64. For comparison, an MWCNT spectrum from the work of Thapliyal et al. is provided in Figure 4a [tan curve] [62].
In addition to the CNT samples of experiment (i), similar instances of carbon nanotube growth occurred in experiment (iv), where the DAC gasket was etched sufficiently to release nanoparticles and induce growth. Generally, CNTs grew outward from the gasket “substrate” and then consolidated into a CNT network. With further heating, the CNTs were coated with other allotropes of carbon (e.g., amorphous phases), ultimately becoming surrounded by a loose carbon matrix. Notably, no nanotubes were grown at the centre of any laser focus, only in cooler regions where catalyst material was available.

3.2. Continuous Diamond Films with Defects

Many of the samples displayed a strong diamond-/D-peak centred at 1342–1344 cm−1, even after subtraction of the calibrated diamond anvil spectrum. One typical example is provided in Figure 4b, from the location of Figure 3b, experiment (ii). This spectrum shows a very strong diamond-/D-peak is centred at 1342–1344 cm−1. There is no significant G-peak apparent in the spectrum or other typical modes of sp3-bonded carbon. Only very minor features are present at 1669, 1907, 2031, and 2501 cm−1. An inset for Figure 4b shows the later features magnified by 2-times. Although a diamond-peak is nominally located at 1332 cm−1, it can be shifted because of temperature, stress, defects, and particle size; these effects, however, all tend to red-shift the wavenumber to below 1332 cm−1 [62]. In Figure 4b, the strong diamond-/D-line is blue-shifted by 10–12 cm−1 above the nominal diamond-peak location. One potential interpretation is that the diamond film is likely under significant residual stresses, which can lead to asymmetric broadening of the diamond-peak. Considering that the FWHM of this peak is 4.8 cm−1, significantly higher than the typical range (~1.5–3 cm−1 for high-quality diamond), this implies residual stresses and structural defects are indeed present in the film.
Additionally, a slightly rising baseline further indicates structural defects in the sample. Some minor alteration of the typical background spectrum may also result from small quantities of residual methanol at the sample sites. In summary, these C-samples appear to be diamond films, with defects and likely residual stresses resulting from the extreme processing pressures and temperature gradients applied during processing.

3.3. Nanocrystalline Diamond

In addition to the diamond films discussed above, two samples exhibited Raman spectra like that of Figure 4c; the displayed spectrum (blue curve) is that of the site indicated in Figure 3c, experiment (ii). As before, there is a strong diamond-/D-peak between 1340 and 1342 cm−1 with an FWHM of ~5 cm−1—even after subtracting the diamond anvil spectrum. In this case, however, a small G-peak is present between 1611 and 1622 cm−1 with an FWHM of 59.26 cm−1. This feature, together with a minor 2D-peak centred around 2674–2715 cm−1, suggests the presence of some sp2-bonding. However, as sp2-modes are 60–100 times more likely to be excited than sp3-modes [65,66], the degree of sp2-bonding in these samples must still be small. For comparison, we have provided two similar spectra of nanocrystalline diamond, one synthesised at temperatures higher than 1000 K via HF-CVD (see green curve) [67], and another processed via HF-CVD at 983.15 K (see orange curve [68]). The Raman spectrum most closely resembling our blue curve in Figure 4c is that of the HF-CVD nanocrystalline diamond sample with grain sizes of 5–250 nm [68]. Given that the sample site in Figure 3c is closer to the laser beam axis, it is expected that the local temperature and temperature gradient would be higher than that of the diamond film in Section 3.2. We submit that the combination of strong temperature gradients combined with extreme pressures naturally leads to more disordered samples.

3.4. Microcrystalline Diamond with Defects

One unusual sample in Figure 3d displayed a strong diamond-/D-peak at 1342.49 cm−1 (after subtraction of the diamond anvil signal) with an FWHM of about 4.7 cm−1. Please refer to the spectrum in Figure 4d. No significant G-peak was present, but small features were observed at 2475 cm−1 and at 2678 cm−1; presumably, these are the D+D’-peak and 2D-peak, respectively. These minor features can be attributed to second-order Raman scattering processes associated with specific defect centres in diamond [69]. That said, examples of similar spectra are few in the literature. The spectrum which most closely matches that of Figure 4d, including the minor features in the inset, is the work of Chau and Andersen, who created diamond micro-powders within a DAC via a reaction between ferrous chloride (FeCl2), water, and the diamond anvil surfaces. The result was fine-grained defected diamond, some graphite, methane, and hydrogen [70]. For comparison, a Raman spectrum obtain by Chau and Anderson is shown in the inset of Figure 4d [orange curve]. It is surmised that the material at site (d) in Figure 3 is a powdered form of diamond of micro-scale grain size. This portion of the sample is more optically dense than other regions, has a thicker deposit, and is adjacent to the laser beam axis, where strong temperature gradients would be present.
Similar to the samples of Section 3.2, the Raman background exhibited fluorescence and a positive slope, likely indicating hydrogenation of the deposit. Using Casiraghi’s method [71], we derived a hydrogen content of 30.8% for this diamond powder material.

3.5. Amorphous Carbon

Near the periphery of experiment (iv), one Raman spectrum was obtained indicating the presence of amorphous carbon (see spectrum in Figure 4e and its location in Figure 3e). A very strong D-peak was present between 1342 and 1350 cm−1, together with a G-peak centred at 1589 cm−1. The D-peak had an FWHM of 74.65 cm−1, while the G-peak had an FWHM of 68.54 cm−1. The ratio of ID/IG was 1.35, reflecting a high degree of disorder with predominantly sp2-content. The spectrum also had a strong 2D-peak at 2696 cm−1, as well as a moderate D+G-peak at 2930 cm−1. Overall, this is a classic spectrum for sp2-bonded amorphous carbon (a-C). For comparison, the Raman Spectrum of a-C obtained by Dychalska et al. is provided as the orange curve in Figure 4e [72].
With all this said, noticeable peaks were also present at 825, 1130, and between 1450 and 1460 cm−1, which intimates the presence of some sp3-bonding; these features are usually associated with amorphous or nanocrystalline diamond. Intriguingly, the amorphous carbon was located at the edge of the growth zone, where temperatures were the lowest. This is consistent with Bloch et al. [73], as amorphous materials are usually grown at low temperatures and high pressures in deposition processes. The sample in Figure 3e is a useful case for showing that this trend is also present at LRS-DAC pressures.
Another unusual Raman spectrum was obtained near the periphery of sample (iii)—see Figure 4f. Please refer to Figure 3f for an image of its location. Key features of the spectrum were a small but broad D-peak between 1349 and 1354 cm−1, a sharp G-peak centred at 1581 cm−1, and a strong 2D-peak at 2715 cm−1. These indicate the presence of sp2-bonded carbon rings (e.g., graphene or benzene rings), but with significant disorder in the sample. A minor D+D’-peak also occured at 2470 cm−1.
Most importantly, however, the spectrum also contains three very strong peaks beyond 3000 cm−1, at approximately 3246, 3625, and 3873 cm−1. The latter two peaks are even stronger than the G-peak. These are clearly very energetic modes that were excited outside of the usual high wavenumber C-H modes, e.g., the C-H stretching mode in methyl groups (2932 cm−1)or the C-H stretching mode of the imidazolium ring (3118 and 3136 cm−1). Through a detailed search of potential sources, many potential by-products were eliminated, including methane, acetylene, ethane, molecular hydrogen, water, 2-butanol, 2,3-butanediol, 1,1-diethoxyethane, and various carbonyl compounds. Indeed, it was shown that when certain alcohols, e.g., ethanol, are compressed and heated, hydrogen evolves at the lowest pressures, but at higher pressures (0.5–1.5 GPa), it will form more complex molecules, such as those listed above [74]. However, none of these compounds show comparable features in their Raman spectra beyond 3200 cm−1.
That said, the O-H stretching vibration, where hydrogen bonding is also present, typically occurs between 3200 and 3700 cm−1 [75,76,77]. While in the absence of hydrogen bonding, or where there are only weak interactions, this stretching mode shifts beyond 3700 cm−1 and often to near 3800 cm−1 [78]. For comparison, one vibrational Raman spectrum for hydroxyl groups similar to ours is displayed in Figure 4f [orange curve].
Furthermore, certain materials/compounds with carbon rings and bonded -OH groups, such as hydroxylated graphene (G-OH), catechol, and polycatechol, show some features similar to our spectra in Figure 3f [79,80]; however, they are not exact matches. Given the combined spectrum, indicative of carbon rings as well as modified O-H stretching vibrations, we suggest that either (1) both hydroxyl ions and graphene rings are present within the characterised region (and likely interacting), or (2) unidentified compound(s) were synthesised, which comprise both carbon rings and -OH groups. Further experimental work will be needed to determine the exact source of these spectral lines. To our knowledge, this is the first time this particular Raman spectrum has been reported from high-pressure experiments of any kind.

4. Conclusions

In summary, we investigated laser reactive synthesis at pressures well beyond the critical point of methanol via an LRS-DAC system, where samples were subjected to localised and selective laser processing. Results show that experiments at comparable pressures (40–100 bar) attained multi-walled and single-walled carbon nanotube deposits similar to those found in prior HP-LCVD experiments. Many deposits of diamond were obtained in different morphologies depending on the temperature, including diamond films, nanocrystalline diamond, and microcrystalline diamond powders. Similarly, amorphous carbon was successfully grown at a pressure of 15 GPa at the edge of the reaction zone, where temperatures are the lowest. Finally, the potential synthesis of an unknown compound with carbon rings and O-H stretching was presented. The investigation of pressurised methanol deepens our understanding of the influence of pressure and laser power in forming various carbon allotropes.

Author Contributions

Conceptualisation, M.E.A. and J.L.M.; methodology, M.E.A.; validation, M.E.A. and J.L.M.; formal analysis, M.E.A.; investigation, M.E.A.; data curation, M.E.A.; writing—original draft preparation, M.E.A.; writing—review and editing, M.E.A. and J.L.M.; visualisation, M.E.A.; supervision, J.L.M.; project administration, J.L.M. All authors have read and agreed to the published version of the manuscript.

Funding

This work was supported by a La Trobe University Full Fee Research Scholarship and a Graduate Research Scholarship. This research received no external funding.

Data Availability Statement

The original contributions presented in this study are included in the article. Further inquiries can be directed to the corresponding author(s).

Acknowledgments

The authors wish to thank the La Trobe University Bioimaging Platform, Kristian Caracciolo, for microscopy support. This work was also conducted in part at the Materials Characterisation and Fabrication Platform (MCFP) of the University of Melbourne and the Victorian Node of the Australian National Fabrication Facility (ANFF), and we thank Anders Barlow for Raman spectroscopy support.

Conflicts of Interest

Author James L. Maxwell was at La Trobe University with oversight of the experimental work, but has since moved to the company Maxwell Laboratories PTY LTD. All authors declare that this research was conducted in the absence of any commercial or financial relationships that could be construed as a potential conflict of interest.

References

  1. Sorb, Y.A.; Bundy, F.P.; DeVries, R.C. Diamond: High-Pressure Synthesis. In Reference Module in Materials Science and Materials Engineering; Elsevier: Amsterdam, The Netherlands, 2016. [Google Scholar]
  2. Bassett, W.A. Diamond anvil cell, 50th birthday. High Press. Res. 2009, 29, 163–186. [Google Scholar] [CrossRef]
  3. Berrada, M.; Hu, G.; Zhou, D.; Wang, S.; Nguyen, P.Q.H.; Zhang, D.; Prakapenka, V.; Chariton, S.; Chen, B.; Li, J.; et al. Detection of thin film phase transformations at high-pressure and high-temperature in a diamond anvil cell. Commun. Earth Environ. 2024, 5, 73. [Google Scholar] [CrossRef]
  4. Yang, Y.; Yuan, M.; Qian, C.; Li, C.; Yang, Y.; Du, X.; Dong, H.; Chen, B. Disordering of graphene nanoplatelet, carbon nanotube and C60 fullerene under shear stress. Carbon 2025, 232, 119802. [Google Scholar] [CrossRef]
  5. Geballe, Z.M.; Lai, J.; Walter, M.J. A broadband pulse amplifier for Joule heating experiments in diamond anvil cells. Rev. Sci. Instrum. 2024, 95, 053902. [Google Scholar] [CrossRef]
  6. Anzellini, S.; Boccato, S. A Practical Review of the Laser-Heated Diamond Anvil Cell for University Laboratories and Synchrotron Applications. Crystals 2020, 10, 459. [Google Scholar] [CrossRef]
  7. Bassett, W.A. The birth and development of laser heating in diamond anvil cells. Rev. Sci. Instrum. 2001, 72, 1270–1272. [Google Scholar] [CrossRef]
  8. Alabdulkarim, M.E.; Maxwell, W.D.; Thapliyal, V.; Maxwell, J.L. A Comprehensive Review of High-Pressure Laser-Induced Materials Processing, Part I: Laser-Heated Diamond Anvil Cells. J. Manuf. Mater. Process. 2022, 6, 111. [Google Scholar] [CrossRef]
  9. Yusa, H.; Takemura, K.; Matsui, Y.; Morishima, H.; Watanabe, K.; Yamawaki, H.; Aoki, K. Direct transformation of graphite to cubic diamond observed in a laser-heated diamond anvil cell. Appl. Phys. Lett. 1998, 72, 1843–1845. [Google Scholar] [CrossRef]
  10. Wei, B.; Lin, L.; Zhang, J.; Zhan, Z.; Cheng, Z.; Jiang, J. In Situ Measurement Techniques Using Diamond Anvil Cell at High Pressure–Temperature Conditions: A Review. Phys. Status Solidi (RRL) Rapid Res. Lett. 2024, 18, 2300469. [Google Scholar] [CrossRef]
  11. Utsumi, W.; Yamakata, M.; Yagi, T.; Shimomura, O. In situ X-ray diffraction study of the phase transition from graphite to hexagonal diamond under high pressures and high temperatures. AIP Conf. Proc. 1994, 309, 535–538. [Google Scholar] [CrossRef]
  12. Li, Y.; Jia, X.; Lin, Y.; Liu, J.; He, D.; Lei, L. LHDAC synthesis of nanopolycrystalline diamond from nano-flake-like graphite. Diam. Relat. Mater. 2025, 152, 111899. [Google Scholar] [CrossRef]
  13. Alabdulkarim, M.E.; Maxwell, W.D.; Thapliyal, V.; Maxwell, J.L. A Comprehensive Review of High-Pressure Laser-Induced Materials Processing, Part III: Laser Reactive Synthesis within Diamond Anvil Cells. J. Manuf. Mater. Process. 2023, 7, 57. [Google Scholar] [CrossRef]
  14. Zhou, D.; Semenok, D.V.; Duan, D.; Xie, H.; Chen, W.; Huang, X.; Li, X.; Liu, B.; Oganov, A.R.; Cui, T. Superconducting praseodymium superhydrides. Sci. Adv. 2020, 6, eaax6849. [Google Scholar] [CrossRef]
  15. Ma, L.; Zhou, M.; Wang, Y.; Kawaguchi, S.; Ohishi, Y.; Peng, F.; Liu, H.; Liu, G.; Wang, H.; Ma, Y. Experimental clathrate superhydrides EuH6 and EuH9 at extreme pressure conditions. Phys. Rev. Res. 2021, 3, 043107. [Google Scholar] [CrossRef]
  16. Struzhkin, V.V.; Mao, H.-K. Magnetic methods in studies of new superconducting hydrides in a diamond anvil cell. Natl. Sci. Rev. 2024, 11, nwae005. [Google Scholar] [CrossRef]
  17. Arpita Aparajita, A.N.; Sanjay Kumar, N.R.; Chandra, S.; Amirthapandian, S.; Shekar, N.V.C.; Sridhar, K. High-Pressure Synthesis of Manganese Monocarbide: A Potential Superhard Material. Inorg. Chem. 2018, 57, 14178–14185. [Google Scholar] [CrossRef] [PubMed]
  18. Juarez-Arellano, E.A.; Winkler, B.; Friedrich, A.; Wilson, D.J.; Koch-Müller, M.; Knorr, K.; Vogel, S.C.; Wall, J.J.; Reiche, H.; Crichton, W.; et al. Reaction of rhenium and carbon at high pressures and temperatures. Z. Kristallogr.-Cryst. Mater. 2008, 223, 492–501. [Google Scholar] [CrossRef]
  19. Bhadram, V.S.; Kim, D.Y.; Strobel, T.A. High-Pressure Synthesis and Characterization of Incompressible Titanium Pernitride. Chem. Mater. 2016, 28, 1616–1620. [Google Scholar] [CrossRef]
  20. Zerr, A.; Miehe, G.; Serghiou, G.; Schwarz, M.; Kroke, E.; Riedel, R.; Fueß, H.; Kroll, P.; Boehler, R. Synthesis of cubic silicon nitride. Nature 1999, 400, 340–342. [Google Scholar] [CrossRef]
  21. Zerr, A.; Miehe, G.; Riedel, R. Synthesis of cubic zirconium and hafnium nitride having Th3P4 structure. Nat. Mater. 2003, 2, 185–189. [Google Scholar] [CrossRef]
  22. Ceppatelli, M.; Serrano-Ruiz, M.; Morana, M.; Dziubek, K.; Scelta, D.; Garbarino, G.; Poręba, T.; Mezouar, M.; Bini, R.; Peruzzini, M. High-pressure and high-temperature synthesis of crystalline Sb3N5. Angew. Chem. 2024, 136, e202319278. [Google Scholar] [CrossRef]
  23. Ibragimova, O.; Vaquero, L.; Hussein, Z.; Drozd, V.; Chariton, S.; Prakapenka, V.; Chuvashova, I. The synthesis of novel lanthanum hydroxyborate at extreme conditions. Front. Chem. 2023, 11, 1259000. [Google Scholar] [CrossRef]
  24. Dewaele, A.; Worth, N.; Pickard, C.J.; Needs, R.J.; Pascarelli, S.; Mathon, O.; Mezouar, M.; Irifune, T. Synthesis and stability of xenon oxides Xe2O5 and Xe3O2 under pressure. Nat. Chem. 2016, 8, 784–790. [Google Scholar] [CrossRef]
  25. Liu, J.; Sun, Y.; Lv, C.; Zhang, F.; Fu, S.; Prakapenka, V.B.; Wang, C.; Ho, K.; Lin, J.; Wentzcovitch, R.M. Iron-rich Fe–O compounds at Earth’s core pressures. Innovation 2023, 4, 100354. [Google Scholar] [CrossRef]
  26. Oka, K.; Mako, I.; Yoshiyuki, O.; Hirose, K. Leveraging oxide reactive sputtering for thermal insulation in laser-heated diamond anvil cell. High Press. Res. 2024, 44, 159–167. [Google Scholar] [CrossRef]
  27. Tamerius, A.D.; Clarke, S.M.; Gu, M.; Walsh, J.P.S.; Esters, M.; Meng, Y.; Hendon, C.H.; Rondinelli, J.M.; Jacobsen, S.D.; Freedman, D.E. Discovery of Cu3Pb. Angew. Chem. Int. Ed. 2018, 57, 12809–12813. [Google Scholar] [CrossRef] [PubMed]
  28. Walsh, J.P.S.; Freedman, D.E. High-Pressure Synthesis: A New Frontier in the Search for Next-Generation Intermetallic Compounds. Acc. Chem. Res. 2018, 51, 1315–1323. [Google Scholar] [CrossRef]
  29. Hussein, Z.; Kazemiasl, N.; Hussaini, K.; Vaquero, L.; Barkova, O.; Drozd, V.; Chariton, S.; Prakapenka, V.; Chuvashova, I. High-pressure high-temperature synthesis of NdRe2. Front. Chem. 2024, 12, 1259032. [Google Scholar] [CrossRef]
  30. Park, S.; Abate, I.I.; Liu, J.; Wang, C.; Dahl, J.E.P.; Carlson, R.M.K.; Yang, L.; Prakapenka, V.B.; Greenberg, E.; Devereaux, T.P.; et al. Facile diamond synthesis from lower diamondoids. Sci. Adv. 2020, 6, eaay9405. [Google Scholar] [CrossRef]
  31. Zeng, Z.; Yang, L.; Zeng, Q.; Lou, H.; Sheng, H.; Wen, J.; Miller, D.J.; Meng, Y.; Yang, W.; Mao, W.L.; et al. Synthesis of quenchable amorphous diamond. Nat. Commun. 2017, 8, 322. [Google Scholar] [CrossRef]
  32. Saha, P.; Mukherjee, G.D. Temperature measurement in double-sided laser-heated diamond anvil cell and reaction of carbon. Indian J. Phys. 2021, 95, 621–628. [Google Scholar] [CrossRef]
  33. Maxwell, J.L.; Boman, M.; Springer, R.W.; Nobile, A.; DeFriend, K.; Espada, L.; Sandstrom, M.; Kommireddy, D.; Pegna, J.; Goodin, D. Process–Structure Map for Diamond-Like Carbon Fibers from Ethene at Hyperbaric Pressures. Adv. Funct. Mater. 2005, 15, 1077–1087. [Google Scholar] [CrossRef]
  34. Thapliyal, V.; Alabdulkarim, M.E.; Maxwell, J.L. Sustainable laser-induced synthesis of diamond-like-carbon and helical carbon allotropes from hyperbaric ethanol-water mixtures to 18 bar. Diam. Relat. Mater. 2025, 152, 111956. [Google Scholar] [CrossRef]
  35. Alabdulkarim, M.E.; Thapliyal, V.; Maxwell, J.L. Sustainable Synthesis of Diamond-like Carbon and Giant Carbon Allotropes from Hyperbaric Methanol–Water Mixtures Through the Critical Point. J. Manuf. Mater. Process. 2024, 8, 286. [Google Scholar] [CrossRef]
  36. Hiramatsu, M.; Noda, H.; Nagai, H.; Shimakura, M.; Nawata, M. Diamond deposition from methanol–hydrogen–water mixed gas using a low pressure, radio frequency, inductively-coupled plasma. Thin Solid Film. 1998, 332, 136–140. [Google Scholar] [CrossRef]
  37. Matsushima, Y.; Naganuma, M.; Yamazaki, T.; Maeda, K.; Suzuki, T. Diamond synthesis under atmospheric pressure from ethanol-water solution using hot-filament chemical vapor deposition method assisted by electrospray. J. Appl. Phys. 2005, 98, 114902. [Google Scholar] [CrossRef]
  38. Simakov, S.K. Metastable nanosized diamond formation from a C−H−O fluid system. J. Mater. Res. 2010, 25, 2336–2340. [Google Scholar] [CrossRef]
  39. Ota, N.; Fujimori, N.; Watanabe, K. Laser CVD Method for Synthesizing Diamond. U.S. Patent 5,387,443, 7 February 1995. [Google Scholar]
  40. Fomin, Y.D.; Dzhavadov, L.N.; Tsiok, E.N.; Ryzhov, V.N.; Brazhkin, V.V. The thermodynamics of pressurized methanol: A simple hydrogen-bonded liquid as a touchstone for experiment and computer simulations. J. Chem. Phys. 2022, 157, 124503. [Google Scholar] [CrossRef]
  41. Yang, L.; Jiang, C.; Guo, S.; Zhang, L.; Gao, J.; Peng, J.; Hu, T.; Wang, L. Novel Diamond Films Synthesis Strategy: Methanol and Argon Atmosphere by Microwave Plasma CVD Method Without Hydrogen. Nanoscale Res. Lett. 2016, 11, 415. [Google Scholar] [CrossRef]
  42. Tominaga, Y.; Uchida, A.; Hunge, Y.M.; Shitanda, I.; Itagaki, M.; Kondo, T.; Yuasa, M.; Uestuska, H.; Terashima, C. Enhanced growth rates of N-type phosphorus-doped polycrystalline diamond via in-liquid microwave plasma CVD. Solid State Sci. 2024, 155, 107650. [Google Scholar] [CrossRef]
  43. Riaz, B.; Thi, W.-F.; Machida, M.N. First observations of warm and cold methanol in Class 0/I proto-brown dwarfs. Mon. Not. R. Astron. Soc. 2023, 522, 4934–4954. [Google Scholar] [CrossRef]
  44. Dorokhov, Y.L.; Sheshukova, E.V.; Komarova, T.V. Methanol in Plant Life. Front. Plant Sci. 2018, 9, 1623. [Google Scholar] [CrossRef] [PubMed]
  45. Heikes, B.G.; Chang, W.; Pilson, M.E.Q.; Swift, E.; Singh, H.B.; Guenther, A.; Jacob, D.J.; Field, B.D.; Fall, R.; Riemer, D.; et al. Atmospheric methanol budget and ocean implication. Glob. Biogeochem. Cycles 2002, 16, 80-1–80-13. [Google Scholar] [CrossRef]
  46. Shin, K.; Udachin, K.A.; Moudrakovski, I.L.; Leek, D.M.; Alavi, S.; Ratcliffe, C.I.; Ripmeester, J.A. Methanol incorporation in clathrate hydrates and the implications for oil and gas pipeline flow assurance and icy planetary bodies. Proc. Natl. Acad. Sci. USA 2013, 110, 8437–8442. [Google Scholar] [CrossRef] [PubMed]
  47. Bernal, J.J.; Sephus, C.D.; Ziurys, L.M. Methanol at the Edge of the Galaxy: New Observations to Constrain the Galactic Habitable Zone. Astrophys. J. 2021, 922, 106. [Google Scholar] [CrossRef]
  48. Deschamps, F.; Mousis, O.; Sanchez-Valle, C.; Lunine, J.I. The Role of Methanol in the Crystallisation of Titan’s Primordial Ocean. Astrophys. J. 2010, 724, 887. [Google Scholar] [CrossRef]
  49. Hodyss, R.; Parkinson, C.D.; Johnson, P.V.; Stern, J.V.; Goguen, J.D.; Yung, Y.L.; Kanik, I. Methanol on Enceladus. Geophys. Res. Lett. 2009, 36, L17103. [Google Scholar] [CrossRef]
  50. Ghiringhelli, L.M.; Valeriani, C.; Los, J.H.; Meijer, E.J.; Fasolino, A.; Frenkel, D. State-of-the-art models for the phase diagram of carbon and diamond nucleation. Mol. Phys. 2008, 106, 2011–2038. [Google Scholar] [CrossRef]
  51. Yafei, Z.; Fangqing, Z.; Guanghua, C. A study of phase transformation between diamond and graphite in P-T diagram of carbon. Carbon 1994, 32, 1415–1418. [Google Scholar] [CrossRef]
  52. Zhou, S.; Zang, C.; Ma, H.; Li, X.; Zhang, H.; Jia, X. Study on growth of coarse grains of diamond with high quality under HPHT. Chin. Sci. Bull. 2009, 54, 163–167. [Google Scholar] [CrossRef]
  53. D’Haenens-Johansson, U.F.S.; Butler, J.E.; Katrusha, A.N. Synthesis of Diamonds and Their Identification. Rev. Mineral. Geochem. 2022, 88, 689–753. [Google Scholar] [CrossRef]
  54. Tessonnier, J.-P.; Su, D.S. Recent Progress on the Growth Mechanism of Carbon Nanotubes: A Review. ChemSusChem 2011, 4, 824–847. [Google Scholar] [CrossRef]
  55. Abdisaidov, I.J.; Gulomjanova, S.G.; Khudaykulov, I.K.; Ashurov, K.B. The Low-Temperature Growth of Carbon Nanotubes Using Nickel Catalyst. East Eur. J. Phys. 2024, 3, 355–358. [Google Scholar] [CrossRef]
  56. Li, Y.; Cui, R.; Ding, L.; Liu, Y.; Zhou, W.; Zhang, Y.; Jin, Z.; Peng, F.; Liu, J. How Catalysts Affect the Growth of Single-Walled Carbon Nanotubes on Substrates. Adv. Mater. 2010, 22, 1508–1515. [Google Scholar] [CrossRef] [PubMed]
  57. Bleu, Y.; Bourquard, F.; Michalon, J.-Y.; Lefkir, Y.; Reynaud, S.; Loir, A.-S.; Barnier, V.; Garrelie, F.; Donnet, C. Transfer-free graphene synthesis by nickel catalyst dewetting using rapid thermal annealing. Appl. Surf. Sci. 2021, 555, 149492. [Google Scholar] [CrossRef]
  58. Zang, X.; Zhou, Q.; Chang, J.; Teh, K.S.; Wei, M.; Zettl, A.; Lin, L. Synthesis of Single-Layer Graphene on Nickel Using a Droplet CVD Process. Adv. Mater. Interfaces 2017, 4, 1600783. [Google Scholar] [CrossRef]
  59. Chernyak, S.A.; Kustov, A.L.; Stolbov, D.N.; Tedeeva, M.A.; Isaikina, O.Y.; Maslakov, K.I.; Usol’tseva, N.V.; Savilov, S.V. Chromium catalysts supported on carbon nanotubes and graphene nanoflakes for CO2-assisted oxidative dehydrogenation of propane. Appl. Surf. Sci. 2022, 578, 152099. [Google Scholar] [CrossRef]
  60. Abdulrazzak, F.; Abbas, A.; Hussein, F. Synthesis of few-wall carbon nanotubes using methanol/propanol mixture by chemical vapour deposition. Front. Nanosci. Nanotechnol. 2017, 3, 1–7. [Google Scholar] [CrossRef]
  61. Zhang, Y.; Gamo, M.N.; Nakagawa, K.; Ando, T. Synthesis of aligned carbon nanotubes in organic liquids. J. Mater. Res. 2002, 17, 2457–2464. [Google Scholar] [CrossRef]
  62. Thapliyal, V.; Alabdulkarim, M.E.; Whelan, D.R.; Mainali, B.; Maxwell, J.L. A concise review of the Raman spectra of carbon allotropes. Diam. Relat. Mater. 2022, 127, 109180. [Google Scholar] [CrossRef]
  63. Botti, S.; Rufoloni, A.; Rindzevicius, T.; Schmidt, M.S. Surface-Enhanced Raman Spectroscopy Characterization of Pristine and Functionalized Carbon Nanotubes and Graphene. In Raman Spectroscopy; Do Nascimento, G.M., Ed.; IntechOpen: Rijeka, Croatia, 2018. [Google Scholar]
  64. Li, Z.; Deng, L.; Kinloch, I.A.; Young, R.J. Raman spectroscopy of carbon materials and their composites: Graphene, nanotubes and fibres. Prog. Mater. Sci. 2023, 135, 101089. [Google Scholar] [CrossRef]
  65. Ivanova, M.; Lamprecht, C.; Loureiro, M.; Huzil, J.; Foldvari, M. Pharmaceutical characterization of solid and dispersed carbon nanotubes as nanoexcipients. Int. J. Nanomed. 2012, 7, 403–415. [Google Scholar] [CrossRef]
  66. Ferrari, A.; Robertson, J. Interpretation of Raman spectra of disordered and amorphous carbon. Phys. Rev. B Condens. Matter Mater. Phys. 2000, 61, 14095–14107. [Google Scholar] [CrossRef]
  67. Fortunato, W.; Chiquito, A.J.; Galzerani, J.C.; Moro, J.R. Crystalline quality and phase purity of CVD diamond films studied by Raman spectroscopy. J. Mater. Sci. 2007, 42, 7331–7336. [Google Scholar] [CrossRef]
  68. Klauser, F.; Steinmüller-Nethl, D.; Kaindl, R.; Bertel, E.; Memmel, N. Raman Studies of Nano- and Ultra-nanocrystalline Diamond Films Grown by Hot-Filament CVD. Chem. Vap. Depos. 2010, 16, 127–135. [Google Scholar] [CrossRef]
  69. Prawer, S.; Nemanich, R.J. Raman spectroscopy of diamond and doped diamond. Philos. Trans. R. Soc. Lond. Ser. A Math. Phys. Eng. Sci. 2004, 362, 2537–2565. [Google Scholar] [CrossRef] [PubMed]
  70. Chou, I.M.; Anderson, A.J. Diamond dissolution and the production of methane and other carbon-bearing species in hydrothermal diamond-anvil cells. Geochim. Cosmochim. Acta 2009, 73, 6360–6366. [Google Scholar] [CrossRef]
  71. Casiraghi, C.; Ferrari, A.C.; Robertson, J. Raman spectroscopy of hydrogenated amorphous carbons. Phys. Rev. B 2005, 72, 085401. [Google Scholar] [CrossRef]
  72. Dychalska, A.; Popielarski, P.; Franków, W.; Fabisiak, K.; Paprocki, K.; Szybowicz, M. Study of CVD diamond layers with amorphous carbon admixture by Raman scattering spectroscopy. Mater. Sci.-Pol. 2015, 33, 799–805. [Google Scholar] [CrossRef]
  73. Bloch, J.; Zeiri, Y.; Lucchese, R.R. A theoretical study of laser-induced chemical vapor deposition. Surf. Sci. 1991, 257, 402–416. [Google Scholar] [CrossRef]
  74. Ceppatelli, M.; Fanetti, S.; Citroni, M.; Bini, R. Photoinduced Reactivity of Liquid Ethanol at High Pressure. J. Phys. Chem. B 2010, 114, 15437–15444. [Google Scholar] [CrossRef] [PubMed]
  75. Zhou, M.; Wang, K.; Men, Z.; Gao, S.; Li, Z.; Sun, C. Study of high-pressure Raman intensity behavior of aromatic hydrocarbons: Benzene, biphenyl and naphthalene. Spectrochim. Acta Part A Mol. Biomol. Spectrosc. 2012, 97, 526–531. [Google Scholar] [CrossRef]
  76. Sun, Q. The Raman OH stretching bands of liquid water. Vib. Spectrosc. 2009, 51, 213–217. [Google Scholar] [CrossRef]
  77. Wu, J.-B.; Lin, M.-L.; Cong, X.; Liu, H.-N.; Tan, P.-H. Raman spectroscopy of graphene-based materials and its applications in related devices. Chem. Soc. Rev. 2018, 47, 1822–1873. [Google Scholar] [CrossRef] [PubMed]
  78. Yang, M.; Han, L.; Xu, Y.; Ke, H.; Zhou, N.; Dong, H.; Liu, S.; Qiao, G. Near Infrared Spectroscopic Study of Trioctahedral Chlorites and Its Remote Sensing Application. Open Geosci. 2019, 11, 815–828. [Google Scholar] [CrossRef]
  79. Jha, P.K.; Halada, G.P. The catalytic role of uranyl in formation of polycatechol complexes. Chem. Cent. J. 2011, 5, 12. [Google Scholar] [CrossRef]
  80. Sun, J.; Deng, Y.; Li, J.; Wang, G.; He, P.; Tian, S.; Bu, X.; Di, Z.; Yang, S.; Ding, G.; et al. A New Graphene Derivative: Hydroxylated Graphene with Excellent Biocompatibility. ACS Appl. Mater. Interfaces 2016, 8, 10226–10233. [Google Scholar] [CrossRef]
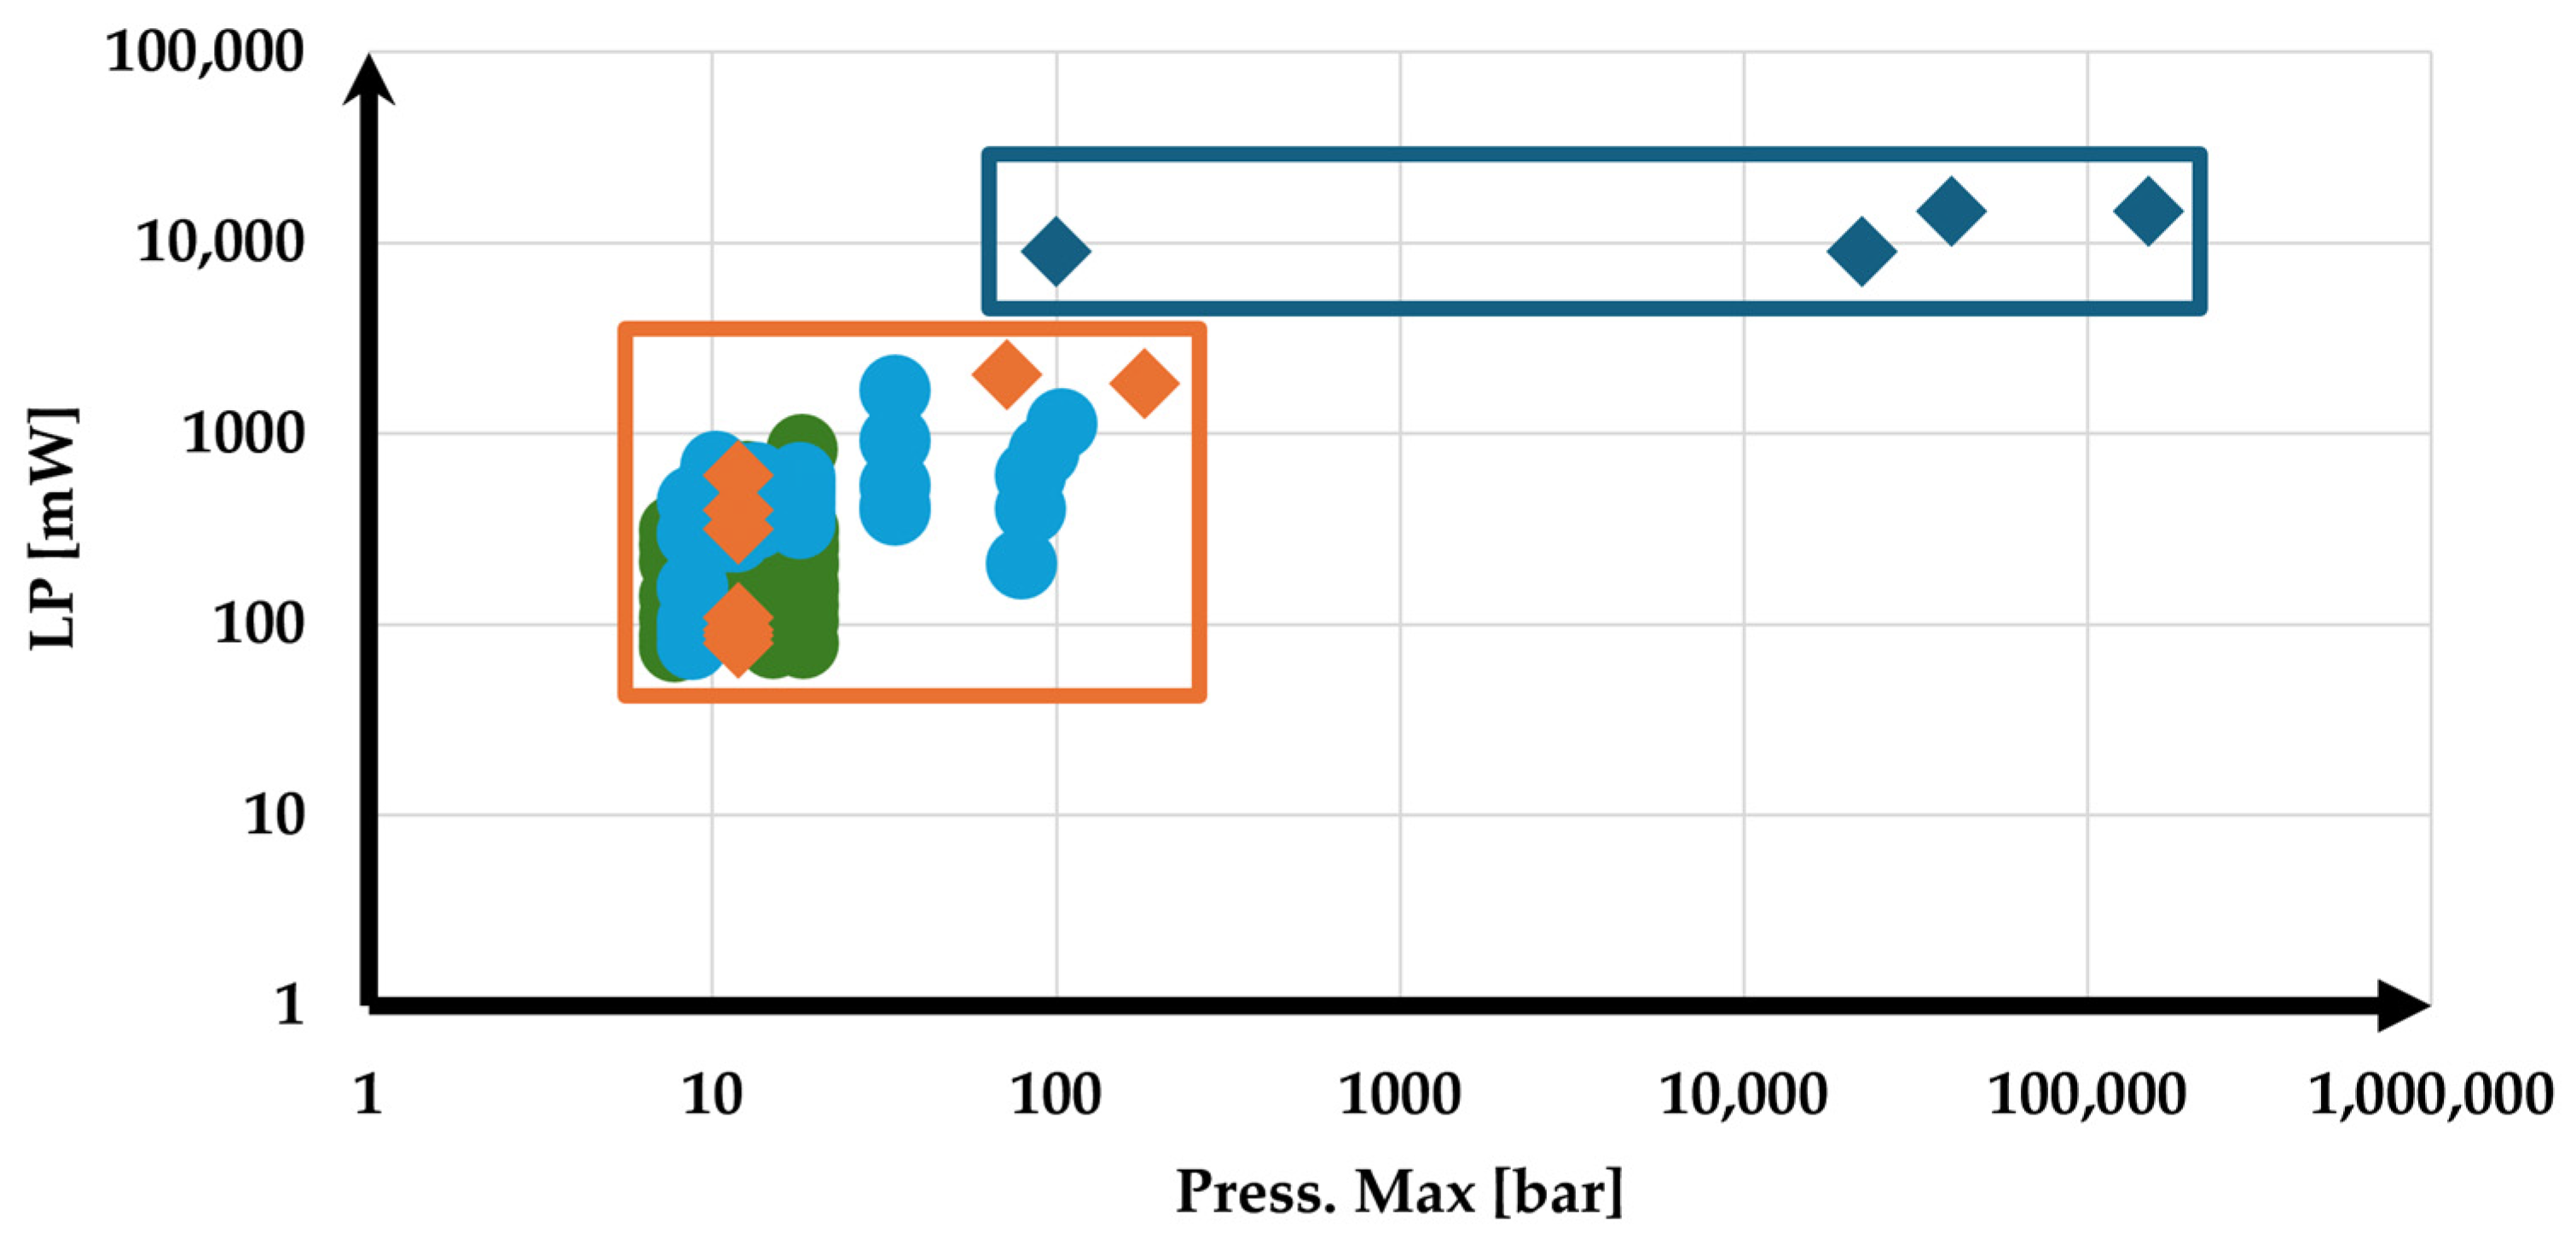
Figure 1. Investigated pressure/temperature regimes; LRS-DAC experiments ( blue box: current work); orange box: previous works via HP-LCVD, where () is pure methanol, () is the methanol and water mixture, and () is the ethanol and water mixture.
Crystals 15 00292 g001
Figure 2. Typical LRS-DAC apparatus; (a) DAC chamber with illustration inset; (b) schematic diagram of LRS-DAC; (c,d) the operational LRS-DAC system with two closeups of the DAC chamber under 9 and 14.6 W.
Crystals 15 00292 g002
Figure 3. Optical/SEM images of samples with unique allotropes, indicated by the orange arrows and characterised by Raman Spectroscopy: (a) growth of CNTs on the side of the Inconel gasket, where the methanol was pressurised to 0.01 GPa and the incident laser power was 9.0 W [experiment (i)]; (b) microcrystalline diamond with defects, produced at 2.2 GPa and 9.0 W [experiment (ii)]; (c) an alternate location in experiment (ii), where nanocrystalline diamond was obtained; (d) another location were microcrystalline diamond with defects was obtained, at pressures of 4 GPa and laser power of 14.6 W [experiment (iii)]; (e) site with predominantly amorphous carbon, with processing conditions of 15 GPa and 14.6 W [experiment (iv)]; (f) location where unknown Raman signatures were obtained at a different site in experiment (iii), presumably from compounds containing hydroxyl groups. This location is somewhat removed from the centre of the laser focus, where the temperature would have been much lower.
Crystals 15 00292 g003
Figure 4. Raman spectra of variouscarbon allotropes described in Section 3.1, Section 3.2, Section 3.3, Section 3.4 and Section 3.5, measured using a 532 nm laser excitation source: (a) grown MWCNT (blue curve) compared with MWCNTs reported in the literature (tan curve); (b) continuous diamond films with defects; (c) grown nanocrystalline diamond (blue curve) compared with HF-CVD nanocrystalline diamond samples from previous work in the literature (orange and green curves); (d) synthesised microcrystalline diamond with defects (blue curve) compared with diamond of micro-scale grain size from the literature (orange curve); (e) synthesised amorphous carbon (blue curve) compared with a-C from the literature (orange curve); and (f) potential new formation/polymerisation (blue curve) compared with the spectrum of hydroxyl groups from the literature (orange curve).
Crystals 15 00292 g004
Figure 5. SEM images of CNT growing from the Inconel alloy gasket.
Crystals 15 00292 g005
Disclaimer/Publisher’s Note: The statements, opinions and data contained in all publications are solely those of the individual author(s) and contributor(s) and not of MDPI and/or the editor(s). MDPI and/or the editor(s) disclaim responsibility for any injury to people or property resulting from any ideas, methods, instructions or products referred to in the content.