Abstract
The hydrogen ions in superionic ice can move freely, playing the role of electrons in metals. Its electromagnetic behavior is the key to explaining the anomalous magnetic fields of Uranus and Neptune. Based on an ab initio evolutionary algorithm, we searched for the stable H4O crystal structure under pressures of 500–5000 GPa and discovered a new layered-chain Pmn21-H4O structure with H3 ion clusters. Interestingly, H3 ion clusters rotate above 900 K (with an instantaneous speed of 3000 m/s at 900 K), generating an instantaneous magnetic moment (~10−26 A·m2 ≈ 0.001 ). Moreover, H ions diffuse in a direction perpendicular to the H-O atomic layer at 960–1000 K. This is because the hydrogen–oxygen covalent bonds within the hydrogen–oxygen plane hinder the diffusion behavior of H3 ion clusters within the plane, resulting in the diffusion of H3 ion clusters between the hydrogen–oxygen planes and the formation of a one-dimensional conductive superionic state. One-dimensional diffusion of ions may generate magnetic fields. We refer to these two types of magnetic moments as “thermally induced ion magnetic moments”. When the temperature exceeds 1000 K, H ions diffuse in three directions. When the temperature exceeds 6900 K, oxygen atoms diffuse and the system becomes fluid. These findings provide important references for people to re-recognize the physical and chemical properties of hydrogen and oxygen under high pressure, as well as the sources of abnormal magnetic fields in Uranus and Neptune.
1. Introduction
Uranus and Neptune have special non-polar and non-axisymmetric magnetic fields, and the source of this anomalous magnetic field is reported to come from the middle ice layers of Uranus and Neptune [1,2]. Exploring the structure and electrical properties of the middle ice layers is a key challenge in explaining the source of anomalous magnetic fields. The expected P-T conditions for the internal ice layers of Uranus and Neptune are approximately 20–600 GPa and 2000–6000 K [3]. In order to explore the structure and electrical properties of the middle ice layers, researchers have studied the structure and electrical properties of ice at different temperatures and pressures [4,5,6,7,8,9,10,11,12].
In 1999, Cavazzoni et al. reported that in the middle layer, planetary ices are in the fluid state, exhibiting (i) a molecular regime at low pressure, (ii) a nonmetallic ionic regime at an intermediate pressure and temperature, and (iii) a metallic regime at a high pressure and temperature [12]. In 2013, Wilson et al. discovered a new superionic ice structure (fcc) with almost zero energy difference between bcc and fcc at 1 Mbar and 3000 K. At higher pressures, the stability of the fcc structure is stronger than that of the bcc structure [5]. The middle layer of Uranus and Neptune is mainly composed of H2O, CH4, and NH3 [13]. Under high pressure, CH4 decomposes to produce H2, which provides conditions for the formation of hydrogen-rich HO compounds. Therefore, Ma et al. studied the structure and superionic state of H3O under the pressure and temperature conditions inside Uranus and Neptune, and explored the influence of hydrogen-rich H-O compounds on the magnetic field [14]. In experiments, Vos et al. revealed the formation of a novel hydrate H4O at pressures ranging from 2.3 to 30 GPa through high-pressure optical and X-ray studies [15]. In theory, the miscibility of H2 and H2O has also been studied at 2–70 GPa and 1000–6000 K [16]. Although numerous studies have reported the structure of the H-O system under high pressure and for superionic ice states, the exploration of the stable structure of H4O is still insufficient; in particular, the relationship between the transition of the superionic state and the magnetic field is still unclear.
In this article, we report a new Pmn21-H4O phase and investigate its special dynamic behavior in the superionic state at a high temperature and high pressure. We found that the H ions in the H3 ion clusters in the H4O superionic state undergo rotation and one-dimensional diffusion, which may generate a magnetic field due to the movement of charged ions, which we call the “thermally induced ion magnetic moment”. This discovery will provide important references for people to re-recognize the physical and chemical properties of hydrogen and oxygen under high pressure, as well as the sources of abnormal magnetic fields in Uranus and Neptune.
2. Calculation Method
We used ab initio quantum-mechanical calculations in USPEX to search for H4O structures under pressures of 500–4000 GPa [17]. For each pressure point, the first generation of 150 structures was produced by a random symmetric structure generator. Fifty structures were calculated for each subsequent generation, which were generated through heredity (20%), a random symmetric structure generator (20%), soft mutation or coomutation (20%), transmutation (20%), lattice mutations (10%), and topological random generator (10%) methods. Structural optimization and energy calculation were performed using the density functional theory-based software VASP.5.4.4 [18]. Calculations were performed in the GGA approximation. Projector augmented wave (PAW) pseudopotential and the Perdew–Burke–Ernzerhof exchange–correlation functional are used. The pseudopotential cutoff radii are 0.8 and 1.1 Bohr for H and O. The Brillouin zone sampling adopts an automatic uniform distribution with a density of 0.251. The cut-off energy for structure search is set to 500 eV, while the cut-off energy for subsequent calculations is set to 1700 eV, and the total energy converges to 1 meV.
We used ab initio molecular mechanics to simulate the dynamic behavior at high temperatures. The temperature range for molecular dynamics simulation is 300–8000 K. The calculated Pmn21-H4O unit cell size is as follows: a = 8.2260 Å, b = 7.3158 Å, c = 8.6568 Å, containing 480 atoms. k-point sampling is performed with the Gamma point as the center. NVT simulation used a Nose Hover thermostat [19,20,21]. Each temperature is calculated with a time step of 0.1 fs for 100,000 steps or 150,000 steps.
3. Results and Discussion
Figure 1 shows the convex hull diagram of hydroxide compounds containing H2, H4O, and H2O, as well as the phase diagram of the enthalpy value of the H4O structure as a function of pressure. The results show that when the pressure is above 1440 GPa, the structure of H4O can exist stably without decomposing into H2 and H2O, which is consistent with the prediction of Zhang et al. [22]. Interestingly, a new and stable Pmn21-H4O structure has emerged within the pressure range of 1440–1570 GPa (see Table S1 for the structural parameters of Pmn21 and Pnma structures). When the pressure exceeds 1570 GPa, the Pmn21 structure transforms into the Pnma structure. These two structures are both indirect bandgap semiconductors in the pressure range of 1440–1570 GPa. At 1500 GPa, the bandgap widths of the Pmn21 and Pnma structures are 2.85 eV and 2.88 eV, respectively, and decrease with increasing pressure (Figures S1 and S2).
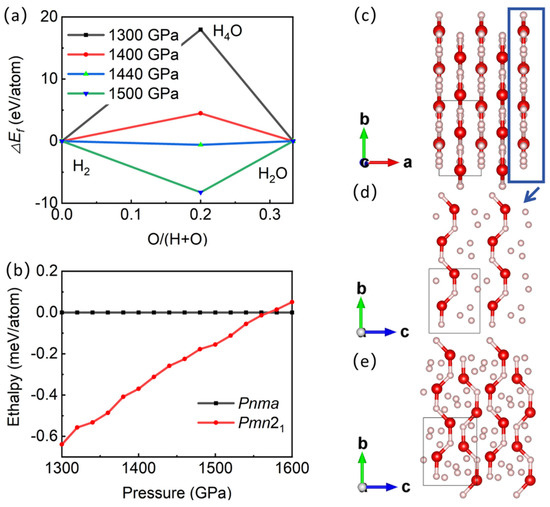
Figure 1.
Phase diagram of hydrogen-rich H-O compounds and crystal structure of new structure. (a) Enthalpy of hydrogen-rich H-O compounds at different pressures, relative to mixture of H2 and H2O. (b) Enthalpy versus pressure of different H4O structures. (c–e) Structure of Pmn21 under 1500 GPa. Red sphere in (c–e) represents oxygen atoms, and pink sphere represents hydrogen atoms.
The new H4O phase is an orthorhombic system, with an AB-stacking layered structure (Figure 1c) for the Pmn21 space group (a = 2.056 Å, b = 3.658 Å, c = 2.886 Å at 1500 GPa). Each layer has H3 ion clusters connected by H-H covalent bonds (bond lengths are 0.707 Å, 0.724 Å, and 0.741 Å, respectively) to form triangles. H3 ion clusters are distributed between parallel -H-O-H-O- chains (bond lengths of H-O are 1.098 Å, 1.027 Å, 1.056 Å, and 1.070 Å, respectively) (Figure 1d). The -H-O-H-O- chains of adjacent layers are arranged in reverse (Figure 1e). The distance between atomic layers is 1.028 Å.
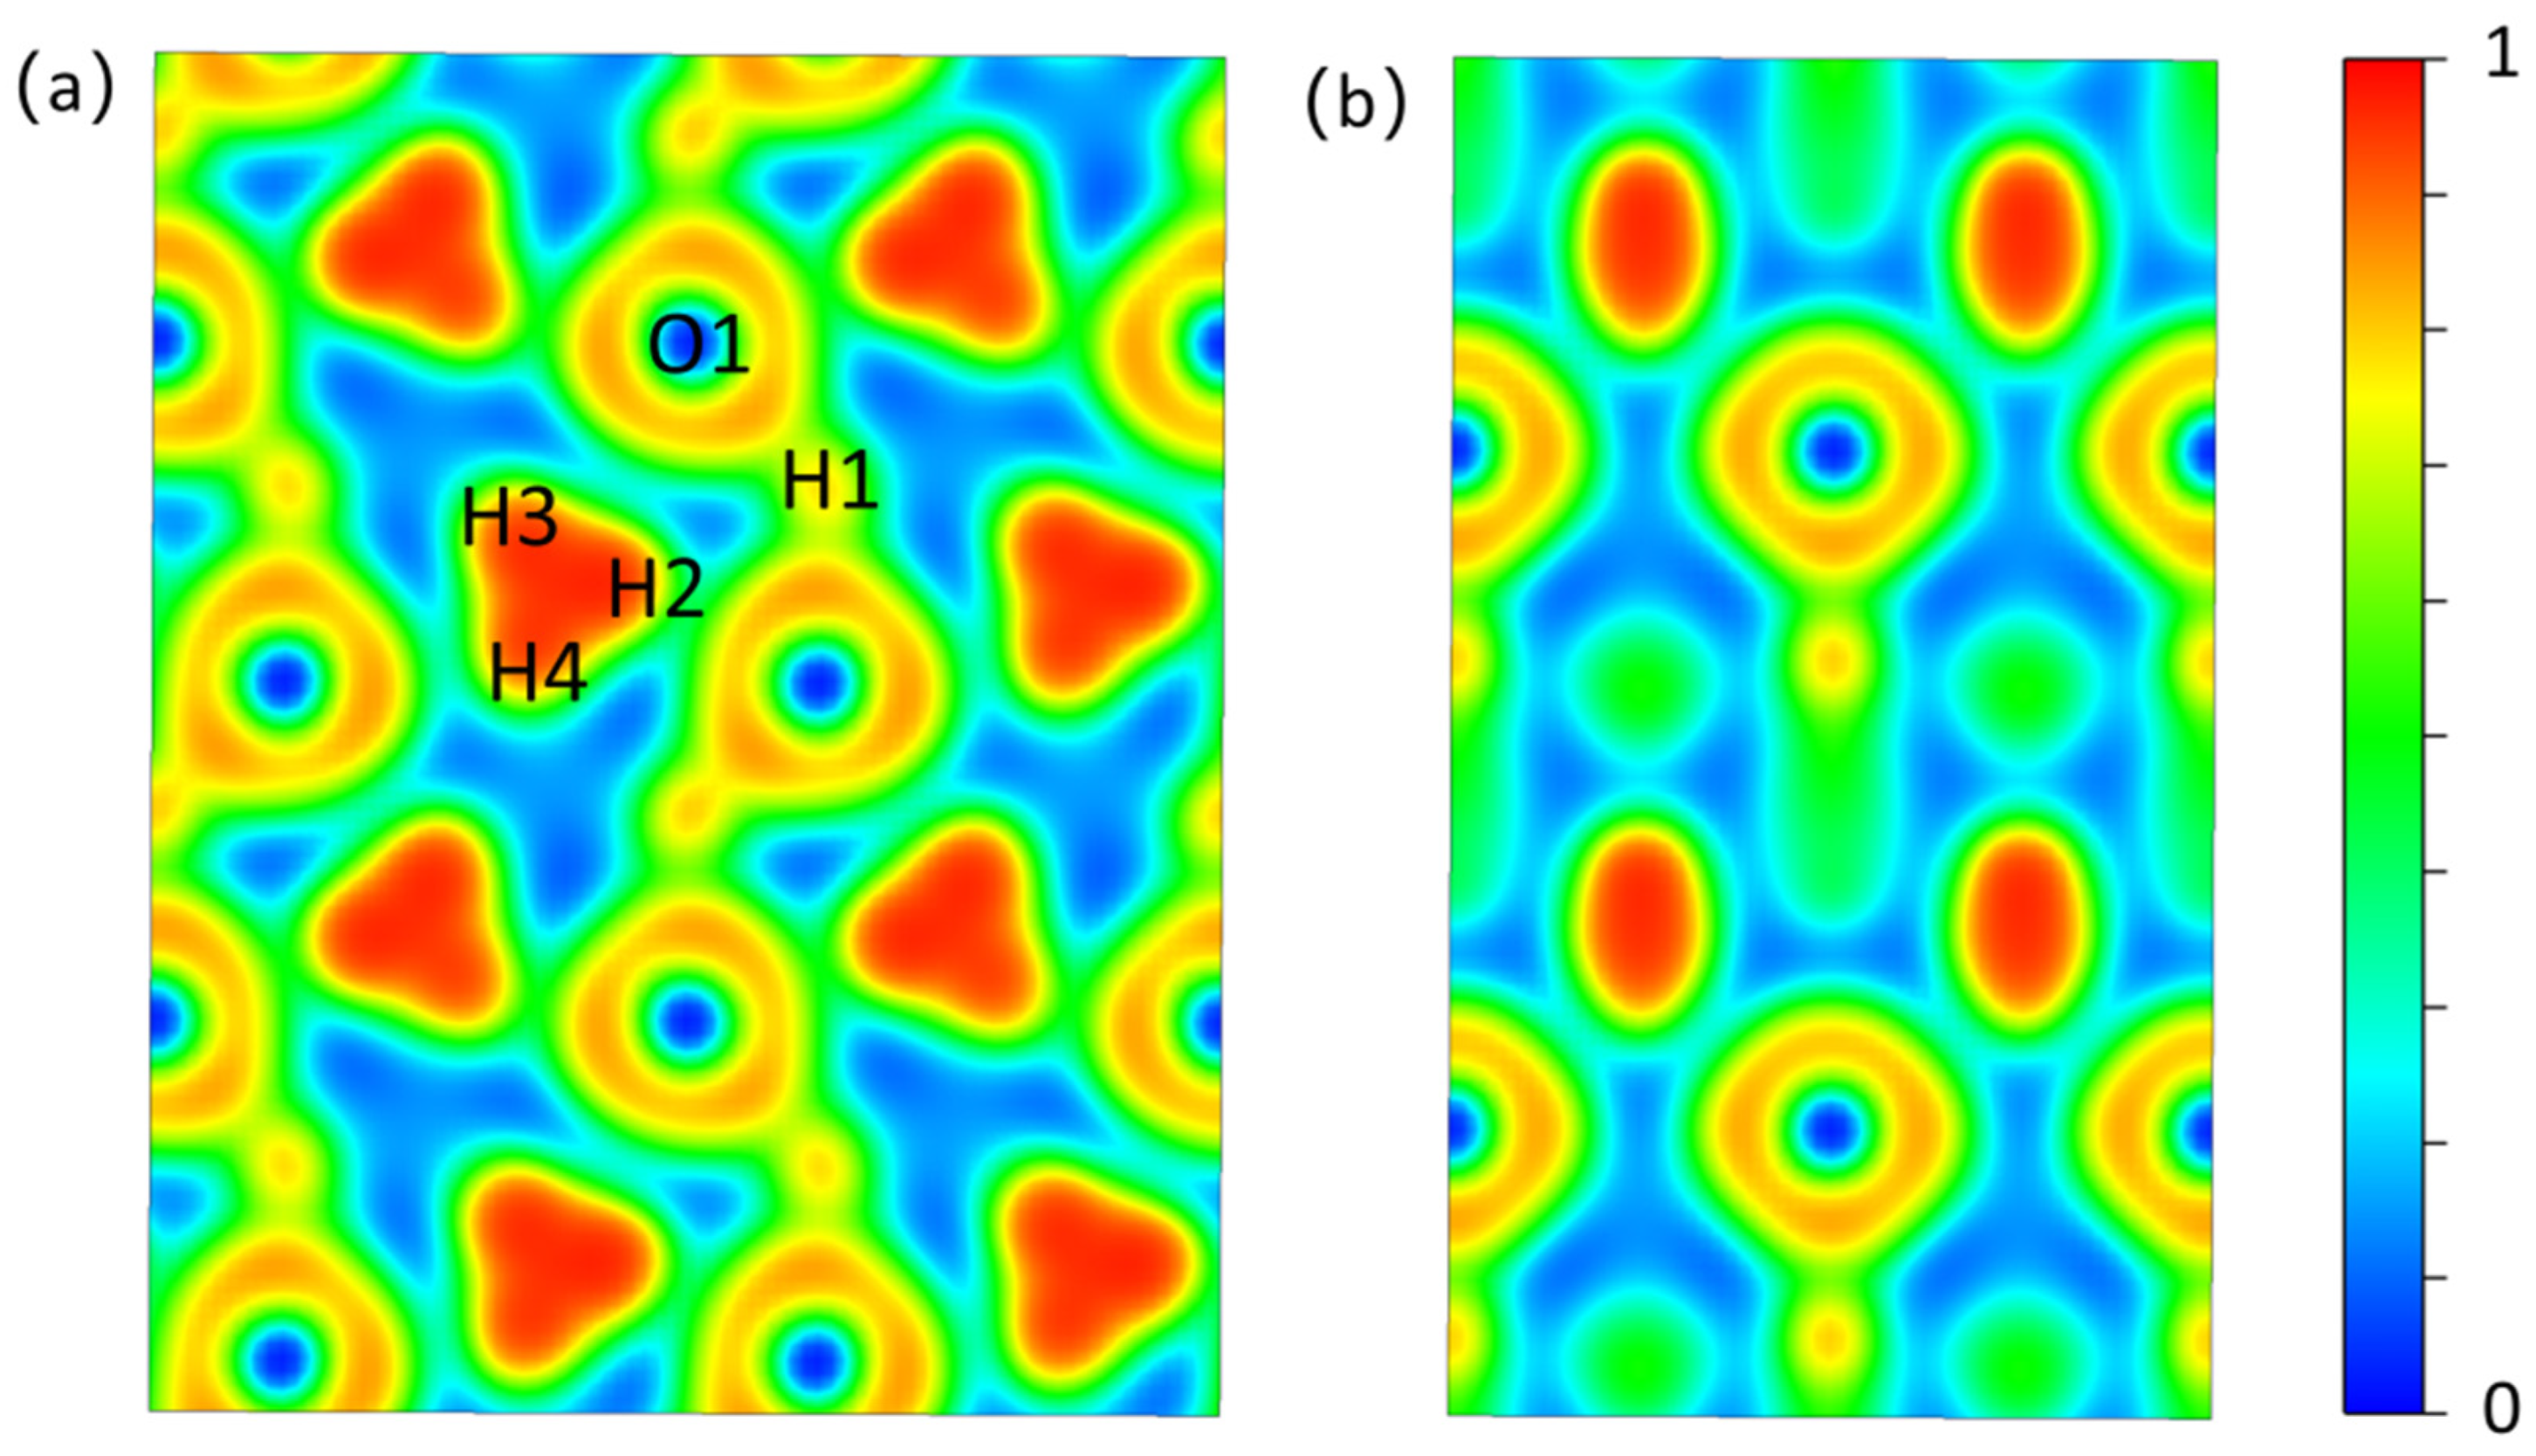
By analyzing ELF, we can understand the bonding and interactions of new structures, with high elf values indicating strong bonding [23,24]. The Electron Localization Function of the (100) crystal plane of Pmn21-H4O (Figure 2a) shows that a high electron localization is observed in the H3 ion cluster to form H-H covalent bonds. The low density of electrons distributed between the H3 ion cluster and the adjacent oxygen atoms indicates that the H3 ion cluster is relatively independent and does not form strong chemical bonds with surrounding atoms, which provide possibilities for showing the rotation phenomenon of H3 ion clusters caused by temperature rise. There is a shared electron between the hydrogen and oxygen atoms on the -H-O-H-O- chain, forming a strong H-O covalent bond. In the Electron Localization Function of the (001) crystal plane (Figure 2b), the charge density between the H-O atomic layers is low, and the interaction between atomic layers is weak. The atomic layers are relatively independent.

Figure 2.
The ELF isosurfaces of Pmn21. (a) (1 0 0) crystal face. (b) (0 0 1) crystal face. Atomic numbers correspond to the atomic numbers in Table S1.
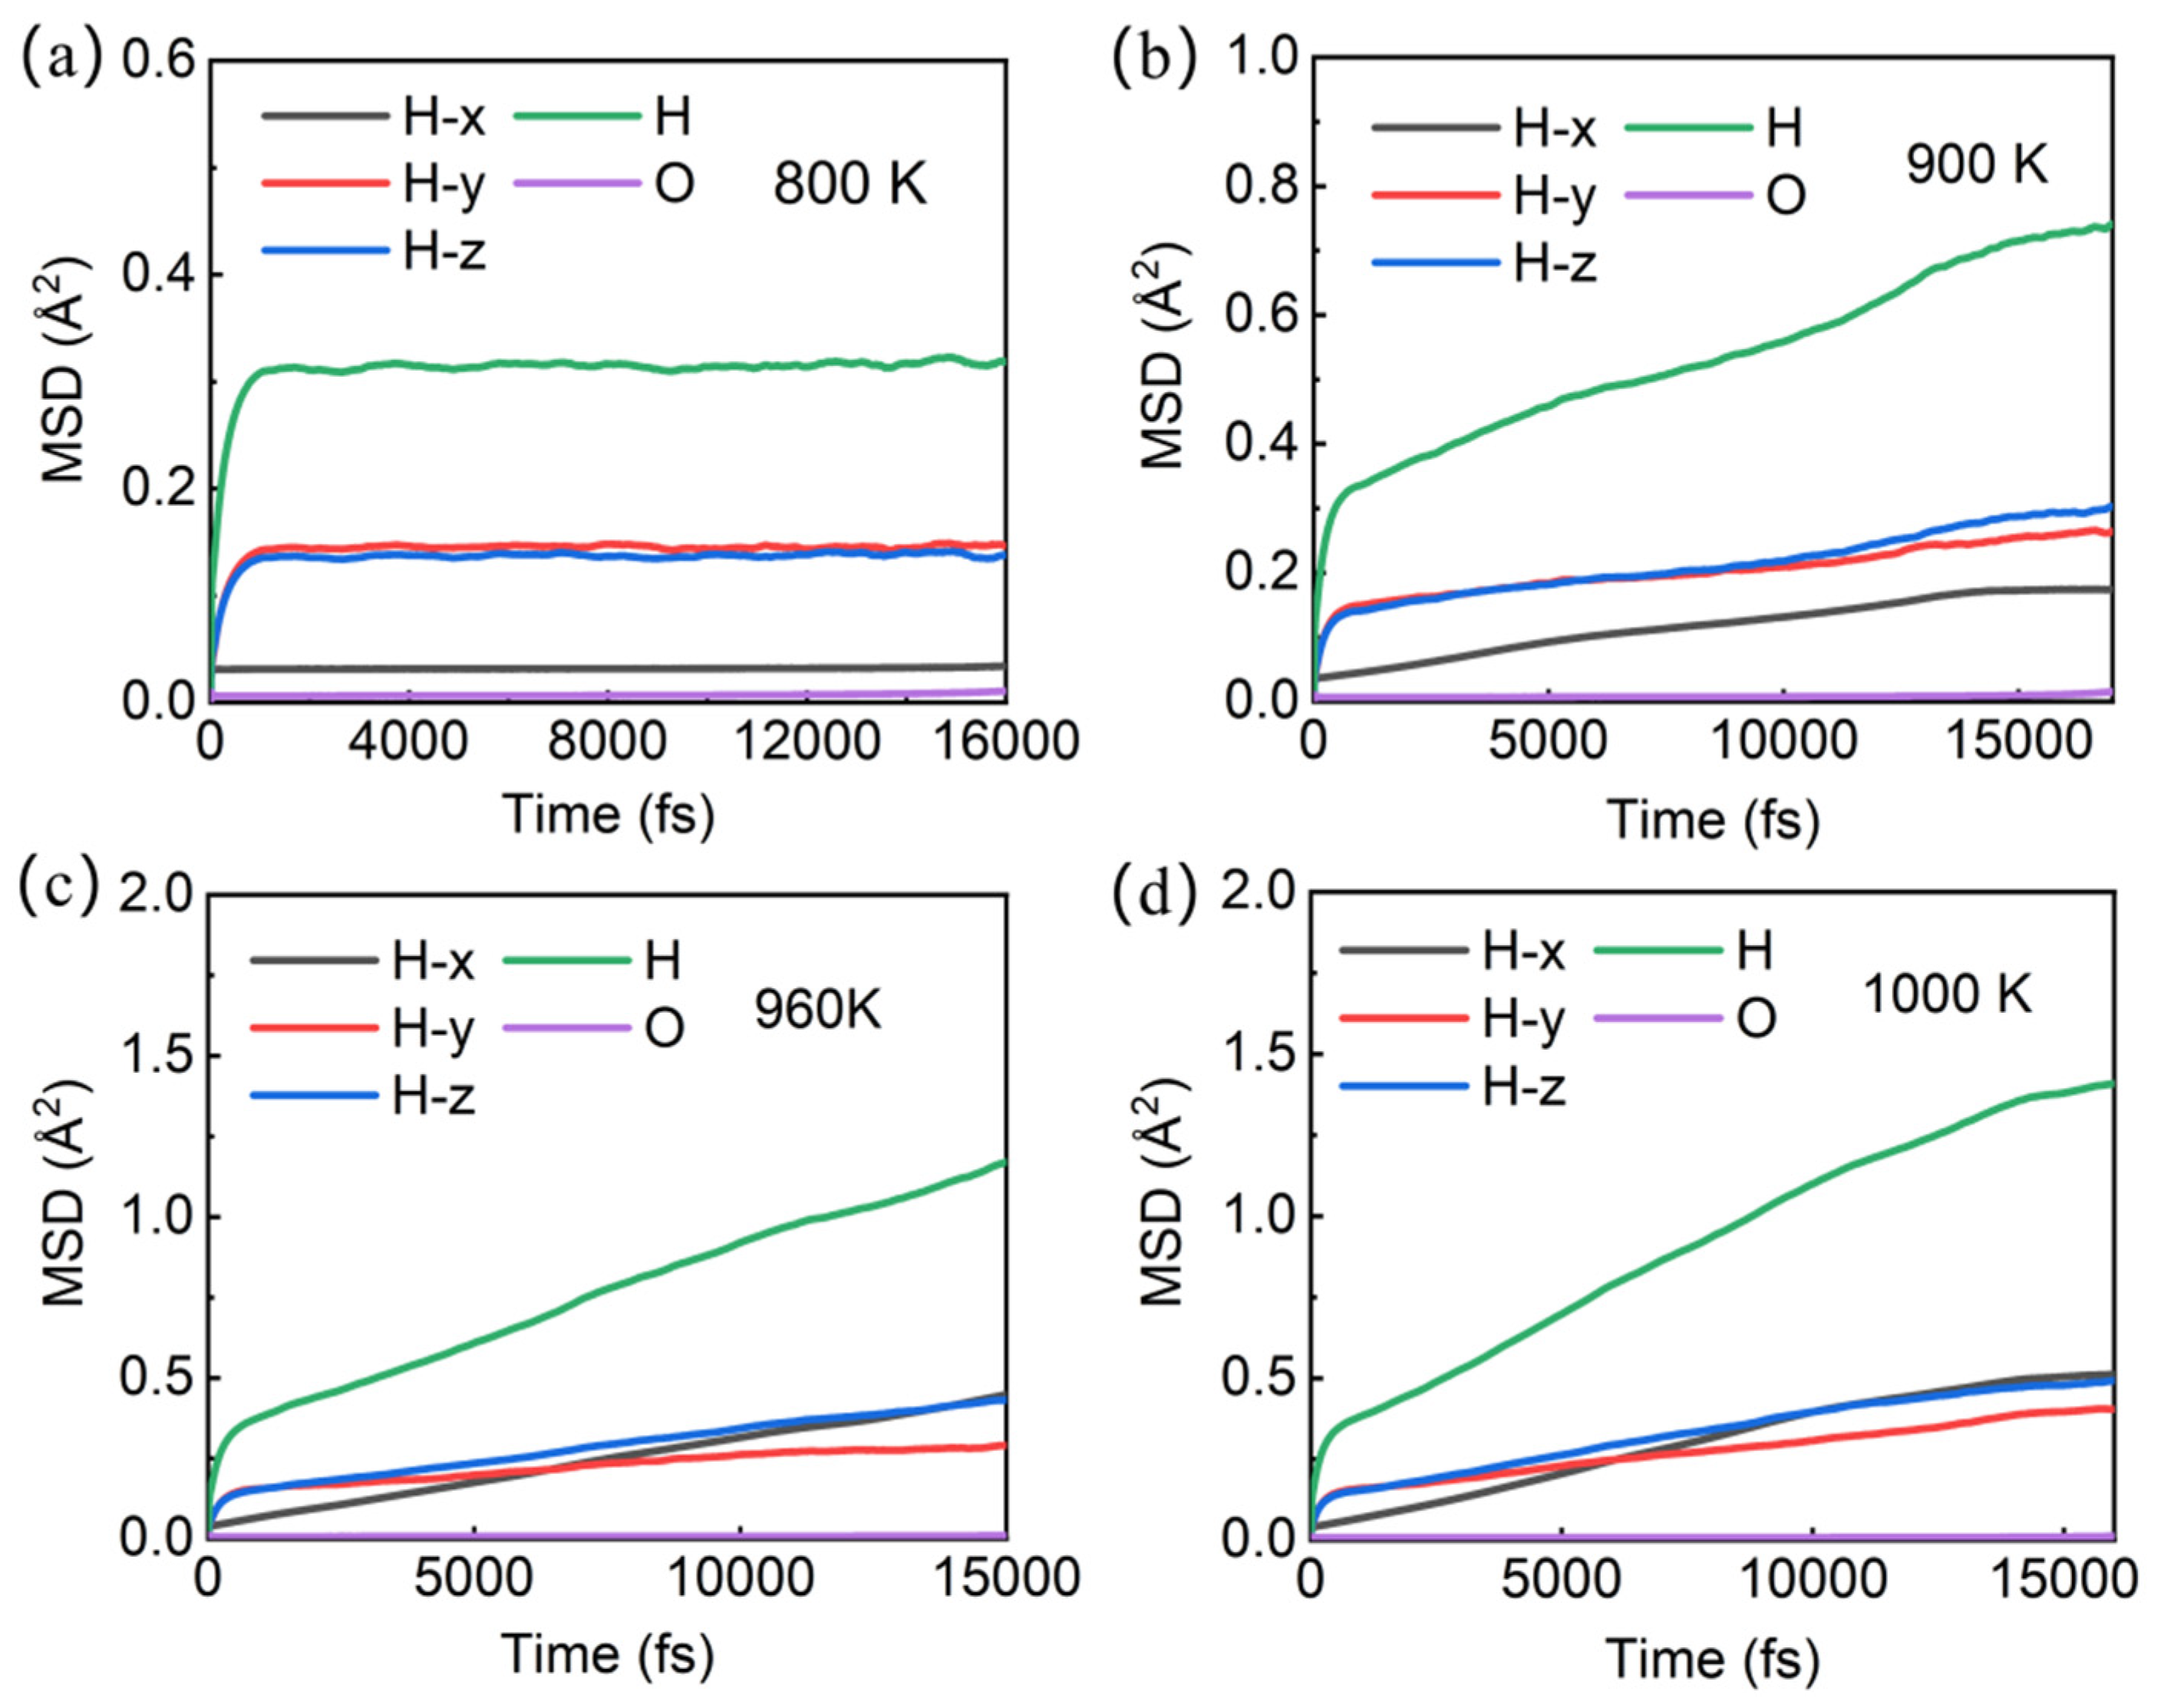
In order to analyze the stability of the Pmn21 structure at different temperatures and the diffusion of hydrogen and oxygen atoms, we conducted molecular dynamics simulations on the Pnm21 structure at different temperatures under a pressure of 1500 GPa. The curve of atomic mean square displacement and total energy over time at room temperature (300 K) (Figure S3) shows that the mean square displacement of oxygen atoms is close to 0, and the mean square displacement of hydrogen atoms is about 0.25 Å2, indicating that both oxygen and hydrogen atoms vibrate near the atomic position without damaging the stability of the structure, and the system is stable in the solid state (diffusion coefficients DO = 0, DH = 0). When the temperature rises to 800 K (Figure 3a), the mean square displacement of both oxygen and hydrogen atoms increases, indicating that the vibrations of both oxygen and hydrogen atoms have increased, but the structure remains stable (diffusion coefficients DO = 0, DH = 0).
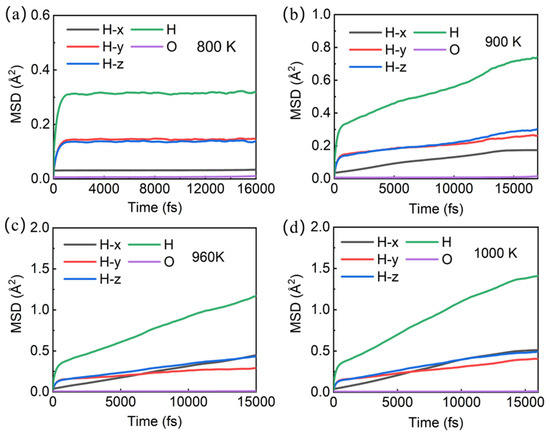
Figure 3.
Mean square displacement of atoms in Pmn21-H4O at different temperatures: (a) 800 K; (b) 900 K; (c) 960 K; (d) 1000 K.
When the temperature reached 900 K, the mean square displacement of hydrogen atoms increased to ~0.74 Å2 (Figure 3b), and remained at ~0.17 Å2 in the X direction (diffusion coefficient DHx = 0), indicating that hydrogen atoms did not diffuse in the X direction (the trajectory diagram of H ions in Figure 4a confirms that H ions do not diffuse in the X direction). However, the mean square displacement in the Y and Z directions is ~0.26 Å2 and 0.30 Å2, respectively. Therefore, the root mean square displacement of hydrogen atoms in the YZ plane is ~0.75 Å, which is greater than the bond length of H-H in the H3 ion cluster, indicating that the H ions in the H3 ion cluster may move among the three H ion positions. In order to identify whether it is moving or not, we calculate the trajectory diagram of H ions at 900 K (Figure 4b). The trajectory diagram of the H ions in the H3 ion cluster is a circular curve, indicating that the H3 ion cluster has rotated, which is confirmed by the atomic state diagram at 1.22–1.25 ps (Figure S4). The instantaneous velocity of the H ion rotation is about 3000 m/s, as is known from the Bader charge analysis, which shows that each H in the H3 ion cluster carries a charge of ~+0.22e (Table S2). In addition, due to the magnitude of the magnetic moment generated by the rotational motion of ions, , where q is the charge of the ion, v is the velocity of the charged ion, and r is the orbital radius of the charged ion’s rotation. The estimated instantaneous magnetic moment generated by the rotation of a single H3 ion cluster is approximately 10−26 A·m2 ≈ 0.001 , which we refer to as the “thermally induced ion magnetic moment”. Because the rotation time and direction of the H3 ion cluster are randomly generated, the superionic state as a whole does not exhibit magnetism. But if we can control the rotation direction of H3 ion clusters, the magnetism of the superionic state can be controlled. For the atoms in the -H-O-H-O- chain, it can be inferred from Figure 3b and Figure 4a,b that they vibrate near their equilibrium positions.
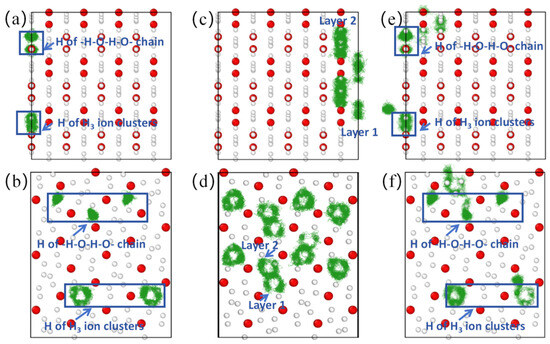
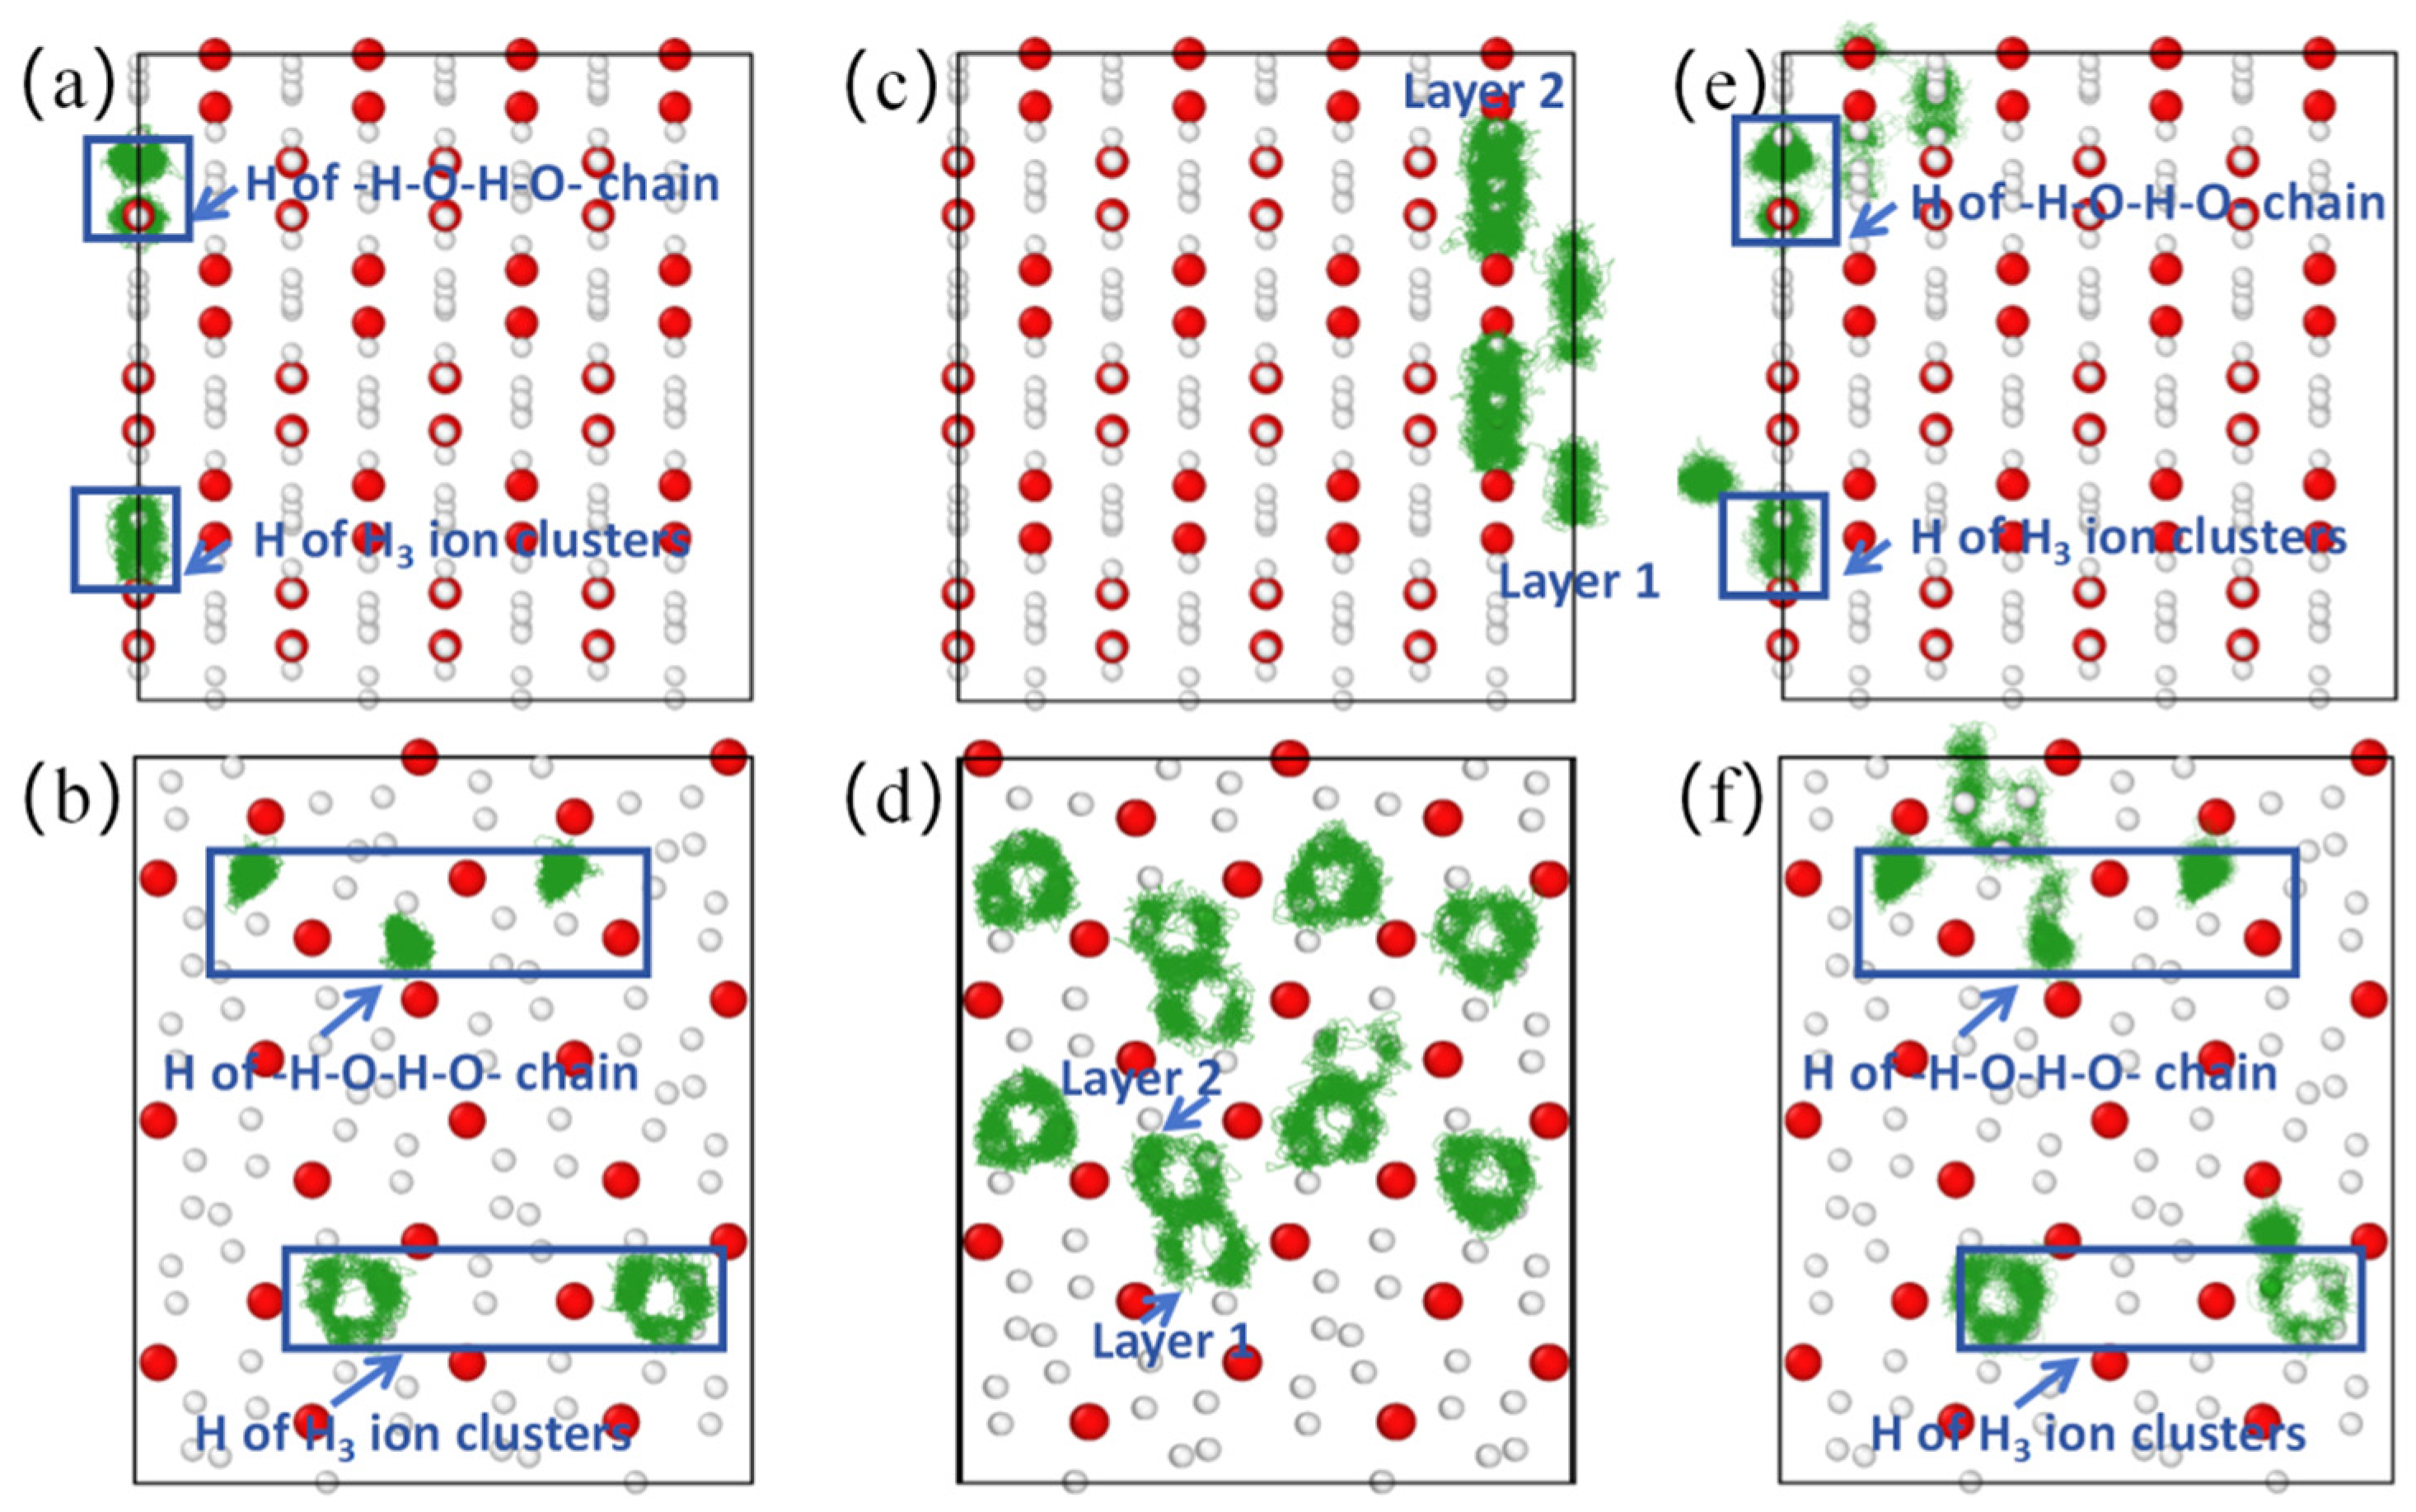
Figure 4.
Atomic trajectory diagrams of (0 1 0) and (1 0 0) crystal face of Pmn21-H4O at different temperatures. (a,b) Trajectory diagram of H ions at 900 K. (c,d) Trajectory diagram of H ions in H3 ion cluster at 960 K. (e,f) Trajectory diagram of H ions at 1000 K. The green line represents the motion trajectory of the H atom.
When the temperature reaches 960 K, the mean square displacement of hydrogen atoms increases to about 1.17 Å2 at 15 ps, and the direction with the largest increase in mean square displacement is in the X direction (Figure 3c), suggesting that hydrogen atoms may diffuse in this direction. Through the trajectory diagram of H ions (Figure 4c,d), it can be determined that the H ions in the Pmn21 structure diffuse only in the X direction. This diffusion phenomenon originates from the movement of H ions between H3 ion clusters in different layers, while the H ions on the -H-O-H-O- chain do not diffuse due to the constraint of hydrogen–oxygen covalent bonds. At the same time, the -H-O-H-O- chain also constrains the diffusion of H3 ion clusters in the plane. At this point, with DO = 0 and DH = 0.9 × 10⁻¹⁰ m2·s−1, the O atom remains near the equilibrium position, forming a sublattice. The H ions begin to diffuse, and the system transitions to a superionic state (DO = 0, DH > 0). This is a special superionic state, where H ions can only move in the X direction; this is a one-dimensional conductive superionic state.
When the temperature reaches 1000 K, the mean square displacement of O atoms remains at zero, and the value for H ions is ~1.5 Å2 at 15 ps (Figure 3d), with DH = 1.1 × 10⁻¹⁰ m2·s−1. The H ions in the -H-O-H-O- chain can move to the position of the neighboring H3 ion clusters (Figure 4e,f), because as the temperature increases, the atomic kinetic energy increases, and the energy is greater than the covalent bond energy of H-O, thereby breaking the -H-O-H-O- chain. At this point, the O atom remains near the equilibrium position to form a sublattice, while the H ions can diffuse in three directions. It is worth noting that the diffusion velocity of H ions exhibits significant anisotropy in three directions, with the fastest diffusion occurring in the X direction perpendicular to the H-O atomic layer.
When the temperature reaches 6900 K, DO > 0, DH > 0, both H and O atoms diffuse, and the system becomes fluid. And as the temperature increases, the mean square displacement and diffusion coefficient of O atoms rapidly increase (Figure S5).
4. Conclusions
We have discovered a new layered-chain Pmn21-H4O structure, which is more stable than the reported Pnma structure at 1440–1570 GPa. At the same time, the structure maintains dynamic stability at temperatures below 900 K. When the temperature is above 900 K, H3 ion clusters rotate in the hydrogen–oxygen plane at an instantaneous speed of 3000 m/s, and the generated instantaneous magnetic moment is about 10−26 A·m2 ≈ 0.001 . When the temperature is 960 K, the H ions in the H3 ion cluster diffuse between the layers of hydrogen and oxygen atoms, resulting in the H ions diffusing only in one direction, leading to a special superionic state of one-dimensional conductivity. When the temperature exceeds 1000 K, the hydrogen–oxygen covalent bond on the -H-O-H-O- chain is broken, and the H ions can diffuse in three directions. When the temperature is above 6900 K, the diffusion coefficient of oxygen atoms is greater than 0, and hydrogen and oxygen atoms can freely diffuse in three directions to form a fluid. The stable pressure range of the new structure is higher than the pressure range of the ice layers inside Uranus and Neptune. Therefore, our research cannot explain the anomalous magnetic fields around Uranus and Neptune, but our research can provide reference and inspiration for the dynamic performance of other superionic H-O compounds. This discovery will provide important references for people to re-recognize the physical and chemical properties of hydrogen and oxygen under high pressure, as well as the sources of abnormal magnetic fields in Uranus and Neptune.
Supplementary Materials
The following supporting information can be downloaded at https://www.mdpi.com/article/10.3390/cryst15040304/s1, Figure S1: Band structure of H4O under 1500 GPa. (a) Pnma-H4O. (b) Pmn21-H4O; Figure S2: Band gap under different pressures for Pnma-H4O and Pmn21-H4O; Figure S3: Atomic mean square displacement and total energy variation of Pmn21-H4O. (a) Mean square displacement of atom at 300 K. (b) Energy changes during simulation process at 300 K; Figure S4: Molecular state diagram of Pmn21-H4O at different times under 900 K: (a) 1220 fs; (b) 1230 fs; (c) 1250 fs; Figure S5: Mean square displacement of O atom in Pmn21-H4O at different temperatures; Table S1: Structural parameters of selected H4O phases; Table S2: Bader charge of Pmn21-H4O; Video S1: Supplementary MD movie.
Author Contributions
Conceptualization, H.D. and X.L. (Xiao Liang); methodology, H.D. and X.L. (Xiao Liang); data curation, X.L. (Xiao Liang), J.P. and X.L. (Xingyun Li); supervision, F.W., R.W., Y.Y. and H.D.; writing—original draft preparation, X.L. (Xiao Liang); writing—review and editing, X.L. (Xiao Liang) and H.D. All authors have read and agreed to the published version of the manuscript.
Funding
This work was supported by the Guangdong Natural Science Foundation of China (Grant No. 2017B030306003), the National Natural Science Foundation of China (Grant No. 11604056), and the State Administration for Market Regulation Science and technology project (Grant No. 2023MK093).
Data Availability Statement
The original contributions presented in this study are included in the article/Supplementary Material. Further inquiries can be directed to the corresponding author(s).
Acknowledgments
The authors thank the Center of Campus Network & Modern Educational Technology, Guangdong University of Technology, Guangdong, China, for providing computational resources and technical support for this work.
Conflicts of Interest
The authors declare no conflict of interest.
References
- Ness, N.F.; Acuna, M.H.; Behannon, K.W.; Burlaga, L.F.; Connerney, J.E.; Lepping, R.P.; Neubauer, F.M. Magnetic fields at uranus. Science 1986, 233, 85–89. [Google Scholar] [CrossRef] [PubMed]
- Ness, N.F.; Acuna, M.H.; Burlaga, L.F.; Connerney, J.E.; Lepping, R.P.; Neubauer, F.M. Magnetic fields at neptune. Science 1989, 246, 1473–1478. [Google Scholar] [CrossRef] [PubMed]
- Helled, R.; Anderson, J.D.; Podolak, M.; Schubert, G. Interior Models of Uranus and Neptune. Astrophys. J. 2011, 726, 15. [Google Scholar] [CrossRef]
- Wang, Y.; Liu, H.; Lv, J.; Zhu, L.; Wang, H.; Ma, Y. High pressure partially ionic phase of water ice. Nat. Commun. 2011, 2, 563. [Google Scholar] [CrossRef]
- Wilson, H.F.; Wong, M.L.; Militzer, B. Superionic to Superionic Phase Change in Water: Consequences for the Interiors of Uranus and Neptune. Phys. Rev. Lett. 2013, 110, 151102. [Google Scholar] [CrossRef]
- Sun, J.; Clark, B.K.; Torquato, S.; Car, R. The phase diagram of high-pressure superionic ice. Nat. Commun. 2015, 6, 8156. [Google Scholar] [CrossRef]
- French, M.; Desjarlais, M.P.; Redmer, R. Ab initio calculation of thermodynamic potentials and entropies for superionic water. Phys. Rev. E 2016, 93, 022140. [Google Scholar] [CrossRef]
- Hernandez, J.-A.; Caracas, R. Superionic-Superionic Phase Transitions in Body-Centered Cubic H2O Ice. Phys. Rev. Lett. 2016, 117, 135503. [Google Scholar] [CrossRef]
- Millot, M.; Hamel, S.; Rygg, J.R.; Celliers, P.M.; Collins, G.W.; Coppari, F.; Fratanduono, D.E.; Jeanloz, R.; Swift, D.C.; Eggert, J.H. Experimental evidence for superionic water ice using shock compression. Nat. Phys. 2018, 14, 297–302. [Google Scholar] [CrossRef]
- Millot, M.; Coppari, F.; Rygg, J.R.; Barrios, A.C.; Hamel, S.; Swift, D.C.; Eggert, J.H. Nanosecond X-ray diffraction of shock-compressed superionic water ice. Nature 2019, 569, 251–255. [Google Scholar] [CrossRef]
- Yamane, R.; Komatsu, K.; Gouchi, J.; Uwatoko, Y.; Machida, S.; Hattori, T.; Ito, H.; Kagi, H. Experimental evidence for the existence of a second partially-ordered phase of ice VI. Nat. Commun. 2021, 12, 1129. [Google Scholar] [CrossRef] [PubMed]
- Cavazzoni, C.; Chiarotti, G.L.; Scandolo, S.; Tosatti, E.; Bernasconi, M.; Parrinello, M. Superionic and metallic states of water and ammonia at giant planet conditions. Science 1999, 283, 44–46. [Google Scholar] [CrossRef] [PubMed]
- Hubbard, W.B. Interiors of the giant planets. Science 1981, 214, 145–149. [Google Scholar] [CrossRef] [PubMed]
- Huang, P.; Liu, H.; Lv, J.; Li, Q.; Long, C.; Wang, Y.; Chen, C.; Hemley, R.J.; Ma, Y. Stability of H3O at extreme conditions and implications for the magnetic fields of Uranus and Neptune. Proc. Natl. Acad. Sci. USA 2020, 117, 5638–5643. [Google Scholar] [CrossRef]
- Vos, W.L.; Finger, L.W.; Hemley, R.J.; Mao, H.-K. Novel H2-H2O clathrates at high pressures. Phys. Rev. Lett. 1993, 71, 3150–3153. [Google Scholar] [CrossRef]
- Soubiran, F.; Militzer, B. Miscibility calculations for water and hydrogen in giant planets. Astrophys. J. 2015, 806, 228. [Google Scholar] [CrossRef]
- Oganov, A.R.; Glass, C.W. Crystal structure prediction using ab initio evolutionary techniques: Principles and applications. J. Chem. Phys. 2006, 124, 244704. [Google Scholar] [CrossRef]
- Kresse, G.; Furthmüller, J. Efficient iterative schemes for ab initio total-energy calculations using a plane-wave basis set. Phys. Rev. B 1996, 54, 11169–11186. [Google Scholar] [CrossRef]
- Nosé, S. A unified formulation of the constant temperature molecular dynamics methods. J. Chem. Phys. 1984, 81, 511–519. [Google Scholar] [CrossRef]
- Hoover, W.G. Canonical dynamics: Equilibrium phase-space distributions. Phys. Rev. A 1985, 31, 1695–1697. [Google Scholar] [CrossRef]
- Shuichi, N. Constant Temperature Molecular Dynamics Methods. Prog. Theor. Phys. Suppl. 1991, 103, 1–46. [Google Scholar] [CrossRef]
- Zhang, S.; Wilson, H.F.; Driver, K.P.; Militzer, B. H4O and other hydrogen-oxygen compounds at giant-planet core pressures. Phys. Rev. B 2013, 87, 024112. [Google Scholar] [CrossRef]
- Burdett, J.K.; McCormick, T.A. Electron localization in molecules and solids: The meaning of ELF. J. Phys. Chem. A 1998, 102, 6366–6372. [Google Scholar] [CrossRef]
- Ayers, P.W. Electron localization functions and local measures of the covariance. J. Chem. Sci. 2005, 117, 441–454. [Google Scholar] [CrossRef]

Disclaimer/Publisher’s Note: The statements, opinions and data contained in all publications are solely those of the individual author(s) and contributor(s) and not of MDPI and/or the editor(s). MDPI and/or the editor(s) disclaim responsibility for any injury to people or property resulting from any ideas, methods, instructions or products referred to in the content. |
© 2025 by the authors. Licensee MDPI, Basel, Switzerland. This article is an open access article distributed under the terms and conditions of the Creative Commons Attribution (CC BY) license (https://creativecommons.org/licenses/by/4.0/).